
Submitted:
04 November 2025
Posted:
07 November 2025
You are already at the latest version
Abstract
The weather has a significant impact on various aspects of lives. The consequences of severe weather conditions are manifold and detrimental, posing significant risks to human survival. In this paper we aim to develop a database for capturing weather data and to predict severe weather condition. The dataset used to achieve this aim was a secondary dataset collected from OpenWeather from 2/21/2024 to 2/27/2024. The weather dataset was analyzed quantitatively using descriptive statistic and correlation analysis. Furthermore, three supervised machine learning model (logistic regression, random forest, and neural network) was trained to predict the severity of the weather situation. Temperature exhibited a strong negative correlation with pressure (-0.640), moderate negative correlation with humidity (-0.296) and wind degree (-0.002), weak positive correlation with ground level (0.260) and wind speed (0.221). Also, pressure was found to have a weak negative correlations with humidity (-0.083), ground level (-0.387), and wind speed (-0.015), wind degree (-0.322) and cloud cover (-0.075). humidity showed a strong positive correlation with ground level (0.662) and wind degree (0.642). Wind degree had a moderate positive correlation with humidity (0.642) and ground level (0.528). The performance metric of the model was evaluated in three different instances (train, testing, all). On the training dataset NN achieved an accuracy of 1(95% CI: 0.9997 to 1), RF with an accuracy of 1.0(95% CI: 0.9998 to 1), logistic with an accuracy of 0.9651(95% CI: 0.9625 to 0.9676). On a new dataset (i.e., test dataset), RF maintained its accuracy of 1.0(95% CI: 0.9984 to 1), while NN had a slightly lower accuracy of 0.9996(95% CI: 0.9975 to 1), and LR achieved accuracy of 0.9663(95% CI: 0.958 to 0.973). Across the entire dataset, RF 1.0(95% CI: 0.9998 to 1) accuracy, The NN model performed nearly as well, with accuracy of 0.9999(95% CI: 0.9997 to 1), while LR maintained consistent but lower scores, recording accuracy of 0.9652(95% CI: 0.9628 to 0.9676). The results suggest that our weather prediction system was stable across the three instances effectively classifies weather conditions indicating its potential for real-world applications in weather prediction systems.
Keywords:
weather severity
; machine learning
; classification problem
Abstract
The weather has a significant impact on various aspects of lives. The consequences of severe weather conditions are manifold and detrimental, posing significant risks to human survival. In this paper we aim to develop a database for capturing weather data and to predict severe weather condition. The dataset used to achieve this aim was a secondary dataset collected from OpenWeather from 2/21/2024 to 2/27/2024. The weather dataset was analyzed quantitatively using descriptive statistic and correlation analysis. Furthermore, three supervised machine learning model (logistic regression, random forest, and neural network) was trained to predict the severity of the weather situation. Temperature exhibited a strong negative correlation with pressure (-0.640), moderate negative correlation with humidity (-0.296) and wind degree (-0.002), weak positive correlation with ground level (0.260) and wind speed (0.221). Also, pressure was found to have a weak negative correlations with humidity (-0.083), ground level (-0.387), and wind speed (-0.015), wind degree (-0.322) and cloud cover (-0.075). humidity showed a strong positive correlation with ground level (0.662) and wind degree (0.642). Wind degree had a moderate positive correlation with humidity (0.642) and ground level (0.528). The performance metric of the model was evaluated in three different instances (train, testing, all). On the training dataset NN achieved an accuracy of 1(95% CI: 0.9997 to 1), RF with an accuracy of 1.0(95% CI: 0.9998 to 1), logistic with an accuracy of 0.9651(95% CI: 0.9625 to 0.9676). On a new dataset (i.e., test dataset), RF maintained its accuracy of 1.0(95% CI: 0.9984 to 1), while NN had a slightly lower accuracy of 0.9996(95% CI: 0.9975 to 1), and LR achieved accuracy of 0.9663(95% CI: 0.958 to 0.973). Across the entire dataset, RF 1.0(95% CI: 0.9998 to 1) accuracy, The NN model performed nearly as well, with accuracy of 0.9999(95% CI: 0.9997 to 1), while LR maintained consistent but lower scores, recording accuracy of 0.9652(95% CI: 0.9628 to 0.9676). The results suggest that our weather prediction system was stable across the three instances effectively classifies weather conditions indicating its potential for real-world applications in weather prediction systems.
Introduction
Technology has brought an innovative transformation to every fields. All fields adopt and applied the beauty of technology. In agriculture, the introduction of technology has optimized the performances of farming, help reduce wastage and increase productivity. It is important to note that the bedrock of all this innovation is the generation of different forms of information. This information, which are also known as data brought a significant understanding of the world and some other difficult issues that were too complex in the past. Favaretto et al. (2020) stated that data are of different types which are generated from different sources such as human, and machines. Formally, Waring (2021) identify two major sources of data, which are; primary and secondary. Data use has become crucial for monitoring worldwide patterns and making informed choices in various industries (Jain et al., 2020). According to Lei & Ming (2023), data plays a pivotal role in modern life, exerting a significant impact on diverse industries and endeavors. It enables businesses and organizations to make educated decisions, gain important insights, and improve their performance (Osakwe et al., 2023). Employing data can improve the type of products, services, marketing strategies, and operational procedures (Sulistyaningsih et al, 2024). Furthermore, it is vital in scientific research as it allows for the examination of trends and patterns, facilitates forecasts, and promotes the formulation of new hypotheses. Over the years, there has been several system and methods of preserving information-such as; digital archiving, paper-based storage, encryption, backups, online backup services, and electronica methods. A database is said to be an electronica storage of systematic collection of data. This system can contain any type of data, including words, numbers, images, videos, and files. Databases are crucial elements of modern information systems, functioning as a well-organized framework for effectively managing, storing, and retrieving data. Whether it involves the administration of client data in commercial enterprises, storing medical records and patients’ information within healthcare facilities. By offering features such as data integrity, security, and scalability, databases enable organizations to harness the power of data to drive innovation and achieve their objectives (Karunamurthy et al., 2023). Constructing a resilient database to oversee weather data and monitor extreme weather patterns is crucial for both meteorological investigation and the protection and welfare of global societies. In the context of weather data management, databases offer numerous advantages. Weather data management is essential for various sectors beyond meteorology, including agriculture, transportation, energy, and urban planning. For example, farmers rely on weather forecasts to optimize crop management practices and minimize crop losses due to adverse weather conditions (Malhi et al., 2021). They provide a centralized repository for storing vast amounts of weather-related information collected from various sources, including weather stations, satellites, and remote sensors (Muppala, 2023). This centralized approach streamlines data access and analysis, allowing meteorologists and researchers to derive valuable insights into weather patterns, trends, and anomalies. The importance of weather data management cannot be overstated, especially in light of the increasing frequency and intensity of extreme weather events attributed to climate change (Frame et al., 2020).
The impact of severe weather condition is numerous and adverse, posing threats on human existence. In Nigeria, Ogbuabor & Egwuckwu (2017) shows that weather conditions significantly influence the economy which relies on agriculture. An extreme case of weather condition like droughts and floods can seriously harm infrastructure and interfere with business operations. In Nigeria, climate change also affects forestry due to erosion and excessive wind thereby resulting in decline in forest produce such as wood and cane. Consequently, it leads to reduction in forestry produce and low income, as well as an increase in the costs of building and furniture materials. Punch, one of Nigeria newspaper reported the results of their interviews with different farmer in 2023. It was gathered that, unfavorable weather events like floods, droughts, and extremely high temperatures cause large crop losses—up to 50% of the overall crop production (Punch newspaper, 2023). All these identified issues are impact of an extreme weather conditions which demand for a swift attention to improve productability, and human betterment.
This integration of machine learning with a relational database enhances the capability to make data-driven decisions, providing a competitive advantage and promoting efficiency (Eessar, 2016). The aim of this research is to design and develop a database system for weather data and apply a machine learning algorithm for prediction of severe weather. In respect to this, the following objectives are to be achieved: (1) Design a weather management system that handles several weather information using MySql; (2) To develop a binary classifier model to classify severe weather condition and not severe weather condition; (3) Evaluate the performance of the model using confusing matrix.
Literature Review
Researchers have extensively explored the impact and significance of weather conditions on various sectors, including agriculture, aviation, air quality, health, land and sea transportation, defense, energy, water, fishing, construction, tourism, and other economic areas. The term “weather conditions” can be used to describe a number of atmospheric parameters, including air pressure, temperature, humidity, precipitation, and wind speed. Depending on the area and season, these parameters are said to change significantly, influencing all areas of lives. The benefits of favourable weather vary according on the situation. It can generally improve our disposition, degree of productivity, and general quality of life (Lee et al., 2014). Good weather frequently encourages social gatherings and outdoor activities, which enhances mental and physical well-being (Heidarzadeh et al., 2021). In agriculture, a study conducted by Manjusha et al. (2019) checked the interaction between weather conditions and agriculture, it was concluded that weather conditions have a significant impact on farm product. The study reported that farmers who adopted agriculture meteorology advisories services in their day-to-day agriculture practices have extra benefits of 80.91%, 77.2%, 79.09% and 66.36%. The advantage of weather conditions has made it possible to find a correlation between ship speed and fuel consumption rate, according to Taskar & Andersen (2020), when the speed is reduced by 30%, fuel savings vary from 2% to 45%, depending on ship type, size and weather conditions.
2.2. Weather Conditions
2.2.1. Air Pressure
The definition of air pressure varies in context, but they all mean the same things. Air pressure (AP) is the pressure exerted by the weight of air in the atmosphere of Earth, and it is proportional to the gravitational force. In a recent study conducted by Spiridonov et al. (2021), air pressure was defined as the force per unit area exerted on a surface by the weight of air force above it. AP often referred to as atmospheric pressure, is a fundamental aspect of Earth’s atmosphere, influencing various aspects of human society (Dohmen et al., 2020). In a study conducted by Cui et al. (2017) it was reported that a decrease in AP resulted to a decrease in respiratory flow rate at standard condition. The study also reported that Oxygen consumption and carbon dioxide significantly increase. However, respiratory quotient observed to increase. Like any other substances, AP has both positive and negative effect on human daily lives. Chen et al. (2023) explained the medical of AP to the medical system, according to him AP serves as a key indicator for weather forecasting. Also, meteorologists analyze pressure patterns to predict weather changes accurately. In a study conducted by Rabinovich (2020), the meteorological tsunamis are mainly produced by directly air pressure force. The result of this study shows that rise in AP often signifies fair weather, while falling pressure indicate the approach of a storm or other atmospheric disturbances. This predictive capability enables communities to prepare for impending weather events, reducing the risk of damage and ensuring public safety. Although, it was said that moderate AP conditions are essential for optimal agricultural productivity. It makes farmers rely on pressure readings to schedule planting, irrigation, and harvesting activities. A study conducted by Heinrich et al. (2022) explore the impact and significant of AP is aviation safety. It was recorded that pilots use pressure data to determine aircraft altitude, calculate airspeed, and ensure safe takeoffs and landings. According to National Research Council (US) Committee on Air Quality in Passenger Cabins of Commercial Aircraft (2002, p2), AP variations affect aircraft performance, particularly during ascent and descent. Accurate AP readings help pilots navigate safely through different atmospheric conditions, reducing the risk of aviation accidents and enhancing passenger safety. Extreme fluctuations in AP are severe and can have adverse effects on human health. In most cases sudden changes in pressure, often associated with weather fronts or storms, may trigger headaches, migraines, and joint pain in susceptible individuals (Lickiewiz et al., 2020). These health issues can significantly impact daily activities and quality of life, particularly for those with pre-existing medical conditions. In architectural science it was observed that drastic shifts in AP can cause structural damage to buildings and infrastructure (Askar et al., 2021). Also, high tense of winds is said to be associated with storms or hurricanes create pressure differentials that exert significant force on structures, leading to structural failures or collapse. Vulnerable buildings, such as those with weak foundations or inadequate reinforcement, are particularly susceptible to damage during extreme pressure events (Yang et al., 2018). In transportation, a study by Chen et al. (2023) reported that AP variations can disrupt transportation systems, leading to delays and cancellations. Changes in pressure affect aircraft performance, necessitating adjustments to flight schedules or routes. Similarly, fluctuations in pressure may impact rail and road networks, causing delays or closures due to safety concerns. Transportation disruptions can inconvenience commuters, disrupt supply chains, and have economic repercussions for affected regions.
2.2.2. Temperature
Research has shown that temperature is of two difference records; minimum and maximum which are known to be the fundamental aspect of climatic and weather condition. It serves is identified as one of the influencers of various natural processes and human operations. According to Luce and Callanan (2020), temperature represent the state of hotness or cold of a substance. Asif et al. (2018) stated that the minimum temperature (Mi-Temp) is the lowest record of a temperature within a specific time, mostly over 24-hour period or over the night. The Mi-Temp is observed early in the morning, before the sunrise. A study by Gobbett et al. (2021) stated that this type of temperature is essential for recording cold exposure risks, determining level of frost occurrence, serving as the basis for understanding the variation in temperature. When the temperature is at maximum, a form of solar radiation and atmospheric conditions occur leading to peak heat (Liu et al., 2021). According to Climate Change Knowledge Portal (2021) maximum temperature (Max-Temp) is the highest degree of temperature that could be recorded in during a period. Comprehending the highest recorded temperatures is essential for analysing the hazards associated with heat stress, measuring the amount of energy required, and predicting patterns in weather conditions. In a study conducted by Pranoto et al. (2019) it was shown that one of the major influencers of temperature is solar radiation, also regarded as sunlight. It is known to be the primary driver of temperature differences on earth’s surface. Latitude and seasonality are another great factor influencing the degree of temperature, a study by Sajadi et al. (2020) recognized latitude playing a significant role in temperature distribution. The equatorial regions are said to receive more direct sunlight and this led to higher temperatures compared to polar regions. On the other hand, variations in season caused by the earth’s axial tilt, result in temperature fluctuation between higher maximum (summer) and lower minimum (winter) (Ola et al., 2022). Other factors and parameters influencing the behavior of the temperature are topography and elevation, land cover and surface properties. Medically, it was reported that during the covid 19 pandemic, temperature was observed to be an environmental driver of the COVID-19 outbreak. Lower and higher temperatures might be positive to decrease the COVID-19 incidence (Mecenas et al., 2020). When a temperature is been influenced to behavior differently from normal, it becomes hazardous. Such case of temperature is termed to be extreme. This happens mostly when the temperature is cold or hot beyond normal. A study conducted by Li and Anming (2023) identified the threat of extreme temperature, and according to National Institute of Environmental Health Sciences (2024). Extreme hot temperature has an adverse effect related to illnesses such as heatstroke and dehydration; this is common among vulnerable populations such as the elderly and children. On the other hand, cold temperatures increase the risk of hypothermia and frostbite, necessitating protective measures and shelter provisions. Also, Jerry and John (2015) reported that, temperature differences impact the crop growth and yield. This is as a result of heat stress during flowering and fruiting stages can resulting to a reduction in crop yields and quality.
2.2.3. Humidity
According to Wu et al. (2020) humidity is the ratio of the actual water vapor pressure to the saturation water vapor pressure at the prevailing temperature. It amounts for the water vapor present in the air. Humidity can encompass the level of moisture in any substance; however, it is commonly used to describe the amount of water vapor in a gas or a combination of gases like the air in the atmosphere. The significant of humidity in the environment is identified in a study conducted by Xiong et al. (2017), affecting both living organisms and non-living systems. The weather dynamics is one of the importance of humidity, which its ability to shaping weather conditions worldwide. The high levels of humidity are known to contribute to the formation of clouds, precipitation and fog which impact rainfall patterns and cloud cover. It’s the other case when the humidity is low, leading to dryness, reduction in cloud formation and high evaporation rates. Human health and comfort are said to be related to humidity significantly impacting it, maintain indoor air quality and preserves structural integrity in architecture. Also, agriculture ecosystems and yield of crops are other things humidity influence. Excessive and high humidity comes with a lot of challenges. To human well-being, elevated temperature in conjunction with high humidity will cause discomfort and heat stress leading to stroke and dehydration (Abokhashabah et al., 2021). According to a microbiological study conducted by Romero et al. (2022) it was stated that excessive humidity enhances the proliferation of fungal diseases in crops.
2.2.4. Precipitation
Precipitation is an essential component of the Earth’s weather system, encompassing any type of water, including rain, snow, sleet, or hail, that descends from the atmosphere to the Earth’s surface (Allen et al., 2020). According to water is an essential part of the hydrological cycle, and it has a significant impact on replenishing freshwater supplies, sustaining ecosystems, and affecting several elements of human life. According to Atkinson (2019) rainfall occurs when water vapor in the atmosphere condenses into liquid droplets and falls to the Earth’s surface.
It is the most common form of precipitation and plays a vital role in sustaining vegetation, replenishing surface water sources, and maintaining ecological balance (Hao et al., 2019). Snowfall is another form of precipitate. According to Mohammadian et al. (2021) it is said to results from the condensation of water vapor into ice crystals in the atmosphere, forming snowflakes that accumulate and fall to the ground. In agriculture, snow is said to be significant for maintaining soil moisture levels, insulating plant roots, and supporting winter recreational activities. Sleet was identified as a precipitated in a study conducted by Rohli et al. (2021) it was said to be formed when raindrops freeze into ice pellets before reaching the ground, while freezing rain occurs when liquid raindrops freeze upon contact with cold surfaces. Both phenomena can create hazardous conditions, leading to icy roads, sidewalks, and power outages. Hailstones are solid ice pellets that form within thunderstorm clouds through a process of repeated freezing and melting of water droplets. Hailstorms can cause significant damage to crops, vehicles, and buildings, posing risks to agriculture and infrastructure (Allen et al., 2020). A severe insufficient or excessive precipitation is related to droughts, crop failures, soil erosion, and loss of agricultural productivity, impacting food security and livelihoods. A severe change in precipitation patterns can disrupt ecological balance, alter species distributions, and increase the risk of habitat loss and fragmentation. A severe precipitate is also related to flooding. According to Reed et al. (2022) flooding disrupts transportation networks, contaminates water supplies, and displaces populations. Intense rainfall and runoff accelerate soil erosion, sediment transport, and deposition, leading to soil degradation, river channel morphological changes, and sedimentation in reservoirs and waterways.
2.2.5. Wind Speed
For a very long time the Anemology has been providing insight on the significant of wind and its impact on nature. In 2019, a study by Zeng et al. (2019) defined wind power as a rapid growing alternative energy source. And according to Topić et al. (2014) wind energy is said to have a positive impact on the grid system, positively influenced the sociological structures, and negatively impacts the environment. Wind speed is primarily driven by differences in air pressure between high-pressure and low-pressure areas. In a study conducted by Li et al. (2019) the pressure transient was analyzed using the tunnel portal design, the result shows that the results indicate a significant reduction in pressure transients caused by train tunnel entry, compared to a tunnel with a constant cross-section. The result of a study conducted by Li et al. (2021) shows that surface roughness, such as terrain features and vegetation, can slow down wind speed by exerting frictional resistance on the moving air. Wind speeds tend to be higher at higher altitudes where frictional effects are minimal. Differences in temperature between adjacent air masses can create localized pressure variations, leading to wind circulation patterns such as sea breezes, mountain breezes, and monsoons. According to National Geographic (2023), wind influences several areas of lives, higher speeds of wind result in increased power production of electricity, wind speed influences weather patterns, including the formation and movement of weather systems such as storms, fronts, and cyclones. Severe winds are called strong winds which pose hazards to navigation, leading to delays, diversions, and safety concerns. Severe wind events are characterized by their intensity, duration, and geographical extent.
2.3. The Role of Machine Learning and Databases in Weather Tracking
Machine learning and databases play pivotal roles in the field of weather tracking, enhancing the accuracy of forecasts and providing valuable insights into weather patterns. The integration of these technologies enables meteorologists and researchers to process vast amounts of data and generate predictive models that are essential for various applications, from agriculture to disaster management. Machine learning in weather tracking involves data analysis and pattern recognition, where algorithms analyze large datasets to identify patterns and correlations that may not be immediately apparent to human analysts (Chen et al., 2023). These patterns can include temperature fluctuations, precipitation levels, wind speeds, and atmospheric pressure changes. Techniques such as regression analysis, classification, clustering, and neural networks are used to predict future weather conditions based on historical data (Adekunle et al., 2024). Predictive modeling is another crucial aspect, using machine learning to forecast short-term and long-term weather conditions. These models can predict temperature, humidity, precipitation, storm paths, and other critical weather elements. Models such as Random Forests, Support Vector Machines (SVMs), and Deep Learning architectures like Convolutional Neural Networks (CNNs) and Recurrent Neural Networks (RNNs) are commonly employed to improve forecast accuracy (Chen et al., 2023). Relational databases (e.g., MySQL, PostgreSQL) and NoSQL databases (e.g., MongoDB, Cassandra) are used to store different types of weather data, including numerical readings, satellite images, and textual reports (Khan et al., 2023). Databases also integrate weather data from various sources, providing a unified platform for analysis. Data warehouses and data lakes are often used to consolidate and manage large volumes of weather data, enabling efficient retrieval and analysis. The volume of weather data is enormous, requiring big data technologies for storage, processing, and analysis. Apache Hadoop and Spark are popular frameworks that facilitate distributed processing of large datasets (ASAP, n.d.). These technologies support advanced analytics and machine learning workflows, allowing for the extraction of meaningful insights from vast weather datasets.
2.4. Related Research Work
| Study | Weather condition | Effect on | Case | Result |
| Wu et al. (2020) | Humidity vs Temperture | Covid 19 | Severe | Revealed that temperature and relative humidity were both negatively related to daily new cases and deaths. |
| Shi et al. (2020) | Temperature | Covid 19 | Severe | COVID-19 incidence changed with temperature as daily incidence decreased when the temperature rose |
| Dohmen et al. (2020) | Air pressure | Oxygen and dyspnea | There was a significant association between barometric pressure and SpO2 < 96%, and we found that a reduction of 166.67 hPa was needed to get a 1% reduction in SpO2. The change in atmospheric pressure was not significantly associated with shortness of breath, also not in subjects with reduced lung function. | |
| Akira et al. (2000) | Air pressure | Visual field defect | Decreased air pressure reduced the occurrence of visual field defects significantly |
Methodology
To achieve the aim of this project from design to implementation. The project was of two phases: (1) Database design and implementation. The database was tested by querying to pulls data from the related tables to evaluate the establishment;(2) After this, a supervised machine learning was trained to predict and classify severe weather patter conditions. The data used was gotten from climate change knowledge portal.
3.2. Data Collected
The dataset utilized for this project is sourced from OpenWeather a valuable extension to the existing Nigerian Meteorological Agency (NiMet) dataset. It includes comprehensive weather information for cities across Nigeria, with a total of 22,541 observations. The dataset has been carefully structured in a CSV format with 21 attributes, providing detailed meteorological and geographical data. Attributes: 1) Country, 2) City, 3)Latitude, 4)Longitude, 5)Temperature, 6) Minimum temperature, 7) Maximum temperature, 8)Pressure measured in hPa, 9)Humidity percentage, 10)Sea level measured in hPa, 11)Ground level measured in hPa, 12)Wind speed, 13)Wind degree, 14)Sunrise, 15)Sunset, 16)Time zone, 17)Cloud, 18)Description of the weather condition, 19)Region, 20)Population, 21)Date: Date when the measurement was recorded.
3.3. Data Base Designs and Implementation
To design the database, such that it maintains the characteristic of a good database by avoiding redundancy, scalability, data independency, and integrity. To achieve these, the database was normalized. At first, the database structure was initially drafted on Ms Excel before the implementation as seen in Figure 1 below.
Four tables were created based on independence and dependences. This process involves Identifying an entity as a logical collection of items related to the stated database and an attribute which is descriptive or quantitative characteristic of the entity. The entity which is known to be a thing, place, person or object that is independent of another, it doesn’t require any certain function and are uniquely identifiable. The tangible entity which contains attributes that can be touched and felt physically identified in the data to be country, city, region, and population. The intangible entity was also identified to be date and description which are abstract. For each of the table drafted, there are primary keys assigned to each of the entities serving as an ID number, which makes it different from other entities. Location table with ID_location, weather condition table with ID_Weather_condition, geography table with ID_geography, and date taken with ID_date_taken. All these serves as uniquely defined, no presence of duplicate. The three tables (weather condition, geography, and data taken) were all depending on the location table. This made it necessary to create a relationship between the independent and the dependents. And the relationship was created such that there is one-to-one correspondence between entities of the dependent tables to that of independent. The creating of the database was done using a structure query language Mysql which is sufficient for creating a relational database. This process involves the implementation of the designed in Figure 2[(a) - (d)].
3.4. Building a Supervised Classification Algorithm
After the database has been successfully designed and implemented. The supervised machine learning (ML) was trained on it for classification (Figure 3).
3.4.1. Model Selection
A binary classifier was trained involving three models (i.e., logistic regression, a random forest, and a binary neural network) was trained for comparison purpose using the data from the database to classify severe weather data and un-severe weather data. These models were selected based on strength to handle variable of two classes, such as event occurring and the other not occurring. The two classes are mutually exclusive and mutually exhaustive. In this case, severe and un-severe. The logistic regression uses maximum likelihood estimate to find the best least and unbiased estimate (i.e. coefficients) that minimizes the log-odd (equation 2) of predicting a weather condition to be true.
The logistic function, also referred to as the sigmoid function (equation 3), is employed to convert the result of the linear equation into a probability value ranging from 0 to 1.
Logistic regression models acquire knowledge of a decision boundary that divides the two classes inside the feature space. In logistic regression, the decision border is commonly depicted as a linear barrier defined as the collection of points where the probability is precisely 0.5. And any probability less than the threshold is classified as 0 and probability greater than the threshold is classified as 1 as seen in Figure 4.
The mathematical representation of the model is the linear combination of all the independent variables with some weights (i.e. coefficients) contribution to the prediction of the probability of predicting the weather condition to be severe which is given below:
3.4.2. Data Modification: Determining Weather Severity Classification
By default, the collected data has no severe label. To assign this label, crucial step involved classifying weather severity to facilitate predictive modeling was taken. The classification was based on specific thresholds for various weather parameters, creating a binary categorization of ‘Severe’ and ‘Non-Severe’ weather conditions. The criteria for classifying weather as ‘Severe’ included high temperature, low pressure, extreme humidity levels, high wind speed, and certain weather descriptions indicating severe conditions. Temperature weather was classified as severe if the temperature exceeded 313.15 Kelvin (40 °C) in accordance with National weather service (n. d.) report, indicating extreme heat conditions. Low atmospheric pressure often correlates with severe weather conditions. Hence, weather was deemed severe if the pressure dropped below 1000 hPa (Dodmen et al., 2020). Both extremely high and low humidity levels can indicate severe weather. Therefore, weather was classified as severe if the humidity was either above 90% or below 20% (National weather service, n. d.). High wind speeds are a common indicator of severe weather, such as storms or hurricanes. Thus, weather was classified as severe if the wind speed exceeded 10 meters per second. Certain keywords in the weather description, such as “storm,” “thunderstorm,” or “heavy rain,” were used to identify severe weather conditions. Additionally, if the cloud cover was greater than 80% and these keywords appeared in the description, the weather was classified as severe. The Figure 5a,b below show the geographical representation of the severed and not severed state in Nigeria.
3.4.3. Data Preparation and Preprocessing
The first thing that was done while preparing the dataset is to address any form of data issues in the dataset. The data was normalized using the equation below after which the dataset was partitioned into 80% for fitting data, and 20% for validation.
Imbalancing issue in the fitting data was rectify using the mixed method which involves the combination of oversampling and under-sampling to equalize the distribution of the target variable as seen in the Figure 6a,b below.
3.4.4. Model Evaluation Process
As stated in the previous subchapter, the test data which is 20% of the entire dataset was used to test the performance the model. This data served as a new instance to be used for cross-validation methods which can be used to test the performance of the logistic regression and to obtain a reliability estimate of the model. The evaluation involves the assessment of various metrics, including accuracy, precision, recall, F1-score (Adekunle et al., 2024).
Equation 4: Performance metrics evaluation equation
True Positives (TP): This represents the number of weather condition correctly identified as severe by the model.
True Negatives (TN): This is the number of weather condition correctly identified as not severe.
False Positives (FP): This represents the number of weather condition incorrectly identified as severe when it is not severe.
False Negatives (FN): This is the number of weather condition incorrectly identified as not severe when it is severe.
3.4.5. Tools and Material
The implementation of this study was done in R programming software version X in an R studio integrated development environment on a Windows operating system. Several packages were used for a successful implementation. Packages such as tidyverse was used for data manipulation, wrangling, and visualization while dlookr was used to explore and visualize patterns of missingness through Pareto plots. Class imbalance in the weather severity outcome was addressed using the ROSE package caTools package was employed to split the data into training and testing subsets. To handle spatial data, the sf package was utilized for working with geographic coordinates, and interactive map visualizations were generated using mapview, enabling the mapping of weather severity patterns across locations in Nigeria. For predictive modeling, logistic regression was implemented using base R’s glm function, random forest model with the randomForest package, and neural network models were trained using the nnet package. Model evaluation was carried out using the caret package. All packages used are open-source and widely adopted in the scientific community for environmental and spatial data analysis, ensuring reproducibility and transparency of the results.(The code: https://github.com/josephdamilare01/Building-a-database-for-managing-weather-data-and-Algorithm-for-tracking-severe-weather-patterns./blob/main/Weather%20analysis.R )
Results and Discussion
Results
The descriptive analysis of various weather condition variables, highlighting their central tendencies, dispersion, and variability (Table 2). The key metrics analyzed include the mean, standard deviation (sd), minimum, median, maximum, interquartile range (IQR), and coefficient of variation (CV). The average population is 53,158.7 with a high standard deviation of 152,217.3, indicating significant variability across different regions, and the coefficient of variation is 2.9, reflecting high relative variability in population distribution. Temperature has an average value of 303.3 K with a standard deviation of 4 K, suggesting consistent temperatures across regions. The pressure has an average of 1010.2 hPa with a standard deviation of 2.3 hPa, showing minimal variation. On the other hand, humidity presents a mean of 38% with a standard deviation of 22%, indicating moderate variability. Ground level analysis shows an average of 976.2 meters with a standard deviation of 27.6 meters, indicating relatively stable elevation levels.
The wind speed has an average value of 2.9 m/s with a standard deviation of 1.5 m/s, indicating moderate variability. Also, wind degree has an average value of 134.3° with a standard deviation of 103°, indicating high variability in wind direction. Lastly, cloud cover presents a mean of 71.7% with a standard deviation of 35.9%, showing considerable variability. The coefficient of variation for the variables were very low. Temperature (cv = 0), pressure (cv = 0), humidity (cv = 0.6), ground level (cv = 0), wind speed (cv = 0.5), wind degree (cv = 0.8) and cloud (cv = 0.5) which highlight a very low or moderate relative variability. The weather conditions are shown in Figure 7a–h. Similarly, the descriptive statistic for weather condition by state and by descriptions were also provided (Supplementary 1 & Supplementary 2).
The relationship between the weather variables as shown on Figure 8. Population showed a weak positive correlation with temperature (0.028) and ground level (0.232), indicating slight associations where higher populations might be found in slightly warmer and elevated areas. Additionally, a moderate positive correlation was observed between population and humidity (0.249), suggesting that more populated regions tend to be more humid. Conversely, population had a weak negative correlation with pressure (-0.141) and wind speed (-0.024), implying that areas with higher populations might experience slightly lower pressure and wind speeds. Temperature exhibited a strong negative correlation with pressure (-0.640), highlighting that higher temperatures are typically associated with lower pressure. Furthermore, there was a moderate negative correlation between temperature and both humidity (-0.296) and wind degree (-0.002), suggesting that higher temperatures might correspond to lower humidity and slight variations in wind direction. Temperature also had a weak positive correlation with ground level (0.260) and wind speed (0.221), indicating that temperature might slightly increase with elevation and wind speed. Also, pressure was found to have a weak negative correlations with humidity (-0.083), ground level (-0.387), and wind speed (-0.015), suggesting that lower pressure is slightly associated with higher humidity and lower elevations.
Additionally, pressure’s correlation with wind degree (-0.322) and cloud cover (-0.075) was weakly negative, indicating minimal relationships with these variables. On the other hand, humidity showed a strong positive correlation with ground level (0.662) and wind degree (0.642), indicating that more humid areas tend to be at higher elevations and associated with specific wind directions. There was also a weak negative correlation between humidity and temperature (-0.296) and wind speed (-0.297), suggesting that higher humidity is generally found in cooler areas with slower winds. The ground level had a moderate positive correlation with wind degree (0.528) and a weak positive correlation with cloud cover (0.129), suggesting that higher elevations might experience certain wind directions and slightly more cloud cover. A weak negative correlation was observed between ground level and wind speed (-0.112), indicating that higher elevations might experience slower wind speeds. Wind speed showed weak negative correlations with population (-0.024), pressure (-0.015), humidity (-0.297), and ground level (-0.112), indicating minimal relationships with these parameters. The correlation with wind degree was moderate and negative (-0.388), suggesting that higher wind speeds are associated with specific wind directions. Wind degree had a moderate positive correlation with humidity (0.642) and ground level (0.528), indicating that specific wind directions are associated with higher humidity and elevations. The correlations with population (0.186), temperature (-0.002), and cloud cover (0.008) were weak, showing minimal relationships. Finally, Cloud cover exhibited weak correlations with most variables, with the strongest being a weak positive correlation with humidity (0.123) and ground level (0.129), suggesting slight associations.
The performance metrics of the three-models —Neural Network (NN), Random Forest (RF), and Logistic Regression (LR)— revealing significant insights into their effectiveness across the training (Figure 9(a)), testing (Figure 9(b)), and full datasets (Figure 9(c)) based on key metrics including accuracy, sensitivity, specificity, precision, Kappa, and balanced accuracy [Figure 9(a) – 9(b)]. On the training dataset (Figure 9(a)), both NN and RF models showed perfect classification ability, with NN achieving an accuracy of 1(95% CI: 0.9997 to 1), Kappa of 0.9999, sensitivity of 0.9999, and specificity of 1.0. RF slightly outperformed NN with a perfect accuracy of 1.0(95% CI: 0.9998 to 1), Kappa of 1, 0.9635 sensitivity, and 100% specificity, without any misclassification. In contrast, the LR model had an accuracy of 0.9651(95% CI: 0.9625 to 0.9676), Kappa of 0.9303, sensitivity of 0.9635, and specificity of 0.9668(Supplementary 3(a)). While these values are still strong, LR misclassified 707 samples in training, highlighting a trade-off between interpretability and predictive precision (Supplementary 4(a)).
When tested on the unseen testing dataset, a similar pattern emerged (Figure 9(b)). RF maintained its perfect accuracy of 1.0(95% CI: 0.9984 to 1), while NN had a slightly lower accuracy of 0.9996(95% CI: 0.9975 to 1), sensitivity of 0.9991, and Kappa of 0.9991, with only 1 misclassified instance. LR again trailed, achieving accuracy of 0.9663(95% CI: 0.958 to 0.973), sensitivity of 0.9700, specificity of 0.9625, and Kappa of 0.9326, misclassifying a total of 76 instances (42 false negatives and 34 false positives) (Supplementary 4(b)). Despite this, LR’s consistent performance confirms its generalizability. Notably, the balanced accuracy for LR on test data was 0.9663, compared to 0.9996 for NN and 1.0 for RF, reinforcing the relative strength of the complex models in capturing patterns in unseen data (Supplementary 3(b)).
Across the entire dataset, RF continued its flawless classification, achieving 1.0(95% CI: 0.9998 to 1) accuracy, perfect Kappa (i.e., 1), and no misclassifications (Supplementary 4(c)). The NN model performed nearly as well, with accuracy of 0.9999(95% CI: 0.9997 to 1), Kappa of 0.9998, sensitivity of 0.9998, and specificity of 1.0, making only 2 classification errors (Supplementary 4(c)). LR once again maintained consistent but lower scores, recording accuracy of 0.9652(95% CI: 0.9628 to 0.9676), sensitivity of 0.9642, specificity of 0.9664, and Kappa of 0.9305, with a total of 783 misclassified instances (377 false negatives and 406 false positives) (Supplementary 4(c)). While RF and NN exhibited extremely high performance across all datasets, the lack of misclassification on both training and test sets may suggest overfitting, which calls for careful evaluation using external validation or cross-validation techniques. In contrast, LR’s relatively lower yet stable performance across datasets suggests better potential for generalization and robustness, especially in real-world scenarios where perfect predictions are rare. The predicted weather conditions are visualized on the map below [Figure 10a,b].
Discussion
The result of this study shows a comprehensive analysis of the weather condition in Nigeria presenting the complex relationships between various weather variables and their potential impacts on different regions in Nigeria, highlighting the critical influence of weather conditions on socio-economic factors. The high variability in population distribution indicates diverse population densities across regions, which may influence local climate conditions due to human activities. Temperature and pressure, showing consistent values across regions, suggest stable climatic conditions, whereas moderate variability in humidity points to differences in moisture levels, which can significantly impact agriculture and forestry. The observed relationships between weather variables reveal intricate dynamics. The weak positive correlation between population and temperature implies that more densely populated areas might experience slightly higher temperatures due to urban heat effects (Jiang et al., 2018). Conversely, the strong negative correlation between temperature and pressure indicates that higher temperatures are typically associated with lower pressure, a common meteorological phenomenon (WHO, 2018). The findings underscore the significant impact of weather conditions on agriculture and forestry in Nigeria. High variability in humidity, coupled with the strong positive correlation between humidity and ground level, suggests that elevated areas tend to be more humid, which could benefit certain crops but may also pose challenges due to increased erosion and wind damage (Malhi et al., 2021). The moderate negative correlation between temperature and humidity implies that higher temperatures could exacerbate drought conditions, adversely affecting crop yields and forest health (Cui et al., 2022). The performance metrics of the supervised binary classifier model demonstrate its efficacy in predicting severe weather conditions. High accuracy and balanced accuracy values indicate robust model performance, with a strong agreement between predicted and actual classes. Sensitivity and specificity metrics show the model’s ability to accurately identify both severe and non-severe weather conditions, crucial for practical applications in weather prediction and disaster management. Comparing the model’s performance on novel datasets with established methods reveals its potential for real-world applications. The high predictive accuracy on both test and train datasets indicates the model’s generalizability and reliability, essential for deploying in operational weather forecasting systems. Also, the database created demonstrate a positive possibility of storing weather data. The development and design of an efficient weather management system using MySQL are crucial for handling diverse weather data. Standardizing the database structure to ensure maximum efficiency involves implementing techniques like normalization and indexing.
Limitations
This study only captures 6 states out of 36 states in Nigeria which indicate that the result of this study should be attributed these states alone. However, the model could be adopted to other state within the country with caution. Nigeria is characterized by three distinct climate zones, a tropical monsoon climate in the south, a tropical savannah climate for most of the central regions, and a Sahelian hot and semi-arid climate in the north of the country. The southern regions experience strong rainfall events during the rainy season; the central regions are governed by a well-defined single rainy season and dry season. The dry season is influenced by the Harmattan wind from the Sahara. Coastal areas experience a short drier season with most rain. In the north, rain only falls from June to September while the rest of the year is hot and dry. Northern areas have a high degree of annual variation in its rainfall regime, which results in flooding and droughts. Highest temperatures occur during the dry season, and vary little from the coast to inland areas. Similar to rainfall, the relative humidity in Nigeria decreases from the south to the north, with an annual mean of 88% around Lagos. The most significant temperature difference in Nigeria is between the coastal areas and its interior as well as between the plateau and the lowlands which is significantly different from other countries and it literally impair the generalization of this project. Also, limited access to comprehensive and accurate historical weather data may constrain the depth and accuracy of the analysis and predictive models developed in this project. Also, the severity was derived based on some threshold different from the using tools such as Doppler radar, weather satellites, and various ground-based instruments like thermometers, barometers, and anemometers.
Conclusion and Recommendation
This study demonstrates the promising potential of adopting machine learning algorithms for weather prediction. The comprehensive analysis of weather variables reveals critical insights into their impacts on different regions and socio-economic factors. The high accuracy and reliability of the models in predicting severe weather conditions underscore its practical applicability in weather forecasting and disaster management. Furthermore, the development of an efficient weather data management system using MySQL highlights the importance of robust data storage solutions in supporting advanced analytical models. Implementing such systems can significantly mitigate the adverse impacts of severe weather conditions, enhance agricultural productivity, and improve disaster preparedness and response.
Future research could focus on incorporating more diverse weather variables and exploring advanced machine learning algorithms to further refine predictive accuracy. Additionally, integrating real-time weather data and developing user-friendly interfaces for stakeholders can enhance the practical utility of weather management systems, contributing to sustainable development and resilience against climate change in Nigeria.
Supplementary Materials
The following supporting information can be downloaded at the website of this paper posted on Preprints.org.
References
- Hachimi, Chouaib & Belaqziz, Salwa & Khabba, Saïd & Sebbar, Badr-Eddine & Dhiba, Driss & Chehbouni, A. (2022). Smart Weather Data Management Based on Artificial Intelligence and Big Data Analytics for Precision Agriculture. Agriculture, 1301.
- Sulistyaningsih, E. , Murti, W., & Ratnasih, C. (2024). Analysis of E-Marketing Strategy and Business Innovation in Optimizing Improvement of Service Quality and Its Effect on MSME Income. ADI Journal on Recent Innovation,.
- Osakwe, J. , Mutelo, S., & Obijiofor, N. (2023). Integrating Customer Relationship Management and Business Intelligence to Enhance Customer Satisfaction and Organisational Performance. A Literature Review. A Literature Review.
- Lei, M. Q. , & Ming, C. W. (2023). The Empowerment of Digital Marketing among SMEs in Chengdu, Sichuan Province, China: The Influence of social media towards Purchase Decision. Journal of Digitainability, Realism & Mastery (DREAM).
- Jain, A. , Patel, H. , Nagalapatti, L., Gupta, N., Mehta, S., Guttula, S.,... & Munigala, August). Overview and importance of data quality for machine learning tasks. In Proceedings of the 26th ACM SIGKDD international conference on knowledge discovery & data mining (pp. 3561-3562)., V. (2020. [Google Scholar]
- Karunamurthy, A. , Yuvaraj, M., Shahithya, J., & Thenmozhi, V. (2023). Cloud Database: Empowering Scalable and Flexible Data Management. Quing: International Journal of Innovative Research in Science and Engineering.
- Frame, D. J. , Rosier, S. M., Noy, I., Harrington, L. J., Carey-Smith, T., Sparrow, S. N.,... & Dean, S. M. (2020). Climate change attribution and the economic costs of extreme weather events: a study on damages from extreme rainfall and drought. Climatic Change.
- Malhi, Gurdeep Singh, Manpreet Kaur, and Prashant Kaushik. 2021. Impact of Climate Change on Agriculture and Its Mitigation Strategies: A Review. Sustainability, 1: 3, 1318. [CrossRef]
- Favaretto, M. , De Clercq, E., Schneble, C. O., & Elger, B. S. (2020). What is your definition of Big Data? Researchers’ understanding of the phenomenon of the decade. PloS one, 2289. [Google Scholar]
- Waring, S. M. (2021). Integrating primary and secondary sources into teaching: The SOURCES framework for authentic investigation. Teachers College Press.
- Punch Newspaper (2023). Farmers groan as poor practices, climate change worsen post-harvest losses. Accessed on 4th of april, 2024, from: https://punchng.
- Ogbuabor, J. E. , & Egwuchukwu, E. I. (2017). The impact of climate change on the Nigerian economy. I. ( 7(2), 217–223.
- Taskar, B. , & Andersen, P. (2020). Benefit of speed reduction for ships in different weather conditions. Transportation Research Part D: Transport and Environment.
- Heidarzadeh, E. , Rezaei, M., Haghi, M. R., Shabanian, H., & Lee, Y. (2021). Assessing the impact of outdoor activities on mental wellbeing; focusing on the walking path in urban area. Iranian journal of public health.
- Lee, J. J. , Gino, F., & Staats, B. R. (2014). Rainmakers: Why bad weather means good productivity. Journal of Applied Psychology.
- Spiridonov, V. , Ćurić, M., Spiridonov, V., & Ćurić, M. (2021). Atmospheric pressure and wind. ( 2021). Atmospheric pressure and wind. Fundamentals of Meteorology, 87–114.
- Manjusha, K. , Nitin, P., Suvarna, D., & Vinaykumar, H. M. (2019). Exposure, perception and advantages about weather based agroadvisory services by selected farmers of Anand District, India. Int. J. Curr. M. ( 8(5), 1934–1944.
- Wu, Y. , Jing, W., Liu, J., Ma, Q., Yuan, J., Wang, Y.,... & Liu, M. (2020). Effects of temperature and humidity on the daily new cases and new deaths of COVID-19 in 166 countries. Science of the Total Environment.
- Shi, P. , Dong, Y., Yan, H., Li, X., Zhao, C., Liu, W.,... & Xi, S. (2020). The impact of temperature and absolute humidity on the coronavirus disease 2019 (COVID-19) outbreak-evidence from China. MedRxiv.
- Akira, H. , Naoko Y., Tadashi H., Yasushiro M., and Akira N. (2000). American Journal of Ophthalmology, 0002; 5. [Google Scholar] [CrossRef]
- Cui, W. , Wang, H., Wu, T., Ouyang, Q., Hu, S., & Zhu, Y. (2017). The influence of a low air pressure environment on human metabolic rate during short-term (< 2 h) exposures. Indoor air.
- Chen, Y. , Gao, J., Yang, J., Berardi, U., & Cui, G. (2023). An hour-ahead predictive control strategy for maximizing natural ventilation in passive buildings based on weather forecasting. Applied Energy.
- Rabinovich, A. B. (2020). Twenty-seven years of progress in the science of meteorological tsunamis following the 1992 Daytona Beach event. Pure and Applied Geophysics, 1193. [Google Scholar]
- Heinrich, G. A. , Vogt, S., Lawrance, N. R., Stastny, T. J., & Siegwart, R. Y. (2022). In-wing pressure measurements for airspeed and airflow angle estimation and high angle-of-attack flight. Journal of Guidance, Control, and Dynamics, 1045. [Google Scholar]
- National Research Council, Division on Earth, Life Studies, Board on Environmental Studies, & Committee on Air Quality in Passenger Cabins of Commercial Aircraft. (2002, p2). The airliner cabin environment and the health of passengers and crew. Washington (DC): National Academies Press (US), Environmental Control, 2074.
- Askar, R.; Bragança, L.; Gervásio, H. (2021) Adaptability of Buildings: A Critical Review on the Concept Evolution. Appl. Sci. [CrossRef]
- Yang, Q. s & Gao, Rong & Bai, Fan & Li, Tian & Tamura, Yukio. (2018). Damage to buildings and structures due to recent devastating wind hazards in East Asia. Natural Hazards, 3253. [Google Scholar]
- Chen, X. , Chen, L., Xie, W., Mueller, N. D., & Davis, S. J. (2023). Flight delays due to air pollution in China. J. ( 119, 102810.
- Luce, M. R. , & Callanan, M. A. (2020). Family conversations about heat and temperature: Implications for children’s learning. Frontiers in psychology.
- Asif, A. , Zeeshan, M., & Jahanzaib, M. (2018). Indoor temperature, relative humidity and CO2 levels assessment in academic buildings with different heating, ventilation and air-conditioning systems. Building and Environment,.
- Gobbett, D. L. , Nidumolu, U., Jin, H., Hayman, P., & Gallant, J. (2021). Minimum temperature mapping augments Australian grain farmers’ knowledge of frost. Agricultural and Forest Meteorology.
- Liu, Y. , Tian, Z., Song, C., Chen, Y., Li, Y., & Liu, J. (2021). Thermal performance and optimization of a casing pipe solar energy storage floor with phase change material. ( 247, 111167.
- Climate Change Knowledge Portal (2021). Explore historical and projected climate data, climate data by sector, impacts, key vulnerabilities and what adaptation measures are being taken. Explore the overview for a general context of how climate change is affecting Nigeria, accessed on 5/4/2024, from: https://climateknowledgeportal.worldbank.
- Pranoto, S. , Pambudi, N., Wardani, N., Setyaji, A., Susanto, A., Setyawan, N., & Utomo, F. (2019). Parabolic trough collector’s heat transfer analysis with changes of variation on the pipe absorber system. Journal of Physics: Conference Series, 1088. [Google Scholar]
- Ola, K. , Tobias, B., Camilla, F. B., Patrick, F., Niklas, H., Gerd, H., Julie, A. H., Monica, I., Christopher, S. J., Saige, K., Norbert, M., Cinthya, N., Carole, N., Thomas, O., Jessica, L. O., Aurel, P., Cameron, P., Keith, P., Saija, M. S., Annabel, W., Sebastian F.M. B. (2022). Earth-Science Reviews, 1038; 43. [Google Scholar] [CrossRef]
- Sajadi, MM. , Habibzadeh, P., Vintzileos, A., Shokouhi, S., Miralles-Wilhelm, F., Amoroso, A. (2020). Temperature, humidity, and latitude analysis to predict potential spread and seasonality for COVID-19. SSRN [Preprint]. [CrossRef]
- Li, Tao, and Anming Bao. 2023. “Identification and Characteristics of Historical Extreme High-Temperature Events over the China–Pakistan Economic Corridor”, Atmosphere 14, no. 3: 530. [CrossRef]
- National Institute of Environmental Health Sciences (2024). Weather Extreme. Accessed on: 5/4/2024, from: https://www.niehs.nih.
- Jerry L., H. , and John H. P. (2015). Temperature extremes: Effect on plant growth and development, Weather and Climate Extremes, 2015; 10. [Google Scholar] [CrossRef]
- Mecenas P, Bastos RTDRM, Vallinoto ACR, Normando D. Effects of temperature and humidity on the spread of COVID-19: A systematic review. PLoS One, e: 18;15(9), 0238. [CrossRef]
- Xiong, Yan & MENG, Qing-shi & GAO, Jie & TANG, Xiang-fang & Zhang, Hongfu. (2017). Effects of relative humidity on animal health and welfare. Journal of Integrative Agriculture, 2095.
- Abokhashabah, T. , Jamoussi, B., Summan, A. S., Abdelfattah, E., & Ijaz, A. (2021). Effects of heat stress exposure and climate change on health and safety of outdoor workers. ( 16(3), 836.
- Romero, F. , Cazzato, S., Walder, F., Vogelgsang, S., Bender, S. F., & van der Heijden, M. G. (2022). Humidity and high temperature are important for predicting fungal disease outbreaks worldwide. G. ( 234(5), 1553–1556.
- Atkinson, B. W. (2019). Precipitation. In Man and Environmental Processes (pp. 23-37). Routledge.
- Hao, S. , Li, F., Li, Y., Gu, C., Zhang, Q., Qiao, Y.,... & Zhu, N. (2019). Stable isotope evidence for identifying the recharge mechanisms of precipitation, surface water, and groundwater in the Ebinur Lake basin. ( 657, 1041–1050. [PubMed]
- Mohammadian, B. , Namdari, N., Abou Yassine, A. H., Heil, J., Rizvi, R., & Sojoudi, H. (2021). Interfacial phenomena in snow from its formation to accumulation and shedding. Advances in Colloid and Interface Science.
- Rohli, R. V. , Li, C., Rohli, R. V., & Li, C. (2021). Precipitation Processes and Types. ( 2021). Precipitation Processes and Types. Meteorology for Coastal Scientists, 125–135.
- Allen, J. T. , Giammanco, I. M., Kumjian, M. R., Jurgen Punge, H., Zhang, Q., Groenemeijer, P.,... & Ortega, K. (2020). Understanding hail in the earth system. Reviews of Geophysics, 0006. [Google Scholar]
- Reed C, Anderson W, Kruczkiewicz A, Nakamura J, Gallo D, Seager R, McDermid SS.(2022). The impact of flooding on food security across Africa. Proc Natl Acad Sci U S A, 2119. [CrossRef]
- Li, W. , Liu, T., Huo, X., Chen, Z., Guo, Z., & Li, L. (2019). Influence of the enlarged portal length on pressure waves in railway tunnels with cross-section expansion. Journal of Wind Engineering and Industrial Aerodynamics.
- Topić, Danijel & Vezmar, Stanislav & Spajić, Anton & Šljivac, Damir & Jozsa, Lajos. (2014). Positive and Negative Impacts of Renewable Energy Sources. International Journal of Electrical and Computer Engineering Systems.
- Zeng, Z. , Ziegler, A. D., Searchinger, T., Yang, L., Chen, A., Ju, K.,... & Wood, E. F. (2019). A reversal in global terrestrial stilling and its implications for wind energy production. F. ( 9(12), 979–985.
- Li, H. , Zou, X., Zhang, C., Kang, L., Cheng, H., Liu, B.,... & Wu, X. (2021). Effects of gravel cover on the near-surface airflow field and soil wind erosion. Soil and Tillage Research.
- National Geographic (2023). Wind is the movement of air caused by the uneven heating of the Earth by the sun. Education encyclopedic entry: Wind, accessed on 5/5/2024, from: https://education.nationalgeographic.
- Adekunle, J. D, Oyeniran, M. I, Ayanlowo, E. J, and Dada, A. M. (2024), Machine Learning Application in Aquaculture: Predicting Fish Aggressive Behaviour and Growth in Diverse Aquatic Environment. Jmlr.
- Dohmen LME, Spigt M, Melbye H. (2020). The effect of atmospheric pressure on oxygen saturation and dyspnea: the Tromsø study. Int J Biometeorol. 64(7):1103-1110. [CrossRef]
- Jiang, W. , Huang, Y., & Sha, A. (2018). A review of eco-friendly functional road materials. Construction and Building Materials, 1092. [Google Scholar] [CrossRef]
- WHO Housing and Health Guidelines. Geneva: World Health Organization; 2018. 4, Low indoor temperatures and insulation. Available from: https://www.ncbi.nlm.nih. 5352.
- Malhi, G. S. , Manpreet, K., and Prashant, K. 2021. “Impact of Climate Change on Agriculture and Its Mitigation Strategies: A Review, Sustainability; 13(3): 1318. [CrossRef]
- Cui Y, Ouyang S, Zhao Y, Tie L, Shao C, Duan H.(2022). Plant responses to high temperature and drought: A bibliometrics analysis. Front Plant Sci, 5266. [CrossRef]
- Khan, Wisal, Teerath Kumar, Cheng Zhang, Kislay Raj, Arunabha M. Roy, and Bin Luo. (2023). “SQL and NoSQL Database Software Architecture Performance Analysis and Assessments—A Systematic Literature Review”, Big Data and Cognitive Computing; 7(2): 97. [CrossRef]
- Chen, Liuyi, Bocheng Han, Xuesong Wang, Jiazhen Zhao, Wenke Yang, and Zhengyi Yang.(2023). “Machine Learning Methods in Weather and Climate Applications: A Survey”. Applied Sciences; 1201. [CrossRef]
- ASAP (n.d.). What is a data warehouse?. Accessed on: 6/19/2024, from: https://www.sap.com/africa/products/technology-platform/datasphere/what-is-a-data-warehouse.
Figure 1.
Ms Excel segment of the data normalization.
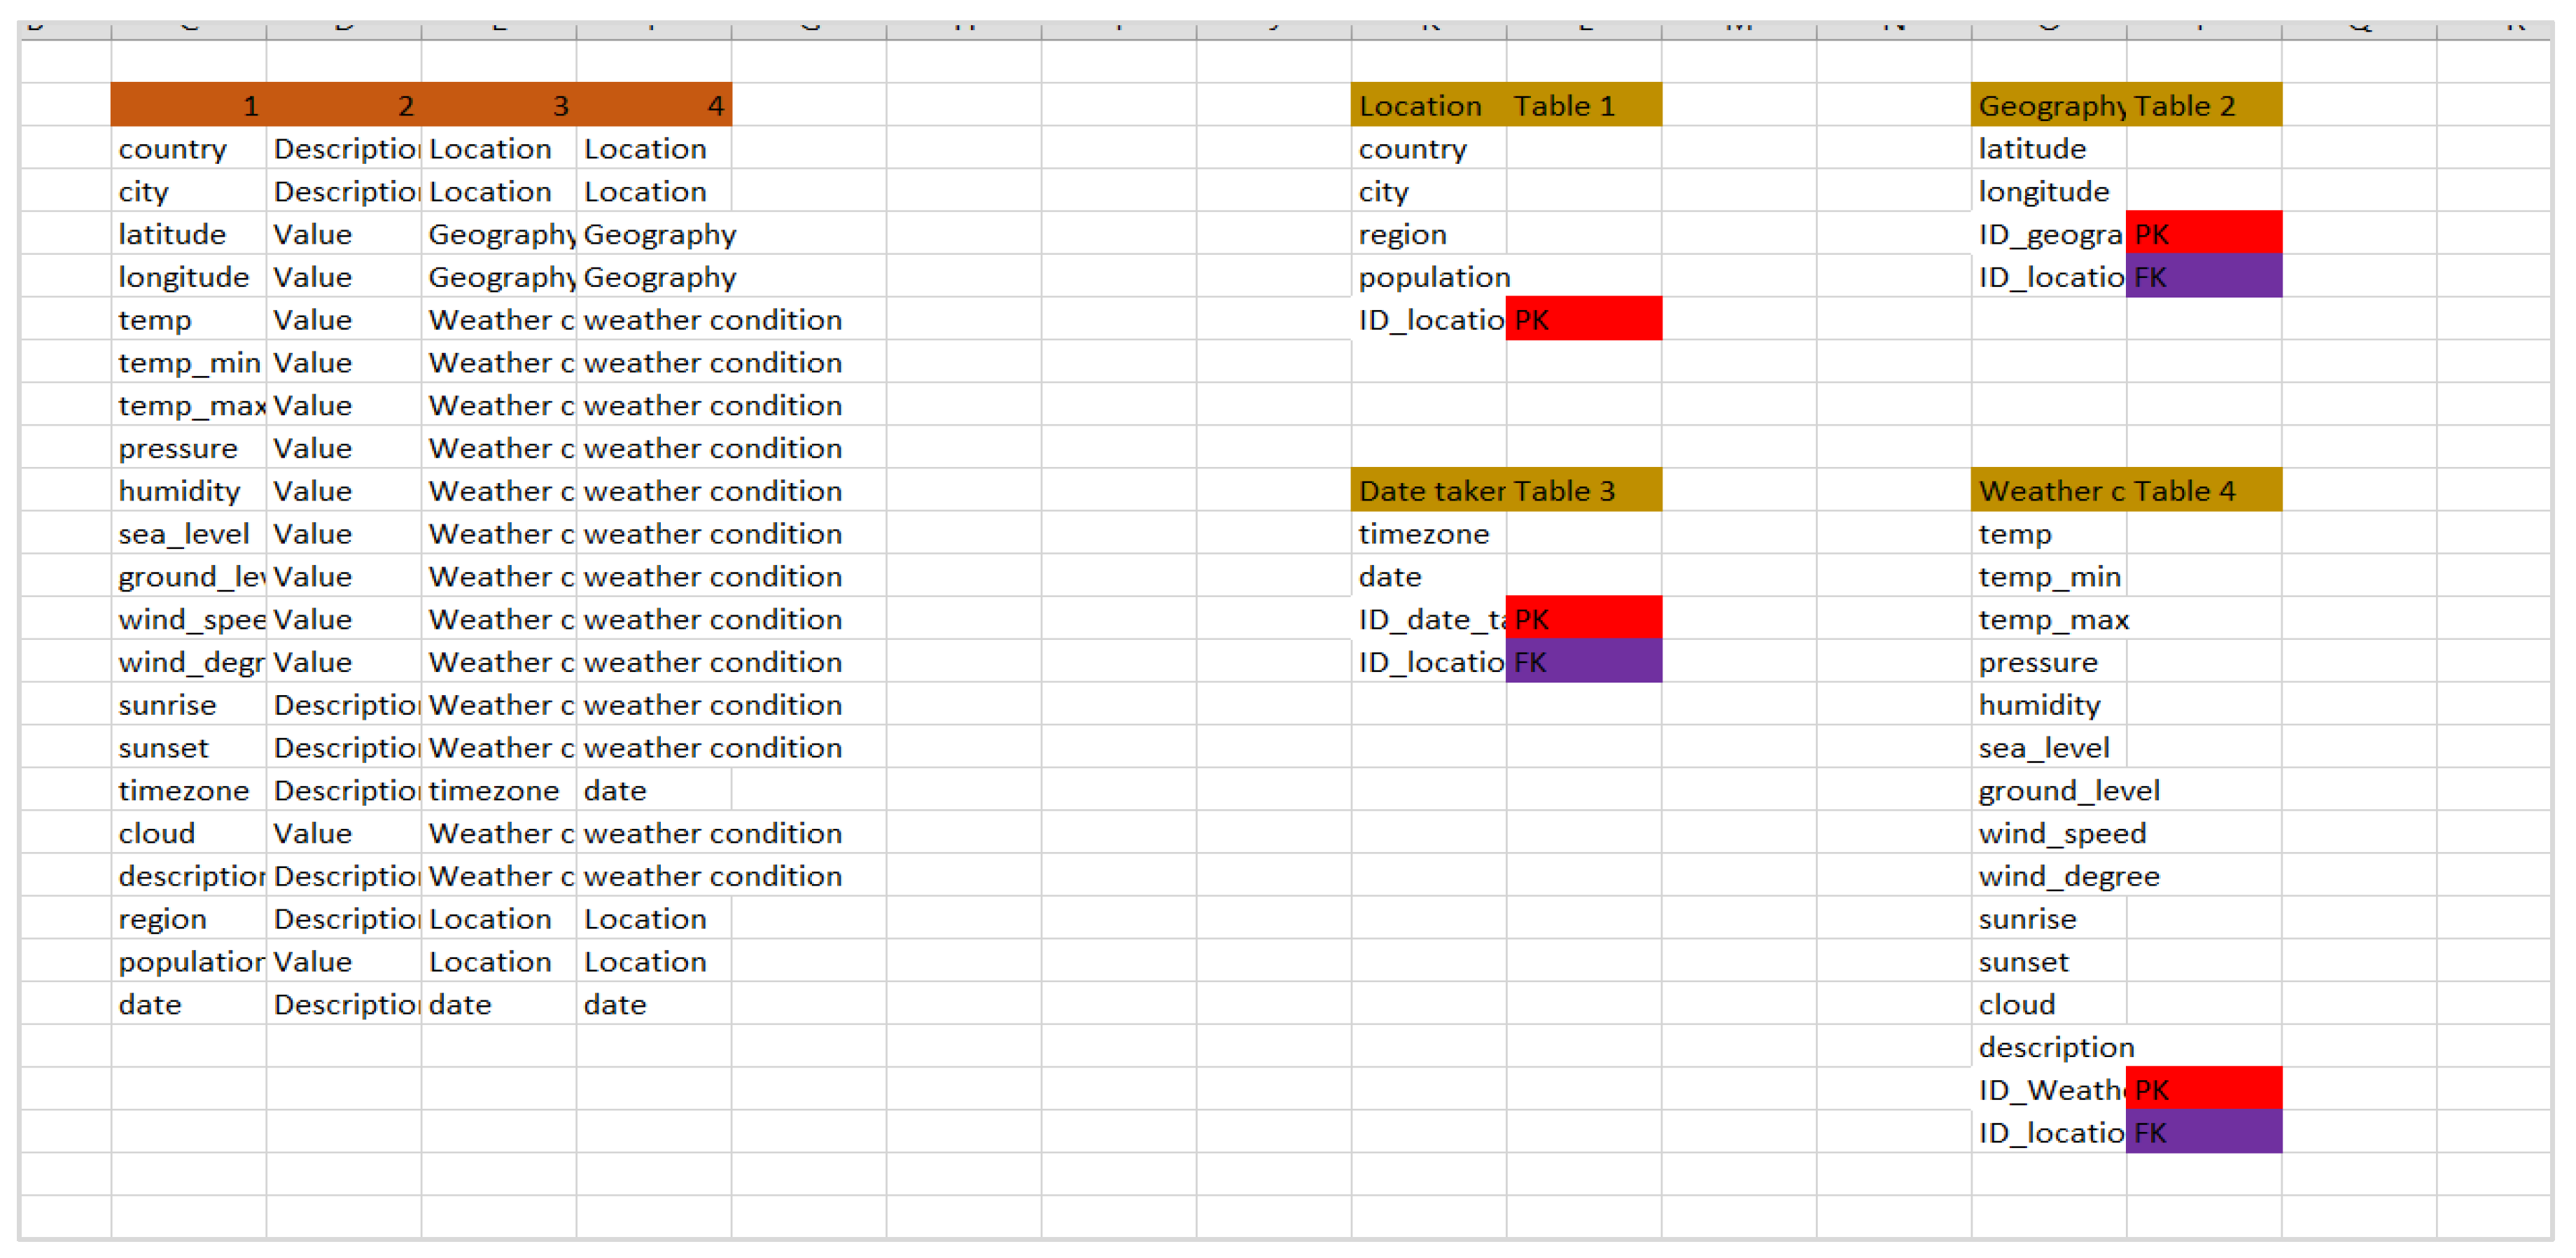
Figure 2.
(a) Code snippet used to create the database; (b) Display of the tables and the primary keys; (c) Display of a pulling query of all the tables on the database;(d) Entity-relationship diagrams.
Figure 2.
(a) Code snippet used to create the database; (b) Display of the tables and the primary keys; (c) Display of a pulling query of all the tables on the database;(d) Entity-relationship diagrams.
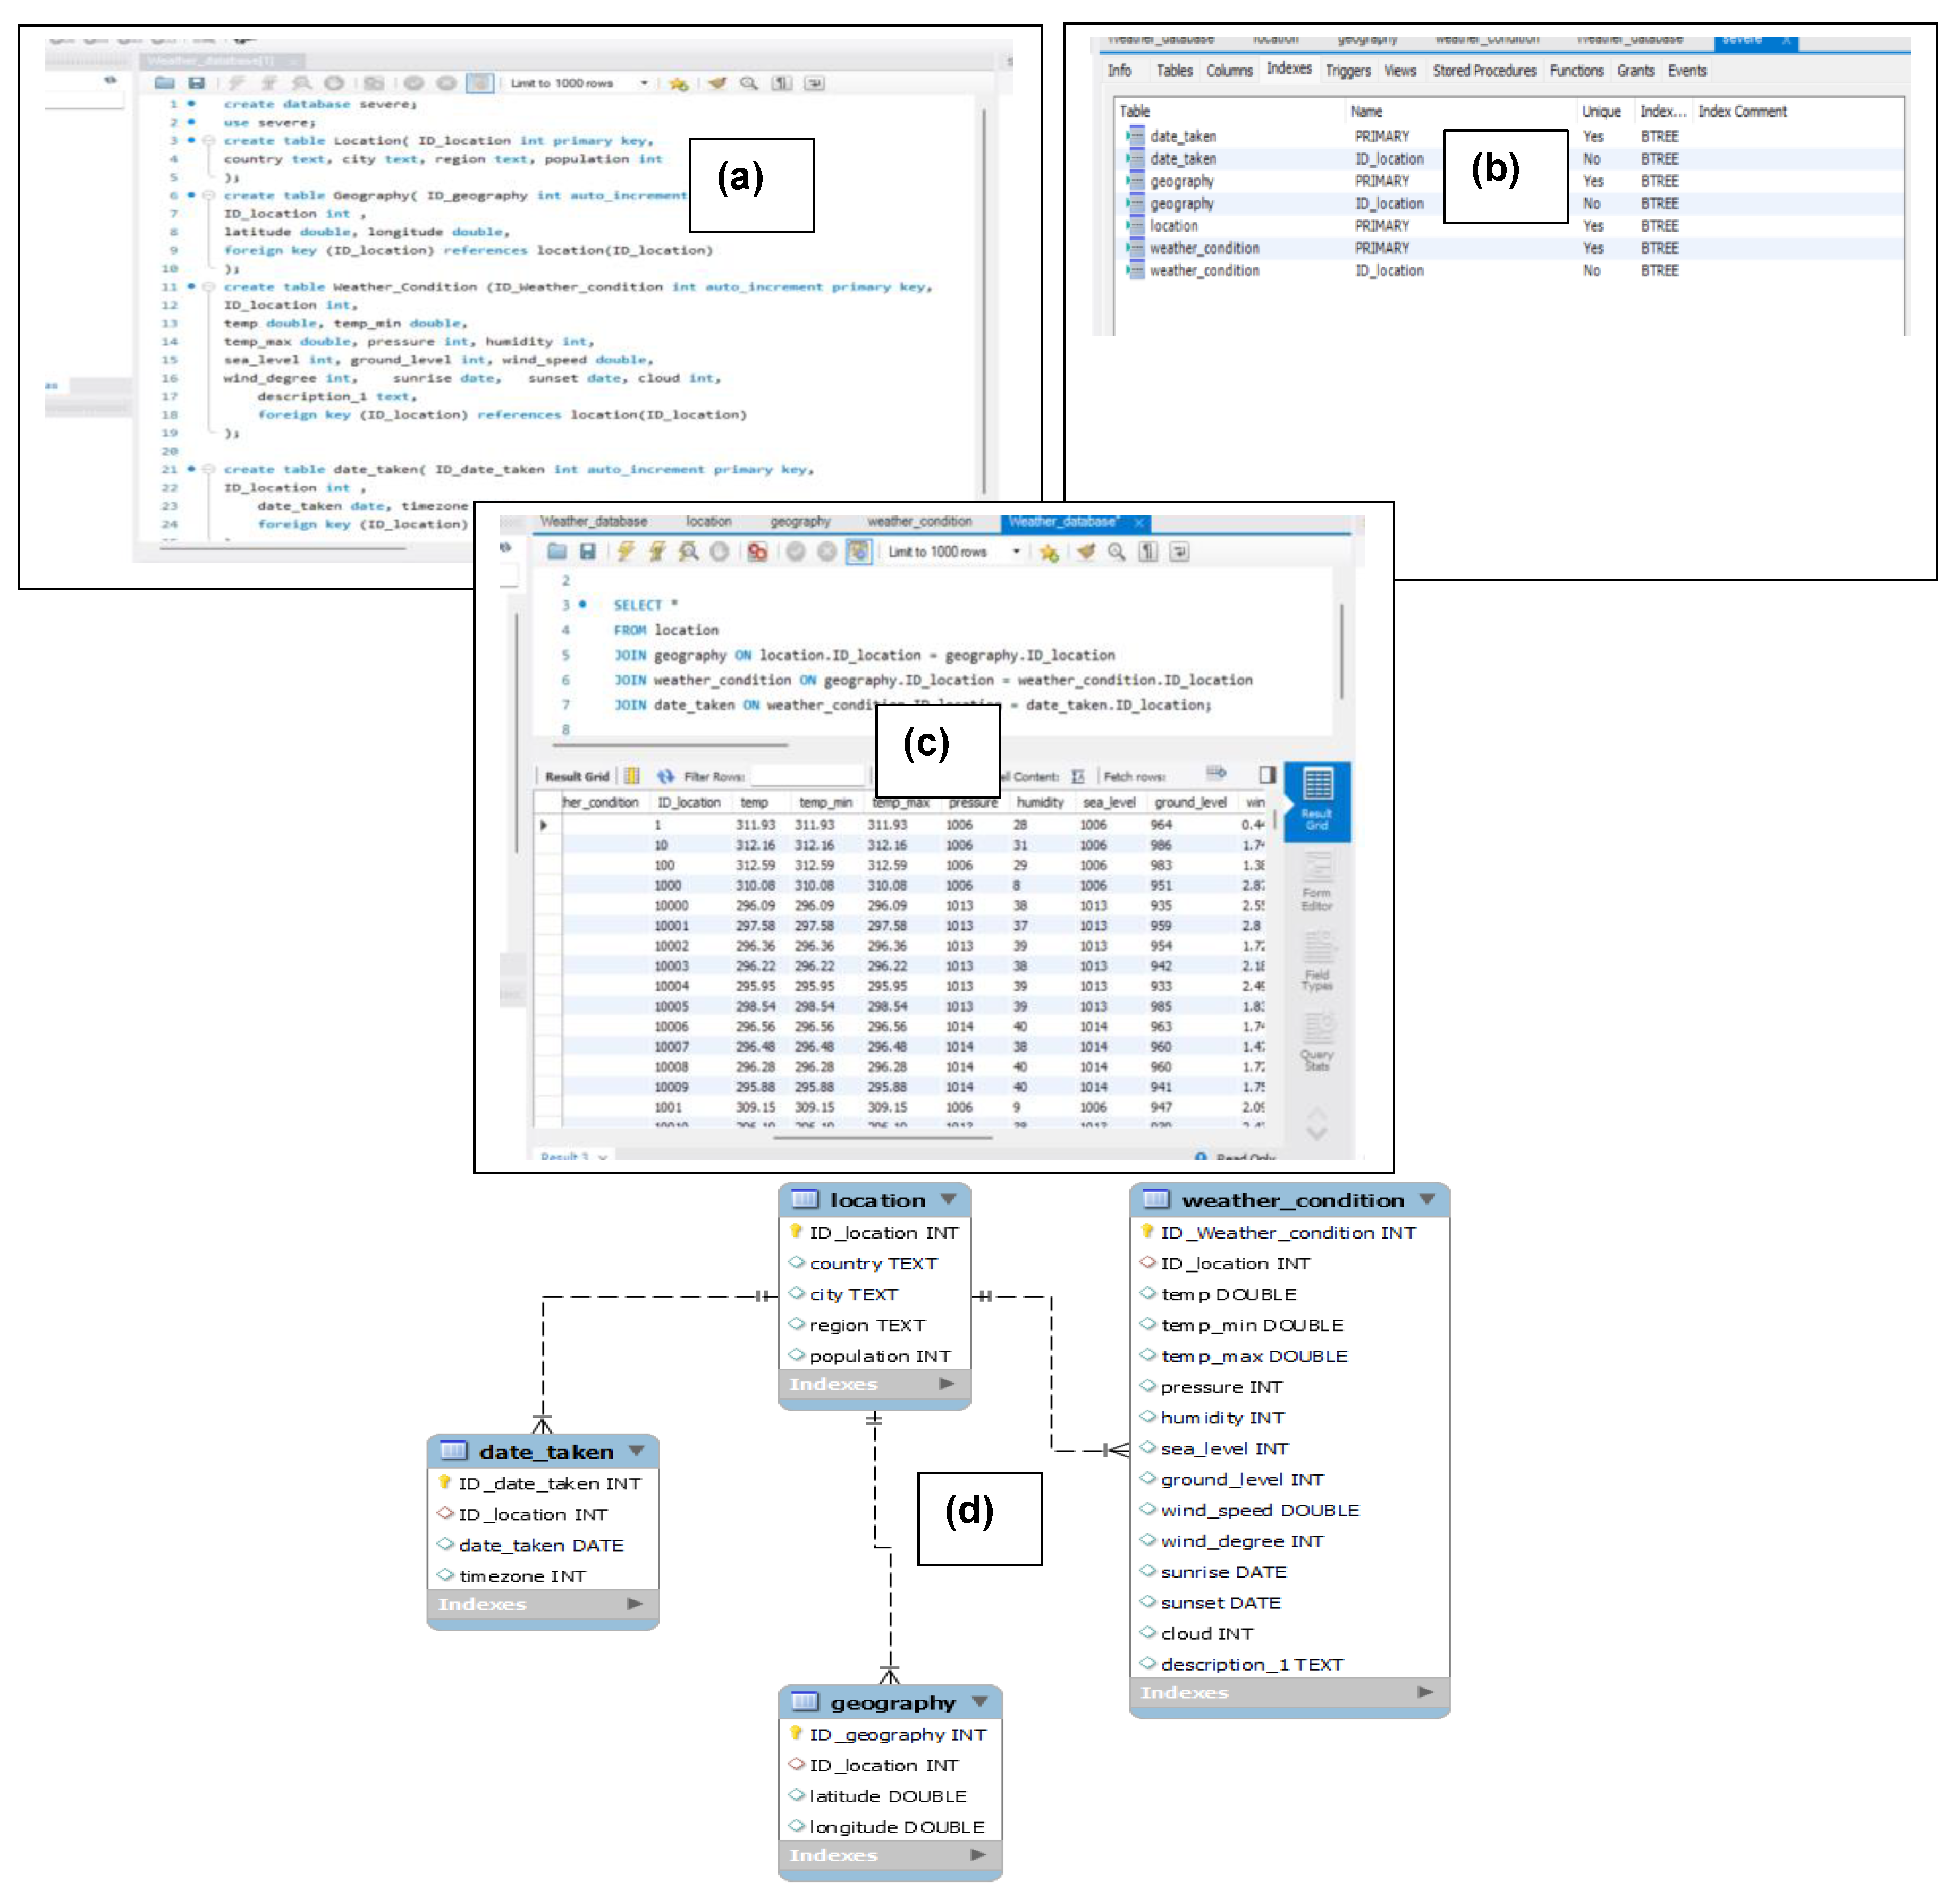
Figure 3.
Supervised machine learning structure.
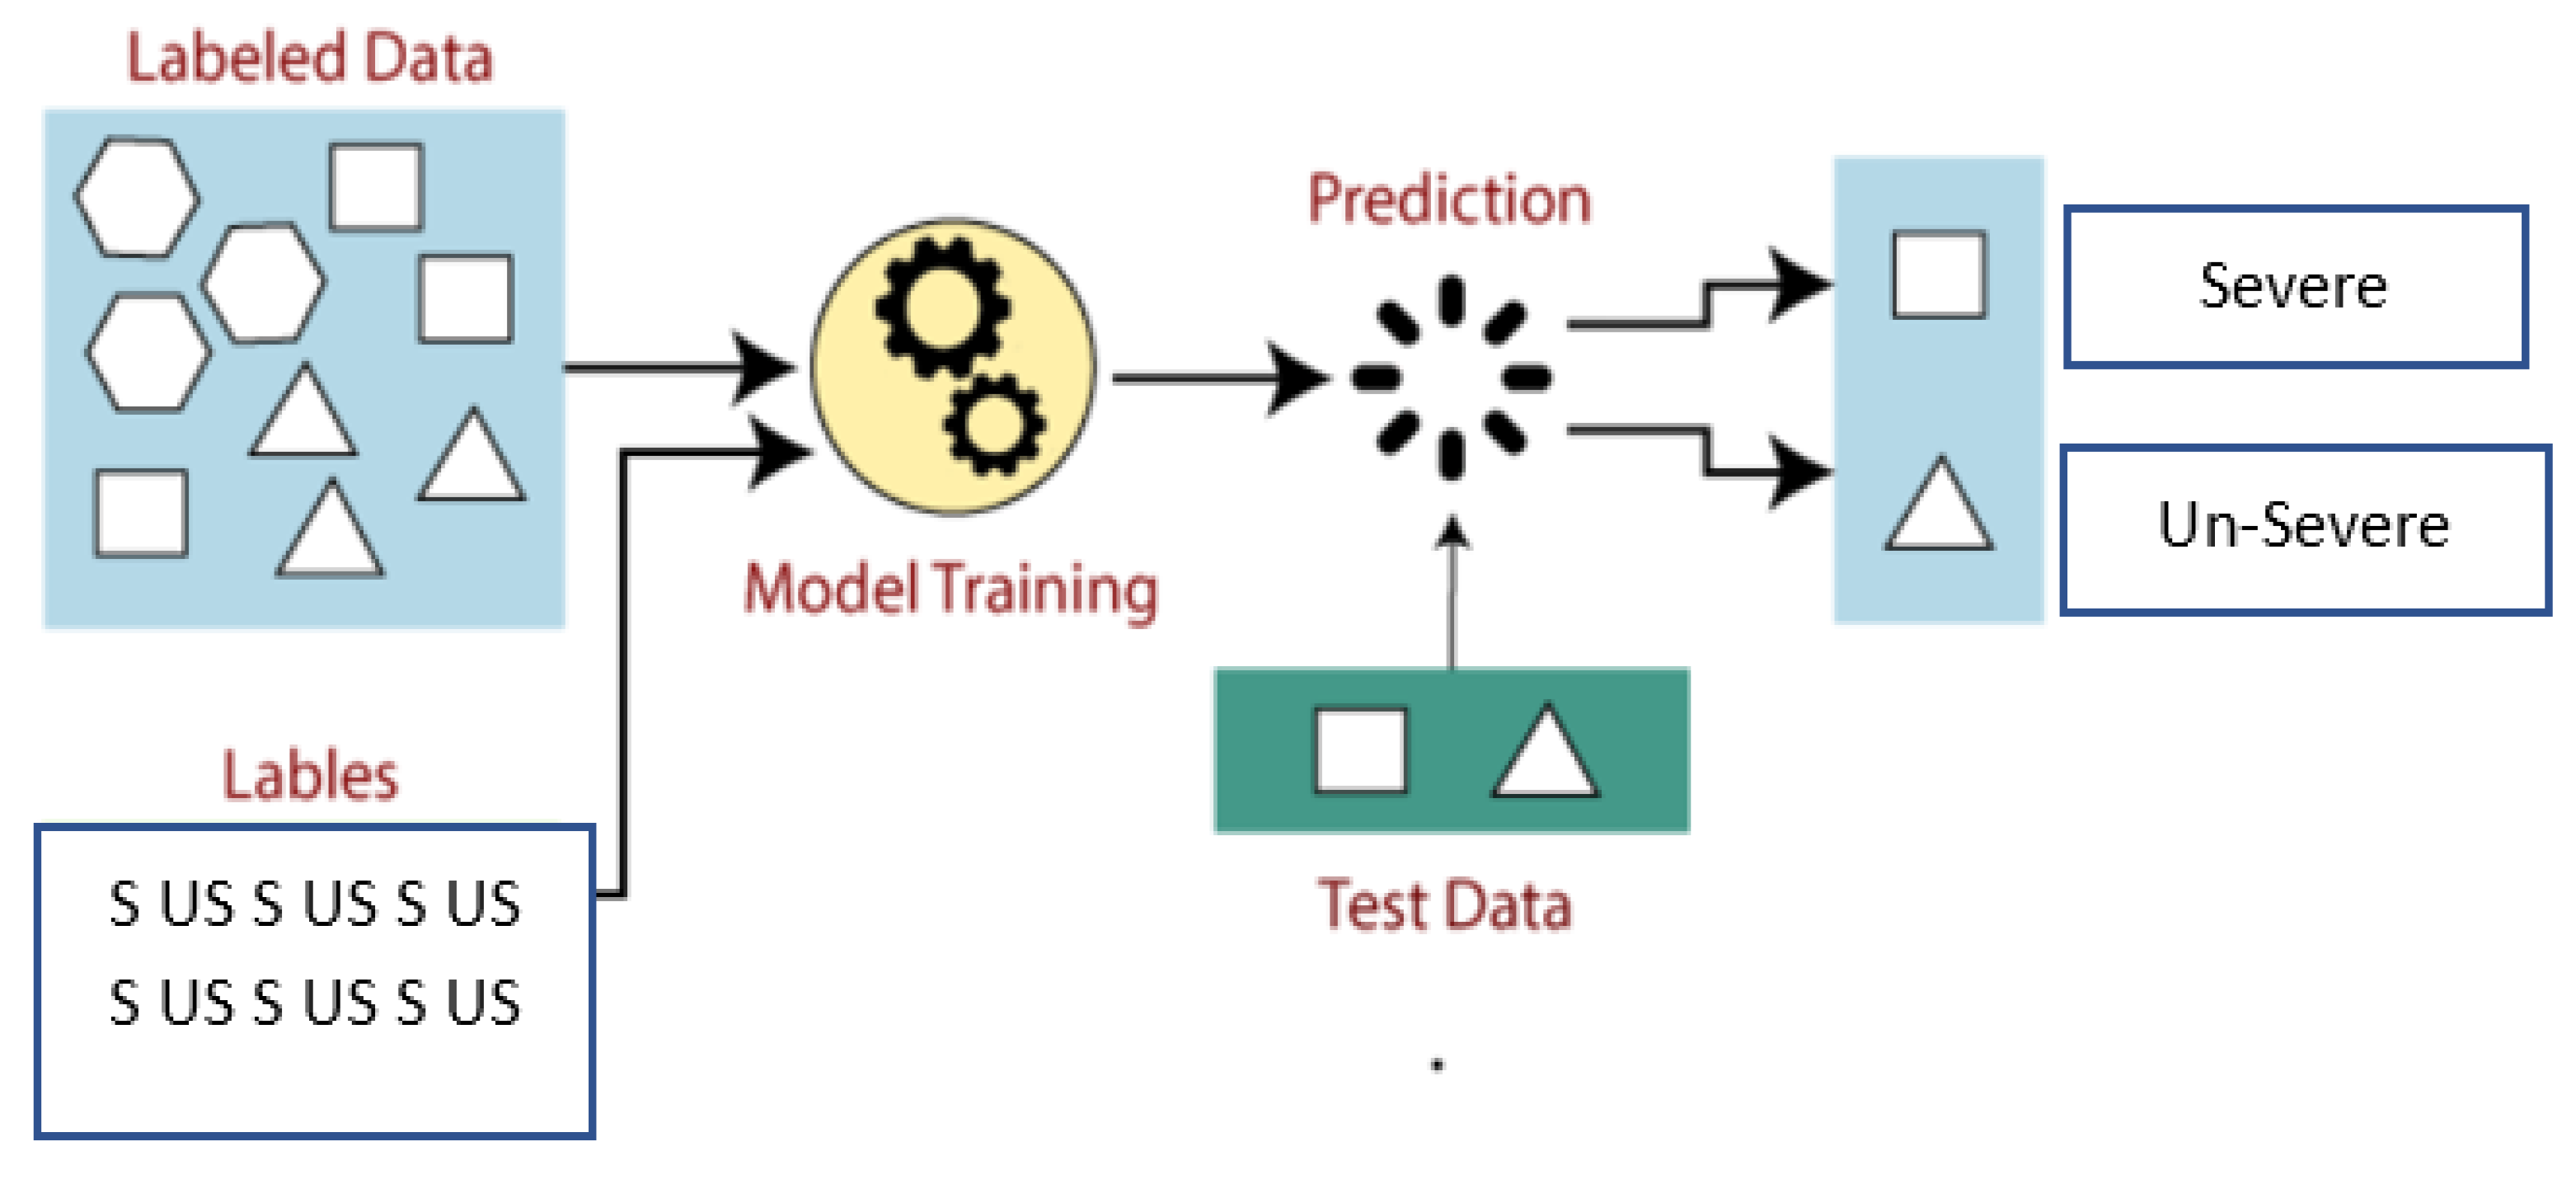
Figure 4.
Decision boundary of a logistic regression.
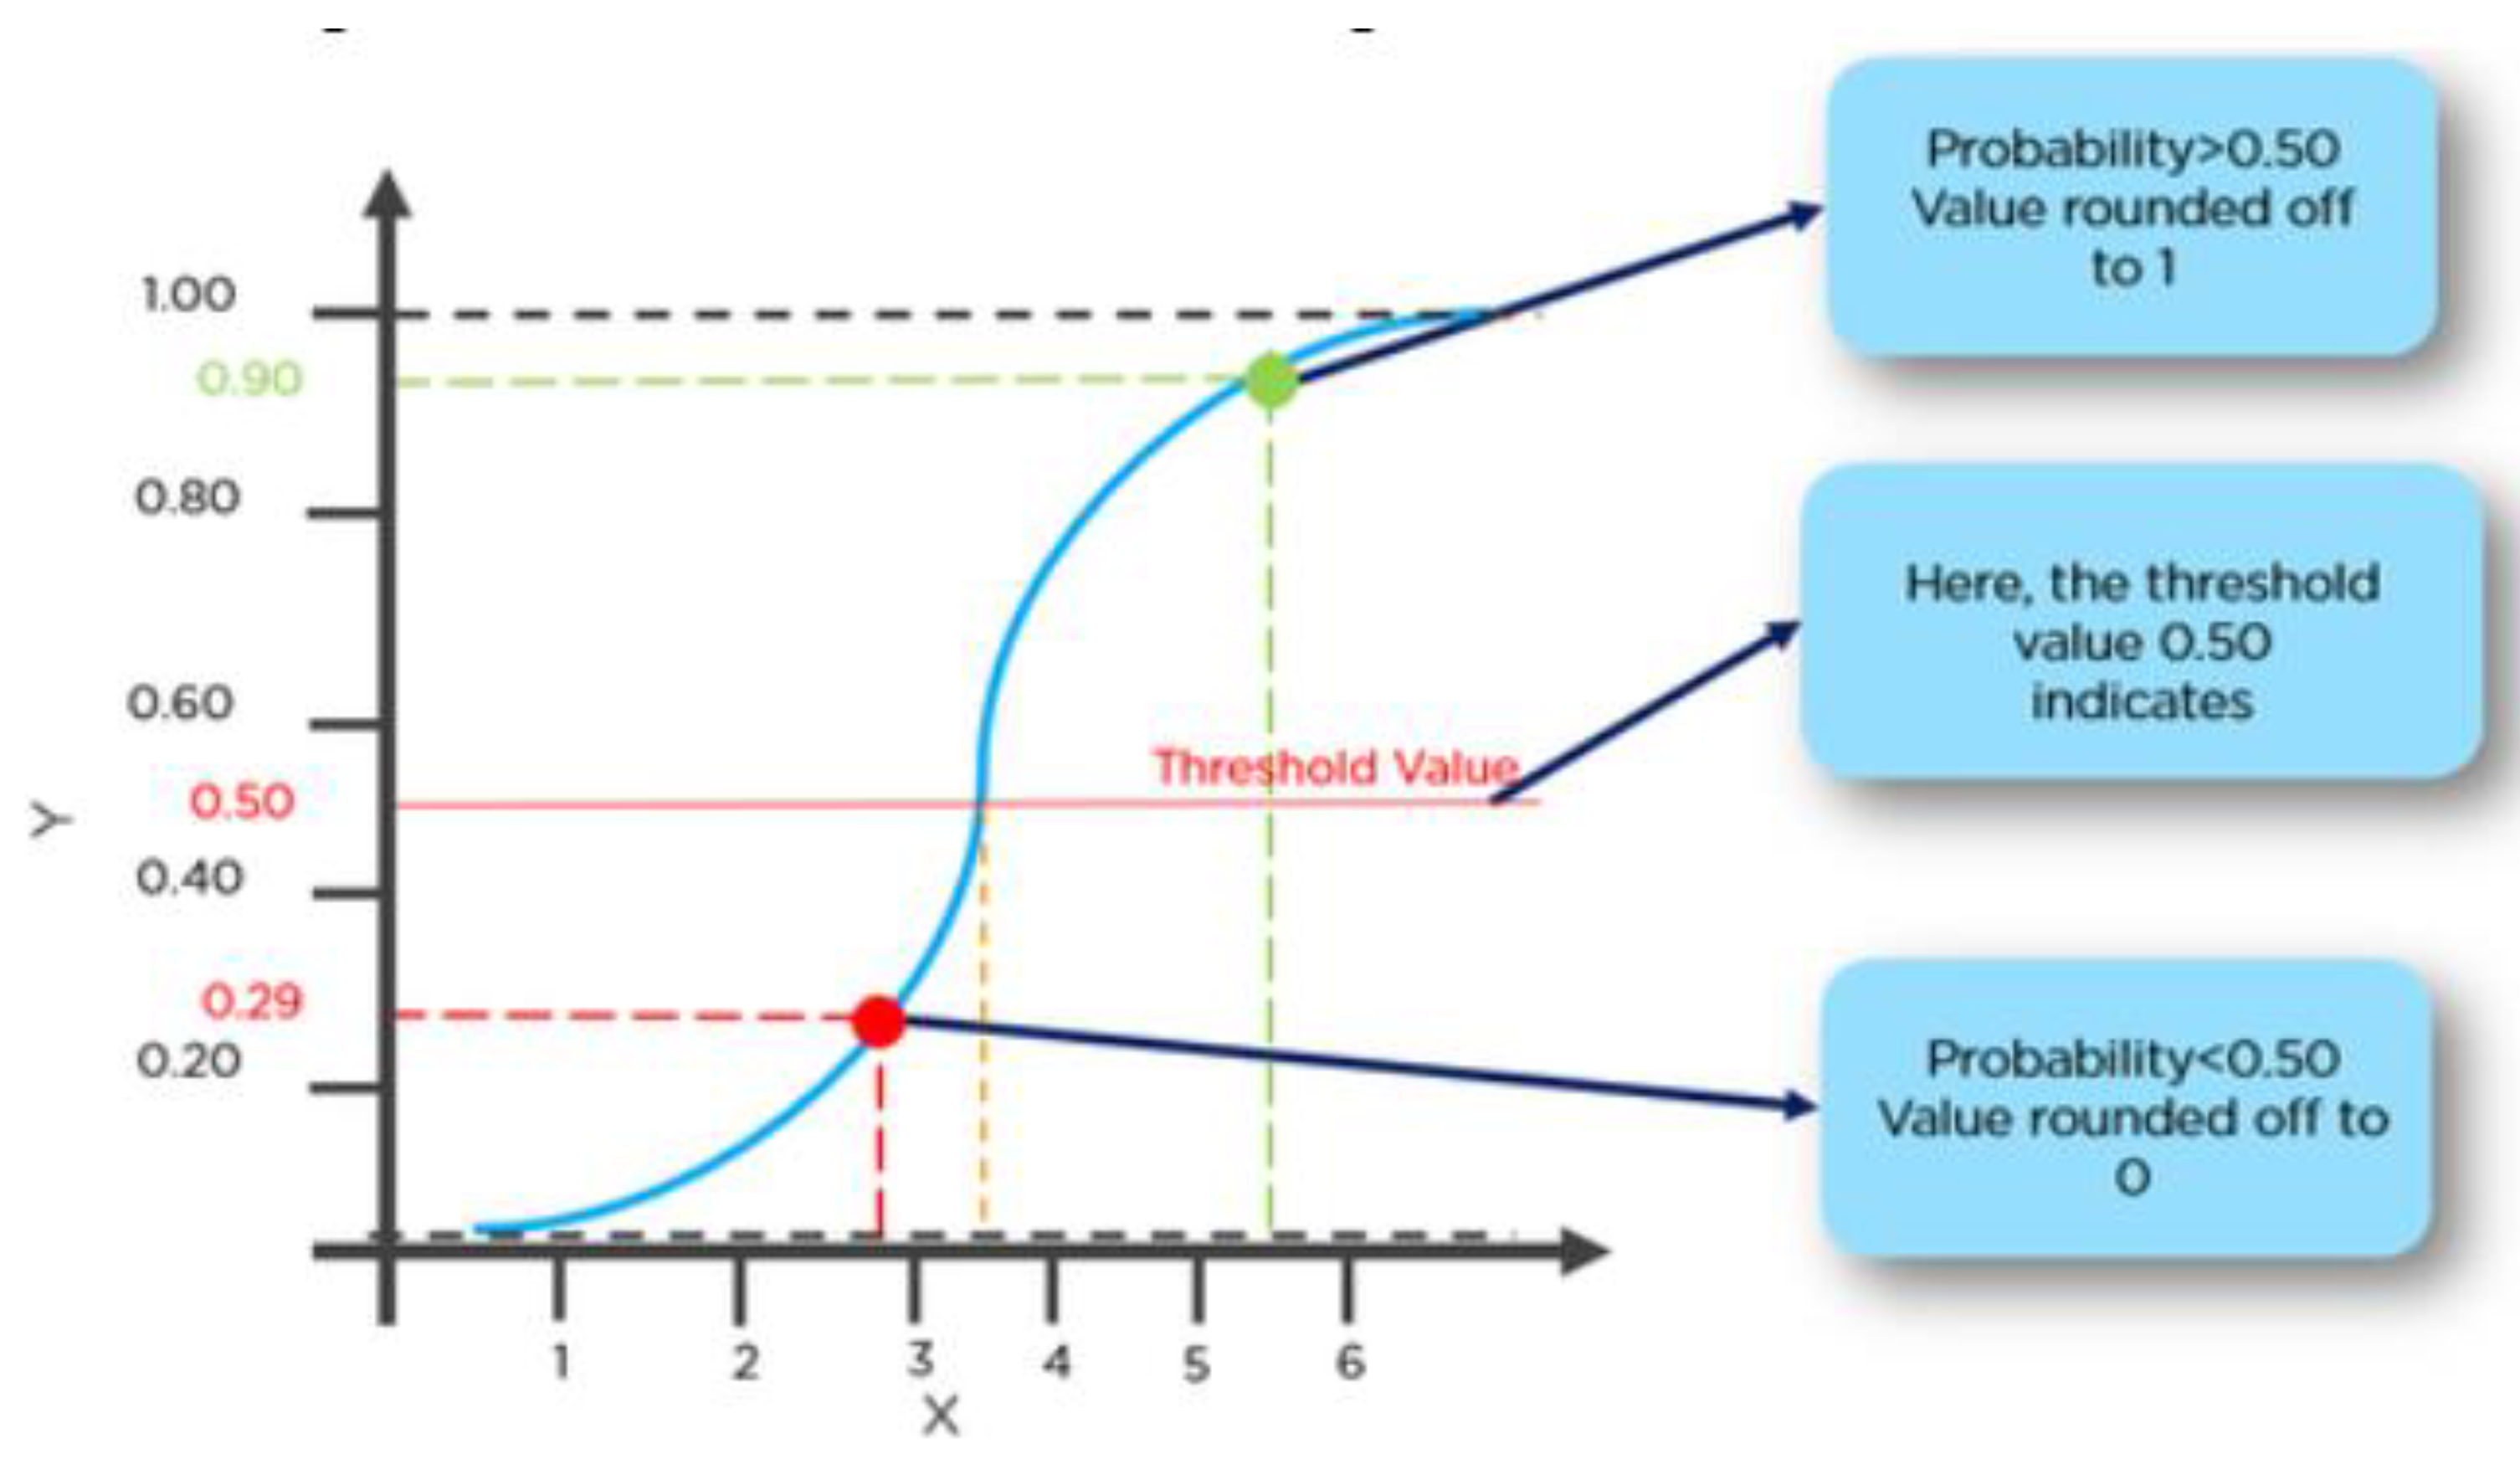
Figure 5.
(a) Geographical representation of Nigeria state with severe weather condition [josephdamilare01.github.io/Severity_unbalanced/]; (b) Geographical representation of Nigeria state identified [josephdamilare01.github.io/state_map/].
Figure 5.
(a) Geographical representation of Nigeria state with severe weather condition [josephdamilare01.github.io/Severity_unbalanced/]; (b) Geographical representation of Nigeria state identified [josephdamilare01.github.io/state_map/].
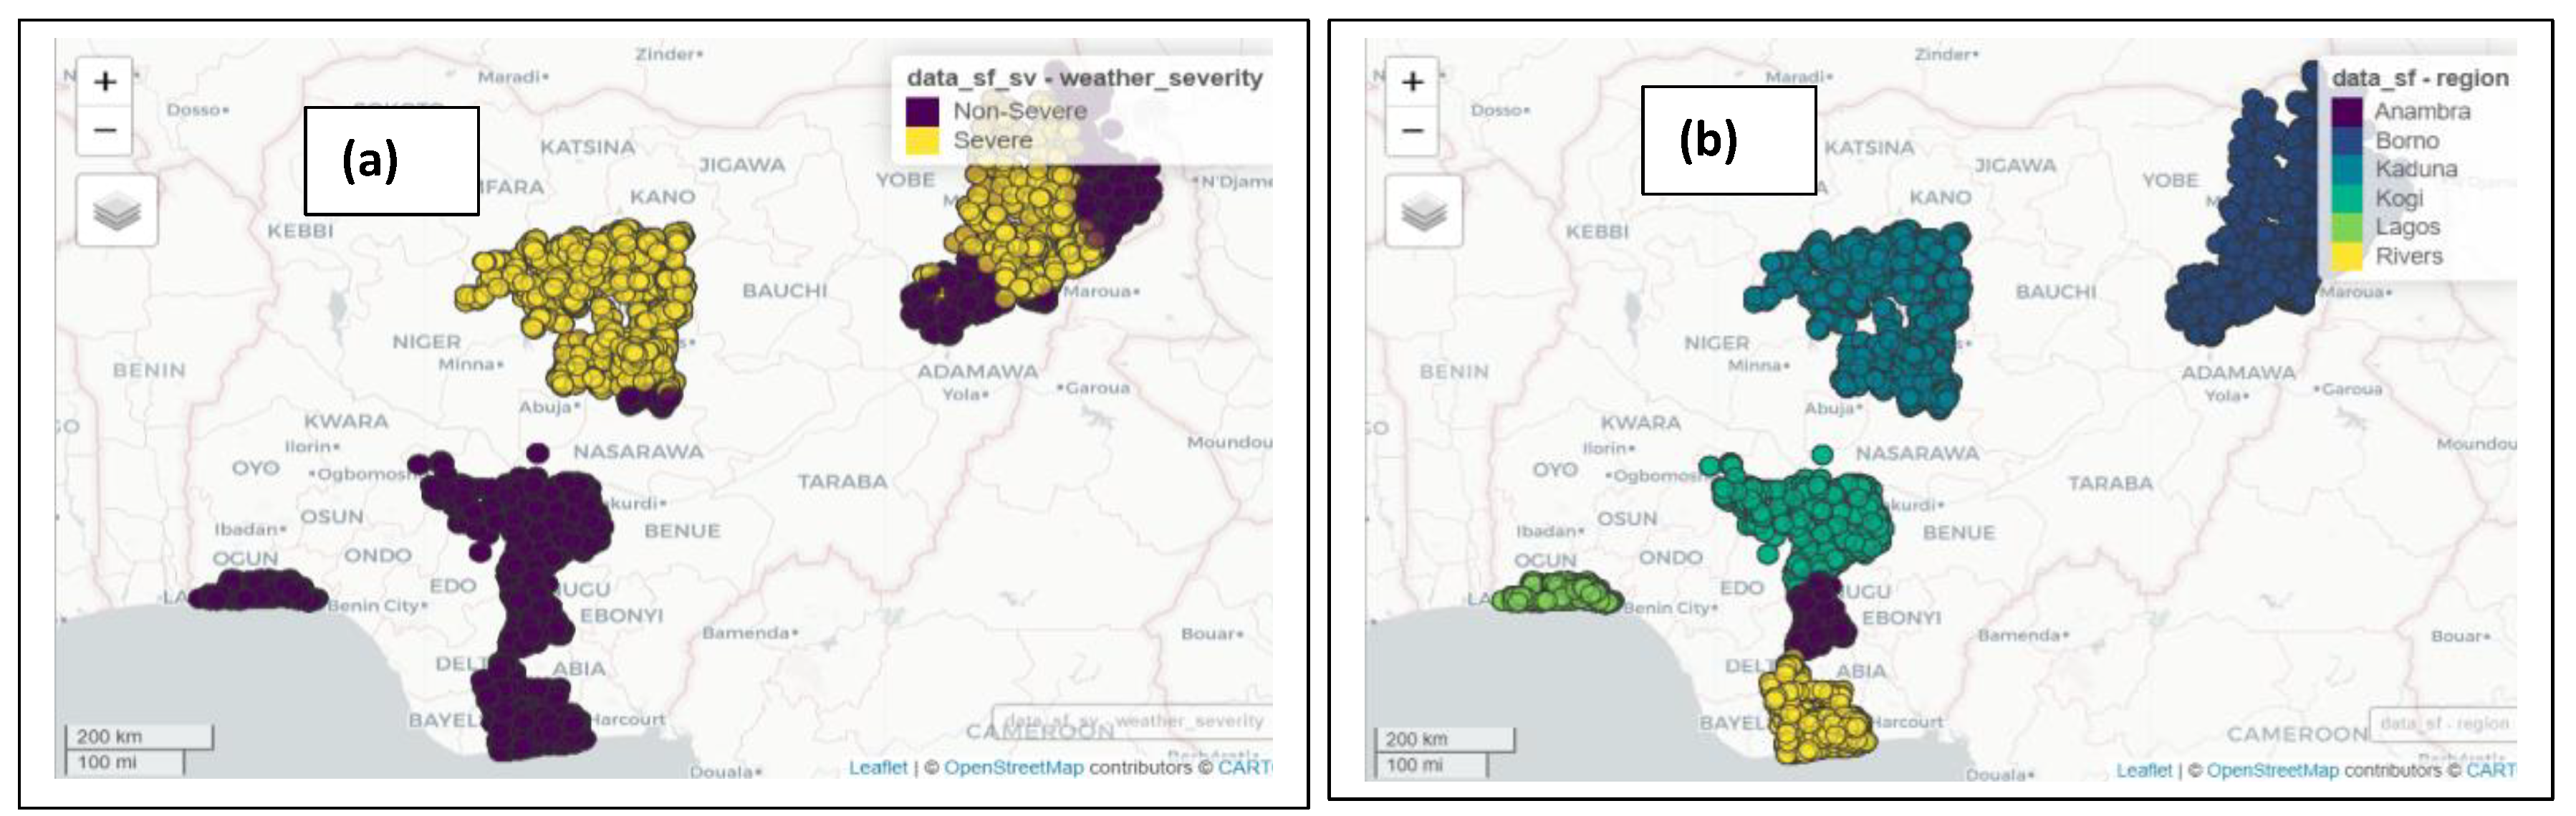
Figure 6.
(a) Unbalanced state of the dataset; (b) Balanced state of the dataset.
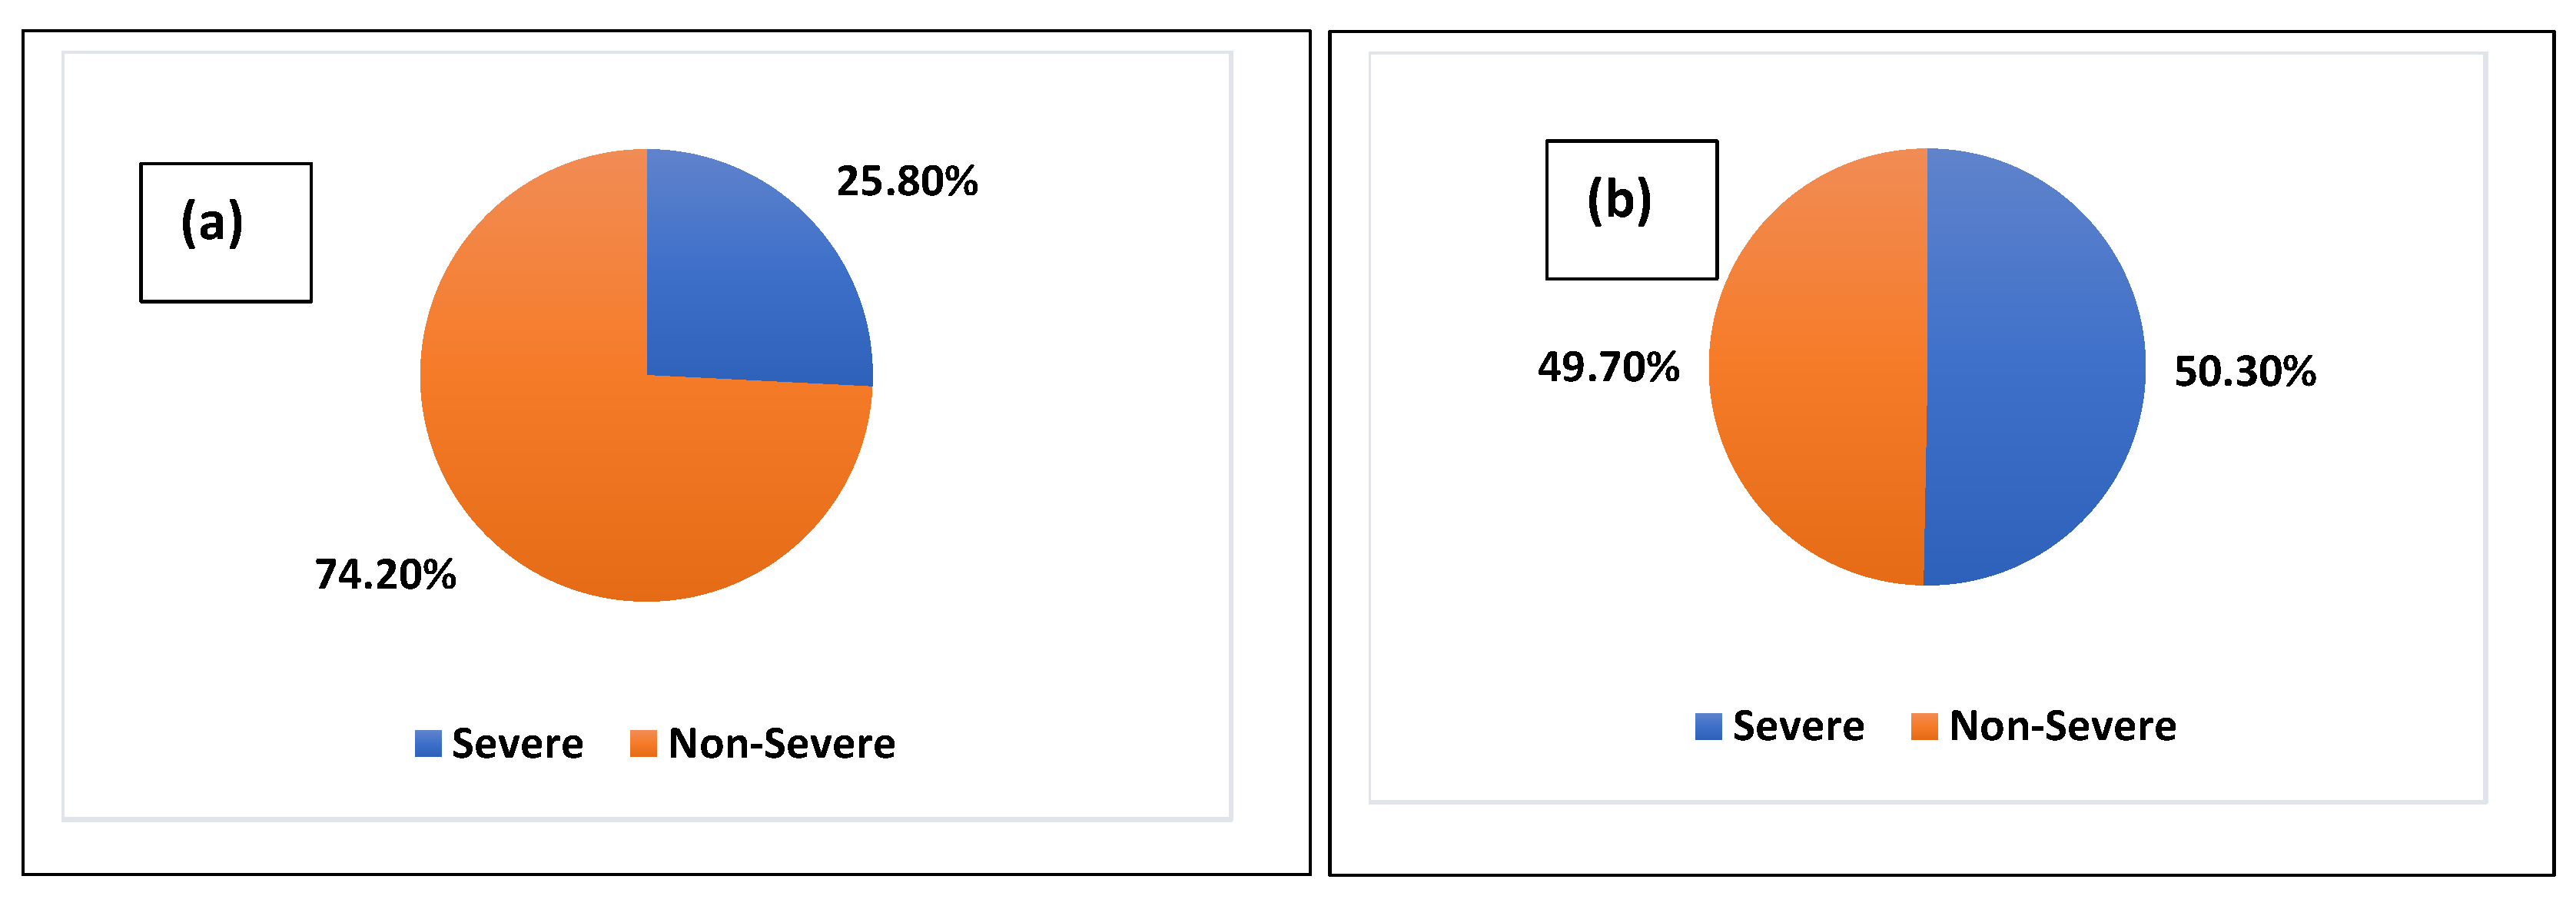
Figure 7.
Weather conditions by states(a)humidity[josephdamilare01.github.io/humidity/];(b) cloud[josephdamilare01.github.io/cloud/];(c)pressure[josephdamilare01.github.io/pressure/];(d)description[josephdamilare01.github.io/description/];(e)Temperature[josephdamilare01.github.io/Temperature/];(f)wind speed[josephdamilare01.github.io/wind-speed-/]; (g) wind degree[josephdamilare01.github.io/wind-degree/]; (h) ground level[josephdamilare01.github.io/ground-level/].
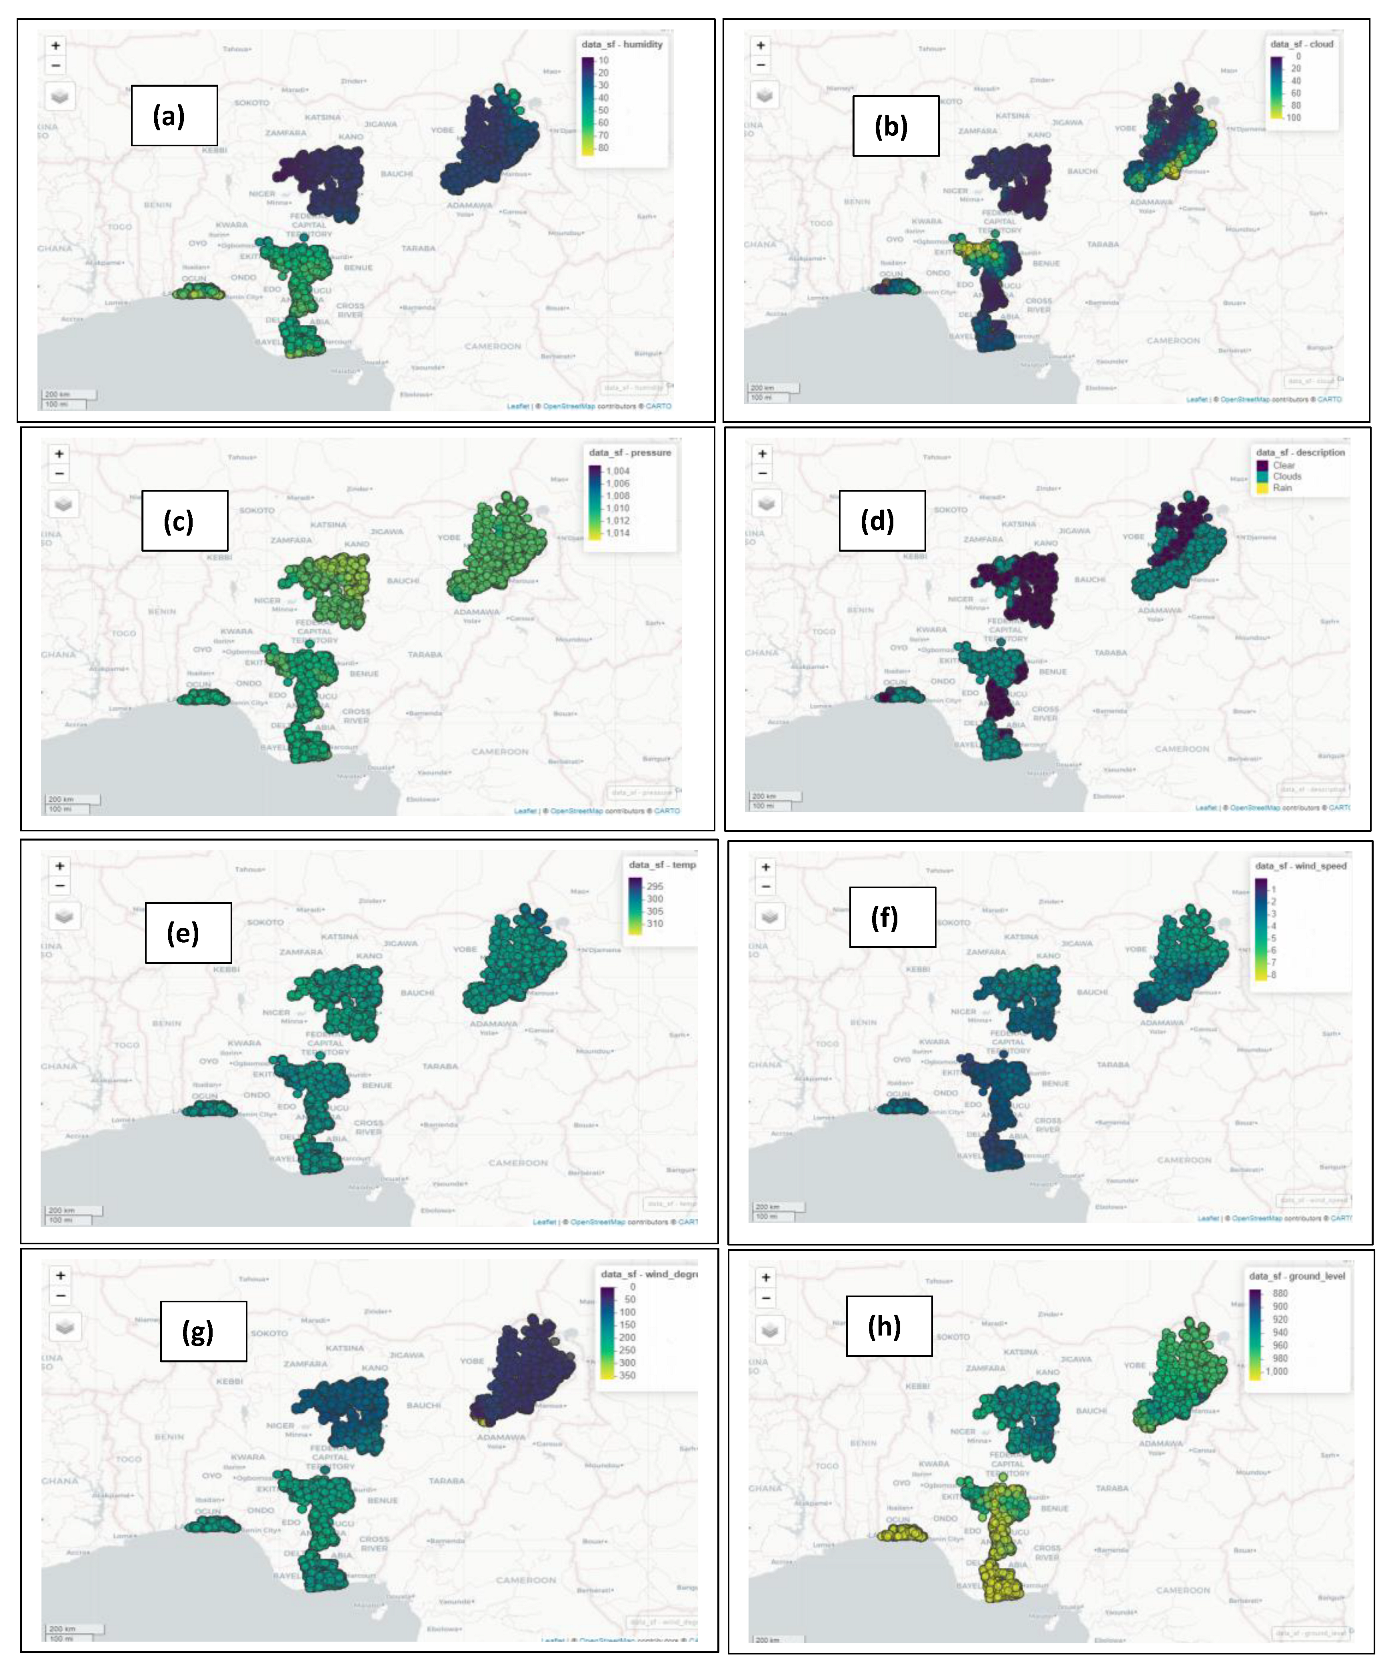
Figure 8.
Relationships between weather condition variables.
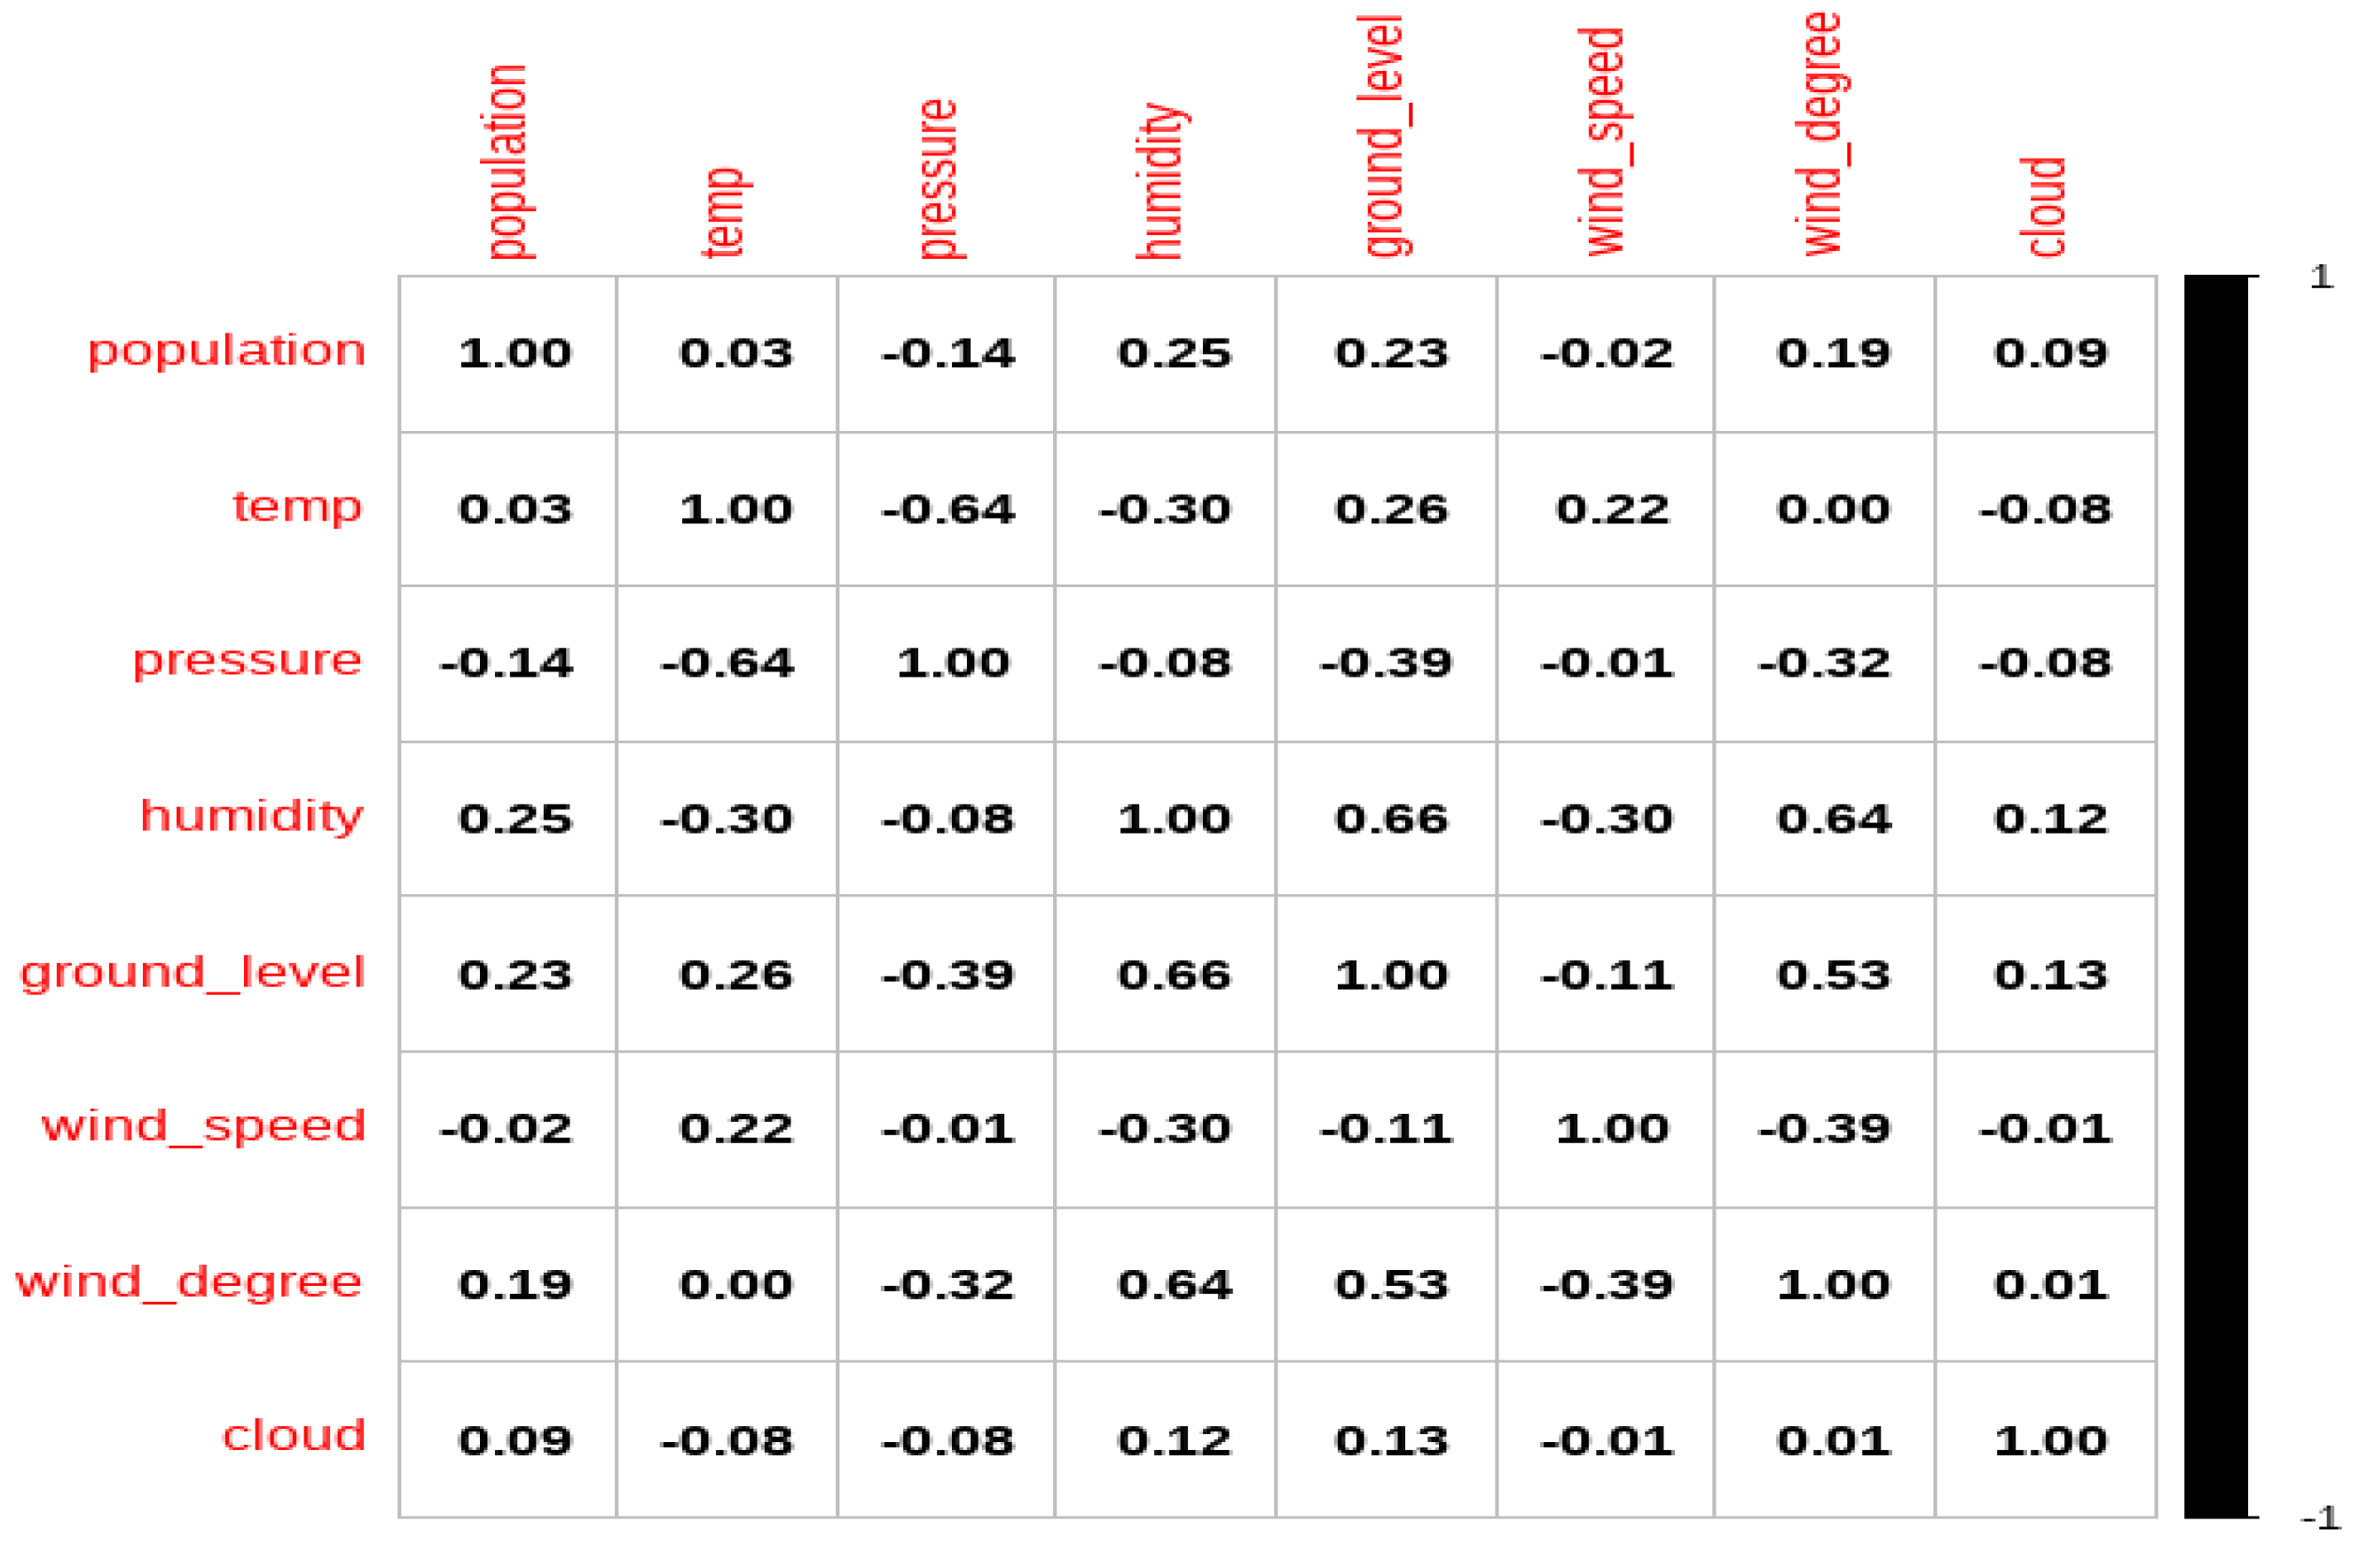
Figure 9.
Performance Comparison of Models on (a) Training dataset (b) Testing dataset (c) the complete dataset.
Figure 9.
Performance Comparison of Models on (a) Training dataset (b) Testing dataset (c) the complete dataset.
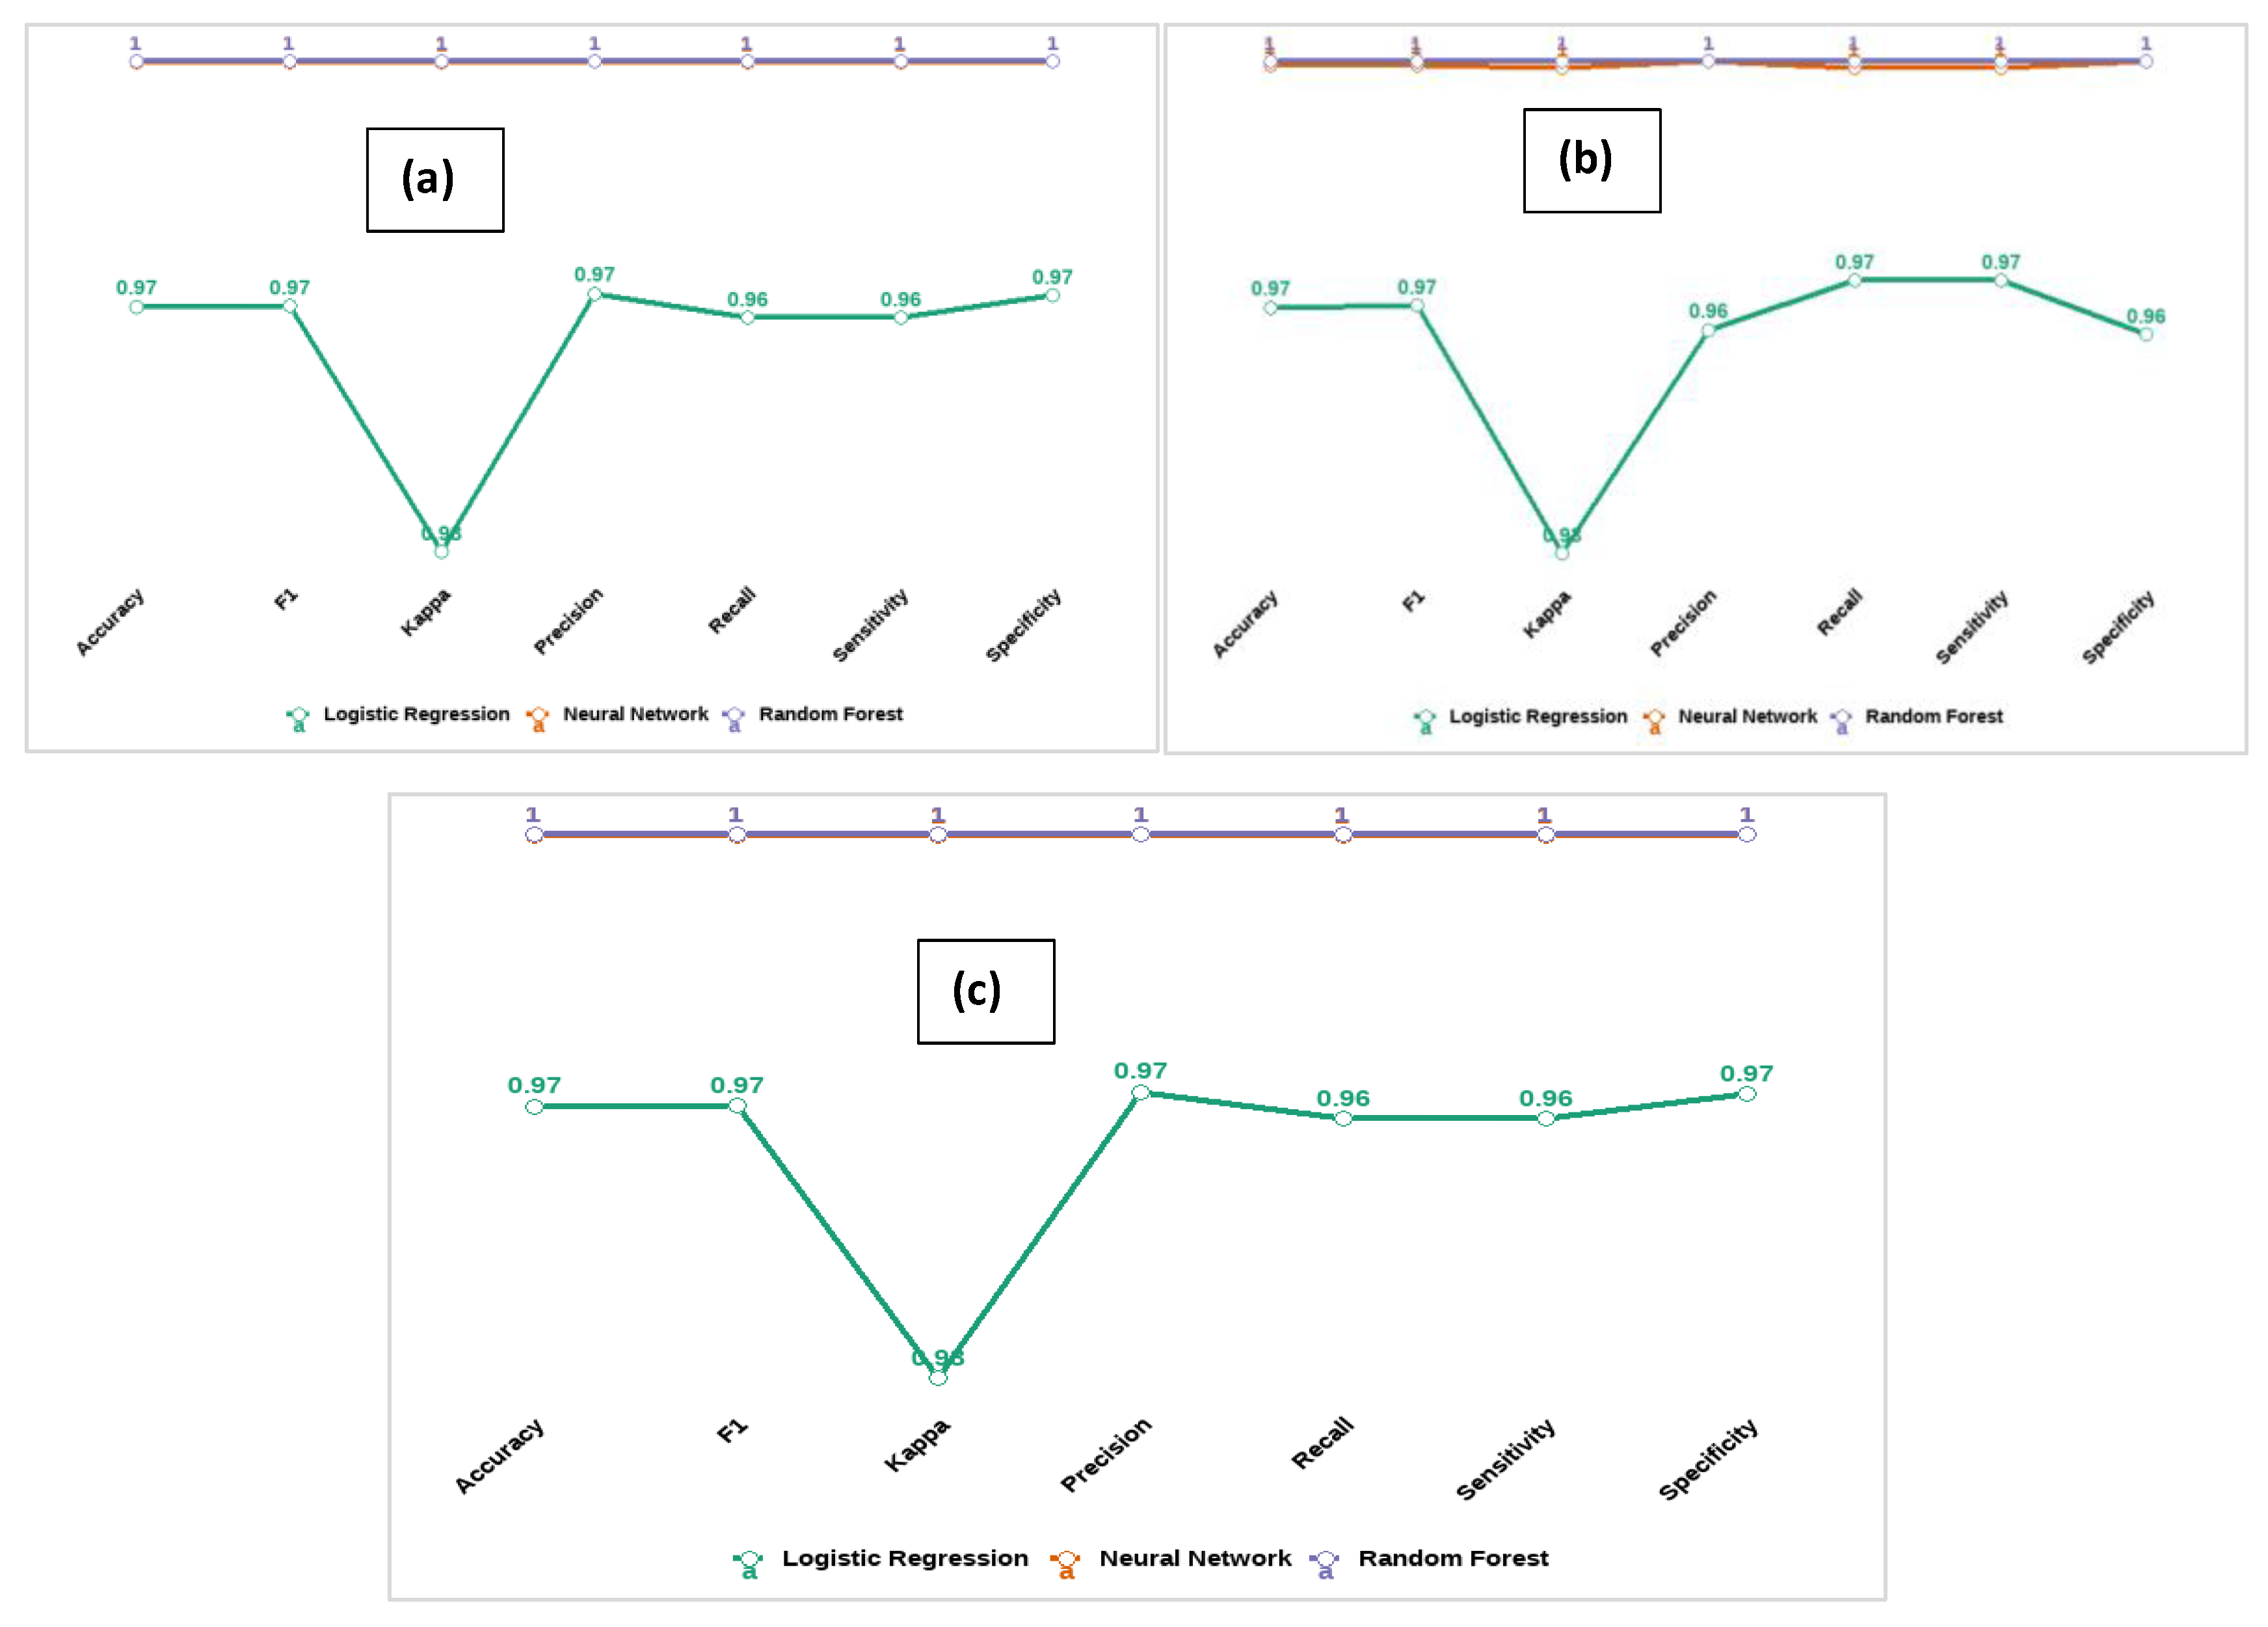
Figure 10.
Prediction by (a) logistic on (a1) All the dataset[josephdamilare01.github.io/Logist_all/] (a) Training dataset[josephdamilare01.github.io/Logist_Train/] (a3) Testing dataset[josephdamilare01.github.io/Logist_Test/]; (b) neural network on (b1) All the dataset[josephdamilare01.github.io/Neural_ALL/] (b2) Testing dataset[josephdamilare01.github.io/Neutral_Test/] (b3) Training dataset[josephdamilare01.github.io/Neutral_Train/]; (c)Random Forest on (c1) All the dataset[josephdamilare01.github.io/RandomF_ALL/] (c2) Training dataset[josephdamilare01.github.io/RandomF_Train/] (c3) Testing dataset[josephdamilare01.github.io/RandomF_Test/].
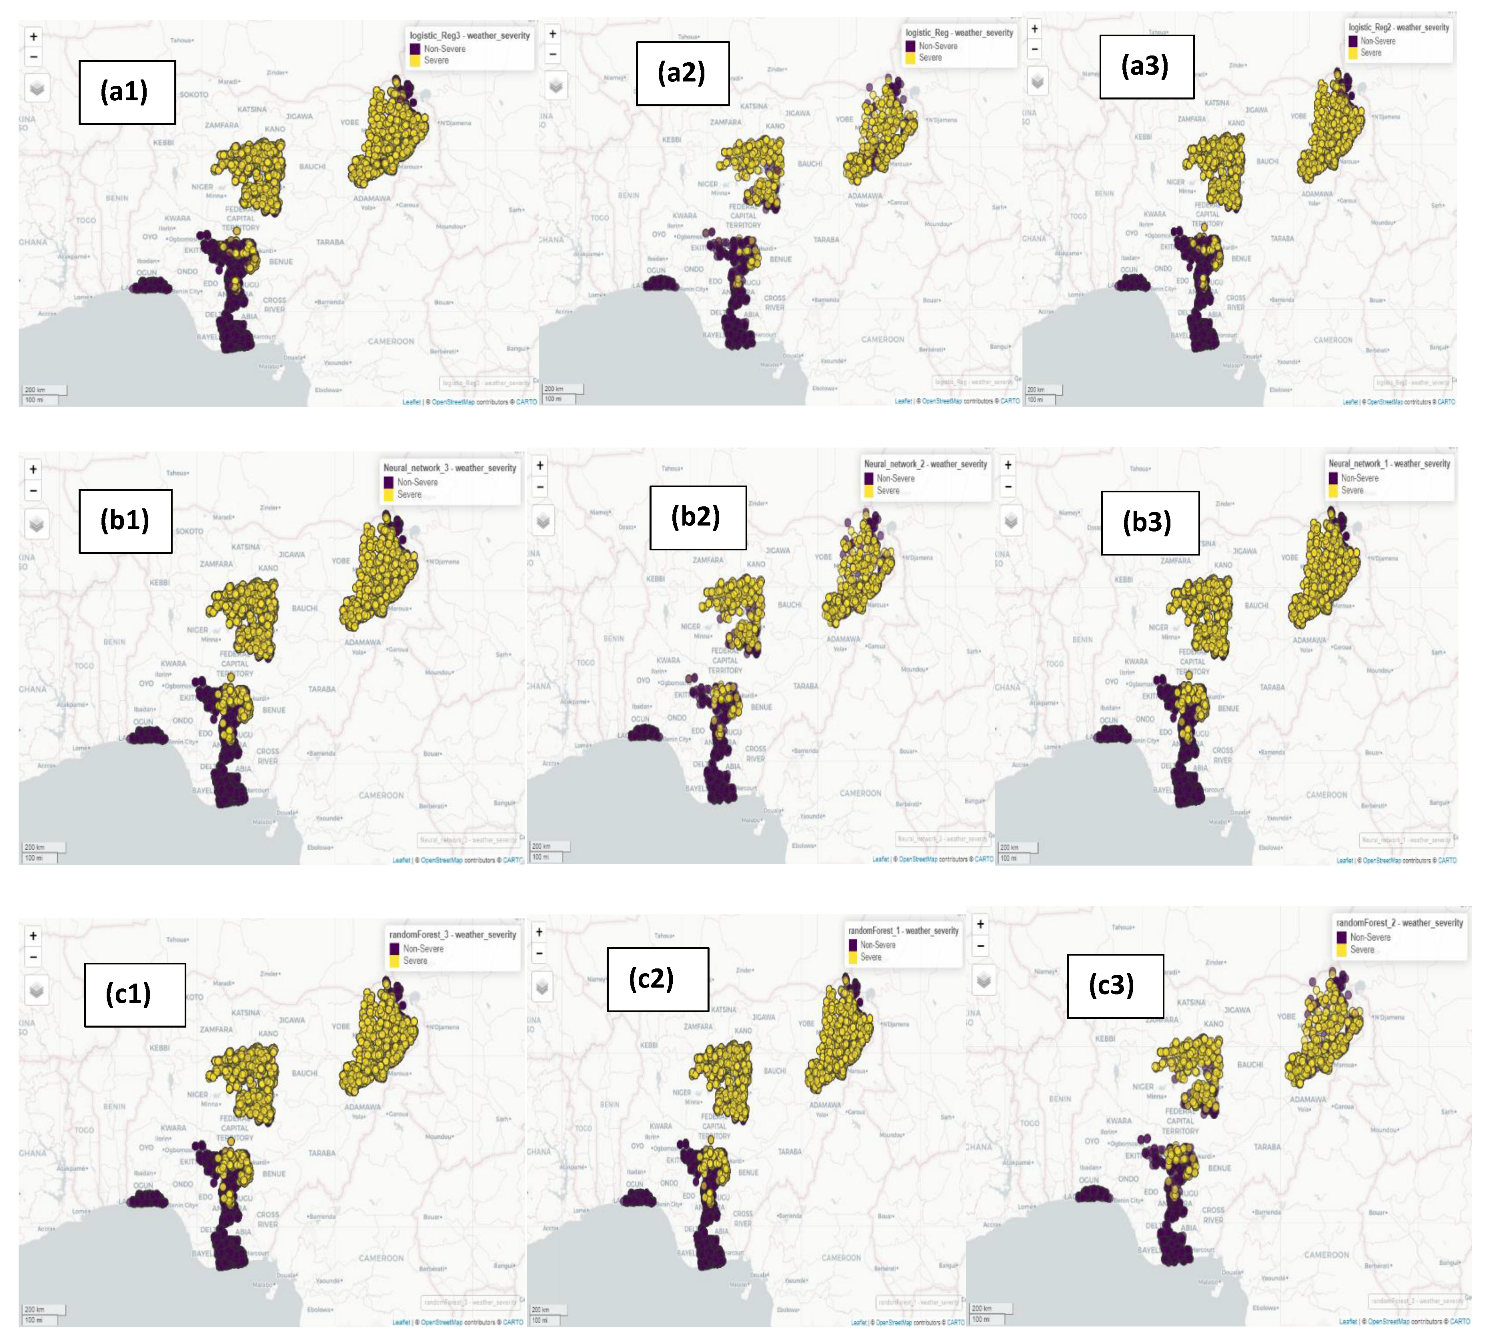

Table 2.
Descriptive analysis of the weather condition variables.
| Variable | Mean | Std | Min | med | Max | IQR | CV |
| Population | 53158.7 | 152217.3 | 0 | 10169 | 1777118 | 20981 | 2.9 |
| Temp | 303.3 | 4 | 291.1 | 303.4 | 314.1 | 5 | 0 |
| Pressure | 1010.2 | 2.3 | 1003 | 1011 | 1015 | 3 | 0 |
| Humidity | 38 | 22 | 7 | 34 | 85 | 39 | 0.6 |
| Ground level | 976.2 | 27.6 | 873 | 978 | 1012 | 51 | 0 |
| Wind speed | 2.9 | 1.5 | 0 | 2.6 | 8.3 | 2.2 | 0.5 |
| Wind degree | 134.3 | 103 | 0 | 95 | 360 | 177 | 0.8 |
| Cloud | 71.7 | 35.9 | 0 | 93 | 100 | 53 | 0.5 |
Disclaimer/Publisher’s Note: The statements, opinions and data contained in all publications are solely those of the individual author(s) and contributor(s) and not of MDPI and/or the editor(s). MDPI and/or the editor(s) disclaim responsibility for any injury to people or property resulting from any ideas, methods, instructions or products referred to in the content. |
© 2025 by the authors. Licensee MDPI, Basel, Switzerland. This article is an open access article distributed under the terms and conditions of the Creative Commons Attribution (CC BY) license (http://creativecommons.org/licenses/by/4.0/).
Copyright: This open access article is published under a Creative Commons CC BY 4.0 license, which permit the free download, distribution, and reuse, provided that the author and preprint are cited in any reuse.


