Submitted:
05 November 2025
Posted:
06 November 2025
You are already at the latest version
Abstract
Glycation-induced modifications of extracellular matrix (ECM) proteins, including collagen, are increasingly recognised as critical modulators of cellular behaviour, particularly in pathophysiological contexts such as ageing and diabetes. While their impact on general cell adhesion has been explored, the specific consequences for mesenchymal stem cell (MSC) mechanotransduction remain poorly defined. In this study, we investigated the temporal and mechanistic aspects of adhesion and mechanosensitive signalling in adipose-derived MSCs (ADMSCs) cultured on native versus glycated collagen substrates. Our findings identify two temporally distinct adhesion mechanisms: an initial pathway mediated by the receptor for advanced glycation end-products (RAGE), which is activated within the first 30 minutes following substrate engagement, and a later-stage adhesion process predominantly governed by integrins. Immunofluorescence analysis demonstrated maximal nuclear localisation of YAP/TAZ transcriptional regulators during the initial adhesion phase, coinciding with RAGE engagement. This nuclear enrichment was progressively attenuated as integrin-mediated focal adhesions matured, suggesting a dynamic shift in receptor usage and mechano-transductive signalling. Interestingly, glycated collagen substrates accelerated early cell attachment but impaired focal adhesion maturation, suggesting a disruption in integrin engagement. Endogenous collagen synthesis was consistently detected at all examined time points (30 minutes, 2 hours, and 5 hours), suggesting a constitutive biosynthetic activity that remains sensitive to the glycation state of the substrate. Atomic force microscopy (AFM) demonstrated that glycation disrupts collagen fibrillogenesis: while native collagen forms a well-organised network of long, interconnected fibrils, GL-1 substrates (glycated for 1 day) displayed sparse and disordered fibrillary structures, whereas GL-5 substrates (5-day glycation) exhibited partial restoration of fibrillar organisation. These matrix alterations were closely associated with changes in adhesion kinetics and mechanotransduction profiles. Taken together, our findings demonstrate that collagen glycation modulates both MSC adhesion dynamics and mechanosensitive signalling through a dual-receptor mechanism. These insights have significant implications for the design of regenerative therapies targeting aged or metabolically compromised tissues, where ECM glycation is prevalent.
Keywords:
MSC
; collagen glycation
; focal adhesion
; Mechanotransduction
; YAP TAZ
; RAGEs
1. Introduction
Cellular behavior is dynamically regulated through the integration of biochemical and biophysical signals originating from the surrounding microenvironment, which includes both the extracellular matrix (ECM) and neighboring cells [1]. Beyond metabolic and humoral factors—outside the scope of this study—cells possess specialized mechanosensitive receptors that detect and transduce mechanical cues into intracellular signaling cascades, ultimately leading to phenotypic adaptations. This process, termed mechanotransduction, is fundamental to a wide array of physiological and pathological processes, including embryogenesis, tissue homeostasis, aging, wound healing, and tumorigenesis [1,2].
Among the cell types most responsive to mechanical stimuli are mesenchymal stem cells (MSCs), whose fate decisions and regenerative capacity are tightly governed by mechanotransductive signaling [2,3]. Central to this mechanosensory machinery are integrins—transmembrane receptors that mediate cell-ECM adhesion and simultaneously sense matrix stiffness, topography, and other mechanical properties. These interactions orchestrate cytoskeletal remodeling and drive morphological and functional changes [4,5]. In addition to integrins, other adhesive receptors, such as members of the immunoglobulin superfamily (IgSF), may also modulate MSC behavior and contribute to their mechanosensitivity [6,7,8].
Collagen, the predominant structural protein within the ECM, plays a critical role in defining the matrix’s mechanical landscape, including its stiffness, porosity, and surface architecture [9]. These biomechanical attributes facilitate force transmission and regulate intercellular communication, thereby influencing diverse cellular functions [10,11,12,13]. Despite significant advances in ECM biology, the mechanistic implications of collagen-cell interactions—particularly under pathological conditions—remain incompletely elucidated [14,15].
One such pathological alteration is collagen glycation, a non-enzymatic modification driven by sustained hyperglycemia. This process involves the covalent attachment of reducing sugars to free amino groups on collagen, initiating the Maillard reaction and leading to the formation of early Amadori products [16]. Over time, these products evolve into advanced glycation end products (AGEs), which disrupt collagen’s supramolecular organization and alter its biomechanical properties [15,17]. In chronic diabetic conditions, excessive glycation compromises ECM integrity and perturbs mechanotransduction pathways, potentially impairing stem cell-mediated tissue regeneration and remodeling [16].
Mesenchymal stem cells (MSCs) possess the capacity to detect and respond to extracellular collagen through multiple mechanisms, with integrins playing a central role in mediating physical anchorage to the ECM and directing lineage specification and functional behavior [17,18]. These cell-matrix interactions are predominantly orchestrated through focal adhesions (FAs)—dynamic multiprotein complexes that serve as key mechanotransductive nodes, bridging ECM components, integrin receptors, and the intracellular cytoskeleton [19]. FA formation is particularly efficient on two-dimensional (2D) substrates, where biophysical parameters such as stiffness, surface topography, and surface energy critically influence their maturation and stability [11,21]. Moreover, the nanoscale spatial distribution of adsorbed adhesive proteins significantly modulates FA architecture and longevity [20,21]. Among the integrin heterodimers implicated in collagen recognition are α1β1, α2β1, and α6β1, which facilitate cellular adhesion and initiate downstream mechanotransductive signaling. Mechanical forces transmitted through integrins induce cytoskeletal remodeling and activate intracellular signaling cascades, notably the RhoA pathway. This involves the regulation of guanine nucleotide exchange factors (GEFs) and GTPase-activating proteins (GAPs), which modulate actomyosin contractility and cellular tension [21]. The dynamic reciprocity between collagen-integrin engagement and cytoskeletal signaling is essential for maintaining cellular morphology, polarity, and functional integration within the ECM. Through extracellular-signal-regulated kinase (ERK) and other pathways, integrin signaling affects genes involved in cell cycle progression, differentiation, and migration. Thus, mechanical signals from integrins can influence chromatin accessibility and histone modifications, linking ECM stiffness to transcriptional programs [22].
Recent insights have highlighted the Hippo signaling pathway as another critical downstream effector of mechanical stimuli, acting as a conduit for transducing extracellular mechanical cues into nuclear transcriptional responses [23,24,25]. This evolutionarily conserved pathway, originally characterized in Drosophila melanogaster, governs key biological processes including cell proliferation, survival, differentiation, and organ size regulation [26]. The Hippo pathway operates through a hierarchical kinase cascade involving the serine/threonine kinases STK3 (MST2) and STK4 (MST1), which form a complex with the scaffold protein Salvador (SAV1). This complex phosphorylates and activates the Large Tumor Suppressor Kinases (LATS1) and LATS2, which subsequently inhibit the transcriptional coactivators Yes-associated protein (YAP1) and transcriptional coactivator with PDZ-binding motif (TAZ) by promoting their cytoplasmic retention and degradation [26,27]. Through this mechanism, the Hippo pathway integrates mechanical inputs to regulate gene expression programs essential for tissue homeostasis and regenerative potential.
In our recent investigations, we provided both morphological and quantitative morphometric evidence of altered mechanotransductive signaling in adipose-derived mesenchymal stem cells (ADMSCs) adhering to collagen under oxidative stress conditions. These alterations implicated focal adhesions, actin cytoskeletal organization, and YAP/TAZ activity as key mechanistic components [15]. Furthermore, we demonstrated that early-stage glycation of collagen induces significant structural and biomechanical modifications, affecting FA assembly, integrin clustering, cytoskeletal dynamics, and the remodeling of the collagen matrix [15,17], as well as the kinetics of cellular attachment [10].
Building upon these findings, the present study aims to elucidate how post-translational modifications of collagen—specifically glycation—impact mechanotransduction in MSCs. Given the central role of ECM mechanics in stem cell fate determination, understanding these interactions is critical for advancing regenerative strategies under pathological conditions such as diabetes.
2. Results
2.1. Morphological Response of Stem Cells on Glycated Collagen
Under static culture conditions (AD-MSCs) demonstrate efficient adhesion and spreading on native collagen matrices, as well documented previously [1,10,15,17], and now validated by our current findings. As shown in Figure 1 (lower panel), within two hours post-seeding, ADMSCs exhibit a robust organization of the actin cytoskeleton, characterized by extensive formation of stress fibres (Figure 1D, viewed in green), which coincide with focal adhesion (FA) complexes (red), better seen below in Figure 3. In contrast, collagen glycation markedly impairs cellular spreading activity. Notably, substrates subjected to five days of glycation (GL5) induce significant cellular shrinkage (Figure 1F), suggesting an altered substratum interaction, whereas those glycated for one day (GL1) promote an intermediate morphological phenotype (Figure 1E). These observations are consistent with our earlier study, supporting a hypothesis of altered integrin-mediated recognition of glycated collagen [10,15,17].
An inverse trend was observed when ADMSC adhesive interactions were assessed at the early 30-minute incubation stage (Figure 1, upper panel). At this time point, cells exhibited visibly enhanced attachment to glycated collagen substrates (Figure 1B and 1C) compared to native collagen (Figure 1A). These morphological observations corroborate with the direct quantities of cell adhesion (Figure 2), which revealed a significant increase in the number of adherent cells at the 30th min on glycated samples—from 15 ± cells/field on native collagen (Nat) it increases to 21 ± 3 and 32 ± 4 cells/field on GL 1 and GL 5, respectively. They are also in harmony with the significantly reduced adhesion to glycated samples on the 2nd hour of incubation where adhesion drop from about 25 ± 3 cells/slide to about 12 ± 1 and 14 ± 2 cells/slide, for GL 1 and GL 5, respectively.
To address potential variability in morphological characteristics across distinct microscopic fields, ImageJ software was employed in a follow-up experiment to quantitatively assess cell adhesion efficiency. Parameters analyzed included mean cell spreading area (CSA, μm2), perimeter (μm), and cell shape index (CSI). This experiment also incorporated an extended incubation period of 5 hours. The resulting data are summarized in Table 1.
As shown in Table 1—and despite the apparently improved attachment observed in Figure 2—ADMSCs exhibit reduced adhesion efficiency to glycated collagen substrates during the initial 30 minutes of incubation. This is most evident in the cell spreading area (CSA), which decreases by approximately 58%, from 3165 μm2 on native collagen (Nat) to 1337 μm2 and 1326 μm2 on GL1 and GL5 substrates, respectively. A similar reduction is observed in cell perimeter, which declines by roughly 45%, from 225 μm on Nat to 144 μm and 136 μm on GL1 and GL5. Prolonged incubation for 5 hours results in only a modest increase in perimeter (~20%), indicating limited enhancement of cell spreading over time. The cell shape index (CSI) however decreases progressively from 0.7 to 0.2 between 30 minutes and 5 hours, reflecting a morphological transition from rounded to more elongated cell profiles. These findings suggest that although initial adhesion to glycated collagen appears accelerated (as illustrated in Figure 1 and Figure 2), it is characterized by restricted spreading and morphological adaptation, indicative of a rapid yet suboptimal adhesion process.
By 2 hours of incubation, ADMSCs cultured on native collagen exhibit a pronounced enhancement in adhesion efficiency, reflected by an approximate twofold increase in both cell spreading area (CSA) and perimeter—from 3165 μm2 to 7522 μm2, and from 225 μm to 468 μm, respectively. In contrast, glycated collagen substrates continue to suppress these parameters by roughly 20%. At the 5-hour mark, cells begin to partially restore their spreading capacity, as indicated by a modest increase in perimeter and a ~20% decrease in cell shape index (CSI), consistent with a shift toward a more elongated, adherent morphology.
This temporal pattern is consistent with our recent findings [10], demonstrating that ADMSCs rapidly adhere to glycated collagen substrates under both static and flow-based conditions, followed by a gradual decline in adhesion strength and cell spreading at later time points. These observations prompted the hypothesis that additional adhesive receptors may be involved in mediating early interactions with glycated matrices. As previously proposed [10], particular attention was given to the receptor for advanced glycation end products (RAGE), a member of the immunoglobulin superfamily (IgSF)—a broad class of cell surface and soluble proteins implicated in cellular recognition, binding, and adhesion processes [28,29].
Although our earlier experiments did not reveal substantial RAGE expression in ADMSCs, literature reports suggest that RAGE may be transiently expressed under specific conditions, including exposure to extrinsic microenvironmental cues and prolonged in vitro culture [30,31,32]. To address this, the present study undertook a more systematic investigation of RAGE expression dynamics over extended incubation periods.
2.2. RAGE Expression in ADMSCs During Collagen Adhesion
Building on these insights, we assessed RAGE expression at three defined time points following ADMSC adhesion to collagen substrates: an early phase at 30 minutes, and two subsequent intervals at 2 and 5 hours. To avoid any additional adhesive factors, all experiments were conducted under serum-free conditions, as illustrated in Figure 2.
Figure 3.
Immunofluorescence visualization of RAGE at early (30 min) and late (2 nan 5 hours) timeframe. The cells were cultured for short period of 30 min, or longer periods of 2 and 5 hours in serum-free conditions on collagen coated glass slides pre-coated with either native (A,D,G) or glycated for 1 day (B, E, H) or 5 days (C, F, L) collagen, then fixed and stained with rabbit polyclonal anti-RAGE antibody, before viewed with Alexafluor 555 goat anti-rabbit secondary antibody. Bar 20 μM.
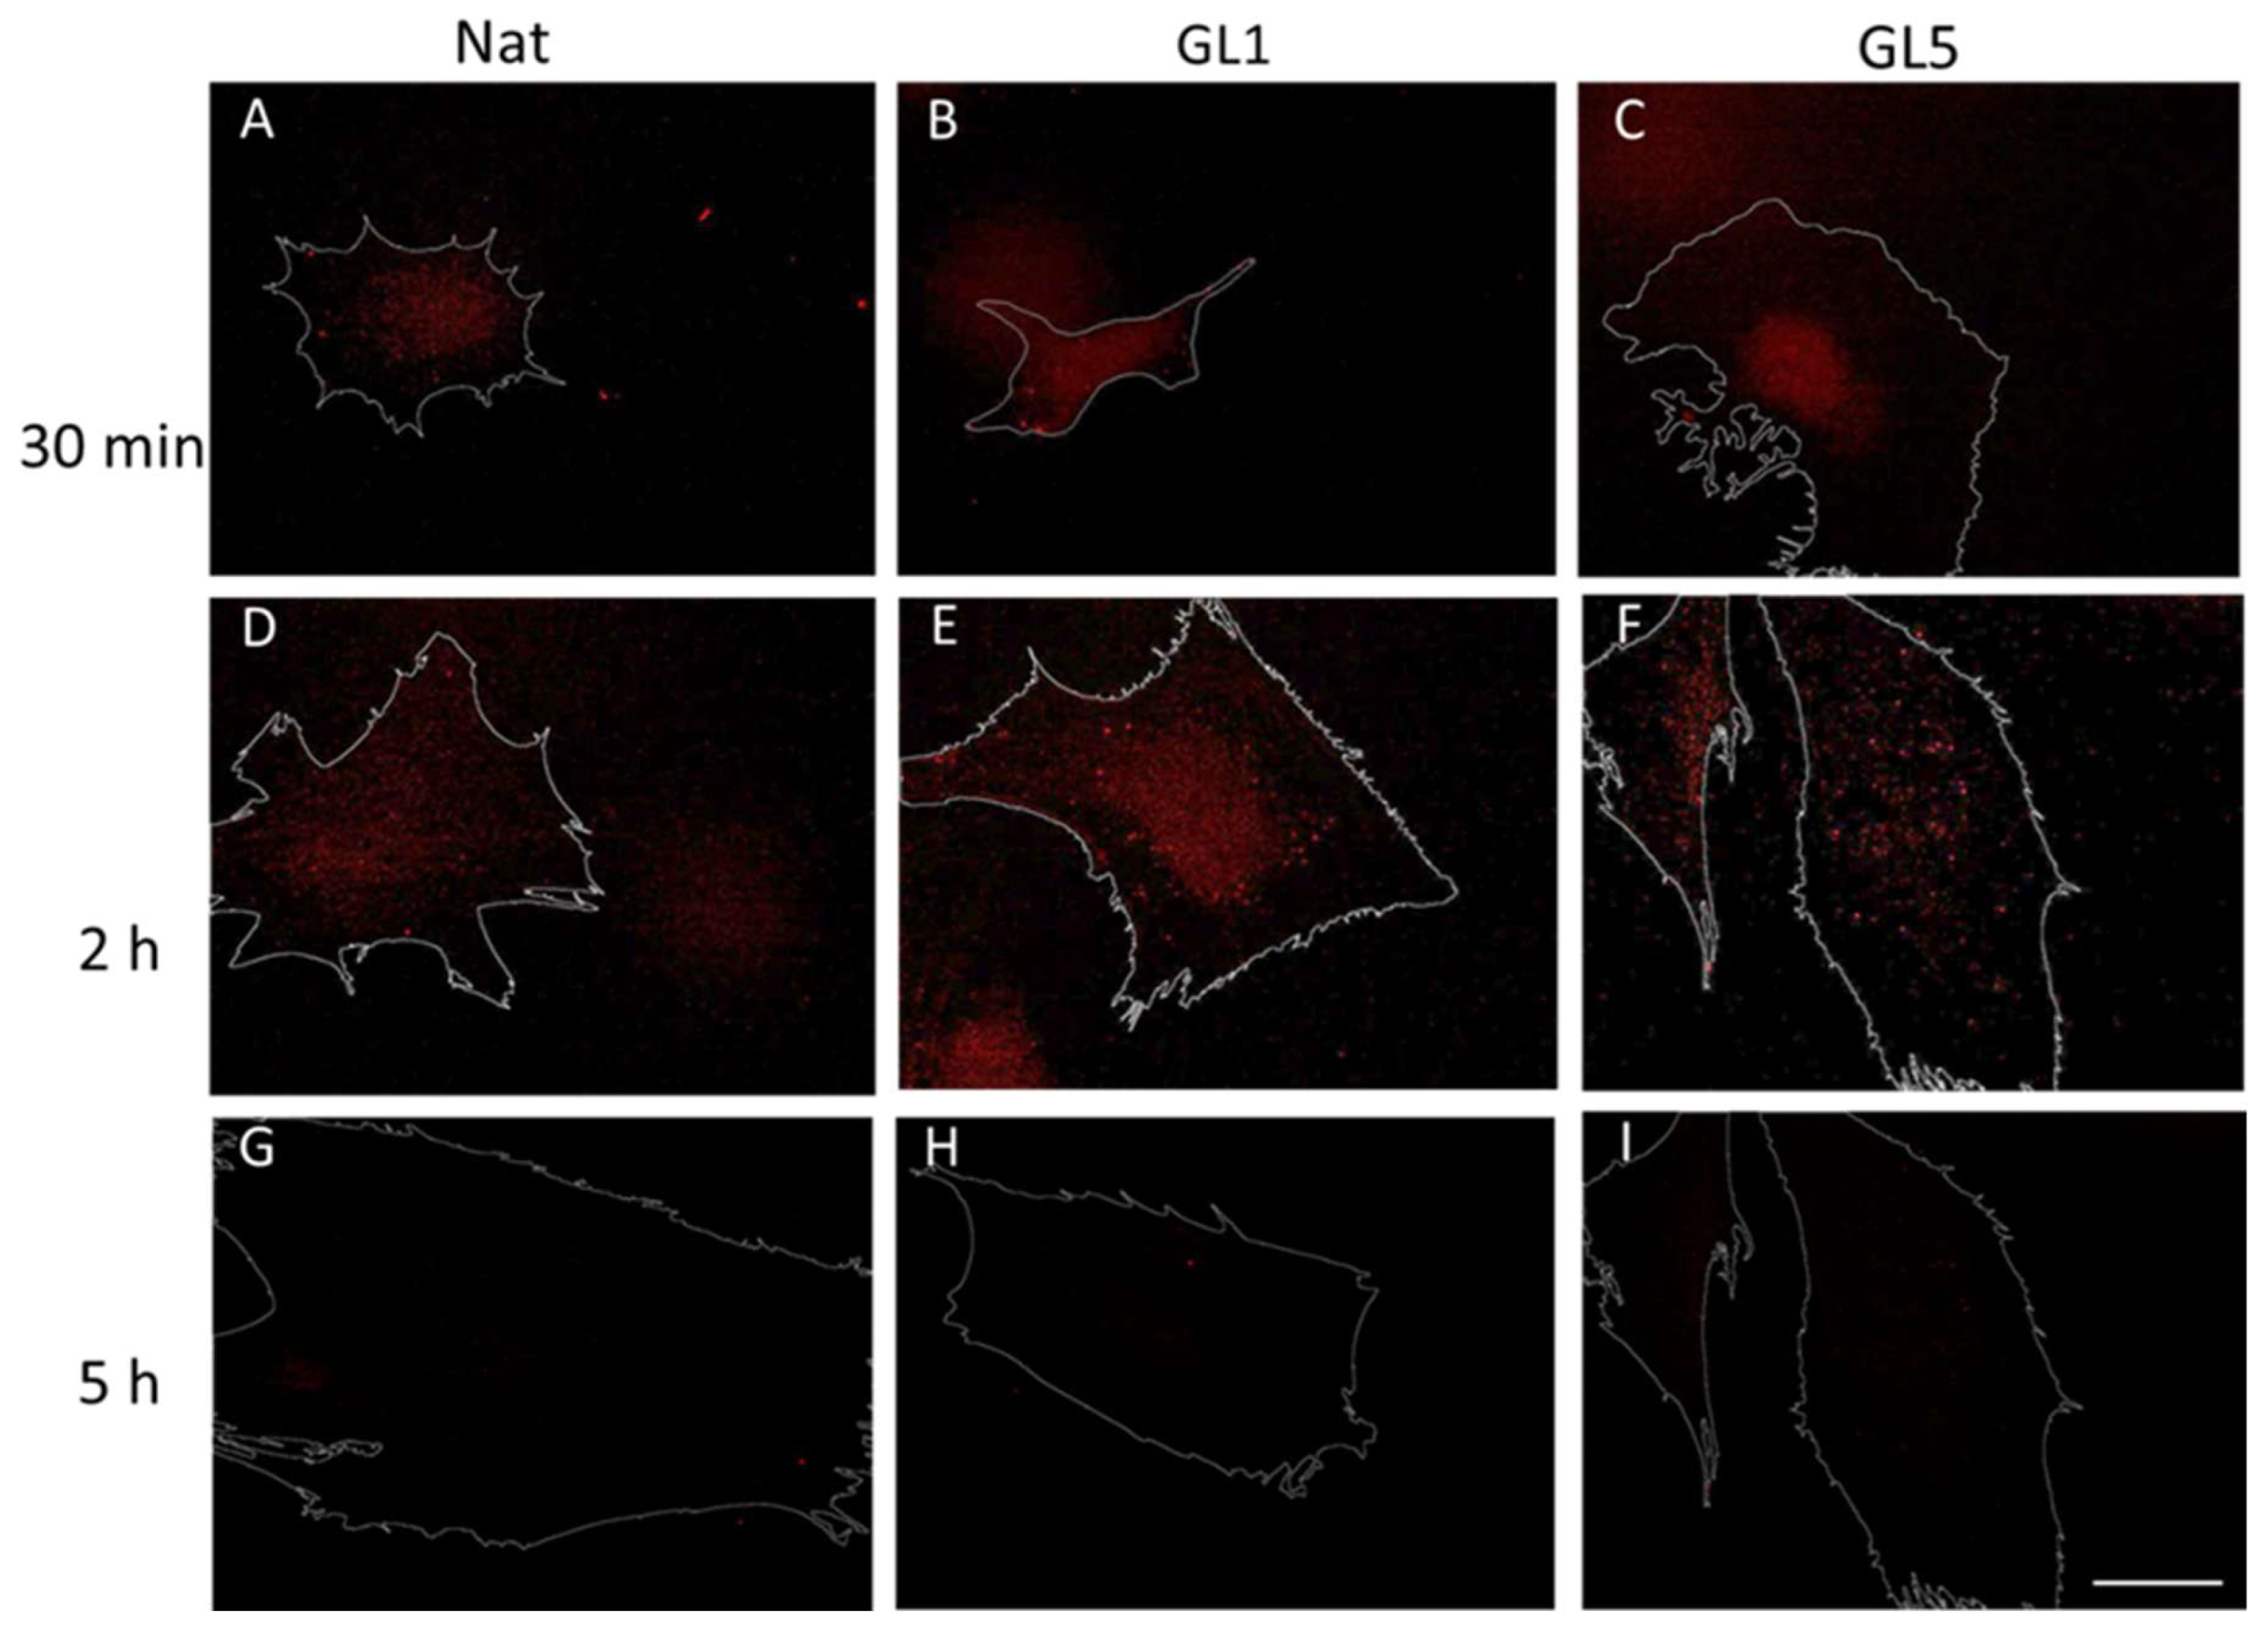
Representative images in Figure 3A–F reveal relatively low levels of RAGE expression, primarily detectable during the early incubation intervals—namely at 30 minutes and 2 hours. Notably, no discrete adhesive clusters were observed at the cell periphery. Instead, RAGE localization appeared diffusely distributed, suggesting potential association with intracellular compartments or extracellular deposition zones, such as the underlying substratum. By the 5-hour time point, RAGE expression showed a pronounced reduction.
2.3. ADMSC Mechanotransduction from Glycated Collagen
Cell–matrix interactions are predominantly mediated by focal adhesions (FAs), which—as outlined in the introduction paragraph—serve as central hubs for mechanotransduction by linking ECM components to integrins and the actin cytoskeleton [21]. In parallel, emerging evidence underscores the pivotal role of the Hippo signaling pathway in relaying mechanical cues to the nucleus. To concurrently assess FA dynamics and Hippo pathway activation during ADMSC adhesion to glycated collagen substrates, we focused on the immunofluorescent visualization of FAs and the YAP/TAZ signaling axis, the principal intracellular effectors of Hippo pathway.
A preliminary investigation was conducted using a previously validated protocol involving a 2-hour incubation under serum-free conditions [17]. Following incubation, cells were fixed and subjected to dual immunostaining: anti-vinculin antibody was employed to visualize focal adhesions, while anti-TAZ antibody labeling was used to assess Hippo pathway activity. Quantification of TAZ activity was based on the ratio of nuclear to cytoplasmic signal intensity. To ensure accurate spatial resolution, nuclear counterstaining was performed, enabling clear delineation of intra- and extranuclear compartments for precise assessment of TAZ distribution
The morphological data obtained from this study revealed several notable findings:
At this time point (2 hours) of ADMSC incubation, collagen glycation led to a reduction in the number of FAs. Nevertheless, these structures remained detectable (red), showing a persistent presence despite the overall decline. However, a subtle and rather inconclusive trend was observed toward nuclear translocation of YAP/TAZ, suggesting a potential—but not definitive—activation of this pathway under our experimental conditions.
These observations underscored the need to implement a morphometric approach for the quantitative assessment of focal adhesion (FA) dynamics and YAP/TAZ activity in a time-resolved manner. This strategy enables the characterization of the temporal progression of these processes and facilitates the determination of their dependence on incubation duration.
2.3.1. Quantification of Focal Adhesion (FA) Dynamics
Due to space constraints, morphological data are not shown; instead, FA dynamics were quantified using ImageJ software. As anticipated in Table 2, minimal FA formation was detected after 30 minutes of incubation, despite the improved initial adhesion observed on glycated substrates (Figure 1 and Table 1). At this early time point, the number of FAs per cell was negligible (ranging from 1 to 2 per cell). By the 2-hour mark, FA formation markedly increased on native collagen, reaching 98 ± 29 FAs per cell. In contrast, FA numbers were significantly reduced on glycated collagen, with GL1 and GL5 showing approximately 40% and 35% decreases, respectively. The same trend follows also the Total area of FA, showing about a two-fold drop for GL1 and about a triple reduction for GL5 (from an initial 1407 µm2 for Native collagen to 782 and 492 µm2 for GL1 and GL5, respectively.
2.3.2. Quantification of YAP/TAZ Activity
The ImageJ software was further used to quantify the coordinated YAP/TAZ translocation to the nucleus, as exemplified in Figure 3:
For this preliminary experiment, actin was used to outline the overall cell shape as a region of interest (ROI) within the cytosol, while the ROI of the nucleus was marked from the blue channel (both shown with arrows). This allowed us to measure separately the fluorescence intensity, representing YAP/TAZ activity of the nucleus and the cytosol on the red channel, and providing opportunity their ratio (nucleus vs. cytosol) to be calculated.
The next experiment was already designed to compare the YAP/TAZ activity of ADMSC between native and glycated collagens, GL1 and GL5, respectively. Figure 4 presents the morphological view upon evaluation of YAP/TAZ activity at the 2nd hour of incubation.
Figure 4.
Simultaneous visualisation of focal adhesion formation and YAP/TAZ activity of ADMSC on glycated collagens. ADMSC were cultured for 2 hours on native or glycated collagen (for 1 day or 5 days) in serum-free medium, then stained for vinculin (red), YAP/TAZ (green) and nuclei (blue).
Figure 4.
Simultaneous visualisation of focal adhesion formation and YAP/TAZ activity of ADMSC on glycated collagens. ADMSC were cultured for 2 hours on native or glycated collagen (for 1 day or 5 days) in serum-free medium, then stained for vinculin (red), YAP/TAZ (green) and nuclei (blue).
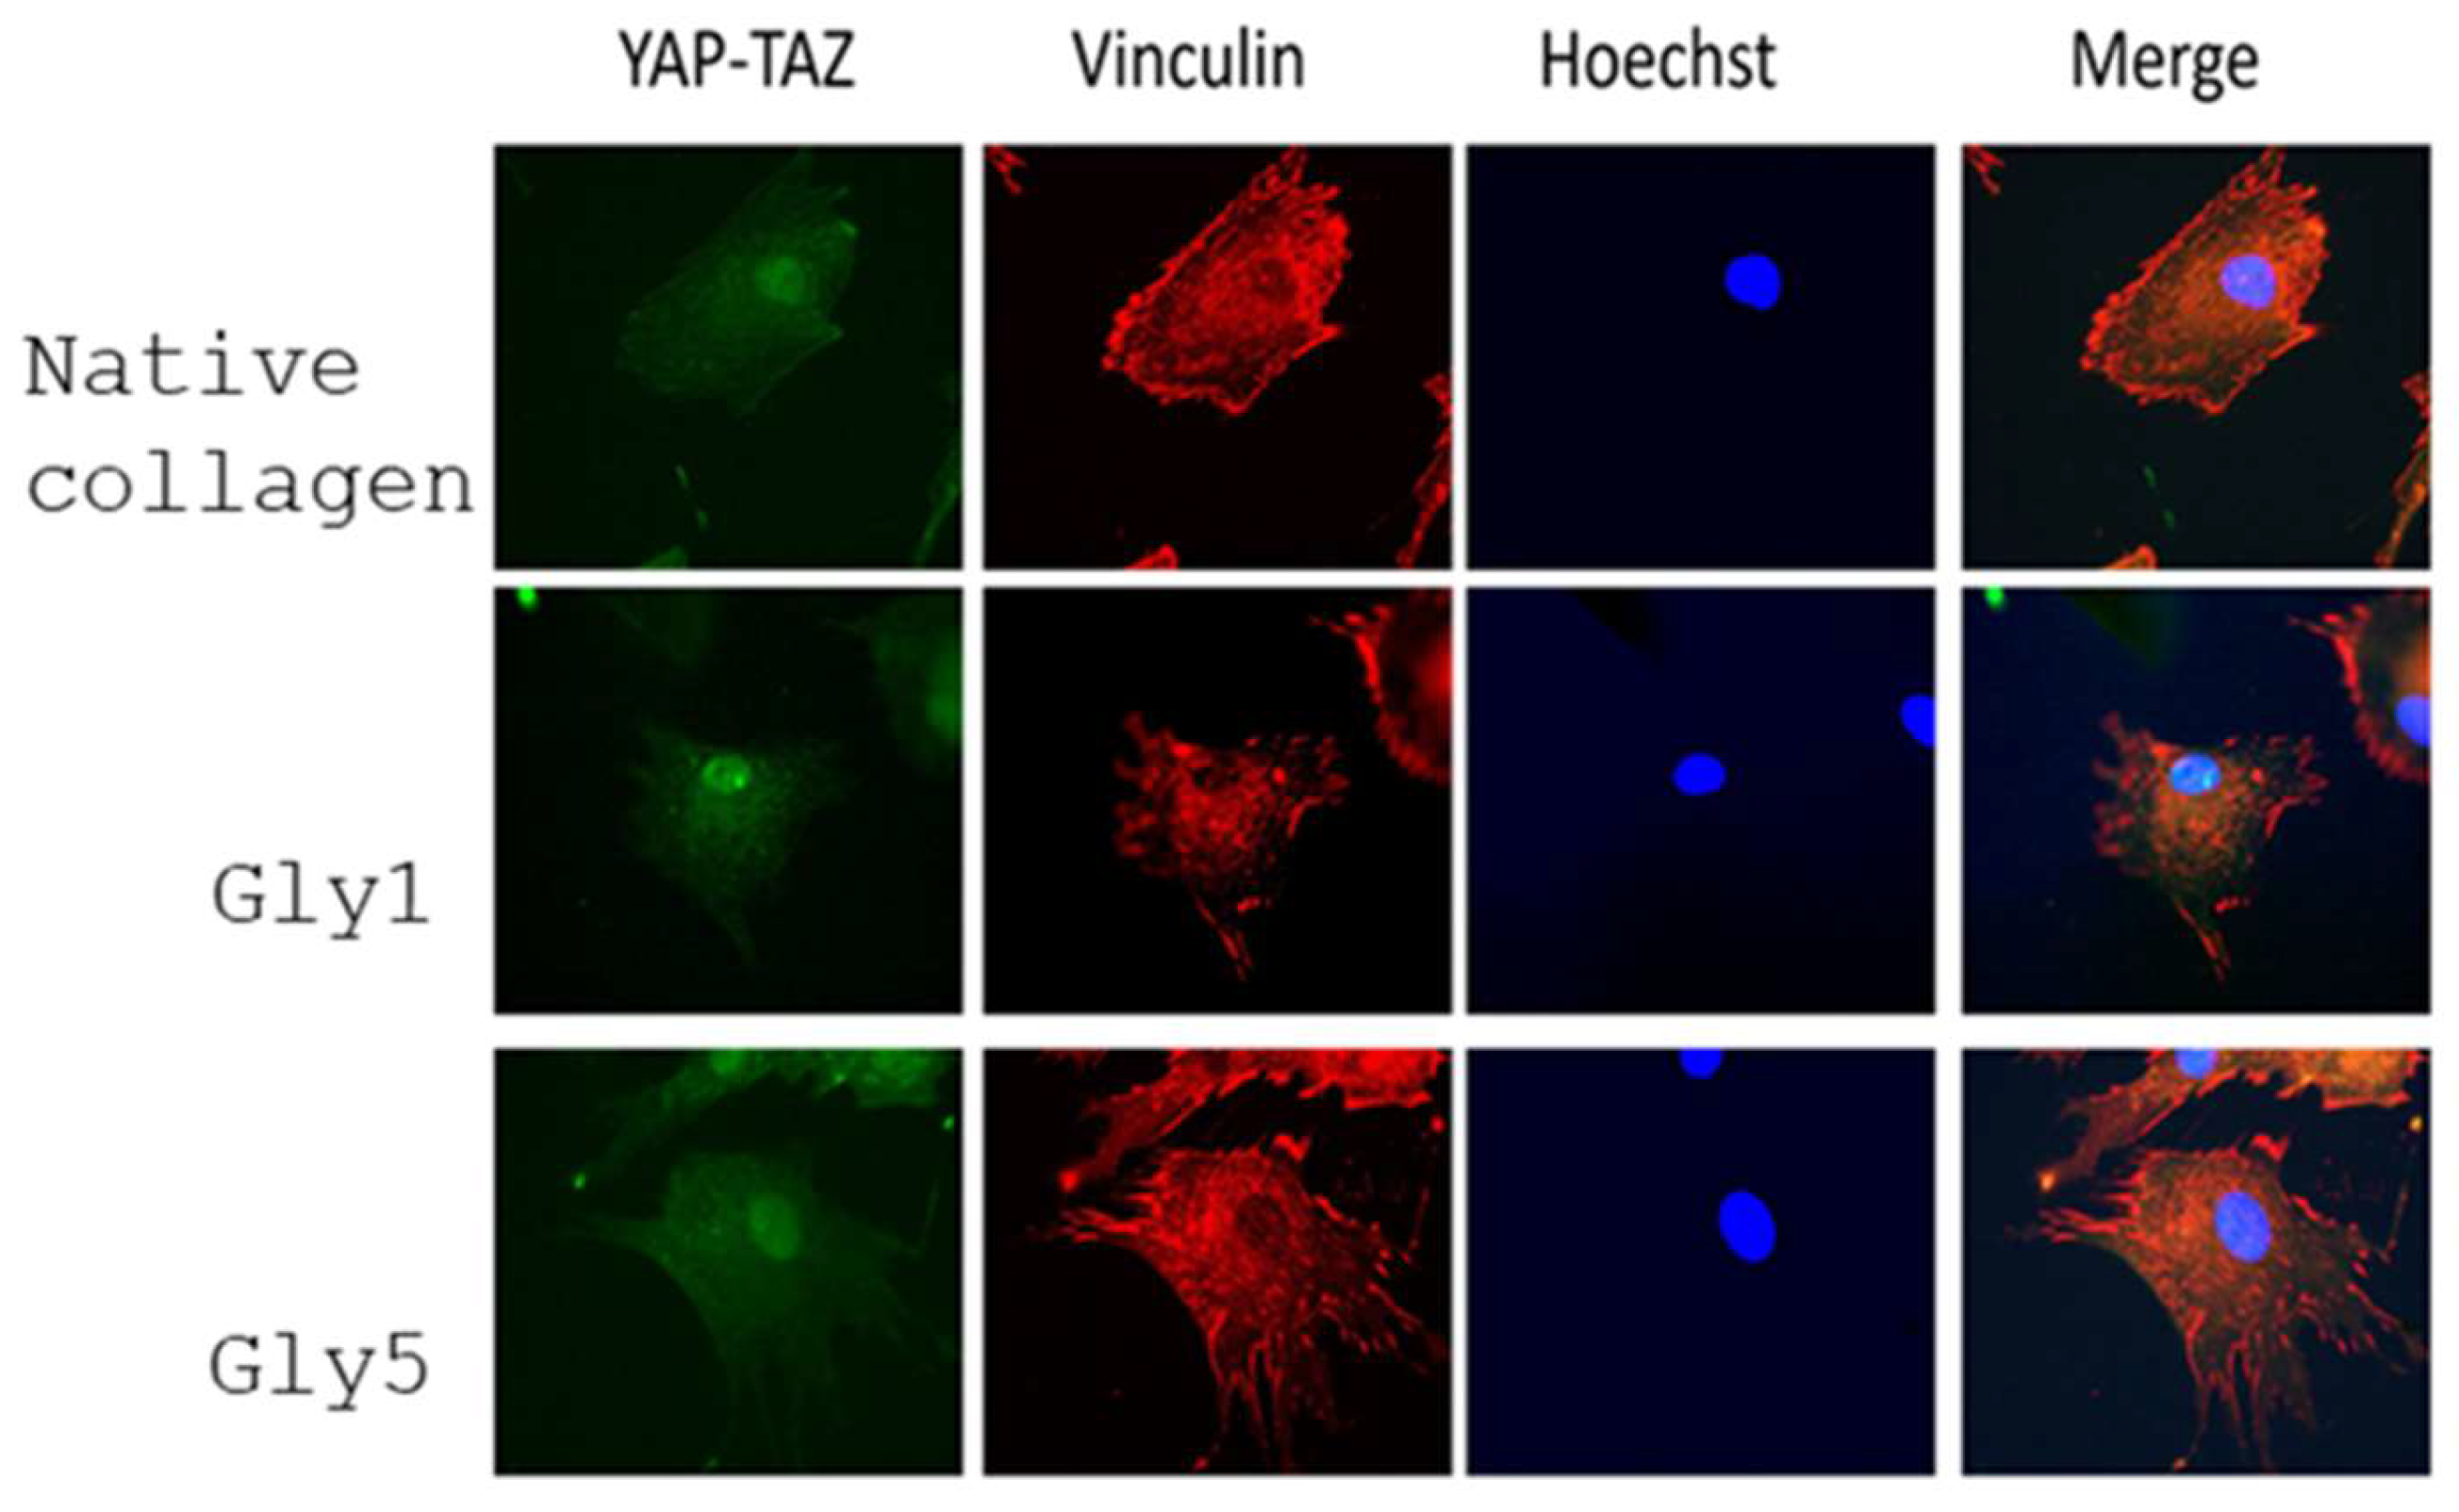
Figure 5.
Quantification of YAP/TAZ activity in a pilot study. ADMSCs were cultured for 2 hours on collagen-coated slides, then fixed and co-stained for actin (green) and nuclei (blue) as shown in the left panel. TAZ localization was visualized using an anti-TAZ antibody (red), highlighting cytoplasmic (middle panel) and nuclear (right panel) regions. Image analysis was performed using ImageG software.
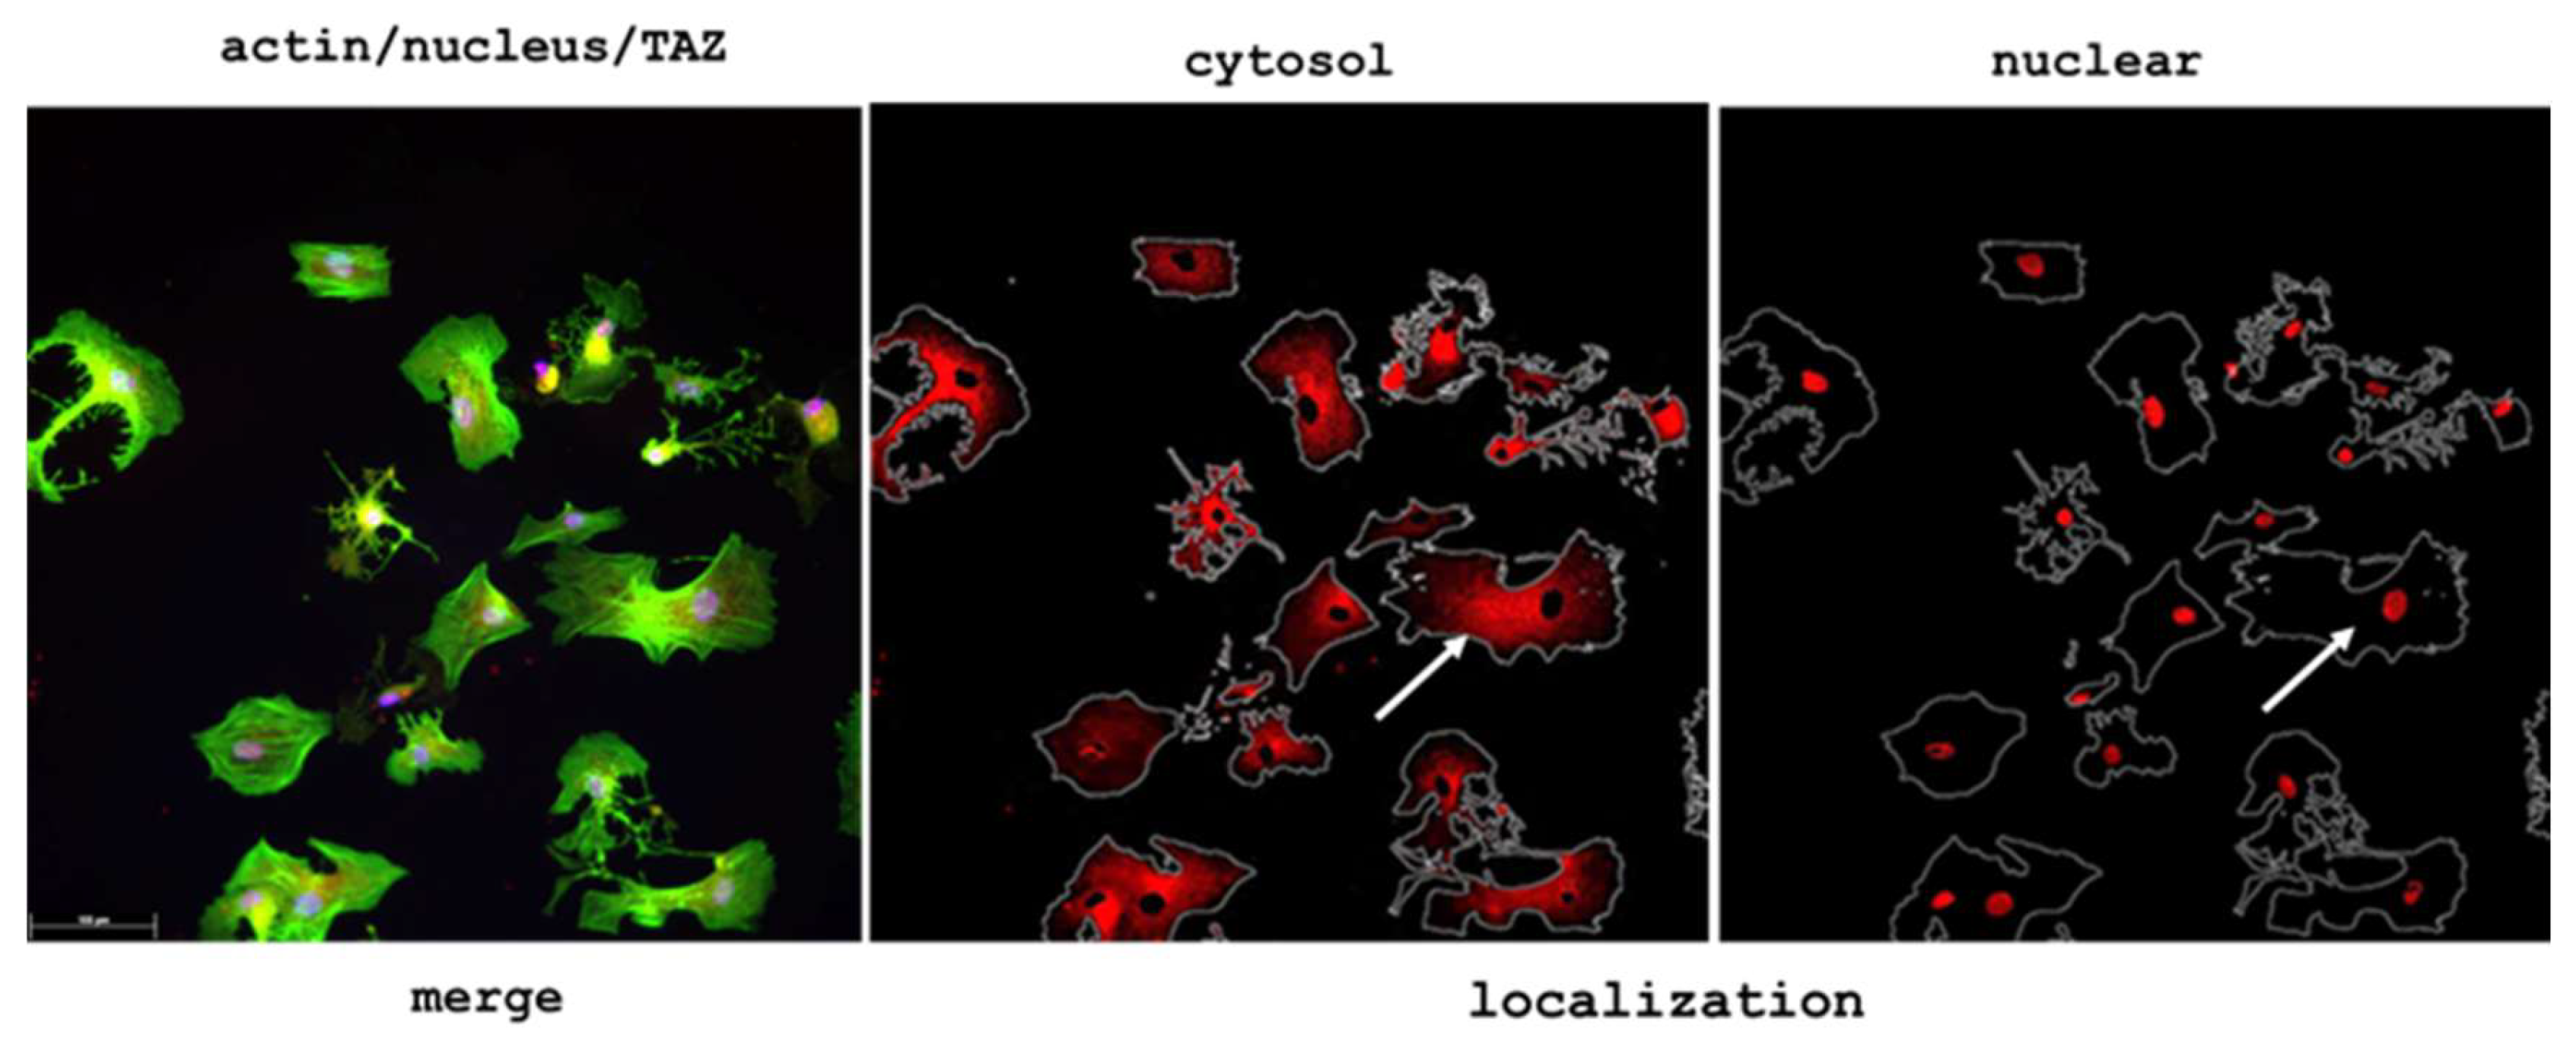
Figure 6.
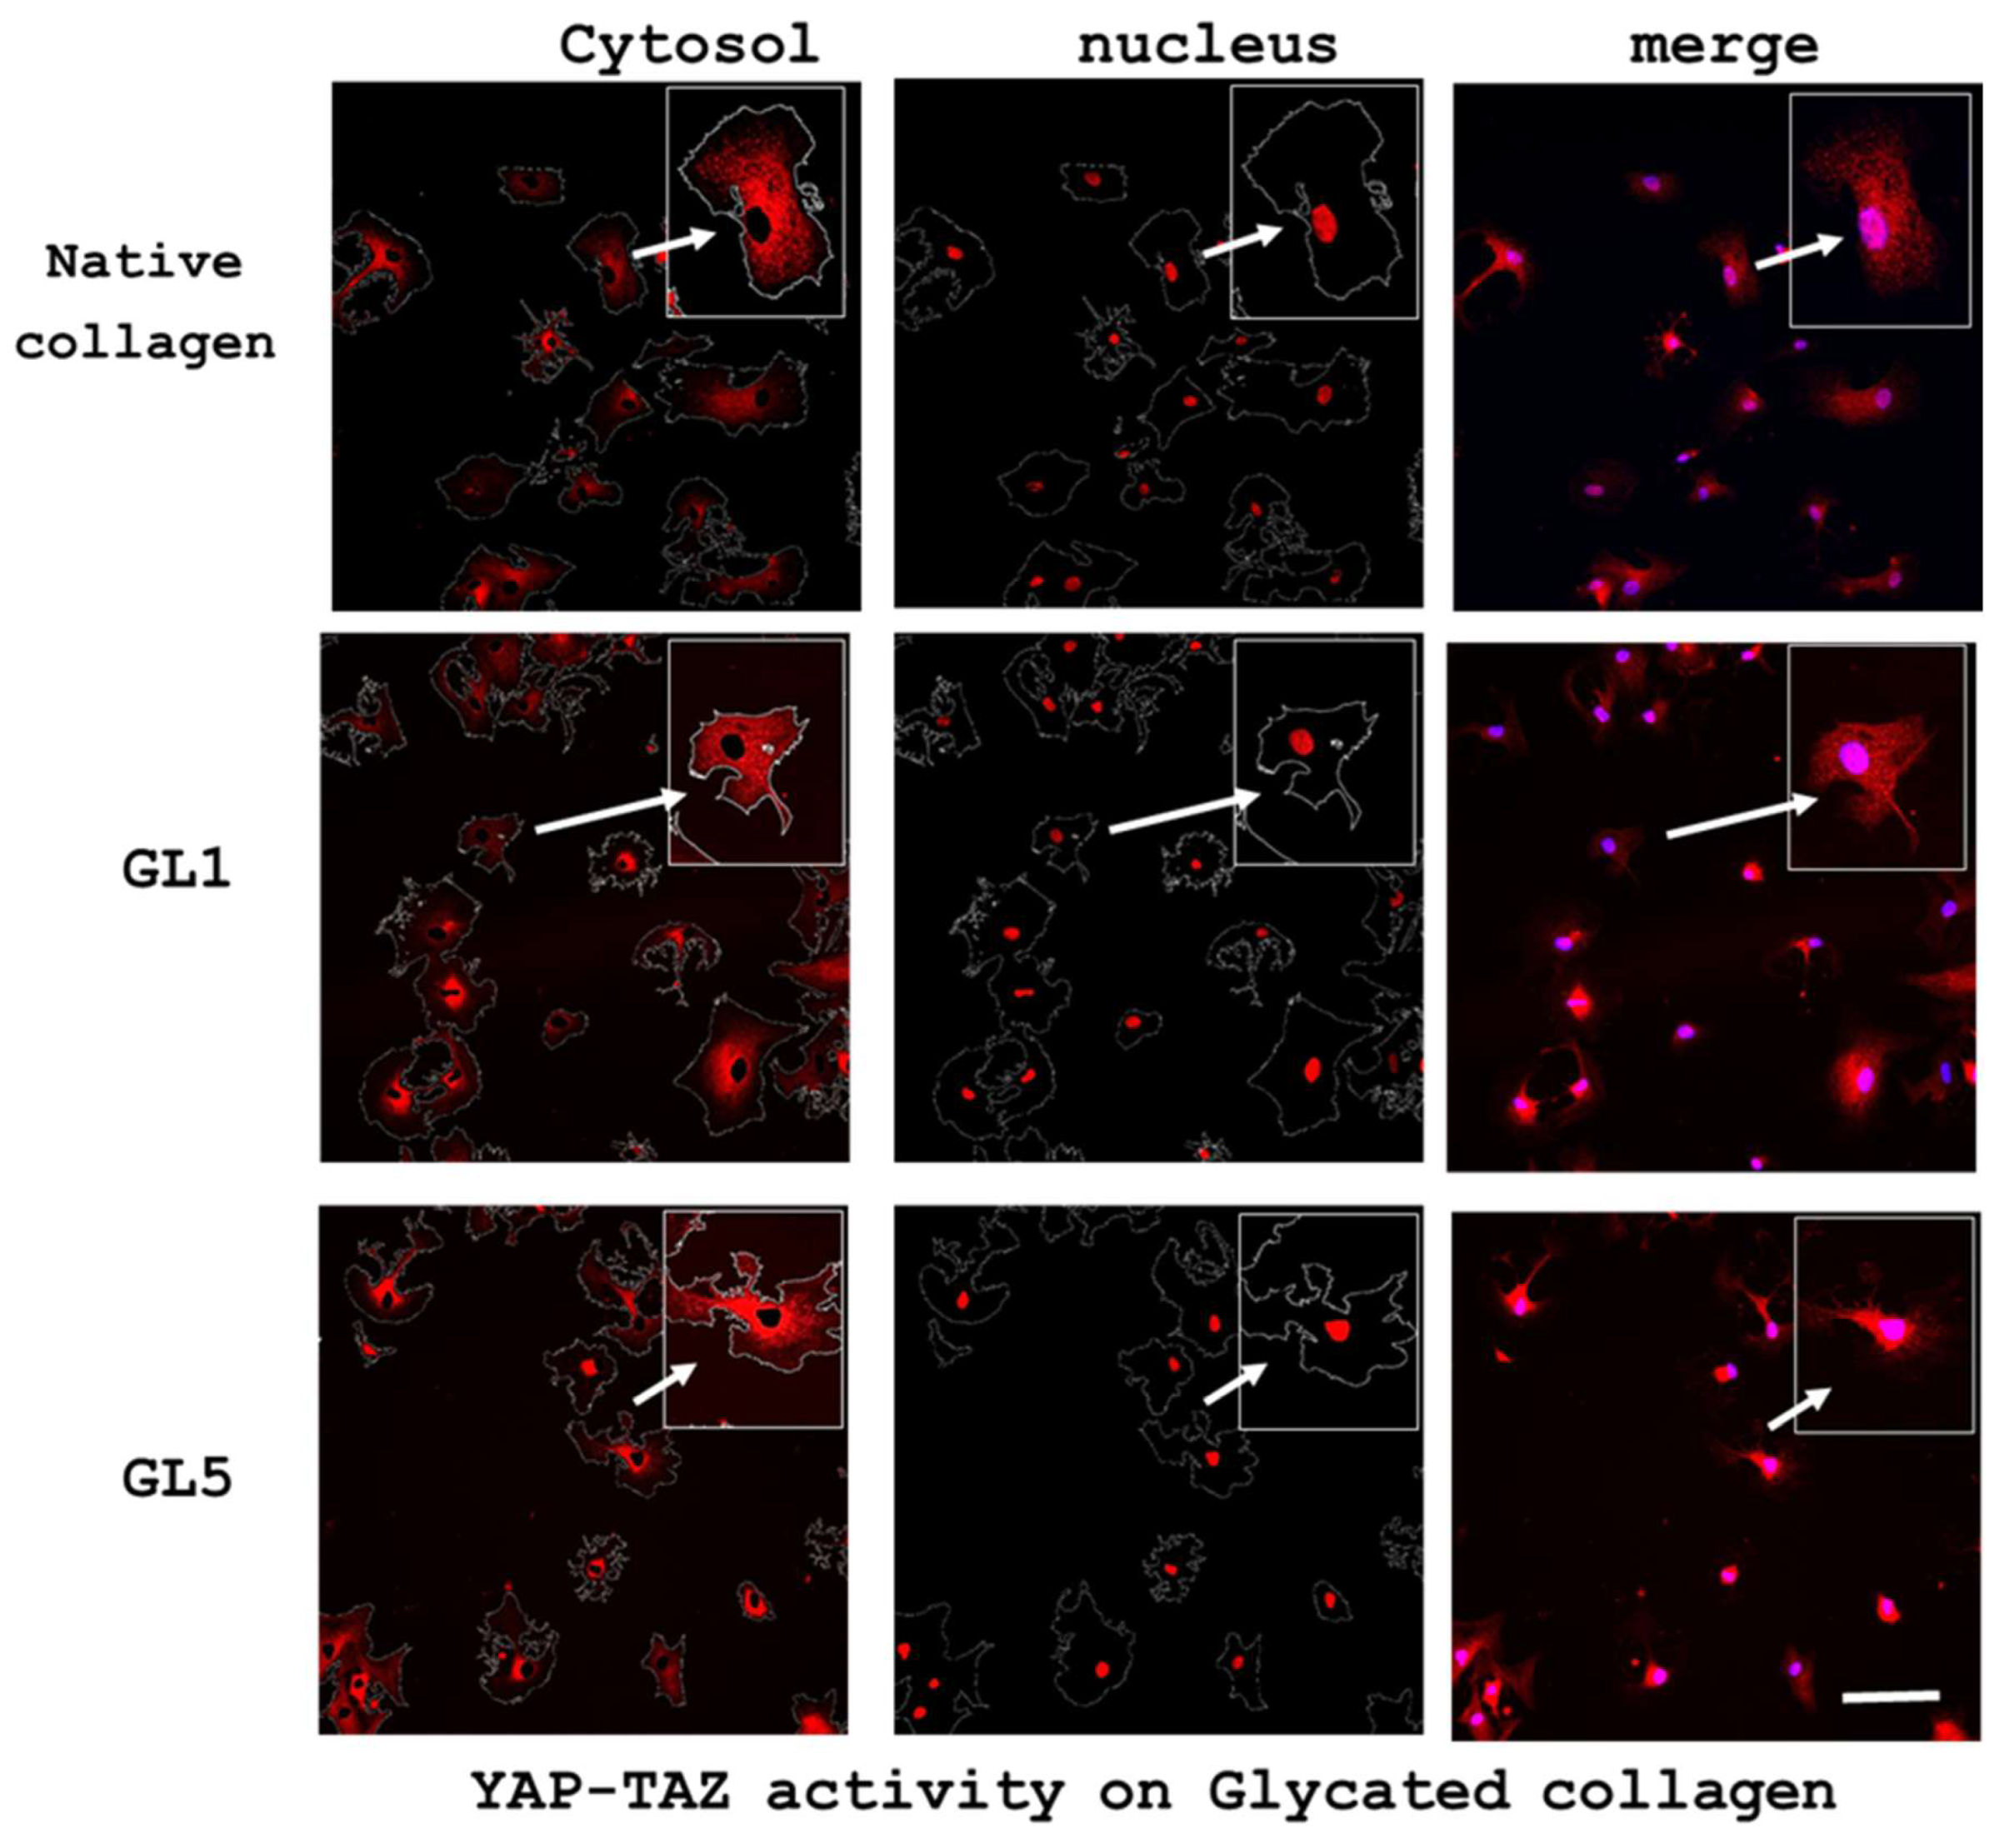
Overall characteristic and YAP/TAZ activity after 2 h incubation of ADMSC on native or glycated collagen. ADMSC were cultured serum-free for 2 hours on native and glycated collagen, as indicated for 1 day (GL1) or 5 days (GL5), then stained with anti-TAZ antibody (red) and nucleus (blue), as detailed in Figure 3. ImageJ software was used to outline the activity in the cytosol (left row) vs. the nuclear regions (middle row), as shown below in Figure 5. Bar 20 μM.
Figure 6.
Overall characteristic and YAP/TAZ activity after 2 h incubation of ADMSC on native or glycated collagen. ADMSC were cultured serum-free for 2 hours on native and glycated collagen, as indicated for 1 day (GL1) or 5 days (GL5), then stained with anti-TAZ antibody (red) and nucleus (blue), as detailed in Figure 3. ImageJ software was used to outline the activity in the cytosol (left row) vs. the nuclear regions (middle row), as shown below in Figure 5. Bar 20 μM.
To provide a comprehensive overview of the process, additional time points were analyzed and are presented in Figure 7 as quantitative data—expressed as nuclear-to-cytosolic fluorescence intensity ratios—covering 30 minutes, 2 hours, and 5 hours of incubation. Due to space constraints, corresponding images are not shown. Quantification was performed using ImageJ.
Figure 7.
Dynamics of YAP/TAZ activity on glycated collagens at different time points.
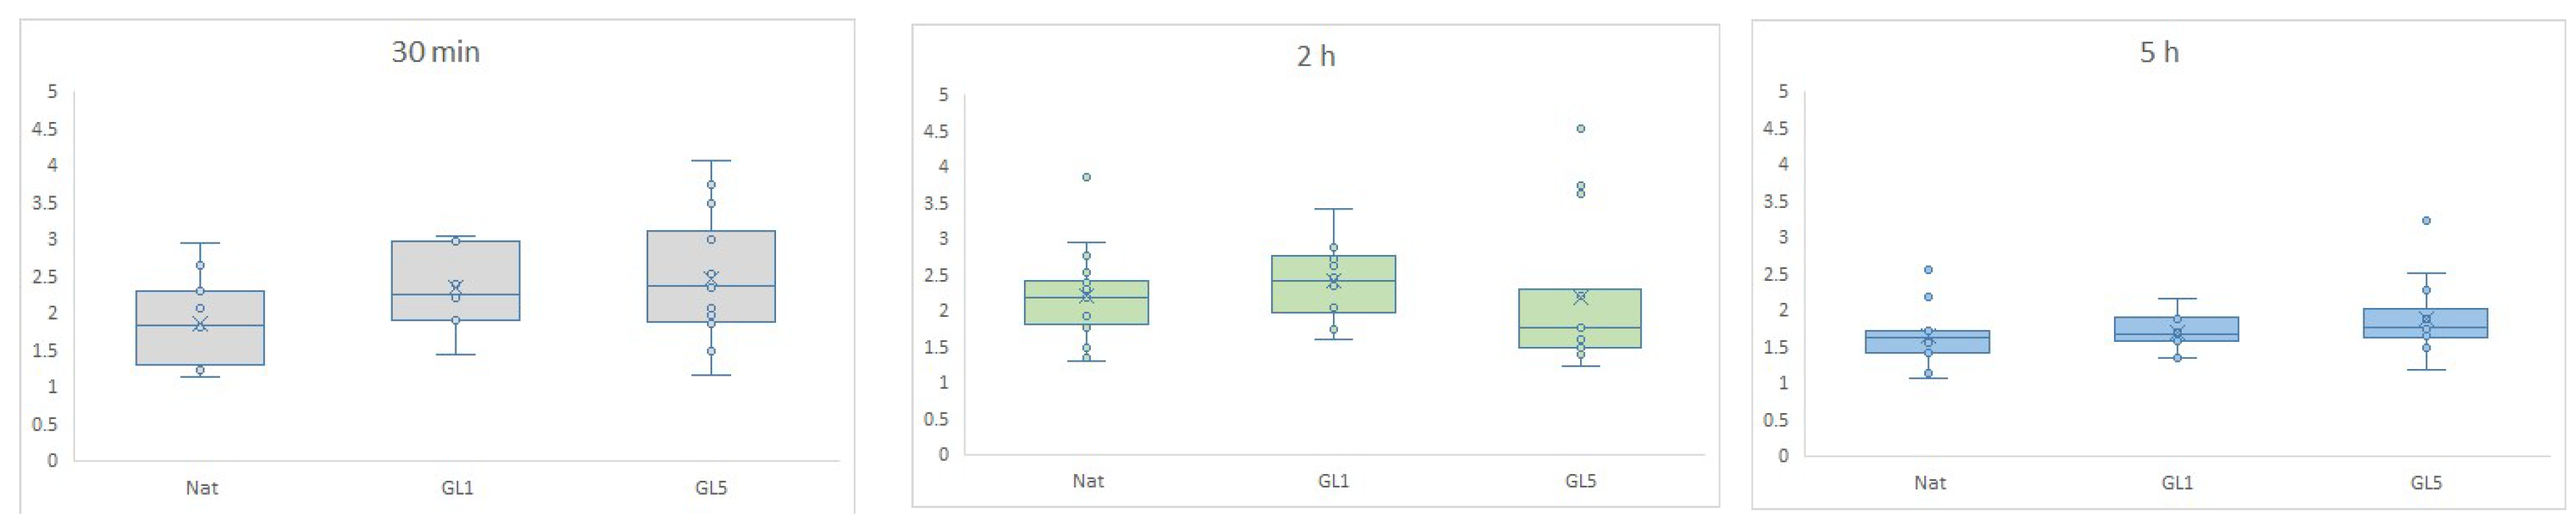
The graphs depict YAP/TAZ nuclear accumulation, quantified as the ratio of fluorescence intensity between the nuclear region of interest (ROI) and the cytosolic ROI. Box-and-whisker plots illustrate the distribution of nuclear signaling efficiency, showing the median and interquartile range (IQR). Comparisons were performed across native collagen (control), GL-1 (1-day glycated), and GL-5 (5-day glycated) substrates at three time points: 30 minutes (grey), 2 hours (light green), and 5 hours (blue). The significant difference was found between native and GL5 at 30 min, GL1 at 30 min and 5 hours, and GL5 at 30 min and 5 hours.
Figure 7 summarizes the quantitative data, revealing a marked nuclear accumulation of YAP/TAZ during the early adhesion phase (30 minutes), with a particularly strong signal in cells cultured on glycated collagen substrates. This increase corresponds to elevated nuclear-to-cytoplasmic localization ratios, indicative of effective mechanotransduction. In glycated conditions—especially GL1—YAP/TAZ nuclear localization continues to intensify up to 2 hours. In contrast, GL5 substrates show a declining signal beyond this point, which is largely resolved by 5 hours. These findings suggest that glycated collagen induces a rapid and transient activation of YAP/TAZ signaling, peaking during the initial 30-minute adhesion window.
2.4. Morphological Evidence for an Increased Collagen Synthesis of ADMSC on Glycated Collagen
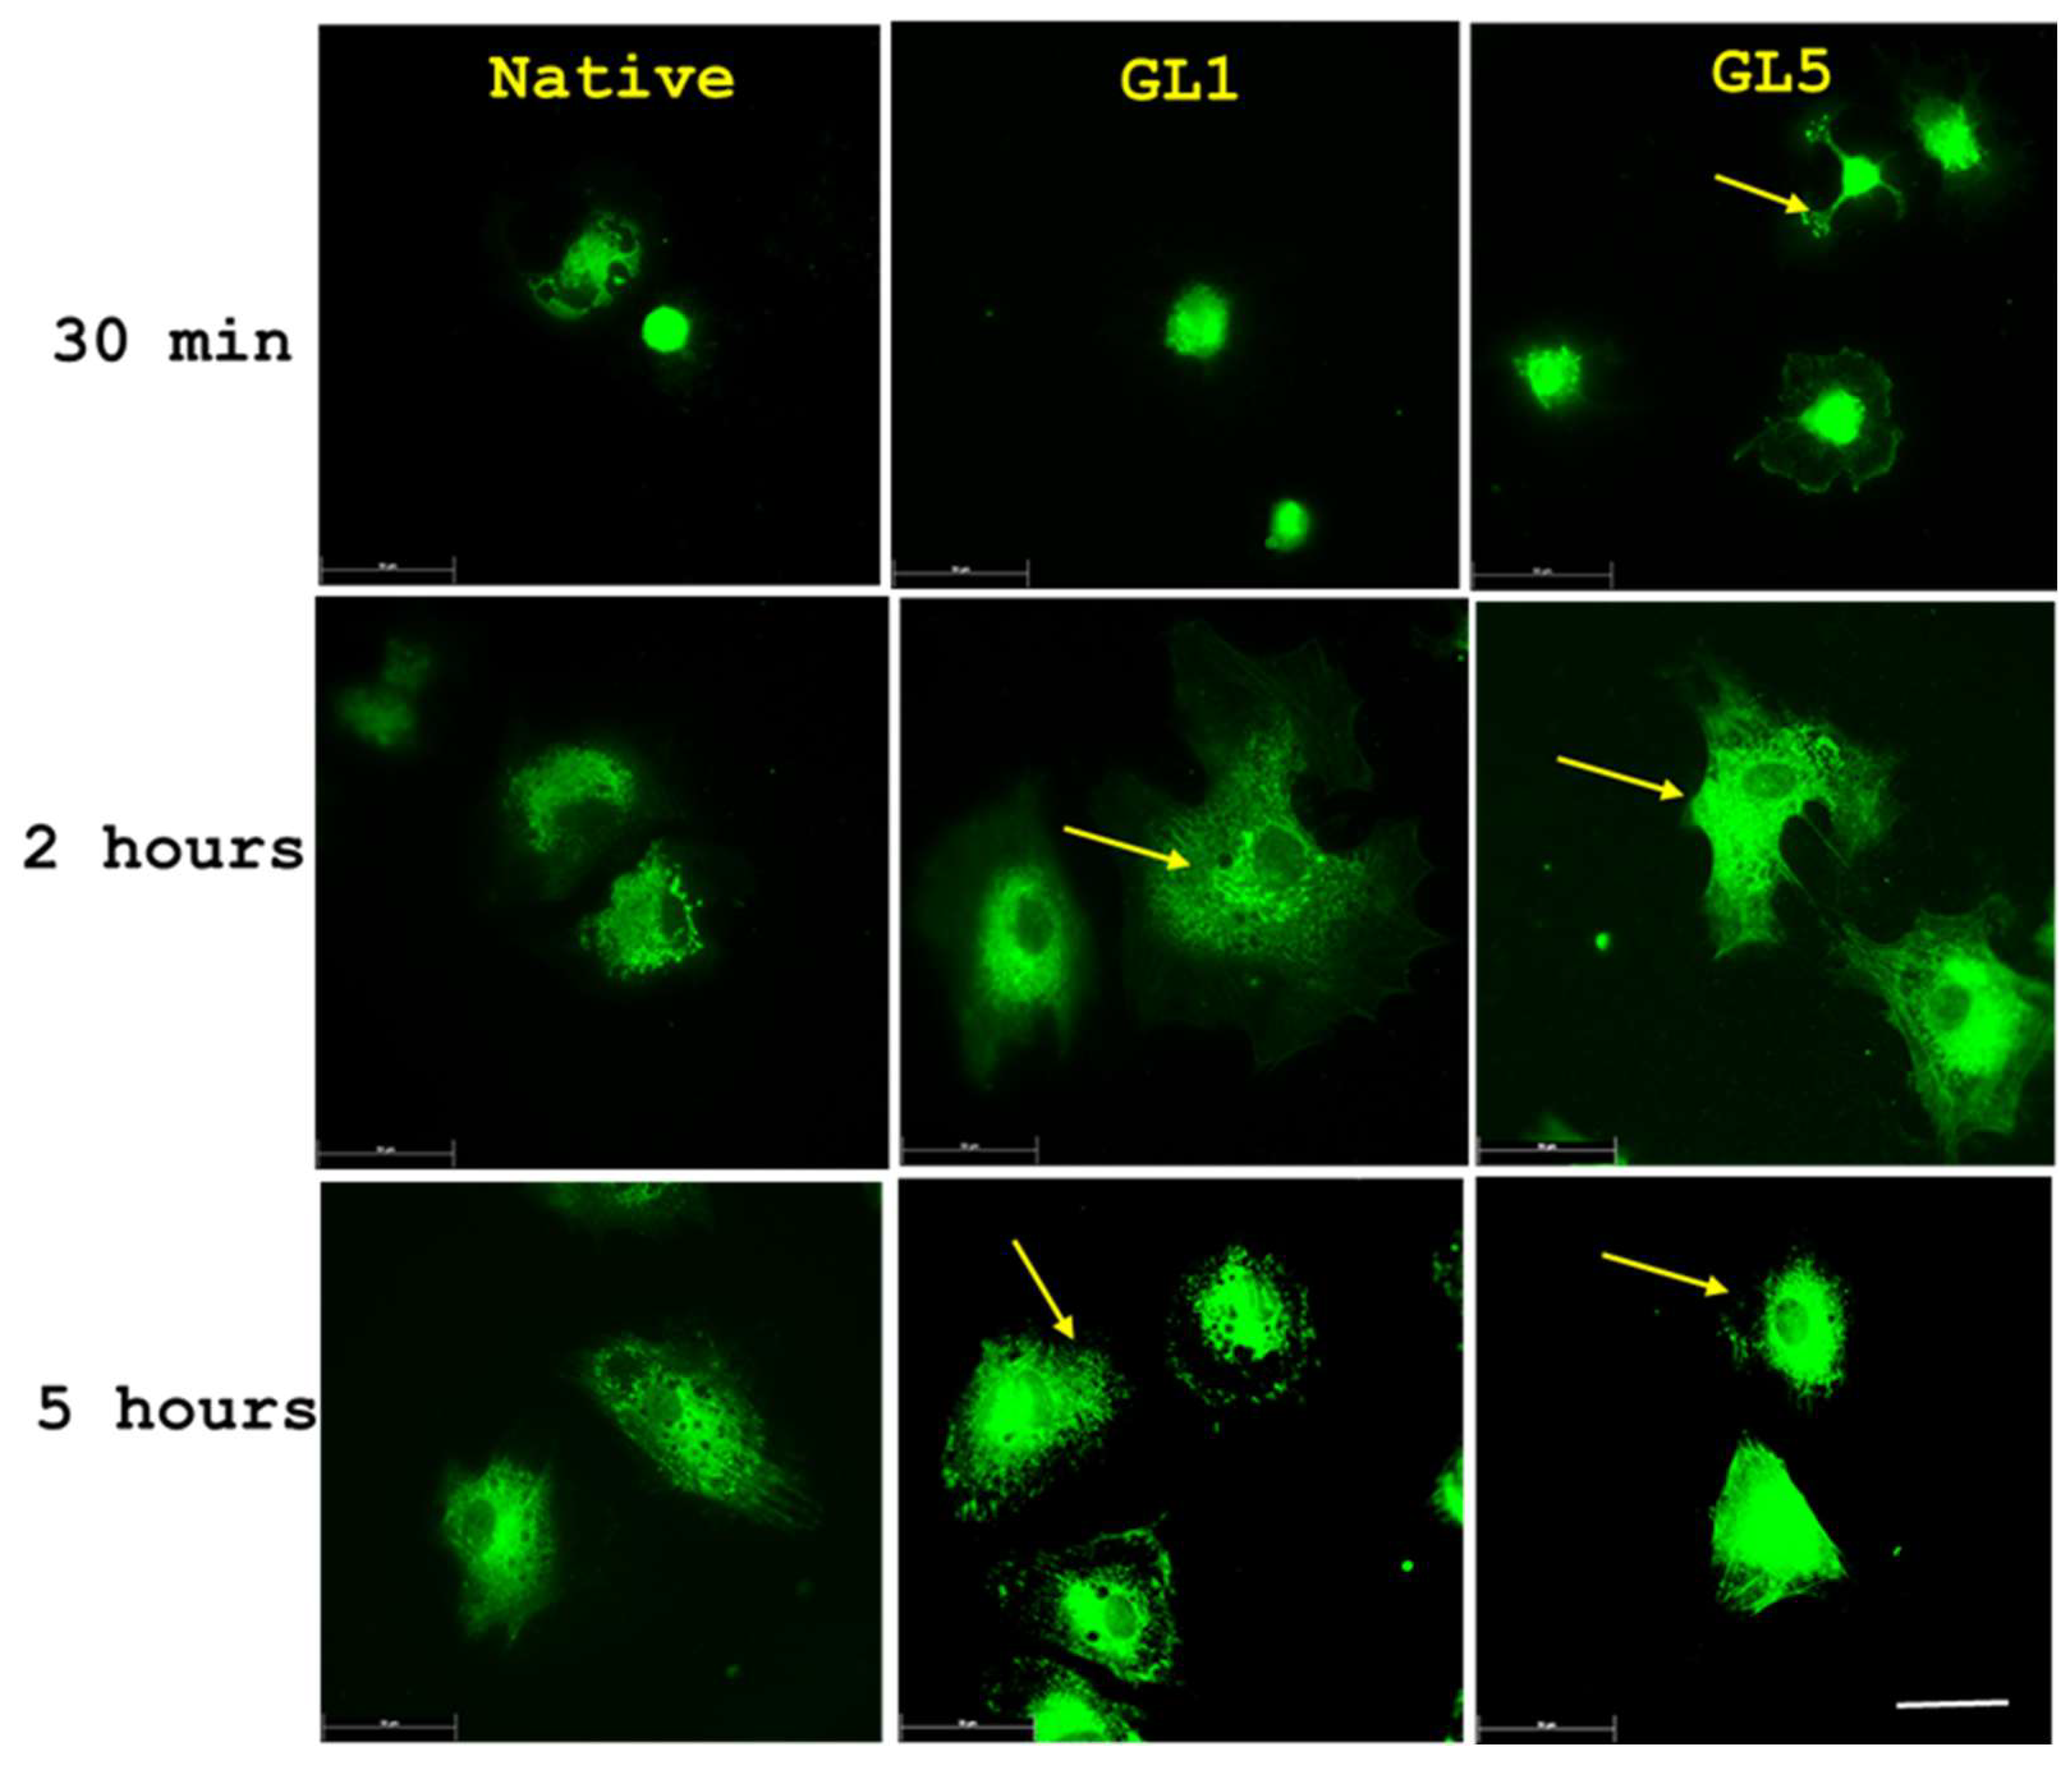
Although enhanced YAP/TAZ signaling was observed in ADMSCs at 30 minutes of adhesion to glycated collagen, this did not correspond to an immediate increase in collagen production, as evidenced by intracellular staining patterns shown in Figure 6. Beginning at the 30-minute time point, ADMSCs exhibited a progressive increase in fluorescence intensity indicative of intracellular collagen content, primarily localized to the perinuclear region—suggestive of various stages of Golgi-mediated processing. Notably, by the 5-hour mark, distinct secretory granules became apparent at the cell periphery (arrows, bottom panel), indicating active endogenous collagen secretion. These findings suggest that collagen synthesis and secretion may proceed independently of early YAP/TAZ activation.
Figure 8.
Human collagen type I synthesis by ADMSCs on native and glycated collagen substrates. ADMSCs were cultured serum-free for 30 minutes, 2 hours, and 5 hours on native collagen and glycated collagen matrices prepared for 1 day (GL1) or 5 days (GL5). Afterwards, the cells were fixed and stained with an anti-human collagen type I antibody, followed by a green fluorescent anti-rabbit secondary antibody. Arrows highlight the perinuclear accumulation of collagen-containing vesicles. Scale bar: 50 μm.
To validate this trend, we further analyzed endogenous collagen content at the same time points of ADMSC adhesion to native and glycated collagen substrates. The graph in Figure 9 summarizes the data on the quantification of total collagen content per cell as viewed by a monoclonal antibody followed by a fluorescently labeled secondary antibody. Cells were incubated for 30 minutes, 2 hours, and 5 hours, and collagen content was assessed via ImageJ software.
Figure 9.
Quantification of the endogenous collagen fluorescence in individual ADMSCs.
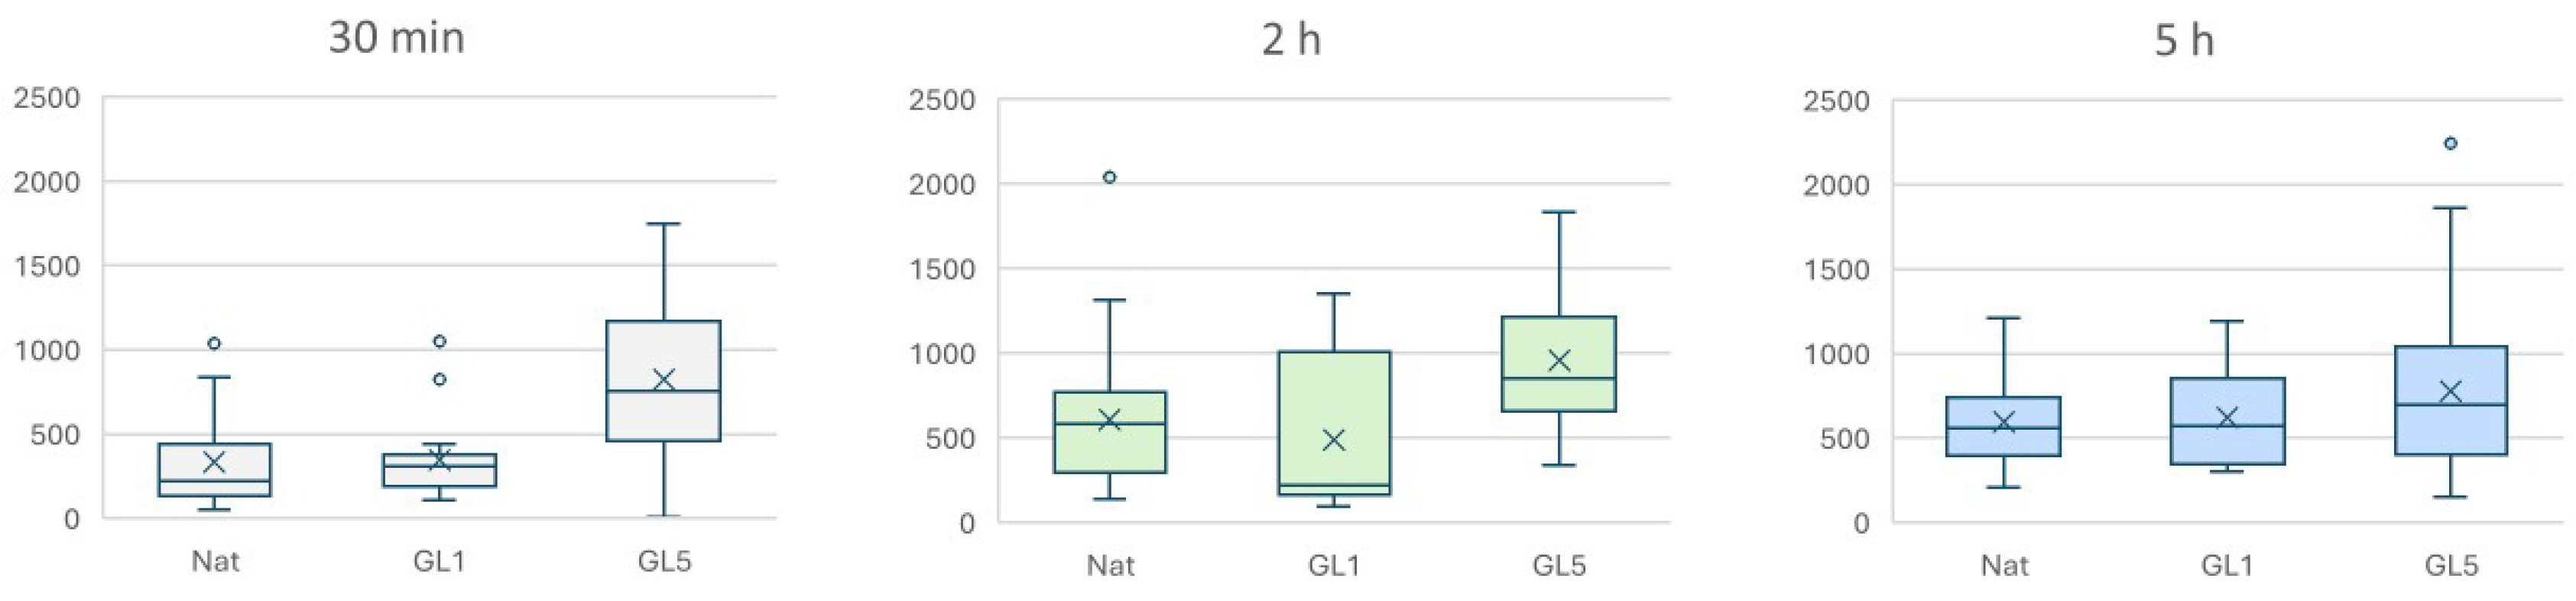
ADMSCs were cultured under the same conditions as described in Figure 8. Following incubation, cells were fixed and immunostained using an anti-human collagen type I primary antibody, with visualization achieved via a green-fluorescent goat anti-rabbit secondary antibody. Fluorescence intensity, expressed as Arbitrary Photometric Units (APU) per cell, was quantified using ImageJ software. Box-and-whisker plots represent the intensity of endogenous collagen fluorescence in AU (Arbitrary Units), displaying the median, interquartile range (IQR), and full data spread. Comparisons were made across native collagen (control), GL-1 (1-day glycated), and GL-5 (5-day glycated) substrates at three time points: 30 minutes (grey), 2 hours (light green), and 5 hours (blue).
As shown in Figure 9, the intensity of the endogenous collagen signal increases with prolonged incubation, in a comparable ratio under both native and glycated conditions, and appearing to peak around the 2-hour mark. Notably, GL5 consistently displays higher fluorescence than GL1, with nearly double the signal at 30 minutes and a sustained, though attenuated, difference at 2 and 5 hours.
2.5. AFM Studies of Glycated Collagen
Cell adhesion may strongly depend on the geometry of the underlying substratum and the positional cues that ADMSCs can recognize there, which can be relatively easily studied by Atomic Force Microscopy (AFM). Typical AFM images of collagen films deposited onto mica supports, obtained from solutions of native and glycated collagens, along with corresponding cross-sectional profiles, are presented in Figure 10. These images reveal strict differences in morphology, network formation, and fibril structure upon glycation of collagen
Figure 10A depicts a typical self-assembled collagen network on mica, demonstrating the characteristic fibrillar morphology of native collagen. More specifically, for the morphology of the film from native collagen in Figure 10A, one can identify a well-defined network of long, interconnected fibrils. The fibrils are relatively uniform in width and appear to be well-assembled (Figure 10A). The height profile (bottom graph) reveals significant vertical variations, indicating distinct fibrils rising above the scanned surface. Considering the network density, it appears to be relatively dense, with good surface coverage, as evidenced by the surface roughness measurements, which yield average values of Furthermore, section analysis, as shown in the profile of Figure 10A, indicates collagen fibril heights of , and widths ranging from tens to hundreds of nanometers, consistent with typical collagen fibril sizes measured by AFM [33].
In Figure 10B, a representative film of GL1 glycated collagen on a mica substrate is shown, illustrating that glycation (GL1) significantly disrupts the self-assembly of collagen into well-defined fibrils. This suggests that glycation interferes with normal fibrillogenesis, likely by altering the protein’s structure and hindering proper intermolecular interactions. The morphology of the film reveals a much sparser distribution of collagen compared to native collagen (Figure 10A). During the self-assembly process on the mica surface, some regions remain uncovered, appearing as round, substrate-exposed areas. Additionally, there are fewer distinct fibrils, and the surface appears more aggregated and less organized. The height profile exhibits reduced variation, indicating a flatter surface with fewer prominent features. Indeed, the estimated surface roughness is nearly half that of the native collagen sample, with an Rₐ value of 0.6 nm. As seen in the image, the collagen network is sparse and poorly developed. Fibril dimension measurements further confirm that the fibrils are smaller and less defined than those in the native sample, with diameters ranging approximately from 1 to 2 nm.
Figure 10C clearly shows that glycation in the GL5 sample also disrupts collagen self-assembly, but perhaps to a lesser extent than in the GL1 sample. This suggests that the degree of glycation or the specific glycation sites might influence the extent of disruption in collagen fibrillogenesis [34]. Analysing the morphology of the film, one can argue that a network is more developed than that of the GL1 sample, but it is still less organised and has less fibrillar structure compared to the native collagen sample. The film remains clumped and aggregated, yet discernible fibrillar structures are apparent, as the profile demonstrates. Notably, the estimated roughness, measured as aligns more closely with native collagen and has a higher roughness than the GL1 sample. Also, the network looks denser compared to the GL1 sample, but less dense than the native collagen sample. Fibril dimensions range roughly to 4 nm, and their features are larger and more defined than those of the GL1 sample, suggesting a better degree of fibril formation. However, they are still less organized than the fibrils of native collagen.
3. Discussion
This study reveals a dual mechanism of adhesion in adipose-derived mesenchymal stem cells (ADMSCs) interacting with collagen substrates, particularly under conditions of glycation. Our data support the existence of two temporally distinct adhesion pathways: a rapid, RAGE-mediated mechanism active within the first 30 minutes, and a slower, integrin-dependent process that dominates at later stages. This duality is consistent with findings of Olson et al., 2024 [45], who demonstrated that advanced glycation end-products (AGEs) disrupt integrin signaling while promoting RAGE-dependent adhesion and differentiation in myoblasts.
Emerging evidence underscores the pivotal role of the YAP/TAZ signaling axis as a central intracellular mechanism governing cellular behavior in response to mechanical stimuli [26,27]. The activity of this pathway is tightly regulated by the Hippo signaling cascade. When the Hippo pathway is active, YAP/TAZ undergo phosphorylation, resulting in their cytoplasmic retention and subsequent proteasomal degradation [3,35], reflected by a lower nuclear to cytosolic ratio. In contrast, suppression of Hippo signaling permits the nuclear translocation of unphosphorylated YAP/TAZ, where they associate with TEA domain (TEAD1–4) transcription factors to drive the expression of genes involved in proliferation, survival, and differentiation [36,38]. The temporal overlap between RAGE engagement and YAP/TAZ activation suggests a functional link between these signaling axes. In our study, YAP/TAZ nuclear localization peaked during early adhesion (30 min), coinciding with enhanced attachment to glycated collagen. This activity diminished at later time points (2–5 h), when focal adhesions matured and integrin signaling became dominant. [37] similarly reported that YAP/TAZ activity in mesenchymal stem cells is tightly regulated by ECM composition and mechanical cues, with collagen deposition enhancing integrin-mediated mechanotransduction. Our findings extend this concept by suggesting that RAGE signaling may serve as an alternative mechanosensitive pathway during early adhesion events.
Glycation of collagen significantly altered the adhesion profile of ADMSCs. Glycated substrates accelerated early adhesion, likely via RAGE signaling, while attenuating focal adhesion formation, as evidenced by reduced vinculin-positive structures. These observations align with the work of Lucas Olson and colleagues [38], who showed that AGE-modified collagen suppresses integrin expression and cytoskeletal organization, while RAGE agonists such as S100b can restore adhesion and differentiation. The attenuation of integrin-mediated adhesion on glycated substrates may reflect structural changes in the ECM that impair classical adhesion receptor engagement.
Interestingly, endogenous collagen synthesis, quantified via immunofluorescence, appeared to be a constitutive process, active during both early and late adhesion phases. As shown in Figure 9, the intensity of the endogenous collagen signal increased approximately twofold with prolonged incubation, reaching a comparable ratio under both native and glycated conditions, and appearing to peak around the 2-hour mark. Notably, GL5 consistently displayed higher fluorescence than GL1, with nearly double the signal at 30 minutes and a sustained, though attenuated, difference at 2 and 5 hours. These findings indicate that while endogenous collagen synthesis proceeds in a largely constitutive manner, it remains responsive to the glycation status of the surrounding matrix, particularly under highly glycated conditions such as those in Gl5. Its expression did not correlate directly with YAP/TAZ activity, suggesting that collagen production in ADMSCs may be regulated independently of Hippo pathway dynamics. This biphasic response may reflect differential cellular adaptation to substrate integrity and mechanical feedback.
AFM analysis revealed substantial disruption of collagen self-assembly upon glycation. Native collagen formed dense, interconnected fibrillar networks, whereas GL1 samples exhibited sparse, disorganized structures. GL5 matrices displayed intermediate morphology, with partial fibril formation and increased aggregation. These structural alterations likely contribute to the observed changes in adhesion dynamics and mechanosensitive signaling. Similar conclusions were drawn in our previous study [10], where we demonstrated for the first time that glycation not only impairs collagen architecture but also modulates stem cell behaviour under both static and dynamic conditions.
Taken together, our findings suggest that glycation-induced modifications of collagen not only alter its physical properties but also redirect MSC adhesion mechanisms toward RAGE-dependent pathways, with downstream effects on YAP/TAZ signaling and matrix remodeling. These insights have implications for regenerative medicine and pathologies such as diabetes and aging.
4. Materials and Methods
4.1. Collagen Procedures
4.1.1. Collagen Preparation
Nearly pure Collagen type I was produced from rat tail tendon by acetic acid extraction and salting out with NaCl, as described elsewhere [39]. The pellets were collected by centrifugation at 4000 rpm at 4 °C for 30 min, redissolved in 0.05 M acetic acid, and dialyzed to remove the excess NaCl. Thus, an approximately monomolecular composition of rat tail collagen (RTC) solution was prepared, in which the collagen content approached 100% of the total dry mass. All procedures were performed at 4 °C. The collagen concentration in the solutions was measured by the modified Lowry assay [40] and by optical absorbance at 220–230 nm [41].
4.1.2. Preparation of Glycated Collagen
Collagen type I obtained from rat tail tendon - RTC (2 mg/mL) was pre-glycated by incubation with 500 mM of glucose solution (Merck, Rahway, NJ, USA) in PBS at pH 7.4, containing 0.02% NaN3 for 1 and 5 days at 37 °C as described elsewhere [18]. The samples were dialysed against 0.05 M acetic acid, then designed as RTC GL1 and RTC GL5, respectively, and stored at 4 °C until use.
4.2. Cells
Human adipose tissue-derived mesenchymal stem cells (ADMSC) of passage two were received from Tissue Bank BulGen (Sofia, Bulgaria), prepared after obtaining regular volunteers’ written consent before liposuction. The cells were maintained in DMEM/F12 medium containing 1% GlutaMAX™, 1% Antibiotic-Antimycotic solution, and 10% fetal bovine serum (FBS), all purchased from Sigma Aldrich (St. Louis, MO, USA). The medium was replaced every two days until the cells reached approximately 90% confluency and were used for the experiments up to the seventh passage. For each experiment, the viability of ADMSCs was verified by trypan blue exclusion testing at the time of harvesting. Over 85% vitality was accepted as permissible for each experiment.
4.2.1. Morphological Studies
For the morphological observations, collagen (100 μg/mL) dissolved in 0.05 M acetic acid was used to coat regular glass coverslips (12 × 12 mm, ISOLAB Laborgeräte GmbH, Eschau, Germany), via incubation for 60 min at 37 °C placed in 6-well TC plates (Sensoplate, Greiner Bioone, Meckenheim, Germany). After 3 washes with PBS, the cells were seeded at density 5 × 10⁴ cells/well in the final volume of 3 mL serum-free medium before being incubated for 30 min, 2 h and 5 h. At the 2nd hour, 10% FBS was added. The initial cell adhesion and morphology were studied at above time frame, first under phase contrast at magnification 20 × using an inverted microscope, Leica DM 2900, and further incubated before being processed for immunofluorescent staining and morphometric analysis, as follows in two protocols, as follows:
4.2.1.1. First Protocol (cell Spreading and FA Formation)
After incubations (30 min., 2 or 5 h), the triplet samples were fixed with 4% paraformaldehyde and permeabilized with 0.5% Triton X-100 before saturation with FBS and further fluorescence staining. Green fluorescent Alexa fluorTM 444 Phalloidin (Invitrogen, Thermo Fisher Scientific Inc Branchburg, NJ, USA) was used to visualize the actin cytoskeleton, while the cell nuclei were stained by Hoechst 33342 (dilution 1:2000) (Sigma-Aldrich/Merck KGaA Darmstadt, Germany). Focal adhesions were viewed with Anti-Vinculin Mouse Monoclonal Antibody (Clone: hVIN-1, Thermo Fisher Scientific, Waltham, MA, USA) IgG (1:150) followed by fluorescent Alexa Fluor 555 conjugated goat anti-mouse IgG (minimal x-reactivity) antibody (provided by Sigma-Aldrich), used at a dilution of 1:100.
4.2.1.2. Second Protocol (YAP/TAZ Signaling Events)
To follow the YAP/TAZ signaling events, separate samples from the same series were stained with a rabbit polyclonal anti-TAZ antibody followed by red fluorescent Alexa FluorTM 555 goat anti-rabbit antibody (both provided by Sigma-Aldrich) and used in dilution 1:100, further counterstained with Hoechst 33342 (to view nuclei) and green fluorescent Phalloidin (Sigma-Aldrich, Darmstadt, Germany) to view actin cytoskeleton, using dilutions as above. Finally, all samples were mounted upside down on glass slides with Mowiol and viewed on Olympus, THUNDER Imager Live Cell, Leica fluorescent microscope (Olympus Corporation, Shinjuku Ku, Tokyo, Japan) with a 20x objective. To determine the overall cell shape, the CellProfiler software[42,43] was used. A minimum of three representative images were obtained for each sample. The respective image processing software merged the different colours. All experiments were quadruplicated. Box-and-whisker plots were used to display a YAP/TAZ dataset’s distribution.
4.2.1.3. Overall Cell Morphology and Focal Adhesion Formation
After 30 min and 2 or 5 h of incubation, the samples were fixed with 4% paraformaldehyde and permeabilized with 0.5% Triton X-100 prior to fluorescence staining. Green fluorescent Alexa fluorTM 488 Phalloidin (Invitrogen, Thermo Fisher Scientific Inc, Branchburg, NJ, USA) was used to visualise the actin cytoskeleton. The cell nuclei were stained with Hoechst 33342 (dilution 1:2000) (Sigma-Aldrich/Merck KGaA, Darmstadt, Germany). Focal adhesions were viewed with Anti-Vinculin Mouse Monoclonal Antibody (Clone: hVIN-1, Thermo Fisher Scientific, Waltham, MA, USA) IgG in dilution 1:150, followed by fluorescent Alexa Fluor 555 conjugated goat anti-mouse IgG antibody used in dilution 1:100 (both provided by Sigma-Aldrich).
4.2.1.4. Quantitative Morphometry Analysis of Raw Format Images by ImageJ
All image analyses were performed per cell using ImageJ 1.54g software version, which provides a wide range of processing and analysis approaches [44]. The fluorescence intensity was measured from raw format images of cells (at 20X magnification), captured from at least three separate images under the same conditions. Pixel-based treatments were performed to highlight the regions of interest (ROIs) and allow the removal of artefacts. A default black-and-white threshold was used in the segmentation module. Images of equal sizes (W: 1600 px/H: 200 px) were examined, and four metrics were acquired, namely, cell spread area (CSA), cell shape index (SCI), and aspect ratio (AR). For that purpose, the individual cellular domains were determined by generating binary masks using Otsu’s intensity-based thresholding method from 20X fluorescent actin images. Cellular masks were then used to calculate ADMSC SA, CSI, and AR. The CSI was calculated using the formula
where A is the mean cell area, and P is the mean cell perimeter.
CSI = 4π × A/P2
With this metric, a line takes a CSI value of 0 (indicating an elongated polygon) or 1 (indicating a circle). AR was calculated as the ratio of the cell’s largest to its smallest side. These morphometric data relating to all experimental conditions, including the number of cells examined, are summarized in Table 2.
4.2.1.5. Quantification of Intracellular Collagen Content
A total of 2 × 10⁴ ADMSCs were seeded onto sterile 22 × 22 mm glass coverslips pre-coated with rat tail collagen (as described above) and cultured under serum-free conditions for 30 minutes, 2 hours, or 5 hours in 6-well tissue culture plates. For collagen detection, cells were fixed with 4% paraformaldehyde and permeabilized using 0.5% Triton X-100. Non-specific binding sites were blocked with 5% bovine serum albumin (BSA). Samples were then incubated with a mouse monoclonal anti-human collagen type I antibody (Sigma Aldrich, 1:200 dilution) for 1 hour at room temperature, followed by a green-fluorescent Alexa Fluor™ 488-conjugated anti-mouse secondary antibody (Invitrogen, Thermo Fisher Scientific Inc., Branchburg, NJ, USA). Nuclear counterstaining was performed using Hoechst 33342 (1:200 dilution; Sigma-Aldrich/Merck KGaA, Darmstadt, Germany). Fluorescence imaging was conducted using an inverted fluorescence microscope Olympus, THUNDER, as above, and collagen expression was quantified with ImageJ software. Box-and-whisker plots were used to represent the dataset’s distribution of endogenous human collagen. Box-and-whisker plots were used to display a YAP/TAZ dataset’s distribution.
4.3. Atomic Force Microscopy of Glycated Collagen
4.3.1. Sample Preparation
For Atomic Force Microscopy (AFM) imaging, a solution from native or glycated collagens (GL1 and GL5) was deposited onto freshly cleaved, square mica sheets (Structure Probe Inc./SPI Supplies, West Chester, PA, USA) that were adhered to metal pads. Approximately 100 µL of the collagen solution was applied to the mica support. After a 15-minute incubation, the samples were washed with water, PBS, and water, thoroughly dried under a stream of nitrogen gas, and then transferred for AFM imaging.
4.3.2. AFM Imaging
AFM imaging was performed using a NanoScope V system (Bruker Inc., USA) in tapping mode under ambient air conditions. Standard silicon nitride (Si3N4) probe tips (BudgetSensors; Innovative Solutions Ltd., Bulgaria) with a tip radius of less than 10 nm were used. Samples were scanned at a rate of 1 Hz. Each sample was examined at 3 to 5 randomly selected locations across the mica surface. Images (512 x 512 pixels) were acquired in both height and phase modes.
4.3.3. Morphological Characterisation
Morphological characterisation, including the determination of height, spreading area, and average roughness of the films containing the collagen fibrils, was performed using Bruker NanoScope Analysis 1.3 software. Roughness analysis was conducted as described elsewhere [45].
4.4. Statistical Analysis
All experiments were conducted in at least three independent series per group. Since the morphometry parameters were not normally distributed (as confirmed by Levene’s test), a one-way ANOVA on ranks (Kruskal–Wallis test) was used as more appropriate for comparisons between subgroups of cells adhering to native and glycated collagen.
Subgroup differences in NAT (RTC), GL1, and GL5 samples were studied using Dunn’s test. Box-and-whisker plots, a visual tool that displays a dataset’s distribution using its five-number summary: minimum, first quartile (Q1), median (Q2), third quartile (Q3), and maximum, were used for a dataset of YAP TAZ and endogenous human collagen presentation. Significance is indicated by asterisks (*), corresponding to p < 0.05, or (**) corresponding to p < 0.01. visual tool that displays a dataset’s distribution using its five-number summary: minimum, first quartile (Q1), median (Q2), third quartile (Q3), and maximum.
Author Contributions
Conceptualization, G.A.; methodology G.A. and R.K.-P.; collagen glycation; cell culture and morphometry investigation, B.D., V.,I., S.S. K.B. and P.T.; data curation, B.D., V.I., P.T., S.S.; writing original draft preparation, G.A.; writing and editing, G.A. and R.K.-P.; super-vision, G.A.; resources, G.A., and R.K-P. All authors have read and agreed to the published version of the manuscript.
Funding
This research was co-funded by the project BG16RFPR002-1.014-0002-С001 “Centre of competence in personalized medicine, 3d and telemedicine, robotic assisted and minimally invasive surgery” supported by the PRIDST 2021-2027 and co-funded by the EU, in particular for collagen preparation, collagen synthesis investigation and preparation of samples for AFM measurements. . This research was co-funded by the European Union NextGeneration EU through the National Recovery and Resilience Plan of the Republic of Bulgaria, project BG-RRP-2.004-0003, in particular for cell culture, immunofluorescence experiments, and collagen glycation.
Institutional Review Board Statement
This study was conducted according to the guidelines of the Declaration of Helsinki and approved by the Institutional Ethics Committee of Medical University—Pleven (approval 745-KENID 05/06/23).
Data Availability Statement
The original contributions presented in this study are included in the article. Further inquiries can be directed to the corresponding author.
Acknowledgments
We acknowledge support through Leonardo da Vinci Centre of Competence in Personalised Medicine, 3D and Telemedicine, Robotic and Minimally Invasive Surgery, Pleven, Bulgaria.
Conflicts of Interest
The authors declare no conflicts of interest.
Abbreviations
| AD-MSCs | Adipose-Derived Mesenchymal Stem Cells |
| RTC | Rat Tail Collagen |
| FBS | Fetal Bovine Serum |
| MSCs | Mesenchymal Stem Cells |
| ECM | Extracellular Matrix |
| PBS | Phosphate Buffered Saline |
| CSA | Cell Spreading Area |
| CAR | Cell Aspect Ratio |
| CSI | Cell Shape Index |
| RAGE | Receptor for Advanced Glycation End-products |
| YAP | Yes-Associated Protein |
| TAZ | Transcriptional Co-activator with PDZ-binding Motif |
| GL1 | 1 day glycated RTC |
| GL5 | 1 day glycated RTC |
References
- Humphrey, J.D.; Dufresne, E.R.; Schwartz, M.A. Mechanotransduction and extracellular matrix homeostasis. Nat. Rev. Mol. Cell Biol. 2014, 15, 802–812. [CrossRef]
- Mierke, C.T. Extracellular Matrix Cues Regulate Mechanosensing and Mechanotransduction of Cancer Cells. Cells 2024, 13, 96. [CrossRef]
- Vining, K.H.; Mooney, D.J. Mechanical forces direct stem cell behaviour in development and regeneration. Nat. Rev. Mol. Cell Biol. 2017, 18, 728–742.
- Klein, E.A.; Yin, L.; Kothapalli, D.; Castagnino, P.; Byfield, F.J.; Xu, T.; Levental, I.; Hawthorne, E.; Janmey, P.A.; Assoian, R.K. Cell-Cycle Control by Physiological Matrix Elasticity and In Vivo Tissue Stiffening. Curr. Biol. 2009, 19, 1511–1518. [CrossRef]
- Wang, L.; You, X.; Zhang, L.; Zhang, C.; Zou, W. Mechanical regulation of bone remodeling. Bone Res. 2022, 10, 1–15. [CrossRef]
- Kozlova, I.; Sytnyk, V. Cell Adhesion Molecules as Modulators of the Epidermal Growth Factor Receptor. Cells 2024, 13, 1919. [CrossRef]
- Li, D.; Zhou, J.; Chowdhury, F.; Cheng, J.; Wang, N.; Wang, F. Role of Mechanical Factors in Fate Decisions of Stem Cells. Regen. Med. 2011, 6, 229–240. [CrossRef]
- Komsa-Penkova, R.; Alexandrova-Watanabe, A.; Todinova, S.; Ivanova, V.; Stoycheva, S.; Temnishki, P.; Dimitrov, B.; Dimitrov, D.; Tonchev, P.; Georgieva, G.; et al. Adhesion of Mesenchymal Stem Cells to Glycated Collagen—Comparative Analysis of Dynamic and Static Conditions. Polymers 2025, 17, 821. [CrossRef]
- Majhy B., Priyadarshinia P., Sen A. K. Effect of surface energy and roughness on cell adhesion and growth – facile surface modification for enhanced cell culture RSC Adv., 2021, 11, 154674.
- Mouw, J.K.; Ou, G.; Weaver, V.M. Extracellular matrix assembly: a multiscale deconstruction. Nat. Rev. Mol. Cell Biol. 2014, 15, 771–785. [CrossRef]
- Heino, J. Cellular signaling by collagen-binding integrins.Adv Exp Med Biol 2014;819:143-55.
- Zeltz C, Gullberg DJ, The integrin-collagen connection - a glue for tissue repair? Cell Sci. 2016 Mar 15;129(6):1284.
- Komsa-Penkova, R.; Dimitrov, B.; Todinova, S.; Ivanova, V.; Stoycheva, S.; Temnishki, P.; Georgieva, G.; Tonchev, P.; Iliev, M.; Altankov, G. Early Stages of Ex Vivo Collagen Glycation Disrupt the Cellular Interaction and Its Remodeling by Mesenchymal Stem Cells—Morphological and Biochemical Evidence. Int. J. Mol. Sci. 2024, 25, 5795. [CrossRef]
- Myllyharju, J. (2005) Intracellular Post-Translational Modifications of Collagens. In: Brinckmann, J., Notbohm H, Müller, P K (eds) Collagen. Topics in Current Chemistry, vol 247. Springer, Berlin, Heidelberg. [CrossRef]
- Komsa-Penkova, R.; Yordanova, A.; Tonchev, P.; Kyurkchiev, S.; Todinova, S.; Strijkova, V.; Iliev, M.; Dimitrov, B.; Altankov, G. Altered Mesenchymal Stem Cells Mechanotransduction from Oxidized Collagen: Morphological and Biophysical Observations. Int. J. Mol. Sci. 2023, 24, 3635. [CrossRef]
- Mikulíková, K.; Eckhardt, A.; Pataridis, S.; Mikšík, I. Study of posttranslational non-enzymatic modifications of collagen using capillary electrophoresis/mass spectrometry and high performance liquid chromatography/mass spectrometry. J. Chromatogr. A 2007, 1155, 125–133. [CrossRef]
- Li, Z.; Lee, H.; Zhu, C. Molecular mechanisms of mechanotransduction in integrin-mediated cell-matrix adhesion. Exp. Cell Res. 2016, 349, 85–94. [CrossRef]
- Lee, J.-H.; Park, H.-K.; Kim, K.S. Intrinsic and extrinsic mechanical properties related to the differentiation of mesenchymal stem cells. Biochem. Biophys. Res. Commun. 2016, 473, 752–757. [CrossRef]
- Sun Z., Guo S. S., Fässler R. Integrin-mediated mechanotransduction. J. Cell Biol. 215, 445–456 (2016).
- Horbett T.A. The role of adsorbed proteins in animal cell adhesion Colloids and Surfaces B: Biointerfaces Vol 2, Issues 1–3, 14 March 1994, Pages 225-240.
- Burridge, K.; Monaghan-Benson, E.; Graham, D.M. Mechanotransduction: from the cell surface to the nucleus via RhoA. Philos. Trans. R. Soc. B: Biol. Sci. 2019, 374, 20180229. [CrossRef]
- Pang, X.; He, X.; Qiu, Z.; Zhang, H.; Xie, R.; Liu, Z.; Gu, Y.; Zhao, N.; Xiang, Q.; Cui, Y. Targeting integrin pathways: mechanisms and advances in therapy. Signal Transduct. Target. Ther. 2023, 8, 1–42. [CrossRef]
- Meng, Z.; Moroishi, T.; Guan, K.-L. Mechanisms of Hippo pathway regulation. Genes Dev. 2016, 30, 1–17. [CrossRef]
- Dupont, S.; Morsut, L.; Aragona, M.; Enzo, E.; Giulitti, S.; Cordenonsi, M.; Zanconato, F.; Le Digabel, J.; Forcato, M.; Bicciato, S.; et al. Role of YAP/TAZ in mechanotransduction. Nature 2011, 474, 179–183. [CrossRef]
- Zinatizadeh, M.R.; Miri, S.R.; Zarandi, P.K.; Chalbatani, G.M.; Rapôso, C.; Mirzaei, H.R.; Akbari, M.E.; Mahmoodzadeh, H. The Hippo Tumor Suppressor Pathway (YAP/TAZ/TEAD/MST/LATS) and EGFR-RAS-RAF-MEK in cancer metastasis. Genes Dis. 2021, 8, 48–60. [CrossRef]
- Halder, G.; Dupont, S.; Piccolo, S. Transduction of mechanical and cytoskeletal cues by YAP and TAZ. Nat. Rev. Mol. Cell Biol. 2012, 13, 591–600.
- Pobbati, A.V.; Hong, W. A combat with the YAP/TAZ-TEAD oncoproteins for cancer therapy. Theranostics 2020, 10, 3622–3635. [CrossRef]
- Sessa, L.; Gatti, E.; Zeni, F.; Antonelli, A.; Catucci, A.; Koch, M.; Pompilio, G.; Fritz, G.; Raucci, A.; E Bianchi, M. The Receptor for Advanced Glycation End-Products (RAGE) Is Only Present in Mammals, and Belongs to a Family of Cell Adhesion Molecules (CAMs). PLOS ONE 2014, 9, e86903. [CrossRef]
- Ramasamy, R.; Yan, S.F.; Schmidt, A.M. Receptor for AGE (RAGE): signaling mechanisms in the pathogenesis of diabetes and its complications. Ann. New York Acad. Sci. 2011, 1243, 88–102. [CrossRef]
- Murillo, J.; Wang, Y.; Xu, X.; Klebe, R.J.; Chen, Z.; Zardeneta, G.; Pal, S.; Mikhailova, M.; Steffensen, B. Advanced Glycation of Type I Collagen and Fibronectin Modifies Periodontal Cell Behavior. J. Periodontol. 2008, 79, 2190–2199. [CrossRef]
- Dandia, H.; Makkad, K.; Tayalia, P. Glycated collagen – a 3D matrix system to study pathological cell behavior. Biomater. Sci. 2019, 7, 3480–3488. [CrossRef]
- Crop, M.J.; Baan, C.C.; Korevaar, S.S.; Ijzermans, J.N.M.; Pescatori, M.; Stubbs, A.P.; Van Ijcken, W.F.J.; Dahlke, M.H.; Eggenhofer, E.; Weimar, W.; et al. Inflammatory conditions affect gene expression and function of human adipose tissue-derived mesenchymal stem cells. Clin. Exp. Immunol. 2010, 162, 474–486. [CrossRef]
- Franz, C.M.; Muller, D.J. (2011). Studying Collagen Self-Assembly by Time-Lapse High-Resolution Atomic Force Microscopy. In: Braga, P., Ricci, D. (eds) Atomic Force Microscopy in Biomedical Research. Methods in Molecular Biology, vol 736. Humana Press. [CrossRef]
- Sloseris, D.; Forde, N.R. AGEing of collagen: The effects of glycation on collagen’s stability, mechanics and assembly. Matrix Biol. 2024, 135, 153–160. [CrossRef]
- Johnson, R.; Halder, G. The two faces of Hippo: targeting the Hippo pathway for regenerative medicine and cancer treatment. Nat. Rev. Drug Discov. 2013, 13, 63–79. [CrossRef]
- Janmey P. A., Wells R. G., Assoian R. K., McCulloch C. A., From tissue mechanics to transcription factors. Differentiation 86, 112–120 (2013).
- Komatsu et al., 2018. Type I collagen deposition via osteoinduction ameliorates YAP/TAZ activity in MSC/ECM complexes Stem Cell Research & Therapy.
- Olson, L.C.; Nguyen, T.M.; Heise, R.L.; Boyan, B.D.; Schwartz, Z.; McClure, M.J. Advanced Glycation End Products Are Retained in Decellularized Muscle Matrix Derived from Aged Skeletal Muscle. Int. J. Mol. Sci. 2021, 22, 8832. [CrossRef]
- Komsa-Penkova, R.; Stavreva, G.; Belemezova, K.; Kyurkchiev, S.; Todinova, S.; Altankov, G. Mesenchymal Stem-Cell Remodeling of Adsorbed Type-I Collagen—The Effect of Collagen Oxidation. Int. J. Mol. Sci. 2022, 23, 3058. [CrossRef]
- Komsa-Penkova, R.; Spirova, R.; Bechev, B. Modification of Lowrys Method for Collagen Concentration Measurement. J. Biochem. Biophys. Methods 1996, 32, 33–43. [CrossRef]
- Kuznetsova, N.; Leikin, S. Does the Triple Helical Domain of Type I Collagen Encode Molecular Recognition and Fiber Assembly while Telopeptides Serve as Catalytic Domains?. J. Biol. Chem. 1999, 274, 36083–36088. [CrossRef]
- McQuin, C.; Goodman, A.; Chernyshev, V.; Kamentsky, L.; A Cimini, B.; Karhohs, K.W.; Doan, M.; Ding, L.; Rafelski, S.M.; Thirstrup, D.; et al. CellProfiler 3.0: Next-generation image processing for biology. PLOS Biol. 2018, 16, e2005970. [CrossRef]
- Stirling, D.R.; E Carpenter, A.; A Cimini, B. CellProfiler Analyst 3.0: accessible data exploration and machine learning for image analysis. Bioinformatics 2021, 37, 3992–3994. [CrossRef]
- Boudaoud, A.; Burian, A.; Borowska-Wykręt, D.; Uyttewaal, M.; Wrzalik, R.; Kwiatkowska, D.; Hamant, O. FibrilTool, an ImageJ plug-in to quantify fibrillar structures in raw microscopy images. Nat. Protoc. 2014, 9, 457–463. [CrossRef]
- Antonio, P.D.; Lasalvia, M.; Perna, G.; Capozzi, V. Scale-independent roughness value of cell membranes studied by means of AFM technique. Biochim. et Biophys. Acta (BBA) - Biomembr. 2012, 1818, 3141–3148. [CrossRef]
Figure 1.
Overall Morphology of ADMSC adhering for 30 min and 2 h on glycated collagen. The cells were cultured for 30 min or 2 h on collagen coated glass slides coated with either native collagen NAT (A) or glycated collagen for 1 day GL1 (B) or 5 days GL5 (C). The cells are stained with FITC phalloidin to view the actin cytoskeleton (green) while nuclei are counterstained with Hoechst (blue). Bar 20 μM.
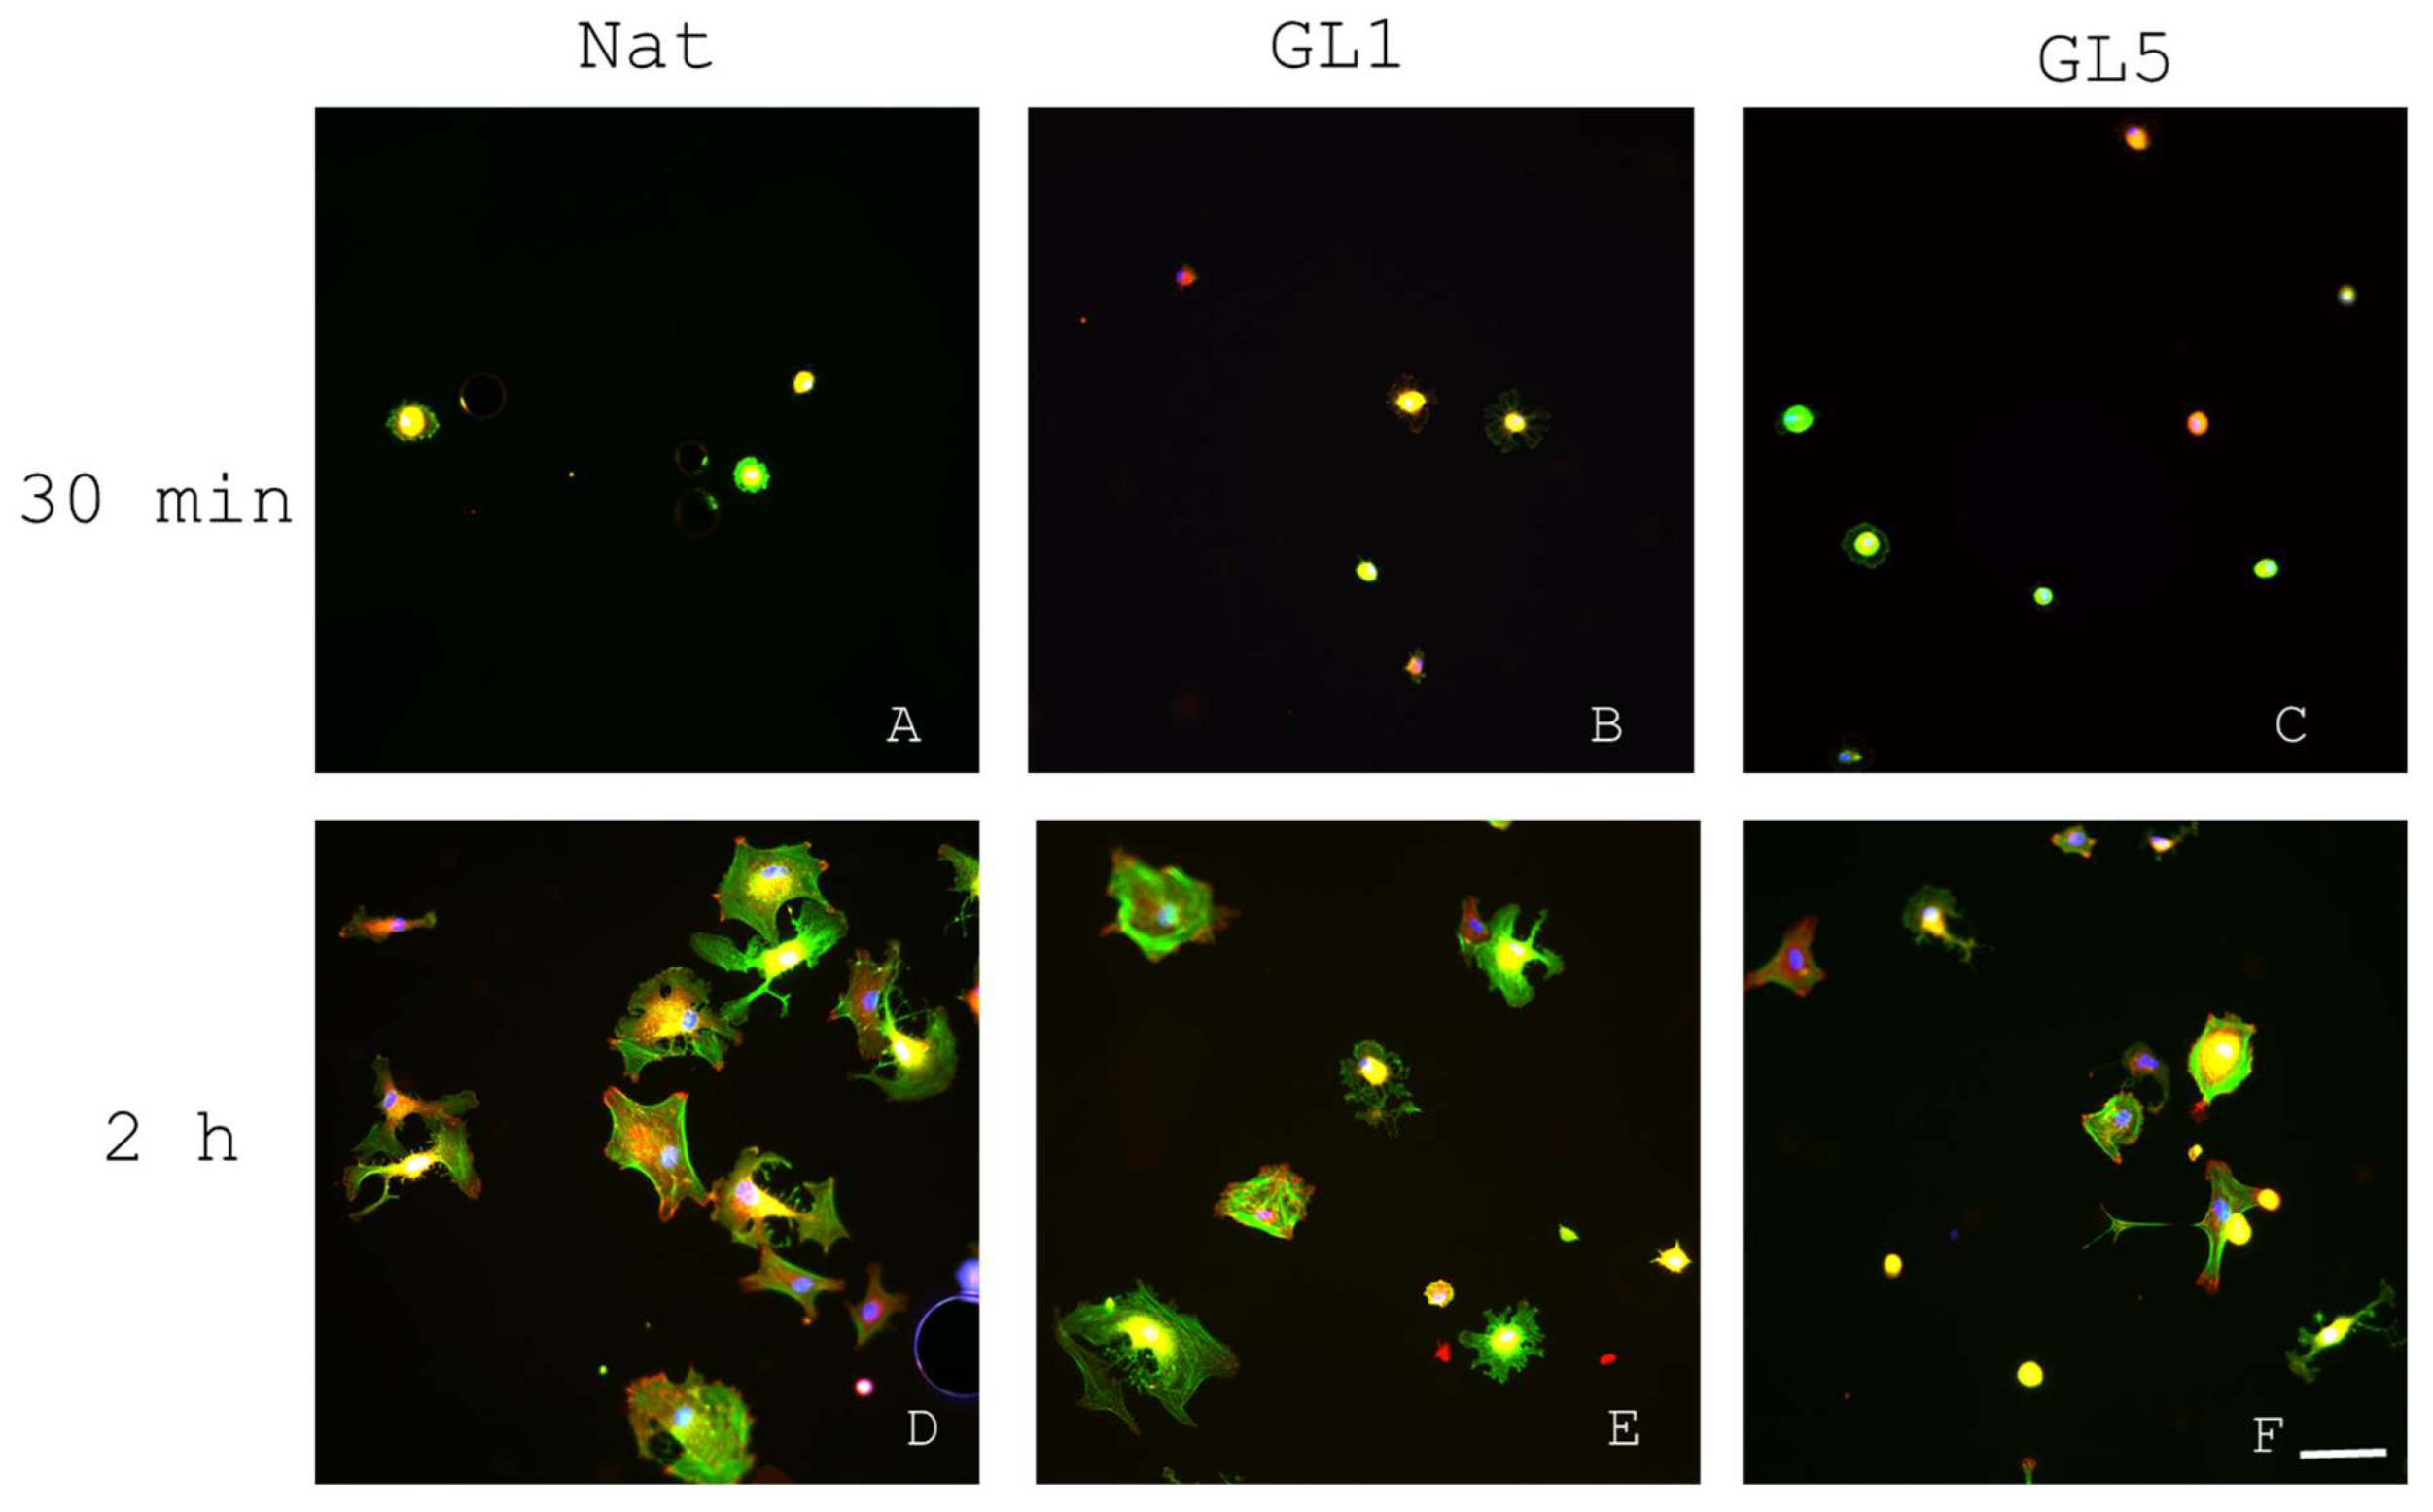
Figure 2.
Quantification of cell adhesion dynamics. The cells were cultured for 30 min and 2 hours, on different collagen substrata, either native (Nat), or glycated GL1 and GL5, as above, then fixed and stained with Hoechst before counting the nuclei in 10 randomly chosen fields at magnification 10X. Data are expressed as mean ± standard deviation (SD), with the number of biological or technical replicates indicated as n. Statistical significance is denoted by asterisks: p < 0.05 (*), and p < 0.01 (**).
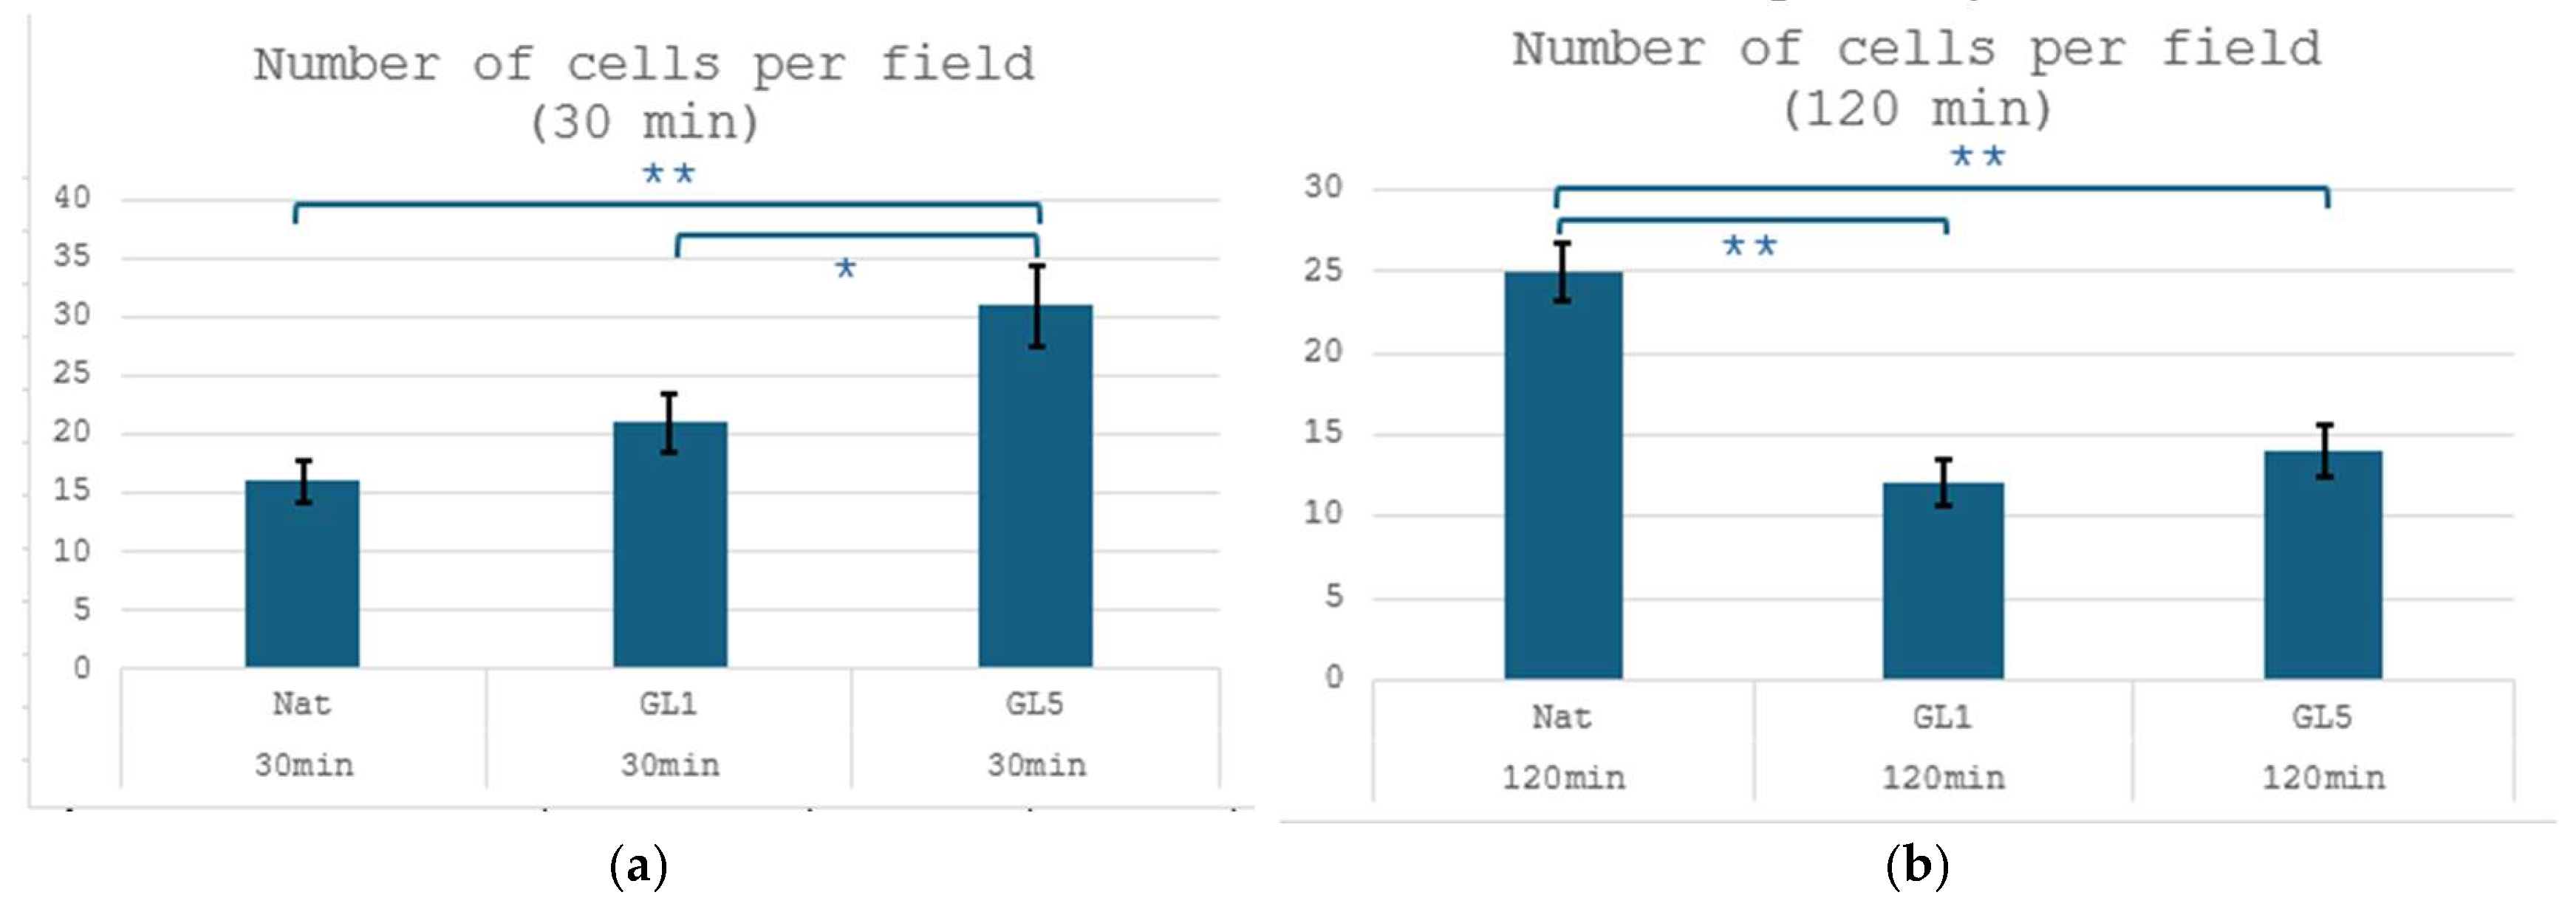
Figure 10.
AFM images illustrating topographical changes and fibril formation in collagen upon glycation. (A) Native collagen, (B) GL1 modified collagen, (C) GL5 modified collagen. Each panel shows a 2D height image with corresponding cross-sectional profiles along the indicated lines. Images were acquired at a 2 x 2 µm scan size with a z-range of 10 nm, providing detailed morphological information and size distributions of the collagen fibrils.
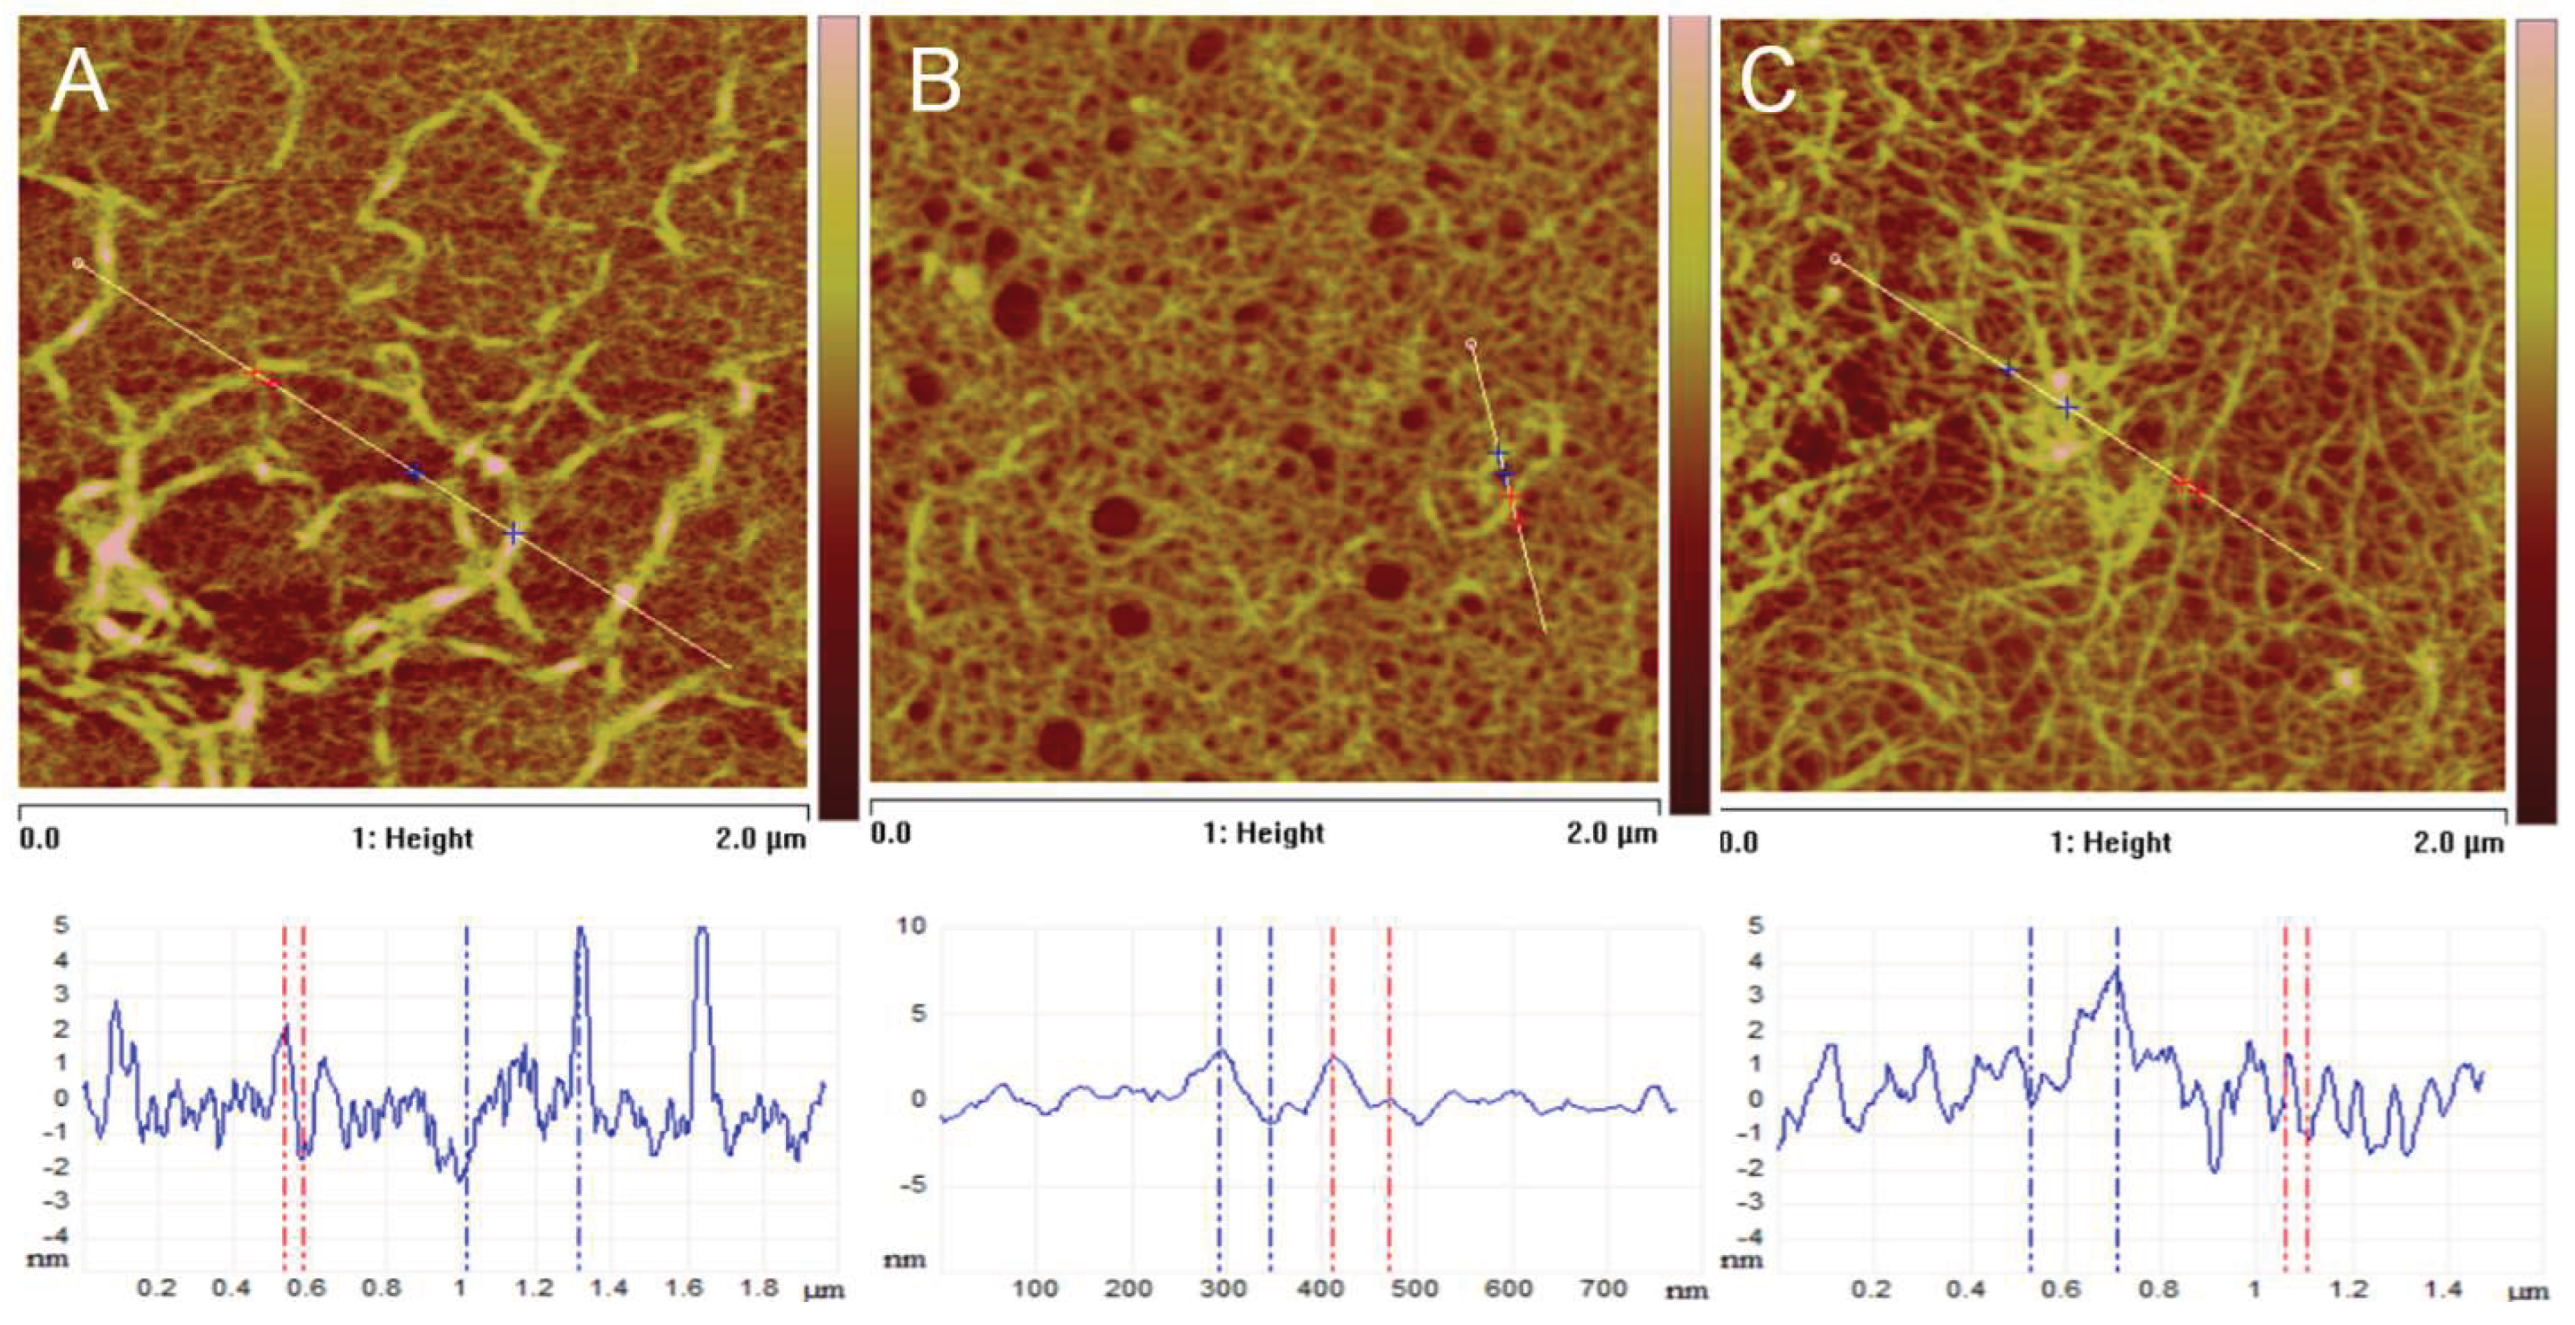

Table 1.
Morphometric quantification of ADMSC spreading efficiency on native (Nat) and glycated collagen substrates (GL1 and GL5). The analysis was conducted at early (30 minutes) and later (2 and 5 hours) adhesion time points. Cells were fixed and stained for actin, vinculin, and nuclei, as in Figure 1. Quantitative morphometric parameters—including mean Cell Spreading Area (CSA, μm2), Perimeter (μm), and Cell Shape Index (CSI)—were calculated using ImageJ software.
| Parameter | Incubation Time | Nat | GL1 | GL5 |
| CSA (μm2) | 30 min | 3165 ± 1926 (n = 11) | 1337 ± 762 (n = 11) | 1326 ± 907 (n = 14) |
| 2 h | 7522 ± 3767 (n = 20) | 5939 ± 4382 (n = 9) | 5454 ± 2717 (n = 12) | |
| 5 h | 7097 ± 3814 (n = 11) | 6663 ± 2440 (n = 12) | 6508 ± 2037 (n = 14) | |
| Perimeter (μm) | 30 min | 225 ± 67 | 144 ± 48 | 136 ± 55 |
| 2 h | 468 ± 206 | 409 ± 216 | 544 ± 198 | |
| 5 h | 607 ± 220 | 724 ± 184 | 854 ± 343 | |
| CSI | 30 min | 0.73 ± 0.18 | 0.79 ± 0.14 | 0.87 ± 0.13 |
| 2 h | 0.48 ± 0.17 | 0.56 ± 0.18 | 0.38 ± 0.12 | |
| 5 h | 0.28 ± 0.17 | 0.23 ± 0.08 | 0.17 ± 0.07 |
Table 2.
Quantification of focal adhesion dynamics at 30 min and 2 hours of incubation.
| Incubation Time | Substrate Type | Number of FAs per Cell | Total Area of FАs per Cell |
| 30 min | Nat | 1 ± 1 | 3.57 ± 0.39 µm2 |
| 30 min | GL1 | 2 ± 1 | 15.14 ± 7.65 µm2 |
| 30 min | GL5 | 2 ± 2 | 15.75 ± 5.04 µm2 |
| 2 h | Nat | 98 ± 29 | 1407.46 ± 542.01 µm2 |
| 2 h | GL1 | 60 ± 12 | 782.08 ± 267.41 µm2 |
| 2 h | GL5 | 51 ± 16 | 492.60 ± 102.39 µm2 |
Disclaimer/Publisher’s Note: The statements, opinions and data contained in all publications are solely those of the individual author(s) and contributor(s) and not of MDPI and/or the editor(s). MDPI and/or the editor(s) disclaim responsibility for any injury to people or property resulting from any ideas, methods, instructions or products referred to in the content. |
© 2025 by the authors. Licensee MDPI, Basel, Switzerland. This article is an open access article distributed under the terms and conditions of the Creative Commons Attribution (CC BY) license (http://creativecommons.org/licenses/by/4.0/).
Copyright: This open access article is published under a Creative Commons CC BY 4.0 license, which permit the free download, distribution, and reuse, provided that the author and preprint are cited in any reuse.


