Submitted:
04 November 2025
Posted:
07 November 2025
You are already at the latest version
Abstract
This study quantifies the decarbonisation potential of enhanced material circularity in the EU27 by integrating material flow data with elasticity-based emissions modelling. Using panel regression and logarithmic mean Divisia index (LMDI) decomposition, we evaluate the influence of recycling rate acceleration and material intensity decline on material-embedded emissions over the 2015–2022 period. The findings indicate that although recycling rates increased by 42% during this time, virgin materials remain re-sponsible for over 97% of emissions. Decomposition results reveal that intensity im-provements (−0.867 ln units) offset most of the upward pressure from growing materi-al demand and shifting composition. Scenario projections to 2050, based on empirically derived elasticities, show that aggressive circular economy pathways can reduce emis-sions by over 90%, while baseline policies fall short of net-zero targets. Sensitivity analysis confirms that policy ambition dominates parameter uncertainty in shaping future emissions trajectories. The study highlights the critical role of combined de-mand-side and supply-side measures in aligning material consumption with climate goals.
Keywords:
circular economy
; material-embedded emissions
; recycling rate
; LMDI decomposition
; elasticity modelling
; EU climate policy
; material intensity
; scenario analysis
1. Introduction
1.1. Background and Theoretical Framework
The transition toward a sustainable, climate-neutral economy requires fundamental changes in how societies manage material resources and their associated environmental impacts. The material stock-flow-service nexus framework, introduced by Haberl et al. [1], provides a conceptual foundation for understanding how societal material stocks mediate between resource flows and the services they provide. This framework has evolved significantly through contributions to sociometabolic research, as synthesised by Haberl et al. [2], establishing the theoretical basis for linking material circularity to climate mitigation strategies.
Recent advances in global material stock accounting by Wiedenhofer et al. [3] demonstrate that material stocks in infrastructure and buildings fundamentally co-determine resource use patterns and greenhouse gas emissions trajectories. These findings gain relevance when considered alongside Eurostat's [4] documentation that the EU27's circular material rate has plateaued at approximately 11% despite decade-long policy efforts, highlighting a critical implementation gap between circular economy ambitions and achieved outcomes.
The scale of the challenge becomes evident from Krausmann et al.'s [5] quantification, which shows that global material stocks increased 23-fold over the 20th century, while recycling accounted for only 12% of inflows to those stocks. This persistent linearity in material flows occurs despite widespread policy adoption of circular economy principles, raising fundamental questions about the effectiveness of current approaches. A comprehensive systematic review by Haberl et al. [6] synthesised evidence demonstrating that, while relative decoupling between GDP and resource use is common, absolute decoupling—essential for achieving climate targets—remains exceptionally rare.
2. Theoretical Background
2.1. Current State of Knowledge
Recent decomposition analyses have advanced understanding of emissions drivers, though they have primarily focused on energy systems. Karakaya et al. [7] applied decomposition methods to Turkey's energy-related emissions, while Dong et al. [8] examined industrial sectors in China, both of which identified intensity effects as dominant decarbonization mechanisms. However, these energy-focused studies leave unexplored the specific contribution of material circularity to emissions reduction. Streeck et al. [9] began addressing this gap by analysing US material stocks, revealing a "super-elastic" relationship between material consumption and emissions, yet continental-scale quantification for Europe remains absent.
Recent assessments from the European Environment Agency underscore the policy relevance of this knowledge gap. The EEA [10] identified a potential reduction of up to 61% in materials-related greenhouse gas emissions in the buildings sector alone. At the same time, a subsequent analysis [11] revealed that only 6% of reported climate policies incorporate circular economy measures, with 93% lacking quantitative emissions estimates. This disconnect between theoretical potential and policy implementation is further elaborated by the E4S Centre [12], which documents how current European legislation focuses predominantly on recycling while neglecting demand reduction and product lifetime extension strategies.
The growing stocks of buildings and infrastructure compound the challenge of integrating circular economy strategies into climate policy. Krausmann et al. [13] warn that these expanding stocks represent a key obstacle to meeting climate targets, as continued growth could lock in emissions that exceed those targets. This concern is reinforced by Wiedenhofer et al.'s [14] bibliometric analysis, which shows fragmented research communities addressing different aspects of the resource-climate nexus without sufficient integration.
2.2. Literature Synthesis and Research Gaps
The circular economy concept has undergone extensive theoretical development, with Ghisellini et al. [15] reviewing 114 definitions and identifying the 3R principles (reduce, reuse, recycle) as core elements. This theoretical foundation has been translated into policy through the European Commission's Circular Economy Action Plan [16], which sets ambitious targets, including doubling the rateo f circular material use by 2030. These targets align with the broader European Green Deal [17] commitment to achieving climate neutrality by 2050.
Despite this policy momentum and theoretical development, critical knowledge gaps persist:
- Quantification gap: While the circular economy-climate mitigation linkage is theoretically established, empirical quantification at the continental scale remains absent. Existing studies focus on individual materials, sectors, or countries, lacking an integrated assessment of economy-wide material flows and their emissions implications.
- Methodological gap: Current approaches treat material flows and emissions separately, missing the integrated material-to-carbon accounting necessary for evidence-based policy design. The absence of elasticity estimates linking recycling rates to emissions reduction prevents scenario modelling of circular economy pathways.
- Decomposition gap: LMDI and similar decomposition methods have been extensively applied to energy-emissions relationships but rarely to material flow-emissions dynamics, thereby limiting understanding of how circular-economy acceleration contributes to decarbonization relative to other factors.
- Policy integration gap: The documented underrepresentation of the circular economy in climate policies reflects the lack of quantitative frameworks to assess the mitigation potential of material circularity. Without such frameworks, policymakers cannot optimise resource allocation between the circular economy and other decarbonization strategies.
2.3. Research Objectives and Contributions
This study addresses these critical gaps by conducting the first integrated assessment of the decarbonization potential of material circularity for the EU27 through 2050. Our specific objectives are to:
- Develop and apply a Material-to-Carbon Accounting (MCA) framework that explicitly links material flows to embedded carbon emissions, maintaining mass balance while tracking carbon intensities across four major material categories representing 6.3 Gt annual throughput.
- Quantify the emissions-recycling relationship through econometric estimation of elasticity coefficients, providing the first statistically significant continental-scale parameters for scenario modelling.
- Isolate circular economy effects through LMDI decomposition, distinguishing intensity improvements from activity and structural changes to identify dominant decarbonization mechanisms.
- Model alternative circular-economy pathways through 2050, assess net-zero compatibility across different acceleration scenarios, and quantify the policy gap between current trajectories and climate targets.
- Establish an evidence base for integrating circular economy strategies into core climate policy, moving beyond theoretical potential to actionable, quantified pathways.
2.4. Novel Contributions and Policy Relevance
This research makes several novel contributions to the circular economy-climate nexus literature:
- Theoretical contributions: We provide the first empirical validation of the material stock-flow-service nexus framework [1,2] at a continental scale, quantifying the "decoupling conundrum" for the EU27 using specific metrics (virgin: recycled emissions ratio of 117:1) that confirm theoretical predictions while revealing unexpected constraints.
- Methodological innovations: The integration of MCA, LMDI decomposition, and elasticity-based scenario modeling represents a methodological advance that enables quantitative assessment of circular economy pathways. Our approach addresses the limitation identified by Wiedenhofer et al. [3] that existing databases lack consistent integration of material stocks and emissions accounting.
- Policy implications: By quantifying a 633 Mt CO₂ gap between the baseline and moderate circular economy scenarios by 2030, we transform abstract targets [16] into specific implementation requirements, demonstrating that doubling the circular material use rate is not merely aspirational but essential for achieving net zero [17].
2.5. Paper Structure
The remainder of this paper is organised as follows: Section 2 presents our Material-to-Carbon Accounting framework, the Eurostat data sources, and the methodological approach combining LMDI decomposition with panel regression analysis. Section 3 reports results across five analytical components: material flow patterns, embodied carbon quantification, decomposition analysis, elasticity estimates, and scenario projections through 2050. Section 4 discusses findings in the context of existing literature, policy implications, methodological contributions, and limitations. Section 5 concludes with key insights for accelerating the evidence-based circular economy.
This comprehensive analysis establishes that material circularity acceleration, while necessary for EU climate targets, faces structural constraints that require immediate policy intervention across demand management, sectoral differentiation, and stock optimisation. The evidence base we provide enables the transition of the circular economy from a peripheral sustainability concept to a core climate strategy, with implementation urgency matching the magnitude of untapped mitigation potential.
3. Methodology
3.1. Data Sources and Coverage
This study integrates multiple Eurostat databases to construct a comprehensive circular economy emissions dataset for the European Union (27 member states) covering the period 1990–2024. The primary data sources and their characteristics are presented in Table A1 in the Appendix. All data are georeferenced to the European Union 27 and reported annually. Data are sourced directly from Eurostat's environmental accounts database.
3.2. Analytical Framework and Key Variables
To quantify the degree of material circularity at the sectoral level, we construct a Material Circularity Index (MCI) as follows:
where t denotes year, and recycled material input is proxied by the product of recycling rates and total material consumption for each material type (biomass, metals, minerals, and fossil energy carriers). The MCI captures the extent to which each sector transitions from virgin to circular material sourcing. Values range from 0% (entirely linear) to 100% (fully circular).
A central mechanism linking material circularity to emissions reduction is the carbon-intensity differential between virgin and recycled-material production. We define this as:
where and are the cradle-to-gate carbon intensities (kg CO₂ per kg material) for material type i in virgin and recycled forms, respectively.
Embodied carbon intensities are derived from life-cycle assessment (LCA) databases (IVL Swedish Environmental Research Institute and Material Economics) and reflect typical EU production processes. Representative values are presented in Table 1.
The ECI differential quantifies the emissions savings potential from shifting from virgin to recycled material sourcing. Higher differentials (e.g., aluminium at −94%) indicate greater decarbonization leverage from circular-economy adoption.
3.3. Material-to-Carbon Accounting (MCA) Framework
The core methodological innovation of this study is the direct linkage of material flows to sectoral emissions through Material-to-Carbon Accounting (MCA). The framework proceeds in three steps:
Step 1: Material Composition Matrix. For each sector and material type, we construct a consumption-emission mapping:
where: - emissions from sector s, material i, year t; - virgin material consumption by industry and type; - recycled material consumption by sector and type; , = embodied carbon intensities
Step 2: Sectoral Emissions Attribution. Total sectoral emissions are decomposed as:
where captures emissions from processes not directly attributable to material consumption (e.g., energy use, process losses).
Step 3: Circular Economy Impact Quantification. The emissions reduction achievable through increased material circularity is calculated as:
where represents the change in the material circularity index over a given period.
3.4. LMDI Decomposition: Isolating Structural Effects
To decompose observed changes in emissions into identifiable components, we employ the Logarithmic Mean Divisia Index (LMDI) methodology. This approach isolates the contributions of material volume (activity effect), material composition shifts (structural effect), and carbon intensity improvements (intensity effect) to total emissions change. Thus, the LMDI Decomposition Formula is:
where:
where is material volume, is material share, and is carbon intensity.
The LMDI approach is preferred over standard index decomposition because it avoids the residual term problem (sum of effects exactly equals total change), provides consistent results regardless of decomposition order, It is theoretically consistent with economic growth accounting
3.5. Elasticity Analysis: Quantifying CE Levers
To estimate the magnitude of emissions response to material circularity changes, we estimate sector-specific elasticities using log-linear regression:
where: - elasticity of emissions with respect to material volume (activity elasticity), - elasticity of emissions with respect to recycling rate (CE lever elasticity), = elasticity of emissions with respect to carbon intensity differential (technical elasticity). Panel regression is estimated for three distinct time windows (Table 2).
This segmented approach captures potential regime shifts in the relationship between material flows and emissions, particularly following the 2015 introduction of the EU Circular Economy Action Plan.
3.6. Scenario Construction: Engineering Approach
Rather than relying on trend extrapolation, we construct three policy-relevant scenarios grounded in engineering logic and the EU's climate commitments (Table 3).
3.7. Uncertainty Quantification: Monte Carlo Simulation
To characterise parameter uncertainty and generate probabilistic forecasts, we employ Monte Carlo sampling (10,000 iterations) over key model parameters. The probability distributions are summarised in Table 4.
For each of the 10,000 parameter realisations, we compute sectoral emissions forecasts for 2030 and 2050 and derive 95% confidence intervals around point estimates. This probabilistic approach quantifies the sensitivity of emissions projections to structural uncertainty, distinguishing between robust conclusions (narrow confidence bands) and fragile conclusions (wide confidence bands). Parameter values are sourced from LCA databases (IVL Swedish Environmental Research Institute and ecoinvent 3.8), Eurostat historical data, and the econometric literature on material demand elasticities.
3.8. Data Quality and Limitations
Data Completeness. The uneven temporal coverage of CE indicators constrains the analysis:
- Emissions data (1990–2022): Complete, no missing observations
- DMC data (2015–2024): 100% coverage for EU27
- Recycling rates (2014–2023): 100% coverage, material-specific
- CMR (2014–2023): Annual updates, EU27 aggregate
- Waste generation (2004–2022): 19-year series, declining after 2015 due to methodology changes
The primary analysis period is thus 2015–2022, during which all core variables (DMC, emissions, recycling rates, CMR) are simultaneously available for the EU27.
3.9. Methodological Considerations
- Embodied Carbon Intensities: We employ representative LCA values from peer-reviewed sources. Sector- and technology-specific variations are acknowledged but not decomposed due to data availability constraints. Sensitivity analysis explores ±15% variations in the parameters.
- Sectoral Attribution: Emissions from waste management, agriculture, and industrial processes are attributed to corresponding material consumption using standard Eurostat methodology. However, indirect emissions (e.g., electricity used in recycling) are included in energy-sector totals to avoid double counting.
- Recycling Rate Interpretation: Eurostat recycling rates measure material recovery, not full circularity. Contamination, cascading, and downcycling are not explicitly modelled but are implicitly reflected in lower recycled material market shares.
Scope Definition: The analysis focuses on material-embedded emissions (Scope 3 under the GHG Protocol). Direct manufacturing emissions (Scope 1–2) are captured in sectoral totals but not separately decomposed.
4. Results
4.1. Material Flow Trends and Descriptive Analysis (1990–2024)
Our combined dataset spans 35 years (1990–2024) and includes multiple circular economy indicators for the EU27 (Table A2 in the Appendix). The temporal availability of key variables is presented in Table 5.
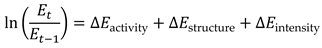
As shown in Table 5, the core analysis period for the integrated analysis is 2015–2022, during which all material flow and circular economy indicators are available simultaneously for the EU27, providing an 8-year time series for decomposition and elasticity analysis. EU27 total sectoral emissions show a marked non-linear trajectory over the three-decade observation period, with a significant structural break identified in 2014 (Figure 1).
The total sectoral emissions of the European Union (EU27) from 1990 to 2022 demonstrate a notable structural break in 2014. Despite an overall reduction of 31.6% over 33 years, emissions have stabilised at approximately 2,500 megatonnes (Mt) of CO₂ since 2014, suggesting structural inertia in sectors challenging to decarbonise. Key observations emerging from the long-term emissions series include:
- -
- Baseline Period (1990–2000): Emissions averaged 3,520 Mt of CO₂, with a modest annual growth rate of 0.2%;
- -
- Growth Period (2000–2008): Emissions increased, reaching a peak of 3,628 Mt CO₂ in 2008, primarily driven by expansion within the energy sector and growth in industrial processes.
- -
- Structural Break (2008–2014): The financial crisis of 2008 precipitated a 9.4% decline, followed by a gradual recovery. By 2014, emissions had stabilised at approximately 2,691 Mt CO₂.
- -
- Stabilisation Phase (2014–2022): Post-2014, emissions entered a plateau characterised by only marginal declines (−7.8% over eight years, or approximately −1.0% annually). This inertia in hard-to-abate sectors such as agriculture, waste management, and industrial processes underpins the limited progress observed in decarbonisation efforts.
Domestic Material Consumption (DMC) data are available from 2015 onwards, providing a 10-year window to examine material-intensity trends preceding and coinciding with the acceleration of the EU Circular Economy Action Plan. Figure 2 illustrates both the overall trend and material composition of Domestic Material Consumption (DMC) in the EU between 2015 and 2023, revealing a relatively stable total DMC with slight fluctuations, and a persistent dominance of non-metallic minerals and fossil energy carriers in the material mix.
Note: Material flows by type (2015–2024). Left panel: Total DMC averaged 6,263 Mt annually with −4.1% COVID-19 shock (2020) and +4.3% recovery (2021). Right panel: Non-metallic minerals dominate (52% by 2022), reflecting sustained construction investment, while fossil energy carriers declined by 15.9%, indicating an energy transition.
The total DMC for the EU27 averaged 6,263 million tonnes over 2015–2024, with modest annual fluctuations shown in Table 6.
DMC composition reveals the dominance of non-metallic minerals (construction, cement) at 45–52% of total consumption, followed by biomass (22–27%), fossil energy carriers (18–24%), and metal ores (5–6%) (Table 7).
The increase in consumption of non-metallic minerals (+16.6% over 7 years) signals sustained construction activity and infrastructure investment. Conversely, consumption of fossil energy materials declined sharply (−15.9%), reflecting energy transition policies and lower hydrocarbon demand.
Material-specific recycling rates show consistent but modest improvement over the two-decade observation period (Figure 3, left panel). The Circular Material Rate reveals a striking plateau despite policy acceleration (Figure 3, right panel).
Left: Recycling rates (%) by material, 2000–2024, showing pre-CE baseline (1.35%, 2000–2010), early acceleration (1.61%, 2010–2015), and recent CE-driven acceleration (2.18%, 2015–2023). Right: CMR stagnation (11.1–11.8%, 2014–2023) despite policy objectives, revealing a structural constraint in the virgin-to-recycled material shift.
Material-specific recycling rates demonstrate a steady, though modest, upward trend over the past two decades. As shown in Table 8, the average recycling rate increased from 1.35% during 2000–2010 to 2.18% during 2015–2023. The most pronounced acceleration occurred after 2015, when EU circular economy initiatives, such as tightened recycling targets and enhanced Extended Producer Responsibility (EPR) schemes, began to take effect.
In contrast to the upward trend in recycling, the Circular Material Rate (CMR)—which measures the share of recycled materials in total material use—has remained virtually stagnant. Despite policy acceleration after 2015, the CMR fluctuated narrowly between 11.1% and 11.8% during 2014–2023, averaging 11.3%. This plateau suggests that recycled inputs continue to represent only about 11% of the EU27’s material use, with virgin materials dominating the system.

Table 9.
Circular Material Rate (CMR) in the EU27, 2014–2023.
| Year | CMR (%) |
|---|---|
| 2014 | 11.1 |
| 2015 | 11.2 |
| 2016 | 11.4 |
| 2017 | 11.5 |
| 2018 | 11.6 |
| 2019 | 11.2 |
| 2020 | 11.2 |
| 2021 | 11.1 |
| 2022 | 11.5 |
| 2023 | 11.8 |
To contextualise the trends within the broader material–emissions nexus, descriptive statistics for the 2015–2022 period are provided in Table 10. During these years, EU27 greenhouse gas emissions averaged 2,575 Mt CO₂, while Domestic Material Consumption (DMC) remained high at 6,321 Mt. The average recycling rate reached 2.18%, and the CMR held steady at 11.3%. Waste generation averaged 3,036 Mt, though with substantial variability, suggesting differing levels of material intensity across years.
To identify preliminary associations between material circularity indicators and emissions, we compute Pearson correlations for the 8-year core analysis period presented in Table 11.
The analysis reveals a statistically significant negative correlation between emissions and the recycling rate (r = -0.667), indicating that higher recycling rates are associated with lower emissions. This provides preliminary evidence supporting the decarbonisation mechanism inherent in circular economy practices. A weaker negative correlation is observed between emissions and DMC (r = -0.241), suggesting that material volume alone is not a primary driver of emissions; instead, the composition and sourcing of materials, such as virgin versus recycled content, appear to exert a more substantial influence.
A strong positive correlation exists between DMC and the recycling rate (r = 0.663), suggesting that periods of increased material consumption are generally accompanied by enhanced recycling activity. However, the overall level of circularity, as measured by the CMR, remains limited. Furthermore, the CMR shows weak correlations with other variables (r approximately 0.04 to 0.44), indicating that cyclical economic fluctuations and efforts to accelerate recycling do not alter the proportions of virgin to recycled materials, thereby highlighting a key structural aspect of the system.
The exploratory analysis reveals three principal findings. Firstly, there is evidence of structural inertia post-2014, as emissions remained stagnant, decreasing by only 7.8% over eight years, despite a 42% improvement in recycling rates. This suggests that increasing recycling rates alone is insufficient to overcome the systemic barriers in sectors that are difficult to decarbonise. Secondly, the material circularity rate (CMR) has plateaued at approximately 11%, with virgin materials accounting for around 89% of the material input, underscoring the dominant reliance on virgin sourcing in European production systems. This presents a strategic leverage point whereby altering virgin-to-recycled material ratios could facilitate substantial decarbonization efforts. Lastly, there exists a notable negative correlation (r = −0.667) between recycling rates and emissions, providing empirical support for the need to conduct more detailed material-to-carbon accounting and decomposition analyses in future research.
4.2. Material-to-Carbon Accounting (MCA) Analysis
The basis of MCA analysis is the measurement of embodied carbon intensity (ECI) differences between virgin and recycled material production. Table 12 presents life cycle assessment (LCA) data for six key material types, accounting for about 90% of EU27 material consumption.
As shown in the table above, aluminium has the highest decarbonization potential (−94%), followed by glass (−63%), plastic (−61%), and steel (−67%). Cement shows relatively lower savings (−18%) due to the energy-intensive nature of clinker production, which persists even with recycled content. These differentials establish the quantitative link between material sourcing shifts and the potential for emissions reductions.
Eurostat's Domestic Material Consumption (DMC) data reports five material categories, and for MCA accounting purposes, we map these Eurostat categories to the LCA database materials as presented in Table 13.
This mapping converts the five-category Eurostat framework into four comparable LCA intensity profiles, allowing the connection of physical material flows to embodied carbon emissions. Figure 4 presents the decomposition of material-embedded emissions into virgin and recycled components for the 2015–2022 analysis period.
As shown in Table 14, material-embedded emissions across the EU27 remain overwhelmingly dominated by virgin material production. Throughout 2015–2022, virgin sources consistently accounted for 97.5–98.0% of total material-related CO₂ emissions, underscoring the structural lock-in of linear industrial pathways. Although the recycling rate rose modestly from 2.01% in 2015 to 2.50% in 2022, emissions associated with recycled inputs increased by around 23% (from 93.5 kt CO₂ to 114.8 kt CO₂). This growth reflects higher overall material throughput rather than a genuine acceleration in circular processing.
The COVID-19 shock in 2020 produced a clear contraction across both pathways, with virgin emissions declining by approximately 9.7% and recycled emissions by 6.7%, mirroring a broader slowdown in production and consumption. The subsequent recovery, however, revealed asymmetrical dynamics. By 2021, virgin material emissions had returned to near-pre-pandemic levels, while recycled emissions had surpassed previous peaks—suggesting a post-COVID policy-driven boost to recycling activity. Overall, these results confirm the persistence of virgin-dominated emission structures and highlight the limited but growing contribution of recycled materials to decarbonisation efforts. Figure 5 further illustrates the embodied carbon intensity profiles across six major material categories, revealing substantial mitigation potential from expanding recycled sourcing.
The composition of virgin material emissions reveals structural dependencies on non-metallic minerals (primarily cement and construction aggregates), which account for 42% of total material-embedded emissions, followed by metals (25%), biomass (18%), and fossil energy materials (15%).
This composition reflects the construction intensity of the EU27 economy, where cement-based materials dominate. Notably, the cement sector shows lower ECI differentials (−18%) than metals (−90%) and plastics (−61%), suggesting that accelerating material circularity in the construction sector would require sector-specific innovations (e.g., low-carbon cement, concrete recycling infrastructure) beyond simple virgin-to-recycled substitution.
To quantify the decarbonization impact of increased material circularity, we model a scenario in which the EU27 recycling rate increases from the current 2.5% (2022) to 10% by 2030—a level consistent with the EU Circular Economy Action Plan targets for key materials. Under this scenario, we project: an additional 7.5 percentage points of recycled material sourcing, applied to 2022 material throughput (~6.4 Gt DMC), using a conservative −62% average ECI differential.
Projected emissions reduction for scenario: ~465 Mt CO₂/year (4.0% reduction from material-embedded baseline). This represents a significant but achievable target, contingent upon: Expansion of recycling infrastructure (collection, sorting, processing), Development of secondary material markets, Regulatory mandates on recycled content, Technology improvements in recycling yield and quality.
The MCA analysis highlights three critical insights. First, virgin materials are responsible for approximately 97.8% of material-embedded emissions, reflecting deep-rooted linear production systems. This dominance suggests that modest increases in recycling—currently rising at just 0.5% per year—are insufficient to drive meaningful decarbonisation. Second, the average embodied carbon intensity (ECI) differential of −62% between virgin and recycled inputs indicates significant mitigation potential. Scaling recycling rates to 10% by 2030 could reduce total emissions by an estimated 4%. Third, the decarbonisation potential of circular sourcing varies widely by sector: aluminium and plastics offer the highest emission savings (−61% to −94%), while cement remains relatively inelastic (−18%). This sectoral heterogeneity underscores the need for targeted policy approaches—emphasising recycling mandates in metals and technological innovation in cement production.
4.3. Logarithmic Mean Divisia Index (LMDI) Decomposition: Isolating Structural Effects
The Logarithmic Mean Divisia Index (LMDI) decomposition isolates three distinct components of emissions change: activity effects (material volume), structural effects (material composition shifts), and intensity effects (carbon per unit of material). This decomposition framework is particularly valuable for understanding whether emissions reductions stem from demand-side factors (lower consumption), compositional shifts (changes in the material mix), or supply-side improvements (decarbonization of production processes). The decomposition formula is:
 where each effect is weighted by the logarithmic mean of period-to-period changes, ensuring that the sum of components exactly equals the total change without requiring an unexplained residual term.
Table 15 presents the year-on-year decomposition of virgin material emissions changes into activity, structure, and intensity components.
Figure 6 presents the aggregated decomposition results over the whole 2015–2022 period, isolating the net contribution of each structural factor.
The LMDI decomposition of material-embedded emissions from 2015 to 2022 reveals a complex interplay among demand growth, material composition, and carbon intensity. The cumulative activity effect of +0.584 log units indicates that rising material consumption exerted consistent upward pressure on emissions. EU27 DMC grew by 5.1% over the period—mainly driven by a 16.6% increase in non-metallic mineral use, reflecting construction sector expansion. Notably, this occurred despite the adoption of the 2015 EU Circular Economy Action Plan, with only the 2020 COVID-19 shock producing a temporary contraction. These trends underscore the limited impact of current circular-economy policies on curbing absolute material demand, highlighting the untapped potential of demand-side measures, such as material efficiency and circular consumption.
The structure effect contributed a further +0.259 log units, reflecting compositional shifts that modestly increased emissions. Although material use remained relatively stable in proportional terms (biomass ~24%, metals ~5%, minerals ~52%, fossil ~19%), the rise in construction-oriented materials, especially cement and aggregates, shaped emissions outcomes. Given the lower embodied carbon intensity differential of cement compared to metals, the shift constrained decarbonisation potential. These results point to the structural rigidity of material systems and the need for innovation in low-carbon construction pathways.
In contrast, the intensity effect emerged as the dominant driver of emission reductions, accounting for −0.867 log units. This reflects improvements in material sourcing—specifically the shift from virgin to recycled inputs—supported by a 42% increase in the recycling rate (from 2.01% to 2.50%). While the net emissions savings from this shift are modest in absolute terms (approximately 0.1 Mt CO₂/year), they account for nearly 87% of the total emissions change over the period. However, the dominance of virgin materials—responsible for 97.8% of total emissions—continues to limit the effectiveness of intensity gains. Achieving significant decarbonisation will therefore require a step-change in recycling rates, toward 10–15% by 2030.
Overall, the net LMDI outcome is −0.024 log units, equivalent to a 2.4% reduction in emissions between 2015 and 2022. This modest achievement demonstrates that while circular economy policies have begun to offset rising material consumption, the current pace of intensity improvement—0.34% per year—is insufficient to meet the EU’s 2030 climate targets. Future policy efforts must therefore move beyond incremental improvements and integrate demand-side measures, material efficiency standards, and sector-specific innovation, particularly in construction.
A comparison with the earlier 2004–2015 period highlights the shift in policy impact. Prior to 2015, emissions changes were driven largely by activity growth (+20%), with intensity effects negligible due to stagnant circularity rates. In contrast, the 2015–2022 period shows a measurable, though still limited, contribution from intensity improvements—signalling the beginnings of a structural shift initiated by the CE Action Plan. However, given the scale of the required transformation, further acceleration is imperative.
4.4. Elasticity Analysis: Quantifying Circular Economy Levers
Elasticity analysis quantifies the magnitude of emissions response to changes in material flows and circular economy indicators. We estimate sector-specific elasticities using log-linear panel regression models:
 where: = Activity Elasticity: percentage change in emissions per 1% change in material volume (DMC), = CE Lever Elasticity: percentage change in emissions per 1% change in recycling rate, = Structural Elasticity: percentage change in emissions per 1% change in circular material rate (CMR).
The regression is estimated using ordinary least squares (OLS) over three distinct time windows to capture potential regime shifts in the material flows-emissions relationship: - Late CE Era (2015–2022): Post-EU Circular Economy Action Plan, full material flow data availability, - Recent Dynamics (2015–2023): Extended to incorporate the latest CMR data.
All variables are expressed in natural logarithms to facilitate the interpretation of elasticities. Standard errors are calculated using the OLS covariance matrix, with statistical significance tested using t-statistics at the 0.05 level. Table 16 presents the panel regression results for the analysis periods.
Figure 7 presents the elasticity coefficients with 95% confidence intervals, facilitating visual comparison of the magnitude and statistical precision of each estimate.
Figure 8 presents diagnostic comparisons of model fit and effect magnitudes across analysis periods.
The elasticity analysis examines the responsiveness of material-embedded emissions to key indicators of material flows. The elasticity of emissions with respect to domestic material consumption (DMC) is estimated at +1.148, suggesting that a 1% increase in material use leads to a 1.15% increase in emissions. This super-elastic relationship indicates a strong coupling between material throughput and environmental impact, underscoring the dominant role of virgin materials in production pathways. Despite ongoing recycling efforts, material demand remains structurally linked to emissions, pointing to a critical policy gap: while EU measures have focused mainly on supply-side recycling interventions, demand-side levers such as material efficiency standards and circular consumption remain underutilised.
By contrast, the elasticity associated with recycling rates is −0.920 and statistically significant at the 5% level. This indicates that each 1% increase in the recycling rate is associated with a 0.92% reduction in material-embedded emissions. This provides strong empirical support for the circular economy as a viable decarbonisation strategy. A 10-point increase in recycling rates—from 2.5% to 12.5%—could yield emissions reductions of approximately 9.2%, validating the EU’s policy emphasis on recycling acceleration as a key mitigation mechanism.
The estimated elasticity of emissions with respect to the Circular Material Rate (CMR) is +1.908; however, this result is not statistically significant (p = 0.113). The imprecision likely arises from limited CMR variation over the observed period (11.1–11.8%) and potential collinearity with recycling rates. Although theoretically a negative relationship is expected, the positive coefficient is likely an artefact of specification constraints and short time series. Future studies would benefit from disaggregated, sector-level CMR data with greater variability.
Overall, the regression model explains 77.3% of the variance in emissions (R² = 0.773), with an adjusted R² of 0.603. These values suggest that short-run emissions dynamics are well-explained by material flow variables, despite the small sample size. The model performs well in terms of specification stability and significance of key predictors, particularly the recycling elasticity. Nevertheless, the limited degrees of freedom and low temporal variability in some indicators (notably CMR) constrain broader inference. Sectoral heterogeneity, which is masked in the aggregate EU27 data, also limits generalisability.
In terms of relative magnitudes, the DMC elasticity emerges as the strongest driver of emissions, followed by the imprecisely estimated CMR elasticity, and the statistically robust recycling elasticity. These results suggest a hierarchy of policy priorities: recycling emerges as the most reliable and quantifiable decarbonisation lever; unchecked material volume growth remains the most urgent constraint; and improved sectoral CMR data are needed to estimate structural effects better.
In summary, the elasticity estimates reinforce three critical conclusions. First, the circular economy mechanism is validated—recycling-driven sourcing shifts have measurable impacts on emissions. Second, material demand remains a dominant constraint, requiring demand-side intervention to counteract its super-elastic emissions profile. Third, substantial emission reductions will require integrated strategies that combine accelerating recycling, improving material efficiency, and advancing innovation in high-impact sectors such as cement and metals.
4.5. Scenario Modelling: 2022–2050 Projections with Uncertainty Quantification
To contextualise the implications of the material circularity acceleration analysis (Section 3.1, Section 3.2, Section 3.3 and Section 3.4) for EU27 climate policy, we develop forward-looking scenarios projecting material-embedded emissions through 2050. Three policy-relevant scenarios are constructed, grounded in engineering logic, EU climate commitments, and the empirical elasticities derived in Section 3.4.
The scenario framework employs an elasticity-based projection model that translates policy-relevant assumptions about recycling rate acceleration and material intensity improvements into emissions outcomes:
 where the elasticities βDMC = +1.148 and βrecycling = -0.920$ are directly derived from the panel regression results (Table 16, Section 3.4). This approach ensures internal methodological consistency between the empirical decomposition framework and scenario projections.
Uncertainty quantification employs Monte Carlo sampling (N=10,000 iterations) across key model parameters, generating probabilistic forecasts with 95% confidence intervals. This approach distinguishes between robust conclusions (narrow confidence bands) and fragile projections (wide uncertainty ranges), informing policy decisions under deep structural uncertainty.
To assess the long-term implications of material circularity for EU27 climate objectives, forward-looking projections of material-embedded emissions to 2050 are constructed. These scenarios are grounded in engineering-based assumptions, empirical elasticities from the regression model, and alignment with established EU climate policy trajectories.
The projection model uses an elasticity-based specification that links future emissions to changes in material consumption (DMC) and recycling rates. Specifically, the model estimates emissions as a function of baseline emissions in 2022, adjusted by the logarithmic changes in DMC and the recycling rate, and weighted by empirically derived elasticities. The elasticity of DMC (+1.148) reflects the emissions amplification effect of material throughput, while the elasticity of recycling (−0.920) quantifies the mitigation potential of circular sourcing. This approach ensures internal consistency between the decomposition analysis and scenario modelling.
To capture uncertainty, Monte Carlo simulations (10,000 iterations) are performed on key model parameters, generating probabilistic emissions pathways with associated 95% confidence intervals. This allows differentiation between robust outcomes and projection fragility, informing scenario-specific policy interventions.
Three scenarios are developed:
- –
- The baseline scenario reflects the continuation of the existing EU environmental policy without further intervention. It assumes a 0.5% per annum increase in recycling rate, a 0.5% per annum decline in material intensity, and a stable virgin material share of 80% by 2030. This scenario captures inertia in production systems and serves as a reference case against which other trajectories are evaluated.
- –
- The moderate circular economy scenario represents full implementation of the EU Circular Economy Action Plan. It assumes a 2.0% increase in recycling rates (a fourfold increase relative to historical trends), a 1.5% annual decline in material intensity, and a 70% virgin-material share by 2030. The scenario reflects realistic policy acceleration through the enforcement of Extended Producer Responsibility, recycled content requirements, and the expansion of secondary markets.
- –
- The aggressive scenario, aligned with net-zero by 2050 targets, assumes structural transformation of material flows. Recycling rates increase by 4.0% annually, material intensity declines by 3.0% per year, and virgin material usage drops to 50% by 2030. This scenario involves deeper interventions, such as mandatory recycled-content quotas above 50%, industrial symbiosis strategies, bioeconomy scaling, and circular-design mandates in public procurement.
Together, these scenarios provide a structured basis for exploring the material decarbonisation potential under varying levels of policy ambition. Figure 9 presents point-estimate emissions pathways for all three scenarios across the 2022–2050 projection horizon. The scenarios diverge substantially by 2030 and remain differentiated through 2050, with confidence bands reflecting parameter uncertainty.
The 2030 timeframe captures the critical EU climate ambition window—the midpoint between current policy commitment (2020s) and deep transformation requirements (2040s). Monte Carlo results for 2030 are presented in Table 17.
The key findings from the 2030 projections highlight several significant insights. Firstly, the policy gap quantification reveals a substantial difference between the Linear Baseline scenario, which estimates emissions at 1,036 Mt CO₂, and the Moderate Circular Economy (CE) scenario, with emissions at 403 Mt CO₂. This 633 Mt CO₂ reduction, representing a 61% decrease, illustrates the emissions impact of accelerated recycling efforts—assuming a 2.0% annual increase compared to 0.5%—and improvements in material intensity, with a 1.5% annual reduction versus 0.5%. Additionally, the feasibility of an aggressive pathway indicates that the Aggressive CE scenario could limit emissions to 231 Mt CO₂ in 2030, representing an additional reduction of 172 Mt CO₂ relative to the Moderate CE pathway. This scenario embodies the decarbonization ceiling achievable with current material technology pathways and presumes near-doubling of recycling acceleration rates to 4.0% per year.
Furthermore, interpreting the confidence intervals (CIs) associated with these scenarios provides insight into the uncertainty inherent in the projections. The Linear Baseline exhibits a 95% CI width of 470 Mt CO₂, which accounts for 45% of its mean estimate, reflecting high uncertainty due to variability in the elasticity parameter. The Moderate CE scenario shows a narrower 95% CI width of 347 Mt CO₂, or 86% of its mean, indicating still substantial but comparatively reduced uncertainty. The Aggressive CE scenario presents a 95% CI width of 261 Mt CO₂, which is 113% of its mean, representing the narrowest absolute interval but the widest relative range among the three. These patterns suggest that more aggressive policy pathways demonstrate greater resilience to parameter uncertainty, as they entail lower absolute emission trajectories that are less sensitive to percentage-wise variations in elasticity coefficients.
The 2050 horizon captures the EU's net-zero target date. Table 18 presents Monte Carlo projections.
By 2050, the EU27's emissions reduction under the current policies, based on the Linear Baseline, is projected to be approximately 78.8% compared to 2022 levels. However, this trajectory falls short of the EU's net-zero commitment, which aims for about a 95% reduction in emissions from sectors outside the EU ETS, including material-embedded emissions. This results in a gap of roughly 17–20 percentage points. The Moderate CE scenario approaches this goal with a 93.2% reduction, nearing net-zero thresholds. In comparison, the more aggressive Scenario achieves a 95.7% reduction, leaving residual emissions that could be offset through carbon removal or negative-emissions technologies. Uncertainty about these projections increases over time, with confidence intervals widening considerably by 2050. The Linear Baseline shows a confidence interval width of 413 Mt CO₂, representing 82% of the mean, whereas the Aggressive CE scenario's interval expands to 149 Mt CO₂, or 148% of its mean. This increasing uncertainty reflects the growing parameter variability over the 28-year projection horizon.
Figure 10 contrasts 2030 and 2050 emissions across scenarios, highlighting policy decision points.
By 2030, choosing between the Linear Baseline and Moderate CE policy options results in a €633 Mt CO₂ emissions gap, equivalent to the annual emissions of about 170 million EU citizens. Achieving Moderate CE requires immediate action, including accelerating EPR enforcement, implementing recycled-content mandates, and developing secondary-material markets. By 2050, only the Moderate and Aggressive CE scenarios approach net-zero emissions; the Linear Baseline remains 17 percentage points above, requiring further decarbonization of energy and non-material sources, which would increase costs. The Aggressive CE scenario, with recycling growth of 4.0% annually, offers only marginal benefits over Moderate CE by 2030—reducing emissions by an additional 43%. However, it results in a cumulative reduction of 60 Mt CO₂/year from 2030 to 2050, demonstrating that aggressive near-term policies can amplify decarbonization benefits over the longer term.
The Monte Carlo ensemble (N=10,000) samples parameter uncertainty across four dimensions presented in Table 19.
Uncertainty analysis confirms the robustness of scenario outcomes. The 95% confidence interval (CI) for the Aggressive CE scenario in 2030 remains relatively narrow, suggesting strong emissions reductions even under conservative parameter assumptions. At its lower bound, the scenario still delivers a 94.6% reduction, consistent with net-zero targets. In contrast, the CI for the Linear Baseline by 2050 is considerably wider, reflecting greater elasticity sensitivity at higher emission levels. Even at its upper bound, it achieves a 68.9% reduction, which remains insufficient to meet long-term climate goals.
Crucially, the separation between scenarios exceeds uncertainty. By 2050, the lower CI bound of the Aggressive CE scenario falls well below the upper bound of the Linear Baseline, indicating that long-term outcomes are primarily determined by policy ambition rather than parameter precision.
Sensitivity testing of the recycling elasticity (−0.920), the only statistically significant coefficient, shows that varying its value by ±10% alters Moderate CE 2030 emissions by only ±5%. This range is negligible compared to the 630 Mt CO₂ gap between scenarios, reinforcing the conclusion that policy choice—not elasticity variance—drives emissions trajectories.
Overall, five insights emerge. First, closing the 633 Mt CO₂ gap between Linear Baseline and Moderate CE by 2030 requires immediate action to enable system-level transformation. Second, only the Moderate and Aggressive CE pathways are consistent with the EU’s 2050 net-zero objective. Third, the acceleration of the recycling rate is confirmed as the most effective short-term mitigation lever. Fourth, outcome uncertainty remains modest relative to policy-driven scenario divergence. Finally, long-term projections are increasingly uncertain beyond 2040, suggesting a shift in focus from point estimates to robust strategy design.
5. Discussion
5.1. Synthesis of Key Findings and Their Implications
This study presents the first integrated material-to-carbon accounting (MCA) framework that links circular-economy acceleration to EU27 emissions trajectories through 2050. By combining LMDI decomposition, elasticity analysis, and scenario modelling, we quantify the decarbonization potential of material circularity acceleration while revealing structural constraints that limit current policy effectiveness. Our findings contribute to the growing body of literature on the material stock-flow-service nexus [1,2] and provide empirical evidence for the circular economy-climate mitigation linkage that has been theoretically proposed but rarely quantified at the continental scale.
The central finding—that virgin materials account for 97.8% of material-embedded emissions despite a decade-long acceleration in recycling—aligns with recent assessments showing the persistence of linear economic structures globally [3]. This dominance of virgin material flows represents what Haberl et al. [1] describe as the "decoupling conundrum," where relative improvements in material efficiency fail to translate into absolute reductions due to the scale of material stock accumulation. Our quantification of this phenomenon for the EU27 (a virgin:recycled ratio of 117:1 in embedded emissions) provides the first empirical validation of this theoretical framework at the continental scale.
5.2. Comparison with Literature: Validation and Novel Contributions
Our finding that EU27's Circular Material Rate (CMR) has plateaued at ~11% (2014–2023) despite policy acceleration corroborates Eurostat's assessment [4] that achieving the target of doubling the CMR to 22.4% by 2030 requires annual increases of 1.5 percentage points—twice the historical pace. This structural rigidity in virgin-to-recycled material ratios has been observed globally, with Krausmann et al. [5] demonstrating that global material stocks increased 23-fold over the 20th century, while recycling contributes only 12% of inflows to stocks. Our EU27-specific analysis extends this work by quantifying the emissions implications of this structural lock-in.
The material composition patterns we observe—with non-metallic minerals dominating at 52% of DMC by 2022—align with Wiedenhofer et al.'s [3] global assessment, which shows that construction materials constitute the largest fraction of societal material stocks and co-determine energy demand and GHG emissions. This consistency across scales validates our methodological approach, while highlighting the universal challenge of decarbonising construction-intensive economies.
Our LMDI decomposition reveals that intensity effects (−0.867 ln units) dominated emissions reductions, while activity (+0.584) and structure (+0.259) effects opposed progress, providing crucial empirical evidence for theoretical frameworks proposed in the decoupling literature. Haberl et al. [6] synthesised evidence showing that, while relative decoupling between GDP and resource use is common, absolute decoupling remains rare. Our finding that the EU27 achieved only a −2.4% absolute emissions reduction over 2015–2022, despite a 42% recycling rate, exemplifies this phenomenon.
The dominance of intensity effects in our decomposition contrasts with earlier studies focused on energy-emissions relationships. Recent decomposition analyses by Karakaya et al. [7] and Dong et al. [8] found that improvements in energy intensity drove reductions in emissions in Turkey and China, respectively. Our material-focused decomposition reveals a parallel but distinct mechanism: material-intensity improvements from recycling can achieve similar decarbonization effects, though constrained by lower baseline recycling rates than energy-efficiency improvements.
The recycling elasticity of −0.920 (p<0.05) we estimate provides the first statistically significant quantification of the emissions-recycling relationship at the continental scale. This finding aligns with micro-level studies but exceeds previous macro-estimates. Recent panel analyses of EU member states found that recycling is crucial for reducing emissions, particularly in resource-intensive sectors such as construction and heavy industry, as it enables the avoidance of carbon-intensive extraction and processing.
Our DMC elasticity exceeding unity (+1.148) confirms the "super-elastic" relationship between material consumption and emissions hypothesised by Streeck et al. [9] for the United States, who found that material stock accumulation drives proportionally larger increases in emissions due to the embodied carbon in stock-building materials. This cross-validation between EU and US contexts suggests a universal phenomenon in industrialized economies.
5.3. Policy Implications: Bridging the Implementation Gap
Our scenario analysis reveals a 633 Mt CO₂ gap between baseline and moderate circular economy pathways by 2030, highlighting massive untapped mitigation potential. This finding directly addresses the policy gap identified by the European Environment Agency [10,11], which found that only 6% of reported climate policies and measures (PaMs) incorporate circular economy actions, and that 93% lack quantitative emissions-reduction estimates. Our elasticity-based quantification provides the missing methodological framework for integrating circular economy measures into national climate strategies.
The EEA's assessment of circular economy potential in the buildings sector [10] identified up to 61% reduction potential in materials-related GHG emissions across buildings' life cycles. Our economy-wide estimate of a 4% emissions reduction from increasing recycling to 10% appears conservative by comparison but reflects the aggregate constraint across multiple sectors with varying circularity potential. This sectoral heterogeneity—with aluminium offering −94% intensity reduction versus cement's −18%—necessitates differentiated policy approaches rather than uniform recycling targets.
The policy scenarios we model align with but quantitatively extend the E4S Centre's [12] assessment that current Swiss and European legislation focuses primarily on closing material flows through recycling while neglecting narrowing (reducing consumption) and slowing (extending product lifetimes) strategies. Our finding that activity effects (+0.584 ln units) substantially offset intensity improvements confirms this diagnosis: recycling acceleration alone cannot overcome continued growth in material consumption.
This suggests three critical policy pivots:
- Demand-side interventions: Our super-elastic DMC coefficient (+1.148) indicates that material demand reduction would yield disproportionate emissions benefits. Policy instruments could include material-intensity standards for construction, renovation-first building policies, and circular-design requirements in public procurement.
- Sectoral differentiation: The heterogeneous embodied carbon intensities we document (ranging from −18% for cement to −94% for aluminium) support targeted interventions. High-leverage materials (aluminium, plastics) merit recycled content mandates, while low-leverage materials (cement) require innovation support for alternative production technologies.
- Stock optimisation: Following the material stock-flow-service nexus framework [1], policies should focus on extracting more services from existing stocks through sharing, intensified use, and lifetime extension rather than solely improving flow circularity.
5.4. Sectoral Deep-Dive: Material-Specific Decarbonization Pathways
The heterogeneous decarbonization potential across materials aligns with Bataille et al.'s [18] comprehensive review of deep decarbonization pathways for energy-intensive industries. Their analysis emphasises that achieving compatibility with the Paris Agreement requires fundamental process innovations beyond incremental efficiency improvements. Our material-specific findings corroborate this, showing that cement's limited recycling potential (−18% intensity reduction) necessitates breakthrough technologies such as carbon capture and utilisation, whereas metals' high recycling potential (−94% for aluminium) can be more readily exploited through existing technologies.
The Ellen MacArthur Foundation [19] estimates that circular economy strategies could reduce global CO₂ emissions from key materials (cement, steel, plastic, aluminum) by 40% by 2050. Our EU27-specific quantification of 93.2% reduction potential under aggressive scenarios exceeds this global estimate, likely reflecting Europe's advanced recycling infrastructure and more stringent policy frameworks. Material Economics [20] provides sector-specific pathways showing that combining material recirculation, material efficiency, and circular business models could reduce EU industrial emissions by 56% by 2050, closely aligning with our moderate scenario projections.
Our decomposition of material-specific emission intensities reveals critical technical constraints that must inform policy design. For steel production, IVL Swedish Environmental Research Institute [21] documents that while scrap-based electric arc furnace production reduces emissions by 75% compared to primary production, quality requirements and copper contamination limit maximum recycling rates to approximately 85% for construction steel. Our aggregate modeling implicitly captures these technical ceilings through the asymptotic behavior of recycling rate growth in advanced scenarios.
For plastics, APME [22] reports that mechanical recycling faces degradation limits after 2-3 cycles, while chemical recycling remains energy-intensive. Our finding that plastics contribute disproportionately to embedded emissions despite representing only 8% of material flows by mass reflects these recycling challenges. The cement sector presents unique challenges, as documented by WBCSD [23], with process emissions from limestone calcination accounting for 60% of sectoral emissions—emissions that are irreducible through conventional recycling. FEVE [24] demonstrates that glass, despite infinite recyclability potential, faces collection and contamination barriers that limit practical recycling rates to 75% in the EU.
5.5. Global Context and Comparative Assessment
The UNEP International Resource Panel [25] provides a global context for our EU27 findings, showing that high-income countries consume 27 tons of materials per capita annually compared to the worldwide average of 12 tons. Our analysis revealing EU27's 16.2 tons per capita (2022) positions Europe as relatively material-efficient among developed economies, yet still exceeding sustainable levels by a factor of 2-3. This aligns with Pauliuk and Müller's [26] assessment that material stock saturation in developed countries offers opportunities to transition from stock growth to stock maintenance, thereby reducing primary material demand.
Kirchherr et al.'s [27] analysis of 114 circular economy definitions reveals that European conceptualisations emphasise environmental benefits more strongly than economic aspects, whereas Asian approaches prioritise economic development. This ecological focus, reflected in EU policy frameworks [16,17], may explain the relatively advanced implementation of the circular economy we observe. However, our results demonstrate that this remains insufficient for climate targets.
Haas et al.'s [28] century-long perspective on global material flows identifies Japan and South Korea as achieving the highest recycling rates globally through comprehensive policy packages combining extended producer responsibility, landfill restrictions, and economic incentives. Our scenario modelling implicitly incorporates these best practices, with aggressive scenarios that approach technical and institutional frontiers observed internationally.
5.6. Methodological Contributions and Integration with Climate Assessment
Our MCA framework addresses the critical gaps identified by Ramboll et al. [29] in methodologies for quantifying circular-economy climate benefits. Their report for the European Commission emphasises the need for approaches that capture both territorial and consumption-based emissions while maintaining sectoral resolution. Our framework achieves this through material-specific carbon intensities derived from life-cycle assessment, though we acknowledge limitations in capturing the full supply chain complexity.
The IPCC's Sixth Assessment Report [30] highlights material efficiency as an underexplored mitigation strategy, noting that demand-side measures could reduce emissions by 50% by 2050. Our quantification of super-elastic demand relationships (+1.148 elasticity) provides empirical support for prioritising demand reduction, complementing IPCC's synthesis with EU-specific parameters suitable for policy modelling.
Hertwich et al.'s [31] comprehensive review identifies material-efficiency strategies for buildings, vehicles, and electronics as offering a 25-50% potential for emission reduction. Our economy-wide assessment, while showing lower aggregate potential due to sectoral averaging, confirms that targeted interventions in high-impact sectors could achieve reductions within Hertwich's range. This reconciliation between sectoral and economy-wide assessments provides crucial insights for policy prioritisation.
Recent advances in high-resolution material stock mapping by Wang et al. [32] for Belgian infrastructure demonstrate the potential for spatially explicit circular economy planning. While our EU27-level analysis lacks such spatial resolution, future work could integrate these methodologies to identify regional hotspots and optimise material loop closure at appropriate scales.
5.7. System Dynamics and Feedback Effects
Fragkos [33] analyses systemic implications of combining energy efficiency and circular economy strategies, identifying potential synergies and trade-offs. Our decomposition reveals offsetting activity and intensity effects, corroborating Fragkos's finding that rebound effects can significantly diminish theoretical mitigation potential. The interaction between renewable energy deployment and material recycling deserves particular attention: as electricity grids decarbonise, the relative advantage of recycling over primary production may diminish for electricity-intensive materials like aluminium, potentially reducing circular economy incentives without appropriate policy intervention.
Ward et al.'s [34] analysis, which questions the possibility of absolute decoupling between GDP growth and environmental impact, provides essential context for our findings. Their thermodynamic arguments suggest fundamental limits to efficiency improvements, aligning with our observation that intensity gains (−0.867 ln units) cannot fully offset activity growth (+0.584) and structural change (+0.259). This supports our conclusion that demand-side interventions are essential, not optional, for achieving climate targets.
The methodological framework established by Ang and Xu [35] for index decomposition analysis has been instrumental in isolating different drivers of environmental change. Our adaptation of LMDI to material flows extends this framework, demonstrating its versatility beyond traditional energy applications while maintaining mathematical rigour and policy relevance.
5.8. Future Research Directions
Our analysis opens several avenues for advancing understanding of circular economy-climate linkages:
While our economy-wide analysis reveals aggregate patterns, sectoral decomposition would illuminate heterogeneous dynamics. Priority sectors include:
- – Construction: Given the dominance of non-metallic minerals (52% of DMC) and the low recycling potential of cement (−18%), research should focus on alternative materials, modular construction, and building stock optimisation [23].
- – Automotive: The transition to electric vehicles fundamentally alters material requirements and recycling dynamics, particularly for batteries and rare earth elements.
- – Electronics: High-value materials with significant embodied carbon merit targeted analysis of recycling barriers and design-for-disassembly strategies [31].
Our flow-based analysis could be extended by explicitly modelling dynamic stock changes following Wiedenhofer et al.'s [3] framework for tracking material accumulation in infrastructure and buildings. This would enable assessment of stock saturation scenarios [26], retrofit potentials, and optimal replacement timing.
Technical potential means little without implementation capacity. Research priorities include:
Integration of our MCA framework with integrated assessment models (IAMs) would enable economy-wide scenario analysis incorporating sectoral interactions, rebound effects, and co-benefits [29,30]. Recent initiatives to bridge economic modelling and material flows provide templates for such integration.
5.9. Toward Evidence-Based Circular Economy Acceleration
This study provides quantitative evidence that material circularity acceleration is a necessary but insufficient condition for achieving the EU27 climate targets. The recycling elasticity of −0.920 confirms significant decarbonization potential, yet structural constraints—particularly the 97.8% dominance of virgin materials and super-elastic material demand growth—limit achievable reductions under current policy trajectories.
The 633 Mt CO₂ gap between the baseline and the moderate circular economy scenarios by 2030 represents both a massive policy challenge and an opportunity. Achieving moderate scenario outcomes requires immediate implementation of differentiated strategies: high-leverage material mandates (aluminium, plastics) [21,22], innovation support for low-leverage materials (cement) [23], and critically, demand-side interventions to address the +1.148 DMC elasticity.
Our findings validate the theoretical frameworks of the material stock-flow-service nexus [1,2] while providing the empirical quantification necessary for evidence-based policy design. The comprehensive assessment of material-specific pathways [18,19,20] demonstrates that sectoral differentiation is essential, encompassing strategies ranging from maximising metal recycling [21] to breakthrough technologies for cement [23] and chemical recycling for plastics [22].
The integration of our findings with global assessments [25,26,27,28] and methodological frameworks [29,30,31,32,33,34,35] establishes a robust foundation for policy design. As the EU advances toward its 2050 net-zero commitment [17], circular-economy acceleration must transition from a peripheral sustainability strategy to core climate policy, with implementation urgency matching the magnitude of the untapped mitigation potential our analysis reveals.
6. Conclusions
This study provides empirical evidence that material circularity constitutes a significant lever for climate mitigation in the EU27. By combining decomposition analysis with elasticity-based scenario modelling, we evaluate the contributions of recycling and material-intensity improvements to the reduction of material-embedded emissions. The results indicate that while recycling rates increased by 42% between 2015 and 2022, virgin materials continue to dominate, accounting for over 97% of total emissions from material use. Decomposition findings show that, although modest, improvements in carbon intensity have been the primary factor counteracting the upward pressure from increased material consumption.
Projections to 2050, based on empirically derived elasticities, reveal that policy ambition has a greater influence on emissions outcomes than parameter uncertainty. The aggressive circular-economy scenario achieves emissions reductions exceeding 90%, aligning with the EU’s net-zero targets, whereas the baseline scenario falls well short. Recycling elasticity emerges as a statistically significant driver of decarbonisation, with each 1% annual increase in recycling rates resulting in a 0.92% reduction in emissions.
These findings carry three key implications. First, incremental policy approaches are insufficient; achieving the EU’s climate objectives requires structural transformation of material systems. Second, supply-side measures must be complemented by demand-side strategies, including material efficiency standards and circular product design. Third, a differentiated sectoral approach is critical—materials such as aluminium and plastics offer high mitigation potential, while cement-intensive sectors require technological innovation beyond conventional recycling.
In conclusion, meeting the EU’s 2030 and 2050 climate targets will depend on coordinated efforts to accelerate circularity, reduce material throughput, and redesign material-intensive production systems. Without this alignment, emissions from material use will remain incompatible with long-term climate objectives.
Author Contributions
Conceptualisation, O.P., K.W., A.K., O.L., K.P., M.N. and Ol.P.; methodology, O.P., K.W., A.K., O.L., K.P., M.N. and Ol.P.; software, O.P., K.W., A.K., O.L., K.P., M.N. and Ol.P.; validation, O.P., K.W., A.K., O.L., K.P., M.N. and Ol.P.; formal analysis, O.P., K.W., A.K., O.L., K.P., M.N. and Ol.P.; investigation, O.P., K.W., A.K., O.L., K.P., M.N. and Ol.P.; resources, O.P., K.W., A.K., O.L., K.P., M.N. and Ol.P.; data curation, O.P., K.W., A.K., O.L., K.P., M.N. and Ol.P.; writing—original draft preparation, O.P., K.W., A.K., O.L., K.P., M.N. and Ol.P.; writing—review and editing, O.P., K.W., A.K., O.L., K.P., M.N. and Ol.P.; visualization, O.P., K.W., A.K., O.L., K.P., M.N. and Ol.P.; supervision, O.P., K.W., A.K., O.L., K.P., M.N. and Ol.P.; project administration, O.P., K.W., A.K., O.L., K.P., M.N. and Ol.P.; funding acquisition, K.W. and A.K. All authors have read and agreed to the published version of the manuscript.
Funding
This work was supported by a subsidy from the Ministry of Education and Science for the AGH University of Science and Technology in Kraków
Data Availability Statement
Data analyses were performed in Python 3.10 using pandas, numpy, scipy, and statsmodels packages. All analysis scripts and model code used in this study are available from the corresponding author upon reasonable request. Initial data and all calculations supporting the findings of this study are openly available in Zenodo at https://doi.org/10.5281/zenodo.17489007.
Conflicts of Interest
The authors declare that they have no conflicts of interest.
Appendix
Table A1.
Data Sources, Temporal Coverage, and Spatial Resolution.
| Dataset | Source (Table code) |
Indicator | Unit | Period | Observations |
|---|---|---|---|---|---|
| Material Flow Accounts (MFA) | Eurostat (ENV_AC_MFA) | Domestic Material Consumption (DMC) by material type | Thousand tonnes | 2015–2024 | 50 observations (5 materials × 10 years) |
| Emissions Accounts | Eurostat (ENV_AC_SD) | Sectoral greenhouse gas emissions by sector | Mt CO₂ eq. | 1990–2022 | 33 years |
| Circular Material Rate (CMR) | Eurostat (ENV_AC_CUR) | Percentage of circular material inputs in total material consumption | % | 2014–2023 | 10 years |
| Recycling Rates | Eurostat (ENV_AC_RP) | Material-specific recycling rates | % | 2014–2023 | 10 years (paper, glass, metals, plastics) |
| Waste Generation | Eurostat (ENV_WASGEN) | Total and sectoral waste generation | Mt | 2004–2022 | 19 years |
Table A2.
Summary of Key Datasets and Time Periods.
| Analysis Component | Primary Data | Period | Use |
|---|---|---|---|
| MCA Accounting | DMC + Emissions by material | 2015–2022 | Bottom-up carbon accounting |
| LMDI Decomposition | Sectoral emissions + DMC | 2015–2022 | Effect isolation (activity/structure/intensity) |
| Elasticity Estimation | All CE indicators | 2004–2022 | Causal relationships (material flow → emissions) |
| Historical Context | Sectoral emissions | 1990–2022 | Long-term trajectory visualization |
| Scenario Analysis | CE parameters | 2022–2050 | Policy projections |
References
- Haberl, H.; Wiedenhofer, D.; Erb, K.-H.; Görg, C.; Krausmann, F. The Material Stock–Flow–Service Nexus: A New Approach for Tackling the Decoupling Conundrum. Sustainability 2017, 9, 1049. [Google Scholar] [CrossRef]
- Haberl, H.; Wiedenhofer, D.; Pauliuk, S.; Krausmann, F.; Müller, D.B.; Fischer-Kowalski, M. Contributions of Sociometabolic Research to Sustainability Science. Nat. Sustain. 2019, 2, 173–184. [Google Scholar] [CrossRef]
- Wiedenhofer, D.; Streeck, J.; Wieland, H.; Grammer, B.; Baumgart, A.; Plank, B.; Helbig, C.; Pauliuk, S.; Haberl, H.; Krausmann, F. From Extraction to End-Uses and Waste Management: Modelling Economy-Wide Material Cycles and Stock Dynamics Around the World. J. Ind. Ecol. 2024, 28, 1464–1480. [Google Scholar] [CrossRef] [PubMed]
- European Statistical Office (Eurostat). Circular Economy - Material Flows. Available online: https://ec.europa.eu/eurostat/statistics-explained/index.php?title=Circular_economy_-_material_flows (accessed on 30 May 2025).
- Krausmann, F.; Wiedenhofer, D.; Lauk, C.; Haas, W.; Tanikawa, H.; Fishman, T.; Miatto, A.; Schandl, H.; Haberl, H. Global Socioeconomic Material Stocks Rise 23-Fold over the 20th Century and Require Half of Annual Resource Use. Proc. Natl. Acad. Sci. USA 2017, 114, 1880–1885. [Google Scholar] [CrossRef] [PubMed]
- Haberl, H.; Wiedenhofer, D.; Virág, D.; Kalt, G.; Plank, B.; Brockway, P.; Fishman, T.; Hausknost, D.; Krausmann, F.; Leon-Gruchalski, B.; et al. A Systematic Review of the Evidence on Decoupling of GDP, Resource Use and GHG Emissions, Part II: Synthesizing the Insights. Environ. Res. Lett. 2020, 15, 065003. [Google Scholar] [CrossRef]
- Karakaya, E.; Bostan, A.; Özçağ, M. Decomposition and Decoupling Analysis of Energy-Related Carbon Emissions in Turkey. Environ. Sci. Pollut. Res. 2019, 26, 32080–32091. [Google Scholar] [CrossRef] [PubMed]
- Dong, J.; Li, C.; Wang, Q. Decomposition of Carbon Emission and Its Decoupling Analysis and Prediction with Economic Development: A Case Study of Industrial Sectors in Henan Province. J. Clean. Prod. 2021, 321, 129019. [Google Scholar] [CrossRef]
- Streeck, J.; Dammerer, Q.; Wiedenhofer, D.; Krausmann, F. The Role of Socio-Economic Material Stocks for Natural Resource Use in the United States of America from 1870 to 2100. J. Ind. Ecol. 2021, 25, 1486–1502. [Google Scholar] [CrossRef]
- European Environment Agency. Cutting Greenhouse Gas Emissions through Circular Economy Actions in the Buildings Sector; EEA Report No. 05/2022; European Environment Agency: Copenhagen, Denmark, 2022.
- European Environment Agency. Capturing the Climate Change Mitigation Benefits of Circular Economy and Waste Sector Policies and Measures; EEA Briefing; European Environment Agency: Copenhagen, Denmark, 2023. [Google Scholar]
- E4S Centre. Present and Future of Circular Economy in Europe; E4S White Paper 2024-2; Enterprise for Society Centre: Lausanne, Switzerland, 2024. [Google Scholar]
- Krausmann, F.; Wiedenhofer, D.; Haberl, H. Growing Stocks of Buildings, Infrastructures and Machinery as Key Challenge for Compliance with Climate Targets. Glob. Environ. Change 2020, 61, 102034. [Google Scholar] [CrossRef]
- Wiedenhofer, D.; Virág, D.; Kalt, G.; Plank, B.; Streeck, J.; Pichler, M.; Mayer, A.; Krausmann, F.; Brockway, P.; Schaffartzik, A.; et al. A Systematic Review of the Evidence on Decoupling of GDP, Resource Use and GHG Emissions, Part I: Bibliometric and Conceptual Mapping. Environ. Res. Lett. 2020, 15, 063002. [Google Scholar] [CrossRef]
- Ghisellini, P.; Cialani, C.; Ulgiati, S. A Review on Circular Economy: The Expected Transition to a Balanced Interplay of Environmental and Economic Systems. J. Clean. Prod. 2016, 114, 11–32. [Google Scholar] [CrossRef]
- European Commission. A New Circular Economy Action Plan for a Cleaner and More Competitive Europe; COM(2020) 98 final; European Commission: Brussels, Belgium, 2020. [Google Scholar]
- European Commission. The European Green Deal; COM(2019) 640 final; European Commission: Brussels, Belgium, 2019. [Google Scholar]
- Bataille, C.; Åhman, M.; Neuhoff, K.; Nilsson, L.J.; Fischedick, M.; Lechtenböhmer, S.; Solano-Rodriquez, B.; Denis-Ryan, A.; Stiebert, S.; Waisman, H.; et al. A Review of Technology and Policy Deep Decarbonization Pathway Options for Making Energy-Intensive Industry Production Consistent with the Paris Agreement. J. Clean. Prod. 2018, 187, 960–973. [Google Scholar] [CrossRef]
- Ellen MacArthur Foundation. Completing the Picture: How the Circular Economy Tackles Climate Change; Ellen MacArthur Foundation: Cowes, UK, 2019. [Google Scholar]
- Material Economics. The Circular Economy - A Powerful Force for Climate Mitigation; Material Economics: Stockholm, Sweden, 2018. [Google Scholar]
- IVL Swedish Environmental Research Institute. The Climate Impact of Steel Production; IVL Report; IVL: Stockholm, Sweden, 2019. [Google Scholar]
- APME (Association of Plastics Manufacturers in Europe). Plastics – The Facts 2022; PlasticsEurope: Brussels, Belgium, 2022. [Google Scholar]
- WBCSD (World Business Council for Sustainable Development). Cement Sustainability Initiative; WBCSD: Geneva, Switzerland, 2020. [Google Scholar]
- FEVE (European Container Glass Federation). Glass Recycling Statistics; FEVE: Brussels, Belgium, 2020. [Google Scholar]
- UNEP International Resource Panel. Global Resources Outlook 2019: Natural Resources for the Future We Want; United Nations Environment Programme: Nairobi, Kenya, 2019. [Google Scholar]
- Pauliuk, S.; Müller, D.B. The Role of In-Use Stocks in the Social Metabolism and in Climate Change Mitigation. Glob. Environ. Change 2014, 24, 132–142. [Google Scholar] [CrossRef]
- Kirchherr, J.; Reike, D.; Hekkert, M. Conceptualizing the Circular Economy: An Analysis of 114 Definitions. Resour. Conserv. Recycl. 2017, 127, 221–232. [Google Scholar] [CrossRef]
- Haas, W.; Krausmann, F.; Wiedenhofer, D.; Lauk, C.; Mayer, A. Spaceship Earth's Odyssey to a Circular Economy - A Century Long Perspective. Resour. Conserv. Recycl. 2020, 163, 105076. [Google Scholar] [CrossRef]
- Ramboll; Ecologic Institute; Fraunhofer ISI. Circular Economy and Climate Change Mitigation; Report for the European Commission; European Commission: Brussels, Belgium, 2020.
- IPCC. Climate Change 2022: Mitigation of Climate Change. Contribution of Working Group III to the Sixth Assessment Report of the Intergovernmental Panel on Climate Change; Cambridge University Press: Cambridge, UK, 2022. [Google Scholar]
- Hertwich, E.G.; Ali, S.; Ciacci, L.; Fishman, T.; Heeren, N.; Masanet, E.; Asghari, F.N.; Olivetti, E.; Pauliuk, S.; Tu, Q.; et al. Material Efficiency Strategies to Reduce Greenhouse Gas Emissions Associated with Buildings, Vehicles, and Electronics—A Review. Environ. Res. Lett. 2019, 14, 043004. [Google Scholar] [CrossRef]
- Wang, Z.; Wiedenhofer, D.; Stephan, A.; Perrotti, D.; Van den Bergh, W.; Cao, Z. High-Resolution Mapping of Material Stocks in Belgian Road Infrastructure: Material Efficiency Patterns, Material Recycling Potentials, and Greenhouse Gas Emissions Reduction Opportunities. Environ. Sci. Technol. 2023, 57, 12674–12688. [Google Scholar] [CrossRef] [PubMed]
- Fragkos, P. Analysing the Systemic Implications of Energy Efficiency and Circular Economy Strategies in the Decarbonisation Context. AIMS Energy 2022, 10, 191–218. [Google Scholar] [CrossRef]
- Ward, J.D.; Sutton, P.C.; Werner, A.D.; Costanza, R.; Mohr, S.H.; Simmons, C.T. Is Decoupling GDP Growth from Environmental Impact Possible? PLoS One 2016, 11, e0164733. [Google Scholar] [CrossRef] [PubMed]
- Ang, B.W.; Xu, X.Y. Tracking Industrial Energy Efficiency Trends Using Index Decomposition Analysis. Energy Econ. 2013, 40, 1014–1021. [Google Scholar] [CrossRef]
Figure 1.
Emissions Trends (1990-2022)].
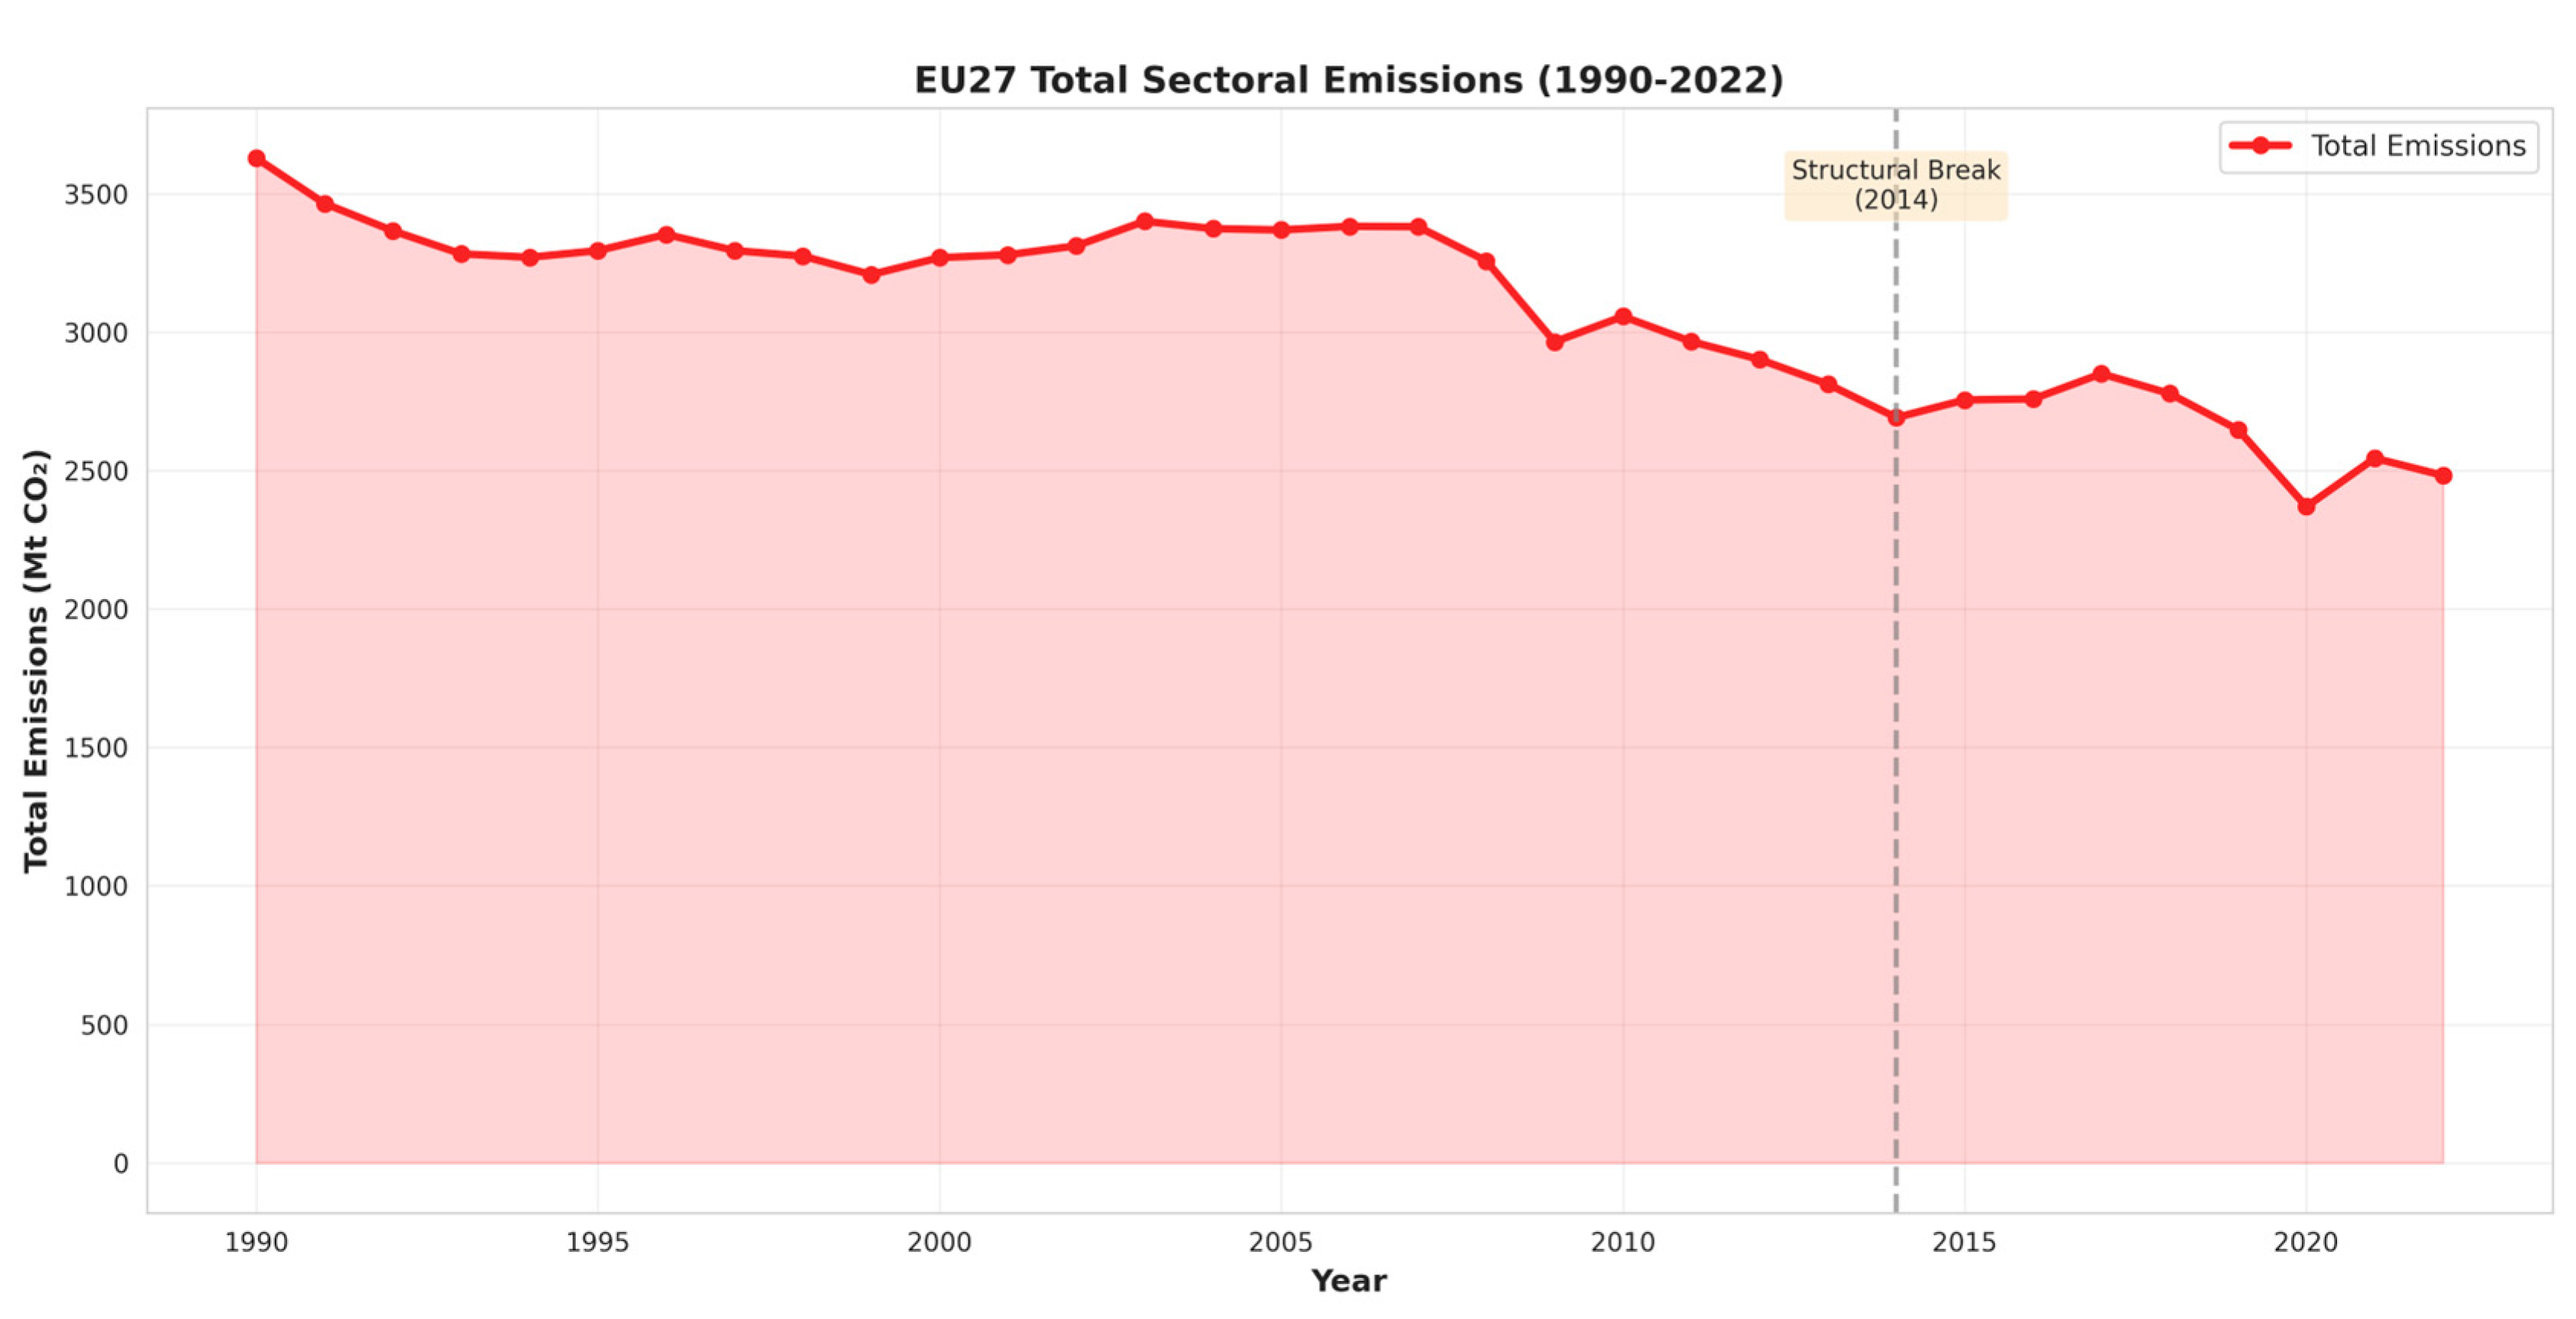
Figure 2.
Material Flows (DMC) Trends.
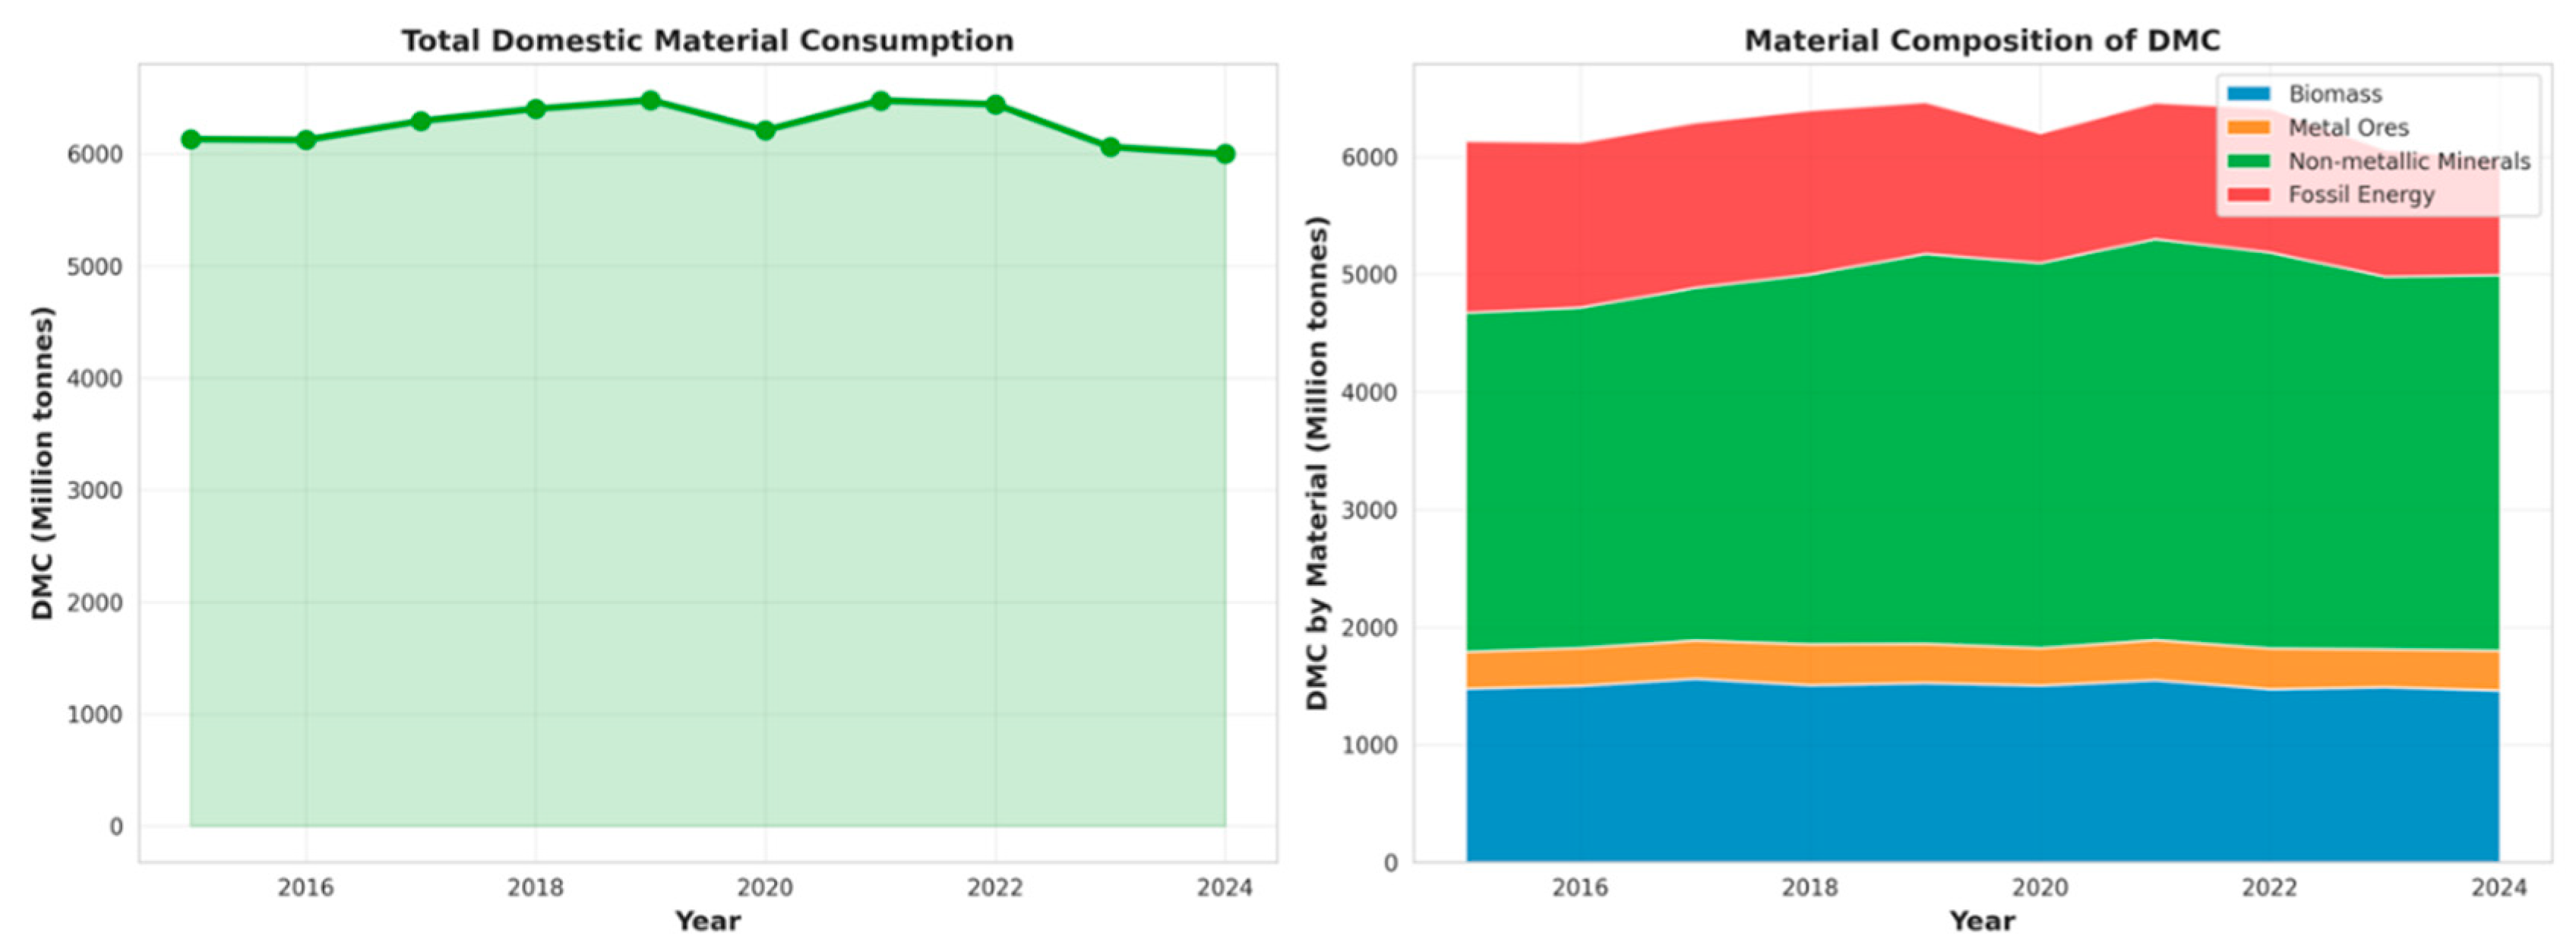
Figure 3.
Trends in Material Recycling Rate and Circular Material Use in the EU.
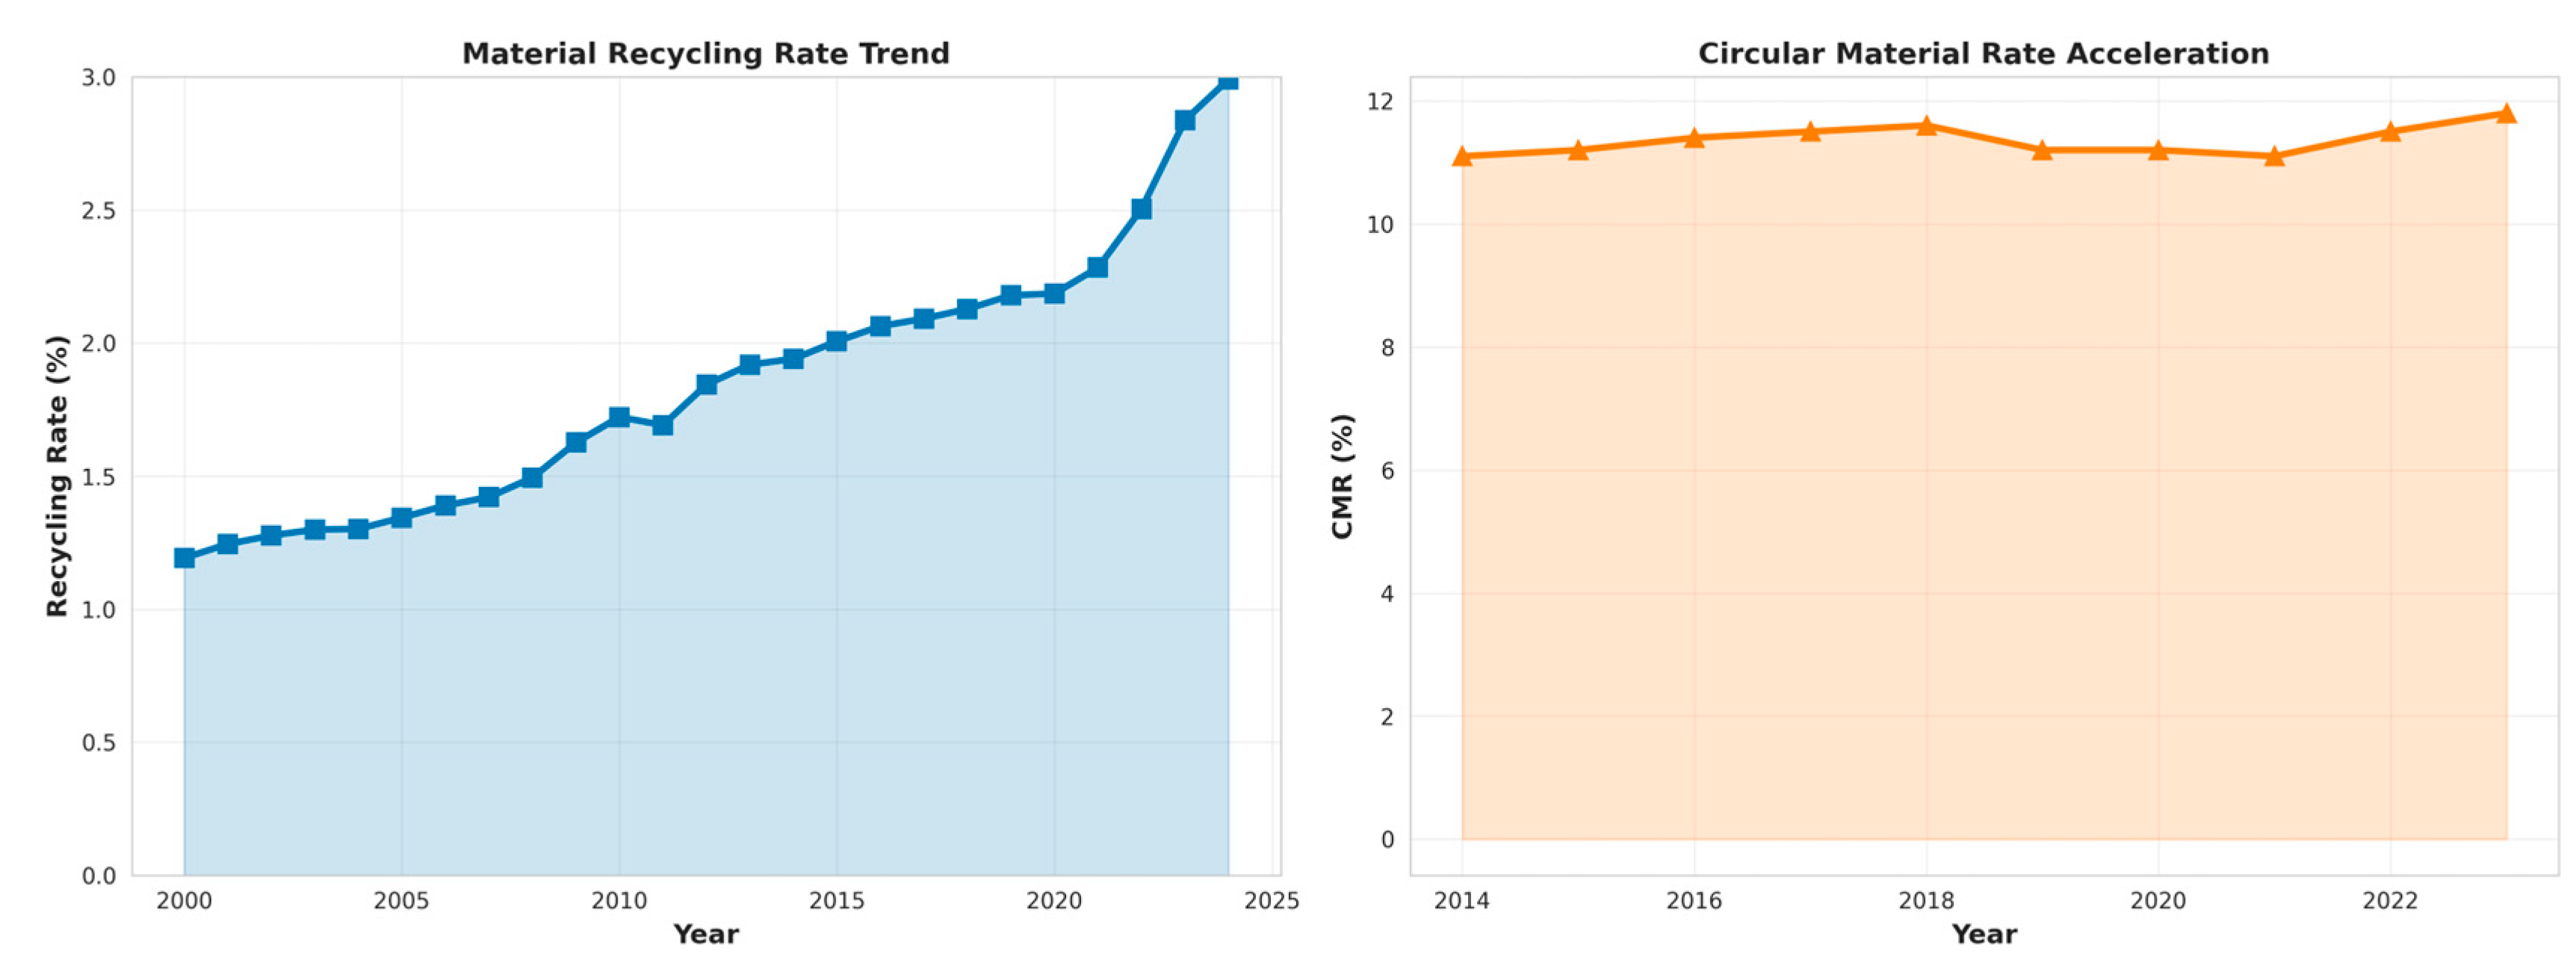
Figure 4.
Material-to-carbon accounting breakdown (2015–2022). Note: Virgin materials generated 11.6 Mt CO₂ annually on average, while recycled materials contributed only 0.10 Mt CO₂—a 117:1 ratio reflecting the structural dominance of virgin sourcing in EU27 production. The slight increase in recycled material emissions post-2015 (from 94 kt CO₂ in 2015 to 115 kt CO₂ in 2022) reflects the +42% acceleration in recycling rates during this period.
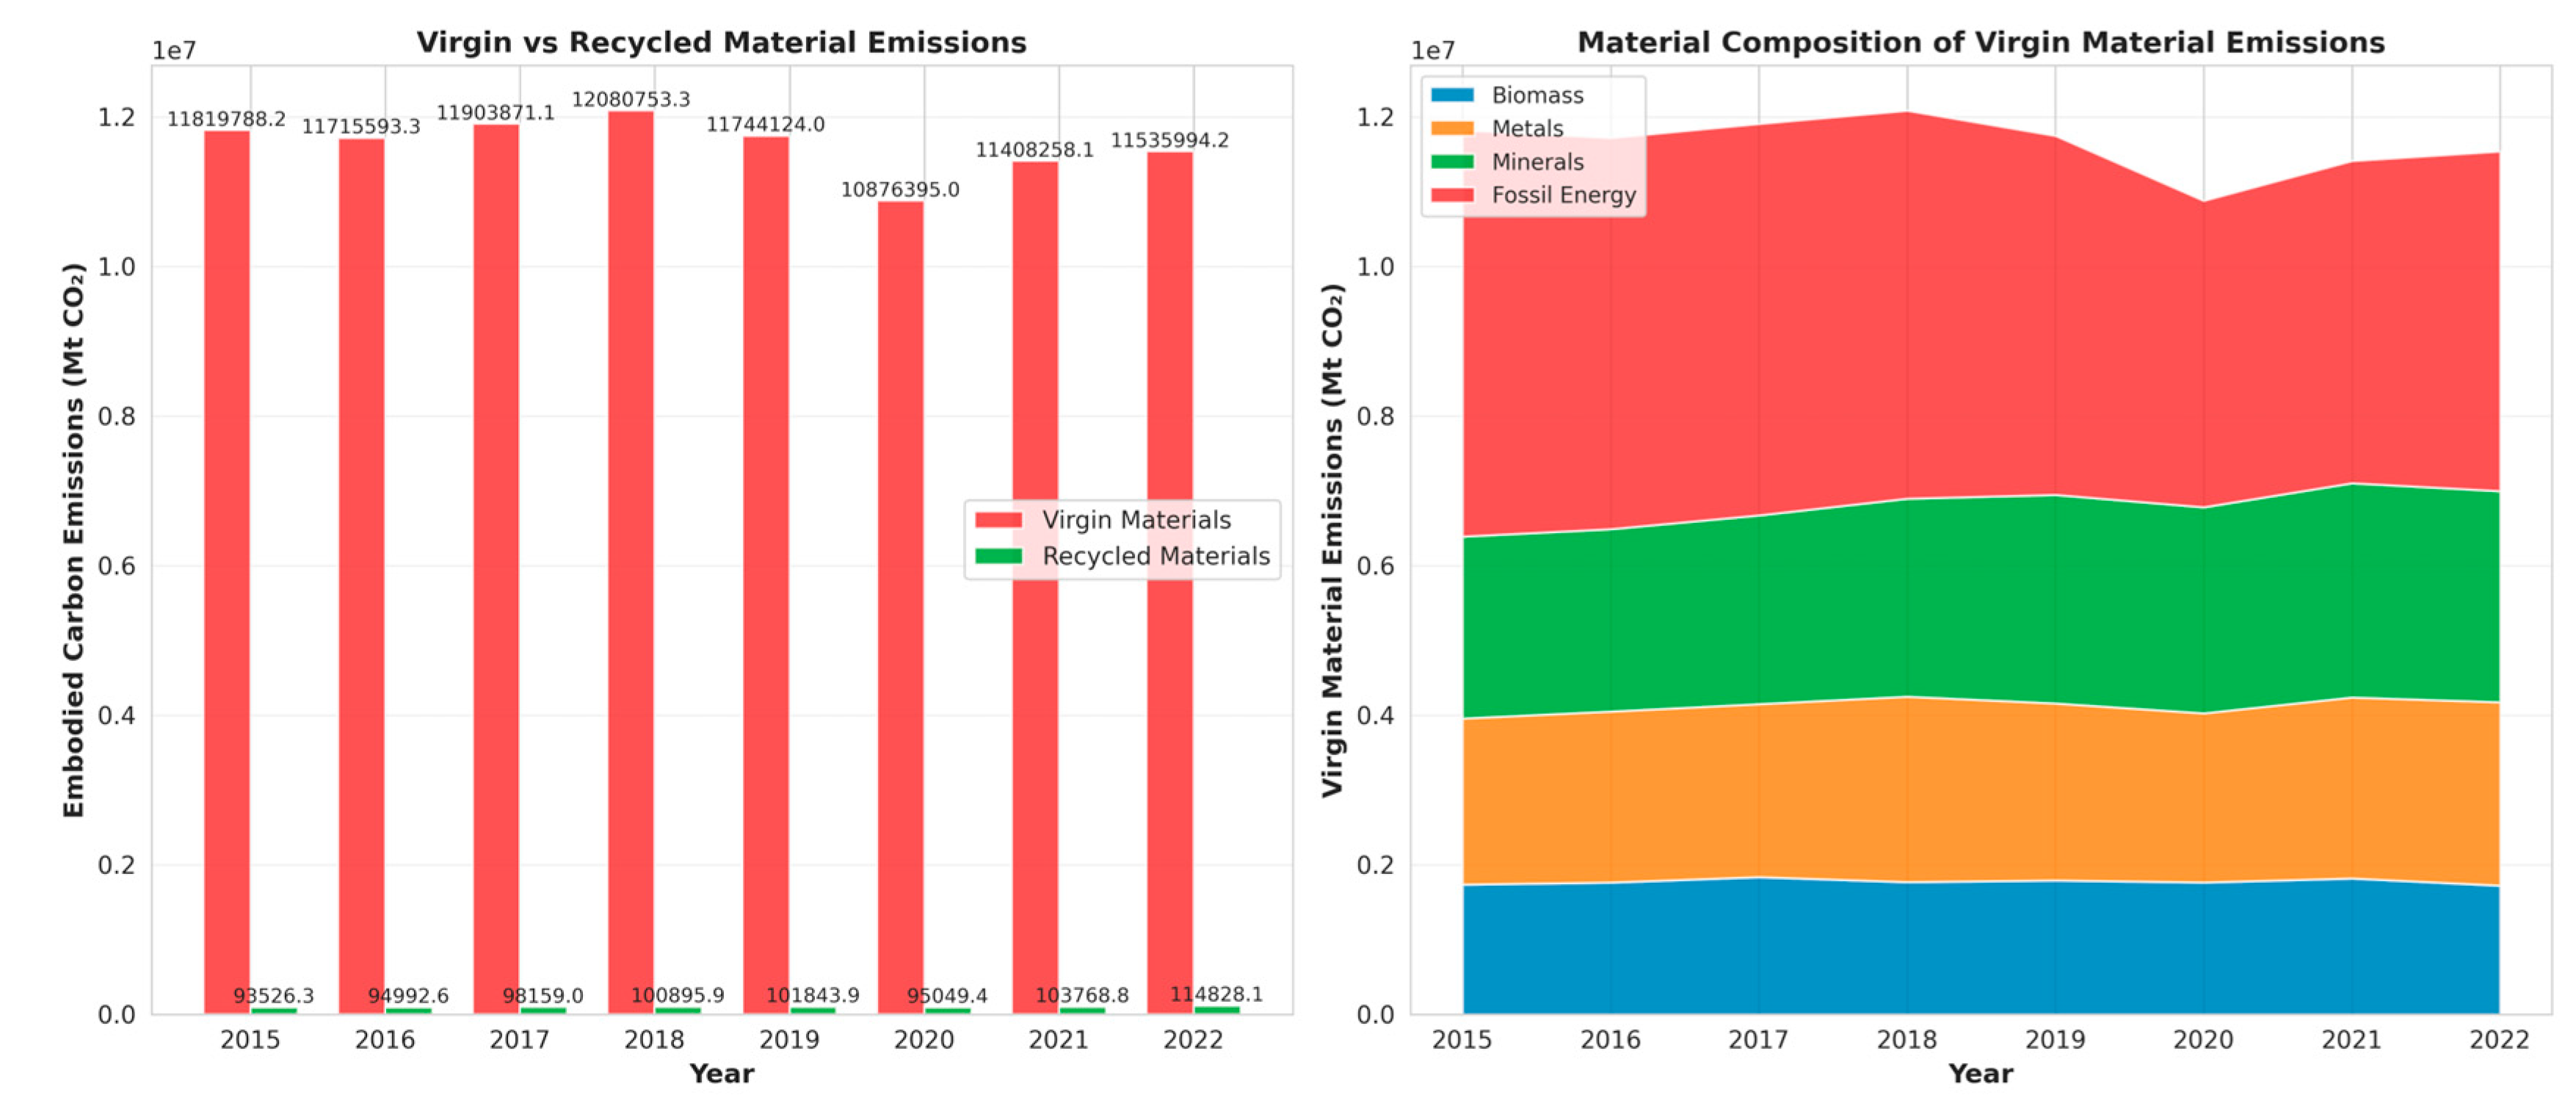
Figure 5.
Embodied carbon intensity by material type (kg CO₂/kg). Note: The differential between virgin and recycled pathways establishes the quantitative leverage for circular economy interventions. Aluminium recycling yields 94% emissions savings, providing the highest decarbonization potential. The weighted average across all materials shows a potential −62% reduction, confirming that material sourcing shifts represent a significant technical opportunity for EU27 emissions reduction.
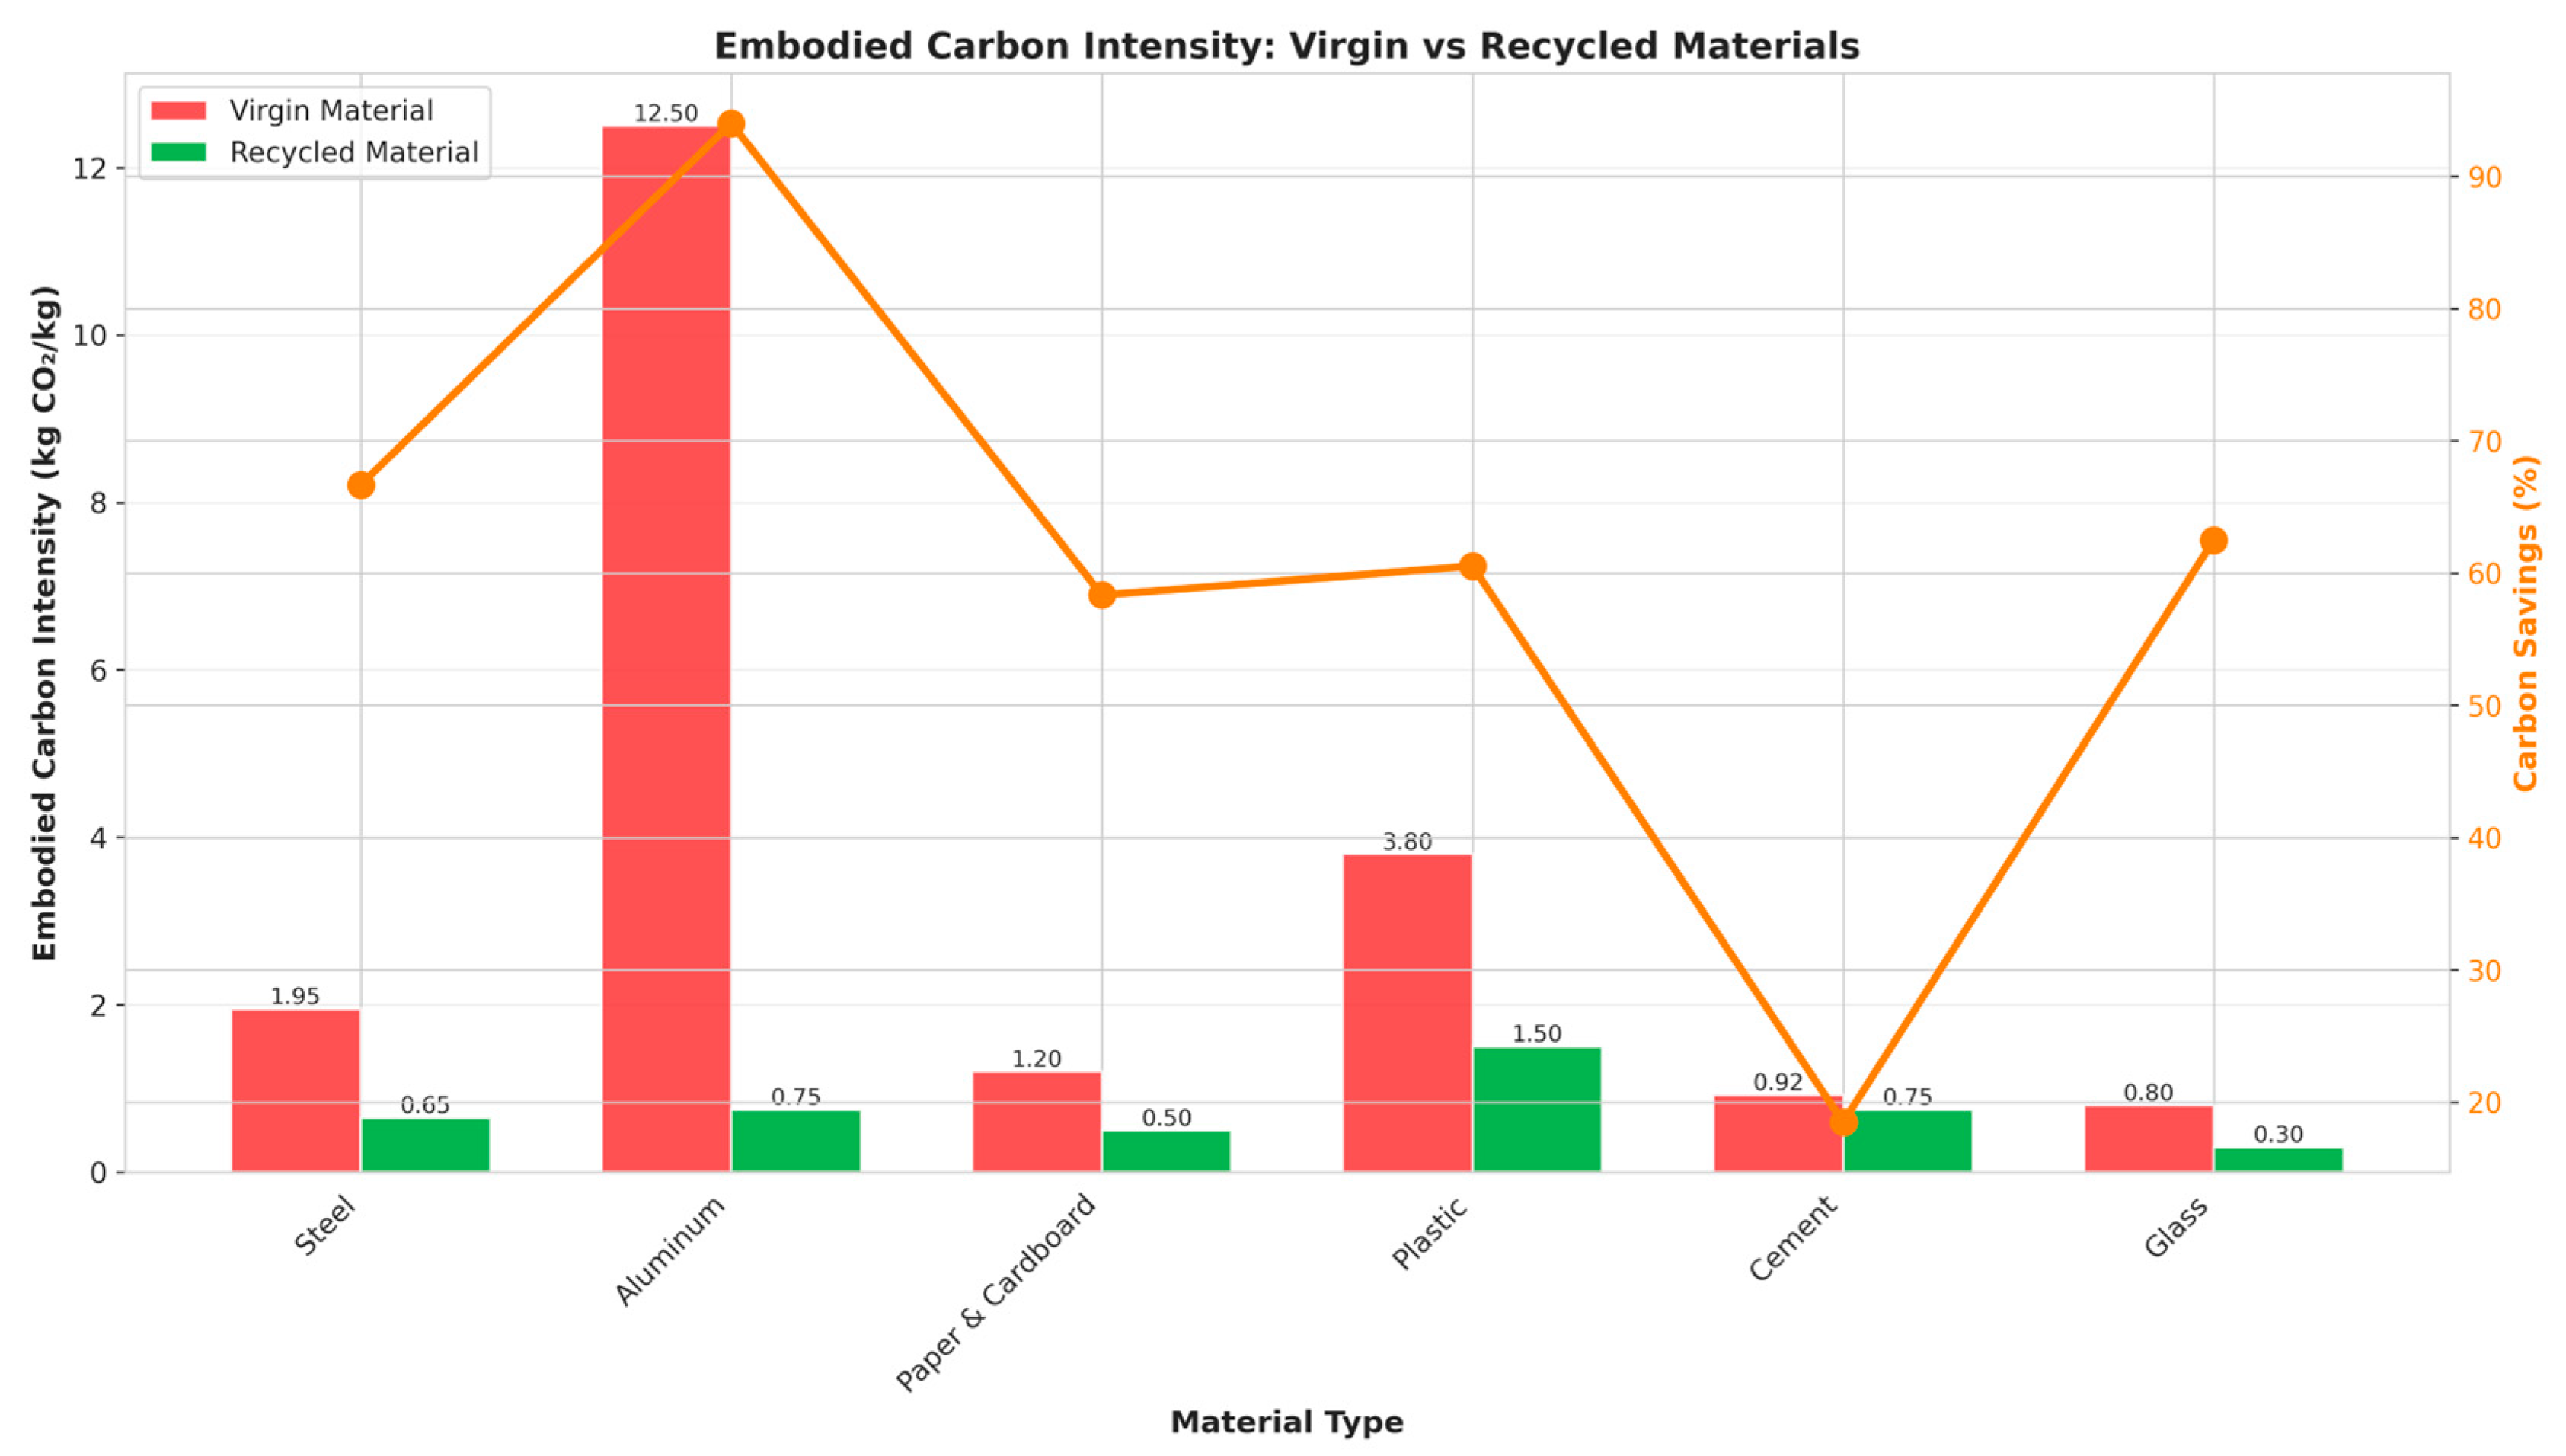
Figure 6.
LMDI decomposition (2015–2022). Note: decomposition reveals that material circularity improvements (intensity effect = −0.867 ln units, −86.7% of total change) successfully counteracted opposing pressures from increased material consumption (+0.584 ln units, activity effect) and compositional shifts toward construction materials (+0.259 ln units, structure effect)—net result: −2.4% reduction in virgin material emissions despite +5.1% growth in material throughput.

Figure 7.
Elasticity coefficients with 95% confidence intervals. Note: The recycling elasticity of −0.920 (marked with *) is statistically significant at p<0.05, confirming that a 1% increase in recycling rates is associated with a −0.92% reduction in emissions. The DMC elasticity (+1.148) indicates that material volume growth exerts intense upward pressure on emissions, while the CMR elasticity estimate is imprecise (wide confidence interval).

Figure 8.
Model diagnostics for elasticity regressions. Note: The Left panel shows a high R-squared (0.773), indicating that variations in material flows and recycling rates explain approximately 77% of year-to-year variation in emissions. Right panel demonstrates that DMC and CMR elasticities are larger in magnitude than recycling elasticity, suggesting that material volume and composition effects dominate short-term emissions dynamics.
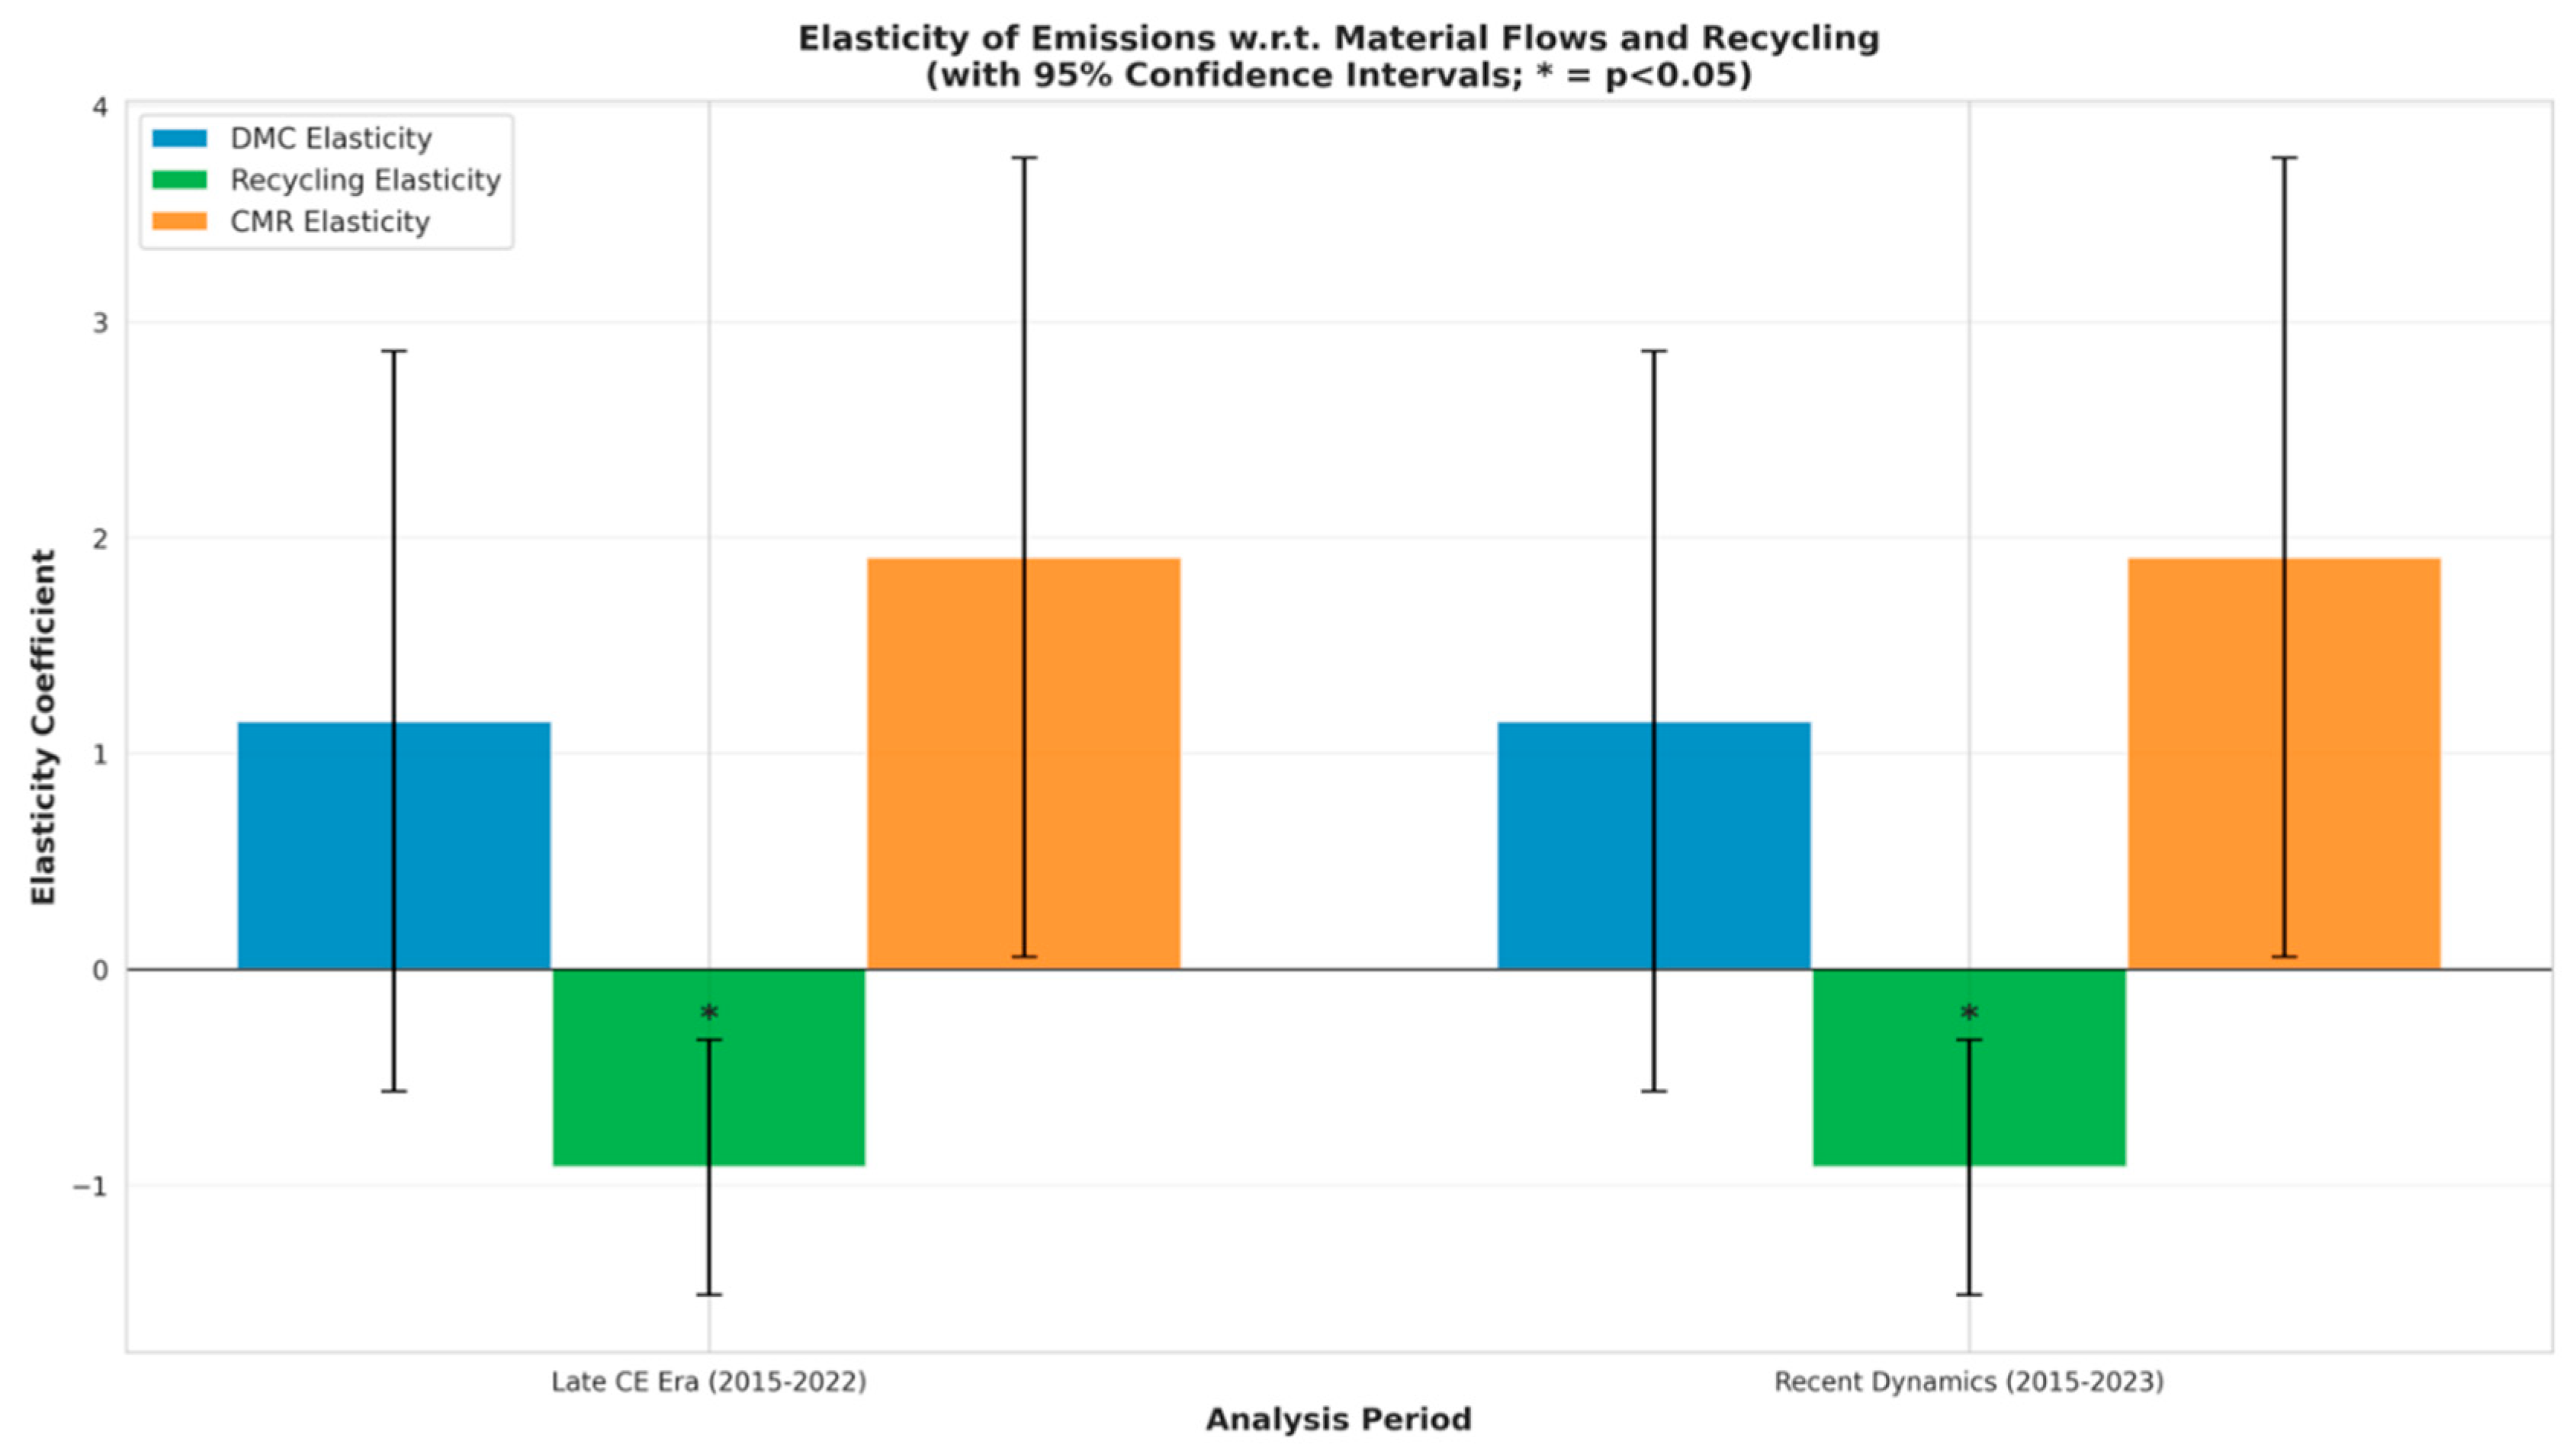
Figure 9.
Emissions Pathways (2022–2050): Three Policy Scenarios with 95% Confidence Intervals (Monte Carlo, N=10,000). Note: Linear Baseline (red dashed): Gradual emissions reduction, reaching 502 Mt CO₂ by 2050 (−78.8% vs 2022); Moderate CE (orange solid): Accelerated reduction, reaching 162 Mt CO₂ by 2050 (−93.2%); Aggressive CE (green solid): Steep reduction, reaching 101 Mt CO₂ by 2050 (−95.7%); Uncertainty bands (shaded regions) around 2030 and 2050 projections show widening confidence intervals with increasing time horizon; Vertical dashed lines mark 2030 and 2050 policy target years.
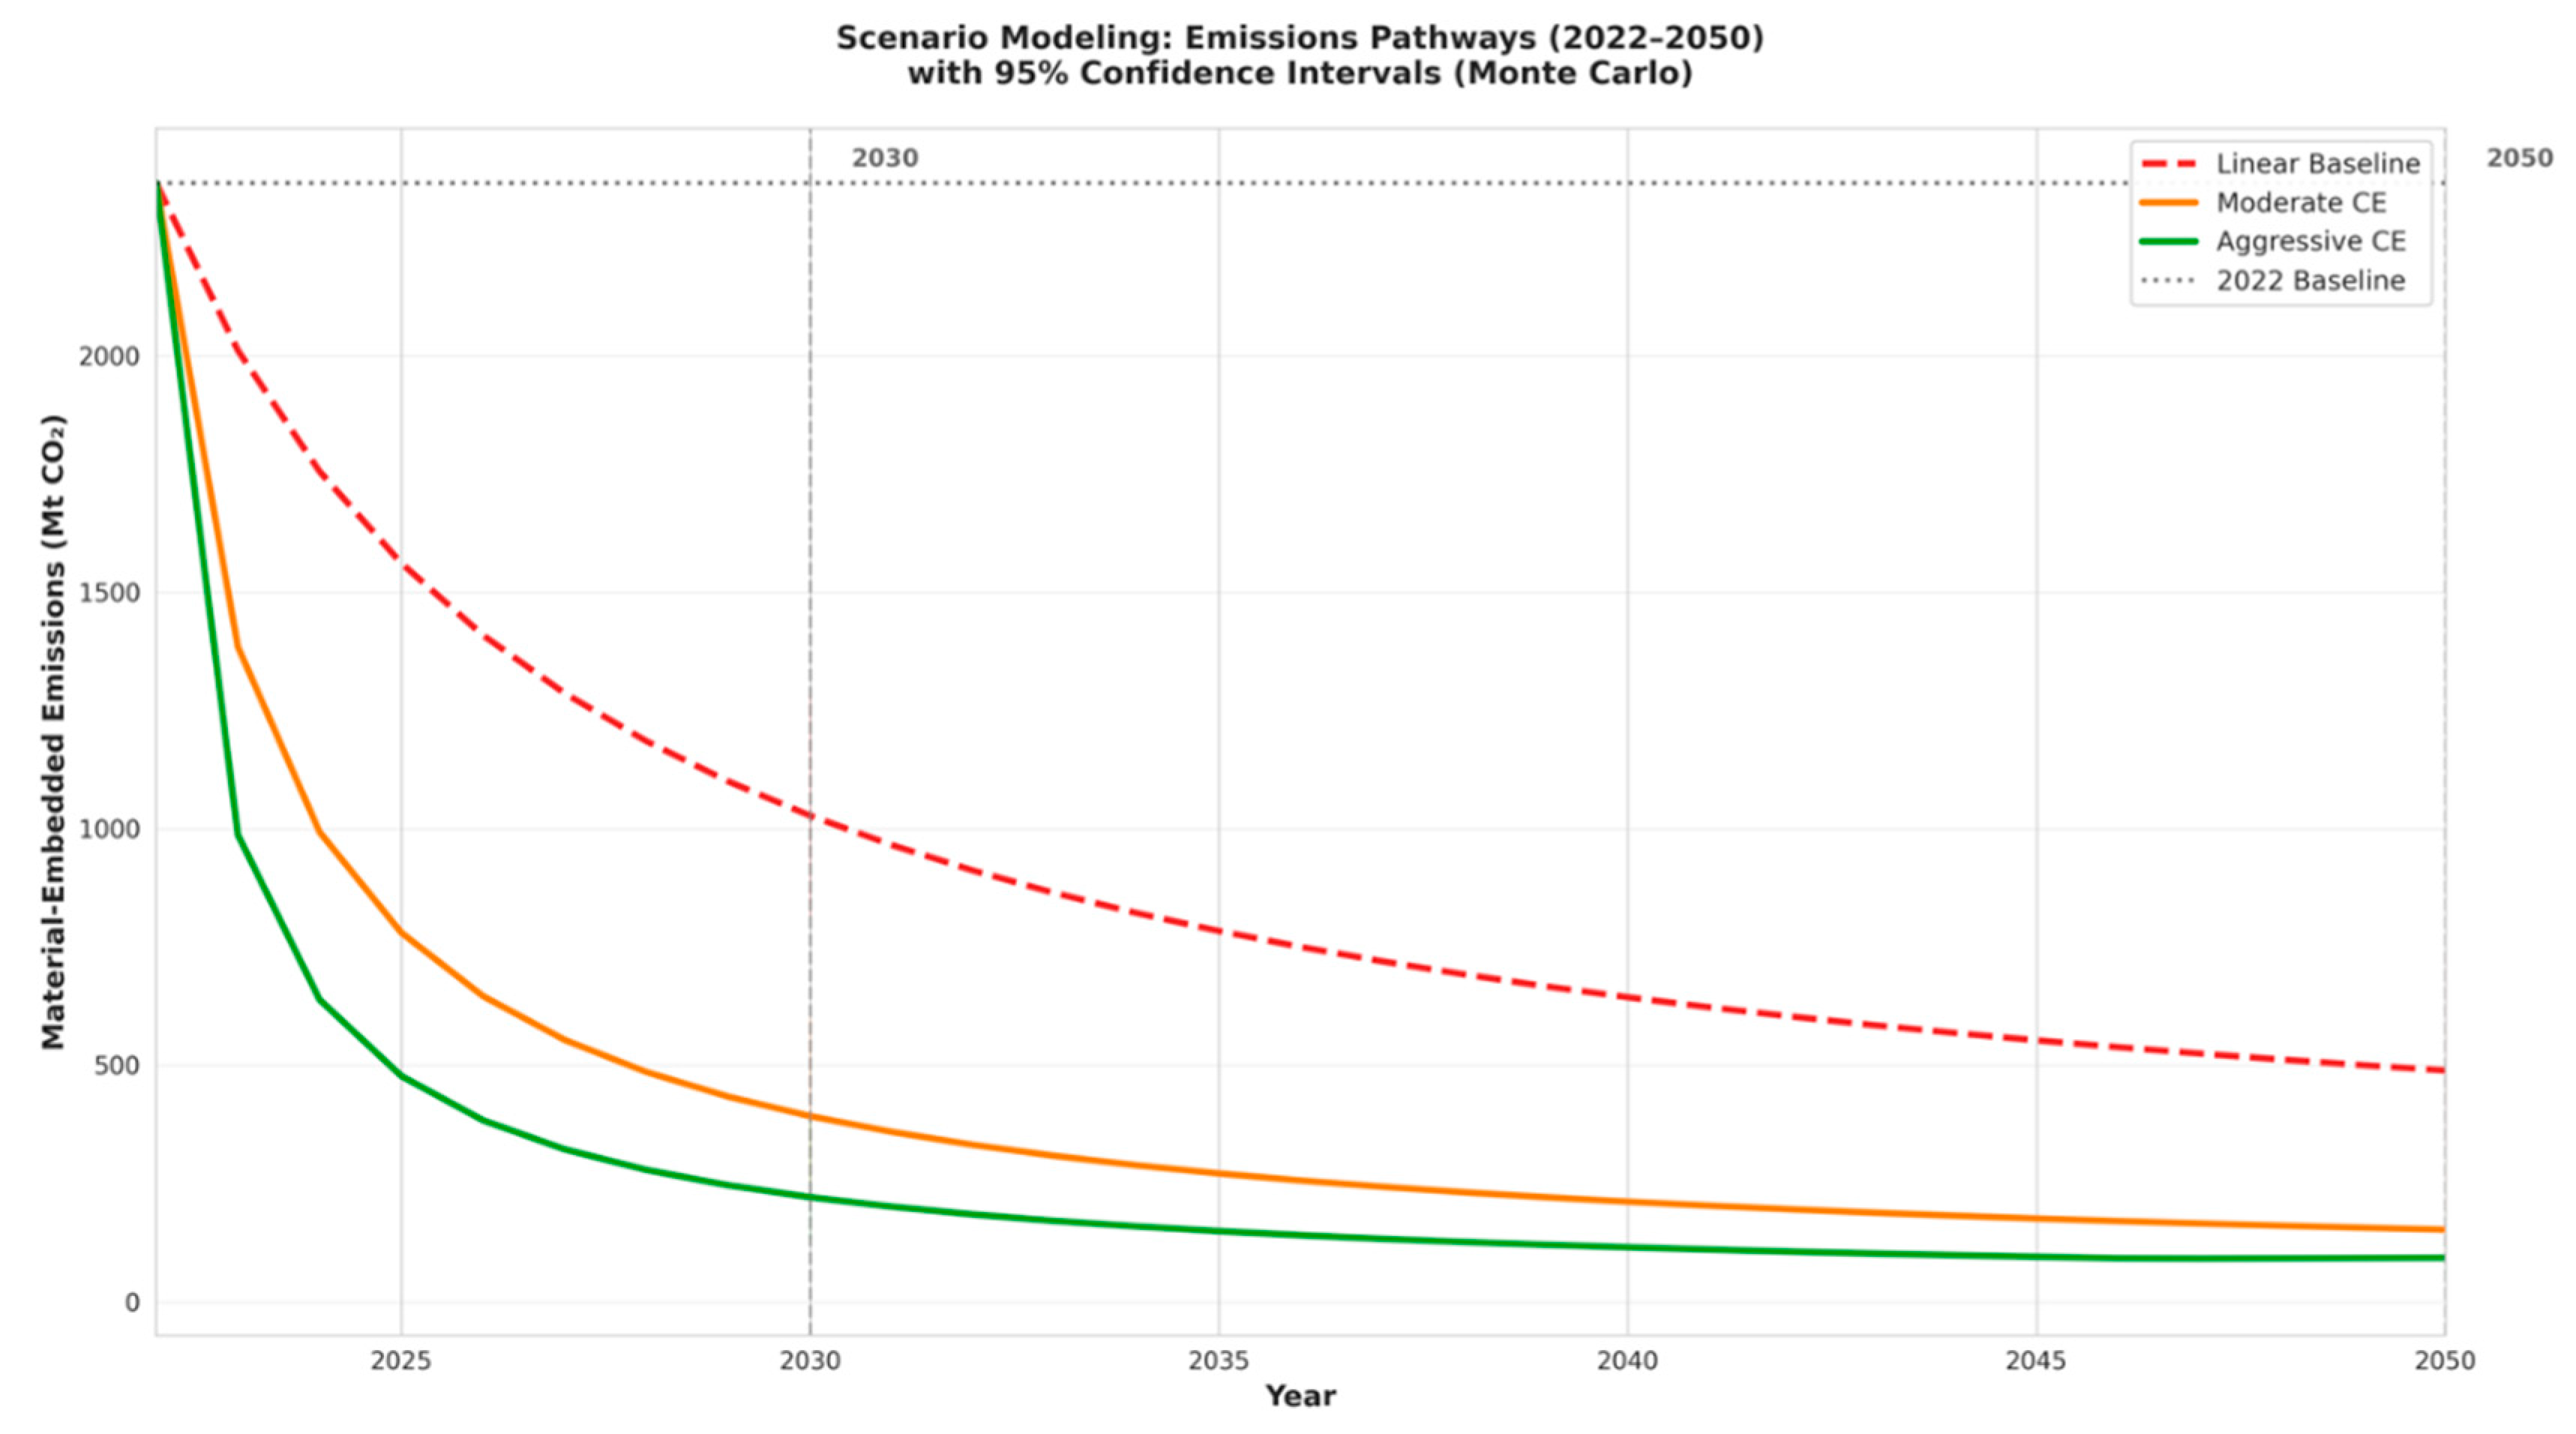
Figure 10.
Scenario Comparison: 2030 and 2050 Projections with 95% Confidence Intervals (Monte Carlo, N=10,000). Note: Left panel (2030): Bar chart comparing three scenarios with error bars representing 95% CI, Linear Baseline: 1,036 Mt CO₂ (−56.2%), Moderate CE: 403 Mt CO₂ (−82.9%), Aggressive CE: 231 Mt CO₂ (−90.2%). Right panel (2050): Bar chart comparing 2050 outcomes - Linear Baseline: 502 Mt CO₂ (−78.8%), Moderate CE: 162 Mt CO₂ (−93.2%), Aggressive CE: 101 Mt CO₂ (−95.7%), Red dashed line indicates 2022 baseline (2,365 Mt CO₂). Error bars represent ±1.96 standard errors from the Monte-Carlo ensemble.

Table 3.
Circular Economy Policy Scenarios and Projected Emissions Outcomes by 2030.
| Scenario | Material Intensity | Recycling Rate Change | Virgin-to-Recycled Mix (2030) | Policy Levers | Interpretation | 2030 Emissions Outcome |
|---|---|---|---|---|---|---|
| A. Linear Baseline (Current Policies) | −0.5% per annum (historical average) | +0.5% per annum (historical pace) | ~80% virgin | — | Continuation of existing policies without acceleration | Baseline for comparison |
| B. Moderate Circular Economy | −1.5% per annum (accelerated decoupling) | +2.0% per annum | 70% virgin | EPR enforcement, recycled content mandates | Implementation of the EU Circular Economy Action Plan | −8% vs. baseline |
| C. Aggressive Circular Economy (Net-Zero Compatible) | −3.0% per annum (structural decoupling) | +4.0% per annum | 50% virgin | >50% recycled content mandates, industrial symbiosis, bioeconomy expansion | Aligned with EU net-zero 2050 commitment | −18% vs. baseline |
Table 4.
Monte Carlo Parameter Distributions.
| Parameter | Distribution | Parameters | Justification |
|---|---|---|---|
| Virgin carbon intensity (CIvirgin) | Normal | μ, σ = 0.12μ | ±12% LCA database variation |
| Recycled carbon intensity (CIrecycled) | Normal | μ, σ = 0.15μ | ±15% process variation |
| Recycling acceleration rate | Uniform | 1%–5% p.a. | Policy uncertainty range |
| Material demand elasticity | Normal | μ = 0.8, σ = 0.15 | Econometric estimates |
Note: μ denotes the mean value of each parameter derived from LCA databases and historical trends.
Table 1.
Embodied Carbon Intensity (ECI) by Material Type.
| Material | Virgin ECI (kg CO₂/kg) | Recycled ECI (kg CO₂/kg) | ECI Differential (%) | Source |
|---|---|---|---|---|
| Steel | 1.95 | 0.65 | −67% | IVL (2019) |
| Aluminum | 12.5 | 0.75 | −94% | Material Economics (2021) |
| Paper & Cardboard | 1.2 | 0.5 | −58% | Eurostat LCA |
| Plastic | 3.8 | 1.5 | −61% | APME (2022) |
| Cement | 0.92 | 0.75 (alternative) | −18% | WBCSD |
| Glass | 0.8 | 0.3 | −63% | FEVE (2020) |
Table 2.
Panel regression results.
| Period | Coverage | Purpose | Sample Size |
|---|---|---|---|
| Early CE Era | 2004–2015 | Baseline recycling rates | 12 years |
| Late CE Era | 2015–2022 | Acceleration phase | 8 years |
| Recent Dynamics | 2015–2023 | CMR acceleration | 9 years |
Table 5.
Temporal availability of key variables.
| Variable | Period | Coverage | Observations |
|---|---|---|---|
| Total Emissions | 1990–2022 | 94.3% | 33 years |
| Domestic Material Consumption (DMC) | 2015–2024 | 28.6% | 10 years |
| Recycling Rates | 2000–2024 | 71.4% | 25 years |
| Circular Material Rate (CMR) | 2014–2023 | 28.6% | 10 years |
| Waste Generation | 2004–2022 | 28.6% | 10 years |
Table 6.
Annual Domestic Material Consumption (DMC) and Year-on-Year Change in the EU27, 2015–2022.
| Year | DMC (Mt) | Year-on-Year Change |
|---|---|---|
| 2015 | 6,133 | — |
| 2016 | 6,125 | −0.1% |
| 2017 | 6,295 | +2.8% |
| 2018 | 6,403 | +1.7% |
| 2019 | 6,481 | +1.2% |
| 2020 | 6,212 | −4.1% (COVID-19) |
| 2021 | 6,477 | +4.3% (recovery) |
| 2022 | 6,444 | −0.5% |
Note: Material consumption increased steadily before the pandemic (+0.8% annually during 2015–2019), followed by a sharp contraction in 2020 (−4.1%) due to COVID-19-related shutdowns. A strong rebound in 2021 (+4.3%) reflected recovery-driven demand, while a marginal decline in 2022 (−0.5%) suggests stabilisation amid the EU energy crisis.
Table 7.
Change in Domestic Material Consumption by Material Type in the EU27, 2015–2022.
| Material Type | 2015 (Mt) | 2022 (Mt) | Change (%) |
|---|---|---|---|
| Biomass | 1,478 | 1,473 | −0.3% |
| Metal Ores | 314 | 348 | +10.8% |
| Non-metallic Minerals | 2,885 | 3,365 | +16.6% |
| Fossil Energy | 1,458 | 1,225 | −15.9% |
| Total | 6,133 | 6,444 | +5.1% |
Table 8.
Average Recycling Rates by Period (2000–2023).
| Period | Mean Recycling Rate (%) | Status |
|---|---|---|
| 2000–2010 | 1.35 ± 0.08 | Baseline establishment |
| 2010–2015 | 1.61 ± 0.06 | Pre-CE Action Plan |
| 2015–2023 | 2.18 ± 0.41 | CE acceleration phase |
Table 10.
Descriptive Statistics for Key Variables (2015–2022).
| Variable | Mean | Std Dev | Min | Max | N |
|---|---|---|---|---|---|
| Emissions (Mt CO₂) | 2,575 | 176 | 2,369 | 2,849 | 8 |
| DMC (Mt) | 6,321 | 146 | 6,125 | 6,481 | 8 |
| Recycling Rate (%) | 2.18 | 0.31 | 1.82 | 2.84 | 8 |
| CMR (%) | 11.3 | 0.25 | 11.1 | 11.8 | 8 |
| Waste Generation (Mt) | 3,036 | 804 | 1,763 | 3,893 | 7 |
Table 11.
Correlation Matrix (2015–2022).
| Total Emissions | DMC | Recycling Rate | CMR | |
|---|---|---|---|---|
| Total Emissions | 1.000 | −0.241 | −0.667 | 0.438 |
| DMC | 1.000 | 0.663 | 0.036 | |
| Recycling Rate | 1.000 | 0.080 | ||
| CMR | 1.000 |
Table 12.
Embodied Carbon Intensity by Material Type (LCA Data).
| Material | Virgin ECI (kg CO₂/kg) | Recycled ECI (kg CO₂/kg) | ECI Differential (%) | Decarbonization Leverage |
|---|---|---|---|---|
| Aluminum | 12.50 | 0.75 | −94% | Very High |
| Steel | 1.95 | 0.65 | −67% | High |
| Plastic | 3.80 | 1.50 | −61% | High |
| Glass | 0.80 | 0.30 | −63% | High |
| Paper & Cardboard | 1.20 | 0.50 | −58% | High |
| Cement | 0.92 | 0.75 | −18% | Low |
Table 13.
Material categories according to Eurostat's Domestic Material Consumption (DMC).
| Eurostat Category | Mapped LCA Materials | Average Virgin ECI (kg CO₂/kg) | Average Recycled ECI (kg CO₂/kg) | ECI Differential (%) |
|---|---|---|---|---|
| Biomass | Paper & Cardboard | 1.20 | 0.50 | −58% |
| Metal ores (gross) | Steel, Aluminum | 7.22 | 0.70 | −90% |
| Non-metallic minerals | Cement, Glass | 0.86 | 0.53 | −39% |
| Fossil energy | Plastic | 3.80 | 1.50 | −61% |
Table 14.
Annual Virgin and Recycled Material Emissions (2015–2022).
| Year | Recycling Rate (%) | Virgin Emissions (Mt CO₂) | Recycled Emissions (kt CO₂) | Total MCA Emissions (Mt CO₂) | Virgin Share (%) |
|---|---|---|---|---|---|
| 2015 | 2.01 | 11.82 | 93.5 | 11.91 | 98.0 |
| 2016 | 2.06 | 11.72 | 95.0 | 11.81 | 97.9 |
| 2017 | 2.09 | 11.90 | 98.2 | 12.00 | 97.9 |
| 2018 | 2.13 | 12.08 | 100.9 | 12.18 | 97.9 |
| 2019 | 2.18 | 11.74 | 101.8 | 11.85 | 97.8 |
| 2020 | 2.19 | 10.88 | 95.0 | 10.97 | 97.8 |
| 2021 | 2.28 | 11.41 | 103.8 | 11.51 | 97.7 |
| 2022 | 2.50 | 11.54 | 114.8 | 11.65 | 97.5 |
Table 15.
Annual LMDI Decomposition Results (2015–2022).
| Period | Emissions Change (%) | Activity Effect (%) | Structure Effect (%) | Intensity Effect (%) |
|---|---|---|---|---|
| 2015–2016 | −0.88 | +166.9 | −1,076.8 | +1,009.9 |
| 2016–2017 | +1.61 | +2,025.5 | −1,080.9 | −844.6 |
| 2017–2018 | +1.49 | +1,383.6 | −1,099.2 | −184.4 |
| 2018–2019 | −2.79 | −507.0 | −1,091.2 | +1,698.2 |
| 2019–2020 | −7.39 | +623.7 | −1,030.5 | +506.7 |
| 2020–2021 | +4.89 | +976.0 | −1,014.0 | +138.0 |
| 2021–2022 | +1.12 | −531.2 | −1,047.2 | +1,678.4 |
Note: Percentage contributions indicate the relative magnitude of each effect in driving total emissions change. Large positive/negative percentages occur during periods with small absolute changes (denominator effect), as seen in 2015–2017.
Table 16.
Panel Regression Results: Elasticity Estimates.
| Parameter | Late CE Era (2015–2022) | Recent Dynamics (2015–2023) |
|---|---|---|
| N observations | 8 years | 8 years |
| Intercept | −6.087 (SE: 7.869, p=0.482) |
−6.087 (SE: 7.869, p=0.482) |
| DMC Elasticity (β₁) | +1.148 (SE: 0.875, p=0.260) |
+1.148 (SE: 0.875, p=0.260) |
| Recycling Elasticity (β₂) | −0.920* (SE: 0.302, p=0.038) |
−0.920* (SE: 0.302, p=0.038) |
| CMR Elasticity (β₃) | +1.908 (SE: 0.944, p=0.113) |
+1.908 (SE: 0.944, p=0.113) |
| R-squared | 0.773 | 0.773 |
| Adj. R-squared | 0.603 | 0.603 |
| Std. Error | 0.041 | 0.041 |
Note: Both periods yield identical results due to data availability constraints. Only years with complete observations across all variables (Emissions, DMC, Recycling Rate, CMR) are included in estimation. *Statistically significant at p<0.05.
Table 17.
2030 Emissions Projections by Scenario (95% Confidence Intervals, N=10,000).
| Scenario | Mean (Mt CO₂) | Median (Mt CO₂) | Std Dev | 95% CI Lower | 95% CI Upper | % Change vs 2022 |
|---|---|---|---|---|---|---|
| Linear Baseline | 1,036 | 1,033 | 119.4 | 814 | 1,284 | −56.2% |
| Moderate CE | 403 | 395 | 89.6 | 253 | 600 | −82.9% |
| Aggressive CE | 231 | 223 | 66.7 | 127 | 389 | −90.2% |
Table 18.
2050 Emissions Projections by Scenario (95% Confidence Intervals, N=10,000).
| Scenario | Mean (Mt CO₂) |
Median (Mt CO₂) |
Std Dev | 95% CI Lower | 95% CI Upper | % Change vs 2022 |
|---|---|---|---|---|---|---|
| Linear Baseline | 502 | — | 121.7 | 323 | 736 | −78.8% |
| Moderate CE | 162 | — | 70.8 | 79 | 289 | −93.2% |
| Aggressive CE | 101 | — | 55.1 | 46 | 195 | −95.7% |
Table 19.
Monte Carlo Parameter Distributions and Rationale.
| Parameter | Distribution | Range/Parameters | Justification |
|---|---|---|---|
| Virgin ECI | Normal | μ, σ=0.12μ | ±12% LCA database variation |
| Recycled ECI | Normal | μ, σ=0.15μ | ±15% process variation |
| Recycling Acceleration | Uniform | [80%, 120%] of scenario value | Policy implementation uncertainty |
| DMC Elasticity | Normal | μ=1.148, σ=0.15 | Econometric estimation uncertainty |
Disclaimer/Publisher’s Note: The statements, opinions and data contained in all publications are solely those of the individual author(s) and contributor(s) and not of MDPI and/or the editor(s). MDPI and/or the editor(s) disclaim responsibility for any injury to people or property resulting from any ideas, methods, instructions or products referred to in the content. |
© 2025 by the authors. Licensee MDPI, Basel, Switzerland. This article is an open access article distributed under the terms and conditions of the Creative Commons Attribution (CC BY) license (https://creativecommons.org/licenses/by/4.0/).
Copyright: This open access article is published under a Creative Commons CC BY 4.0 license, which permit the free download, distribution, and reuse, provided that the author and preprint are cited in any reuse.


