
Submitted:
26 January 2026
Posted:
28 January 2026
You are already at the latest version
Abstract
Vietnam is an energy-intensive economy that has a rapidly growing industry. This fact has increased the urgency for firm-level sustainable energy management practices, especially given the country’s low ranking in global environmental performance. In this study, we investigate the firm-level determinants of sustainable energy management adoption in Vietnam, focusing on structural characteristics, innovation capabilities, and external linkages. Using data from the 2023 World Bank Enterprise Survey, we apply both a logit regression model and a Random Forest algorithm, a novel combination in the study of determinants of sustainable energy management adoption. The logit model identifies significant positive relationships between sustainable energy management adoption and factors such as firm size, R&D investment, international quality certification, and export orientation. Managerial experience shows a non-linear relationship with sustainable energy management adoption, whereas foreign ownership influences it only when combined with R&D investment. The Random Forest model complements these findings by revealing nonlinear relationships and highlighting the predictive importance of variables like international certification, managerial expe-rience, and manufacturing sector affiliation. Together, the models show that internal capabilities and external pressures drive the adoption of sustainable energy management. Our results suggest that policy interventions should be designed with sector- and firm-specific contexts in mind to foster more sustainable firms.
Keywords:
sustainable energy management
; Vietnam
; firm characteristics
; innovation capabilities
; external linkages
; logit model
; random forest
1. Introduction
Over the last few decades, firms have been adapting their strategies to become more environmentally friendly by minimizing resource use and reducing their environmental impact (Valero-Gil et al., 2017). This is partly due to the increasing pressure that firms face from consumers and to stricter regulatory measures taken by governments (Erdiaw-Kwasi et al., 2024). The literature provides evidence that such measures not only benefit the environment but also confer firms with comparative advantages and financial gains (Kotkova Striteska et al., 2024; Vučković and Čučković, 2024). For instance, adopting sustainable energy management (SEM) measures reduces operational costs and improves production efficiency (Erdiaw-Kwasi et al., 2024). However, implementing greener measures remains one of the biggest challenges firms face, especially in developing countries (Luthra et al., 2015).
Identifying the factors that drive firms to take sustainability measures is crucial for accelerating the transition to a low-carbon economy. By understanding these drivers, policymakers can design more targeted and effective regulations and incentives to promote sustainable practices. This, in turn, is key to achieving broader climate goals.
Investigating the determinants of greenness measures in Vietnam is especially important, as environmental degradation has accelerated over the last few decades, beginning with the Doi Moi economic reforms in 1986 (Ngo, 2023). Vietnam ranks last among 180 countries in the 2024 Environmental Performance Index, a comprehensive, data-driven ranking that analyzes and scores countries’ environmental policies and sustainability performance worldwide (Block et al., 2024). As such, it is imperative that all actors in the country take sustainability measures at the individual and institutional levels.
Therefore, in this paper, we focus on the energy management aspect of sustainability measures, which include improving existing technologies and procedures or developing new, energy-saving technologies (Asif et al., 2025). Long-standing government policies that indirectly subsidize energy costs through state-owned companies have made Vietnam one of the world’s most energy-intensive economies. This has led to inefficient energy use in businesses’ production processes (Le, 2019). Growth in industry and construction is driving the rapid rise in energy demand in Vietnam (Le, 2019).
Against this backdrop, this paper investigates the determinants of SEM practices of Vietnamese firms by addressing the following research questions (RQ): RQ1) How do firm-level characteristics influence the adoption of SEM practices? RQ2) How do firms’ innovation capabilities affect SEM decisions? RQ3) Are firms with external linkages more likely to adopt SEM practices?
To address these questions, we developed a logit model and a machine-learning-based random forest model.
The remainder of the paper is organized as follows. The next section presents the relevant literature and the theoretical arguments underpinning this analysis. Section 3 describes the data, defines the variables, and explains the methodology used in this study. After that, the empirical results are presented and discussed. The last section concludes with policy recommendations and suggestions for future research.
2. Literature Review, Theoretical Background, and Our Contribution
We conceptualize SEM adoption as a strategic investment decision under cost, knowledge, and institutional constraints, which leads us to the three research questions stated above. To answer these research questions, we formulate four hypotheses based on the theoretical background provided by the literature and past empirical findings, which we develop in the following three subsections. In the last subsection, we outline our contributions to the literature.
2.1. RQ 1: How Do Firm-Level Characteristics Influence the Adoption of SEM Practices?
Applying sustainable energy management measures is bound to be costly for firms. This makes it less likely that small or medium-sized enterprises take such measures, as they tend to lack the necessary resources (Aragón-Correa et al., 2008). Moreover, larger firms tend to accumulate more knowledge (Nguyen & Vu, 2024). Empirically, Uhlaner et al. (2014) and Veselova & Sidorenko (2022) find a positive association between firm size and environmental management practices. Similarly, Horbach et al. (2023) find a positive relationship between firm size and greenness. Interestingly, Erdiaw-Kwasie et al. (2024) find that firm size negatively affects sustainable energy practices.
The sector in which a firm operates can also be a determinant of whether it takes sustainability measures. According to Demirel et al. (2019), stringent regulations serve as a key driver of innovation, pushing industries—especially those in heavily regulated sectors—to develop sustainable practices and green business models. Truong (2024) states that manufacturing companies are primarily to blame for Vietnam’s severe environmental issues. Thus, environmental management standards certificates became compulsory in Vietnam for polluting industries in the manufacturing sector (Fadly, 2020). Moreover, manufacturing firms may be more willing to adopt sustainable energy management measures because they are more heavily affected by high energy prices than other sectors (Asif et al., 2025). Indeed, Kotkova Striteska et al. (2024) find that firms in the manufacturing sector are more likely to implement energy consumption management measures. Similarly, Vučković and Čučković (2024) find that manufacturing firms are more likely than service firms to implement capital-intensive green measures.
Based on the above presented findings and theoretical arguments, we expect that:
Hypothesis 1.
Large firms and firms operating in the manufacturing sector are more likely to adopt energy management measures to reduce emissions, waste, or pollution.
The effect of a firm’s age—or, in other words, its experience—on its likelihood of taking sustainable energy measures may go either way. On the one hand, over time, firms are more likely to accumulate the capabilities and resources needed to take such decisions (Horbach et al., 2023). On the other hand, it may lead to structural inertia, that is, to a strong tendency for firms to resist change and maintain their current structure (Hannan and Freeman, 1984). There is also no empirical consensus. While Horbach et al. (2023) find a positive effect of firms’ age on their greenness, Vučković and Čučković (2024) find a negative relationship between firms’ age and the adoption of green measures. Others, such as Hoogendorn et al. (2015) or Younis & Sundarakani (2020) fail to find a significant relationship between firms’ age and environmental and green supply practices.
Based on these mixed findings, we do not have an a priori expectation regarding the relationship between the experience of the firm and the likelihood of SEM adoption.
Hambrick and Mason’s (1984) Upper Echelons Theory posits that a part of an organization’s results and decisions can be attributed to the prior experience of its managers. Their abilities and experience in the sector influence their firms’ corporate social responsibility actions (Cortes et al., 2025). More experience may allow managers to build stronger industry-specific knowledge and to access the information, resources, and partnerships needed to implement sustainable energy management measures. On the other hand, Hambrick and Fukutomi (1991) argue that long-serving managers may resist change due to an increasing dedication to their original strategic vision. Indeed, Datta et al. (2003) find a negative correlation between CEOs’ tenure and their openness to change. Older managers are generally more risk-averse and thus less likely to take measures with more uncertain outcomes (Barker & Mueller, 2002). The above arguments suggest that the relationship between managers` experience and their likelihood of taking sustainable energy management decisions may not be linear:
Hypothesis 2.
There is a non-linear relationship between the manager’s experience in the sector and the likelihood of the firm taking SEM decisions.
2.2. RQ 2: How Do Firms’ Innovation Capabilities Affect SEM Decisions?
According to the dynamic capabilities theory by Teece (2007), a firm maintains a competitive advantage by developing three key abilities: first, to sense shifts in the market; second, to act on those shifts; and third, to continuously reorganize its resources and strengths to adapt. Developing these capabilities may also help firms to be leaders in sustainability measures. Investment in R&D is part of the learning process that forms the micro-foundations of dynamic capabilities (Teece, 2007).
Cohen and Levinthal (1990) posit that a firm’s innovative potential is driven by its absorptive capacity, which is the capability to recognize valuable external information, assimilate it, and exploit it for commercial applications. The firm’s prior related knowledge largely determines this capacity. This potential can manifest itself in areas such as sustainability and energy management. Cohen and Levinthal (1990) show that firms’ R&D expenditures contribute to this absorptive capacity.
Based on these two theories, we could expect an indirect positive effect of R&D expenditure on sustainability and greenness measures. Indeed, Kotkova Striteska et al. (2024) find a positive impact of firms’ R&D expenditure on energy consumption monitoring and proactive environmental strategies.
Furthermore, innovation outcomes have been found to improve access to formal credit for Vietnamese SMEs (Pham et al., 2023), potentially creating a virtuous cycle where innovation facilitates the financing needed for further sustainable investments.
Internationally recognized quality management systems such as ISO 9000 and ISO 14000 facilitate the implementation of environmental measures by providing the necessary information (Horbach et al., 2023). This should be more relevant for the implementation of more capital-intensive greening measures (Vučković and Čučković, 2024). Having such internationally recognized certificates was found to be positively correlated with green practices (Asif et al., 2025; Horbach et al., 2023).
Using better technologies facilitates the implementation of energy management systems (Asif et al., 2025). In developing countries such as Vietnam, access to foreign technology enables the use of better and more efficient tools (Vučković and Čučković, 2024). The use of such technology, in turn, increases the odds of implementing environmental measures (Vučković and Čučković, 2024).
Considering the arguments and findings above, we formulate Hypothesis 3.
Hypothesis 3.
Firms that invest in R&D, use foreign licensed technologies, and hold internationally recognized quality certificates are more likely to implement sustainable energy management measures.
2.3. RQ 3: Are Firms with External Linkages More Likely to Adopt SEM Practices?
Due to financial constraints, local firms often struggle to obtain access to environmental technologies (Christmann and Taylor, 2001). Foreign ownership may facilitate access to better technologies (Vučković and Čučković, 2024). Due to greater concern for their reputation, foreign firms typically adhere to more responsible business conduct (Hanousek et al., 2019). Thus, it is to be expected that foreign-owned firms are more likely to take environmental actions. This conjecture is supported by empirical evidence. Arora (2023) finds a positive link between foreign ownership and sustainability measures, while Veselova and Sidorenko (2022) and Vučković and Čučković (2024) found a connection between foreign ownership and engagement in environmental practices and greenness measures, respectively.
In developing countries like Vietnam, environmental regulations tend to be less stringent, and consumer awareness is lower (Ngo, 2023). Therefore, firms exporting to more developed countries – with stricter environmental regulations – may have stronger incentives to become greener to gain a competitive advantage (Constantini and Mazzanti, 2012). A firm’s environmental strategy is often based on a cost-benefit analysis that weighs the perceived economic benefits of complying with domestic standards against those of major foreign markets (Christmann and Taylor, 2001). Therefore, firms that export their production to markets with more stringent environmental standards are generally more likely to adopt greener practices. This link is empirically supported by Horbach et al. (2023) and Vučković and Čučković (2024), studies that find that exporters are more likely to implement environmental actions.
Based on the above theoretical arguments and empirical findings, we hypothesize that:
Hypothesis 4.
Foreign-owned and export-oriented firms are more likely to implement sustainable energy management measures.
2.4. Our Contribution
Previous studies have examined how various firm characteristics and structural or external factors affect firms’ likelihood of implementing green measures. However, to the best of our knowledge, no other study has examined the relationship between managers’ experience and the likelihood of adopting green measures. Based on the theoretical arguments above, we test whether a non-linear relationship is present between managers’ experience and the probability of taking SEM measures (Hypothesis 2).
Methodologically, to the best of our knowledge, this is the first study to analyze the adoption of SEM in enterprises combining a traditional econometric model with a machine learning algorithm. This approach allows us to uncover nonlinearities and dependencies in the data.
3. Data, Variables, and Methodology
In this section, we first present the source of the survey data we use and provide details on how the survey was conducted. We then describe the dependent and independent variables of our model and, finally, briefly outline the statistical methodology used.
3.1. Data
This study uses the World Bank Enterprise Surveys (WBES)1, a survey conducted with business owners and top managers. They provide information on several topics in the business environment, including infrastructure, performance, corruption, financial accessibility, and innovation. The Vietnamese survey comprises 1,028 observations. WBES employed stratified random sampling across industries, company size (small, medium, and large), and geographic areas (five subnational divisions). The survey was conducted between April and November 2023. Sampling weights were employed to ensure representativeness.
3.2. Dependent and Independent Variables
Table 1 describes the dependent and independent variables of our models. Our independent variables can be classified into three groups: firm characteristics and structural factors, innovation capabilities and knowledge assets, and external linkages.
The dependent variable and all the independent variables, except for Firm Age and Manager’s Experience, are binary variables.
As the survey was conducted in 2023, to obtain the firm’s age, the establishment year reported by the firm in the survey was subtracted from 2023. The theoretical arguments and empirical evidence presented above do not suggest the direction of the relationship between a firm’s age and the likelihood of taking SEM measures. Since we cannot rule out the possibility of a non-linear relationship, such as a U- or inverse-U-shaped one, the firm’s age was included in the logit model both in level and in quadratic form.
For the sector dummy variables, the omitted category includes the retail, wholesale trade, and services sectors.
To test the hypothesized non-linear relationship between the manager’s experience and the dependent variable (Hypothesis 2), we include the variable in its linear and quadratic levels.
The Foreign Private Ownership dummy variable takes value 1 for firms whose largest ownership type among the three (foreign private, domestic private, state, or government) is foreign private.
Finally, the Exporter variable takes value 1 if the firm exports its products directly or indirectly.
Firms’ productivity and profitability are adversely impacted by extreme weather conditions and other global challenges (Vučković and Čučković, 2024). As Horbach et al. (2023) find that firms affected by extreme weather events are more likely to implement greenness actions, we also control for the effect of such events in our analysis.
3.3. Methodology
To analyze the determinants of sustainable energy management decisions taken by Vietnamese enterprises, a logit regression model was estimated, an appropriate approach given the nature of the dependent variable: it takes a value of 1 if at least one SEM was taken in the last three years, or 0 if no such measure took place. As explained in the previous subsection, the independent variables are grouped into three categories (firm characteristics and structural factors, innovation capabilities and knowledge assets, and external linkages), and therefore, the results are presented by variable group. The model also includes a control variable to capture whether the firm was affected by extreme weather.
To complement our analysis, a Random Forest (RF) algorithm was employed (Breiman, 2001). This machine learning algorithm constructs several decision trees during training and, afterwards, chooses the class that appears most frequently across the predictions of the individual trees to determine the final classification output.
RF’s main advantage is its ability to capture potential non-linear relationships between the dependent and independent variables, as well as interaction effects between the independent variables, without requiring the researcher to establish them a priori. This is particularly important in our context because parametric models, such as the logit model, rely on pre-specified functional forms. Consequently, RF might uncover information that the logit model cannot detect. Furthermore, the variable importance metrics generated by RF supplement the information obtained from the logit model. Such metrics quantify each variable’s relative contribution to the model’s predictive power, allowing us to identify the most influential factors in our context (Hastie et al., 2009).
The variable importance metric used in our analysis is the mean decrease in accuracy (MDA) index. This index measures a variable’s importance using the model’s built-in test data, the Out-of-Bag (OOB) sample. For each tree in the forest, the method compares the model’s prediction error on the OOB data before and after randomly shuffling the variable values. The variable’s importance is the average of these error increases across all trees, indicating how much the model’s performance relies on that variable (Han et al., 2016).
To evaluate the possible interactions among the covariates, we calculate the Friedman’s H-statistic for each covariate, which measures the proportion of variance that is explained by the interaction with other independent variables (Friedman and Popescu, 2008). As a measure of the additive contribution of a variable at the individual level, we obtain the SHAP (SHapley Additive exPlanation) values proposed by Lundberg and Lee (2017). These values provide interpretable insights into the specific weight and contribution of each feature toward the final prediction. (Antonini et al., 2024).
By combining a logit model and a RF, we balance interpretability and flexibility. While the logit model allows for hypothesis testing under a parametric structure, the RF captures nonlinearities and conditional patterns in the data without the need to impose a specific functional form.
The logit regression and random forest algorithm were run in R, while data cleaning and variable creation were performed in Stata.
4. Results and Discussion
Table 2 below presents some descriptive statistics of our variables.
Table 2 shows that only 17.8% of the sampled Vietnamese enterprises have adopted sustainable energy management decisions in the three years preceding the survey. Moreover, there are low levels of innovation capabilities among Vietnamese firms: only 4.5% of them invested in R&D, and only 5.4% held a foreign technology license. In the same vein, Vietnamese enterprises’ foreign linkages are weak. While less than 10% of firms are exporters, the share of private foreign ownership is below 5%.
Small and medium-sized enterprises dominate the sample since only 6.7% of the firms are large.
As mentioned previously, we first estimate a logit model. Table 3 presents the regression results and the odds ratios (OR) for the independent variables. Model 1 includes all variables except the control variable (Affected by Extreme Weather) and the quadratic terms for the firm’s age and the manager’s experience. Model 2 includes these two quadratic terms, while Model 3 incorporates the control variable.
The first thing to notice is that the incorporation of the quadratic terms and the control variable does not affect the sign and statistical significance of any of the independent variables.
The results provide only partial evidence in favor of Hypothesis 1, which states that large firms and those operating in the manufacturing sector are more likely to adopt SEM measures. The logit estimates show no statistically significant association between the production sector and SEM adoption, while firm size plays a role in the implementation of SEM practices. Large firms are 118.5% more likely to take sustainable energy measures than small and medium-sized firms, consistent with the idea that firms with more financial or knowledge-based resources are in a better position to face the costs of sustainable energy management measures. This result is in line with the resource-based arguments discussed in Section 2.1 (Uhlaner et al., 2014; Veselova & Sidorenko, 2022; Vučković & Čučković, 2024).
The statistical significance of both Manager’s Experience and Manager’s Experience Squared provides evidence that supports Hypothesis 2. The negative coefficient of the linear term and the positive sign of the quadratic term suggest a U-shaped relationship between the manager’s experience and the adoption of SEM measures. The negative effect of an additional year of the manager’s experience gets smaller the more years of experience s/he has, reaching a turning point, and finally going up. Nonetheless, the increasing part of the curve has little practical value, as fewer than 5% of managers exceed the turning point, estimated at around 28.13 years. That means that for most managers, the relationship between experience and the adoption of SEM measures is negative. This result is consistent with the arguments presented in Section 2: more experience may trigger more risk aversion and strategic vision persistence, affecting negatively the propensity to take sustainability measures (Datta et al., 2003; Barker & Mueller, 2002).
In line with the findings of Hoogendorn et al. (2015) and Younis & Sundarakani (2020), we fail to find a significant relationship between the firm’s age and its likelihood of adopting SEM measures.
Hypothesis 3, which states that firms with stronger innovation capabilities are more likely to implement SEM, is partially supported by our findings. While no link was found between holding a foreign technology license and SEM implementation, we find that both investing in R&D and holding an international quality certificate (IQC) have a statistically significant positive relationship with SEM measures. This finding aligns with those of Cohen and Levinthal (1990) and Kotkova Striteska et al. (2024): R&D enhances the absorptive capacity of a firm needed to incorporate external knowledge, which can result in an improvement of its sustainability and energy management. Likewise, holding an IQC provides the necessary information to implement environmental measures (Horbach et al., 2023). Nonetheless, this should not be interpreted causally since firms that are already “green” are most likely to seek certifications, as suggested by Horbach et al. (2023).
As for the effect of external linkages, the estimates show that export firms are more likely to engage in SEM, consistent with the idea that exporting to countries with stricter environmental regulations pushes Vietnamese firms to meet these higher standards. This finding aligns with those of Horbach et al. (2023) and Vučković and Čučković (2024). On the other hand, contrary to our expectations, foreign-owned enterprises are not more likely to engage in SEM practices, suggesting that foreign ownership alone is not sufficient to induce the firms to take sustainability measures.
Given that only 17.8% of firms adopted SEM measures, and several of the independent variables infrequently take value 1 (e.g., only 4.5% of firms invest in R&D), we reestimate the model using Firth’s penalized likelihood estimator as a robustness check. This approach mitigates bias that could arise from rare outcomes and sparse covariates (Firth, 1993; Suhas et al., 2023). The results of the new set of estimates are presented in Table 4 below.
As can be observed in Table 4, the results of the Firth logit model are consistent with those of the standard logit model. Not only is the set of statistically significant covariates the same in both specifications, but the estimated coefficients also have the same signs and show very similar values. In particular, there are still strong associations between SEM adoption and the firm size, the manager’s experience, R&D investment, international quality certification, and export orientation. In fact, firm size is now significant at a stricter significance level. This consistency suggests that potential biases due to rare outcomes or sparse covariates do not affect the baseline logit results.
As discussed in Section 3.3, to complement our logit regression analysis, a Random Forest algorithm was employed. We used the Ranger package in R because our dataset was imbalanced, with only 17.8% of firms adopting SEM measures. By maximizing the Youden Index –a metric that considers how well the model classifies firms as SEM-measures adopters or not adopters– the ranger package identified an optimal threshold of 0.27 (instead of using the default 0.5 threshold, which is biased towards the majority class), meaning that the model classifies a firm as adopting SEM measures if the predicted probability is 27% or higher. This optimal threshold improves the model’s ability to correctly identify firms that adopt SEM measures.
Figure 1 shows the relative influence of each variable on the model’s predictive accuracy. The RF model identifies holding an International Quality Certification as the most influential factor in the adoption of SEM measures, which is consistent with the highly significant relationship found by the logit model. This consistency highlights the importance of established quality standards in promoting SEM adoption. Moreover, like the logit model, the RF assigns high importance to the manager’s experience.
Nonetheless, there are some discrepancies between the RF and the logit model findings, which may reflect the RF’s ability to capture nonlinearities and conditional relations in the data. A key difference is the high importance the RF assigned to the Manufacturing Sector variable, which was not statistically significant in the logit model. According to the RF model, the fourth most important variable is foreign private ownership, while in the logit model, it did not affect SEM adoption. The firm’s age ranked sixth in importance, ahead of R&D spending and exporting, even though it was not statistically significant in the logit model.
Finally, the variable R&D spending ranks seventh in importance. Including it, the cumulative importance reaches 94%, as shown in Table 5 below. We can consider the remaining variables to have low weight in determining whether an enterprise takes SEM measures.
As stated above, the Manufacturing Sector variable ranks as the second most important predictor in the RF but is not statistically significant in the logit model. This discrepancy is not due to high multicollinearity in the logit model, as the pairwise correlation coefficient between this variable and Exporter, and their VIF values are both low. Further inspection reveals that while 22.79% of firms in the manufacturing sector export, this share is only 2.81% in the other sectors. This suggests that the effect of being in the manufacturing sector for SEM adoption may be conditional on other firm characteristics.
Similarly, Foreign Private Ownership, while ranking as the fourth most important predictor in the RF model, is not statistically significant in the logit model. As with the manufacturing sector, this discrepancy is not caused by high multicollinearity, given the low pairwise correlation coefficient between this variable and International Quality Certification, and low VIF values. However, while only 5.02% of domestically owned firms possess a quality certification, this share is 36.4% among foreign owned companies. This indicates that foreign private ownership may affect SEM adoption depending on other firm characteristics.
Figure 2 presents the H-statistics for the covariates, indicating the strength of interaction between the variables. For the H statistics, which (usually) go from 0 to 1, values above 0.10-0.15 are considered meaningful (Nayak et al., 2022; Su et al., 2025). The manager’s experience has an H value of 0.55, meaning that 55% of the variable influence on the model comes from its interactions with other covariates. Other variables with high interaction strength are the firm’s age, the economic sector of the firm, foreign ownership, and the firm’s size. This means that their relationship with SEM adoption is dependent on other covariates, something not captured by the logit model.
The high interaction strength of the firm’s age could explain the discrepancies between the logit model and RF findings.
Figure 3 presents the SHAP beeswarm plot, showing how each explanatory variable contributes to the RF predictions. Each dot corresponds to a firm, with colors showing whether the value of the variable is low (blue) or high (red). A point to the right of the vertical axis suggests that the variable increases the likelihood of adopting SEM measures for that particular firm, while a dot on the left suggests the opposite. A high dispersion of the points means that the variable has a different effect on different firms, suggesting that its influence may vary with other characteristics of the firm.
Operating in the manufacturing sector (red dots) increases the probability of adopting SEM measures. Similarly, having an international quality certification, being a large firm, and investing in R&D are positively associated with SEM adoption. For continuous variables, like the manager’s experience, a wide dispersion of dots is observed, suggesting that its effect is complex and dependent on other variables, consistent with the findings from Figure 2 and the non-linear relationship found in the logit model.
While Figure 1 shows how much a variable contributes to the global predictive performance of the model, Figure 3 illustrates the impact on each firm, i.e., how much a variable increases or decreases SEM adoption probability for each enterprise. Figure 2 complements these findings by quantifying how much of a variable’s influence on the model prediction depends on its interaction with other covariates.
Table 6 below shows the most important performance metrics we can use to compare the models.
The comparison of performance metrics shows that the RF model is more accurate than the logit model, i.e., the proportion of correctly classified firms is higher under the RF model. Moreover, while the logit model correctly identifies 89.5% of the firms that do not adopt SEM measures (Specificity), the Sensitivity (% of correctly identified adopters) is only 47.8%. This means that more than half of the firms that take SEM measures are misclassified. The RF performs much better; it correctly classifies adopters in 86.1% of cases while maintaining a very high Specificity (84.6%). The AUC (area under the ROC curve) shows that RF’s overall ability to discriminate between the two groups is higher than that of the logit model (0.927 vs. 0.786). There is also a clear improvement in the F1-score (the harmonic mean of precision and sensitivity), confirming the superior predictive performance of the RF.
Taken together, the results from the logit regression and the RF model offer complementary insights into the determinants of SEM adoption among Vietnamese firms. While the logit model identifies statistically significant relationships between the likelihood of taking SEM measures and the explanatory variables R&D investment, international quality certification, and exporting, the RF highlights additional nonlinear relationships. Both models underscore the importance of international quality certification, managerial experience, firm size, and R&D spending. However, the RF reveals additional important predictors, including manufacturing sector affiliation, firm age, and foreign ownership, which were either marginally significant or insignificant in the logit model. This suggests that these factors may influence SEM adoption in conditional or non-linear ways not captured by traditional regressions. Overall, the machine learning approach enhances the robustness of the analysis and improves predictive accuracy, thereby offering a richer understanding of the drivers behind SEM decisions.
5. Concluding Remarks
This study provides empirical evidence on the determinants of SEM adoption among Vietnamese firms by combining a logit regression model and a random forest algorithm. The findings reveal how internal capabilities, managerial characteristics, and external pressures influence SEM adoption.
The logit model shows that firm-level factors–including size, R&D investment, international quality certification, and export orientation–significantly increase the likelihood of SEM adoption, while managerial experience exhibits a negative non-linear association with SEM adoption.
The RF model complements and extends the regression analysis by uncovering nonlinear and conditional relationships in the data. It identifies international certification, managerial experience, and manufacturing-sector affiliation as key predictors, even though these variables are not statistically significant in the logit model. This difference underscores the value of using machine learning techniques alongside traditional regression models.
From a policy perspective, the results suggest that support for R&D activities and international certification processes could significantly enhance SEM adoption. As other firm-level characteristics also play an important role, it is essential to design such policies in a targeted manner. For instance, initiatives could include providing grants or tax incentives for R&D investments, particularly for small and medium-sized enterprises. Additionally, to address the scale disadvantages faced by smaller firms and the sectoral dependencies revealed by our models, authorities could encourage the formation of industrial networks such as collaborative platforms that could allow SMEs to pool resources for green technology acquisition.
Moreover, the Vietnamese government could subsidize the ISO certification process to encourage firms to adopt international standards. Since foreign ownership per se does not guarantee SEM adoption, to ensure that technological spillovers result in sustainable practices, foreign investment should be combined with programs that enhance local absorptive capacity. Likewise, capacity-building programs focused on managerial development could help overcome resistance to change and promote more sustainable practices.
A manager’s experience is the sum of diverse factors, such as the diversity of sectors and firms worked at, macroeconomic conditions, and financial and other firm-level characteristics, among others. Beyond experience, specific managerial capabilities such as financial literacy have also been identified as key drivers that promote environmental sustainability by facilitating the adoption of process innovations (Molina-García et al., 2025). Unfortunately, our dataset does not allow us to move beyond a measure of years. Future research could delve further into the effect of managerial experience diversity on the adoption of green measures. Future research could also explore the specific mechanisms behind the non-linear and interactive relationships uncovered.
Funding
This research did not receive any specific grant from funding agencies in the public, commercial, or not-for-profit sectors.
| 1 |
References
- Antonini, A. S.; Tanzola, J.; Asiain, L.; Ferracutti, G. R.; Castro, S. M.; Bjerg, E. A.; Ganuza, M. L. Machine Learning model interpretability using SHAP values: Application to Igneous Rock Classification task. Applied Computing and Geosciences 2024, 23, 100178. [Google Scholar] [CrossRef]
- Aragón-Correa, J. A.; Hurtado-Torres, N.; Sharma, S.; García-Morales, V. J. Environmental strategy and performance in small firms: A resource-based perspective. Journal of Environmental Management 2008, 86(1), 88–103. [Google Scholar] [CrossRef]
- Arora, I. Gender Inequality as a Barrier for Climate Mitigation: Evidence from Emerging Markets. Master’s thesis, Georgetown University, 2023. [Google Scholar]
- Asif, M.; Dhamija, A.; Khan, W.; Johri, A.; Wasiq, M. Factors affecting adoption of green practices by food firms: evidences from the World Bank Enterprises Survey. Clean Technologies and Environmental Policy 2025, 1–18. [Google Scholar] [CrossRef]
- Barker, V. L.; Mueller, G. C. CEO characteristics and firm R&D spending. Management Science 2002, 48(6), 782–801. [Google Scholar] [CrossRef]
- Block, S.; Emerson, J. W.; Esty, D. C.; de Sherbinin, A.; Wendling, Z. A.; et al. 2024 Environmental Performance Index; Yale Center for Environmental Law & Policy. Epi.yale.edu: New Haven, CT, 2024. [Google Scholar]
- Breiman, L. Random forests. Machine Learning 2001, 45(1), 5–32. [Google Scholar] [CrossRef]
- Christmann, P.; Taylor, G. Globalization and the environment: Determinants of firm self-regulation in China. Journal of International Business Studies 2001, 32(3), 439–458. [Google Scholar] [CrossRef]
- Cohen, W. M.; Levinthal, D. A. Absorptive capacity: A new perspective on learning and innovation. Administrative Science Quarterly 1990, 35(1), 128–152. [Google Scholar] [CrossRef]
- Costantini, V.; Mazzanti, M. On the green and innovative side of trade competitiveness? The impact of environmental policies and innovation on EU exports. Research Policy 2012, 41(1), 132–153. [Google Scholar] [CrossRef]
- Cortes, A. F.; Cortes-Mejia, S.; Samimi, M.; Joo, M. Strategic leadership of social and environmental responsibility: a review and research agenda. Management Review Quarterly 2025, 1–40. [Google Scholar] [CrossRef]
- Datta, D. K.; Rajagopalan, N.; Zhang, Y. New CEO openness to change and strategic persistence: The moderating role of industry characteristics. British Journal of Management 2003, 14(2), 101–114. [Google Scholar] [CrossRef]
- Demirel, P.; Li, Q. C.; Rentocchini, F.; Tamvada, J. P. Born to be green: new insights into the economics and management of green entrepreneurship. Small Business Economics 2019, 52(4), 759–771. [Google Scholar] [CrossRef]
- Erdiaw-Kwasie, M. O.; Tenakwah, E. S.; Tenakwah, E. J.; Tuffour, J. Sustainable energy strategies among small and medium-scale enterprises: The mediating role of business associations. Journal of Cleaner Production 2024, 470, 143237. [Google Scholar] [CrossRef]
- Fadly, D. Greening industry in Vietnam: Environmental management standards and resource efficiency in SMEs. Sustainability 2020, 12(18), 7455. [Google Scholar] [CrossRef]
- Firth, D. Bias reduction of maximum likelihood estimates. Biometrika 1993, 80(1), 27–38. [Google Scholar] [CrossRef]
- Friedman, J. H.; Popescu, B. E. Predictive learning via rule ensembles. The Annals of Applied Statistics 2008, 2(3), 916–954. [Google Scholar] [CrossRef]
- Hambrick, D. C.; Fukutomi, G. D. The seasons of a CEO’s tenure. Academy of Management Review 1991, 16(4), 719–742. [Google Scholar] [CrossRef] [PubMed]
- Hambrick, D. C.; Mason, P. A. Upper echelons: The organization as a reflection of its top managers. Academy of Management Review 1984, 9(2), 193–206. [Google Scholar] [CrossRef]
- Han, H.; Guo, X.; Yu, H. Variable selection using mean decrease accuracy and mean decrease Gini based on random forest. 2016 7th IEEE International Conference on Software Engineering and Service Science (ICSESS), 2016, August; IEEE; pp. 219–224. [Google Scholar]
- Hannan, M. T.; Freeman, J. Structural inertia and organizational change. American Sociological Review 1984, 49(2), 149–164. [Google Scholar] [CrossRef]
- Hanousek, J.; Shamshur, A.; Tresl, J. Firm efficiency, foreign ownership and CEO gender in corrupt environments. Journal of Corporate Finance 2019, 59, 344–360. [Google Scholar] [CrossRef]
- Hastie, T.; Tibshirani, R.; Friedman, J. The elements of statistical learning: Data Mining, Inference, and Prediction; Springer: Berlin, Germany, 2009. [Google Scholar]
- Hoogendoorn, B.; Guerra, D.; Van Der Zwan, P. What drives environmental practices of SMEs? Small Business Economics 2015, 44(4), 759–781. [Google Scholar] [CrossRef]
- Horbach, J.; Prokop, V.; Stejskal, J. Determinants of firms’ greenness towards sustainable development: A multi-country analysis. Business Strategy and the Environment 2023, 32(6), 2868–2881. [Google Scholar] [CrossRef]
- Kotkova Striteska, M.; Myslivcova, K.; Prokop, V.; Zapletalova, L. Employees’ engagement, family ownership, or gender diversity? Searching for determinants of SMEs’ green behaviors in CEE countries. Corporate Social Responsibility and Environmental Management 2024, 31(4), 3065–3080. [Google Scholar] [CrossRef]
- Le, P. V. Energy demand and factor substitution in Vietnam: evidence from two recent enterprise surveys. Journal of Economic Structures 2019, 8(1), 35. [Google Scholar] [CrossRef]
- Lundberg, S. M.; Lee, S. I. A unified approach to interpreting model predictions. Advances in Neural Information Processing Systems, 30, 31st Conference on Neural Information Processing Systems (NIPS 2017), 2017. [Google Scholar]
- Luthra, S.; Garg, D.; Haleem, A. An analysis of interactions among critical success factors to implement green supply chain management towards sustainability: An Indian perspective. Resources Policy 2015, 46, 37–50. [Google Scholar] [CrossRef]
- Molina-Garcia, A.; Galache-Laza, M. T.; Gonzalez-Garcia, V.; Diéguez-Soto, J. Financial literacy and environmental sustainability in SMEs: process innovation as an association mechanism. Eurasian Business Review 2025, 1–38. [Google Scholar] [CrossRef]
- Nayak, H. S.; Silva, J. V.; Parihar, C. M.; Krupnik, T. J.; Sena, D. R.; Kakraliya, S. K.; Sapkota, T. B. Interpretable machine learning methods to explain on-farm yield variability of high productivity wheat in Northwest India. Field Crops Research 2022, 287, 108640. [Google Scholar] [CrossRef]
- Ngo, Q. H. Do environmental management practices mediate institutional pressures-environmental performance relationship? Evidence from Vietnamese SMEs. Heliyon 2023, 9(7). [Google Scholar] [CrossRef]
- Nguyen, B.; Vu, N. Does intrinsic motivation or extrinsic pressure matter more? An exploratory study of small businesses going green and innovation. Business Strategy and the Environment 2024, 33(5), 3855–3886. [Google Scholar] [CrossRef]
- Pham, T. T. T.; Nguyen, T. V. H.; Nguyen, S. K.; Nguyen, H. T. H. Does planned innovation promote financial access? Evidence from Vietnamese SMEs. Eurasian Business Review 2023, 13(2), 281–307. [Google Scholar] [CrossRef]
- Su, C. C.; Chen, J. L.; Lee, C. C.; Li, C. T.; Lin, W. L.; Cheng, C. L. An interpretable machine learning approach to evaluate 30-day mortality risk in patients with community-onset bacteremia. Journal of Microbiology, Immunology and Infection 2025. [Google Scholar] [CrossRef]
- Suhas, S.; Manjunatha, N.; Kumar, C. N.; Benegal, V.; Rao, G. N.; Varghese, M.; Gururaj, G. Firth’s penalized logistic regression: A superior approach for analysis of data from India’s National Mental Health Survey, 2016. Indian Journal of Psychiatry 2023, 65(12), 1208–1213. [Google Scholar] [CrossRef]
- Teece, D. J. Explicating dynamic capabilities: the nature and microfoundations of (sustainable) enterprise performance. Strategic Management Journal 2007, 28(13), 1319–1350. [Google Scholar] [CrossRef]
- Truong, D. D. Adoption of environmental management accounting in Vietnamese enterprises: An empirical analysis of influencing determinants. PLOS ONE 2024, 19(7), e0304902. [Google Scholar] [CrossRef]
- Uhlaner, L. M.; Berent-Braun, M. M.; Jeurissen, R. J.; de Wit, G. Beyond size: Predicting engagement in environmental management practices of Dutch SMEs. Journal of Business Ethics 2012, 109(4), 411–429. [Google Scholar] [CrossRef]
- Valero-Gil, J.; Rivera-Torres, P.; Garcés-Ayerbe, C. How is environmental proactivity accomplished? Drivers and barriers in firms’ pro-environmental change process. Sustainability 2017, 9(8), 1327. [Google Scholar] [CrossRef]
- Veselova, A.; Sidorenko, A. The impact of firm characteristics on adoption of environmental management practices in Russian SMEs. Journal of East-West Business 2022, 28(4), 323–349. [Google Scholar] [CrossRef]
- Vučković, V.; Čučković, N. Greening of SMEs in Western Balkan Countries–Evidence from Firm-Level Analysis. Economic Annals 2024, 69(243), 7–40. [Google Scholar] [CrossRef]
- Younis, H.; Sundarakani, B. The impact of firm size, firm age and environmental management certification on the relationship between green supply chain practices and corporate performance. Benchmarking: An International Journal 2020, 27(1), 319–346. [Google Scholar] [CrossRef]
Figure 1.
Predictor Variable Importance.
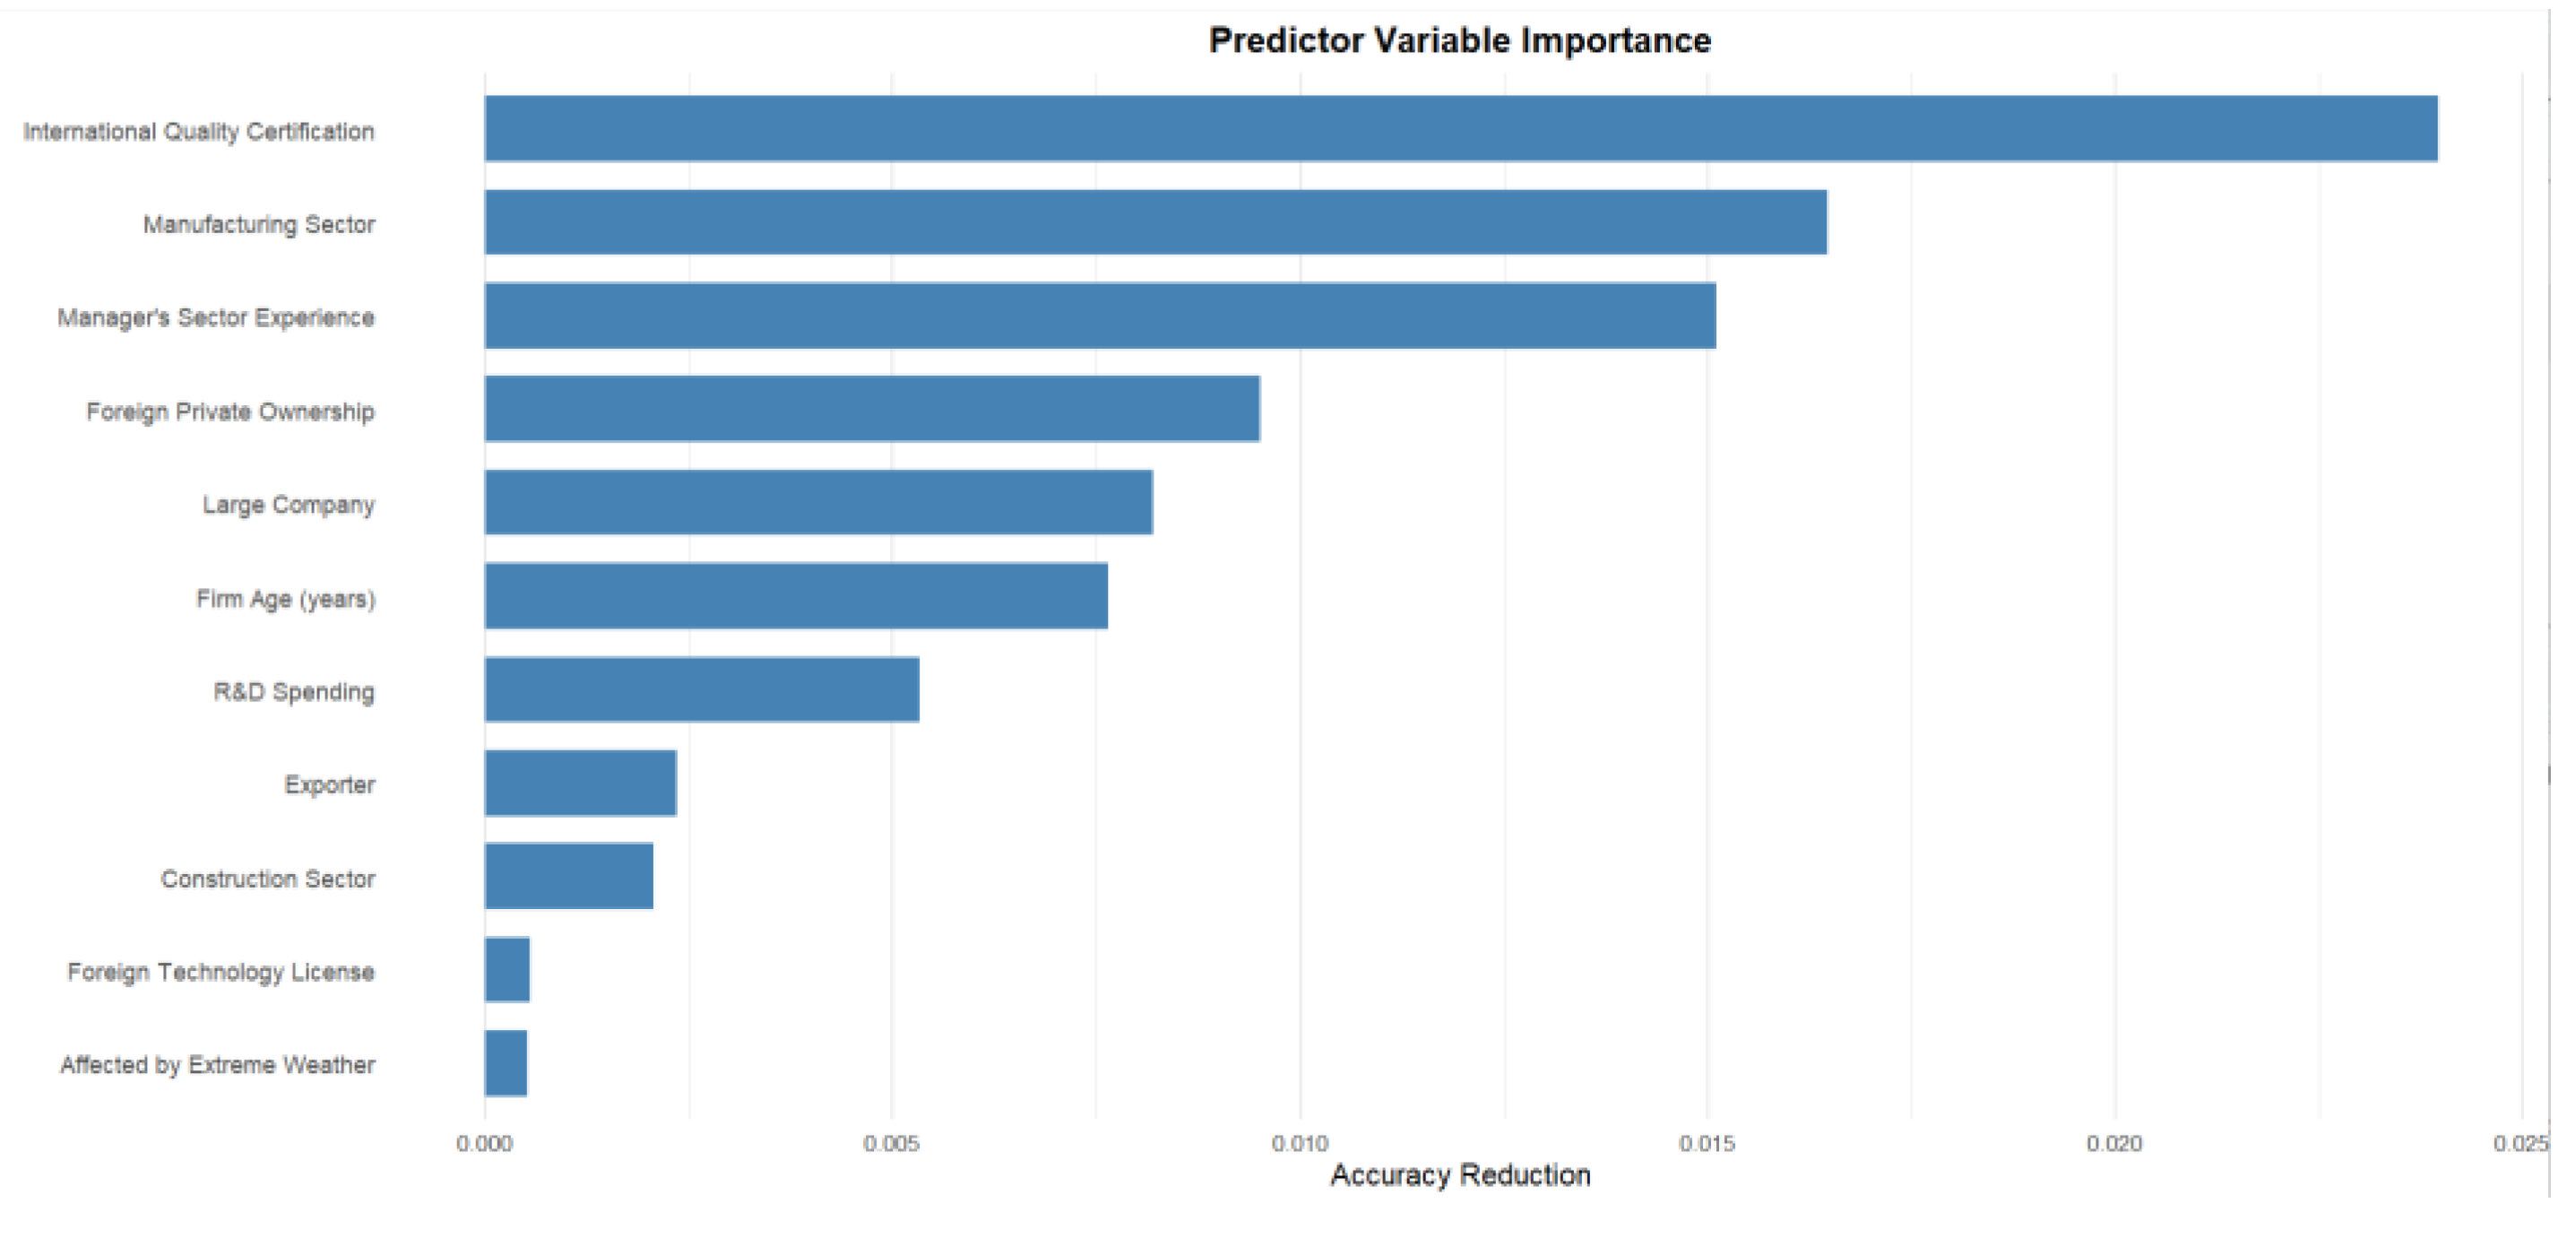
Figure 2.
Friedman’s H-Statistic.
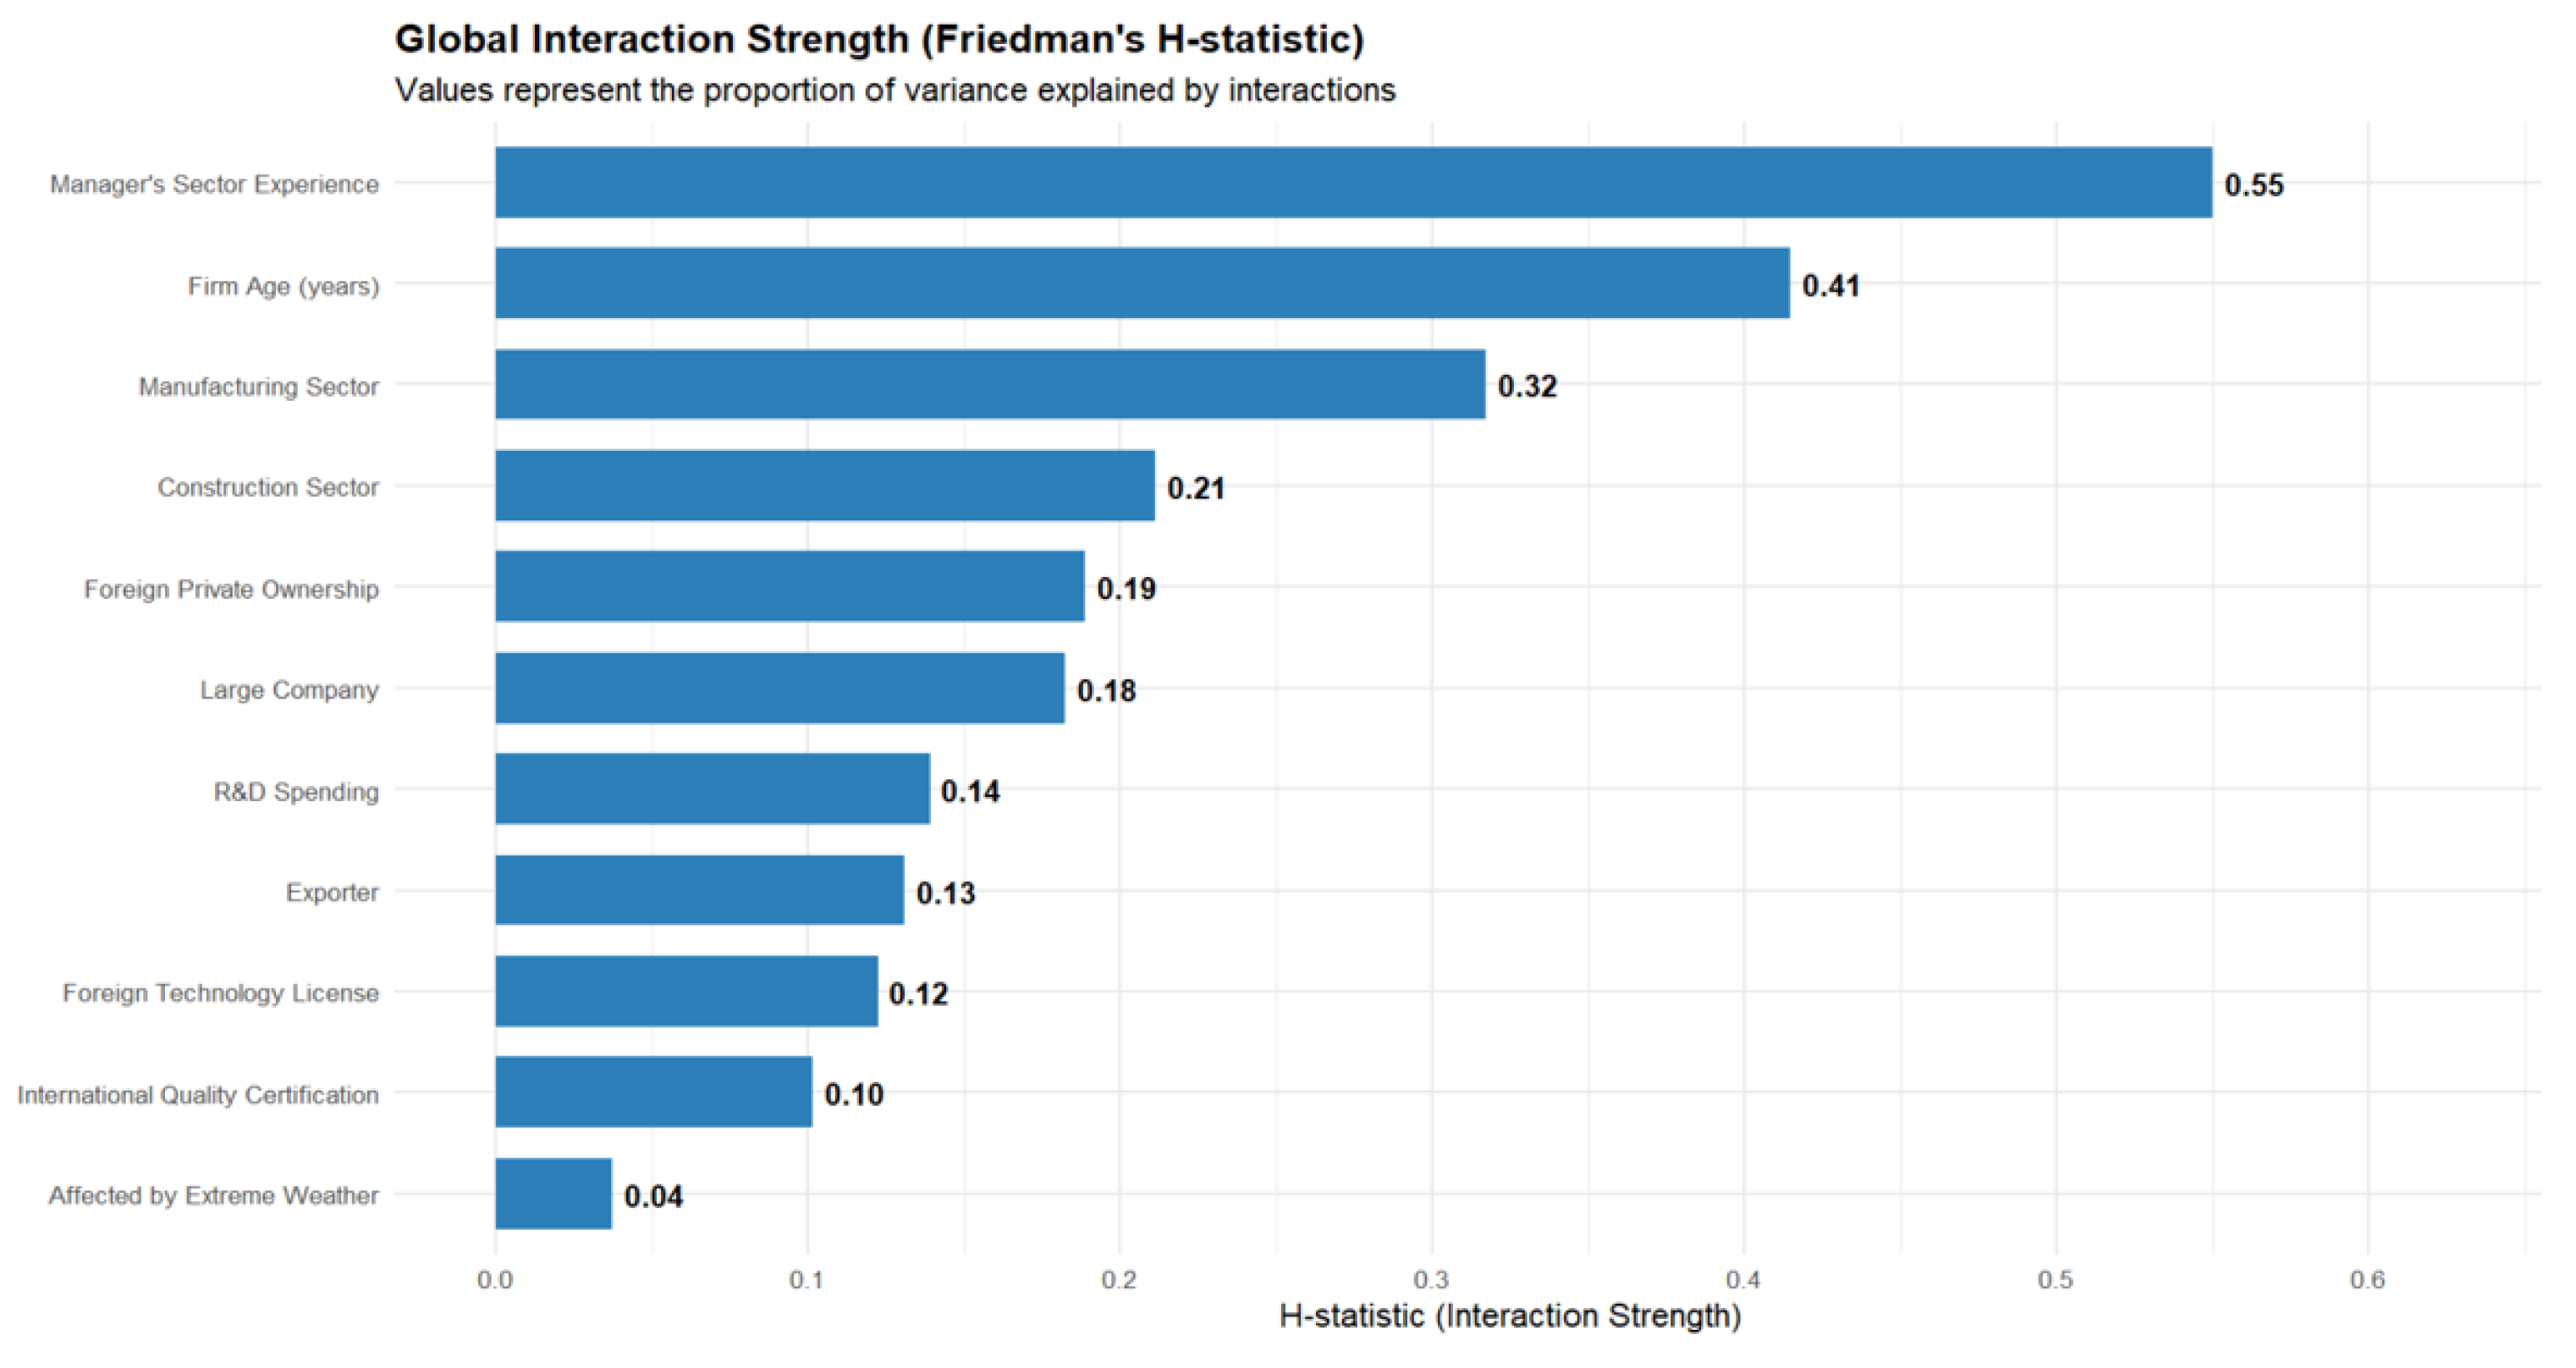
Figure 3.
SHAP Beeswarm Plot.
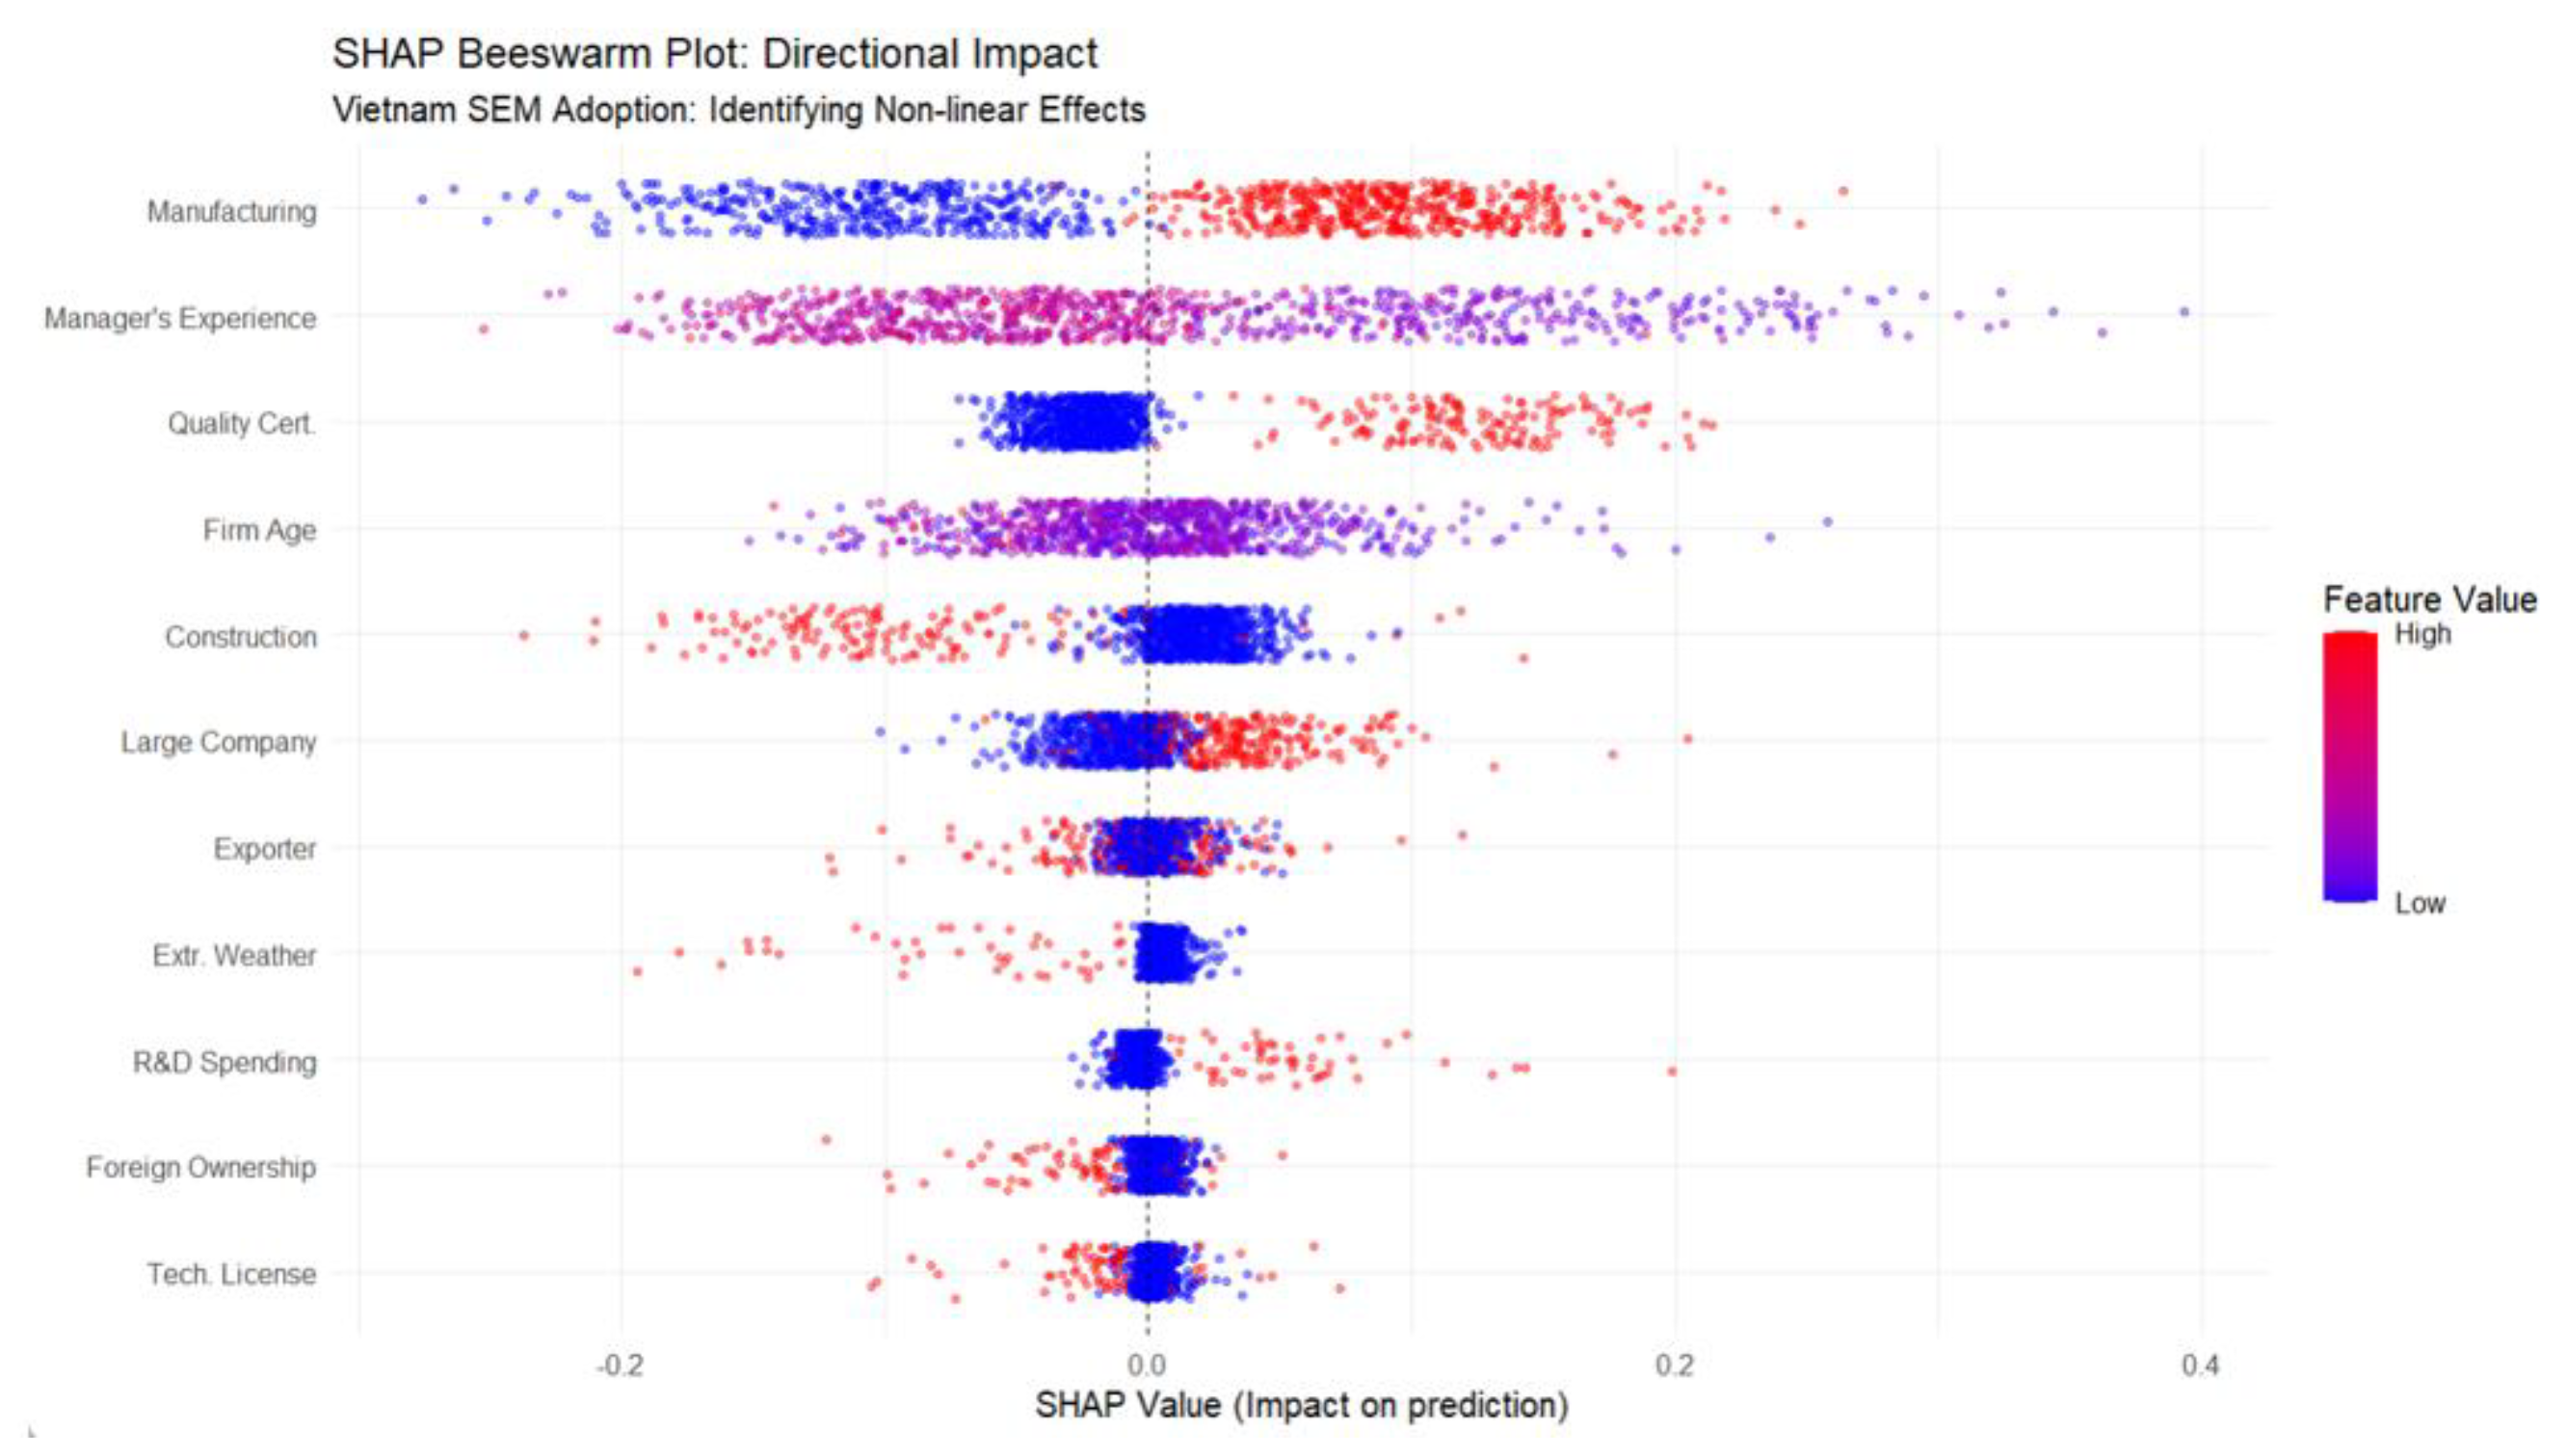

Table 1.
Variables used in the analysis.
| Group | Variable | Question |
| Dependent variable | Sustainable energy management (1 = Yes) | Over the last three years, did this establishment adopt any energy management measures to reduce emissions, waste, or pollution? |
| Firm characteristics and structural factors | Large Company (1 = Yes) | Sampling size: Small (5 to 19 employees), Medium (20 to 99 employees), Large (100 or more employees) |
| Manufacturing Sector (1 = Yes) | In the last fiscal year, what was this establishment’s main activity and product...? | |
| Construction Sector (1 = Yes) | In the last fiscal year, what was this establishment’s main activity and product...? | |
| Firm Age (years) | In what year did this establishment begin operations? | |
| Manager’s Experience | How many years of experience working in this sector does the Top Manager have? | |
| Innovation Capabilities and Knowledge Assets | R&D Spending (1 = Yes) | During the last fiscal year, did this establishment spend on research and development activities...? |
| Foreign Technology License (1 = Yes) | Does this establishment presently use technology licensed from a foreign-owned company, excluding office software? | |
| International Quality Certification (1 = Yes) | Does this establishment have an internationally recognized quality certification? | |
| External Linkages | Foreign Private Ownership (1 = Yes) | What percentage of this firm is owned by each of the following? Private foreign individuals, companies or organizations; Private domestic individuals, companies or organizations; Government or state |
| Exporter (1 = Yes) | What percentage of this establishment’s sales were...? Direct/Indirect Exports | |
| Control | Affected by Extreme Weather (1 = Yes) | In the last fiscal year, did this establishment experience damage of physical assets due to extreme weather events...? |
Table 2.
Descriptive statistics.
| Group | Variable | N | Mean | Std_Dev | Min | Max |
| Dependent variable | Sustainable energy management (1 = Yes) | 899 | 0.178 | 0.383 | 0 | 1 |
| Firm characteristics and structural factors | Large Company (1 = Yes) | 899 | 0.067 | 0.250 | 0 | 1 |
| Manufacturing Sector (1 = Yes) | 899 | 0.270 | 0.444 | 0 | 1 | |
| Construction Sector (1 = Yes) | 899 | 0.226 | 0.418 | 0 | 1 | |
| Firm Age (years) | 899 | 12.854 | 6.357 | 1 | 68 | |
| Manager’s Experience | 899 | 15.006 | 7.594 | 0 | 47 | |
| Innovation Capabilities and Knowledge Assets | R&D Spending (1 = Yes) | 899 | 0.045 | 0.208 | 0 | 1 |
| Foreign Technology License (1 = Yes) | 899 | 0.054 | 0.225 | 0 | 1 | |
| International Quality Certification (1 = Yes) | 899 | 0.065 | 0.246 | 0 | 1 | |
| External Linkages | Foreign Private Ownership (1 = Yes) | 899 | 0.046 | 0.210 | 0 | 1 |
| Exporter | 899 | 0.082 | 0.275 | 0 | 1 | |
| Control | Affected by Extreme Weather (1 = Yes) | 899 | 0.037 | 0.188 | 0 | 1 |
Table 3.
Logistic Regression Results.
| LOGIT MODEL | ||||||||||
| Model 1 | Model 2 | Model 3 | ||||||||
| Group | Variable | Estimate | OR | p-value | Estimate | OR | p-value | Estimate | OR | p-value |
| (Intercept) | -0.797 | 0.451 | 0.080 | 0.122 | 1.129 | 0.836 | 0.122 | 1.129 | 0.837 | |
| Firm characteristics and structural factors | Large Company (1 = Yes) | 0.836 | 2.308 | 0.050 | 0.769 | 2.158 | 0.063 | 0.782 | 2.185 | 0.060 |
| Manufacturing Sector (1 = Yes) | 0.297 | 1.346 | 0.400 | 0.278 | 1.321 | 0.432 | 0.264 | 1.303 | 0.459 | |
| Construction Sector (1 = Yes) | -0.068 | 0.935 | 0.904 | -0.010 | 0.990 | 0.986 | 0.004 | 1.004 | 0.995 | |
| Firm Age (years) | 0.006 | 1.006 | 0.843 | -0.033 | 0.968 | 0.616 | -0.032 | 0.969 | 0.631 | |
| Firm Age Squared | 0.001 | 1.001 | 0.340 | 0.001 | 1.001 | 0.350 | ||||
| Manager’s Experience | -0.102 | 0.903 | 0.001 | -0.225 | 0.799 | 0.001 | -0.225 | 0.798 | 0.001 | |
| Manager’s Experience Squared | 0.004 | 1.004 | 0.016 | 0.004 | 1.004 | 0.016 | ||||
| Innovation Capabilities and Knowledge Assets | R&D Spending (1 = Yes) | 1.842 | 6.309 | 0.002 | 1.948 | 7.012 | 0.001 | 2.017 | 7.517 | 0.001 |
| Foreign Technology License (1 = Yes) | 0.316 | 1.372 | 0.579 | 0.386 | 1.471 | 0.496 | 0.361 | 1.435 | 0.529 | |
| International Quality Certification (1 = Yes) | 2.307 | 10.045 | 0.000 | 2.253 | 9.514 | 0.000 | 2.278 | 9.757 | 0.000 | |
| External Linkages | Foreign Private Ownership (1=Yes) | -0.303 | 0.739 | 0.501 | -0.154 | 0.857 | 0.731 | -0.179 | 0.836 | 0.692 |
| Exporter (1=Yes) | 0.740 | 2.097 | 0.065 | 0.797 | 2.219 | 0.044 | 0.830 | 2.294 | 0.039 | |
| Control | Affected by Extreme Weather (1=Yes) | -0.333 | 0.717 | 0.537 | ||||||
Omitted sectors: retail, wholesale trade, and services.
Table 4.
Firth Logit Model Results.
| FIRTH LOGIT MODEL | ||||||||||
| Model 1 | Model 2 | Model 3 | ||||||||
| Group | Variable | Estimate | OR | p-value | Estimate | OR | p-value | Estimate | OR | p-value |
| (Intercept) | -0.803 | 0.448 | 0.001 | 0.074 | 1.077 | 0.835 | 0.072 | 1.074 | 0.841 | |
| Firm characteristics and structural factors | Large Company (1 = Yes) | 0.837 | 2.310 | 0.030 | 0.771 | 2.162 | 0.044 | 0.780 | 2.182 | 0.042 |
| Manufacturing Sector (1 = Yes) | 0.298 | 1.347 | 0.233 | 0.286 | 1.331 | 0.258 | 0.274 | 1.315 | 0.281 | |
| Construction Sector (1 = Yes) | -0.063 | 0.939 | 0.812 | -0.007 | 0.993 | 0.979 | 0.007 | 1.007 | 0.979 | |
| Firm Age (years) | 0.007 | 1.007 | 0.711 | -0.021 | 0.979 | 0.553 | -0.020 | 0.981 | 0.586 | |
| Firm Age Squared | 0.001 | 1.001 | 0.332 | 0.001 | 1.001 | 0.350 | ||||
| Manager’s Experience | -0.100 | 0.905 | 0.000 | -0.225 | 0.798 | 0.000 | -0.226 | 0.798 | 0.000 | |
| Manager’s Experience Squared | 0.004 | 1.004 | 0.002 | 0.004 | 1.004 | 0.002 | ||||
| Innovation Capabilities and Knowledge Assets | R&D Spending (1 = Yes) | 1.814 | 6.133 | 0.000 | 1.901 | 6.694 | 0.000 | 1.958 | 7.086 | 0.000 |
| Foreign Technology License (1 = Yes) | 0.327 | 1.387 | 0.404 | 0.394 | 1.484 | 0.314 | 0.374 | 1.453 | 0.344 | |
| International Quality Certification (1 = Yes) | 2.228 | 9.285 | 0.000 | 2.169 | 8.751 | 0.000 | 2.185 | 8.888 | 0.000 | |
| External Linkages | Foreign Private Ownership (1=Yes) | -0.281 | 0.755 | 0.550 | -0.138 | 0.871 | 0.771 | -0.157 | 0.855 | 0.741 |
| Exporter (1=Yes) | 0.736 | 2.087 | 0.049 | 0.785 | 2.193 | 0.037 | 0.812 | 2.253 | 0.033 | |
| Control | Affected by Extreme Weather (1=Yes) | -0.273 | 0.761 | 0.601 | ||||||
Omitted sectors: retail, wholesale trade, and services.
Table 5.
Importance and cumulative importance of covariates.
| Variable | Importance | Cumulative | % |
| International Quality Certification | 0.024 | 0.024 | 26% |
| Manufacturing Sector | 0.016 | 0.040 | 44% |
| Manager’s Sector Experience | 0.015 | 0.056 | 61% |
| Foreign Private Ownership | 0.010 | 0.065 | 71% |
| Large Company | 0.008 | 0.073 | 80% |
| Firm Age (years) | 0.008 | 0.081 | 88% |
| R&D Spending | 0.005 | 0.086 | 94% |
| Exporter | 0.002 | 0.089 | 97% |
| Construction Sector | 0.002 | 0.091 | 99% |
| Foreign Technology License | 0.001 | 0.091 | 99% |
| Affected by Extreme Weather | 0.001 | 0.092 | 100% |
Table 6.
Performance metrics for the logit, Firth, and RF models.
| Metric | Logit Model | Firth Model | Random Forest |
| Accuracy | 0.789 | 0.792 | 0.850 |
| Sensitivity (true positive rate) | 0.478 | 0.478 | 0.861 |
| Specificity (true negative rate) | 0.895 | 0.900 | 0.846 |
| Balanced Accuracy | 0.687 | 0.689 | 0.854 |
| AUC-ROC | 0.786 | 0.789 | 0.927 |
| F1-Score | 0.537 | 0.541 | 0.746 |
Disclaimer/Publisher’s Note: The statements, opinions and data contained in all publications are solely those of the individual author(s) and contributor(s) and not of MDPI and/or the editor(s). MDPI and/or the editor(s) disclaim responsibility for any injury to people or property resulting from any ideas, methods, instructions or products referred to in the content. |
© 2026 by the authors. Licensee MDPI, Basel, Switzerland. This article is an open access article distributed under the terms and conditions of the Creative Commons Attribution (CC BY) license (http://creativecommons.org/licenses/by/4.0/).
Copyright: This open access article is published under a Creative Commons CC BY 4.0 license, which permit the free download, distribution, and reuse, provided that the author and preprint are cited in any reuse.


