Submitted:
02 November 2025
Posted:
06 November 2025
You are already at the latest version
Abstract
This study explores the application of Artificial Intelligence (AI) algorithms for detecting hazardous substance discharges into water bodies and modeling their distribution. River pollution remains a major environmental concern, while traditional monitoring methods are labor-intensive, costly, and lack operational efficiency. The paper analyzes key water quality parameters and modern Internet of Things (IoT) systems that enable real-time data collection on indicators such as pH, dissolved oxygen, temperature, and turbidity. Emphasis is placed on Machine Learning (ML) algorithms for anomaly detection and pollution forecasting. Methods including linear regression, decision trees, neural networks, and clustering are compared, with particular attention to ensemble models such as Random Forest (RF) and XGBoost. Using open environmental data on Ukrainian surface waters for 2022, RF and XGBoost were found to effectively predict nitrogen and dissolved oxygen concentrations and identify anomalies linked to anthropogenic pollution sources, including municipal sewage and agricultural runoff. The integration of AI and IoT technologies significantly improves the accuracy, speed, and efficiency of water quality monitoring, supporting early warning systems and sustainable water management while highlighting ongoing challenges related to data quality and implementation costs.
Keywords:
Artificial Intelligence (AI)
; Machine Learning (ML)
; Internet of Things (IoT)
; anomaly detection
; water pollution monitoring
; ensemble models
; Random Forest
; XGBoost
1. Introduction
1.1. Problem Statement
River pollution is a serious environmental problem that significantly impacts ecosystems and human health. The main sources of pollution are municipal and industrial waste, agricultural activity, mining of useful minerals, and petroleum products. These contain heavy metals, pesticides, organic substances, and microorganisms of fecal origin. Pollution leads to changes in the species composition of hydrobionts, which can disrupt the natural balance of the ecosystem and reduce biodiversity. Changes in the number and biomass of species affect the productivity of the ecosystem, which can lead to a decrease in water quality. River pollution also has a direct impact on human health, as consuming polluted water can lead to various diseases, including infectious diseases and heavy metal poisoning.
The exponential growth in the volume of IoT data in environmental monitoring creates critical challenges for developing resource-efficient algorithms for analysis. Although Deep Learning (LSTM, CNN) (Al Farizi et al., 2021) is often used for time series, its high computational requirements and low interpretability complicate operational implementation in real early warning systems. Instead, a methodology is needed for the rapid conversion of raw data into operational decisions.
Thus, monitoring and control of water quality in rivers are critically important for preserving ecosystems and ensuring public health (Rodionov et al., 2023; Zabulonov et al., 2019). The use of modern technologies, such as Artificial Intelligence (AI), can significantly improve the effectiveness of these processes.
In contrast to specialized anomaly detection models (Isolation Forest, One-Class SVM) (Aschepkov, 2024; Forhad et al., 2024), which require prior labeling or a clean dataset, we propose a hybrid ensemble approach that combines the high accuracy of Random Forest/XGBoost with residual analysis to detect anomalies in unlabeled, noisy environmental data.
1.2. Research Objectives
The aim of this work is the development and empirical validation of a methodology for detecting critical anomalies in hydrochemical time series, using a hybrid ensemble approach (Random Forest and XGBoost) with subsequent residual analysis () to ensure high accuracy and operational efficiency of early warning systems. The novelty lies in demonstrating that this approach, applied to open environmental data of Ukraine, allows not only achieving high accuracy () but also geographically verifying the nature of the anomaly.
2. Results
Traditional water quality monitoring methods, which include manual sample collection and laboratory analysis, have their advantages and disadvantages, summarized in Table 1, but they are often labor-intensive, expensive, and cannot provide sufficient spatial and temporal coverage for effective pollution detection and tracking.
The latest intelligent information technologies, particularly Artificial Intelligence (AI), play an important role in modern environmental monitoring, ensuring more accurate and effective data analysis. Here are some existing solutions. The digital platform "World Environment Situation Room (WESR)" collects and analyzes data from various sources, including satellites and sensors, to monitor the state of the environment. The platform was launched by the UN Environment Programme (UNEP) and uses AI for global environmental analysis. The GEMS air pollution monitoring platform uses AI to track air pollution levels in real-time, analyzing data from sensors located at various points in the city and providing air quality forecasts. AI is used for monitoring emissions of one of the most powerful greenhouse gases – methane. AI algorithms analyze data from satellites and ground sensors to detect emission sources and assess their impact on the climate. AI helps assess the impact of various activities on the environment and climate. This includes analyzing data on greenhouse gas emissions, resource use, and other environmental indicators.
AI to analyze data from sensors that measure various water parameters, such as pollution levels, temperature, and pH. This allows for the detection of anomalies and the prediction of possible threats. AI is used for monitoring wild animal populations and their habitats. Algorithms analyze data from surveillance cameras, drones, and other sources to detect changes in animal behavior and the state of their habitats. The presented environmental technologies demonstrate how AI can significantly improve the effectiveness and accuracy of environmental monitoring, helping to preserve the environment and ensure sustainable development (Melenchuk & Protsyshyn, 2023).
Biological, hydromorphological, and physicochemical parameters help ensure a comprehensive approach to river water quality monitoring, which is critically important for preserving ecosystems and ensuring public health.
Various sensors and equipment are used for water quality monitoring, ensuring accurate measurements of different water parameters. Dissolved Oxygen (DO) sensors have high accuracy, which is a critical parameter for aquatic ecosystems, and are calibrated once every 3–6 months. pH sensors have high accuracy in assessing water acidity/alkalinity but are calibrated monthly or before each use. Temperature sensors are important for chemical reactions and biological processes. They generally do not require calibration, but accuracy verification is recommended once a year. Turbidity sensors are important for assessing water transparency and sediment level and are usually calibrated every 6 months. Conductivity sensors are used to indicate the concentration of ions in the water, and calibration is recommended every 3–6 months. Data about them are summarized in Table 2 and Table 3.
The use of Internet of Things (IoT) technologies opens up new possibilities for real-time water quality monitoring (Hamid et al., 2020; Kamaludin & Ismail, 2017). Modern water quality IoT systems measure parameters such as pH, temperature, water level, turbidity, ORP, DO, EC, chlorophyll, blue-green phytoplankton, conductivity, depth, salinity, chlorine, and others. They use almost all available data transmission technologies: LoRaWAN, NB-IoT, 4G, LTE, GSM, GPRS, Bluetooth, USB, SDI-12, Modbus, Wi-Fi, MQTT, REST API, SD-card, and others.
Sensors collect data on water parameters and transmit them to a central system on servers and cloud platforms for processing. The characteristics of modern IoT water quality sensors are summarized in Table 4.
The application of Artificial Intelligence (AI) and Machine Learning (ML) algorithms in water resource monitoring opens up new possibilities for increasing the accuracy, responsiveness, and effectiveness of environmental analysis. These algorithms ensure automated processing of large data sets coming from sensor systems, aiming to detect anomalous changes, predict potential pollution threats, and formulate scientifically sound recommendations for water ecosystem management. Integration with digital platforms and mobile applications allows for the visualization of results in the form of graphs, cartographic layers, and analytical reports, as well as rapidly informing users about critical deviations from normative indicators.
Different types of AI algorithms have a specific purpose depending on the nature of the data and the research goals. Specifically, linear regression is used to build models of dependence between the physicochemical parameters of water and its quality indices. Decision trees are effective for detecting patterns and anomalies in structured data. Support Vector Machine (SVM) methods are applied for classifying types of pollution, while clustering (K-Means) allows for the identification of spatial zones with increased levels of anthropogenic load. Convolutional Neural Networks (CNN) ensure the analysis of satellite images and images of water objects, and Recurrent Networks (LSTM) predict the dynamics of water quality changes based on time series. Transformer architectures allow for the detection of complex interdependencies in multi-dimensional data, and Autoencoders identify atypical combinations of parameters that may indicate hidden sources of pollution.
The application of these tools allows environmentalists not only to respond quickly to changes in the aquatic environment but also to form long-term strategies for water resource management based on data. Summarized data on AI algorithms used for water quality data analysis are presented in Table 5.
The indicated algorithms help ensure accurate and effective analysis of water quality data, which is critically important for preserving ecosystems and ensuring public health.
Examples of successful implementation of such projects include the "Smart Water" Project (USA) and the "AquaWatch" Project (European Union). The "Smart Water" Project (n.d.) uses IoT for water quality monitoring in urban water supply systems. Sensors collect water quality data, which are analyzed in real-time to detect pollution. The "AquaWatch" Project is based on the use of satellite data and IoT for monitoring water quality in rivers and lakes. In both projects, integration with IoT allows for continuous real-time water quality monitoring, which is critically important for preserving ecosystems and ensuring public health. An example of successful use of AI for water quality monitoring in Ukraine is the "Clean Water" project, in which data on water quality in rivers and lakes of Ukraine are collected using IoT sensors and analyzed using machine learning and AI algorithms.
The reviewed Artificial Intelligence methods demonstrate a wide range of possibilities for increasing the effectiveness of water quality monitoring, particularly through the automated analysis of large volumes of data. One of the key directions of their practical application is the detection of anomalies in water environment indicators, which may indicate sudden pollution or technogenic impacts.
In this context, machine learning algorithms play a special role, allowing the identification of atypical deviations in data, even in the absence of clearly defined threshold values. Let's consider the main approaches to anomaly detection in water quality data using ML. Examples of the most effective ML algorithms used for anomaly detection in water quality data are provided in Table 6.
Continuous water quality monitoring using AI and IoT allows for the real-time detection of hazardous substance discharges into rivers and water bodies. The detection of discharges is based on the assumption that anomalies significantly deviate from the normal behavior of the data. In the context of monitoring and anomaly detection that may indicate environmental threats or changes, a number of machine learning algorithms exist.
The "Isolation Forest" algorithm (Cheng et al., 2019) effectively detects anomalous observations that are "isolated" faster than normal data through random feature partitioning. In environmental monitoring, this can be applied to detect atypical changes in ecological time series (e.g., sharp jumps in air or water pollution, uncharacteristic behavior of species populations).
The "One-Class SVM" algorithm (Kerimov et al., 2025) is used to identify deviations from the "normal" profile of environmental data when data primarily describing the normal state of the ecosystem are available. It builds a boundary around these normal data, and any new observations outside this boundary are considered anomalous (e.g., detecting unusual chemical compounds in soil samples that are not characteristic of the given area).
The "Local Outlier Factor" (LOF) algorithm determines the degree of abnormality of each data point by comparing its local density with the density of its neighbors. In the environmental protection sphere, LOF can help detect localized anomalies, such as points with unusually low biodiversity compared to surrounding areas or sudden local changes in water temperature (Cheng et al., 2019).
"Autoencoders" algorithms are based on neural networks trained to reconstruct input data (Akhmetshyna & Nesterenko, 2024). Anomalies can be detected as observations for which the reconstruction error is significantly higher, as the model was not trained on such atypical data. Autoencoders can be used to detect unusual combinations of environmental parameters in large datasets from remote sensing or water quality monitoring networks.
"Random Forest" is a method that combines a large number of independent decision trees, each trained on a random subset of data and features. The resulting prediction is formed as the average of the predictions of all trees. The method ensures high accuracy, resistance to overfitting, and allows for assessing feature importance.
"XGBoost" (Extreme Gradient Boosting) is a boosting model that sequentially trains weak models (decision trees), each correcting the errors of the previous ones. The algorithm optimizes the loss function with regularization, allowing for high accuracy while maintaining generalizability. XGBoost supports handling missing values, automatic feature selection, and parallel training.
The application of these methods allows for more effective detection of potential environmental problems at early stages, tracking changes in ecosystems, and making informed decisions regarding environmental protection measures.
A comparison of AI and ML methods for anomaly detection is presented in Table 7.
To select the monitoring method for water in reservoirs, factors such as data structure (structured, unstructured), data size, resource size (limited, unlimited), and the nature of anomalies must be considered. The method selection is summarized in Table 8.
Various types of models are used to assess and predict the pathways of hazardous substance spread in water bodies.
Mathematical models (including Gaussian and turbulent diffusion models) are applied to describe the processes of pollutant dispersion in the aquatic environment. They are based on the normal distribution of concentrations and consider the influence of turbulent flows and diffusion. Such models are effective for estimating pollution levels at different distances from the source, especially in complex hydrological conditions.
Hydrodynamic models, based on the equations of fluid motion (Navier–Stokes equations, transport equations), allow for modeling the behavior of water flows and the spread of pollution in water bodies. They take into account real hydrodynamic conditions, which makes them indispensable for environmental monitoring and planning clean-up measures.
Machine learning methods use historical data to detect patterns in pollution spread, allowing for building forecasts based on the analysis of large volumes of ecological information, which is particularly useful when the amount of field measurements is limited.
A comparative characteristic of these approaches is given in Table 9, which allows for selecting the optimal modeling method depending on the research conditions and available data.
These methods help ensure accurate and effective prediction of hazardous substance spread pathways in water bodies, which is critically important for preserving ecosystems and ensuring public health.
The application of Artificial Intelligence (AI) methods in water quality monitoring systems is accompanied by a number of technical and practical challenges. The effectiveness of AI models largely depends on the quality of the input data coming from sensor devices. Incomplete or inaccurate data can lead to false predictions and incorrect management decisions (Shestopalov et al., 2024).
The process of training and functioning of AI models requires significant computational resources, which may be inaccessible to small organizations. The integration of intelligent systems into the already existing monitoring infrastructure is often complex and requires additional financial and technical costs (Tekhnična inzhenerija, 2024). The high cost of implementing and maintaining such systems can become a barrier to their widespread adoption, especially under conditions of limited funding. It is also important to consider that the effective use of AI requires highly qualified personnel, which is not always available in environmental institutions with limited human resources.
Besides technical aspects, the application of AI in water resource monitoring must comply with current regulatory requirements and standards, which may complicate its implementation. These limitations are important aspects to consider when implementing AI for water quality monitoring.
The authors conducted a study to assess the effectiveness of machine learning algorithms for predicting key water quality indicators, particularly nitrogen concentration and dissolved oxygen, based on multi-dimensional chemical, spatial, and seasonal features. Anomaly detection was additionally performed, which may indicate hazardous substance discharges or sensor errors.
Open environmental water quality data collected between February 2022 and January 2023 were analyzed, containing information on the quality status of Ukraine's surface waters for 2022. The dataset contains primary information (observation data) from the state monitoring of surface waters. Data are presented by monitoring sites and sampling dates. The set includes 16 key monitoring indicators: total nitrogen, biochemical oxygen demand for 5 days, suspended solids, dissolved oxygen, sulfate ions, chloride ions, ammonium ions, nitrate ions, nitrite ions, phosphate ions (polyphosphates), chemical oxygen demand, phytoplankton, and others. Each table in the dataset contains observation data for a specific period. Monitoring programs and other reference information can be found on the State Water Agency website (Derzhavne ahentsvo vodnykh resursiv Ukrayiny, n.d.) and the Portal for monitoring and environmental assessment of Ukraine's water resources (Portal monitorynhu ta ekologhichnoji otsinky vodnykh resursiv Ukrajiny, n.d.).
Data from monthly files were merged, cleaned of missing values, and converted to a numerical format. Relevant chemical, spatial, and seasonal features (biochemical oxygen demand for 5 days, phosphate concentration, and nitrate concentration, geographical coordinates of monitoring sites, and seasonal features) were selected for nitrogen and oxygen. A hybrid ensemble approach (RF/XGBoost + residual analysis) was chosen for predicting key indicators (nitrogen, oxygen). This choice is pragmatic and optimal because, in addition to high accuracy and resistance to overfitting, these models are less demanding on computational resources compared to deep learning methods (e.g., autoencoders), which was appropriate for the study's capabilities. Residual analysis was applied for anomaly detection, where the deviation threshold from the model's prediction indicated unforeseen events, such as local pollution or measurement errors. Both methods were tested on identical datasets. The standard 80/20 train/test split method was used for initial model evaluation, and more robust methods, such as k-fold cross-validation, are proposed for future research. Residual analysis for anomaly detection, model comparison, and result generalization were also performed. The coefficient of determination (R2), which shows the proportion of the variation in the target variable the model could explain based on features, and the Root Mean Square Error (RMSE) were calculated for each model.
All key stages of the study were verified and summarized in Table 10.
Residual analysis allowed for the identification of anomalous points that significantly deviate from the model's predictions (Figure 1). These deviations indicate the presence of observations that do not correspond to the general pattern and may be indicators of unforeseen events, such as local pollution or measurement errors.
Anomalous points that do not correspond to the general pattern were detected. Based on Latitude and Longitude coordinates, maps (Figure 2) were constructed to demonstrate the spatial location of these anomalous points. The visualization confirmed that anomalies are not concentrated in one region (from Lviv region to Odesa region), which indicates the systemic nature of the phenomenon or distributed pollution sources (municipal sewage, agricultural impact) across the entire monitoring area.
Verification of the origin of the anomalous points by monitoring siteі was carried out. It was found that six monitoring sites are sources of most anomalies, which may indicate local pollution problems, technical measurement errors, or non-uniformity in data collection methods. The integration of residual analysis into the modeling process allowed for increased prediction accuracy and the detection of potentially critical points that require additional monitoring. This approach demonstrates how AI algorithms can be used for the early detection of environmental threats. Prediction results and model evaluation are presented in Table 11.
Residual analysis was performed for each indicator to detect anomalous points that do not align with the models' predictions. For oxygen, both models have similar accuracy, but RF detected slightly more anomalies (28 versus 6). The threshold is lower for oxygen, indicating less residual variability. Nitrogen anomalies are concentrated around technogenic sources, while oxygen anomalies are more widely distributed, often associated with drinking water intakes. Some monitoring sites (Table 12) have anomalies that recur across different models, regardless of the method or target variable.
Residual analysis allowed for the identification of anomalous points that significantly deviate from the model's predictions. These deviations indicate the presence of observations that do not correspond to the general pattern and may be indicators of unforeseen events, such as local pollution or measurement errors. Anomalous points that do not align with the general pattern were detected.
Six monitoring sites are the sources of most recurring anomalies across different models, which indicates systemic instability or the manifestation of local pollution. Specifically, anomalies at the R. Poltva monitoring site (Kam'yanopil'), which consistently deviated from predicted values, have a high probability of technogenic origin. This monitoring site is located downstream from Lviv and its sewage treatment plants. Deviations detected by the Random Forest and XGBoost models may be a direct indicator of irregular or peak discharges from the municipal infrastructure that do not fit into usual seasonal and annual patterns. A similar situation is observed at other monitoring sites, which is confirmed by geographical analysis.
Anomalies were detected in two or more models at six monitoring sites. The Kropyvnyk River is the most persistent point of concern, with four anomalies identified by the RF model (nitrogen) and confirmed by the XGB model (nitrogen). The Hadzhyder River presents a unique case where anomalies were found for both indicators (nitrogen and oxygen) in the RF model. The Kyrhyzh-Kytay River shows a cross-model anomaly, appearing in the XGB model (nitrogen) and the RF model (oxygen).
These points may indicate systemic water quality problems, anthropogenic impacts, or sensor measurement instability. Their detection, independent of the model used, confirms the consistency of the algorithms and the reliability of the anomaly detection approach.
The detected anomalies exhibit a clear seasonal and spatial structure, indicating the models' sensitivity to natural and anthropogenic factors. Anomalies that recur across different models point to systemic water quality problems, regardless of the algorithm chosen.
Thus, the applied anomaly detection method (residual analysis) successfully identifies local pollution sources associated with high anthropogenic pressure. Combining ensemble methods (RF, XGB) with residual analysis proves to be an effective strategy for uncovering hidden patterns in environmental data. This approach can be scaled to other types of monitoring, including air, soil, or biological indicators. ML models have demonstrated their ability to detect complex non-linear dependencies, offering high accuracy and ease of interpretation without manual formula tuning. This research demonstrates that AI can support environmental monitoring, and these models can be integrated into early warning system.
3. Conclusions
The conducted research confirmed that combining ensemble algorithms (Random Forest and XGBoost) with residual analysis is an effective tool for identifying systemic and hidden anomalies in water quality data. The geographic verification of anomalous points clearly correlates their occurrence with major sources of anthropogenic impact. Specifically, two main types of impact were identified: technogenic and agricultural. The technogenic impact, recorded on the Poltva and Kropyvnyk rivers, is linked to municipal and industrial discharges from large cities. The agricultural impact, detected on the Hadzhyder and Kyrhyzh-Kytay rivers, manifests through cross-model anomalies of nitrogen and oxygen, which serve as a direct indicator of systemic eutrophication caused by fertilizer runoff. This approach allows for the transformation of machine learning results into operational data for environmental management and early warning of local pollution events.
A comparison between artificial intelligence and traditional methods in the field of water quality monitoring reveals significant differences across several key criteria.
From the perspective of accuracy and speed, AI provides high analytical precision and is capable of processing data in real time, which is critically important for preserving ecosystems and ensuring public health. Traditional methods can also be accurate, but they require significantly more time to perform the analysis.
Regarding responsiveness, AI-based systems enable continuous monitoring and rapid reaction to changes in the aquatic environment. In contrast, traditional approaches are limited in this aspect as they rely on manual data collection, which slows down the response process.
In the context of cost and accessibility, AI helps reduce expenses associated with manual data collection and is easily scalable. At the same time, traditional methods have the advantage of relatively low-cost field tests, especially in the initial stages.
However, both approaches have their drawbacks. AI is characterized by a high dependency on the quality of input data, as well as significant costs for system implementation and maintenance. Traditional methods, in turn, require expensive laboratory analyses and a long time to process the results.
In summary, we can affirm that AI ensures high accuracy in data analysis through the use of machine learning and deep learning algorithms. This allows for the detection of complex anomalies that might be missed by traditional methods.
Continuous, real-time monitoring of water quality enables the rapid detection of pollution and the implementation of necessary remediation measures. Integration with Internet of Things (IoT) systems provides for the automation of data collection and analysis processes, which increases the efficiency of water resource management. AI algorithms can predict the spread of pollutants in water bodies, which allows for timely measures to be taken to prevent environmental disasters. Machine learning models help assess the impact of various factors on water quality and develop strategies to reduce pollution. The speed of data processing increases significantly, which enables real-time results and rapid responses to changes in water quality. Overall, AI, ML, and IoT help to optimize water resource management, reducing the costs associated with their monitoring and purification.
Prospects for further research in the field of AI-powered water quality monitoring encompass several key areas aimed at enhancing the accuracy, efficiency, and scalability of these technologies. Among them are the development of new, more sensitive sensors, the integration of systems with the Internet of Things (IoT) for real-time data collection, and the use of satellite data for large-scale monitoring. An important direction is the improvement of artificial intelligence algorithms, particularly machine learning and deep learning, for more precise analysis and prediction of pollution.
Furthermore, significant attention should be given to modernizing laboratory equipment to improve the quality of analytical research. All these areas contribute to the creation of more reliable, adaptive, and accessible monitoring systems, which are critically important for the protection of water resources, environmental safety, and public health.
References
- Akhmetshyna, L., & Nesterenko, A. (2024). Analiz aerofotozjomok z vykorystannjam zhortovoji merezhi avtoenkoduvannja [Analysis of aerial photography using a convolutional autoencoding network]. Vymirjuvaljni ta obchysljuvaljni prylady v tekhnologhichnykh protsesakh, (3). https://vottp.khmnu.edu.ua/index.php/vottp/article/view/340. [CrossRef]
- Al Farizi, W. S., Hidayah, I., & Rizal, M. N. (2021, September). Isolation forest-based anomaly detection: A systematic literature review. In 2021 8th International Conference on Information Technology, Computer and Electrical Engineering (ICITACEE) (pp. 118–122). IEEE.
- Aschepkov, V. (2024). The use of the Isolation Forest model for anomaly detection in measurement data. Innovative Technologies and Scientific Solutions for Industries, 1(27). https://journals.uran.ua/itssi/article/view/301062. [CrossRef]
- Boiko, V. V., & Pljatsuk, L. D. (2010). Analiz metodiv matematychnogho modeljuvannja rozpovsjudzhennja zabrudnjujučykh rechovyn v atmosferi [Analysis of mathematical modeling methods for the spread of pollutants in the atmosphere]. Visnyk KrNU. https://visnikkrnu.kdu.edu.ua/statti/2010-6-1(65)/148.pdf.
- Cheng, Z., Zou, C., & Dong, J. (2019). Outlier detection using Isolation Forest and local outlier factor. In RACS '19: Proceedings of the Conference on Research in Adaptive and Convergent Systems (pp. 161–168). [CrossRef]
- Derzhavne ahentsvo vodnykh resursiv Ukrayiny. (n.d.). Monitorynh poverkhnevykh vod [Monitoring of surface waters]. https://www.davr.gov.ua/monitoring-poverhnevih-vod1.
- Forhad, H. M., Uddin, M. R., Chakrovorty, R. S., Ruhul, A. M., Faruk, H. M., Kamruzzaman, S.,... Morshed, A. M. (2024). IoT-based real-time water quality monitoring system in water treatment plants (WTPs). Heliyon, 10(23). [CrossRef]
- GEO AquaWatch. (n.d.). https://www.geoaquawatch.org/.
- Hamid, S. A., Rahim, A. M. A., Fadhlullah, S. Y., et al. (2020). IoT-based water quality monitoring system and evaluation. In 2020 10th IEEE International Conference on Control System, Computing and Engineering (ICCSCE) (pp. 102–106). IEEE. [CrossRef]
- Kamaludin, K. H., & Ismail, W. (2017). Water quality monitoring with Internet of Things (IoT). In 2017 IEEE Conference on Systems, Process and Control (ICSPC) (pp. 18–23). IEEE. [CrossRef]
- Kerimov, K., Kerimov, K., & Azizova, Z. (2025). Methods for detecting anomalies in network traffic based on one-class SVM technology. International Scientific Technical Journal “Problems of Control and Informatics”, 70(2). https://jais.net.ua/index.php/files/article/view/418. [CrossRef]
- Melenchuk, O., & Protsyshyn, Yu. (2023). Vykorystannja ŠI u vyrišenni ekologhičnykh problem, a same upravlinni vodnymy resursamy [The use of AI in solving environmental problems, namely water resources management]. Nejromarketynh, štučnyj intelekt ta tsyfrovyj marketynh, 128.
- Portal monitorynhu ta ekologhichnoji otsinky vodnykh resursiv Ukrajiny [Portal for monitoring and ecological assessment of water resources of Ukraine]. (n.d.). http://monitoring.davr.gov.ua/.
- Rodionov, V., Nikolenko, V., Tutsky, D., Burtniak, V., Melnychenko, T., Zabulonov, Yu., Illsley, M., & Mikhalovsky, S. (2023). Combined nonthermal plasma and carbon sorption in water decontamination from persistent organic pollutants. In 9th International Conference on Carbon for Energy Storage and Environmental Protection.
- Shestopalov, O. V., Sakun, A. O., Lizantan, P. S., Kanunnikova, N. O., Haiduchyk, O. H., Tomashevskyi, R. S., & Vorobjov, B. V. (2024). Analiz pokaznykiv jakosti vody: sučasni aspekty i vyklyky [Analysis of water quality indicators: modern aspects and challenges]. Ekologhični nauky, 3(54). http://ecoj.dea.kiev.ua/archives/2024/3/12.pdf. [CrossRef]
- Vymohy do tekhničnykh zasobiv avtomatyzovanoji systemy vymirjuvannja ghidrokhimičnykh parametriv poverkhnevykh vod iz zastosuvannjam IoT-tekhnologhij [Requirements for technical means of an automated system for measuring hydrochemical parameters of surface waters using IoT technologies]. (2024). Tekhnična inzhenerija, 2(94), 13.
- Yan, R., Liao, J., Yang, J., Sun, W., Nong, M., & Li, F. (2021). Multi-hour and multi-site air quality index forecasting in Beijing using CNN, LSTM, CNN-LSTM, and spatiotemporal clustering. Expert Systems with Applications, 169, 114513. [CrossRef]
- Zabulonov, Yu. L., Kadoshnikov, V. M., & Melnychenko, T. I. (2019). Kolojidni nanodyspersiji dlja očyšhennja tekhnoghenno zabrudnenykh vod [Colloidal nanodispersions for the purification of technogenically contaminated waters]. In VII naučna konferencija “Fundamentaljni ta prykladni doslidzhennja u sučasnij nauci” (p. 65). Tehnologichnyj Tsentr.
Figure 1.
Results of nitrogen and oxygen prediction and visualization of anomalies detected by residual analysis.
Figure 1.
Results of nitrogen and oxygen prediction and visualization of anomalies detected by residual analysis.
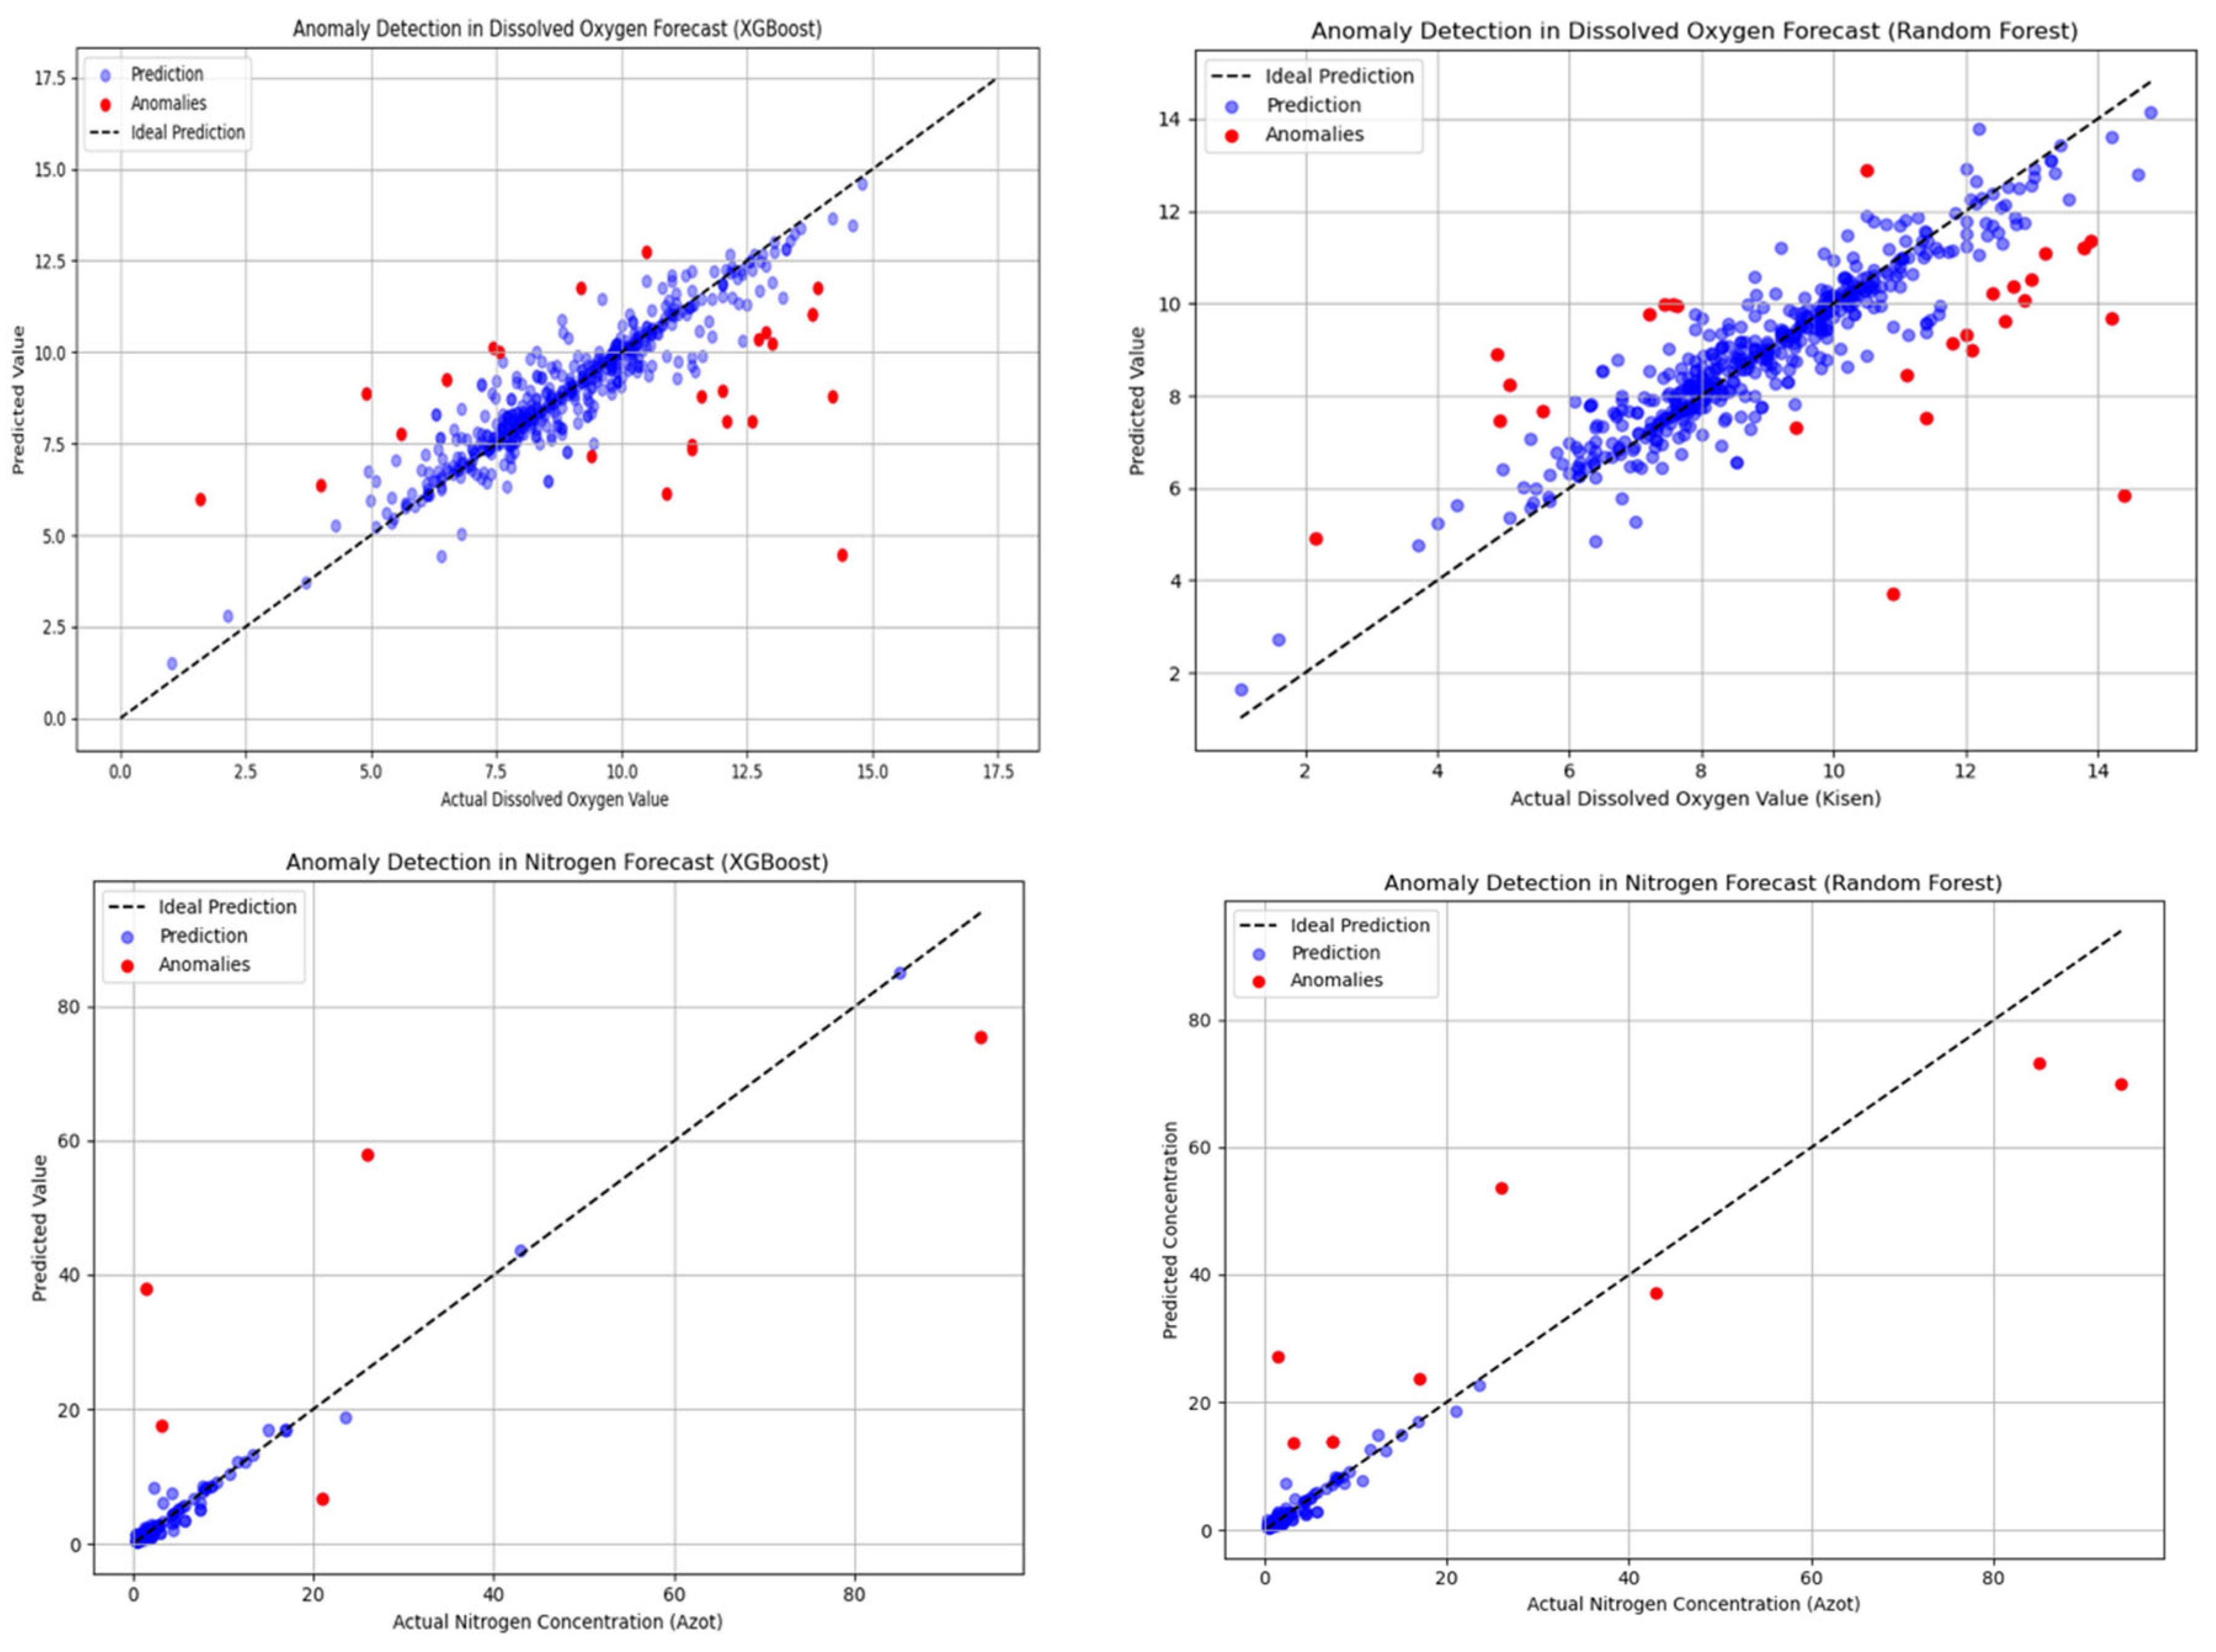
Figure 2.
Spatial visualization of nitrogen and oxygen anomalies detected at monitoring sites.
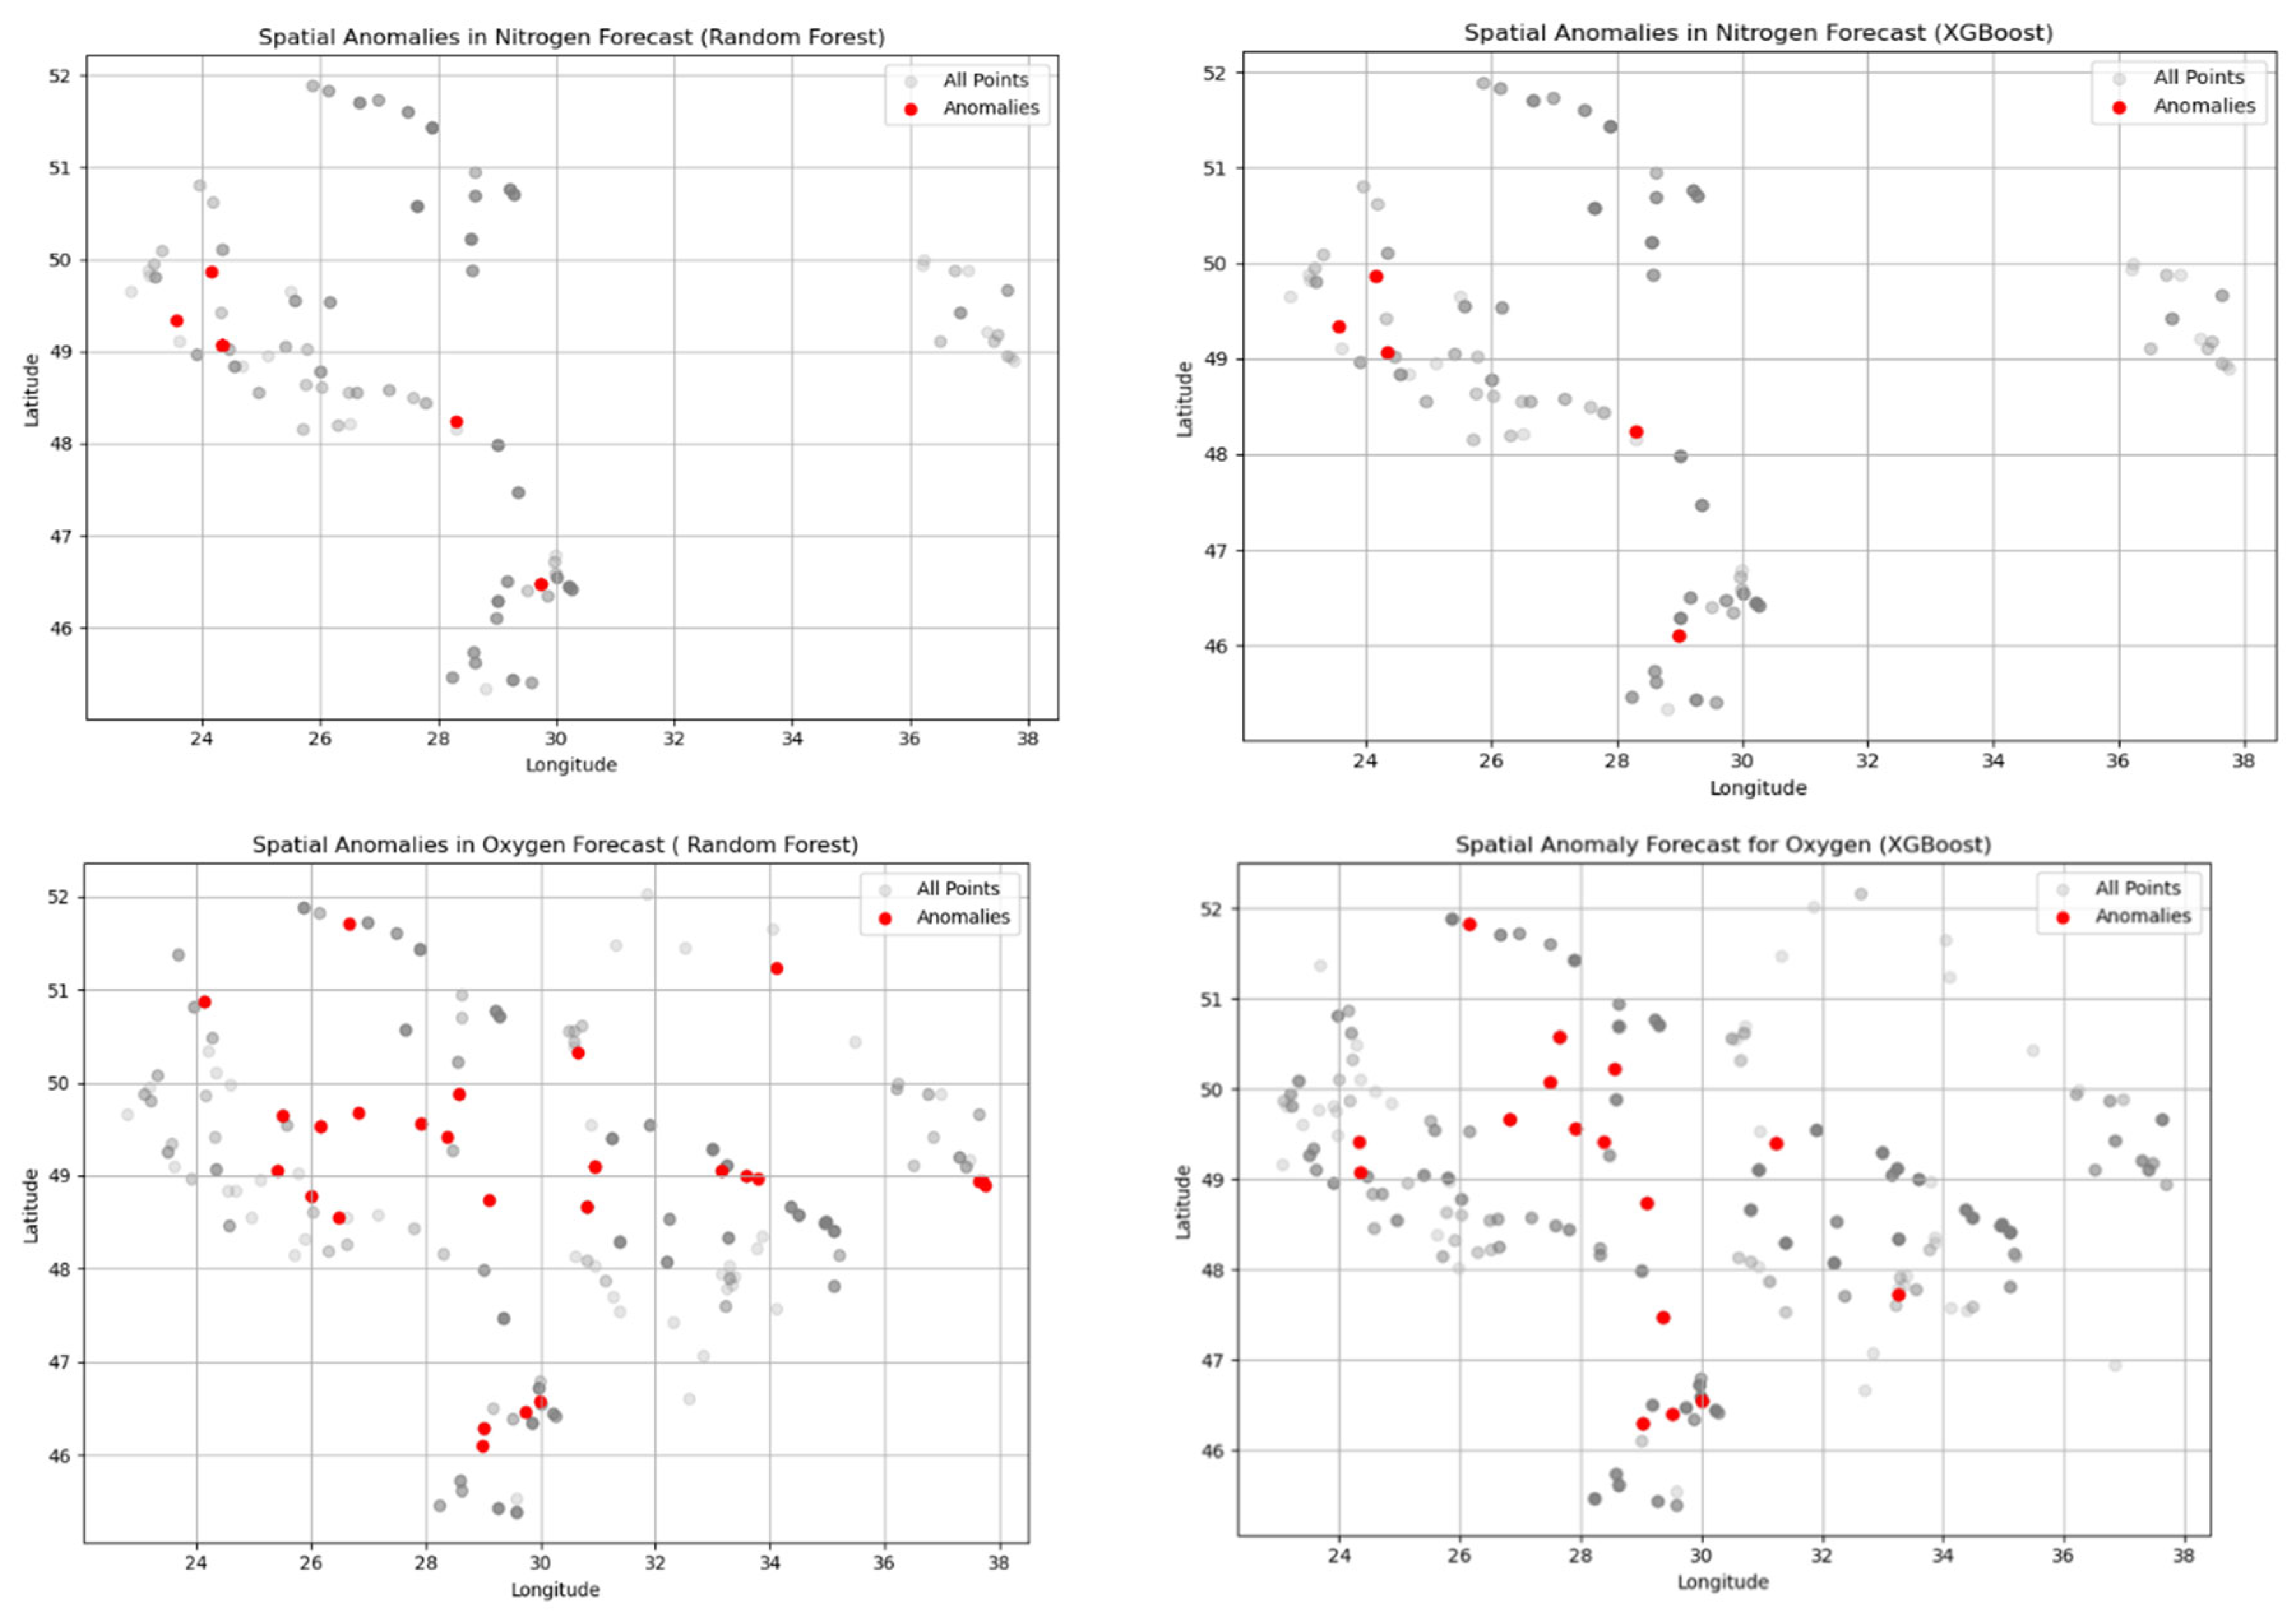

Table 1.
Comparative Analysis of Traditional Water Quality Monitoring Methods.
| Method | Advantages | Disadvantages |
| Laboratory analysis | High accuracy and reliability of results; wide range of detected pollutants | Duration of the process; high cost; necessity of transporting samples |
| Field tests | Speed of obtaining results; possibility of on-site analysis; low cost | Limited accuracy; limited range of parameters |
| Online monitoring systems | Continuous real-time monitoring; quick response; reduced manual data collection costs | High installation and maintenance cost; necessity of regular calibration |
Table 2.
Sensors for Water Quality Monitoring.
| Sensor Type | Measurement Parameters | Advantages | Disadvantages |
| Dissolved Oxygen (DO) sensors | Dissolved oxygen concentration | High accuracy, critical for ecosystems | Necessity of regular maintenance |
| pH sensors | Level of acidity/alkalinity | High accuracy, necessary for water treatment plants | Limited measurement range |
| Temperature sensors | Water temperature | Reliability, important for chemical reactions | Limited operating temperature range |
| TDS sensors | Concentration of dissolved substances | Ensure water quality for various applications | Low accuracy compared to laboratory methods |
| Oxidation-Reduction Potential (ORP) sensors | Oxidation-reduction potential | Critical for disinfection and chemical monitoring | Necessity of regular calibration |
| Turbidity sensors | Quantity of suspended particles | Important for assessing water transparency | Low accuracy in highly turbid waters |
| Conductivity sensors | Ability to conduct electric current | Indication of ion concentration in water | High cost |
Table 3.
Equipment for Water Quality Monitoring.
| Equipment Type | Purpose | Advantages | Disadvantages |
| Liquid chromatograph | Determination of chemical substances | High accuracy, wide spectrum of analysis | High cost, complexity of maintenance |
| Gas chromatograph | Determination of gaseous substances | High accuracy, analysis speed | High cost, need for specialized skills |
| Spectrophotometer | Measurement of substance concentration | High accuracy, analysis speed | High cost, need for regular calibration |
| Conductometer/pH meter | Measurement of electrical conductivity and pH | High accuracy, instruments important for various applications | Limited measurement range |
| Automatic nitrogen analyzer | Determination of total nitrogen | High accuracy, process automation | High cost, need for regular maintenance |
| Photometers | Measurement of turbidity | High accuracy, instruments important for assessing water transparency | Low accuracy in highly turbid waters |
Table 4.
Purpose and Characteristics of IoT Water Quality Sensors.
| System Name / Source | Sensor Types | Measured Parameters | Data Transmission Technologies | Features / Purpose |
| Libelium Smart Water Xtreme (Spain) | pH, ORP, dissolved oxygen, conductivity, temperature, turbidity | pH, ORP, DO, EC, temperature, turbidity | LoRaWAN, NB-IoT, 4G | Industrial grade, certified for scientific research, integration with cloud platforms. Monitoring of rivers, lakes, reservoirs, wastewater. |
| Environdata AquaLogger (UK) | pH, temperature, water level, turbidity | pH, temperature, water level, turbidity | GSM, GPRS, satellite communication | Autonomous operation up to 1 year, used in environmental studies. |
| YSI EXO2 Multiparameter Sonde (USA) | pH, DO, chlorophyll, blue-green phytoplankton, turbidity, conductivity, temperature | pH, DO, chlorophyll, blue-green phytoplankton, turbidity, conductivity, temperature | Bluetooth, USB, SDI-12, Modbus | High-precision scientific instrument, used by NOAA, EPA, universities. |
| Atlas Scientific IoT Water Quality Kit (USA) | pH, ORP, EC, DO, temperature | pH, ORP, EC, DO, temperature | Wi-Fi, MQTT, REST API | Modular system for laboratories, startups, universities. |
| HORIBA U-50 Series (Japan) | pH, DO, EC, turbidity, temperature, depth, ORP, salinity | pH, DO, EC, turbidity, temperature, depth, ORP, salinity | USB, SD-card, Bluetooth (optional) | Portable field instrument, used in research on marine and freshwater ecosystems. |
| Yokogawa FLXA402 (Japan) | pH/ORP, dissolved oxygen, chlorine, conductivity | pH/ORP, DO, chlorine, conductivity | HART, Modbus, Ethernet | Industrial IoT controller, integrates into SCADA systems, used in scientific and industrial research. |
| Intelligent Water Monitoring System (Lviv Polytechnic) | AS7265x, DFRobot Turbidity, DS18B20 | Spectral analysis (organic/inorganic), turbidity, temperature | Wi-Fi, SD-card | High-precision spectral analysis, environmental monitoring, detection of changes in water composition |
| IoT systems with cloud analytics | pH, DO (dissolved oxygen), EC (electrical conductivity), salinity, temperature | pH, DO, EC, salinity, temperature | Wi-Fi, LTE, cloud services | Continuous monitoring, anomaly detection, integration with AI |
| SmartWater (SalesBox) | Complex of wireless sensors | pH, temperature, DO, salinity, turbidity | IoT gateways, cloud, API | Automatic pollution detection, data visualization, warnings |
Table 5.
Comparison of AI Algorithms Used for Water Quality Data Analysis.
| Algorithm | Principle of Operation | Application |
| Linear Regression | Determining the dependence between variables | Prediction of pollutant concentration |
| Decision Trees | Tree structure for decision-making | Anomaly detection in data |
| Support Vector Machines | Data classification using a hyperplane | Classification of pollution types |
| Clustering (K-Means) | Grouping data into clusters | Detection of zones with high pollution concentration |
| Convolutional Neural Networks | Analysis of spatial data | Analysis of images of water objects |
| Long Short-Term Memory Networks | Processing sequential data | Prediction of changes in water quality |
| Transformer Networks | Analyzing long-term relationships in data | Detection of complex patterns |
| Autoencoders | Data dimensionality reduction | Anomaly detection in data |
Table 6.
Machine Learning Methods Used for River Pollution Detection.
| Method Name | Learning Type | Main Advantages | Main Limitations | Examples of Application |
| Supervised Learning | Supervised | High accuracy of classification and regression when labeled data is available. | Requires a large amount of labeled data. | Water quality classification, prediction of pollution levels. |
| Unsupervised Learning | Unsupervised | Detection of hidden patterns and anomalies without prior labeling. | Results can be difficult to interpret. | Detection of unusual changes in sensor data, clustering of river sections by pollution level. |
| Deep Learning | Supervised / Unsupervised | Effective analysis of complex data (images, time series). | Requires large volumes of data for training and significant computational resources. | Analysis of satellite images for pollution detection, processing of real-time sensor data. |
| RNN/LSTM | Supervised | Effective modeling of temporal dependencies in data. | Can be difficult in training and interpretation. | Prediction of pollution spread, analysis of time series data from sensors. |
| CNN | Supervised | High effectiveness in processing images and spatial data. | Requires large volumes of labeled images for training. | Pollution detection on satellite images, analysis of images from UAVs. |
| Anomaly Detection | Unsupervised / Supervised | Identification of unusual deviations from the norm, which may indicate discharges. | Effectiveness depends on the chosen method and data characteristics. | Detection of sudden changes in sensor readings, identification of atypical spectral signatures on satellite images. |
| NLP | Supervised / Unsupervised | Analysis of textual data to detect information about pollution. | Analysis quality depends on the quality and volume of textual data. | Extraction of information about discharges from environmental reports and news. |
| Random Forest | Supervised | High accuracy, resistance to overfitting, interpretability of feature importance | Slow operation on large datasets, less flexible to complex interdependencies | Prediction of nitrogen concentration in water |
| GMB (XGBoost) | Controlled | Support for missing values, high generalizability | Requires fine-tuning, less interpretable for non-specialists | Detection of seasonal anomalies, analysis of the impact of spatial features |
Table 7.
Comparison of ML and AI Methods for Anomaly Detection.
| Method | Principle of Operation | Advantages | Disadvantages | Application |
| Isolation Forest | Random trees for data partitioning | High effectiveness, does not require labeled data | Less effective with very complex data | "Smart Water" project |
| One-Class SVM | Hyperplane for separating normal data | High accuracy, suitable for non-linear data | High computational complexity | "AquaWatch" project |
| Local Outlier Factor | Data density estimation | Well-suited for data with uneven density | High computational complexity | "Clean Water Initiative" project |
| Autoencoders | Encoding and decoding of input data | High accuracy, possibility of detecting non-linear anomalies | Require a large amount of data for training | "EcoWater" project |
| Random Forest | Anomalies are detected through large residuals between the prediction and the actual value | High accuracy, resistance to overfitting, feature interpretability, works well with tabular data | Not specifically designed for anomalies, can miss complex atypical patterns, slow on large datasets | Residual analysis for detecting potential discharges |
| GMB (XGBoost) | Sequential training of trees, each correcting the errors of the previous ones. Anomalies are detected through residuals or classification of exceedances | High generalizability, support for missing values, flexibility in configuration | Complexity of interpretation, can be sensitive to noise | Detection of seasonal anomalies |
Table 8.
Anomaly Detection Method Selection.
| Method | Criterion: Data Type | Criterion: Data Size | Criterion: Computational Resources | Criterion: Nature of Anomalies |
| Isolation Forest | Structured | Large | Limited | Nonlinear |
| One-Class SVM | Structured | Small | Limited | Linear |
| Local Outlier Factor | Structured | Small | Limited | Nonlinear |
| Random Forest | Numerical, categorical (works well with heterogeneous data) | Large | High (parallel training) | Anomalies corresponding to complex feature interactions |
| XGBoost | Numerical, categorical (works well with heterogeneous data) | Large | High (sequential tree building) | Anomalies corresponding to complex feature interactions |
| Autoencoders | Unstructured | Large | Large | Nonlinear |
Table 9.
Pollutant Spread Modeling Methods.
| Method | Principle of Operation | Application |
| Gaussian models | Normal distribution | Predicting pollutant concentration |
| Turbulent diffusion models | Turbulent flows and diffusion | Predicting in complex hydrodynamic conditions |
| Models based on Navier–Stokes equations | Equations of fluid motion | Predicting in rivers and water bodies |
| Models based on transport equations | Convection and diffusion | Predicting pollutant concentration |
| Empirical models | Historical data | Predicting based on statistical patterns |
| Machine learning models | Machine learning algorithms | Predicting based on large volumes of data |
Table 10.
Verification of the Study.
| Stage | Status | Comment |
| Data merging and cleaning | Performed | Data from monthly files were merged, cleaned of missing values, converted to a numerical format |
| Feature selection (predictors and target variables) | Performed | Relevant chemical, spatial, and seasonal features were selected for nitrogen and oxygen |
| Machine learning model selection | Performed | Random Forest and XGBoost were applied for each indicator |
| Model quality assessment (R2, RMSE) | Performed | R2 and RMSE were calculated for each model, results documented |
| Cross-validation | Partial | Train/test split was used |
| Residual analysis and anomaly detection | Performed | Residuals were calculated, anomalies detected through the ±2σ threshold for each model |
| Model comparison and result generalization | Performed | Comparative tables were built, recurring points identified, conclusions formulated |
Table 11.
Results for Predicting Nitrogen and Oxygen Indicators Using RF and XGB Models.
| Indicator | Метoд | R2 | RMSE | Number of Anomalies | Threshold±2σ |
| Nitrogen | RF | 0.8743 | ±2.120 | 9 | ±5.768 |
| XGB | 0.8378 | 3.280 | 5 | ±6.552 | |
| Oxygen | RF | 0.7376 | 1.038 | 28 | ±2.076 |
| XGB | 0.7262 | 1.060 | 6 | ±2.120 |
Table 12.
Detection of recurring anomalies in different models.
| Monitoring site | RF- Nitrogen | XGBoost – Nitrogen | RF- Oxygen | XGBoost – Oxygen | Comment |
| River Poltva, 30 km, Kam'yanopil village, Pustomyty district | ++++ | + | The most stable nitrogen anomaly caused by municipal sewage from Lviv located upstream. | ||
| River Solonytsia, 0 km, Ranevychi village | + | + | Repeats in both models for nitrogen; likely a local source of pollution from the Drohobych industrial area. | ||
| River Kropyvnyk, 12 km, Mostyshche village | + | + | Stable technogenic anomaly caused by chemical and municipal discharges from Kalush. | ||
| River Dnister, 566.3 km | + | + | Repeats in both models for nitrogen; mid-course anomaly due to urban sewage and hydrological alterations (reservoirs). | ||
| River Khadzhyder, 68 km, Chystovidne village | ++ | + | Detected for both indicators; mixed source; eutrophication from intensive agriculture in southern Odesa region. | ||
| River Kyrhyz-Kytay, 49 km, Mykhailo-Yaroslavets village | + | + | Cross-anomaly between nitrogen and oxygen; typical case of systemic eutrophication and agricultural runoff. |
Disclaimer/Publisher’s Note: The statements, opinions and data contained in all publications are solely those of the individual author(s) and contributor(s) and not of MDPI and/or the editor(s). MDPI and/or the editor(s) disclaim responsibility for any injury to people or property resulting from any ideas, methods, instructions or products referred to in the content. |
© 2025 by the authors. Licensee MDPI, Basel, Switzerland. This article is an open access article distributed under the terms and conditions of the Creative Commons Attribution (CC BY) license (http://creativecommons.org/licenses/by/4.0/).
Copyright: This open access article is published under a Creative Commons CC BY 4.0 license, which permit the free download, distribution, and reuse, provided that the author and preprint are cited in any reuse.


