Submitted:
05 November 2025
Posted:
06 November 2025
You are already at the latest version
Abstract
Despite the global relevance of soybean production and Brazil’s leadership in this sector, most studies have focused on established producing regions such as south-central Brazil, while little attention has been given to new frontiers. In particular, the role of barter, costs, price volatility, and local socio-economic aspects remain underexplored. Therefore, this study analyses production costs, market volatility, barter ratio, and the socio-economic impacts of soybean cultivation in the Paragominas Pole in Pará, a Brazilian state, between the crop seasons 2018/2019 and 2024/2025. This research was founded on a descriptive/explanatory case study with quantitative analysis, using statistical data, market reports, and a survey with 36 farmers. We evaluate how barter arrangements are affected by internal and external factors that go beyond the reach of farmers due to their integration into global supply chains. Results highlight that international shocks such as the COVID-19 pandemic and the Russia–Ukraine war significantly increased input and output price volatility, with fertiliser costs being the main driver (hotspot). Notwithstanding, in 2021/2022 onwards, despite the soybean price increasing, a substantial increase in input prices and the barter ratio were also noted, with the highest peak observed in the 2022/2023 harvest (28.35 bags/ha, input costs = US$ 884.52/ha, and soy bag price = US$ 31.2). Soybean production directly employs one person for every 121.8 ha. Half of the area is land leased, and 53% of the surface is cultivated with some kind of off-season crop. We suggest that soybeans producers make their barter with some hedge against falling soybean prices by taking up a position in the Chicago Board of Trade (CBOT), seeking to protect against volatility and fluctuations in the market.
Keywords:
agricultural supply chains
; CBOT
; commodity cycles
; futures market
; grain origination
; hedging
; trade war
; tropical agriculture
1. Introduction
In recent decades, global consumption of soybean has increased considerably due to the growing use of its diverse by-products, such as feed (soybean meal), food (textured soy protein, tofu cheese, soymilk), soy lecithin, biofuels, bioplastics, as well as raw materials in the cosmetics industry, among other diverse uses [1,2,3,4]. Consequently, it can be highlighted that the global soybean cultivation area has expanded significantly, with the global soybean cultivation area in the 2023/2024 crop season estimated to be around 140.66 million hectares, generating a production of approximately 396.36 million tonnes [5].
Brazil, the USA and Argentina are responsible for approximately 80% of global soybean production [1,2,6]. It is important to note that Brazil is the leading player in the global soybean market, with a production of 154.50 million tonnes, from a cultivated area of 46.15 million hectares, followed by the USA, with a cultivated area of 33.29 million hectares and a production of 113.27 million tonnes [1,2,6]. Despite Brazil being the largest global exporter of soybeans (in nature), Argentina is the leading global exporter of soybean meal [6].
China is another prominent player in the global soybean chain. In the 2023/2024 crop season, its soybean imports totalled 112 million tonnes [5]. In recent years, China´s demand has triggered a significant land use change (LUC) in Brazil, contributing to the conversion of different areas (mainly degraded pasture) to soybean cultivation. Another contributing factor for this shift was the trade war between the USA and China, which began in 2018. Both factors have positioned Brazil as the primary source of this soft commodity, supplying China with around 73% of its total soybean imports [1,2,7].
Thus, Chinese imports of Brazilian soybean in 2023 generated a revenue of US$ 38.9 billion [7]. Due to an unusual situation resulting from the climate phenomenon known as “La Niña” (which causes the cooling of surface waters in the Pacific Ocean in South America, unleashing greater rainfall intensity near the Equator line and severe droughts in regions closer to the south pole), Argentina experienced a significant shortfall in soybean production. This scenario propelled Argentina to become the second-largest importer of Brazilian soybeans in 2023, with the aim of supplying its soybean crushing plants with raw material. This situation generated US$ 2 billion in revenue for the Brazilian trade balance [7].
Regarding Brazil’s new agricultural frontiers, the state of Pará has emerged as a key player, home to two important ports (Santarém and Barcarena) with the so-called Brazil´s “North Arch”. Their strategic location near major global consumer markets and close to the Equator line ensures reduced transit time during sea transportation [1]. In the 2023/2024 crop season, the state of Pará cultivated around 1.129 million hectares of soybeans, with an estimated production of 4.06 million tonnes of soybeans [8].
However, the outbreak of the COVID–19 pandemic caused disruptions in several global supply chains, leading to a sharp rise in global food prices. This disrupted scenario sparked attention and debate about how to secure consumer goods globally, including China’s food security [9]. Despite China being one of the world’s largest cereals producers, it would need to increase its current soybean planting area by 6.9 times to reduce its dependence on soybean imports [9]. However, such a move could lead to a drop in its cereal self-sufficiency rate, as each additional unit of soybean production would reduce cereal production by 3.9 units.
The war between Russia and Ukraine, which began in early 2022, was another significant event that contributed to rising prices of agricultural commodities and inputs used for their production, jeopardising food security in several countries [10,11]. The inflationary pressure effects caused by this event are evident worldwide, driven by factors such as the increased cost of energy (fuels) and fertilisers, among others [11].
In general terms, commodities are marketable, uniform products consumed on a large scale, with low level of manufacturing or processing, and serve as raw materials for industries, with reference prices established in commodity exchange markets [12]. Various agricultural commodities are traded (spot and futures/derivatives) on the main global stock exchange, the CBOT – Chicago Board of Trade. While CBOT is part of the CME Group, Inc., (Chicago Mercantile Exchange), it remains a self-regulatory organisation approved by the Commodity Futures Trading Commission (CFTC) to list soybean, corn, and wheat futures contracts for trading [13]. It is worth noting that the CME is the largest and most diverse derivatives exchange, where the world manages its risks.
All agricultural activities carry different risks: operational, financial, production, market, credit, and legal risks [14]. The derivatives market has tools to mitigate these risks, transferring them between various agents who interact with each other [15], and can be used both for leverage purposes (increasing risk) as for hedging purposes (reducing risk) [14].
Therefore, in the agricultural commodities stock exchange, there are hedgers (farmers or traders) who are generally linked to a physical product (asset) and seek to protect themselves (hedge) from market volatility. On the other side of the operation are speculators, who, as a rule, are not interested in the asset itself, but in the potential gains these assets can offer through price fluctuations. Depending on the intensity and size of the flow, speculators can bring liquidity or volatility to the market [14,16].
Given the magnitude of derivatives, we can describe some of the operations commonly used in agribusiness:
Foreign exchange swap: where exchange rate or interest rate variations can be negotiated between a buyer and a seller, in agreement with a predetermined fixed date, to neutralize a financial exposure in foreign currency or other interest indexes [17].
Futures contracts: these are standardised contracts with established details such as price, product quality standard, quantity negotiated per contract, site, delivery date, and contract settlement date. These aspects guarantee futures contracts greater liquidity [18].
Options contracts: these are financial derivatives that grant the holder the right, but not the obligation, to buy or sell an underlying asset at a specified price (strike price) within a defined period. There are two basic types of options:
Call option – gives the buyer the right to buy the underlying asset.
Put option – gives the buyer the right to sell the underlying asset.
To acquire these rights, the buyer pays a premium to the seller (writer) of the option. This premium represents the maximum loss (a floor) the buyer can incur, while the potential profit can be unlimited (especially in a call option during a market rally). Buying an option does not require posting margin or a performance bond, meaning there is no risk of margin calls or the need to deposit additional funds. The risk for the buyer is limited to the premium paid [19].
Among the types of credit operations, barter is one of the most commonly used in Brazilian agribusiness. Barter operations consist of payment for inputs (fertilisers, seeds, pesticides, among others) through grains in the post-harvest, without monetary intermediation. This harvest financing mechanism is conducted between commodity traders, such as ADM, Bunge, Cargill, or other local players, and farmers who deliver their output – physical commodities: (for example, grains) [20].
The main problem addressed in this study lies in the increasing exposure of soybean farmers to various endogenous and exogenous factors that bring considerable risks to their continued participation in agricultural activity, particularly in emerging agricultural frontiers such as the Paragominas Pole in Pará, Brazil. This study is also pioneering in outlining the socio-economic profile of soybean cultivation in the region, filling a complete gap in knowledge about this important supply chain in the state.
We believe this article can guide soybean farmers by promoting risk management as an essential survival strategy in agribusiness, as well as provide guidelines for stakeholders and policymakers that can help in the construction of socio-economic policies for the sector, the region, and the state.
Thus, our research aims to analyse the socio-economic impacts, price volatility, and cost of production of soybeans produced in the Paragominas Pole, state of Pará, Brazil, as well as to describe the respective barter relationship of farmers between the crop seasons 2018/2019 and 2024/2025. Moreover, during the studied historical series, an uncertain international scenario, marked by war and pandemic, has caused price volatility in both inputs and outputs. We highlight the importance of hedging for farmers, seeking to minimise the risks of market volatility and fluctuations, as well as their respective impact on the soybean supply chain.
2. Materials and Methods
2.1. Study Area and Crop
Despite the state of Pará having three production poles, Paragominas (northeast pole), Redenção (south pole), and Santarém (west pole), located in the Baixo Amazonas region, our study focused on the non-irrigated soybean (Glycine max (L.) Merrill) cultivation system (GMO) in the northeast pole (Paragominas and its neighbouring municipalities), which accounts for just over 50% of all soybeans produced in the state of Pará.
The northeast pole encompasses Paragominas and its neighbouring municipalities: Ipixuna do Pará, Nova Esperança do Piriá, Tomé-Açú, Tailândia, Goianésia do Pará, Ulianópolis, Dom Eliseu, Rondon do Pará, Abel Figueiredo, and Bom Jesus do Tocantins (Figure 1).
The average annual temperature and rainfall values for the region are 26.5 °C and 1700 mm per year, respectively [21].
2.2. Aim of the Study and Methodological Approach
The objective of this research is to clarify the socio-economic impacts, cost of production, soybean price volatility, commodity options, and barter ratio in soy bags per hectare (each soy bag = 60 kg) for farmers in the Paragominas Pole, state of Pará, Brazil, between the crop seasons 2018/2019 and 2024/2025. This study also proposes insights into the importance of hedging as a management tool to mitigate losses in the commodity market and provides a general socio-economic profile of soybean farmers in Brazil’s newest agriculture frontier, located in the Amazon biome.
This research is based on a descriptive/explanatory case study with quantitative analysis. Historical data series on soy bag prices and inputs costs (both in US$) were kindly provided by a local agricultural company that engages in barter with soybean farmers. The inputs considered included chemical fertilisers (MAP and KCl), foliar fertilisers, pesticides (herbicides, insecticides, and fungicides), adjuvants, inoculants (Bradyrhizobium japonicum) and soy seeds (IST - industrial seed treated).
The investment considered for this package of inputs was at a medium technological level for this barter. Therefore, the package included the following management practices:
Spraying: four fungicides, three herbicides (pre- and post-emergent), two insecticides and three foliar fertilisers.
Chemical fertiliser doses: 18 kg N ha-1, 100 kg of P2O5 ha-1, and 70 kg K2O ha-1.
Operating and limestone costs, along with other socio-economic data, were obtained through a survey (Appendix A.1) conducted both in person and online, involving the voluntary participation of 36 soybean farmers from the northeast pole between March and August 2025. The sample covered an area of 68,832 ha of soybean cultivation (representing 12% of the total soybean area in this pole). The smallest farmer in the sample cultivates 362 ha of soybean, while the largest cultivates 12,500 ha.
Except for questions related to operating and limestone costs, this questionnaire was based on the 2017 Brazilian agricultural census [22], and its structure was aligned with the objectives of our research, which is pioneering in this new agricultural frontier in northern Brazil. This gap in knowledge in the literature about this important sector for the state´s economy was identified as a key issue.
2.3. CBOT – Chicago Board of Trade, Soybean Pricing and Exchange Rate
As with all commodities, soybean futures quotes use a stock exchange as a trading parameter. In this context, the CBOT is the primary global reference where futures contracts are traded, reflecting market expectations. This is essential for soybean producers and traders to mitigate risks. Therefore, the soybeans traded on the CBOT and the prices set therein influence markets in other regions. The bushel is the unit of measurement used on the CBOT for prices quotes, which are expressed in cents US$/bushel, being one bushel of soybeans equalling 27.2155422 kg.
Another component of pricing is the basis (also quoted in cents US$/bushel), which may be either positive (+ premium) or negative (- discount) relative to the CBOT price. It represents the difference between the international market and the price at the port of origin, in this case, the port of Barcarena, Pará, Brazil. Thus, different external factors, such as trade policies, sea freight, country of destination, time of year, global supply and demand, and internal factors, such as exchange rate, climate, logistics, product quality, local supply and demand, price of soy by-products in the domestic market, and requirements for loading the ship, can directly impact the basis value.
In short, the price of soybeans for export is formed as follows:
Soy price = bushel value reference in CBOT (±) basis value – total value of costs
The total value of costs includes port logistics, terminal, export expenses, and road freight.
The soybean prices referred to in this study pertain to the delivery of the harvest to a warehouse in the northeast pole. Thus, transportation costs from the warehouse to the port of origin (for export) have already been accounted. Therefore, the soybean prices in this study reflect the contract settlement date at 30/06 of each crop year.
The exchange rate refers to the relationship between two different currencies. In this case, it is the amount of Brazilian Real (BRL) needed to buy one dollar (USD). We analysed and discussed the exchange rate due to its relative impact on commodity price and input costs.
3. Results
3.1. Farmer´s Socio-Economic Profile
Figure 2 depicts the socio-economic composition of the soybean supply chain in the region, based on the sample profile of the 36 survey respondents. Of these, 100% are male, with 15 individual farmers and 21 farmers conducting the activity with some type of business partner (e.g., spouse, son, friend, etc.). Only nine (or 25% of the sample) declared affiliation with a cooperative.
Regarding education level, eight farmers declared they did not complete their respective courses, while four partners reported not finishing their education.
Considering that soybean represents 68,832 ha as the primary crop, about 53% of the study area has been cropped with some interim cash crop. Of the total, six farmers reported not doing any second harvest, while ten farmers stated they conduct a second crop on 100% of their areas. Among the second crops grown, noteworthy examples include: sesame (16 farmers), sorghum (15 farmers), maize (13 farmers), millet and Brachiaria ruziziensis grass (seven farmers each).
All farmers reported receiving technical assistance, with a predominance of “owned or hired by the farmer” for 23 them, and “private financing company” for 15 farmers.
Regarding Figure 3, we reveal pertinent aspects of the local workforce profile employed in the activity. The associated data for the total number of employees (permanent and temporary), employees’ education level, and average wage for employees directly linked to the soybean supply chain are shown. Additionally, we highlight the number of farmers who have grain silos on their farms.
For reference, the minimum wage in September 2025 was R$ 1,508.00 (BRL – Brazilian Real). With a PTAX exchange rate of R$ 5.4275 on 8 September 2025, the gross minimum wage in Brazil was US$ 277.84.
3.2. Farm Machinery (Quantity per Farmer)
In Figure 4, we present the quantity of various farm machinery owned by the 36 farmers participating in the survey. For item (a), the statistical mode was two planter machines, reported by ten farmers. For item (b), ten farmers also reported not having any combine harvester.
Regarding items (c) and (d), such as the quantity of fertiliser/limestone spreaders and tractors (>100 hp), the observed mode was as follows: 23 farmers have just one machine for item (c) and seven farmers reported owning four machines for item (d).
Based on our sample, the average soybean cultivation area per farmer in this study is 1,912 ha. Therefore, the average quantity of farm machinery reported for each item is sufficient to maintain field operations.
3.3. Barter Ratio, Soy Bag Price, Cost of Inputs, Operating and Limestone Costs
Figure 5 presents the soy bag price (US$ per unit), the total cost of inputs (US$ per ha), and the soy barter ratio (i.e., the quantity of soy bags per ha required to purchase inputs through barter operations), based on the historical series between crop seasons 2018/2019 and 2024/2025.
As a rule, the barter operation between the parties (trading companies and farmers) is established with an agreement supported by a Rural Product Note (CPR), registered at a notary´s office, detailing the quantity and quality of the soybeans to be delivered, deadlines, and conditions. For all the crop seasons in this study, due to the time required for proper logistical arrangements and the organisation of barter process documentation, all operations were formalised until up to six months (deadline) before harvest.
It should be noted that [8] forecasts an average soybean yield in Pará state of approximately 3,598 kg ha-1 (or 59.97 soy bags/ha). Depending on the cultivars planted, the soybean crop cycle in the northeast pole may vary between 95–120-days.
Regarding operational and limestone costs, Figure 6 summarises the survey responses.
It is worth noting that ten farmers reported having no expenses with their own harvest, while nine farmers had no expenses for outsourcing harvest. However, 17 farmers used both harvesting options during the crop season. For these 17 farmers, we considered an average harvest cost of 2.54 soy bags per ha per year.
Regarding the average freight cost from harvest to warehouse, the observed range was between 0.1 to 5.0 soy bags per ha, with the lowest values reported by farmers who have silos on their own farms (short distances). Based on the data provided, the average total operating and limestone costs ranged between 14.11 and 14.89 soy bags per ha per year, with values reported between 5.69 and 25.5 soy bags per ha.
Regarding the sample collected, Figure 7 shows the average annual cost of one ha of land leased for soybean cultivation on the Paragominas pole.
Based on the sample, 50.4% of soybeans were cultivated on land leased. However, the payment ranged from 6 to 13 soy bags, with an average annual cost of 9.24 soy bags per ha per year. Of the 36 farmers sampled, ten farmers reported to cultivating 100% of their soybeans on their own farms, while 11 farmers planted 100% of their soybeans on leased land.
3.4. Commodity Options (Financial Derivatives) and Future Contracts
Given the threats and uncertainties affecting commodity supply chains, such as volatile soybean prices and input costs, hedging emerges as a safe strategy to protect the business. In the results previously presented, we used a simple soybean futures contract sale (flat price) as a hedge, commonly employed by farmers during the barter negotiation. However, we created a hypothetical scenario for two unhedged situations (or without soybean future sale via flat price) at the time of barter negotiations in different crop years. For example:
For the 2023/2024 crop season: If the farmer buys his inputs and only fixes the soybean price later in February 2024, at US$ 21.40 per bag, with the contract settlement date at 30 June 2024, the barter ratio would be 29.5 soy bags per ha, representing an increasing of 2.68 soy bags per ha.
For the 2021/2022 crop season: If the farmer purchased his inputs and fixed the soybean price in May 2022, with his costs in soy bags based on the contract settlement date at 30 June 2022, when the soy bag price was US$ 36.5, the barter ration would drop to 18.1 soy bags per ha, a decrease of 5.66 soy bags per ha.
Thus, observing the volatile behaviour of soybean prices in recent harvests, farmers who leaves soy costs open (soy price to be fixed later) take on unnecessary risk. Therefore, we suggest that farmers manage their input costs through barter when the barter ratio is favourable for their business. Calegari et al. [14] point out that hedging with derivative tools should not be used for speculation but rather to reduce business exposure to risk.
For options trading tools, we draw another hypothetical scenario for the 2023/2024 crop season. In early August 2023, if the farmer conducted his barter, establishing a minimum by purchasing put options (floor in CBOT), also known as “lock against falling prices,” with a strike price of US$ 13.36 per bushel (reference ZSN24) on CBOT and a floor for the soy bag price of US$ 24.58, the result would be determined at the tool´s expiration date (May 2024). However, exit is allowed at any time up to the expiration date, and the farmer may seek a SWAP (guaranteed price) higher than the pre-set price, increasing the disarming level during a potential rally in CBOT.
At the end of August 2023, observing a rally in the CBOT bushel, the farmer opted to exit the put options at US$ 13.89 per bushel, adjusting the soy bag price to US$ 25.75. Thus, considering the average input costs for the 2023/2024 crop season and the initial barter ratio with a floor price of 25.64 soy bags per ha, the new strike price in the put options allowed the farmer to improve the barter ratio to 24.48 soy bags per ha, reducing the barter by 1.16 soy bags per ha.
It should be noted that the premium paid for put options varies based on the duration of the tool and the minimum floor guarantee (strike price) at the time of operation. Generally, they cost a few cents US$/bushel [19].
The advantages of using options as a risk management tool include establishing and guaranteeing a minimum price, the possibility of selling at a higher price, knowing the cost of the option, and the maximum loss being limited to the option premium.
4. Discussion
Figure 8 shows the bushel listed on the CBOT over the last five years, from November 2019 to November 2024.
The bushel listed below is in a format called a continuous futures contract. This is an artificial financial instrument created by chaining numerous individual futures contracts with distinct expiration dates. This method generates a smoothed price series, which can help identify trends and patterns. Thus, there is no need to manually switch individual contracts for scenario analysis. In our example, we show a weekly continuous contract ZS1, which always represents the current month (or the closest due month).
Therefore, as it is a synthetic instrument involving artificial prices, continuous contracts may not accurately represent the real prices traded in individual futures contracts.
The deleterious effects of COVID-19 pandemic and the Russia–Ukraine war on global food security is evident. The highest peak observed for the soy bushel on the CBOT was during the 2021/2022 crop season, while the highest peak for input costs occurred during the 2022/2023 crop season. Considering that the COVID-19 pandemic began in March 2020 and the Russia–Ukraine war started in February 2022, the combination of these two events in a relatively short period has undoubtedly impacted the barter ratio in the 2021/2022 and 2022/2023 crop seasons.
Our results corroborate those described by Zhang et al. [23], who noted that the Russia–Ukraine war had a greater impact on increasing the volatility of soybean futures prices on stock exchanges. Notwithstanding, they made two important observations:–The USA agricultural market transmitted more volatility risk to Chinese markets than the reverse risk spillover.– The risk spillover enhancement effect of the Russia–Ukraine war was stronger than that of the COVID-19 pandemic, with a more pronounced impact on soybean and corn futures markets on the Chinese and USA exchanges, respectively.
Thus, among the inputs, fertilisers were the primary driver of the highest peak in costs. During the 2022/2023 crop season, fertiliser costs were approximately US$ 488.90 (55% of total input costs) or 15.67 soy bags per ha, while in the 2019/2020 crop season of 2019/20, fertilisers costs amounted to US$ 177.98 (39.6% of total input costs) or 10.17 soy bags per ha.
Moreover, Ilinova et al. [24] highlight important aspects of the impact of COVID-19 pandemic on the fertiliser supply chain. They authors noted the resilience of this chain in comparison to other supply chains. Traditionally, the fertiliser industry has been turbulent, so, fertiliser companies have some “immunity” to disturbances. As such, fertiliser companies are strong and mature, ensuring the delivery of supplies, even if this results in higher prices. The fertiliser industry plays a crucial role in food security, and fertiliser products are indispensable for people. The International Fertiliser Association [25] states that crop nutrition is key to achieving Sustainable Development Goals (SDGs) 2 (Zero Hunger) and 13 (Climate Action) of the United Nations Sustainable Development Agenda.
As stated above, the impact of the war may jeopardize the implementation of the SDGs, particularly SDG 1 (No Poverty), SDG 2 (Zero Hunger), and SDG 12 (Responsible Consumption and Production) [26].
Brazil is known to be among the largest consumers of fertilisers globally, behind only China, India, and the USA. In 2018, 77% of total NPK fertilisers consumed in Brazil were imported [27,28]. However, Farias et al. [28] warn that in a hypothetical scenario, if the Brazilian government fails to provide any stimulus to the country´s fertiliser industry, Brazil´s biofuel industry sector will be overexposed to price fluctuations and volatility in the global fertiliser market by 2035, which would negatively impact the soybean supply chain.
Figure 9 shows the evolution of the exchange rate, i.e., the value of the dollar against the Brazilian Real (USD vs. BRL) over the last five years, from November 2019 to November 2024. It is important to note that the Brazilian Real experienced severe devaluation following the outbreak of the COVID-19 pandemic.
When the exchange rate reaches peaks, farmers typically see an increase in the value of their output (grains) in local currency. This can make Brazilian soybeans more attractive and competitive in the international market, benefiting farmer selling.
As previously mentioned, a high exchange rate can exert bearish pressure on the soy basis. Another potential disadvantage is its impact on the increase in soybean production costs, as some raw materials used in the production of inputs, such as fertilisers and pesticides, are imported, making them directly susceptible to the effects of exchange rate fluctuations.
Bresser-Pereira and Marconi [29] define the theory of “Dutch disease” as a market failure affecting developing countries that possess abundant and cheap natural resources or commodities. If these countries focus solely on exporting raw materials and there is a commodities boom, the resulting exchange rate that balances the current account becomes stronger than the one that makes the production of tradable goods viable. In this way, depending on the severity of the Dutch disease, it can cripple a country’s industry, increasing dependence on imports of high-value manufactured goods. Brazil has suffered from this issue in recent decades but currently does not suffer from Dutch disease.
Currently, the state of Pará does not have a large-scale agro-industrial soybean processing plant in operation. However, the installation of a soy crushing facility to verticalise the soybean supply chain locally would allow the sale of value-added by-products, such as soybean meal for feed, soy hull pellets, glycerine, and vegetable oil (biodiesel and edible oils), as well as the creation of direct and indirect jobs across the chain. The benefits of verticalising the soybean chain corroborate findings by Montoya et al. [30], which attest to the importance of adding value through industrial activity. This structure would ensure that farmers can sell their physical production year-round, unlike the current soybean export window, which only allows from January to mid-August.
The overwhelming majority of soybeans produced in nature in the northeast pole are exported via the port of Barcarena [1]. Despite the pole being located in the Amazon basin and part of the North Arch, Lopes [31] points out that agribusiness’s contribution to the economy could have been more effective in the context of trade surpluses or bumper harvests were it not for the excessive costs and waste generated by inadequate infrastructure, expressed in the deficient road network and insignificant transport by rail and waterways.
Nevertheless, EMBRAPA [32] describes the incredible evolution of soybean exports in the state of Pará over the past 20 years. In 2023, approximately 90% (or 3.672 million tonnes) of all soybeans produced in Pará were exported, generating substantial revenue of US$ 1.912 billion for the state´s trade balance. Examining soybean exports from three microregions near the study area (Paragominas, Tomé-Açu, and Belém), it was found that they exported to 24 countries, and accounted for about 43% (or 1.591 million tonnes) of all soy exported from Pará, generating US$ 812 million in revenue, with the main destinations being China, Spain, and the Netherlands, as shown in Figure 10 (data extracted and adapted from EMBRAPA [32]).
As mentioned previously, China leads as the main destination for Brazilian soybeans. Nevertheless, as the new trade war (version 2.0) intensifies between China and the USA, if a new trade agreement is not reached soon, China will likely increase its soybean purchases from South America, primarily from Brazil and Argentina. Table 1 below shows the average export sales query system for the USA soybeans to China over the last five years.
It is worth noting that, as of 18 September 2025, at the beginning of the US harvest for the 2025/2026 crop year, China has not yet purchased US soybeans. This marks a change compared to previous harvests when China had already purchased significant volumes of US soybeans this time.
Considering an average of operating and limestone costs of 14.89 soy bags per ha and a barter ration of 27.02 soy bags per ha in the 2024/2025 crop season, we calculated an average cost of production of 41.91 soy bags per ha for farmers cultivating on their own land. However, if we include the average cost paid by farmers cultivating on leased land, this value increases to 51.15 soy bags per ha. Generally, farmers who do not have silos on their farms pay a 3% reception fee to deliver their production to a third-party silo. In these cases, the total average cost can reach 52.95 soy bags per ha. This total aligns with findings by the Associação dos Produtores de Soja do Mato Grosso do Sul [34] for the reality in Mato Grosso do Sul (another Brazilian state), where a total cost of 51.27 soy bags per ha was reported, but without including the value of land leasing.
It is well known that, in recent years, while Brazilian grain production has grown exponentially, farm storage capacity has not kept pace with this growth [35]. In this sense, Péra [36] confirms that less than 20% of Brazil’s static storage capacity is located within the farm gate, while in our study, 27.78% of farmers reported having their own on-farm warehouses. Additionally, the total static storage capacity of Pará is 2.657 million tonnes [35]. This storage deficit results in greater strain on warehouses, higher logistical costs, and, consequently, greater vulnerability to the deterioration of grain quality during the post-harvest period (shelf life).
The fact that all farmers surveyed reported receiving technical assistance contrasts with the findings in the last Brazilian agricultural census of 2017 [22], which indicated that only 20% of Brazilian rural producers received some form of technical assistance. This is an important indicator that technical assistance and rural extension have broad coverage within the soybean chain in the region, regardless of the origin of the assistance.
The education level of Paragominas pole’s soybean farmers also differs from the general profile of most Brazilian producers. The 2017 census [22] reports that 73% of Brazilian rural producers have at most primary education. In interviews with soybean farmers in the state of Mato Grosso (another Brazilian state), Silva et al. [37] found that all of them recognised the high value of education and training, emphasising that completing at least higher education is an important strategy to keep up with changes in the business and avoid potential pitfalls. Silva et al. [37] also highlight that the soybean/maize business now requires management strategies and a deep understanding of agricultural technology to enable reliable decision-making.
In terms of age, the soybean farmers of this study are notably younger than the general average observed among Brazilian rural producers. The 2017 census shows the following ethnic distribution among Brazilian rural producers: 45% white, 8% black, 1% of Asian descendant, 44% mixed race (Pardo), and 1% indigenous. Additionally, around 81% of Brazilian producers are male, and 14% of all Brazilian rural establishments own a tractor.
The strength of the soybean production chain is evident, driving the national economy. Millions of direct and indirect jobs are generated along this value chain. Between 2000 and 2014, there was a significant increase in the total number of jobs within the Brazilian soybean chain [30], which spans various sectors, including products, trade, services, inputs, agro-industry, logistics, and other related sub-sectors.
Other authors have made important contributions regarding these socio-economic aspects. Andrade Neto and Raiher [38], in a study of Brazilian soybean AMC´s (Minimum Comparable Areas), observed positive effects of soybean production on the economic dynamism of new agricultural frontiers, leading to an increase in GDP per capita. Over time, this initial dynamism can result in the diversification of the local economy. Richards et al. [39] investigated the impact of a decade of agricultural change on urban and economic growth in Mato Grosso, Brazil and showed that economic growth in the non-agricultural sector was closely tied to the expansion of soybean agricultural systems. This expansion has contributed to reduced poverty and improved school facilities. Therefore, Richards et al. [39] also attests that each square kilometre of soybean production supports 2.5 formal sector jobs outside agriculture and approximately US$ 150,000 in annual non-agricultural GDP.
Assuming that 49.2% of soybean farm employees have only primary education, this information aligns with the findings of Toloi et al. [40], who describe how people working in the country´s agribusiness sector often has low levels of formal education and are usually unqualified.
Carneiro et al. [41] pointed out that new agricultural frontiers tend to have higher labour costs and a notable lack of a qualified labour force. For example, Silva et al. [37], conducting interviews with producers in the Araguaia valley region, specifically in Canarana, state of Mato Grosso, stated that it is extremely difficult to find qualified workers to operate a grain silo. According to them, this shortage of qualified labour means that the few qualified workers are always hired by trading companies.
Despite high level of precipitation in the northeast pole region, rain is concentrated in just six months of the year, making it highly difficult and risky to conduct an interim harvest. However, Brito et al. [1] highlights the efforts by farmers to promote the adoption of no-tillage systems, cultivating cover crops such as Brachiaria ruziziensis, millet, and other grain crops like sesame, as well as crops with dual purposes, such as maize and sorghum after the soybean harvest, as shown in Figure 11 bellow.
The implementation of these alternative crops promotes numerous benefits for sustainability, as they serve as interim cash crops, increasing biodiversity in the agroecosystem, and contribute to the so-called low-carbon agriculture (ABC, an acronym in Portuguese) [1].
Viana et al. [42] highlighted the benefits of soybean-livestock integration (ILP, an acronym in Portuguese). This synergy, especially within a no-tillage system, ensures greater efficiency, balance, and soil health, minimising the effects of seasonality, optimising land and input use, favouring nutrient recycling, increasing soil carbon stocks, maintaining natural predators, and breaking the cycles of pests and diseases, among other benefits, particularly in tropical conditions [43].
An important example of how crop rotation can reduce the incidence of pests and diseases is shown in Figure 12, which depicts a soybean plant affected by a syndrome popularly known as “Soja Louca II” (Green Stem and Foliar Retention, GSFR). This disorder has been observed in warm and rainy states such as Maranhão, Tocantins, Pará, and the northern region of Mato Grosso, with its causal agent being the nematode Aphelenchoides besseyi, which typically attacks the aerial parts of plants. An infected plant manifests the following symptoms from flowering to harvest: the plant remains green (stems, petioles, leaves, and pods) without completing its phenological cycle, with enlarged nodes, strapping, vein thickening, distorted pods, high levels of flower abortion, and bud proliferation [44].
In farms on the Paragominas pole where the conventional tillage system is used, and where fallow areas after the soybean harvest encourage the growth of spontaneous weeds, the incidence of “Soja Louca II” is higher. In contrast, farmers who cultivate their fields during the second crop season reported a lower incidence of disease.
5. Conclusions
In this study, we gained insights into the socio-economic profile of most soybean farmers in the Paragominas pole: they are predominantly male, young, with higher education, white, and conduct their activities with some type of business partner. All of them receive technical assistance. The general profile of employees indicates that most have a low level of education, with 95.4% earning a salary between >one and <six minimum wages. Furthermore, the soybean production chain in the region employs one person for every 121.8 ha (within the farm gate), including both permanent and temporary workers. Regarding the sample area, the average size of the soybean cultivation area is 1,912 ha per farmer. Half of the area is land leased, 53% is cultivated with off-season crops, and only one quarter of the farmers have their own silo to standardise and storage their grains.
Considering that the COVID-19 pandemic and the Russia–Ukraine war have disrupted numerous global supply chains, including soft commodities, the inflationary effects are evident within the soybean supply chain, with the highest peaks observed in the 2022/2023 crop season for soy bag prices, barter ratio, and input costs. Among the inputs, fertilisers contributed most significantly to the high input costs.
Therefore, we suggest that farmers manage risk through hedging with derivatives, whether using futures contracts (flat price) or contract options on the stock exchange. These tools can guarantee a minimum price or allow farmers to benefit from a possible bushel rally on the CBOT.
Farmers adopting a risk management strategy will protect their businesses against potential uncertainties and volatilities that might affect logistics, commodity markets, and input costs, especially during trade wars. We also caution that if farmers act as speculators and speculate on their costs, they may be engaging in a high-risk strategy, akin “Russian roulette”, jeopardising their business. In a downward scenario for commodity prices, not hedging input costs could lead farmers to abandon the activity, as margins in the soybean agribusiness are increasingly squeezed and input costs remain high.
Theoretically, the findings contribute to the literature on agricultural economics and rural development in the context of new agricultural frontiers. Practically, the results offer valuable insights for policymakers and agribusiness stakeholders, promoting knowledge of risk management and enhancing sustainability within the soybean production chain by stabilising incomes and ensuring the long-term viability of agricultural activity in the face of external shocks such as pandemics and geopolitical conflicts.
As limitations, we highlight that the analysis was geographically restricted to the Paragominas pole, which may limit the generalisability of the results to other producing regions in Brazil with distinct socio-economic or institutional contexts. Additionally, the data reflect a specific period impacted by two exceptional factors (COVID-19 pandemic and the Russia–Ukraine war), which may not capture long-term behavioural patterns under more stable market conditions. Finally, we suggest that future studies could expand the scope of analysis, including comparative assessments across regions and crops, and investigate how farmers’ risk management practices evolve over time. Such research would strengthen the theoretical framework on agricultural risk behaviour and inform more effective and adaptive policy interventions in the context of Brazil’s expanding agricultural frontiers.
Author Contributions
Conceptualisation, methodology, investigation, and writing—original draft preparation, T.B.: review and editing, R.F., L.S, A.A.F.S., G.J., J.R.S.L., and J.A. All authors have read and agreed to the published version of the manuscript.
Funding
This work was supported by National Funds by FCT – Portuguese Foundation for Science and Technology, under the project UIDB/04007/2020 and projects UID/04033/2025: Centre for the Research and Technology of Agro-Environmental and Biological Sciences and LA/P/0126/2020 (https://doi.org/10.54499/LA/P/0126/2020).
Institutional Review Board Statement
Not applicable.
Data Availability Statement
Not applicable.
Acknowledgments
The authors would like to thank Mr. Carlos Eduardo Correa and Mr. Aderbal Machado for clarify some doubts about the commodities market, Prof. Dr. Cristina Marreiros for providing insights into the construction of the questionnaire, the local company that provided barter data, as well as the Association of Soybean Producers of the state of Pará (APROSOJA – PA) and all local farmers who kindly provided valuable information that help us build this paper.
Conflicts of Interest
The authors declare no conflicts of interest.
Appendix A
Appendix A.1
Study/project title: Sustainable Planning of the Soybean Supply Chain in the state of Pará, Brazil
SOCIO-ECONOMIC QUESTIONNAIRE TO BE APPLIED TO SOYBEAN FARMERS IN THE STATE OF PARÁ.
1) Personal data
- Gender
( ) Male ( ) Female
2) Legal status of the farmer
( ) Individual producer
( ) Couple (when both are responsible for management), union of people, condominium or consortium – Partnership/Family unit (e.g., couple, parents and children, friends, condominium or consortium
3) Age
( ) Under 25 years; ( ) 25 to 35 years; ( ) 35 to 45 years; ( ) 45 to 55 years ( ) 55 to 65 years; ( ) 65 years or older.
4) Age (Partner – if applicable)
( ) Under 25 years old; ( ) 25 to 35 years; ( ) 35 to 45 years; ( ) 45 to 55 years ( ) 55 to 65 years; ( ) 65 years or older.
5) Education level
( ) Illiterate ( ) Primary education ( ) Secondary education ( ) Technical or Vocational education ( ) Higher education
- Have you completed the course?
( ) Yes ( ) No
6) Education level (Partner – if applicable)
( ) Illiterate ( ) Primary school ( ) High school ( ) Technical or vocational education ( ) Higher education
- Have you completed the course?
( ) Yes ( ) No
7) Farmer´s ethnic background
( ) White ( ) Black ( ) Asian descent ( ) Mixed race (Pardo)
8) Partner´s ethnic (if applicable)
( ) White ( ) Black ( ) Asian descent ( ) Mixed race (Pardo)
9) Production data
- Location (municipality): __________________________)
- Cultivation area (ha of soybeans and ha of corn):
( ) and ( )
- ( )% of owned land
- ( )% of leased land
- ( )% of off-season area (crops grown): ______________________________)
10) Do you have a grain silo?
( ) Yes ( ) no.
11) Machinery (number of units):
( ) Planter ( ) Combine harvester ( ) Fertiliser and lime spreader ( ) Tractor (≥100 hp).
12) Are you a member of a cooperative?
( ) Yes ( ) No
13) Do you receive technical assistance?
( ) Yes ( ) No
14) Source of technical assistance
( ) Public ( ) Own or hired by the farmer ( ) Cooperative ( ) Private financing company.
15) Operating costs (in bags of soybeans per hectare)
( ) Spraying costs (fungicides, insecticides, herbicides, foliar fertilisers, biostimulants)
( ) Cost of limestone (on-farm)
( ) Soil mechanisation costs (ploughing, harrowing, lime application, seeding)
( ) Own harvest costs
( ) Outsourced harvesting costs
( ) Freight during harvest.
16) Annual lease cost (in bags of soybeans per hectare):__________;
Note: If you plant 100% on your own land, this does not apply.
17) Socio-economic data;
- Number of registered employees:
( ) Permanent workers
( ) Temporary workers
18) Education level of employees (number of workers);
( ) Illiterate
( ) Primary education
( ) Secondary education
( ) Incomplete higher education
( ) Completed higher education
19) Average wage of employees
( ) One minimum wage
( ) > 1 to 3 minimum wages
( ) > 3 to 6 minimum wages
( ) > 6 to 10 minimum wages
( ) > 10 minimum wages
References
- Brito, T.; Fragoso, R.; Santos, L.; Martins, J.A.; Fernandes Silva, A.A.; Aranha, J. Life Cycle Assessment for Soybean Supply Chain: A Case Study of State of Pará, Brazil. Agronomy 2023, 13, 1648. [Google Scholar] [CrossRef]
- Brito, T.R.C.; Aranha, J.T.M.; Fernandes Silva, A.A.; Santos, L.A.C.; Fragoso, R.M.S. A Review and Analysis of Life Cycle Assessment Tendencies in the Brazilian Soybean Supply Chain. Biol. Environ. Proc. R. Ir. Acad. 2022, 122, 53–65. [Google Scholar] [CrossRef]
- Colletti, A.; Attrovio, A.; Boffa, L.; Mantegna, S.; Cravotto, G. Valorisation of By-Products from Soybean (Glycine max (L.) Merr.) Processing. Molecules 2020, 25, 2129. [Google Scholar] [CrossRef] [PubMed]
- Rahman, Md. M.; Dey, A.; Yodo, N.; Chiwon, W. L.; Grewell, D. Soybean By-Products (Polylactic Acid)-Based Plant Containers: Sustainable Development and Performance Study. Sustainability 2023, 15, 5373. [Google Scholar] [CrossRef]
- USDA—United States Department of Agriculture; Foreign Agricultural Service. Word Agricultural Production, Circular Series, WAP 09-25. 2025. Available online: http://apps.fas.usda.gov/psdonline/circulars/production.pdf (accessed on 22 September 2025).
- USDA—United States Department of Agriculture; World Agricultural Supply and Demand Estimates, WASDE 655. 2024. Available online: http://www.usda.gov/oce/commodity/wasde/wasde1224v2.pdf (accessed on 25 December 2024).
- Trademap—Trade Statistics for International Business Development. Imports and Exports. 2024. Available online: https://www.trademap.org/Index.aspx (accessed on 08 July 2024).
- CONAB—Companhia Nacional de Abastecimento. Séries Históricas das Safra—Soja. Available online: https://www.conab.gov.br/infoagro/safras/serie-historica-das-safras/itemlist/category/911-soja (accessed on 21 July 2024).
- Yao, H.; Zuo, X.; Zuo, D.; Lin, H.; Huang, X.; Zang, C. Study on soybean potential productivity and food security in China under the influence of COVID-19 outbreak. Geography and Sustainability 2020, 1, 163–171. [Google Scholar] [CrossRef]
- Ahn, S.; Kim, D.; Steinbach, S. The impact of the Russian invasion of Ukraine on grain and oilseed trade. Agribusiness 2023, 39, 291–299. [Google Scholar] [CrossRef]
- Urak, F.; Bilgic, A.; Wojciech, J. F.; Bozma, G. Confluence of COVID-19 and the Russia-Ukraine conflict: Effects on agricultural commodity prices and food security. Borsa Istanbul Review 2024, 24, 506–519. [Google Scholar] [CrossRef]
- Veríssimo, M.P. and Xavier, C.L. 2014 Tipos de com modities, taxa de câmbio e crescimento econômico: Evidências da maldição dos recursos naturais para o Brasil. Revista de Economia Contemporânea 2014, 18, 267–95. [Google Scholar] [CrossRef]
- Irwin, S. H.; Garcia, P.; Darrel, L. G. and Kuanda, E. L. Spreads and Non-Convergence in Chicago Board of Trade Corn, Soybean, and Wheat Futures: Are Index Funds to Blame? Applied Economic Perspectives and Policy 2011, 33, 1, 116–142. [Google Scholar] [CrossRef]
- Calegari, I.P.; Baigorri, M.C. and Freire, F.S. Os derivativos agrícolas como uma ferramenta de gestão do risco do preço. Custos e @agronegócio online 2012, 8, 2–21. [Google Scholar]
- Mendonça, A. A.; A decisão de realizar ou não hedge no ambiente corporativo. Resenha BM&F, v. 162, p. 26-33, São Paulo, 2005.
- Hull, J.C. Fundamentos dos Mercados Futuros e de Opções, 4rd ed.; BM&F - Bolsa de Mercadorias e Futuros; São Paulo, Brasil, 2005, pp 1-597.
- Negrisolo, D.H.; Amorim, D.I.M. Derivatives as Hedging tools for Agribusiness – FX. Research, Society and Development 2022, 11, 12, 1–18. [Google Scholar] [CrossRef]
- Santos, V.P. Impacto de Hedge e Especulação Sobre a Volatilidade dos Mercados de Commodities Agrícolas: Um Estudo Empírico para os EUA e Brasil. Master´s Dissertation, State University of Campinas, Institute of Economics, São Paulo, 02 February 201.
- CME Group. Produtos de commodities: Guia auto-didático para Hedge com Futuros e Opções de grãos e sementes oleaginosas. São Paulo: Available online: AC-216.1_GrainsHedgingGuide_port_SR.pdf (cmegroup.com) (accessed on 20 September 2024).
- Skrastins, J. Barter Credit: Warehouses as a Contracting Technology. The Journal of Finance 2023, 78, 4, 2009–2047. [Google Scholar] [CrossRef]
- INMET Instituto Nacional de Meteorologia. Meteorological Database of INMET. Available online: https://bdmep.inmet.gov.br/ (accessed on 24 September 2024).
- Instituto Brasileiro de Geografia e Estatística (IBGE). Censo Agropecuário. 2017. Available online: www.fao.org/fileadmin/templates/ess/ess_test_folder/World_Census_Agriculture/WCA_2020/WCA_2020_new_doc/BRA_REP1_POR_2017.pdf (accessed on 18 August 2025).
- Zhang, Y.; Sun, Y.; Shi, H.; Ding, S.; Zhao, Y. COVID-19, the Russia-Ukraine war and the connectedness between the U.S. and Chinese agricultural futures markets. Humanities & Social Sciences Communications 2024, 11, 477. [Google Scholar] [CrossRef]
- Ilinova, A.; Dmitrieva, D.; Kraslawski, A. Influence of COVID-19 pandemic on fertilizer companies: The role of competitive advantages. Resour. Policy 2021, 71, 102019. [Google Scholar] [CrossRef]
- IFA — International Fertilizer Association. Agenda 2030, Helping to Transform our World — Plant Nutrients and Climate Action. Available online: https://www.fertilizer.org/wp-content/uploads/2023/01/2019_IFA_Plant_Nutrients_Climate_Action.pdf (accessed on 20 October 2024).
- Ben Hassen, T.; El Bilali, H. Impacts of the Russia-Ukraine War on Global Food Security: Towards More Sustainable and Resilient Food Systems? Foods 2022, 11, 2301. [Google Scholar] [CrossRef]
- ANDA. Setor de Fertilizantes—Anuário Estatístico de 2018, 1st ed.; Associação Nacional para Difusão de Adubos (ANDA): São Paulo, Brazil, 2019. [Google Scholar]
- Farias, P.I.V.; Freire, E.; Cunha, A.L.C.d.; Grumbach, R.J.d.S.; Antunes, A.M.d.S. The Fertilizer Industry in Brazil and the Assurance of Inputs for Biofuels Production: Prospective Scenarios after COVID-19. Sustainability 2020, 12, 8889. [Google Scholar] [CrossRef]
- Bresser-Pereira, L.C.; Marconi, N. Existe doença holandesa no Brasil? In: Luiz Carlos Bresser Pereira. (Org.). Doença holandesa e indústria. Rio de Janeiro: Editora FGV, 2010, p. 207-230.
- Montoya, M.A.; Bertussi, L.A.; Lopes, R.L.; Finamore, E.B. Uma Nota Sobre Consumo Energético, Emissões, Renda e Emprego na Cadeia de Soja no Brasil. Rev. Brasile. de Econ. 2019, 73, 3–345. [Google Scholar] [CrossRef]
- Lopes, E.P. Logística de escoamento dos produtos agropecuários no Brasil: estrangulamentos dos fluxos de exportação. In: Paulo Claudio Machado Júnior; Stelito Assis dos Reis Neto. (Org.). Perdas em Transportes e Armazenagem de Grãos. 1ed. Brasília - DF: CONAB, 2021, v. 1, p. 15-197.
- EMBRAPA—Sistema de Inteligência Territorial Estratégica. Macrologística Agropecuária. Exportação Agropecuária. Available online: https://www.embrapa.br/macrologistica/sistema/exportacao-agropecuaria (accessed on 08 July 2025).
- USDA—United States Department of Agriculture; Foreign Agricultural Service. Export Sales Query System, Outstanding Sales – Current Marketing Year – 5 Years by Commodity/Date. 2025. Available online: http://apps.fas.usda.gov/esrquery/esrq.aspx (accessed on 25 September 2025).
- APROSOJA/MS—Associação dos Produtores de Soja do Mato Grosso do Sul. Safra de soja 2024/2025: plantar um hectare custa R$ 5,9 mil em Mato Grosso do Sul. Available online: https://aprosojams.org.br/blog/safra-de-soja-20242025-plantar-um-hectare-custa-r-59-mil-em-mato-grosso-do-sul#:~text=De%20acordo%20com%o%estudo,entre%20as%20safras%2C%20clique%20aqui (accessed on 08 September 2025).
- CONAB—Companhia Nacional de Abastecimento. Anuário Agrologístico—Volume 2. Available online: https://www.gov.br/conab/pt-br/acesso-a-informacao/institucional/publicacoes/outras-publicacoes/anuario-agrologistico-2025/view (accessed on 08 September 2025).
- Péra, T.G. Logística e infraestrutura do agronegócio brasileiro: lições aprendidas e oportunidades para enfrentar o desafio do escoamento. Série Logística do Agronegócio – Oportunidades e Desafios. Grupo ESALQ-LOG/USP, Piracicaba, Brasil, 2025, v.8, p. 01-13.
- Silva, R.F.B.; Batistella, M.; Moran, E.; Celidonio, O.L.M.; Millington, J.D.A. The soybean trap: Challenges and risks for brazilian producers. Front. Sustain. Food. Syst. 2020, 4, 12. [Google Scholar] [CrossRef]
- Andrade Neto, A.O., & Raiher, A.P. Impacto socioeconômico da cultura da soja nas áreas mínimas comparáveis do Brasil. Rev. de Econ. e Soc. Rur. 2675. [CrossRef]
- Richards, P.; Pellegrina, H.; VanWey, L.; Spera, S. Soybean development: The impact of a decade of agricultural change on urban and economic growth in Mato Grosso, Brazil. PLoS ONE 2015, 10, e0122510. [Google Scholar] [CrossRef]
- Toloi, M.N.V.; Bonilla, S.H.; Toloi, R.C.; Silva, H.R.O.; Nääs, I.d.A. Development Indicators and Soybean Production in Brazil. Agriculture 2021, 11, 1164. [Google Scholar] [CrossRef]
- Carneiro, D.M.; Duarte, S.L. and Costa, S.A. Cost drivers of Brazilian soybean production. Custos e @agronegócio online 2019, 15, 1, 43–66. [Google Scholar]
- Viana, J.S., Barbosa, J.G., Silva, J.A., Brito, T.R.C., & Badji, C.A. Integração soja e pastagem: Uma revisão de literatura. Rev. Verde de Agroec. e Des. Sust. 2015, 10(5). [CrossRef]
- Sentelhas, P.C.; Battisti, R.; Câmara, G.M.S.; Farias, J.R.B.; Hampf, A.; Nendel, C. The soybean yield gap in Brazil—Magnitude, causes and possible solutions for a sustainable production. J. Agric. Sci. 2015, 153, 1394–1411. [Google Scholar] [CrossRef]
- Meyer, M.C.; Favoreto, L.; Klepker, D.; Marcelino-Guimarães, F.C. Soybean green stem and foliar retention syndrome caused by Aphelenchoides besseyi. Trop. Plant Pathol. 2017, 42, 403–409. [Google Scholar] [CrossRef]
Figure 1.
Map of study area and export corridors of the soybean crop produced in the Paragominas pole, state of Pará, Brazil.
Figure 1.
Map of study area and export corridors of the soybean crop produced in the Paragominas pole, state of Pará, Brazil.
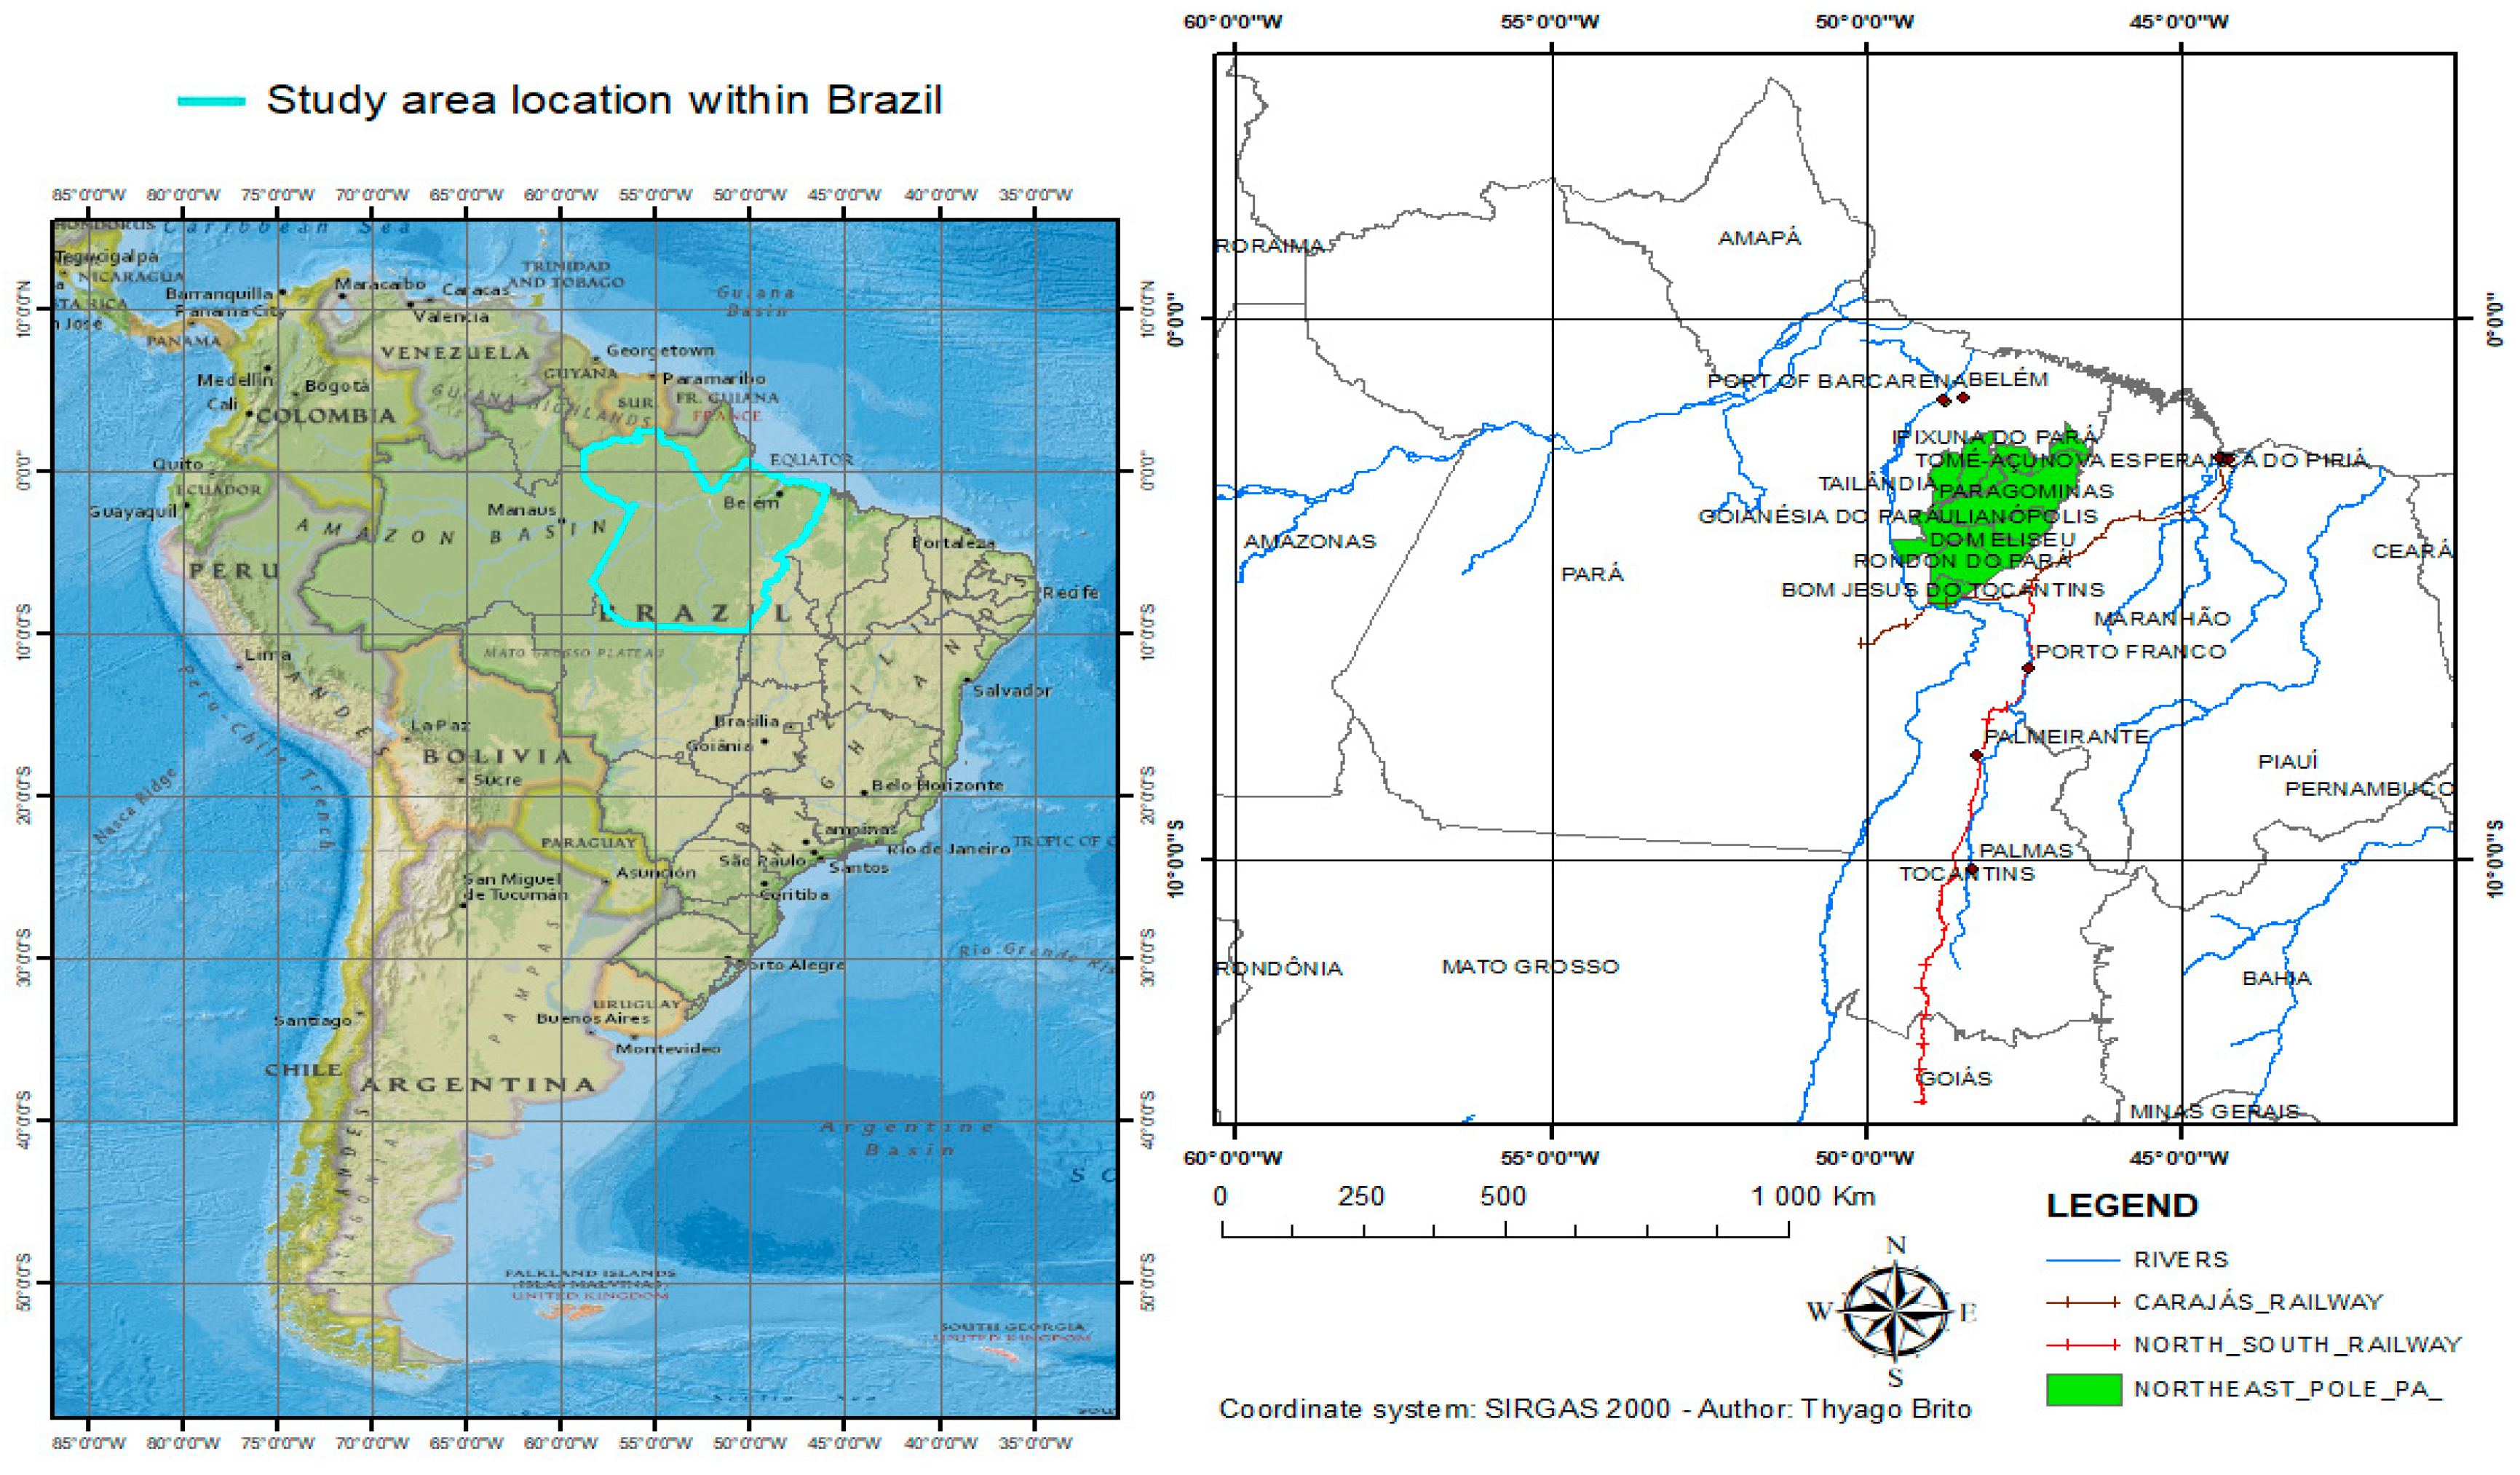
Figure 2.
(a) Farmers’ age range; (b) Partners’ age range; (c) Farmers’ average education level; (d) Partners’ average education level; (e) Farmers’ ethnic background; (f) Partners’ ethnic background.
Figure 2.
(a) Farmers’ age range; (b) Partners’ age range; (c) Farmers’ average education level; (d) Partners’ average education level; (e) Farmers’ ethnic background; (f) Partners’ ethnic background.
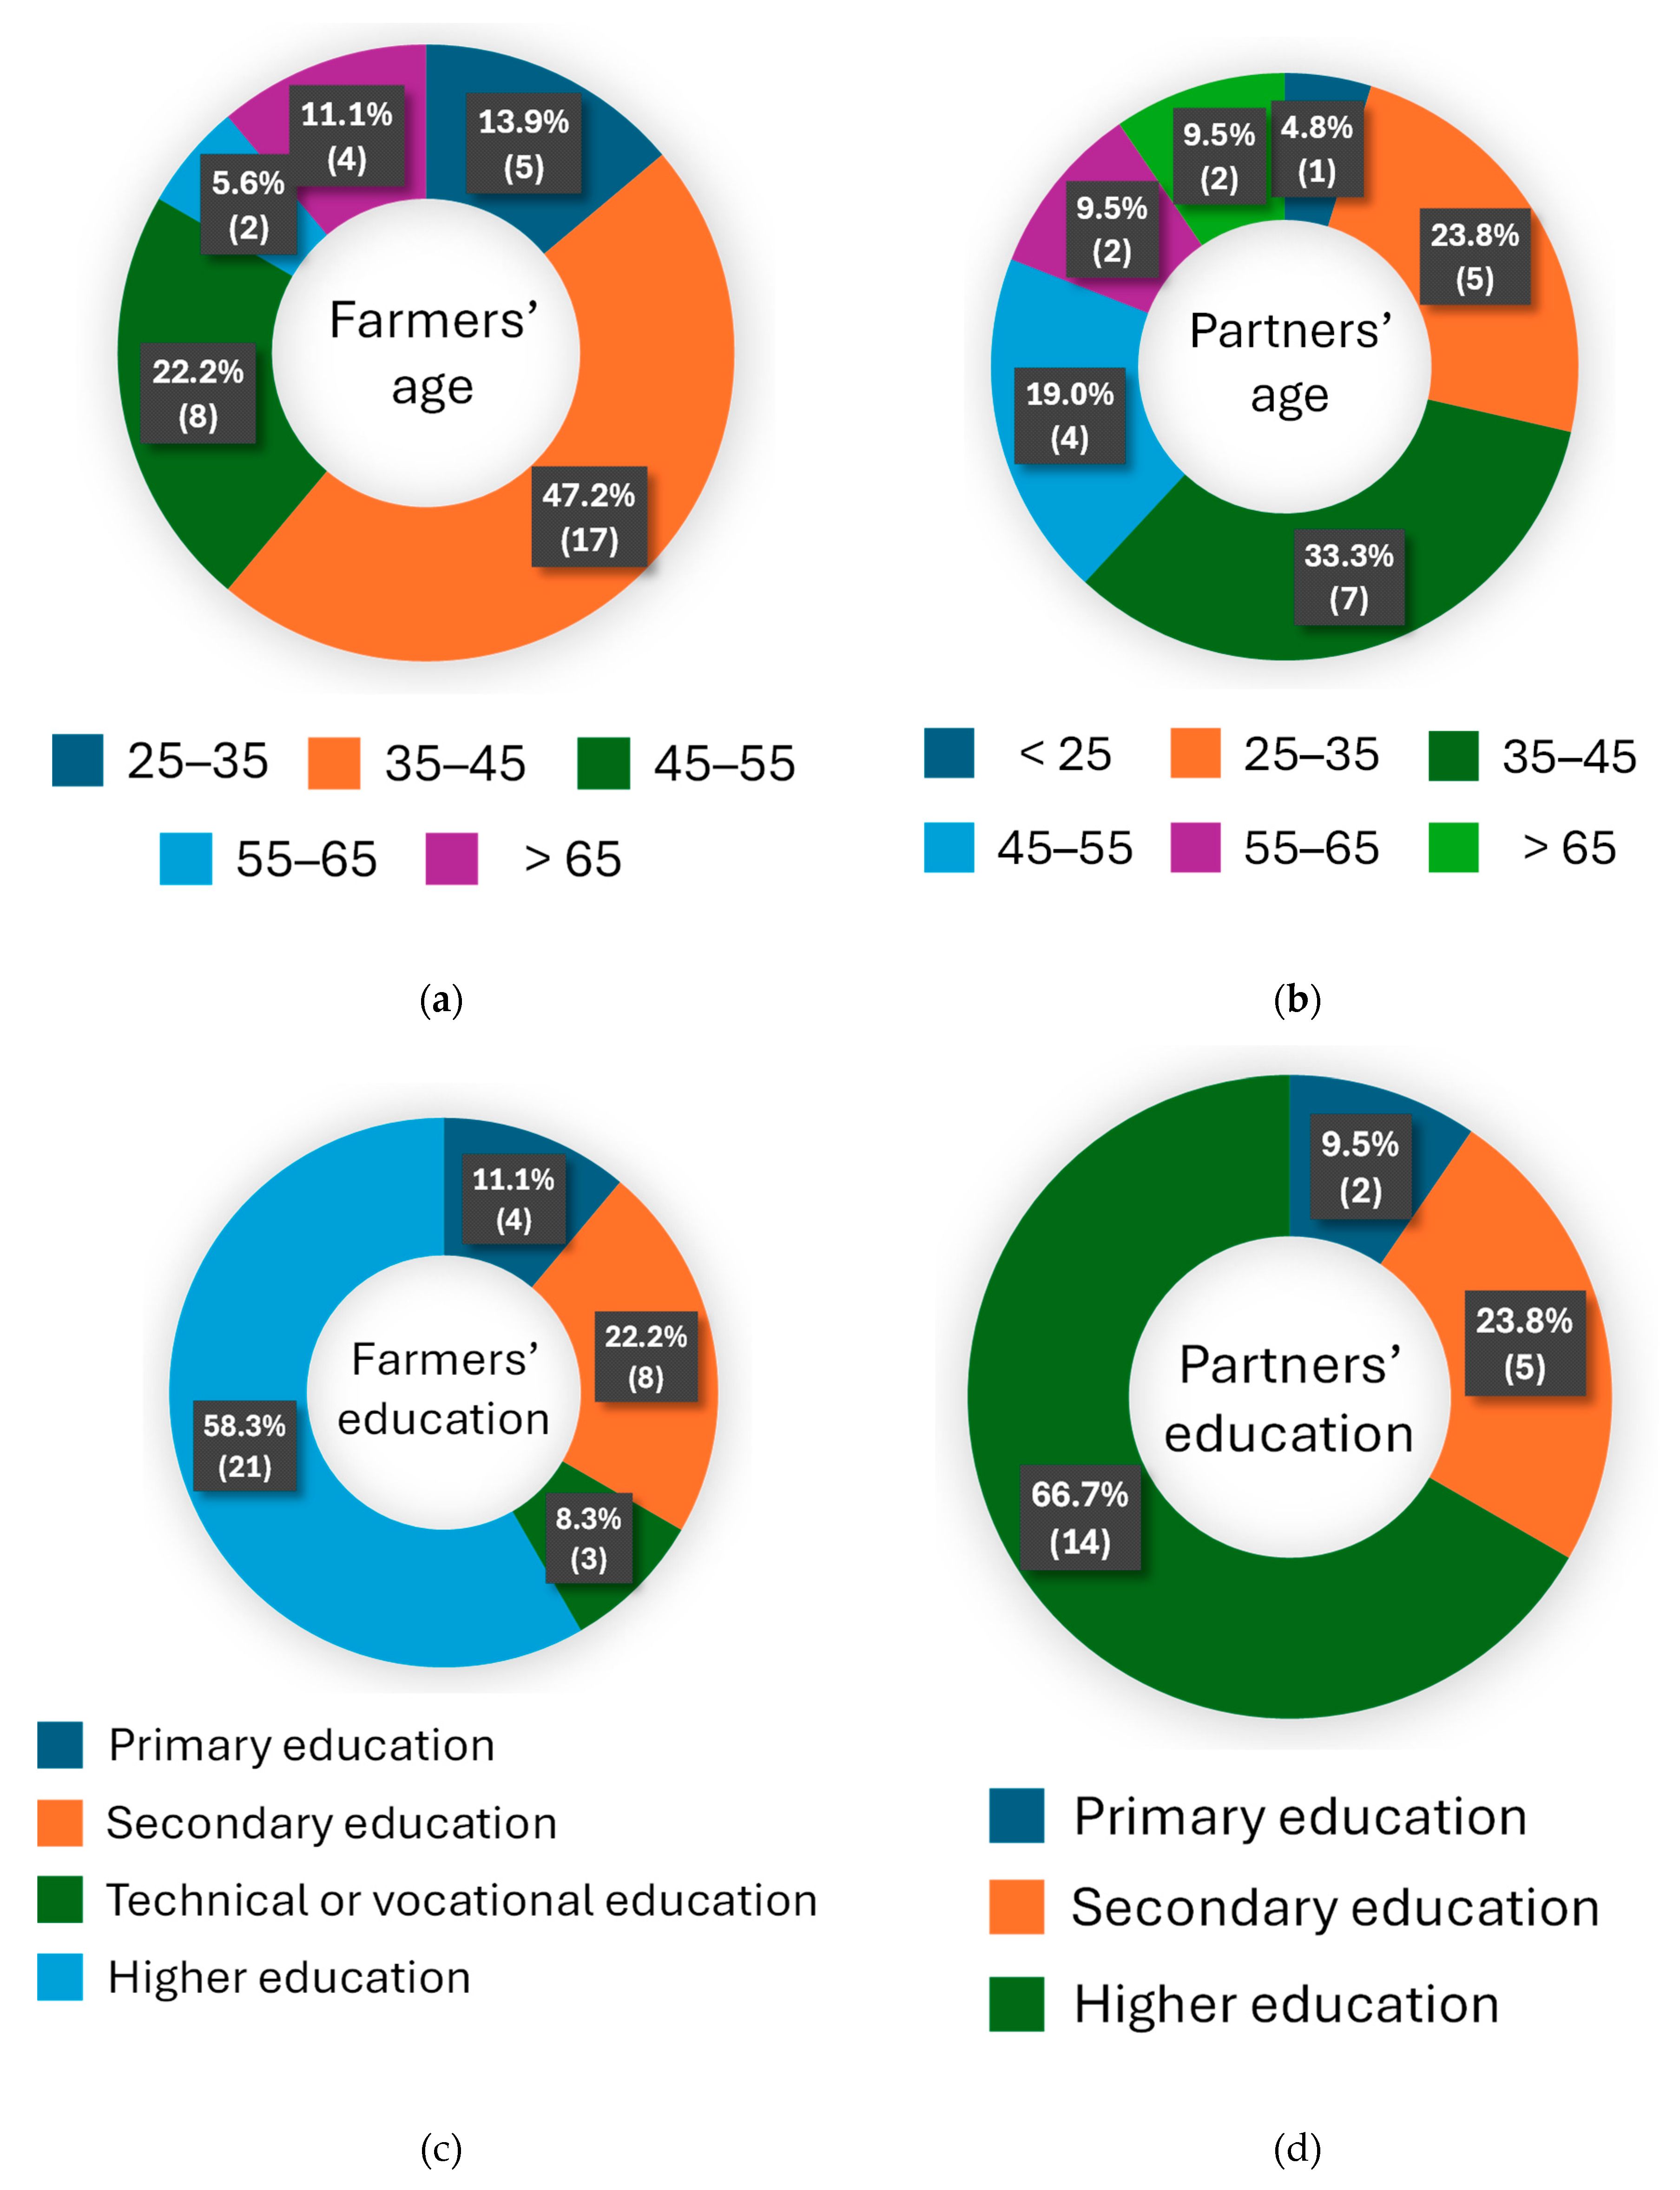
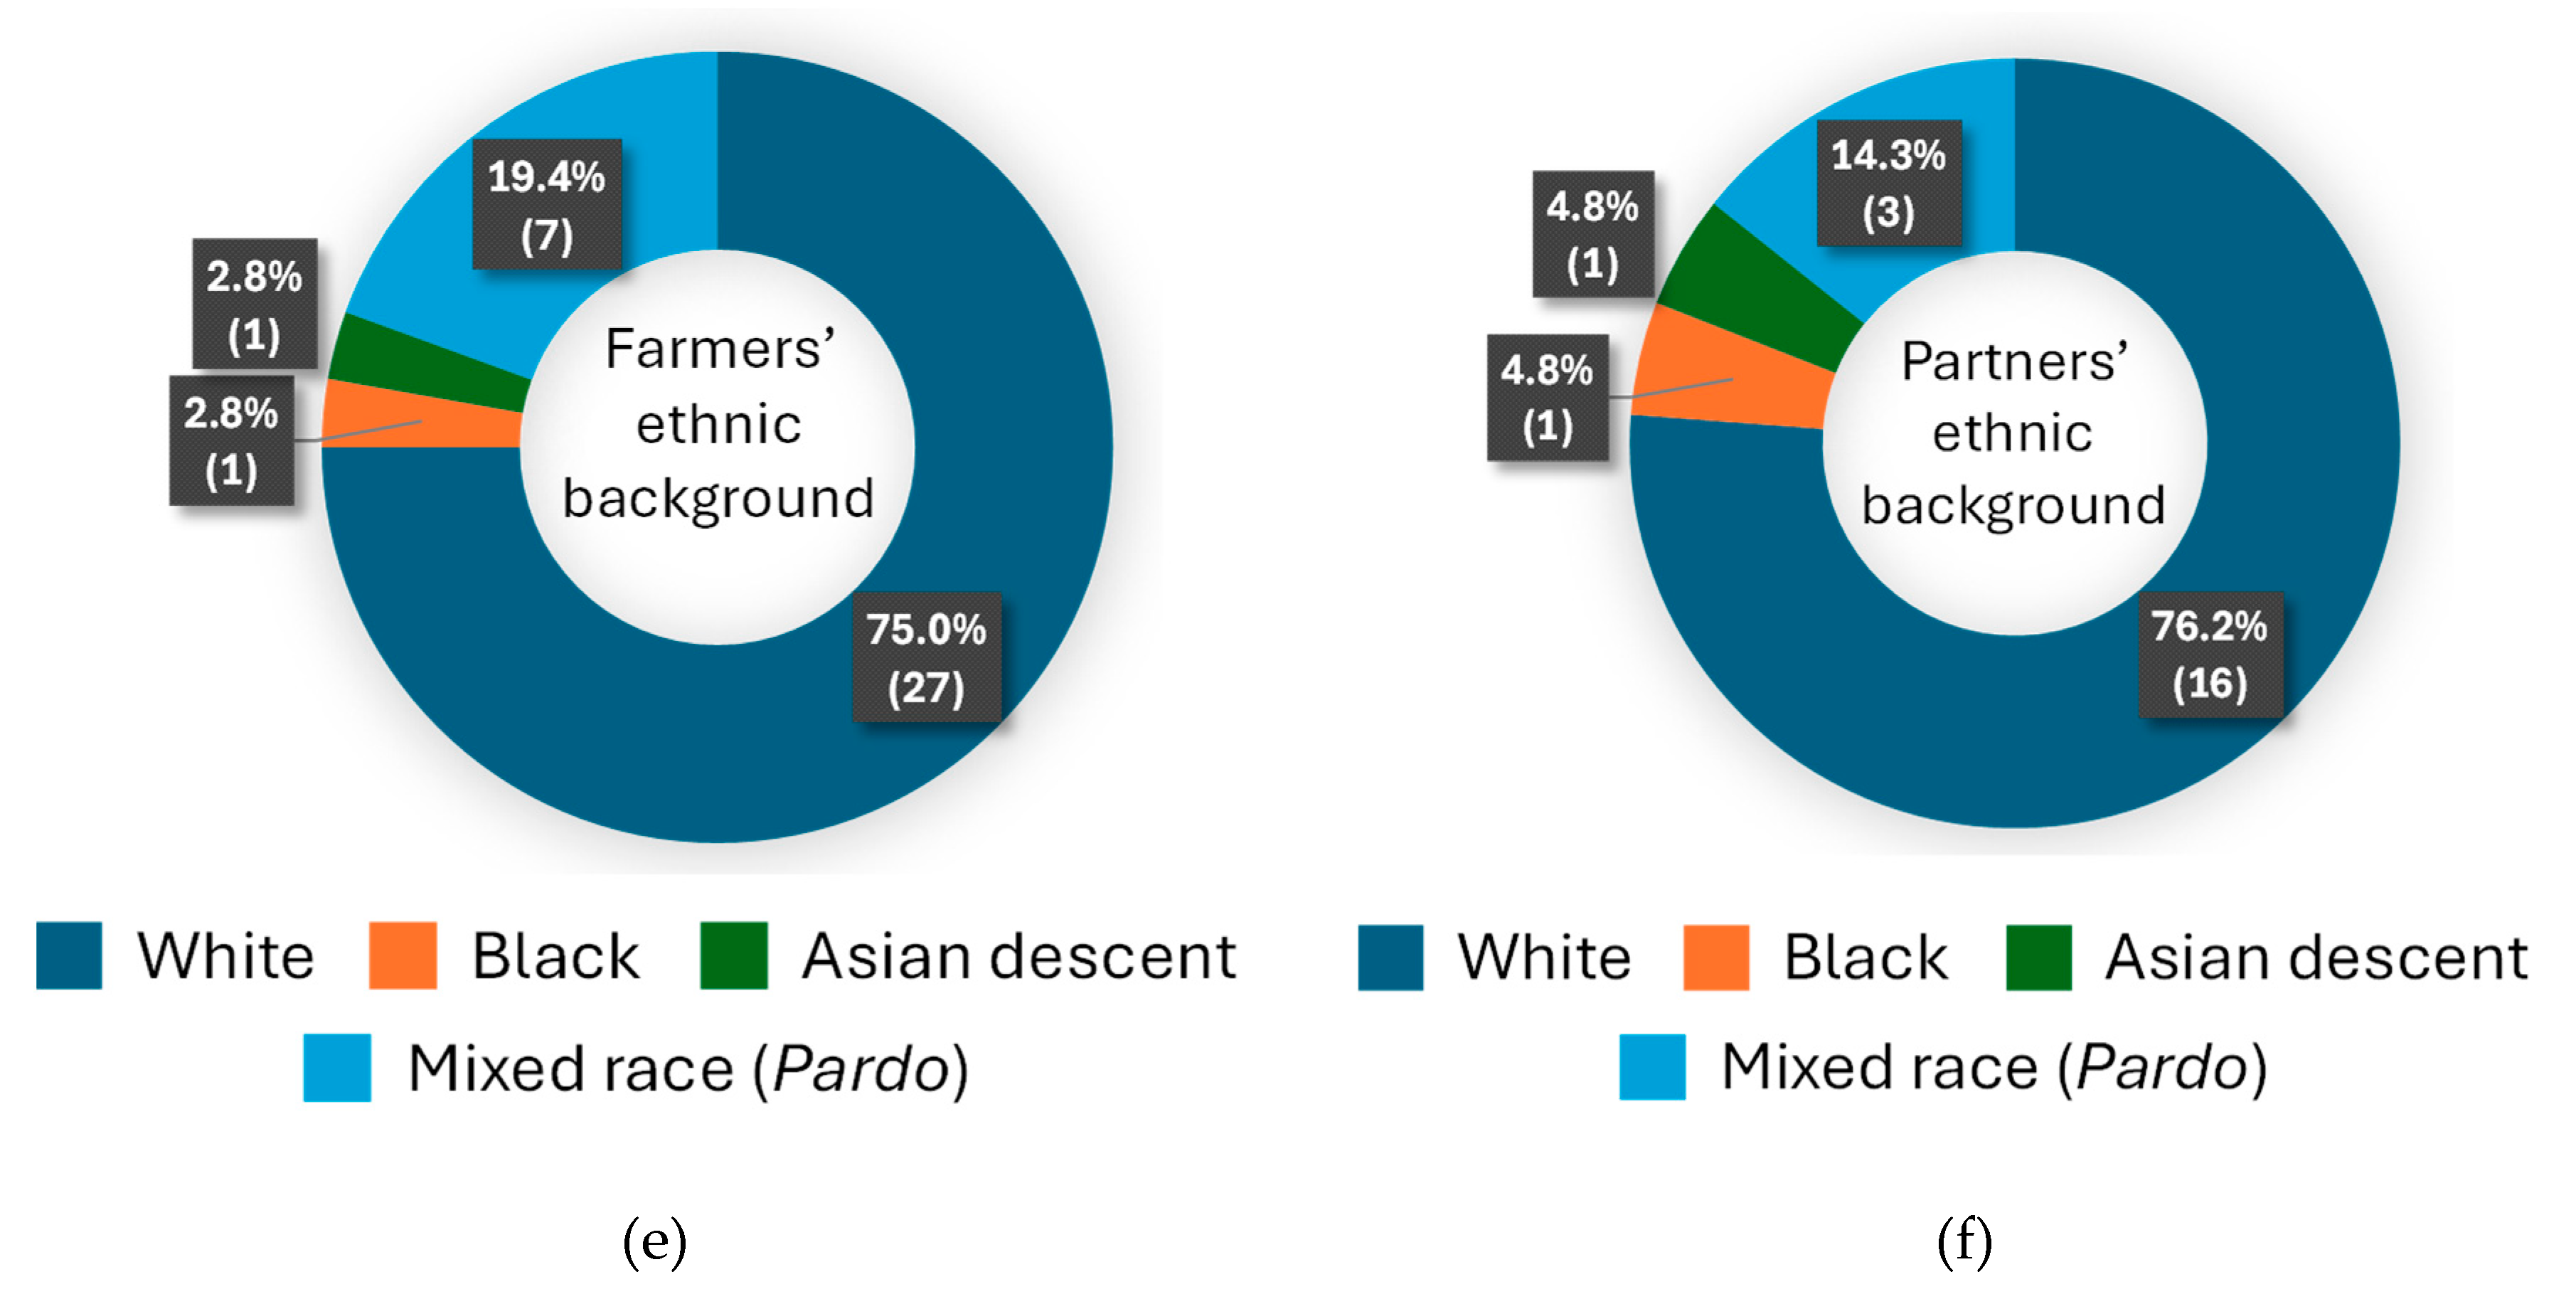
Figure 3.
(a) Percentage of farmers with grain silo; (b) Total number of employees mapped in this study; (c) Education level of employees; (d) Average wage of employees.
Figure 3.
(a) Percentage of farmers with grain silo; (b) Total number of employees mapped in this study; (c) Education level of employees; (d) Average wage of employees.
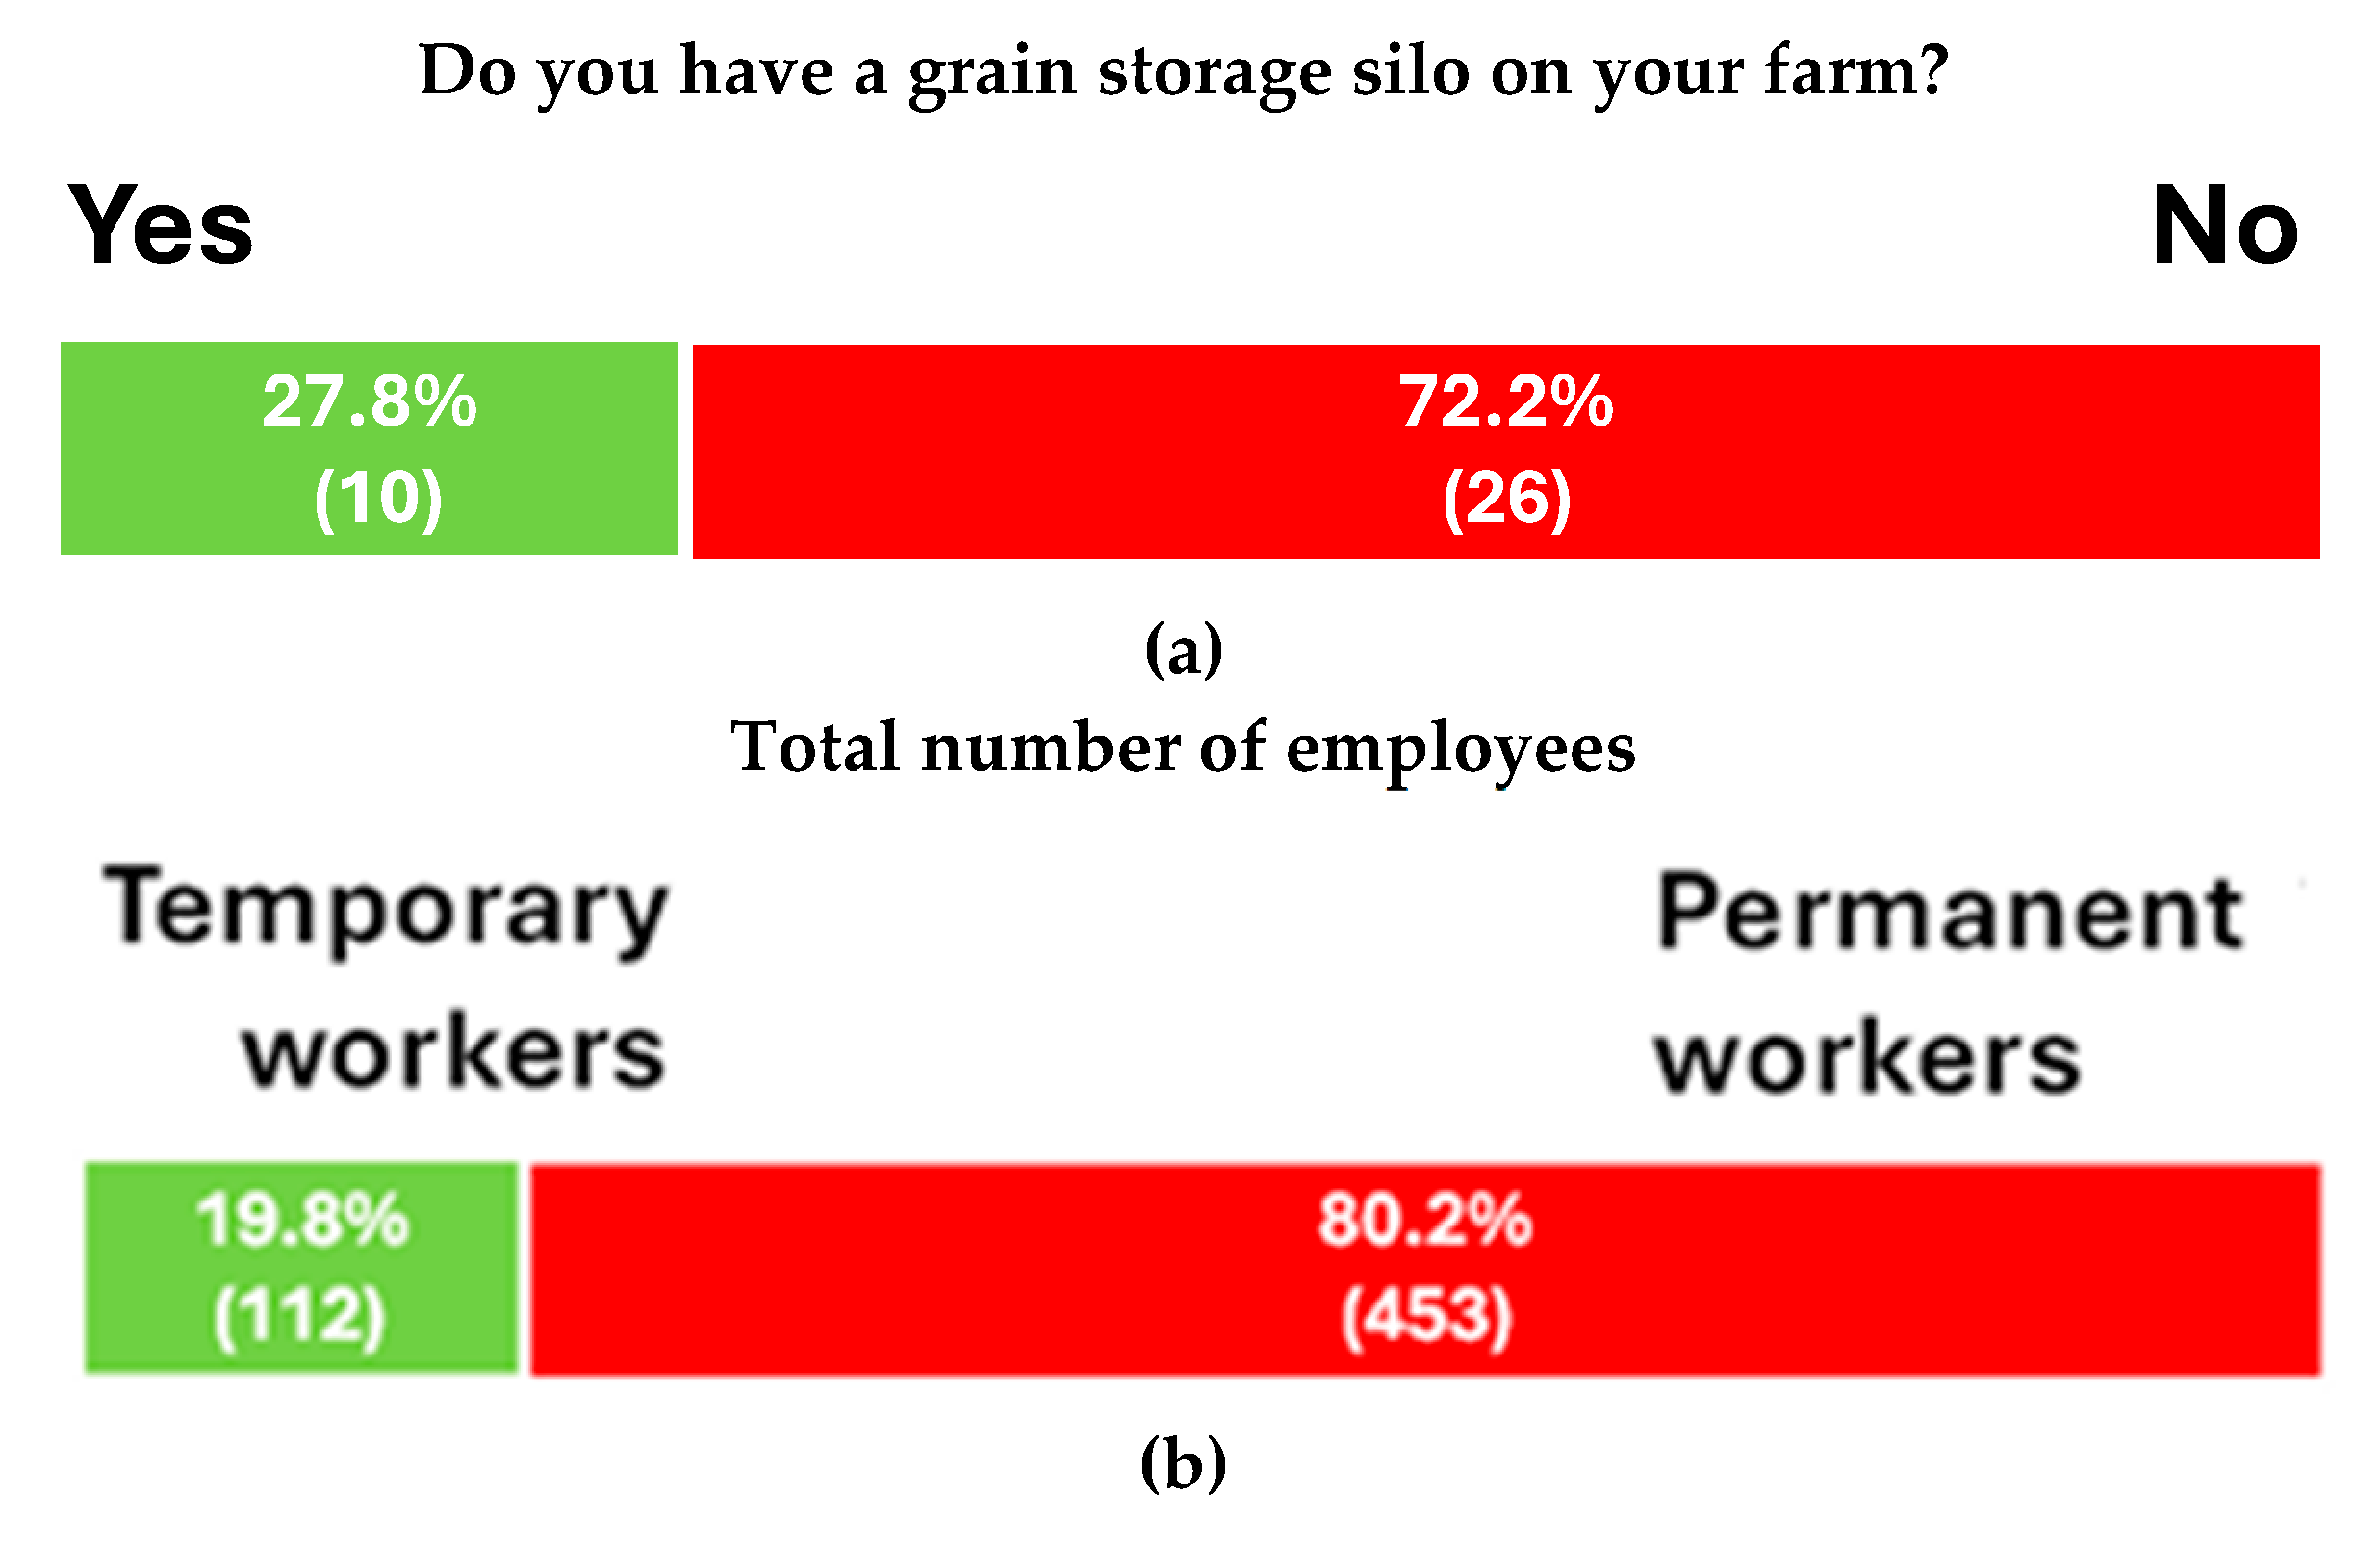
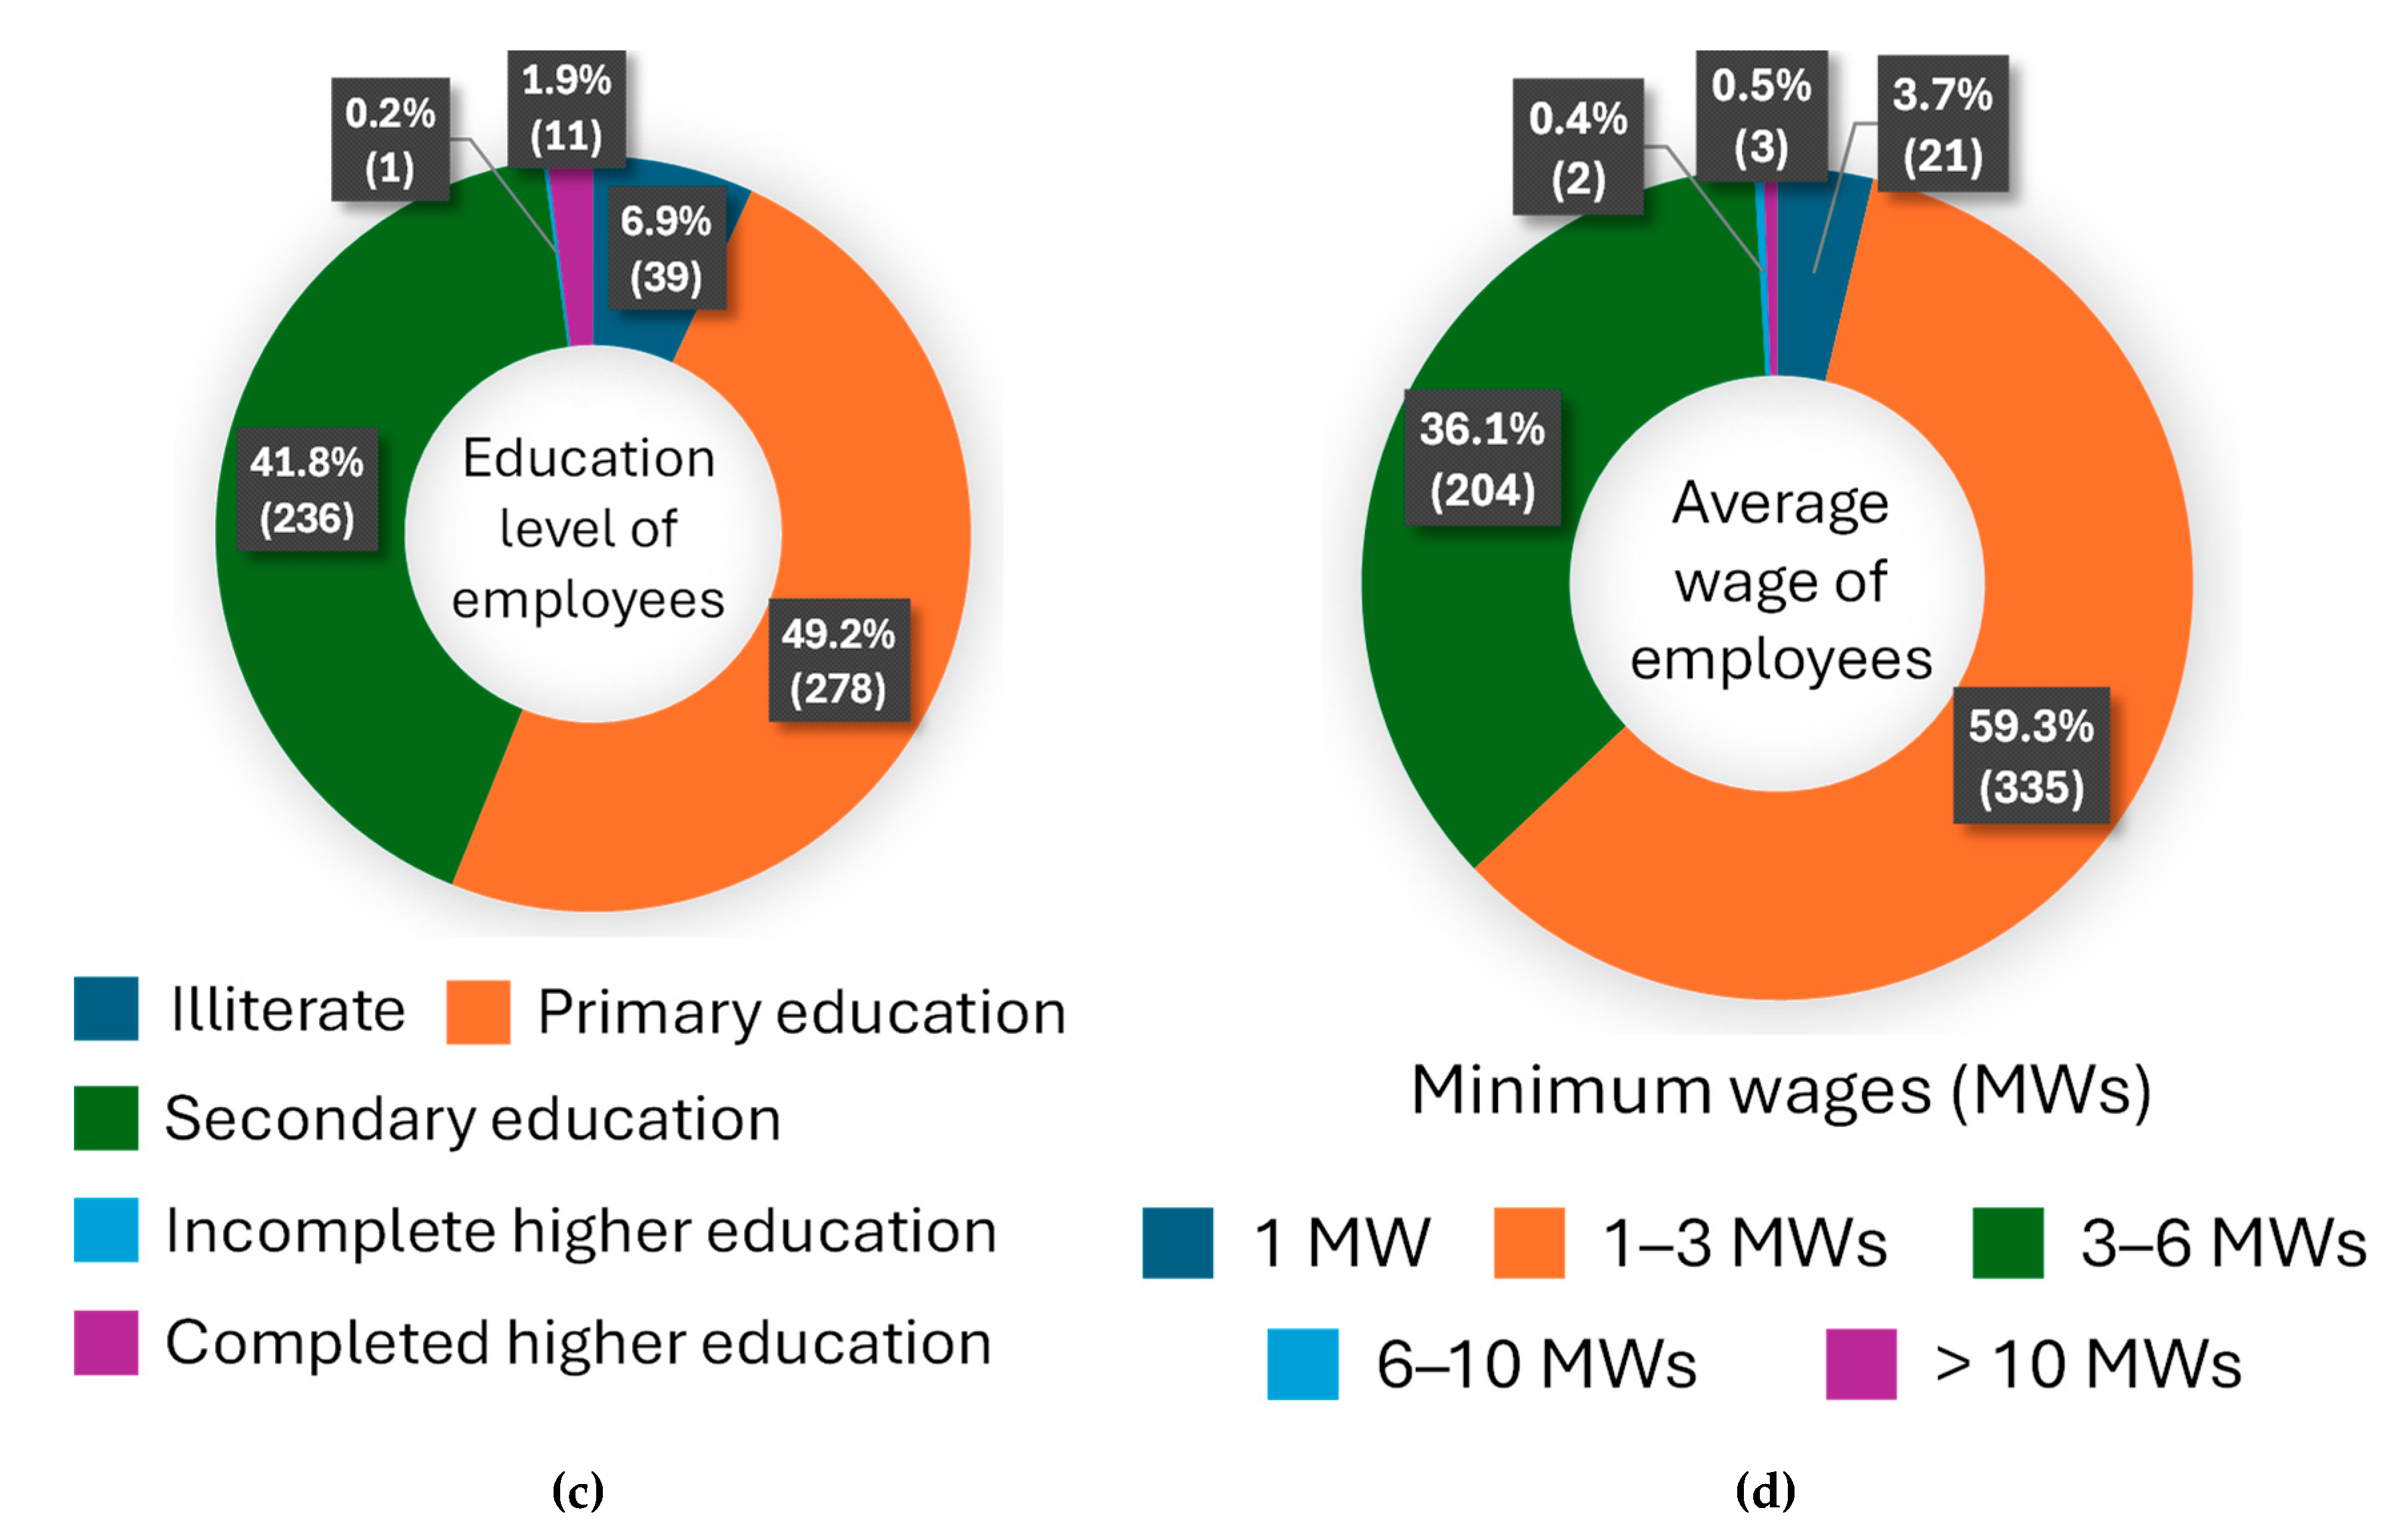
Figure 4.
(a) Number of planter machines per farmer; (b) Number of combine harvesters per farmer; (c) Number of fertiliser and lime spreaders per farmer; (d) Number of tractors (>100 hp) per farmer.
Figure 4.
(a) Number of planter machines per farmer; (b) Number of combine harvesters per farmer; (c) Number of fertiliser and lime spreaders per farmer; (d) Number of tractors (>100 hp) per farmer.
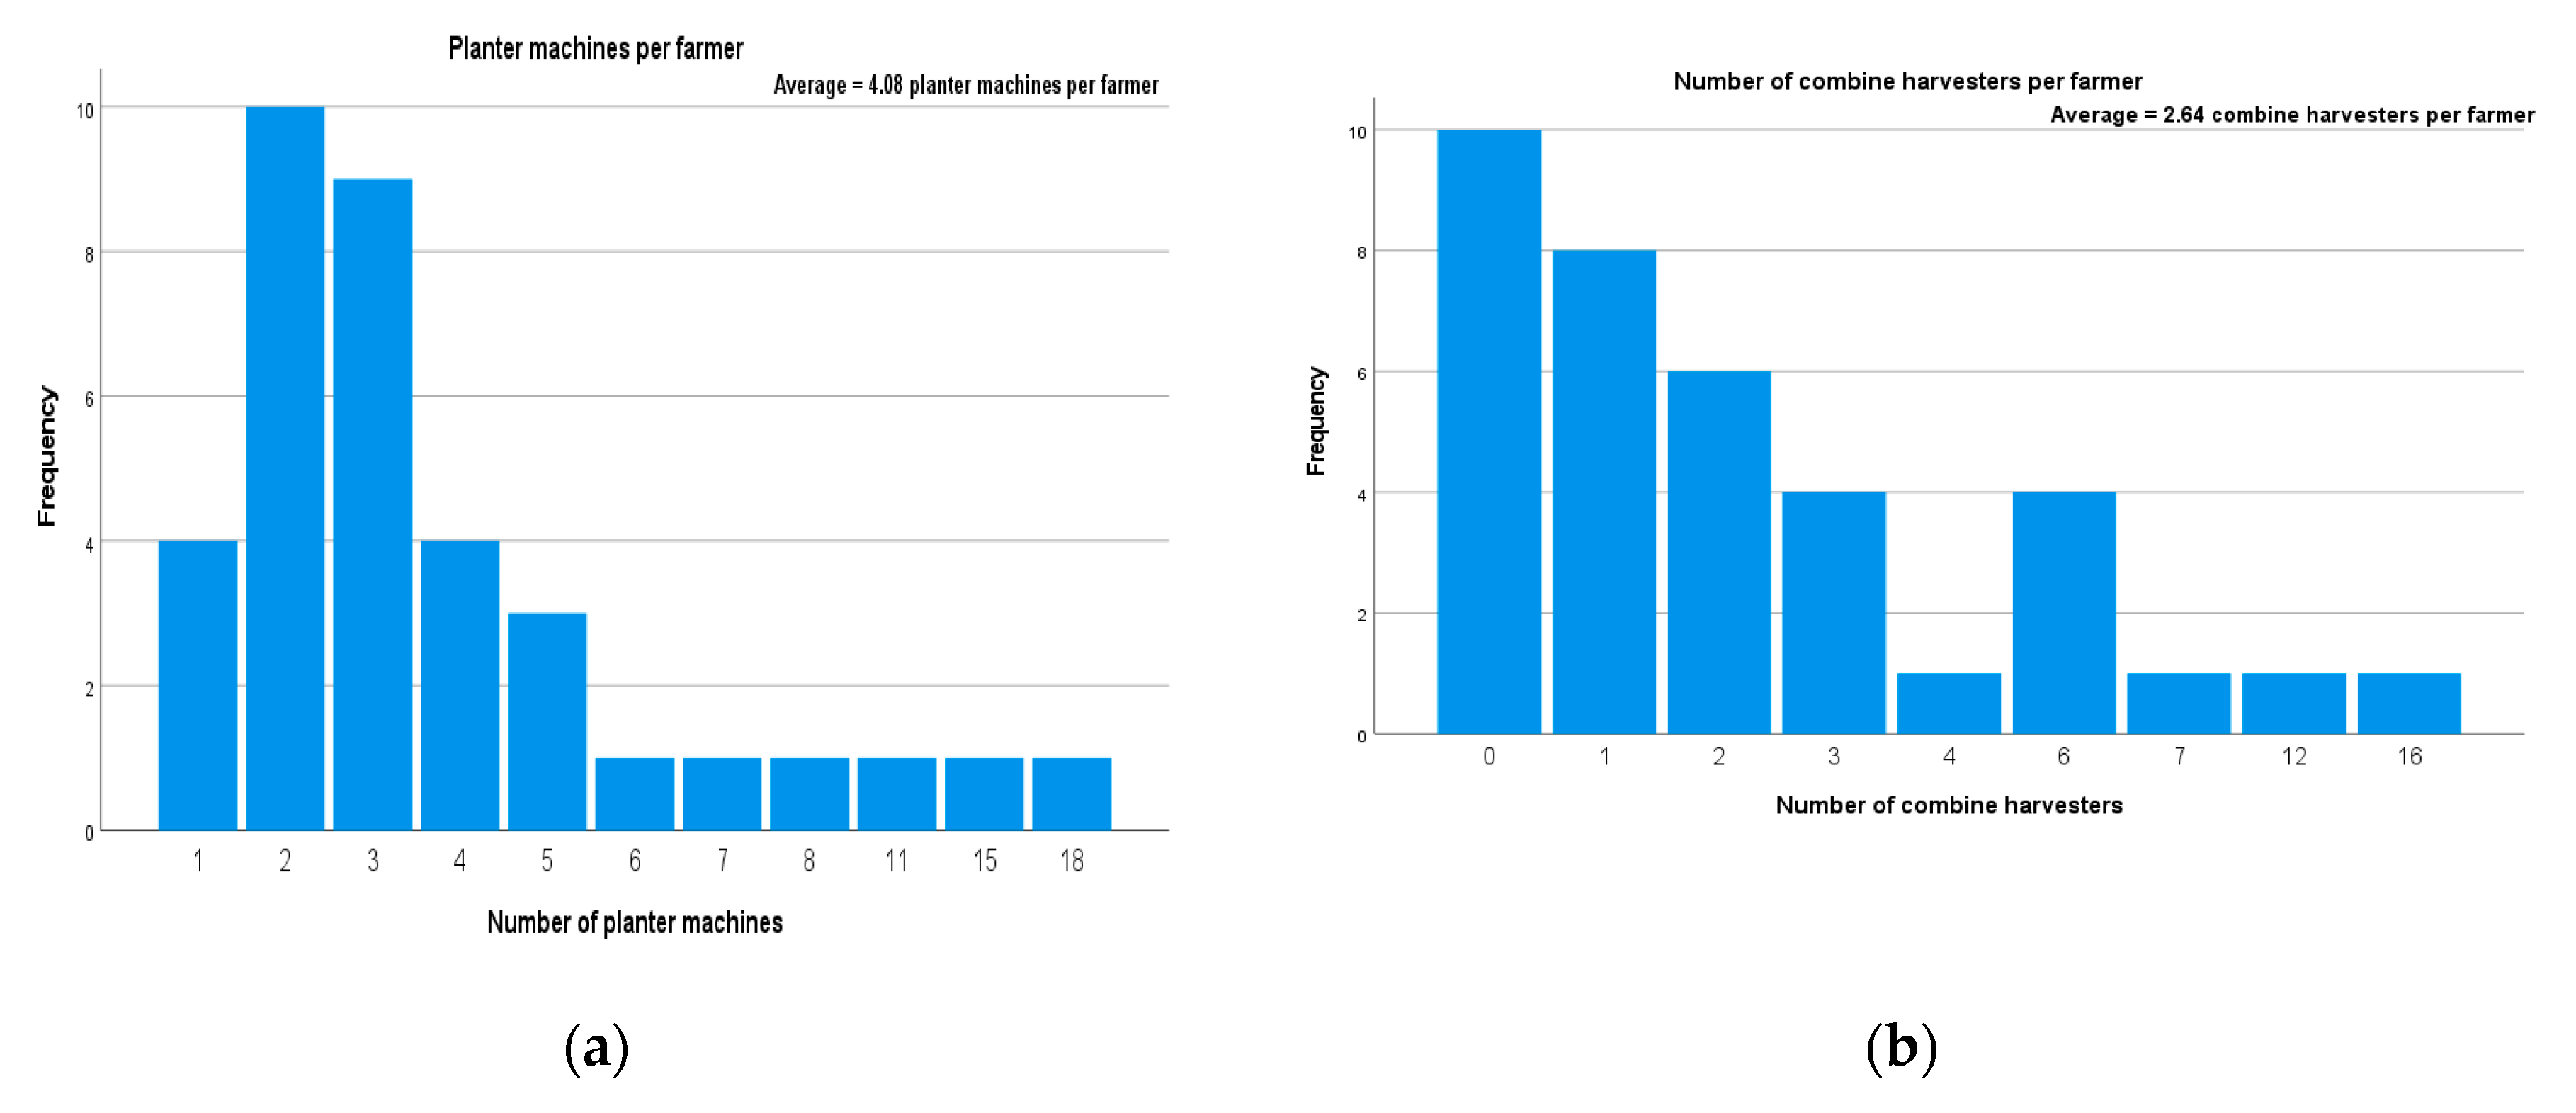
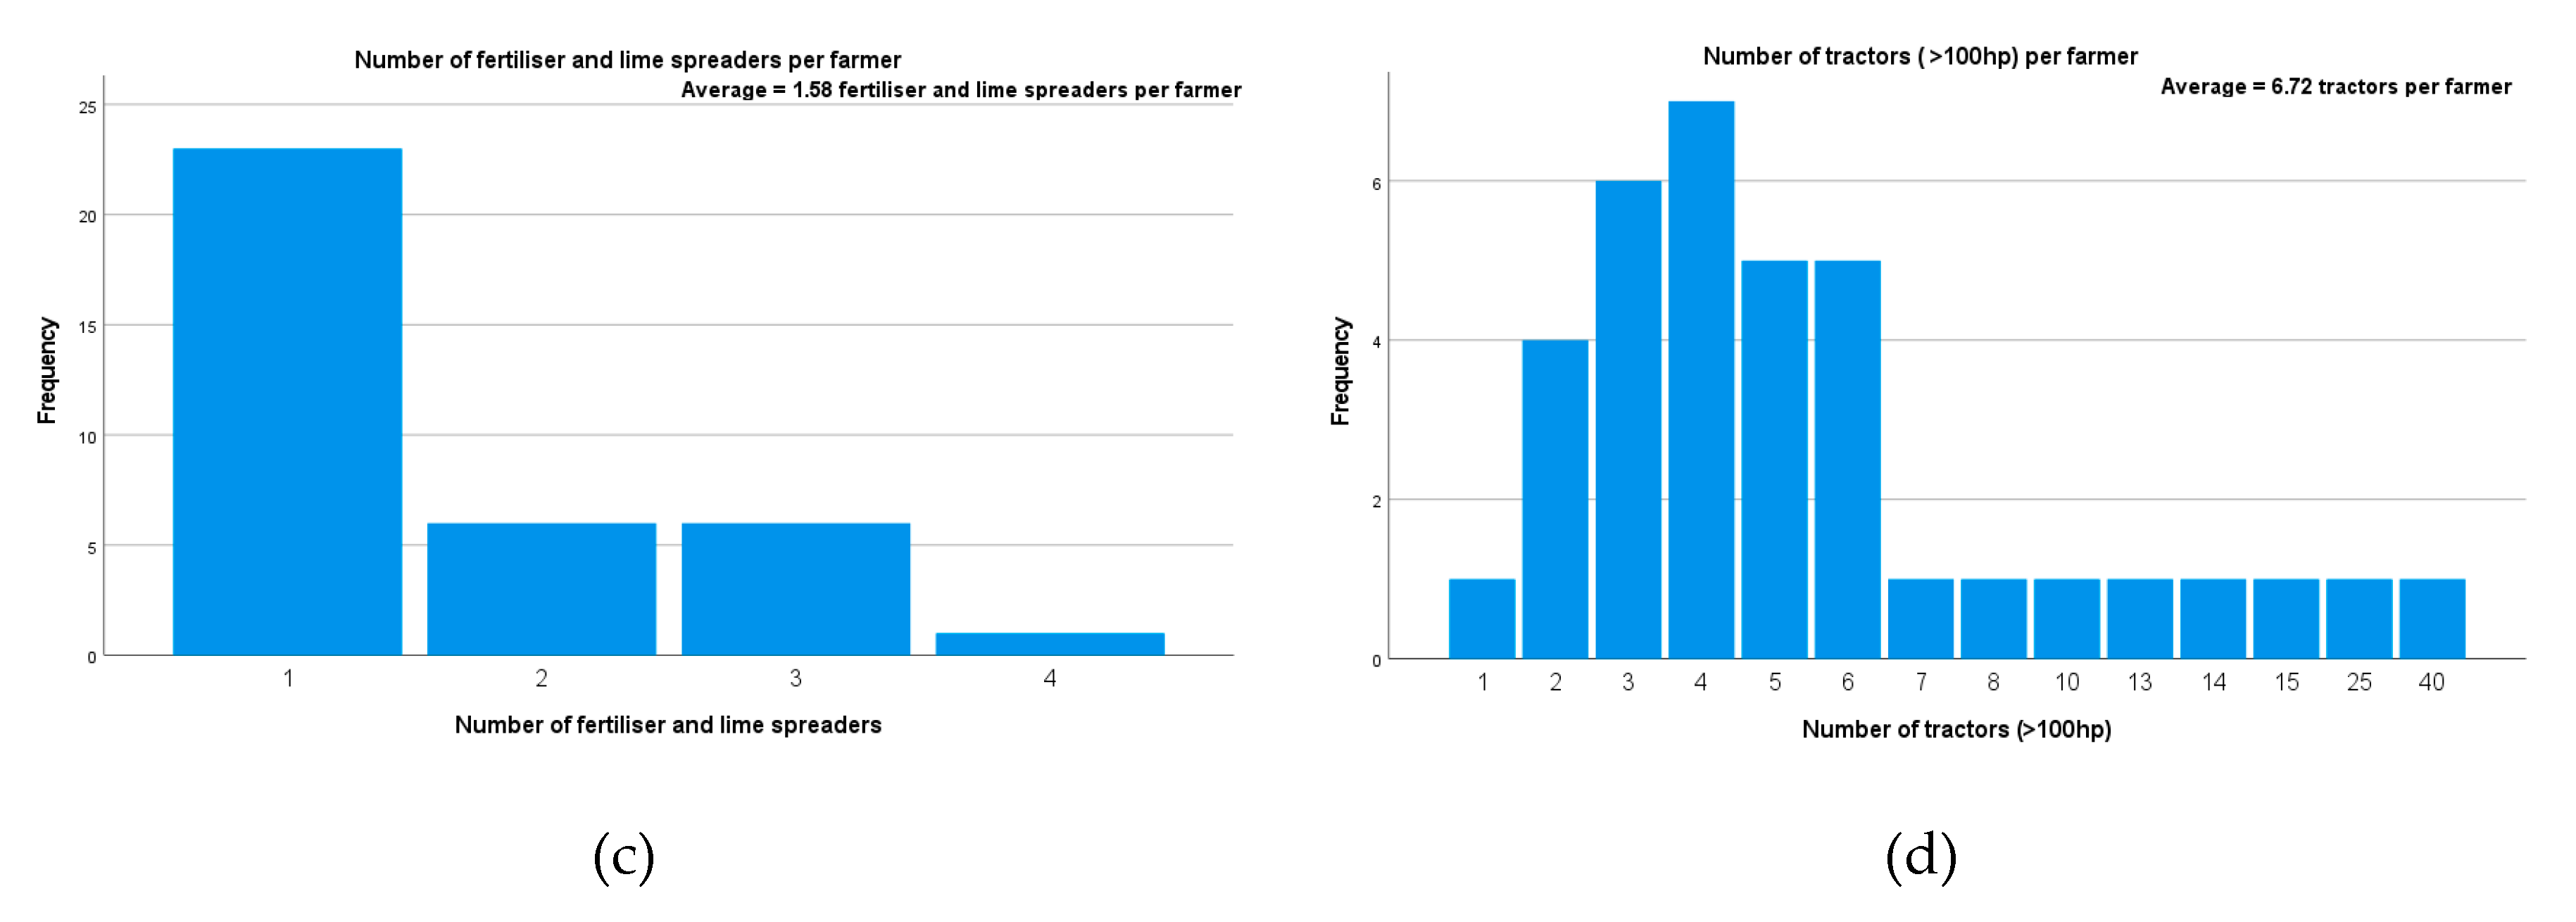
Figure 5.
Soy bag price, total cost of inputs, and soy barter ratio between the crop years 2018/2019 and 2024/2025 in the Paragominas Pole, state of Pará, Brazil.
Figure 5.
Soy bag price, total cost of inputs, and soy barter ratio between the crop years 2018/2019 and 2024/2025 in the Paragominas Pole, state of Pará, Brazil.
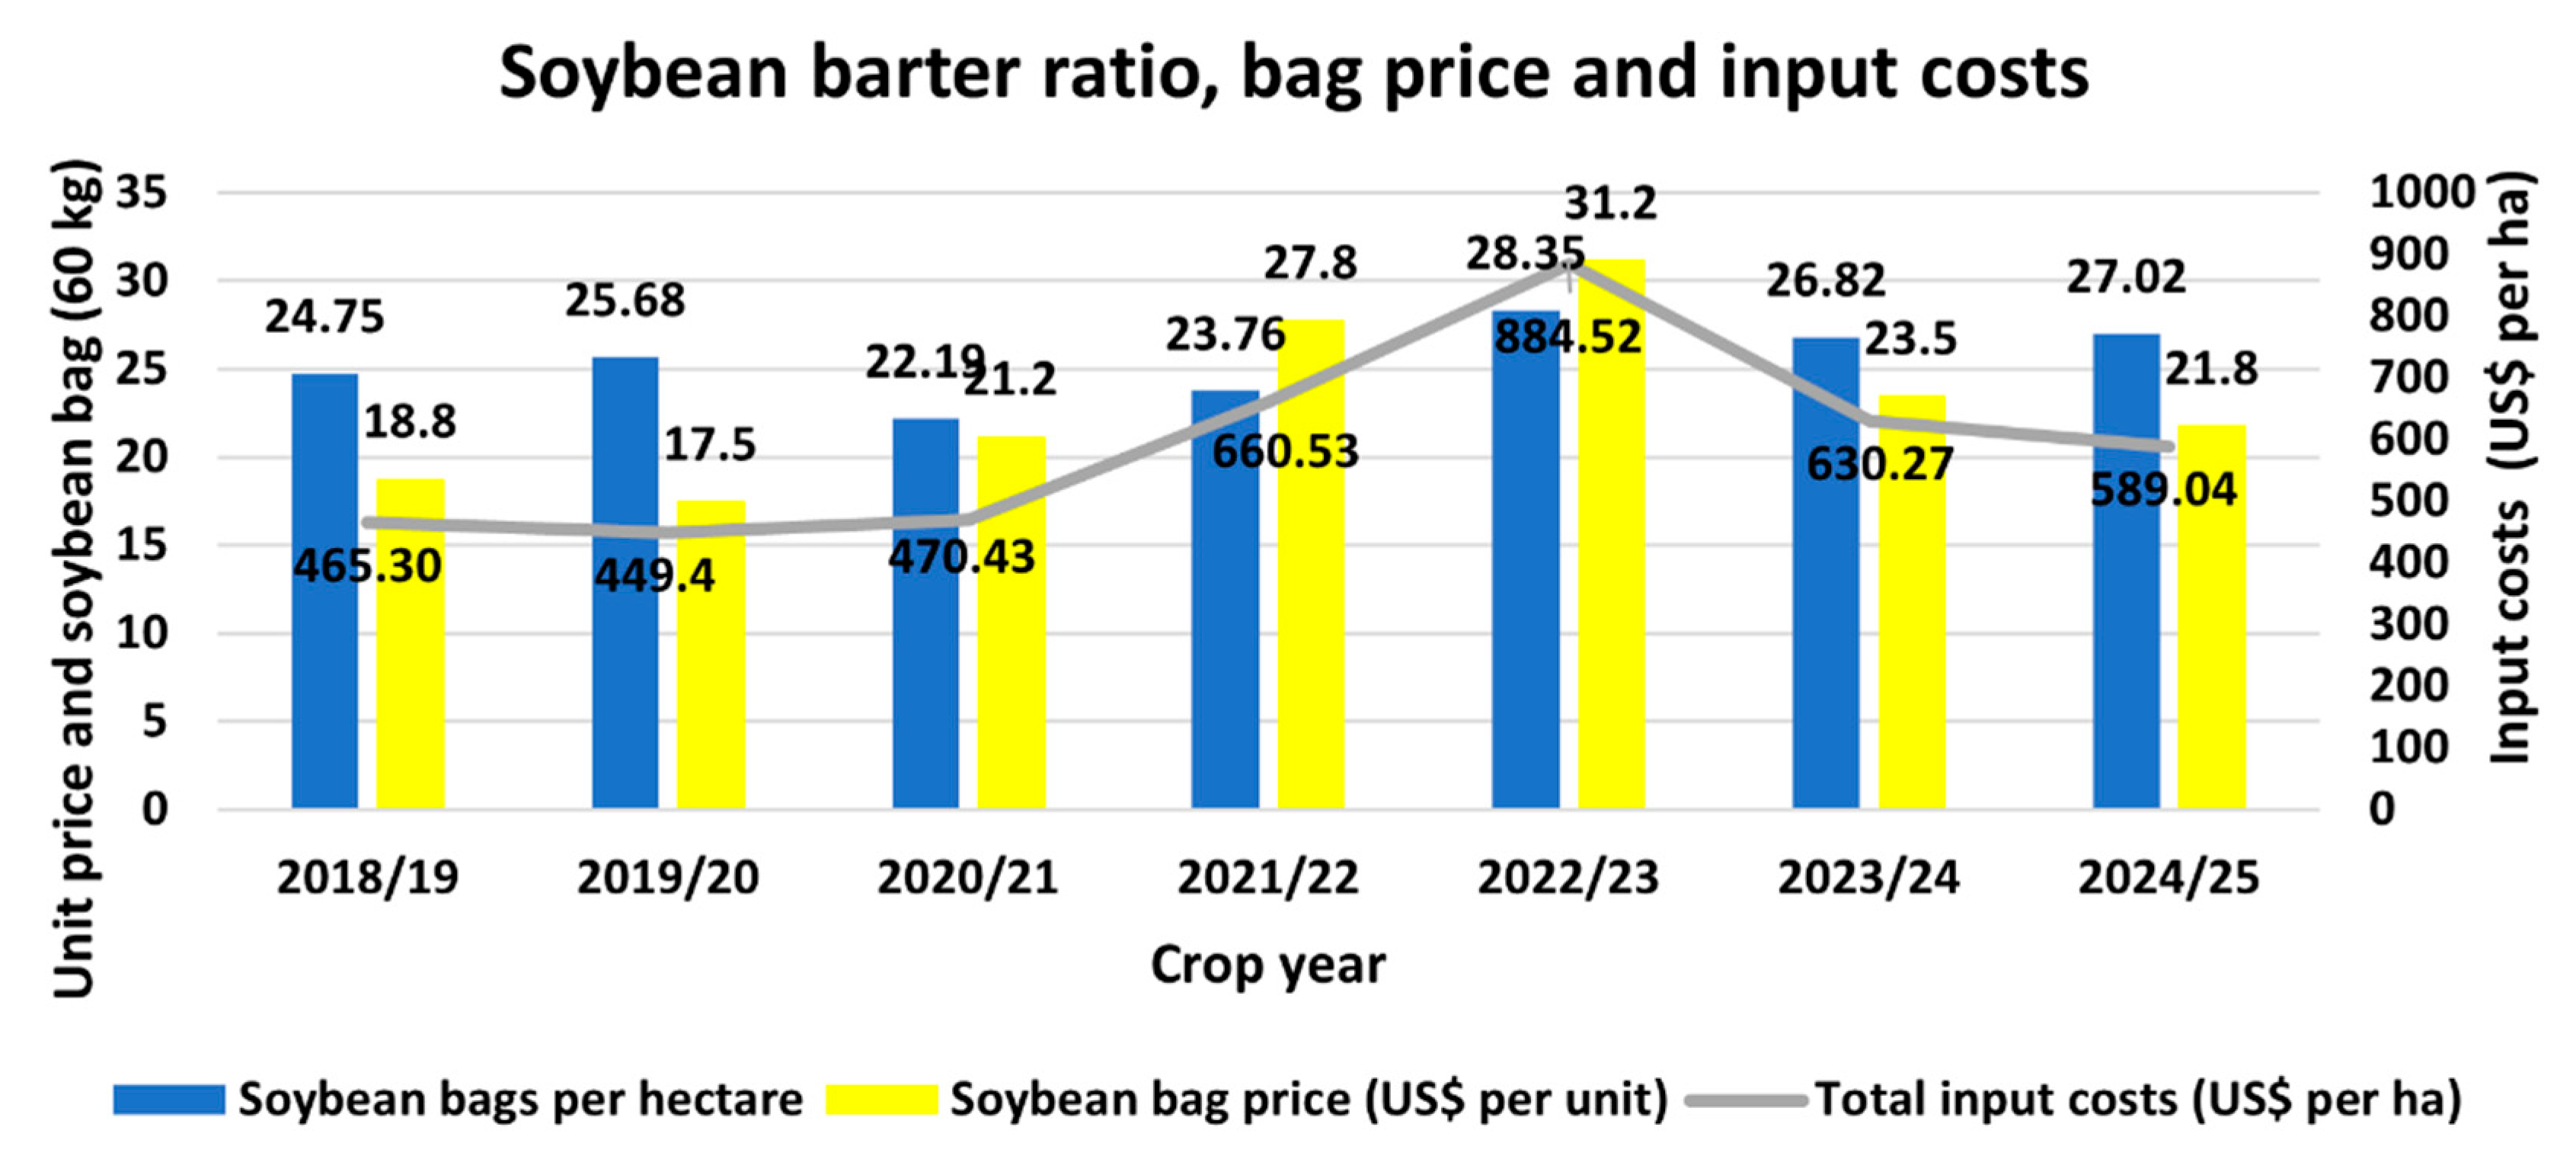
Figure 6.
Average operating and limestone costs per hectare of 36 farmers in Paragominas (northeast pole), state of Pará, Brazil, during the 2023/2024 crop season.
Figure 6.
Average operating and limestone costs per hectare of 36 farmers in Paragominas (northeast pole), state of Pará, Brazil, during the 2023/2024 crop season.
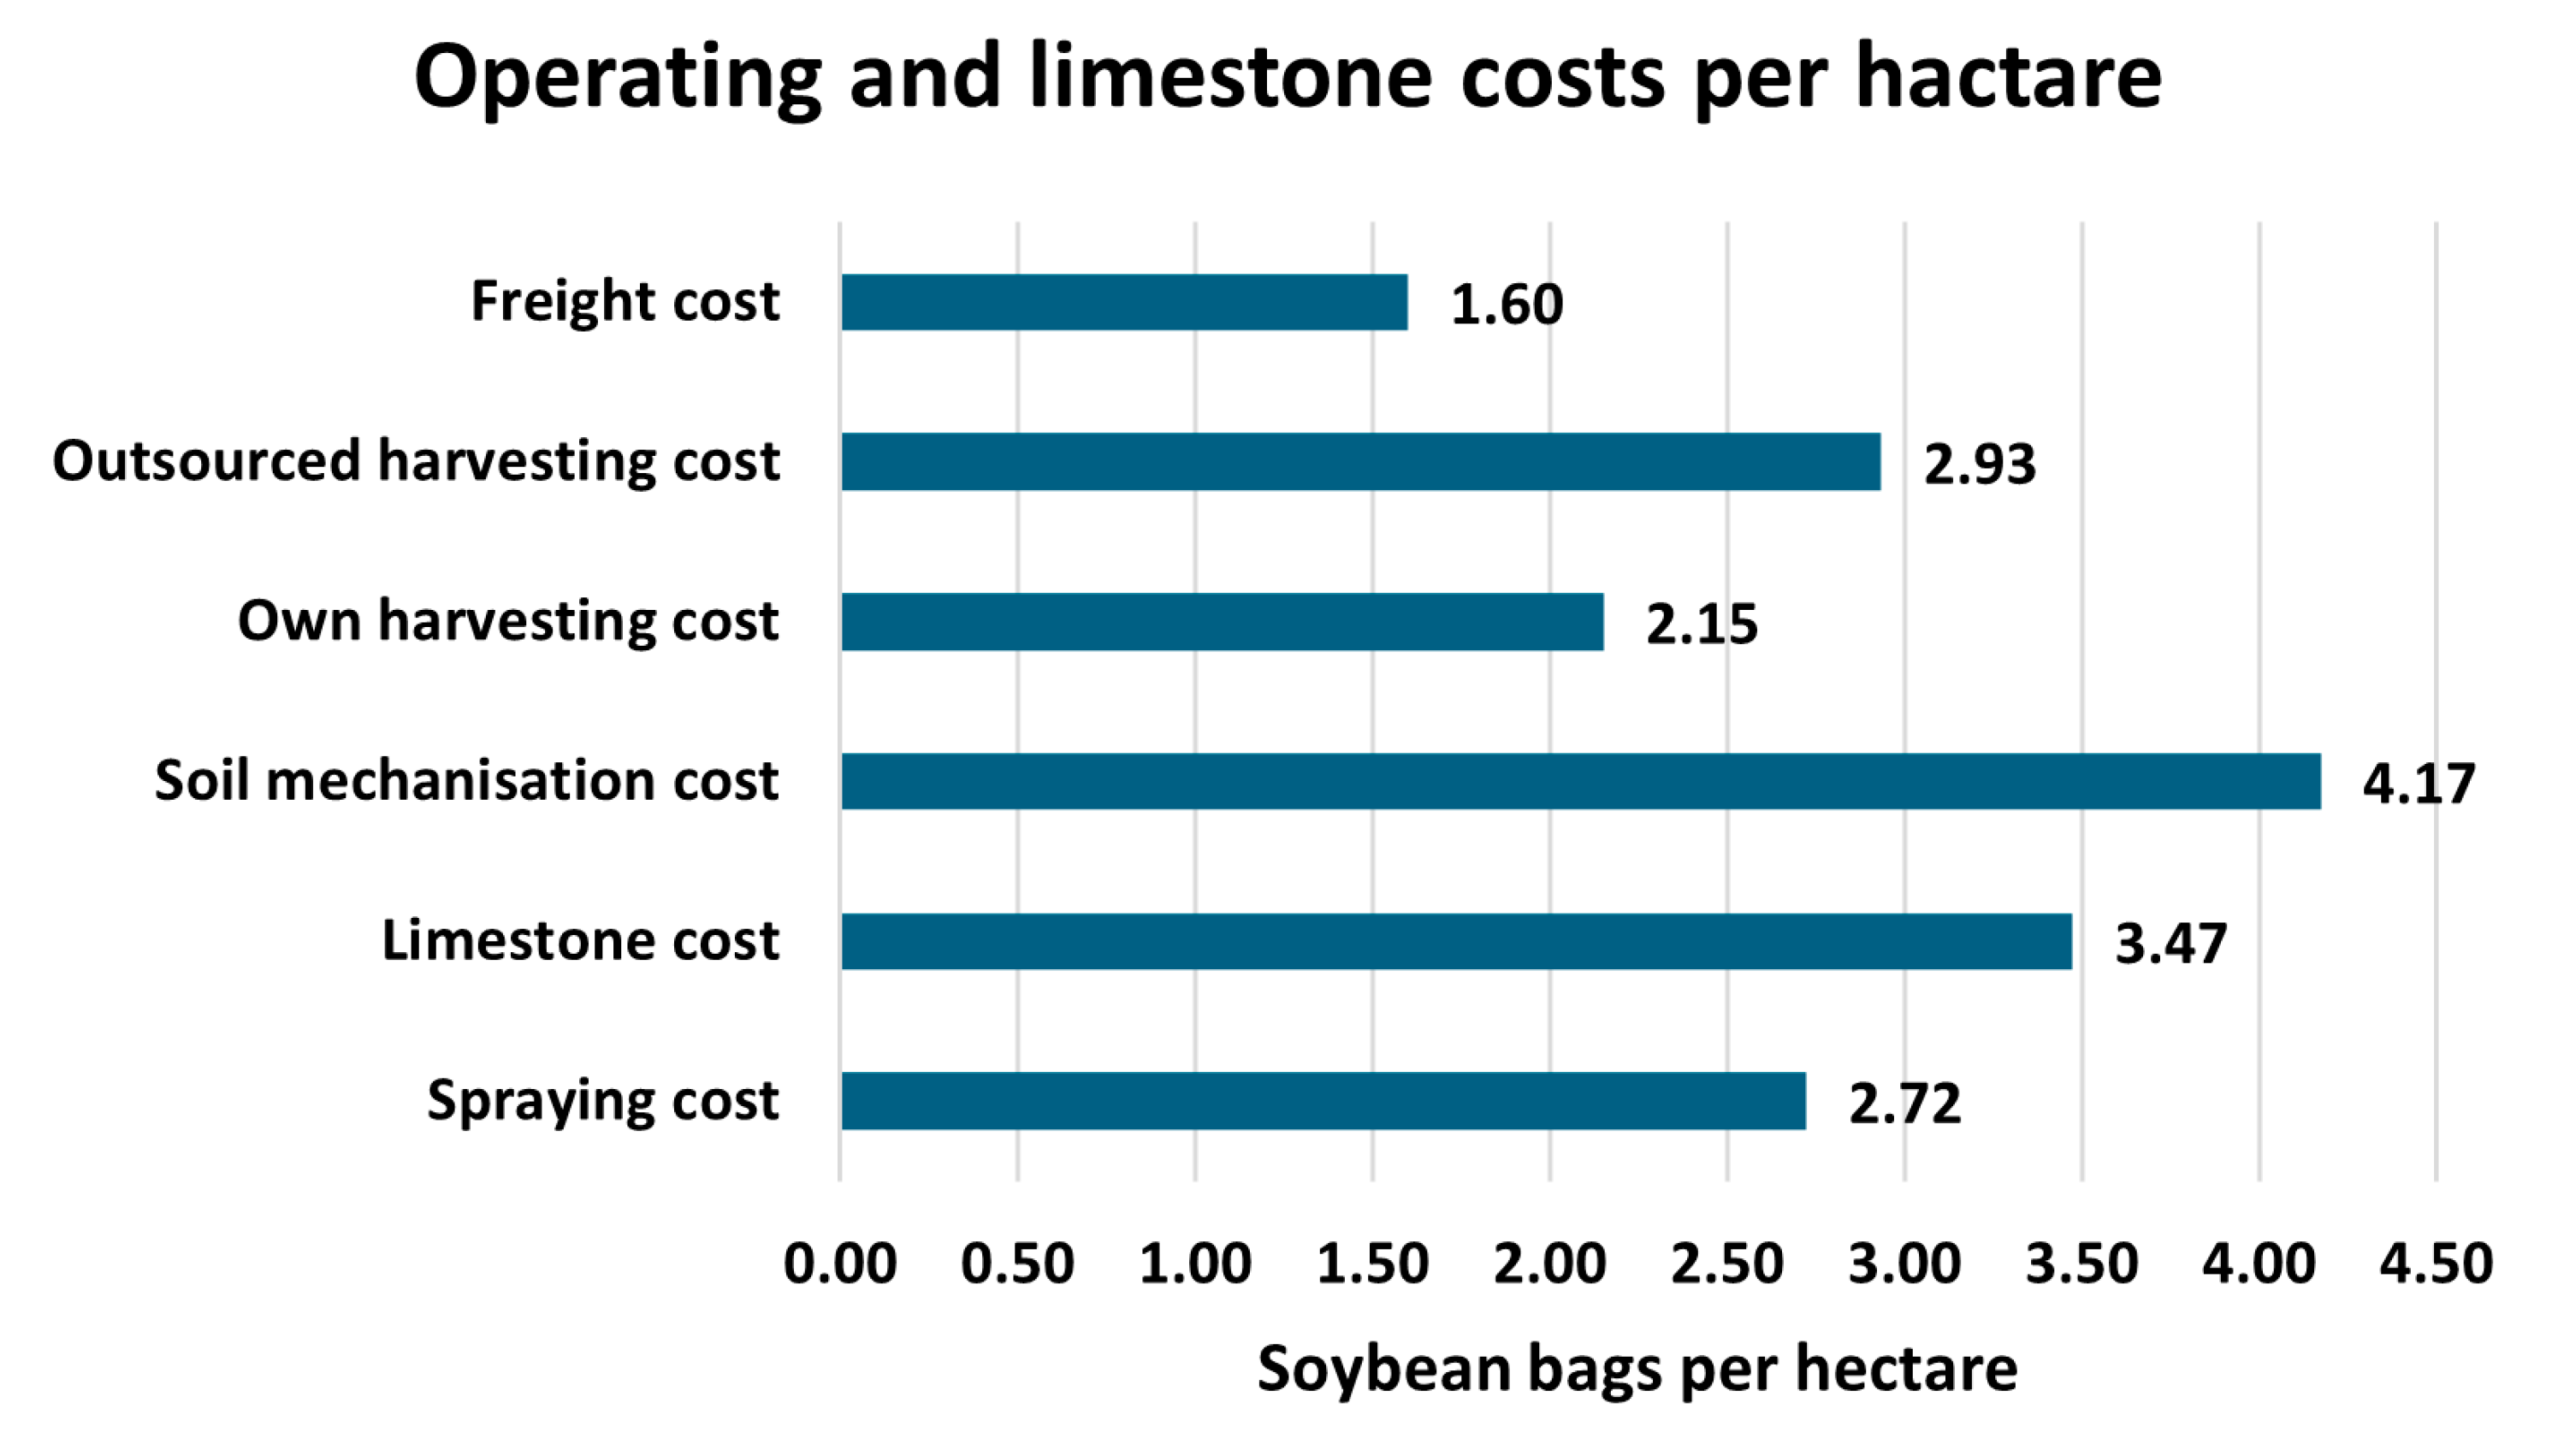
Figure 7.
Average annual cost of one ha leased for soybean cultivation in Paragominas (northeast pole), state of Pará, Brazil.
Figure 7.
Average annual cost of one ha leased for soybean cultivation in Paragominas (northeast pole), state of Pará, Brazil.
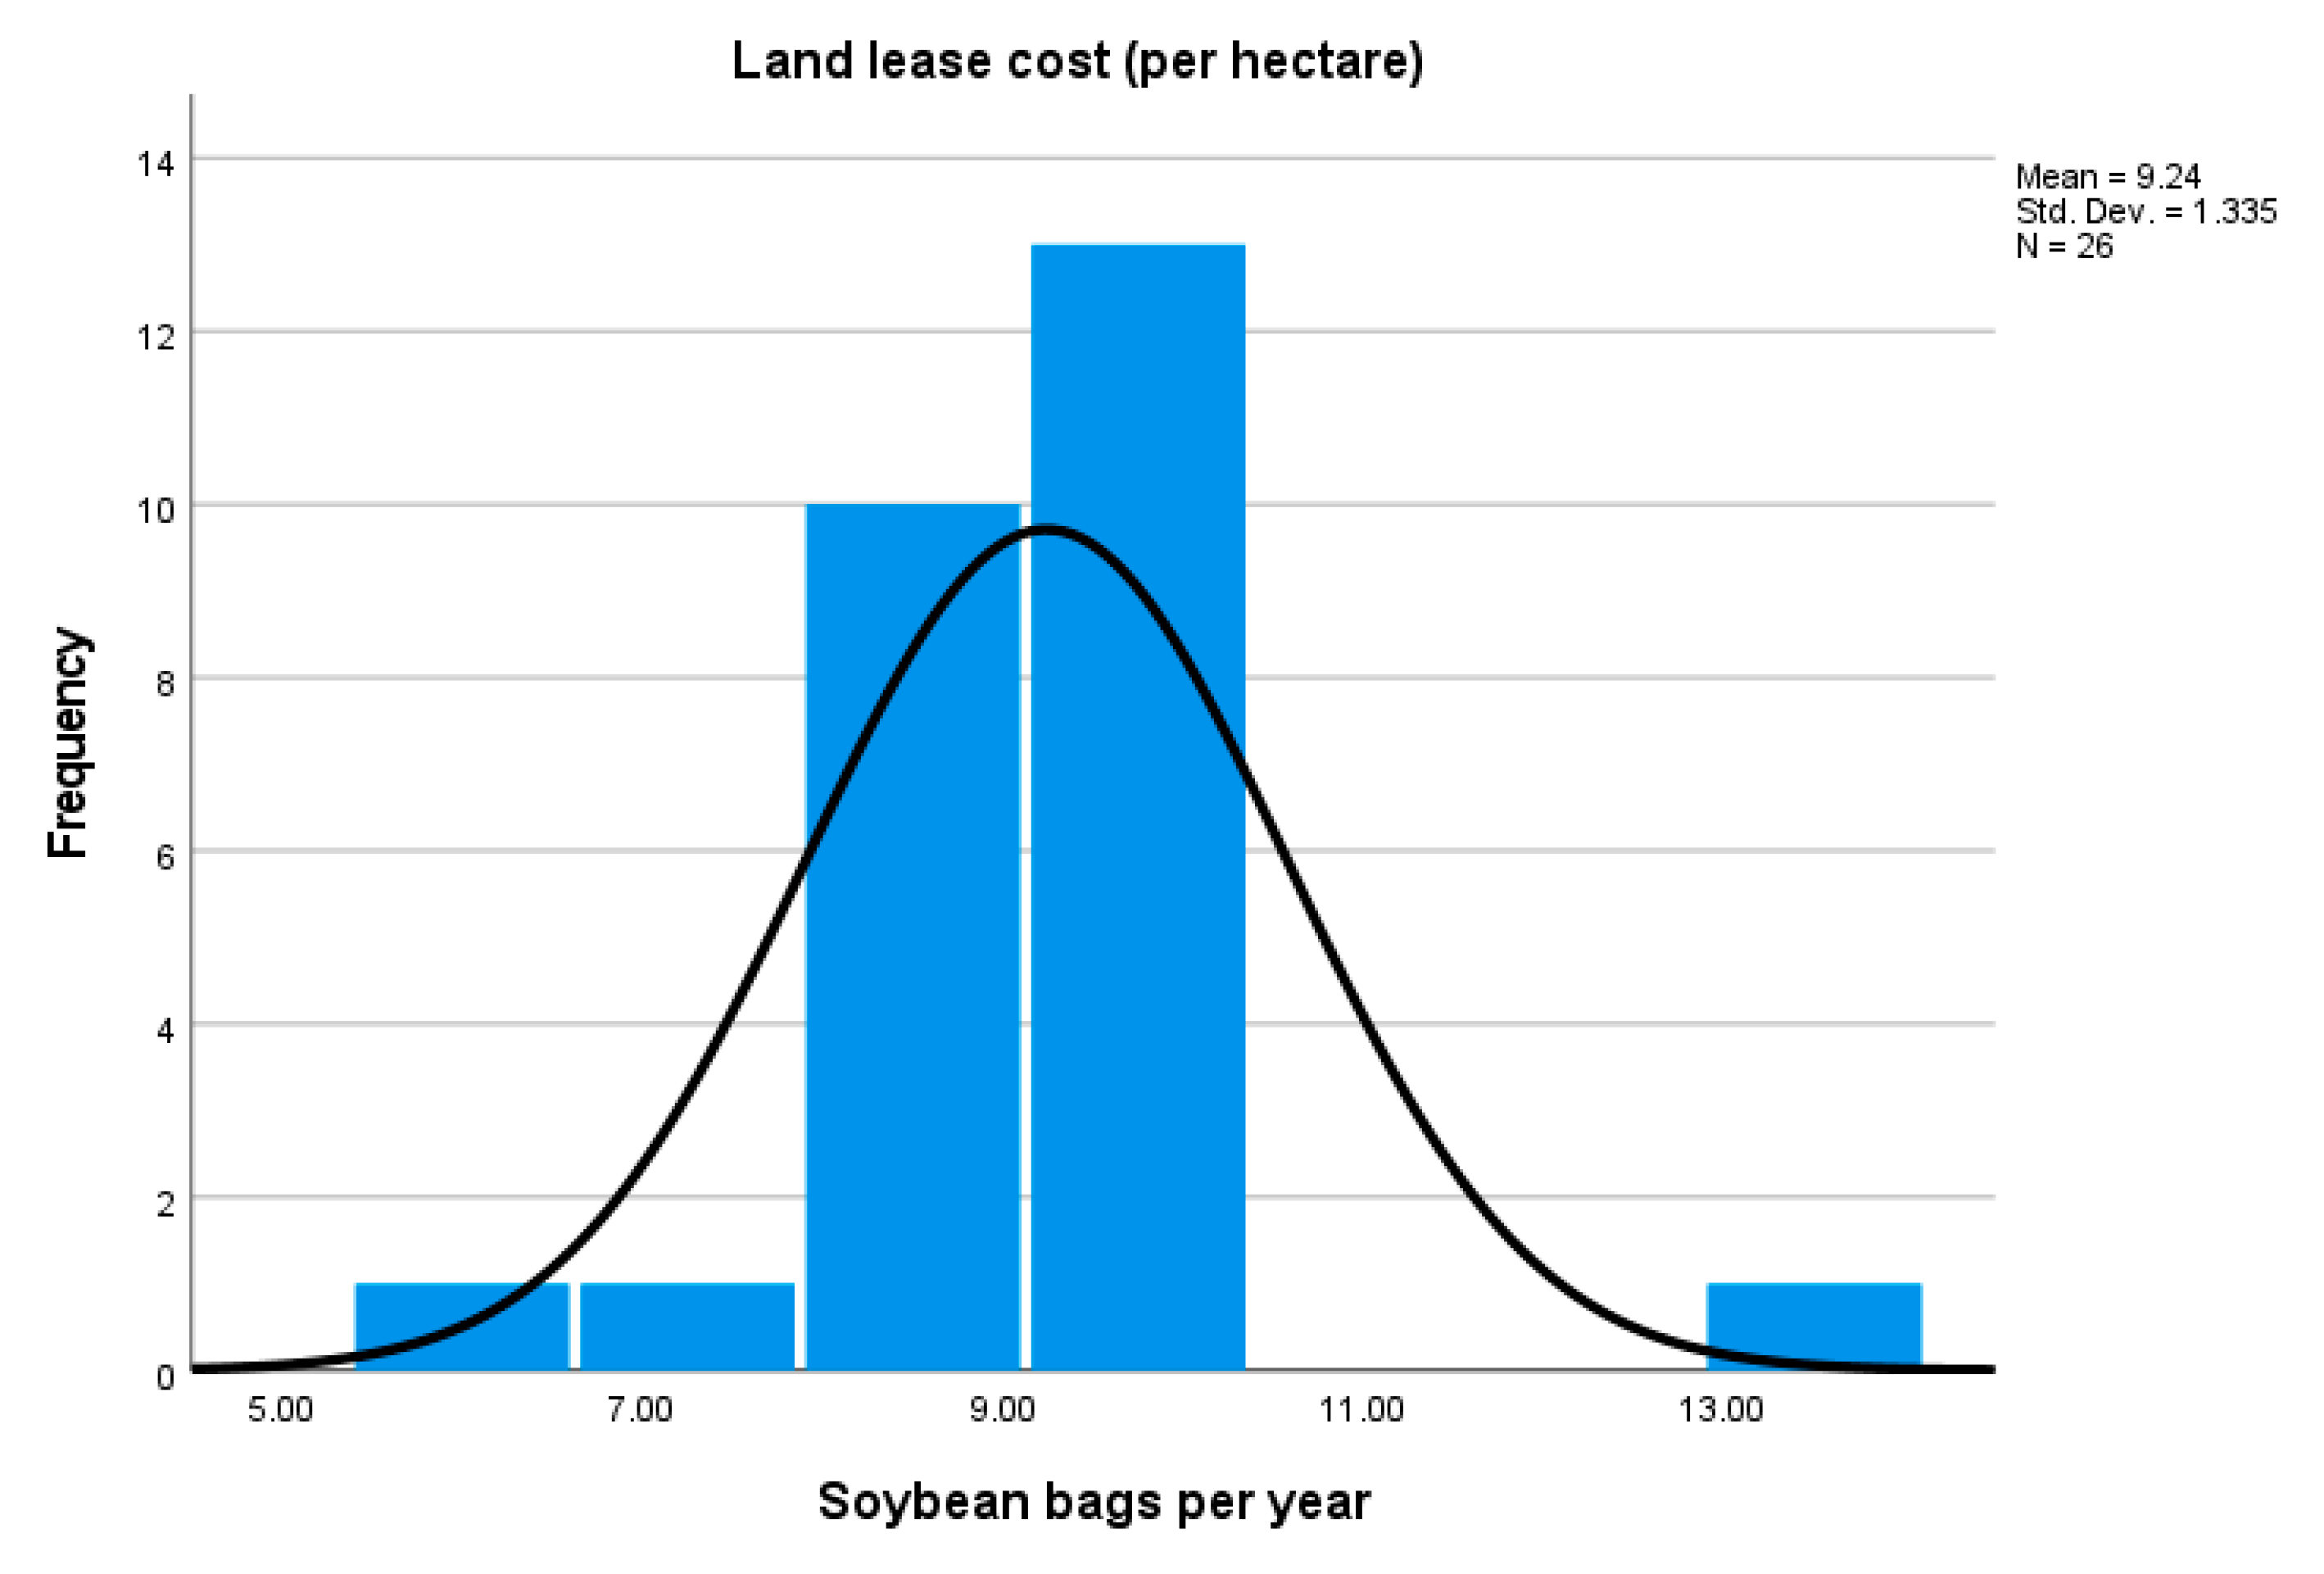
Figure 8.
Weekly performance of the bushel (ZS1) listed on the CBOT over the last five years, from November 2019 to November 2024, in the continuous futures contract format.
Figure 8.
Weekly performance of the bushel (ZS1) listed on the CBOT over the last five years, from November 2019 to November 2024, in the continuous futures contract format.
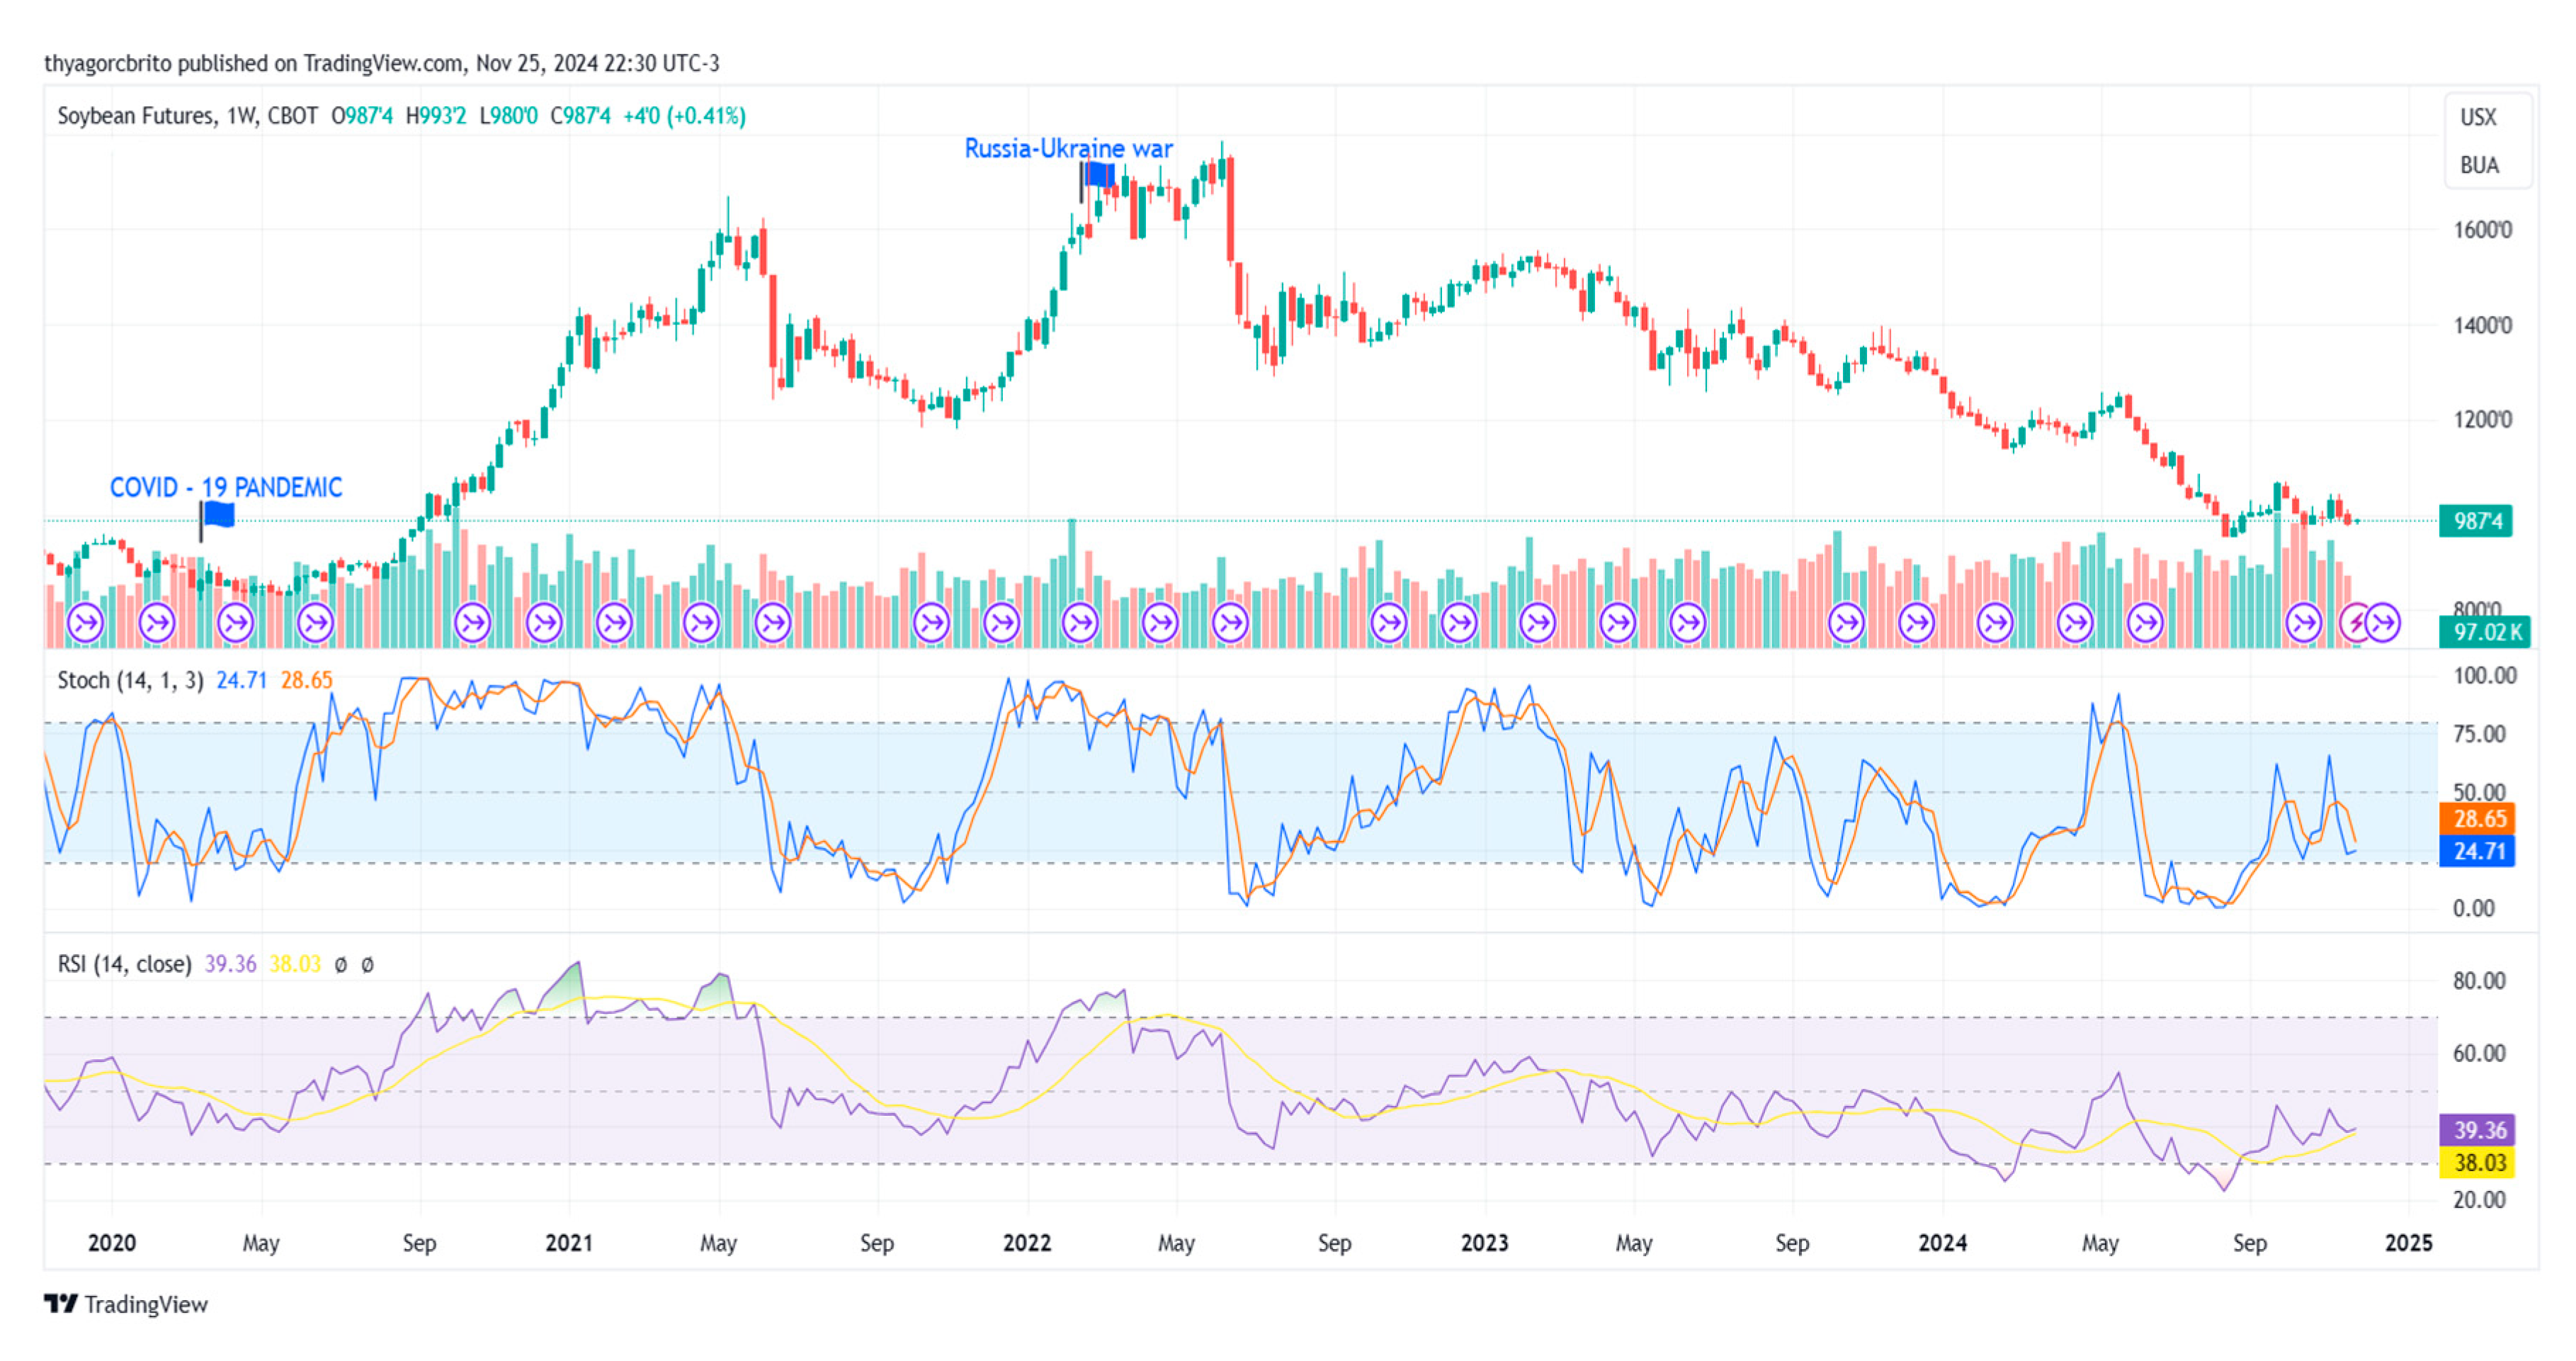
Figure 9.
Weekly performance of the exchange rate (USD vs. BRL) over the last five years, from November 2019 to November 2024.
Figure 9.
Weekly performance of the exchange rate (USD vs. BRL) over the last five years, from November 2019 to November 2024.
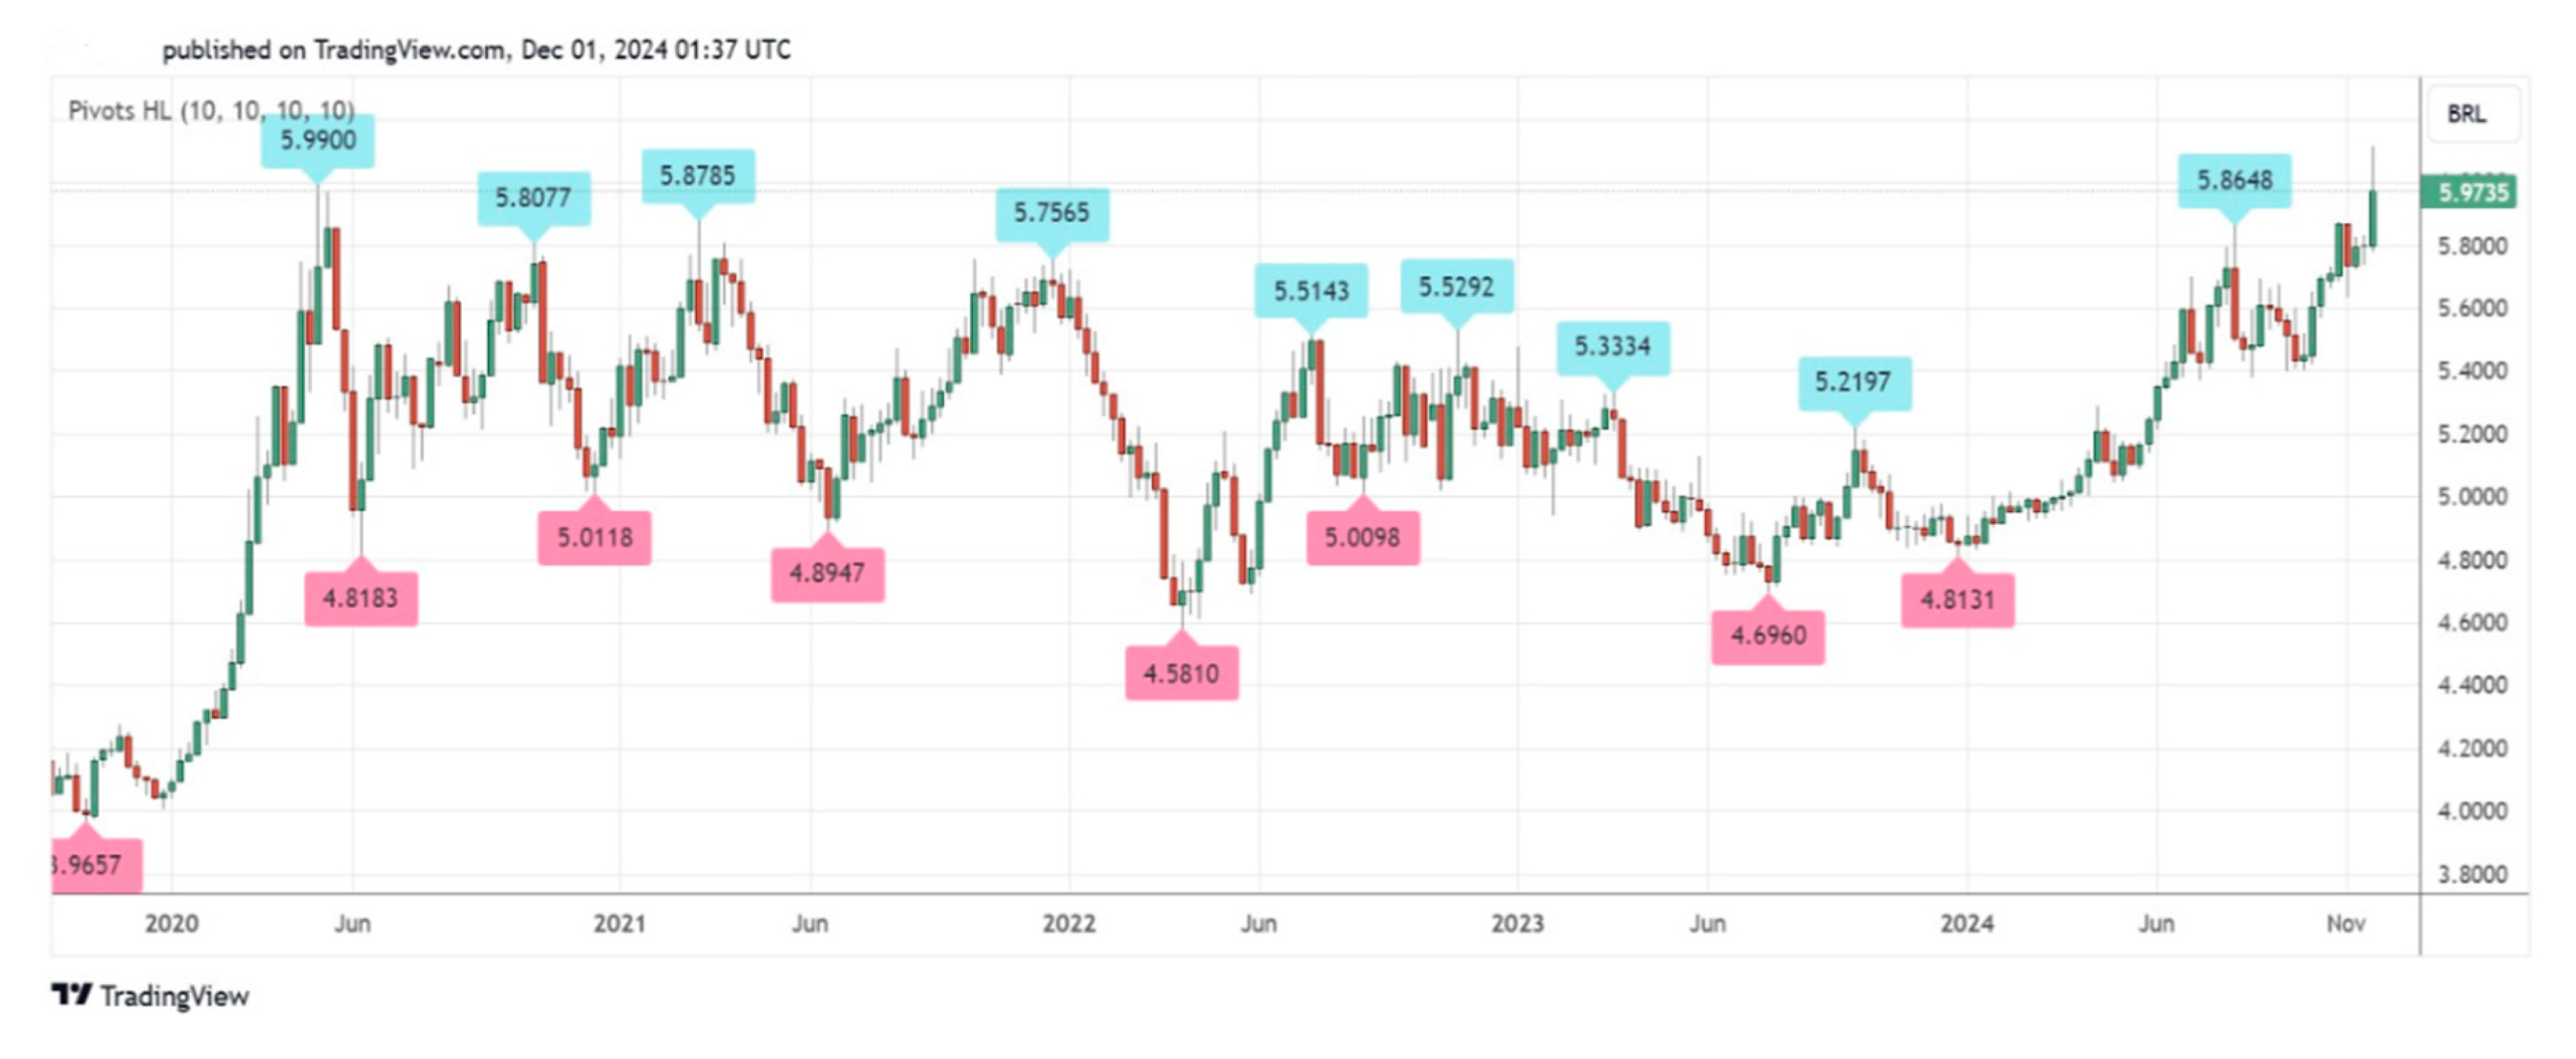
Figure 10.
Evolution of soybean exports (volume and FOB value in US $) and main soybean destinations from three microregions near the study area (Paragominas, Tomé-Açu, and Belém) from 1996 to 2023 according to EMBRAPA. Source: extracted and adapted from [32].
Figure 10.
Evolution of soybean exports (volume and FOB value in US $) and main soybean destinations from three microregions near the study area (Paragominas, Tomé-Açu, and Belém) from 1996 to 2023 according to EMBRAPA. Source: extracted and adapted from [32].
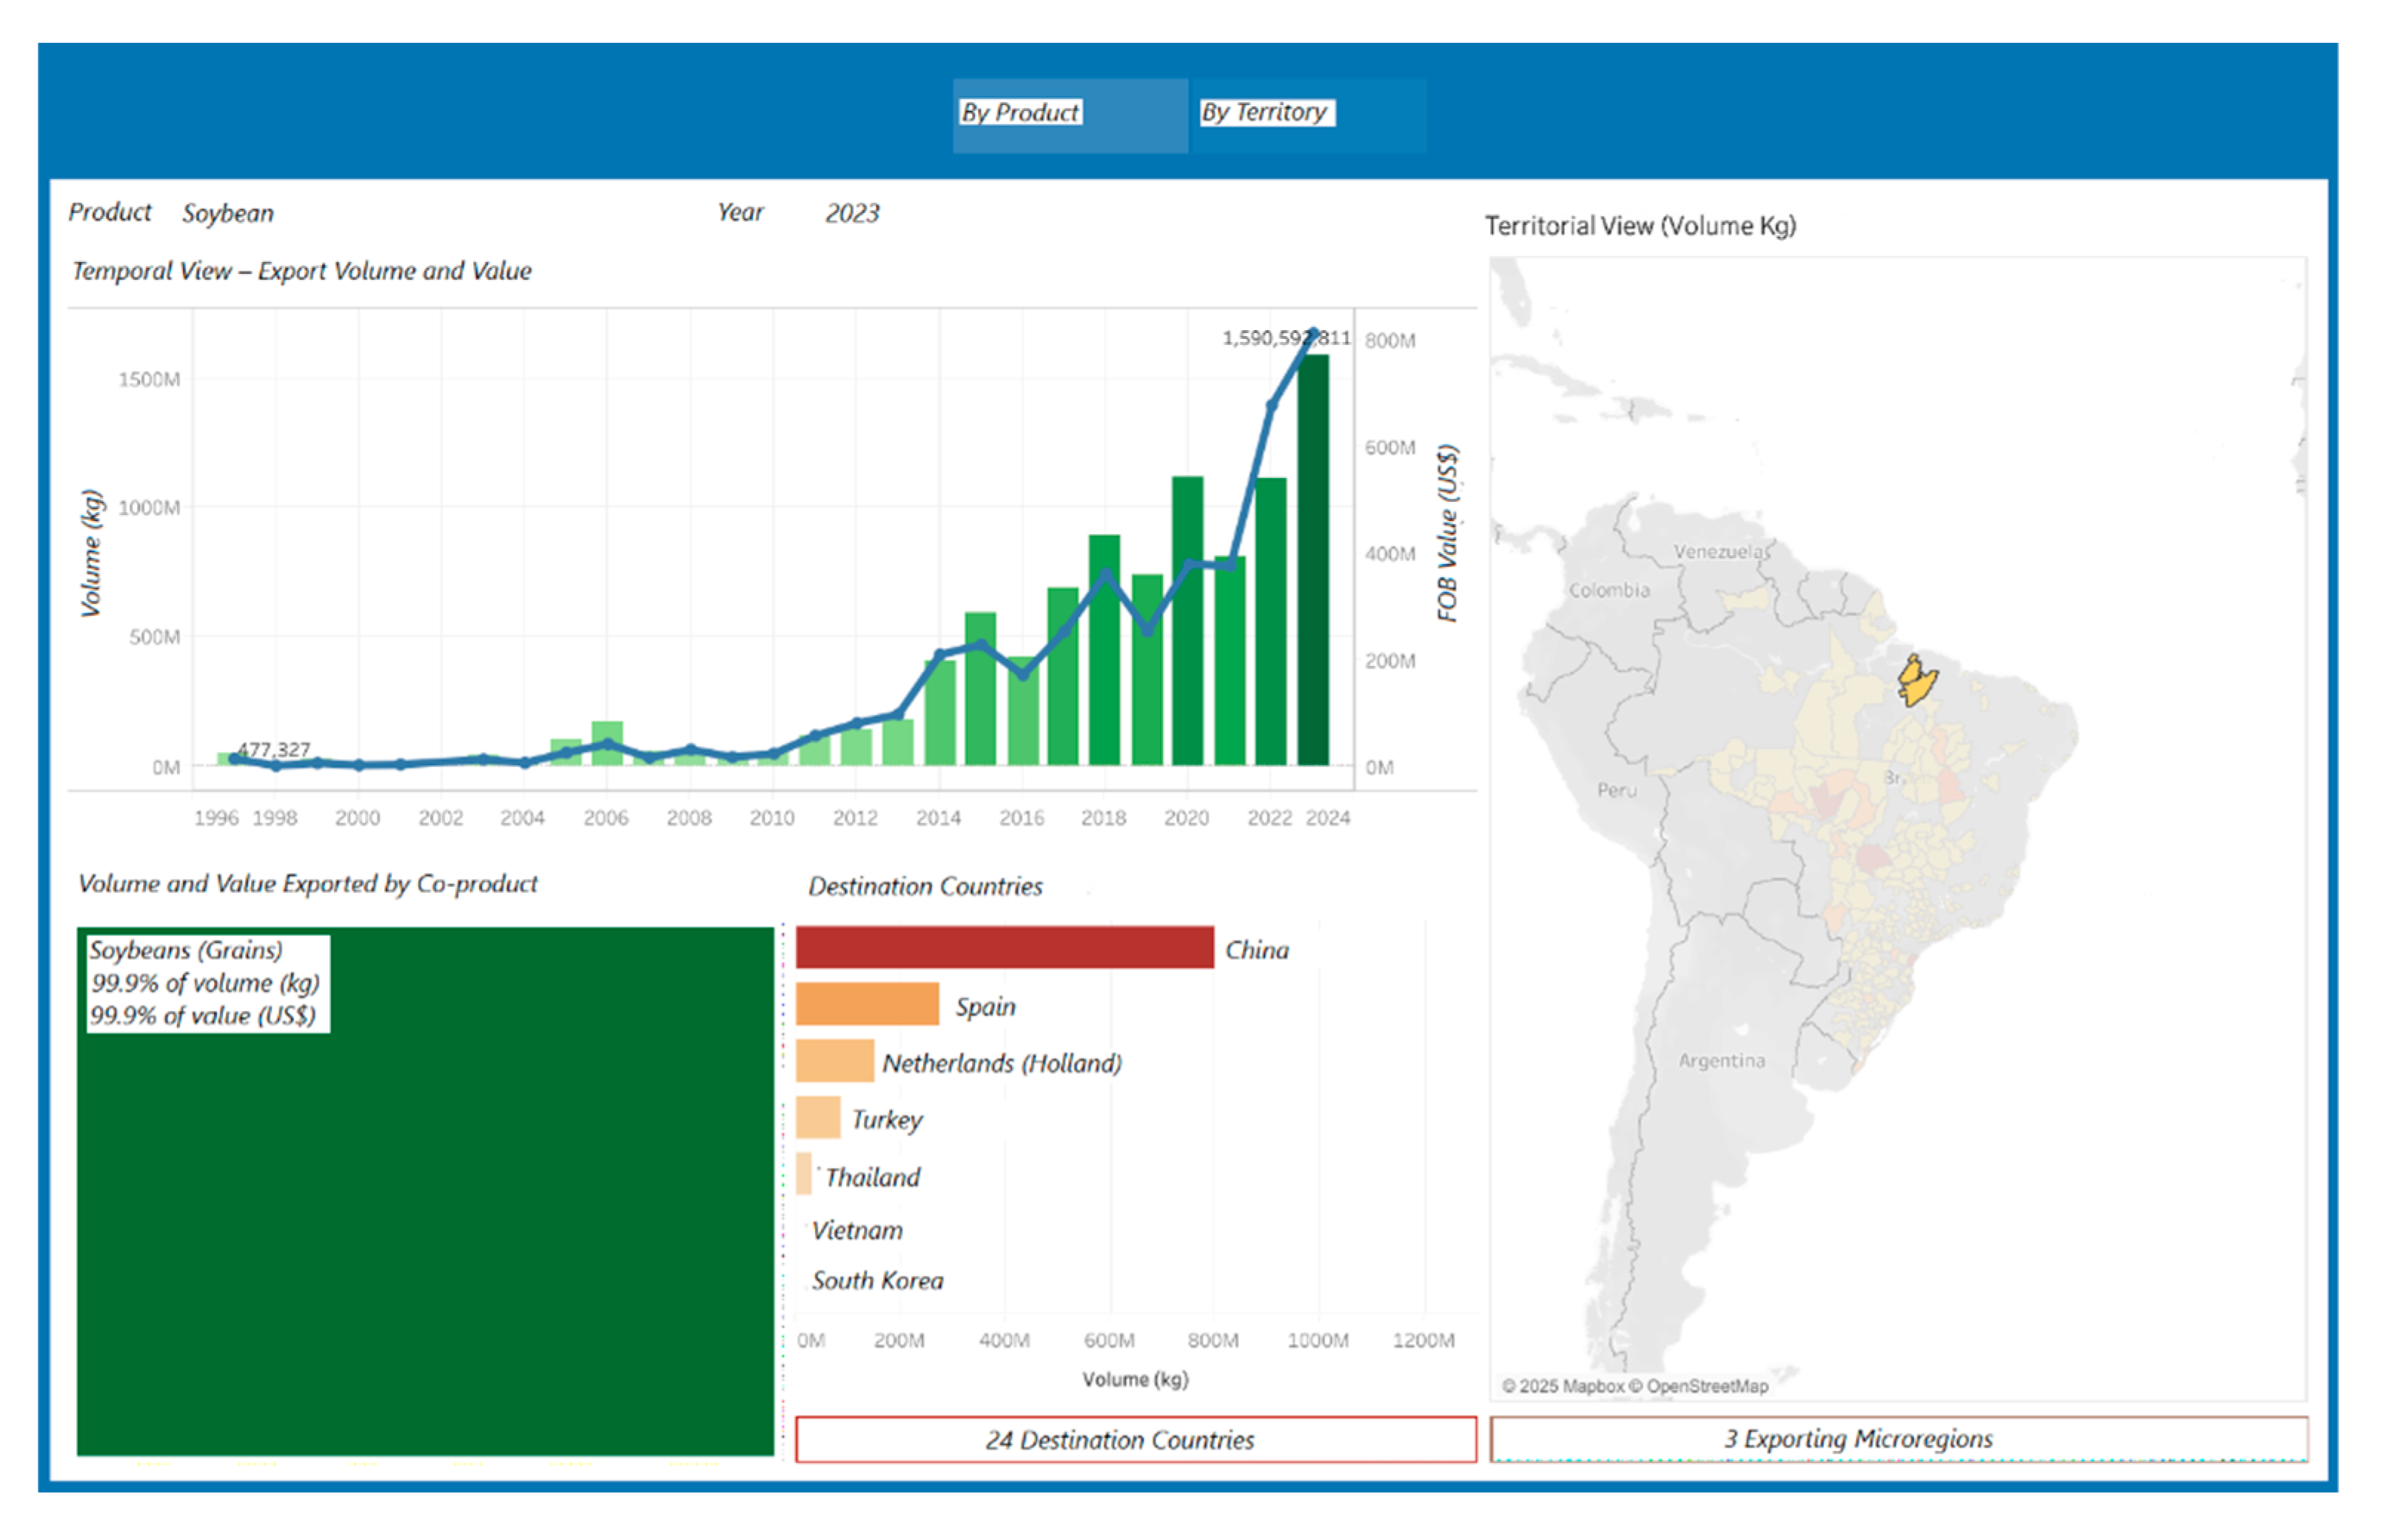
Figure 11.
(a) Honey bee (Apis mellifera) visiting a flower of sesame (Sesamum indicum) sown in the off-season crop; (b) Maize (Zea mays) intercropped with Brachiaria ruziziensis grass in the off-season; (c) Soybean in reproductive stage (R6 – seed maturation) sown under sorghum straw; (d) Cattle (Bos taurus indicus) grazing on B. ruziziensis pasture formed after soybean harvest; (e) Incorporation of limestone in the conventional tillage system; (f) Sorghum (Sorghum bicolor) second crop freshly harvested with other crops ready to harvest (side by side).
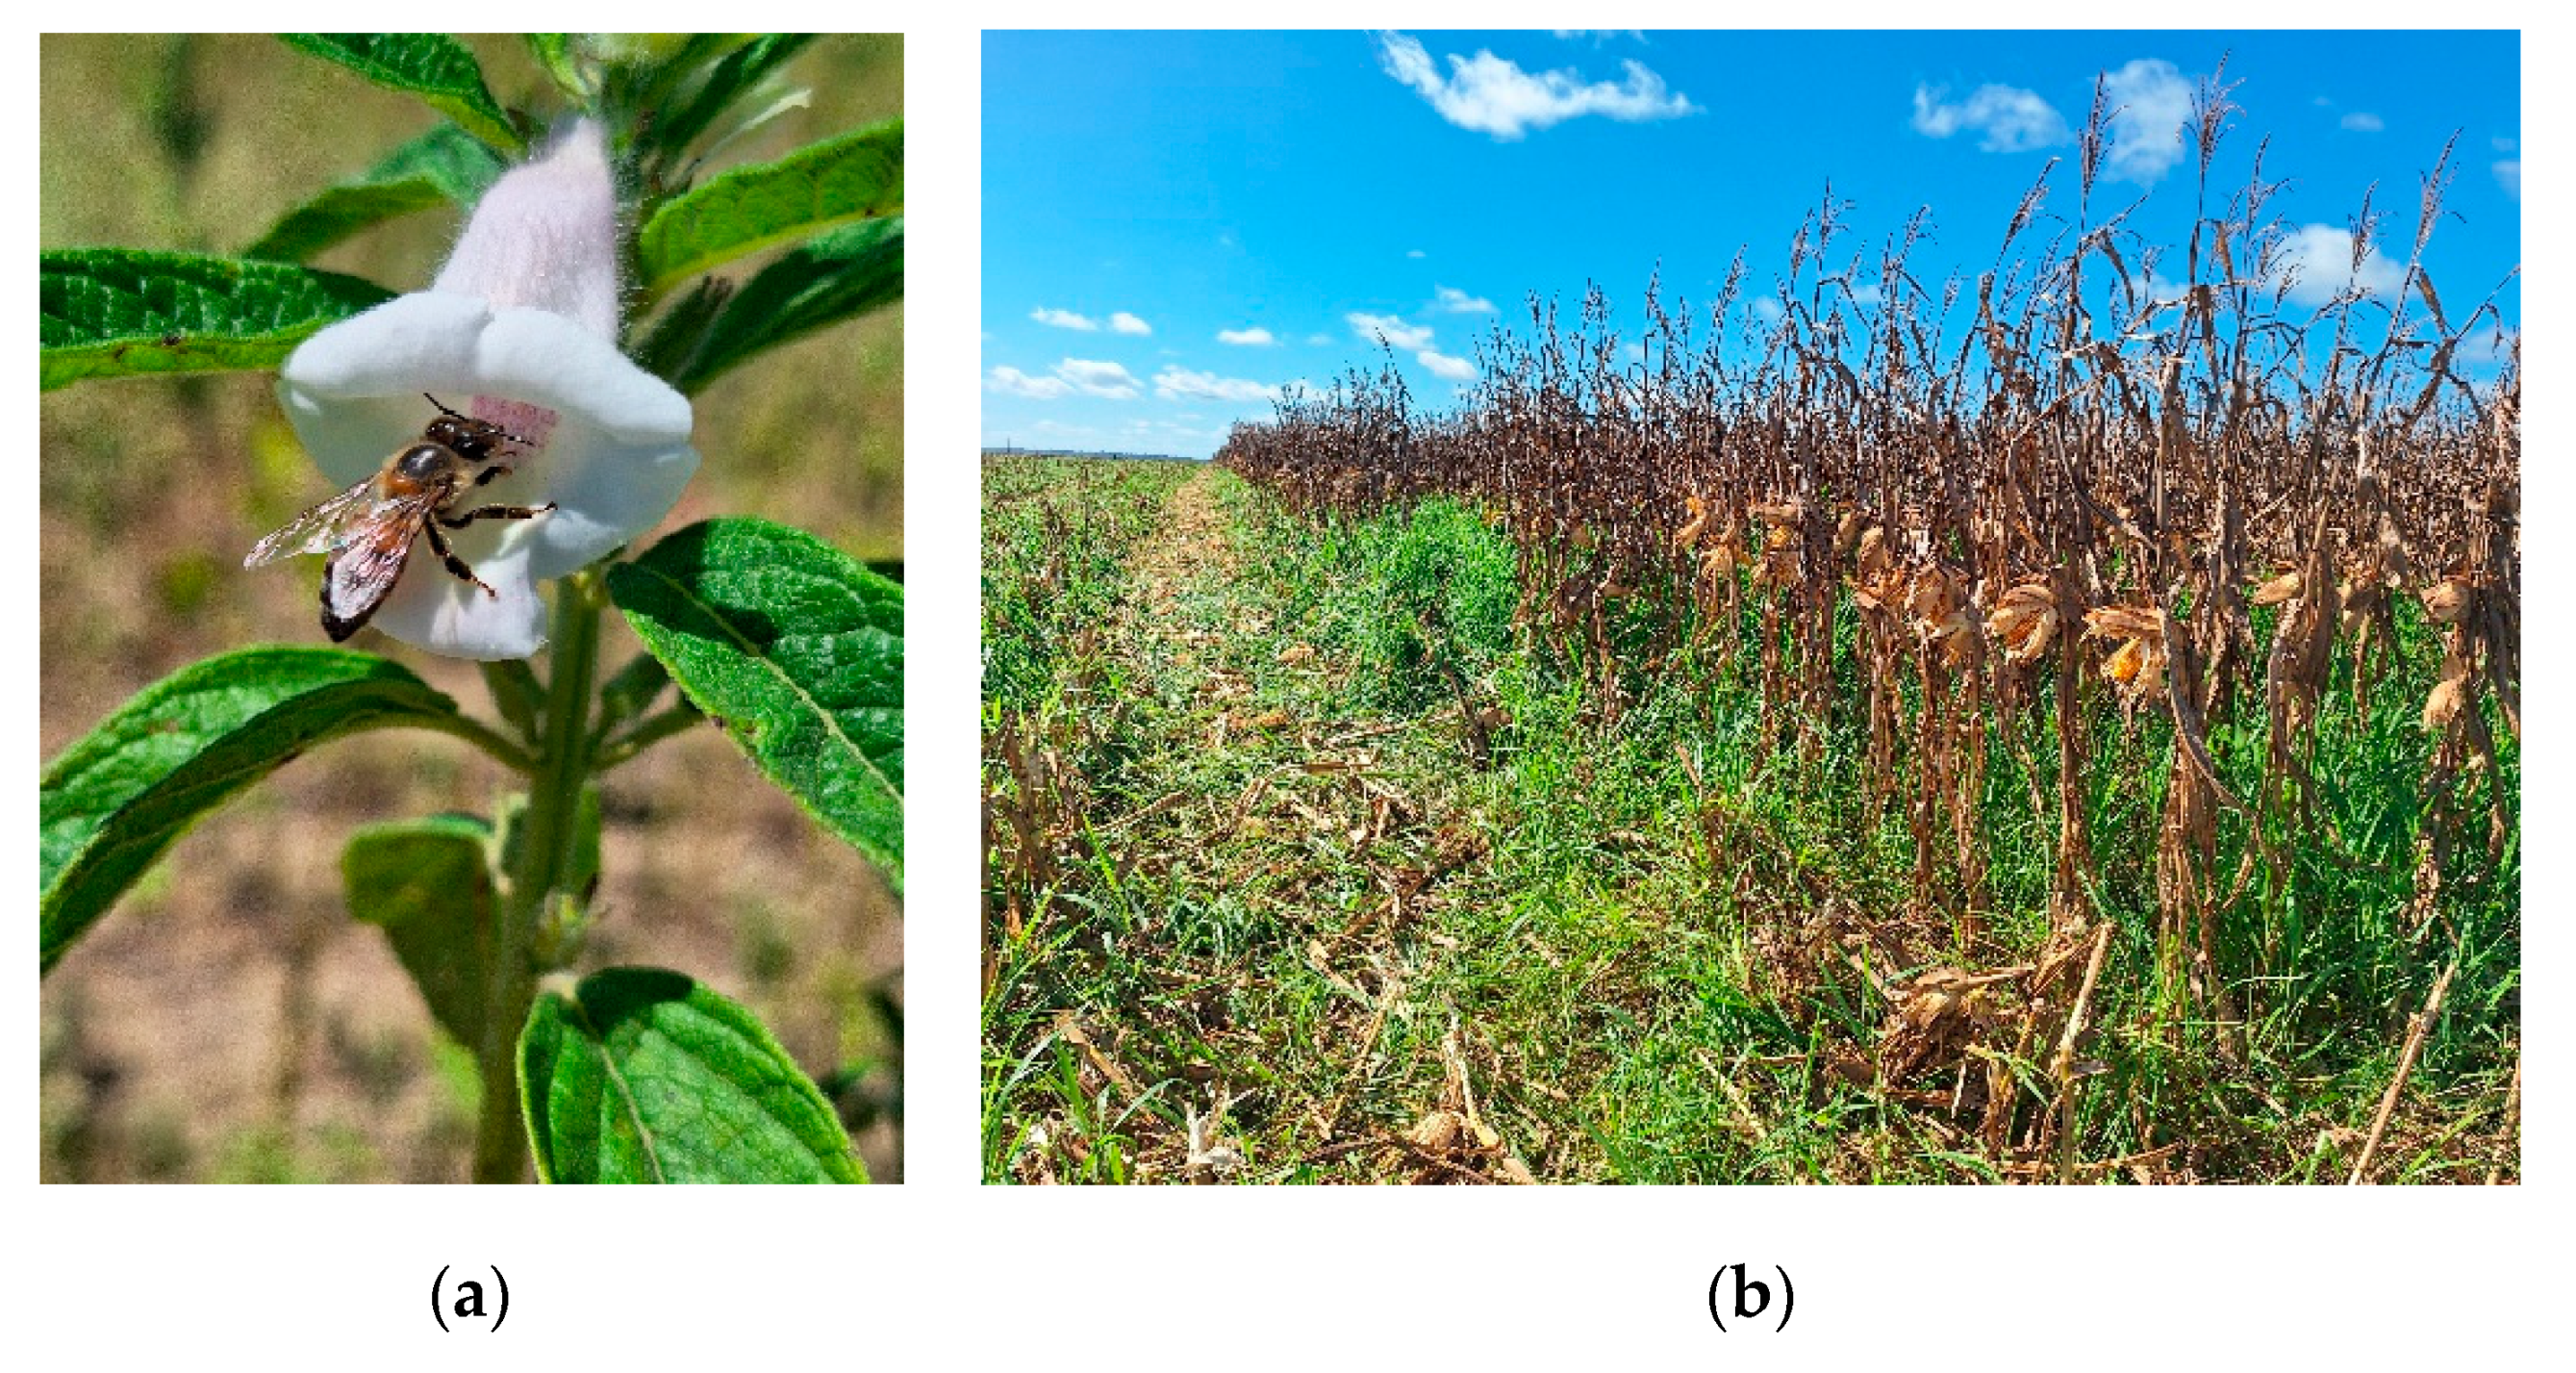
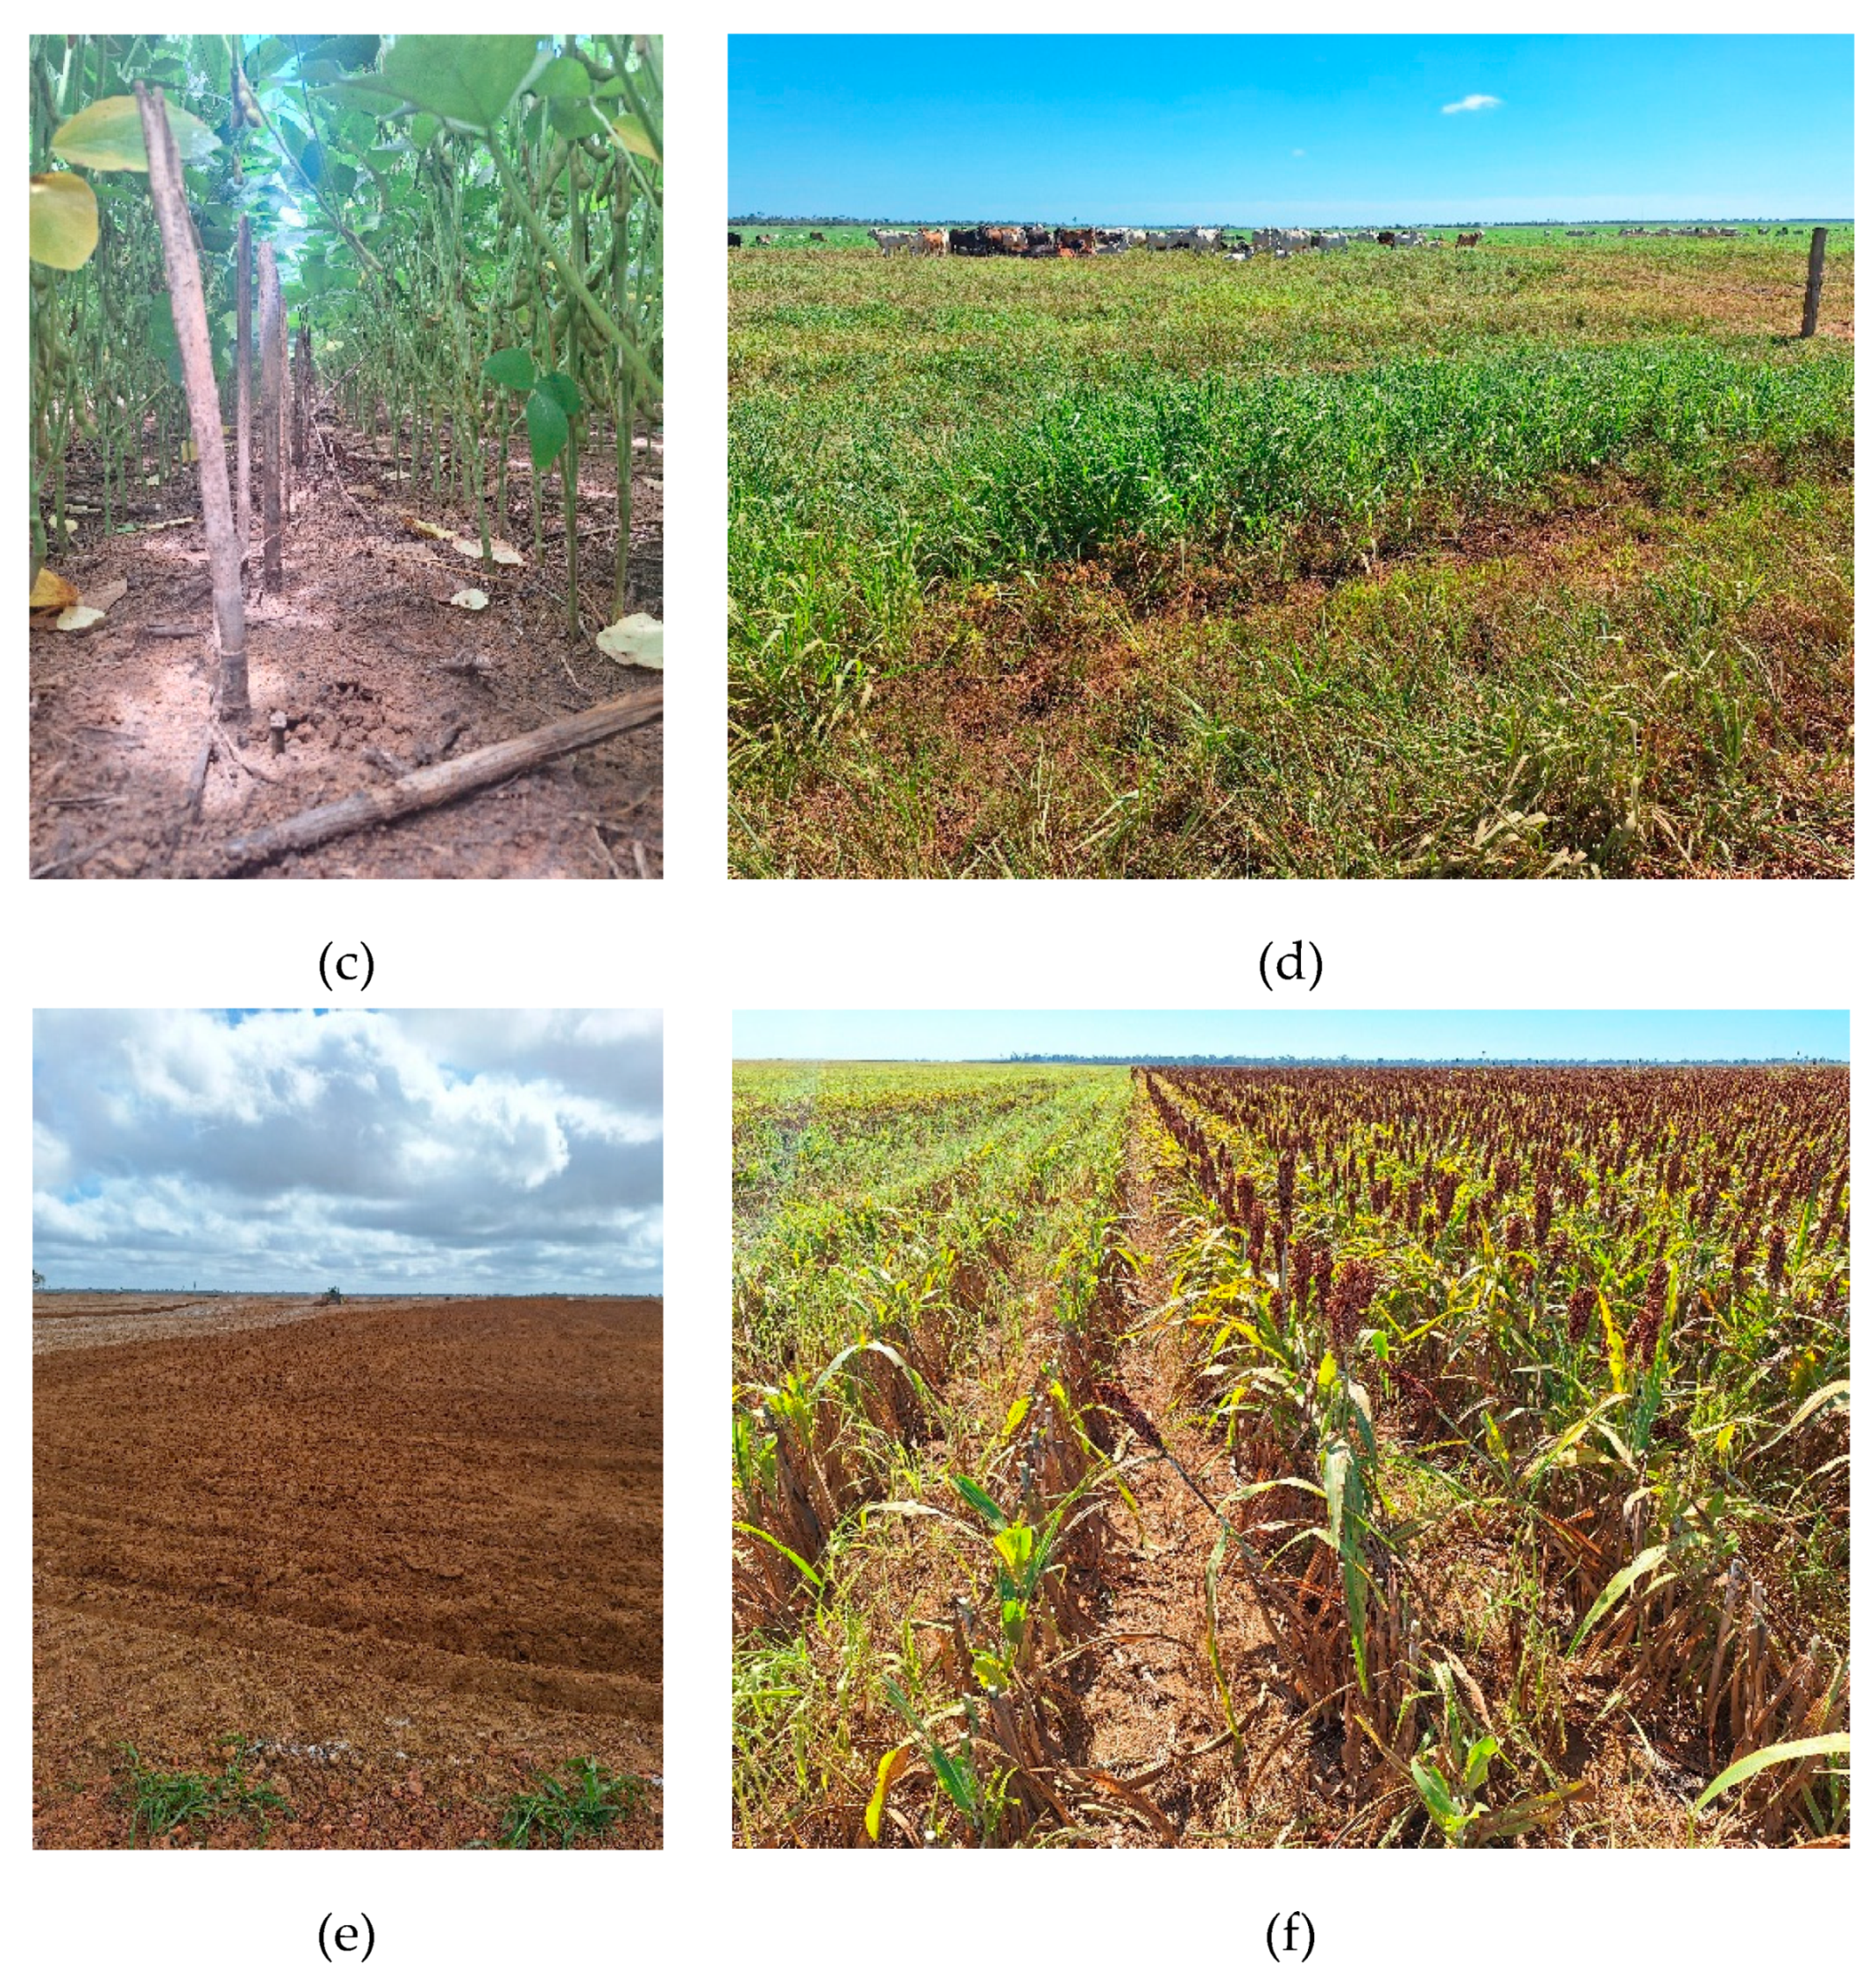
Figure 12.
Soybean plant showing symptoms of “Soja Louca II” (Green Stem and Foliar Retention, GSFR) in the Paragominas pole during the 2024/2025 crop season.
Figure 12.
Soybean plant showing symptoms of “Soja Louca II” (Green Stem and Foliar Retention, GSFR) in the Paragominas pole during the 2024/2025 crop season.
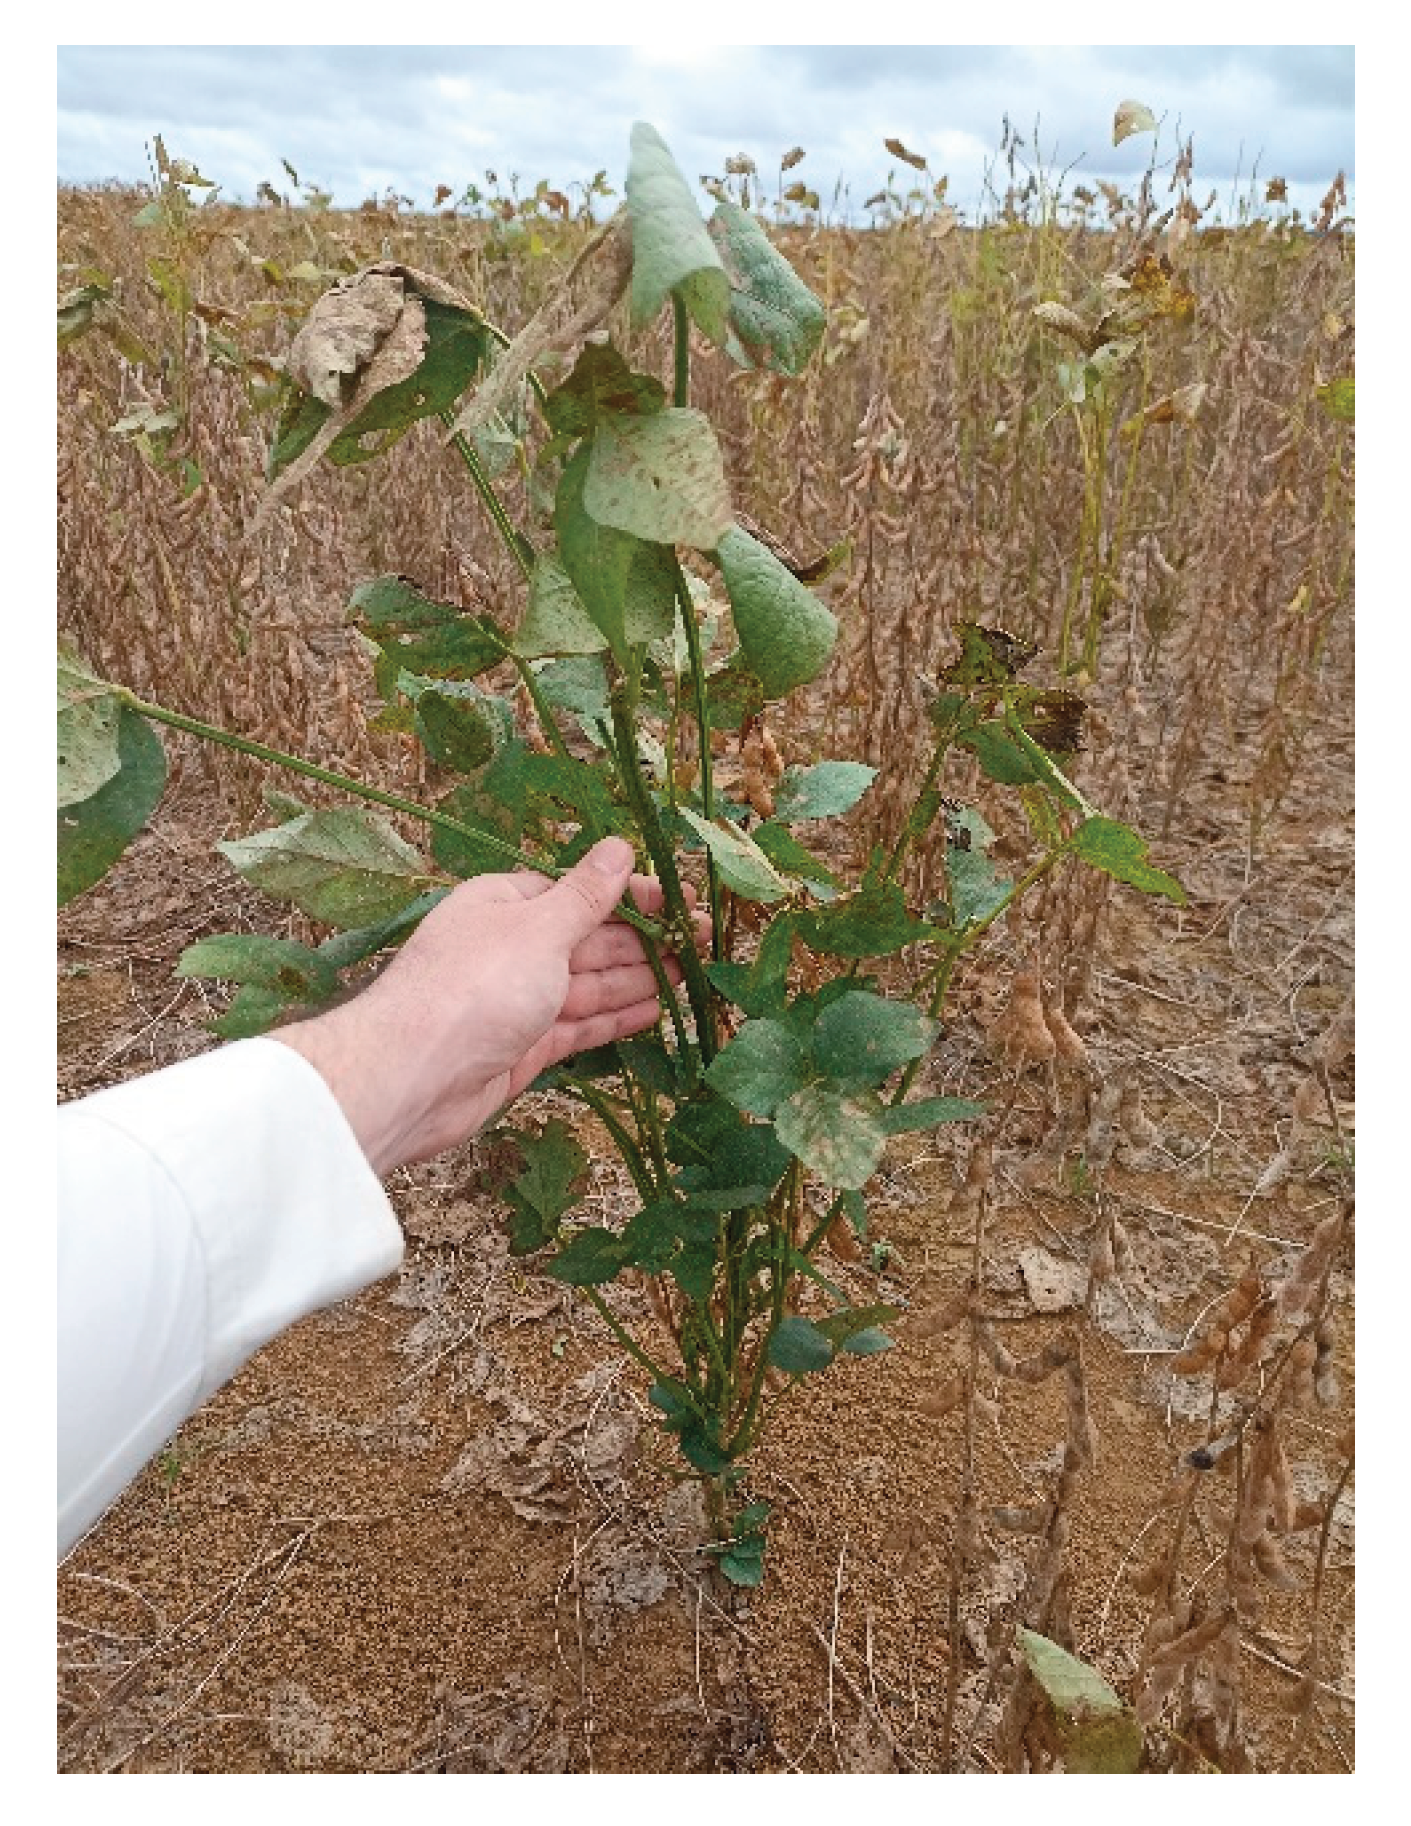

Table 1.
Export sales query system, outstanding sales in the last five years, from US soybeans to China.
Table 1.
Export sales query system, outstanding sales in the last five years, from US soybeans to China.
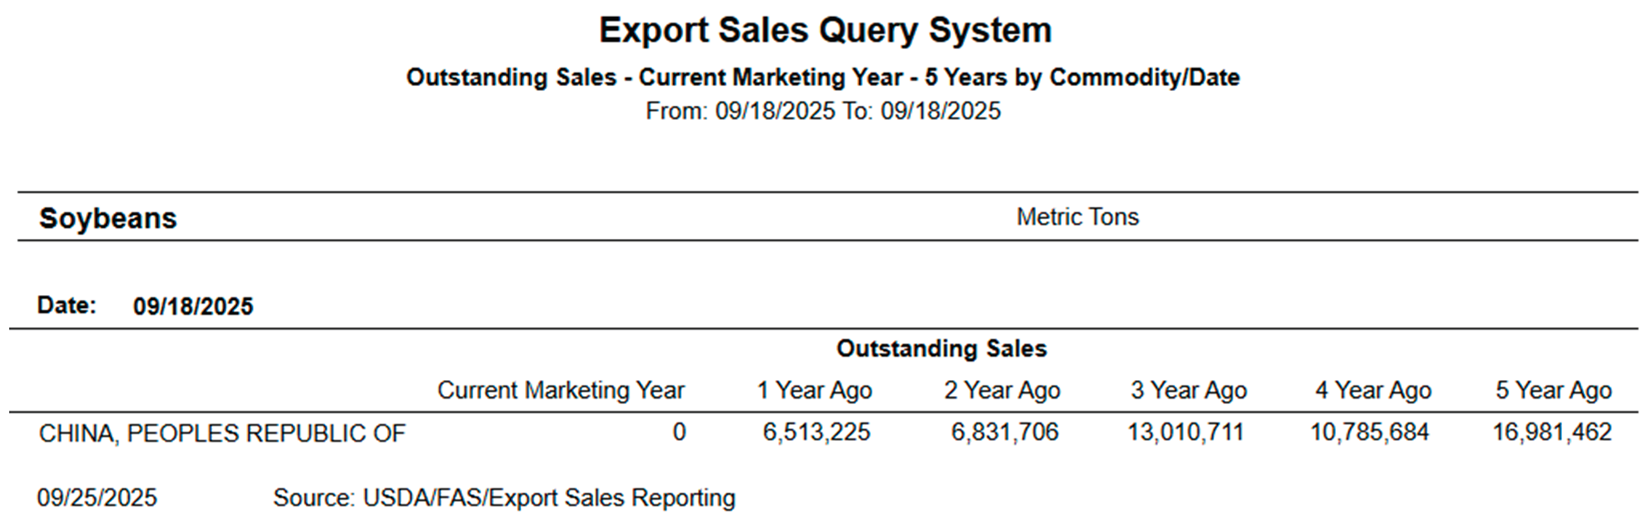 |
Source: Extracted from the United States Department of Agriculture [33].
Disclaimer/Publisher’s Note: The statements, opinions and data contained in all publications are solely those of the individual author(s) and contributor(s) and not of MDPI and/or the editor(s). MDPI and/or the editor(s) disclaim responsibility for any injury to people or property resulting from any ideas, methods, instructions or products referred to in the content. |
© 2025 by the authors. Licensee MDPI, Basel, Switzerland. This article is an open access article distributed under the terms and conditions of the Creative Commons Attribution (CC BY) license (http://creativecommons.org/licenses/by/4.0/).
Copyright: This open access article is published under a Creative Commons CC BY 4.0 license, which permit the free download, distribution, and reuse, provided that the author and preprint are cited in any reuse.


