
Submitted:
05 November 2025
Posted:
05 November 2025
You are already at the latest version
Abstract
Arboviruses spread in urban tropics under climate change. We designed intelligent systems to predict cases and breeding sites of Aedes‑borne diseases in Recife, Brazil. We linked surveillance and climate data from APAC, INMET, LIRAa, and Recife’s Open Data Portal. We modeled 2013–2021 cases and 2009–2017 breeding sites. We generated spatial fields with inverse distance weighting. We built bimonthly training grids with 5,000 points and validation grids with 50,000 points. We tested linear regression, random forests, multilayer perceptrons, support vector regressors, and extreme learning machines in Weka and PyRCN. We ran 30 repetitions with cross‑validation. Random forests performed well. Multilayer perceptrons reached very high correlations but needed longer training. Polynomial SVMs reached near‑perfect accuracy but required very high computation. Single‑layer extreme learning machines delivered the best trade‑off, with low errors, correlations near 1.0, and short training times. The models produced fine‑scale risk predictions and highlighted priority areas. The findings support earlier, targeted control and guide public health plans in Recife.
Keywords:
Dengue
; Chikungunya fever
; intelligent systems
; prediction methods
; climate change
1. Introduction
Arboviruses remain one of the most persistent and complex public health problems in Brazil. Dengue (DENV), Chikungunya (CHIKV), and Zika (ZIKV) stand out as major threats, especially for approximately 3.9 billion people living in tropical and subtropical areas where environmental conditions favor the development and proliferation of Aedes aegypti and Aedes albopictus, mosquitoes that transmit the viruses of these arboviruses [1].
About half of the world's population is now at risk of dengue with an estimated 100–400 million infections occurring each year [2]. Due to reporting and diagnostic challenges, the number of people affected by CHIKV is underestimated. Between 1 January and 4 March 2023, a total of 113,447 cases of chikungunya were reported in the Region of the Americas, including 51 deaths, representing a four-fold increase in cases and deaths compared to the same period in 2022 [3].
Dengue is endemic in many regions of the country and causes repeated outbreaks with high numbers of cases and hospitalizations every year. The recent arrival of CHIKV and ZIKV in the Americas made the situation worse. These viruses can lead to severe complications like chronic arthritis, microcephaly, and even death [4].
Climate change intensifies this problem. Rising temperatures, extreme weather, and shifting rainfall patterns create better conditions for mosquito Aedes to spread. Arboviruses now reach more areas and persist for longer periods. Effective response requires new strategies that combine innovation and prediction. Understanding how climate, environment, and disease patterns interact is crucial to anticipate outbreaks and shape public policy [5].
These diseases place a heavy burden on Brazil’s public health system (SUS). They also cause major social and economic damage. Sick individuals miss work or school. Hospitals become overcrowded. Costs rise for both the government and the population. The overall quality of life declines [6].
In Brazil, the Rapid Indices Survey for Ae. aegypti (LIRAa) is an entomological surveillance method adopted by the Ministry of Health to determine Ae. aegypti infestation rates quickly and in a timely manner. Municipalities conduct larval surveys to calculate the Breteau index and the building infestation index. The indices predominantly identify breeding sites and are used as indicators for vector control [7,8]. Females of Ae. aegypti can lay eggs in different locations that retain water with varying degrees of cleanliness, resist drought, adapt to warmer climates and increasing altitudes [9,10]. Global climate change has been highlighted as one of the main causes of the increase in arbovirus cases [11]).
There are currently several methods for controlling the reproduction of Ae. aegypti, leading to a reduction in the number of cases of diseases related to it. One way to control this disease is to inspect and neutralize the places where Aedes lays its eggs [10,12]. Research to help identify likely areas at risk for the proliferation of Ae. aegypti breeding sites in Brazil has been carried out and considered as yet another tool for public health professionals and in demonstrating how it can be applied to help resolve public health challenges [11,12,13,14,15].
This article outlines the scope and contributions of the study titled "Development of Intelligent Systems for the Prediction and Diagnosis of Arboviruses Transmitted by Aedes aegypti in the Context of Climate Change." The project focuses on building smart systems that use climate and epidemiological data to predict when and where outbreaks will happen. It also aims to improve clinical diagnosis. The central research question is: “How early can we predict an arbovirus outbreak using climate and surveillance data through AI?” By exploring this question, the study seeks to offer practical tools to enhance disease surveillance, optimize resource use, and reduce the impact of arboviruses on public health in Brazil.
2. Materials and Methods
2.1. Study Type and Area
We conducted an ecological study in Recife, Pernambuco, from 2013 to 2023. The city is divided into 94 neighborhoods, grouped into six Political-Administrative Regions (RPA). In the health sector, a new territorial organization was established in 2014, with the creation of two new health districts, separating the two most populous districts. This restructuring of management processes and healthcare delivery is a priority [16]. In 2022, Recife had an estimated population of 1,488,920. The city covers 218.843 km². Population density reached 6,803.60 inhabitants/km² [17].
2.2. Study Population and Data Source
We used four data sources:
- APAC Geographic Information System (SIGH-PE). We exported rainfall and fluviometric records. Variables included rainfall (mm) and dam status. APAC publishes real-time data.
- INMET Meteorological Database for Teaching and Research (BDMEP). We extracted monthly averages of air temperature and wind speed from the Recife conventional station (A301). INMET provides digital files that follow international technical standards. We used the APAC and INMET series from 2009–2021.
- LIRAa Recife. We used the Rapid Survey of Indices for Aedes aegypti (LIRAa). The dataset reports infested locations and the Building and Breteau indices. Entomological surveillance teams collect these data. The Open Data Portal of Recife publishes the files. To predict breeding sites, we used 2009–2017.
- Arbovirus cases. We obtained dengue, Zika, and chikungunya cases from the Open Data Portal of Recife. The portal lists each reported case. To predict cases, we used 2013–2021.
Data access and availability. We complied with open-data policies and obtained permission from the responsible institutions. INMET and APAC publish data on public portals. We exported the required datasets. The Open Data Portal of Recife offers public access and supports downloads of health datasets.
2.3. Preprocessing
Data preprocessing was performed using Python, version 3.13.0. [20]
2.3.1. Arboviruses Dataset
Recife’s Open Data Portal provides records of dengue, Zika, and chikungunya cases. The dataset lists patient symptoms. It also includes sex, date of birth, and neighborhood of residence. We organized the data by year and by two-month period. The municipal health system uses the same two-month cycle for prevention policies. For each two-month period in each year, we summed suspected and confirmed cases for every neighborhood in Recife.
2.3.2. Breeding Sites Dataset
Data on mosquito breeding sites are available bimonthly and not by neighborhood. To record breeding sites and other LIRAa indices, the Health Department divides the city into health districts. Each health district contains a certain number of strata. Furthermore, each stratum contains a certain number of neighborhoods within the stratum (Figure 1). In other words, a stratum can contain one or more neighborhoods. The number of neighborhoods per stratum is determined mainly by their sociodemographic characteristics [21].
Therefore, to obtain information on breeding sites by neighborhood, we assumed that neighborhoods belonging to the same stratum would have the same number of mosquito breeding sites.
2.3.3. Climatic Variables
From the APAC database, we obtained data on the monthly rainfall distribution in the city of Recife. Other climatic variables such as the monthly data on relative humidity, wind speed, and average temperature were obtained from the INMET database. To estimate the distribution of climatic variables in Recife's neighborhoods, we used the Gaussian distribution represented by Equation 1. In this equation represents the variance, and represents the mean of the distribution.
Where , in Equation 2, represents the maximum measurement value. In the case of rainfall monitoring, we used the records from the three APAC monitoring stations. Therefore, for rainfall indices, the maximum value considered was the highest value recorded among the three stations. Similarly, the mean value considered was the mean of the values recorded among the three stations.
2.3.4. Prediction Datasets
We built prediction sets for arbovirus cases and for breeding sites. We combined spatial distributions of climate variables with the predictor variable (arbovirus cases or breeding sites). We generated spatial maps with Inverse Distance Weighting (IDW) in the Terra library, version 1.8.42 [22], under R, version 4.4.3 [23].
For each task, we created two sets: a training/testing set with a 5,000-point interpolation grid and a validation set with 50,000 points. We overlaid the distribution maps of each variable to assemble both sets. For each latitude–longitude pair, we concatenated, in order: 1) the bimonthly count of cases (or breeding sites); 2) for each month in the two-month period, the monthly fields of temperature, precipitation, wind speed, and relative humidity. Each prediction set included data from the six bimonthly periods before the prediction period. Figure 2 shows the workflow to build the prediction sets.
Therefore, for arbovirus case prediction, 48 training/test sets with 5,000 instances and 47 attributes were created. For mosquito breeding site prediction, we obtained 48 training/test sets, also with 5,000 instances and 47 attributes. The datasets with 50,000 instances (for both case and breeding site prediction) were used to evaluate the best-performing model. Thus, we generated 48 validation sets for both case and mosquito breeding site prediction.
2.4. Experiments and Evaluation Metrics
We evaluated the performance of several machine learning algorithms, including: linear regression, random forests, multilayer perceptron, support vector regressor, and extreme learning machines. We selected the regressor hyperparameters empirically, based on the research group's experience and the results of the existing literature [24,25]. The hyperparameter settings are described below:
- Random Forests (RF): 10-80, and 100 trees;
- Multilayer Perceptron (MLP): learning rate 0.3, momentum 0.2, 10-30 neurons in the hidden layer;
-
Support vector regressor:
- -
- Parameter C = 0.1;
- -
- Polynomial kernel: 1 (linear), 2 and 3 degrees;
- -
- Radial Basis Function (RBF) kernel: gamma = 0.01;
-
Extreme Learning Machines:
- -
- 1, 2, 5, and 10 layers; with 500, 700, 900, and 1000 neurons in each layer.
To evaluate the algorithms' performance, we used the Mean Absolute Error (MAE), Root Mean Square Error (RMSE), Relative Root Square Error (RRSE), Correlation Coefficient (R), and training time (in seconds). The errors are metrics for local quality, and the smaller the error, the more accurate the model. The correlation coefficient is a metric for global quality, and the higher the correlation coefficient, the greater the correlation between the model's predicted distribution and the actual distribution [26]. The training time, in turn, is a metric for the computational cost of the models; that is, the longer the training time, the greater the need for computational resources to generate the prediction model [27].
We use the Mean Absolute Error (MAE), Root Mean Square Error (RMSE) metrics, reducing the impact of extreme values and considering the overall distribution of values in the data. RMSE provides a relative measure of the effectiveness of the model, where a lower RMSE value indicates a more accurate fit of the model [28].
3. Results
3.4. Arboviruses Cases Prediction
The performance results of the models generated for predicting arbovirus cases are detailed in Table 1.
The model created with linear regression performed poorly in all metrics, with an average MAE of 0.646, average RMSE of 1.12, average RRSE of 36.857% and average correlation coefficient of 0.928, with an average training time of 0.044 seconds.
The models created with Random Forest showed good results overall. With MAE ranging from 0.191 to 0.227, RMSE from 0.454 to 0.530, RRSE from 15.226% to 18.005% and correlation coefficient from 0.984 to 0.990, with training time from 0.223 to 1.761 seconds. The configuration with 40 trees had the best performance, with MAE of 0.118, RMSE of 0.454, RRSE% of 15.492% and correlation of 0.990, with a training time of 0.852 seconds, all averages of the metrics (Table 2).

Table 3.
Prediction results for the number of breeding sites using Support Vector Machine models.
| MAE | RMSE | RRSE (%) | Correlation Coefficient | Training time (s) | |||||||
|---|---|---|---|---|---|---|---|---|---|---|---|
| Regression method | Setup | mean | std | mean | std | mean | std | mean | std | mean | std |
| SVM | polynomial kernel, p=1 | 0.514 | 0.211 | 1.231 | 0.560 | 41.243 | 10.357 | 0.907 | 0.044 | 38.135 | 6.673 |
| polynomial kernel, p=2 | 0.057 | 0.023 | 0.123 | 0.068 | 4.171 | 2.052 | 0.999 | 0.002 | 392.845 | 197.922 | |
| polynomial kernel, p=3 | 0.033 | 0.013 | 0.055 | 0.046 | 1.834 | 1.377 | 1.000 | 0.001 | 1423.400 | 838.156 | |
| polynomial kernel, RBF | 0.715 | 0.271 | 1.454 | 0.625 | 48.951 | 8.715 | 0.882 | 0.045 | 50.354 | 16.332 | |
The models created with Multilayer Perceptron (MLP) showed very good results in all configurations, and the average performance ranged from 0.097 to 0.114 for MAE, 0.156 to 0.181 for RMSE, 5.220% to 6.084% for RRSE% and 0.998 to 0.999 for correlation coefficient, with performance improving as the number of neurons increased. However, the training time varies from 69.651 to 124.706 seconds as the number of neurons increases (Table 4).
The reservoir computation models, Extreme Learning Machines (ELM), obtained very varied results, with the best results with 1 layer and the worst with 10 layers. The average performance variation ranged from 0.002 to 0.119 MAE, RMSE from 0.004 to 0.165, RRSE% from 2.386% to 101.475% and correlation coefficient from 0.298 to 0.999, with training time ranging from 0.268 to 4.599 seconds. The worst result was for a configuration with 10 layers and 1000 neurons in each layer. The best performance was achieved with a single layer with 1000 neurons, with the same correlation coefficient as the single layer with 900 neurons, but being slightly better for the other metrics and the training time (Table 5).
These results show the superiority of the models created with the single-layer reservoir computing paradigm. They obtained high correlation, low values for the location metrics and much shorter training times. This demonstrates the good computational cost ratio of these models for predicting Ae. aegypti breeding sites in the city of Recife.
4. Discussion
The present study included a large number of Aedes breeding sites with the aim of developing Intelligent Systems for the Prediction of arboviruses. The models created with Random Forest presented good results, consistent with a recent study [28] which showed that the set of selected variables resulted in the best performances of the RF models to predict the number of all potential Aedes breeding sites. However, it highlights that since the presence of larvae depends on many factors, predicting only positive breeding sites may result in underestimating the real carrying capacity of the environment, highlighting the difficulty of identifying relevant predictive variables for all types of breeding sites.
The efficiency of RF for prediction applied to the spatiotemporal distribution or abundance of Ae. aegypti has also been demonstrated [29,30]. RF can create a highly accurate classifier using a large number of features [31]. In a study to identify dengue, malaria, and leishmaniasis breeding sites using spatiotemporal data in a real-time platform, the author [32] demonstrated that RF achieved the highest accuracies on all remaining data samples and was the best model for large data sets. In a research [30]) conducted in Northeastern Thailand on the spatial distribution and prediction of dengue vector abundance using machine learning models on different data factors such as logistic regression (LR), support vector machine (SVM), k-nearest neighbor (kNN), artificial neural network (ANN), and random forest (RF), they demonstrated that RF achieves the best model performance with all data variables used in this study.
The results in Table 3 reveal a stark contrast in predictive performance across different SVM kernel types and polynomial degrees. Models employing polynomial kernels of degree 2 and 3 achieved near-perfect accuracy, with the degree-3 configuration yielding a mean correlation coefficient of 1.000, an MAE of 0.033, and an RRSE of just 1.834%. These metrics indicate an exceptionally close alignment between predicted and observed breeding site densities. However, this high predictive fidelity came at a substantial computational cost: training times escalated dramatically with kernel complexity—reaching an average of 1,423.4 seconds for the cubic polynomial kernel, over 37 times longer than the linear variant. In contrast, the Radial Basis Function (RBF) kernel performed poorly (correlation = 0.882, RRSE = 48.95%), suggesting that the underlying data structure may not conform well to the isotropic similarity assumptions of RBF in this spatial context.
These findings underscore a critical trade-off between model accuracy and computational efficiency in public health applications. While high-degree polynomial SVMs can capture complex nonlinear relationships between climate variables and entomological indicators, their prolonged training times may hinder operational deployment in resource-constrained settings like municipal vector control programs. Moreover, the risk of overfitting with high-degree polynomials—especially given the limited temporal span of the breeding site data (2009–2017) warrants caution. The near-perfect performance metrics, though impressive, should be interpreted alongside robust validation on out-of-sample periods and spatial cross-validation to ensure generalizability. Thus, despite their theoretical appeal, high-degree SVMs may be less practical than lighter, more scalable alternatives for real-time arbovirus risk forecasting in dynamic urban environments such as Recife.
The results in Table 4 demonstrate that Multilayer Perceptron (MLP) models achieved consistently high predictive accuracy across all tested configurations. As the number of neurons in the hidden layer increased from 10 to 30, performance metrics improved incrementally: the Mean Absolute Error (MAE) decreased from 0.114 to 0.097, the Relative Root Squared Error (RRSE) dropped from 6.084% to 5.220%, and the correlation coefficient remained near-perfect, ranging from 0.998 to 0.999. These findings indicate that MLPs effectively captured the nonlinear relationships between climatic variables, historical entomological data, and breeding site densities across Recife’s neighborhoods. The high correlation values, in particular, suggest that the spatial patterns predicted by the MLP closely mirrored the observed distribution of breeding sites, reinforcing the model’s suitability for fine-scale risk mapping.
However, this performance came at a notable computational cost. Training times increased substantially with model complexity—rising from approximately 69.7 seconds (10 neurons) to 124.7 seconds (30 neurons)—reflecting the iterative nature of backpropagation and the sensitivity of MLPs to hyperparameter tuning. While these durations are manageable in offline forecasting scenarios, they may pose challenges for real-time or near-real-time public health decision-making, especially in resource-limited municipal settings. Moreover, given the relatively modest gains in accuracy beyond 20 neurons, the marginal benefit of increasing model complexity must be weighed against practical deployment constraints. Nonetheless, the MLP’s strong performance underscores the value of deep learning approaches in entomological forecasting, particularly when paired with high-resolution spatiotemporal data and robust validation protocols such as the 30-fold cross-validation employed in this study.
Table 5 reveals a striking sensitivity of Extreme Learning Machine (ELM) performance to architectural depth. Single-layer ELMs achieved exceptional predictive accuracy, with configurations using 900–1000 neurons yielding near-perfect correlation coefficients (0.999), extremely low MAE (≈0.001), and RRSE values below 2.4%. Training times remained remarkably short—under 0.5 seconds—highlighting the computational efficiency of shallow ELMs. In stark contrast, increasing the number of layers led to a rapid and consistent degradation in performance: models with 5 or 10 layers exhibited sharply reduced correlations (as low as 0.298), RRSE values exceeding 97%, and substantially higher prediction errors. This pattern suggests that deeper ELM architectures, in this specific spatiotemporal forecasting context, suffer from instability, poor generalization, or ineffective random weight initialization—issues not offset by increased representational capacity.
These findings strongly support the use of shallow, single-layer ELMs as a high-performance, low-cost solution for operational entomological forecasting in urban public health settings. The combination of near-perfect predictive fidelity, minimal computational overhead, and robustness across repetitions positions single-layer ELMs as particularly well-suited for integration into real-time surveillance dashboards, such as those used by Recife’s vector control program. Moreover, the sharp performance drop with added layers underscores a critical insight for reservoir computing applications in epidemiology: architectural simplicity often outperforms complexity when data are spatially aggregated, temporally limited, or subject to reporting biases. Thus, ELMs with a single hidden layer not only deliver the best trade-off among all models tested in this study—as noted in the abstract—but also offer a scalable and maintainable framework for deployment in resource-constrained municipal health systems facing the growing threat of climate-driven arbovirus transmission.
The key limitations of this study are related to its study design. We used data from official notification records, that is, secondary data. The dataset obtained by vector control services may be biased, as they were collected for immediate operational needs, leading to oversampling or undersampling in specific geographic areas [28].
5. Conclusions
This study demonstrates that machine learning–based intelligent systems can effectively forecast the spatiotemporal distribution of Aedes aegypti breeding sites in Recife using publicly available climate and entomological data. Among the models evaluated, single-layer Extreme Learning Machines (ELMs) offered the best balance of predictive accuracy—achieving correlation coefficients near 1.0 and RRSE below 2.4%—and computational efficiency, with training times under half a second. These characteristics make ELMs particularly suitable for integration into municipal surveillance platforms requiring rapid, scalable risk assessments.
While case prediction models (e.g., Random Forests) also performed well, the strongest results were obtained for breeding site forecasting, highlighting the value of entomological indicators as early proxies for arbovirus transmission risk. The resulting fine-scale risk maps can support proactive vector control by identifying priority neighborhoods weeks in advance of peak transmission periods. Future work should incorporate socioeconomic, urban infrastructure, and real-time mobility data to enhance generalizability and extend predictions to clinical case incidence. Nonetheless, this study provides a reproducible, open-data framework that can be adapted to other tropical cities facing similar climate-driven arboviral threats.
Author Contributions
Conceptualization, W.P.S., C.L.L., C.C.S., M.F.S.M., K.A.S., R.V.; methodology, W.P.S., C.L.L., C.C.S., M.F.S.M., K.A.S., R.V.; software, W.P.S., C.L.L., C.C.S., M.F.S.M., K.A.S., R.V.; validation, W.P.S., C.L.L., C.C.S., M.F.S.M., K.A.S., R.V. and F.T.B; formal analysis, W.P.S., C.L.L., C.C.S., M.F.S.M., K.A.S., R.V..; investigation, W.P.S., C.L.L., C.C.S., M.F.S.M., K.A.S., R.V.; resources, W.P.S., C.L.L., C.C.S., M.F.S.M., K.A.S., R.V.; data curation, W.P.S., C.L.L., C.C.S., M.F.S.M., K.A.S., R.V.; writing—original draft preparation, W.P.S., C.L.L., C.C.S., M.F.S.M., K.A.S., R.V., F.T.B; C.E.G.S; writing—review and editing, W.P.S., C.L.L., K.A.S., F.T.B.; C.E.G.S; visualization, W.P.S., C.L.L., C.C.S., M.F.S.M., K.A.S., R.V.; supervision, W.P.S.; project administration, W.P.S., C.L.L., C.C.S., M.F.S.M., K.A.S., R.V.; funding acquisition, W.P.S. All authors have read and agreed to the published version of the manuscript.
Funding
This research was funded by Council for Scientific and Technological Development—CNPq (grant n. 445900/20.23-7).
Institutional Review Board Statement
The study was conducted in accordance with the Declaration of Helsinki, and approved by the Research Ethics Committee of the Federal University of Pernambuco (approval number: CAAE: 80113224.6.0000.5208, legal opinion number: 6.954.924) on July 17, 2.024.
Informed Consent Statement
Informed consent for participation is not required as per local legislation [RESOLUTION Nº 510, APRIL 7, .2016].
Data Availability Statement
The original data presented in the study are openly available in: APAC Geographic Information System (SIGH-PE) https:// https://www.apac.pe.gov.br; INMET Meteorological Database for Teaching and Research (BDMEP) https:// https://bdmep.inmet.gov.br; The Open Data Portal of Recife https:// http://dados.recife.pe.gov..br
Acknowledgments
During the preparation of this study, the authors used Phyton o develop prediction models. The authors have reviewed the output and take full responsibility for the content of this publication.
Conflicts of Interes
The authors declare no conflicts of interest.
Abbreviations
The following abbreviations are used in this manuscript:
| AI | Artificial Intelligence |
| APAC | Pernambuco Water and Climate Agency |
| ANN | Artificial Neural Network |
| ELM | Extreme Learning Machines |
| INMET | National Institute of Meteorology |
| kNN | k-Nearest Neighbor |
| LR | Logistic Regression |
| LIRAa | Rapid Survey of Indices for Aedes aegypti |
| MAE | Mean Absolute Error |
| MLP | Multilayer Perceptron |
| RMSE | Root Mean Square Error |
| RRSE | Relative Root Square Error |
| SIGH-PE | Pernambuco Geographic Information System |
| SVM | Support Vector Machine |
References
- WHO - WORLD HEALTH ORGANIZATION. Global Arbovirus Initiative, 2022. Available online: https://www.who.int/initiatives/global-arbovirus-initiative. (accessed on 11 April 2025).
- WHO - WORLD HEALTH ORGANIZATION. Dengue and severe dengue. Fact sheet Updated 23 April 2024. Available online: https://www.who.int/news-room/fact-sheets/detail/dengue-and-severe-dengue. (accessed on 05 April 2025).
- WORLD HEALTH ORGANIZATION - WHO. Disease Outbreak News. Geographical expansion of cases of dengue and chikungunya beyond the historical areas of transmission in the Region of the Americas. 23 March 2023. Available online: https://www.who.int/emergencies/disease-outbreak-news/item/2023-DON448#:~:text=Paraguay%3A%20Between%202%20October%202022,hospitalized%20cases%20and%2046%20deaths. (accessed on 02 May 2025).
- Santos LLM, de Aquino EC, Fernandes SM, Ternes YMF, Feres VCR. Dengue, chikungunya, and Zika virus infections in Latin America and the Caribbean: a systematic review. Revista Panamericana de Salud Pública. 2023;47:e34. [CrossRef]
- Kaye AR, Obolski U, Sun L, Hart WS, Hurrell JW, Tildesley MJ, Thompson RN. The impact of natural climate variability on the global distribution of Aedes aegypti: a mathematical modelling study. The Lancet Planetary Health. 2024; 8(12): e1079-e1087. [CrossRef]
- Abud, D. A., Santos, C. Y., Neto, A. A. L., Senra, J. T., & Tuboi, S. (2022). Real world data study of prevalence and direct costs related to dengue management in Brazil's private healthcare from 2015 to 2020. The Brazilian Journal of Infectious Diseases, 26(6), 102718.
- Azil AH, Li M, Williams CR. Programas de vigilância de vetores da dengue: uma revisão da diversidade metodológica em alguns países endêmicos e epidêmicos. Asia Pac J Public Health. 2011 nov;23(6):827–42. [CrossRef]
- Ribeiro MS, Ferreira DF, Azevedo RC, Santos GBGD, Medronho RA. Índices larvais de Aedes aegypti e incidência de dengue: um estudo ecológico no Estado do Rio de Janeiro, Brasil [Aedes aegypti larval indices and dengue incidence: an ecological study in the state of Rio de Janeiro, Brazil]. Cad Saude Publica. 2021 Jul 19;37(7):e00263320. Portuguese. [CrossRef]
- Brady OJ, Hay SI. A expansão global da dengue: como os mosquitos Aedes aegypti possibilitaram o primeiro arbovírus pandêmico. Annu Rev Entomol. 2020;7;65(1):191–208. [CrossRef]
- Flaibani N, Pérez AA, Barbero IM, Burroni NE. Different approaches to characterize artificial breeding sites of Aedes aegypti using generalized linear mixed models. Infect Dis Poverty. 2020 Jul 31;9(1):107. [CrossRef]
- Gurgel-Gonçalves R, Oliveira WK, Croda J. The greatest Dengue epidemic in Brazil: Surveillance, Prevention, and Control. Rev Soc Bras Med Trop. 2024 Sep 20;57:e002032024. [CrossRef]
- Lima Y, Pinheiro W, Barbosa CE, Magalhães M, Chaves M, de Souza JM, Rodrigues S, Xexéo G. Development of an Index for the Inspection of Aedes aegypti Breeding Sites in Brazil: Multi-criteria Analysis. JMIR Public Health Surveill. 2021 May 10;7(5):e19502. [CrossRef]
- Rodrigues GO, Pereira BGV, Pereira MAF, Trindade-Bezerra JM, Guimarães-e-Silva AS, Soares-Pinheiro VC, et al.. Potential breeding containers of Aedes aegypti (Linnaeus, 1762) and Aedes albopictus (Skuse, 1894) at strategic points in a city in the eastern region of Maranhão. Braz J Biol [Internet]. 2023;83:e275582. Available from: . [CrossRef]
- Schultes OL, Morais MHF, Cunha MDCM, Sobral A, Caiaffa WT. Spatial analysis of dengue incidence and Aedes aegypti ovitrap surveillance in Belo Horizonte, Brazil. Trop Med Int Health. 2021 Feb;26(2):237-255. [CrossRef]
- Soares APM, Rosário ING, Silva IM. Distribution and preference for oviposition sites of Aedes albopictus (Skuse) in the metropolitan area of Belém, in the Brazilian Amazon. J Vector Ecol. 2020 Dec;45(2):312-320. [CrossRef]
- RECIFE, Governo Municipal, Secretaria de Saúde do Recife, Secretaria Executiva de Planejamento, Monitoramento e Articulação Distrital, Plano Municipal de Saúde 2022 - 2025 / Governo Municipal, Secretaria de Saúde do Recife, Recife. Secretaria Executiva de Planejamento, Monitoramento e Articulação Distrital, Gerência Geral de Planejamento e Orçamento, 1ª. Ed. - Secretaria de Saúde do Recife, 2022. p.: - il. Available online: https://www2.recife.pe.gov.br/servico/plano-municipal-de-saude-pms-2022-2025. (accessed on 09 September 2025).
- IBGE – Instituto Brasileiro de Geografia e Estatística. Brasil. Pernambuco. Rio de Janeiro: IBGE, 2022. Available online: https://cidades.ibge.gov.br/brasil/pe/recife/panorama. (accessed on 03 August 2023).
- Frank, E., Hall, M. A., & Witten, I. H. (2016). The WEKA Workbench [Online appendix]. In Data mining: Practical machine learning tools and techniques (4th ed.). Morgan Kaufmann.
- Steiner, P., Jalalvand, A., Stone, S., & Birkholz, P. (2022). PyRCN: A toolbox for exploration and application of Reservoir Computing Networks. Engineering Applications of Artificial Intelligence, 113, 104964. [CrossRef]
- Python Software Foundation. Python (Version 3.13.0) [Computer software]. Available online: https://www.python.org/ (accessed on 10 October 2025).
- DISTRITOS SANITÁRIOS DE RECIFE. RAMOS, Roberta de Souza Pereira da Silva et al. Análise espacial da mortalidade fetal por sífilis congênita no Município do Recife-PE-Brasil entre 2007 e 2016. Escola Anna Nery, v. 26, p. e20210013, 2022.
- Hijmans, R. J. (2025). terra: Spatial data analysis (R package version 1.8-64) [Computer software]. https://github.com/rspatial/terra.
- R Core Team (2025). _R: A Language and Environment for Statistical Computing_. R Foundation for Statistical Computing, Vienna, Austria. <https://www.R-project.org/>.RAMOS, A. S. M. Generative Artificial Intelligence based on large language models - tools for use in academic research. In SciELO Preprints. 2023.
- Forecasting Dengue, Chikungunya and Zika cases in Recife, Brazil: a spatio-temporal approach based on climate conditions, health notifications and machine learning. Research, Society and Development, [S. l.], v. 10, n. 12, p. e452101220804, 2021. Disponível em: https://rsdjournal.org/rsd/article/view/20804. Acesso em: 8 sep. 2025. [CrossRef]
- da Silva, C.C., de Lima, C.L., da Silva, A.C.G. et al. Spatiotemporal forecasting for dengue, chikungunya fever and Zika using machine learning and artificial expert committees based on meta-heuristics. Res. Biomed. Eng. 38, 499–537 (2022). [CrossRef]
- Witten, I. H, Frank, E., Hall, M. A. (2016). The WEKA Workbench. Online Appendix for" Data Mining: Practical Machine Learning Tools and Techniques".
- El Misilmani, H. M., & Naous, T. (2019, July). Machine learning in antenna design: An overview on machine learning concept and algorithms. In 2019 International Conference on High Performance Computing & Simulation (HPCS) (pp. 600-607). IEEE.
- Teillet C, Devillers R, Tran A, Catry T, Marti R, Dessay N, Rwagitinywa J, Restrepo J, Roux E. Exploring fine-scale urban landscapes using satellite data to predict the distribution of Aedes mosquito breeding sites. Int J Health Geogr. 2024 Jul 7;23(1):18. [CrossRef]
- Mudele O, Bayer FM, Zanandrez L, Eiras AE, Gamba P. Modeling the Temporal Population Distribution of Ae. aegypti Mosquito using Big Earth Observation Data [Internet]. arXiv; 2019. http://arxiv.org/abs/1911.08979.
- Rahmana MS, Pientong C, Zafar S, Ekalaksananan T, Paul RE, Haque U, Rocklöv J, Overgaard HJ. Mapping the spatial distribution of the dengue vector Aedes aegypti and predicting its abundance in northeastern Thailand using machine-learning approach. One Health. 2021 Dec 4;13:100358. [CrossRef]
- Niu B., Liang R., Zhou G., Zhang Q., Su Q., Qu X., Chen Q. Prediction for global Peste des petits ruminants outbreaks based on a combination of random forest algorithms and meteorological data. Front. Vet. Sci. 2021;7:570829. [CrossRef]
- Javaid M, Sarfraz MS, Aftab MU, Zaman QU, Rauf HT, Alnowibet KA. WebGIS-Based Real-Time Surveillance and Response System for Vector-Borne Infectious Diseases. Int J Environ Res Public Health. 2023 Feb 20;20(4):3740. Erratum in: Int J Environ Res Public Health. 2025 Mar 26;22(4):499. doi: 10.3390/ijerph22040499. [CrossRef]
- Sezgin, E. Redefining Virtual Assistants in Health Care: The Future With Large Language Models. J Med Internet Res 2024;26:e53225.
Figure 1.
Map of the municipality of Recife (in Portuguese, Município de Recife), Pernambuco, identifying the eight health districts (In Portuguese, Distritos Sanitários: DS I, DS II, DS III, DS IV, DS V, DS VI, DS VII, and DS VIII). The boundaries of Recife are shown in red. Recife, Pernambuco, Brazil, 2020.
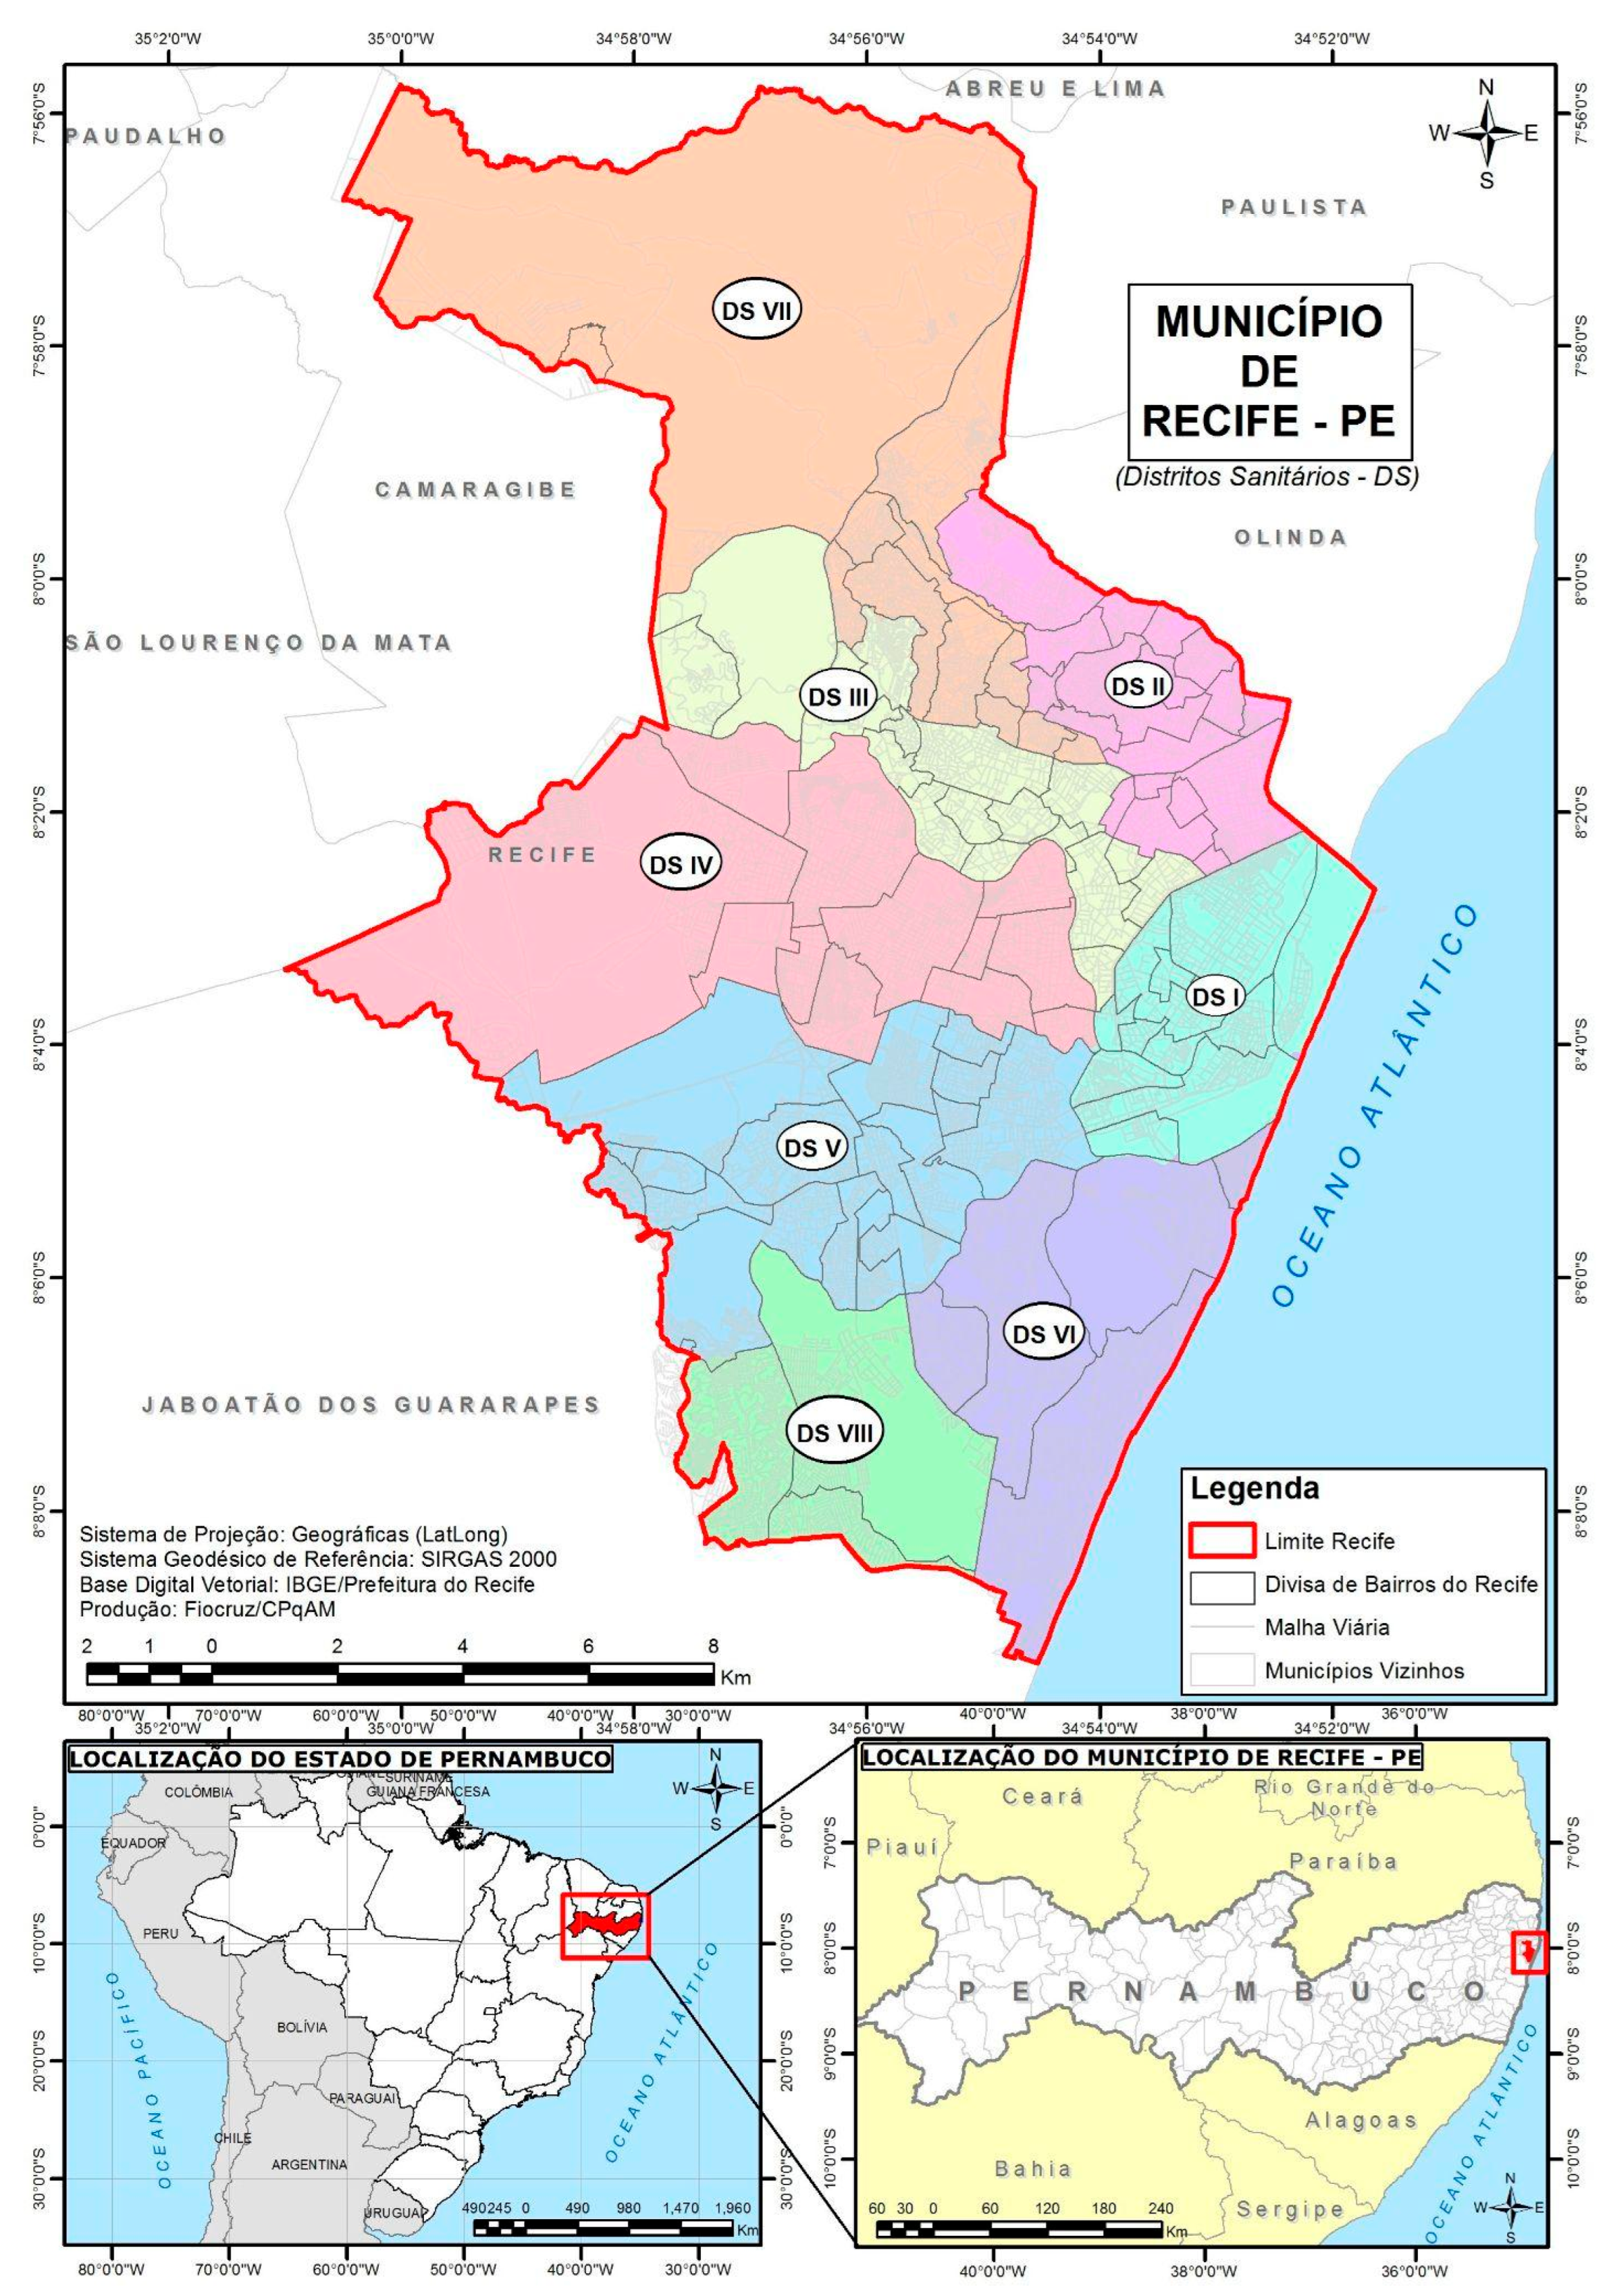
Figure 2.
Proposed method to predict the spatial distribution of arbovirus cases in Recife, and Ae. aegypti breeding sites.
Figure 2.
Proposed method to predict the spatial distribution of arbovirus cases in Recife, and Ae. aegypti breeding sites.
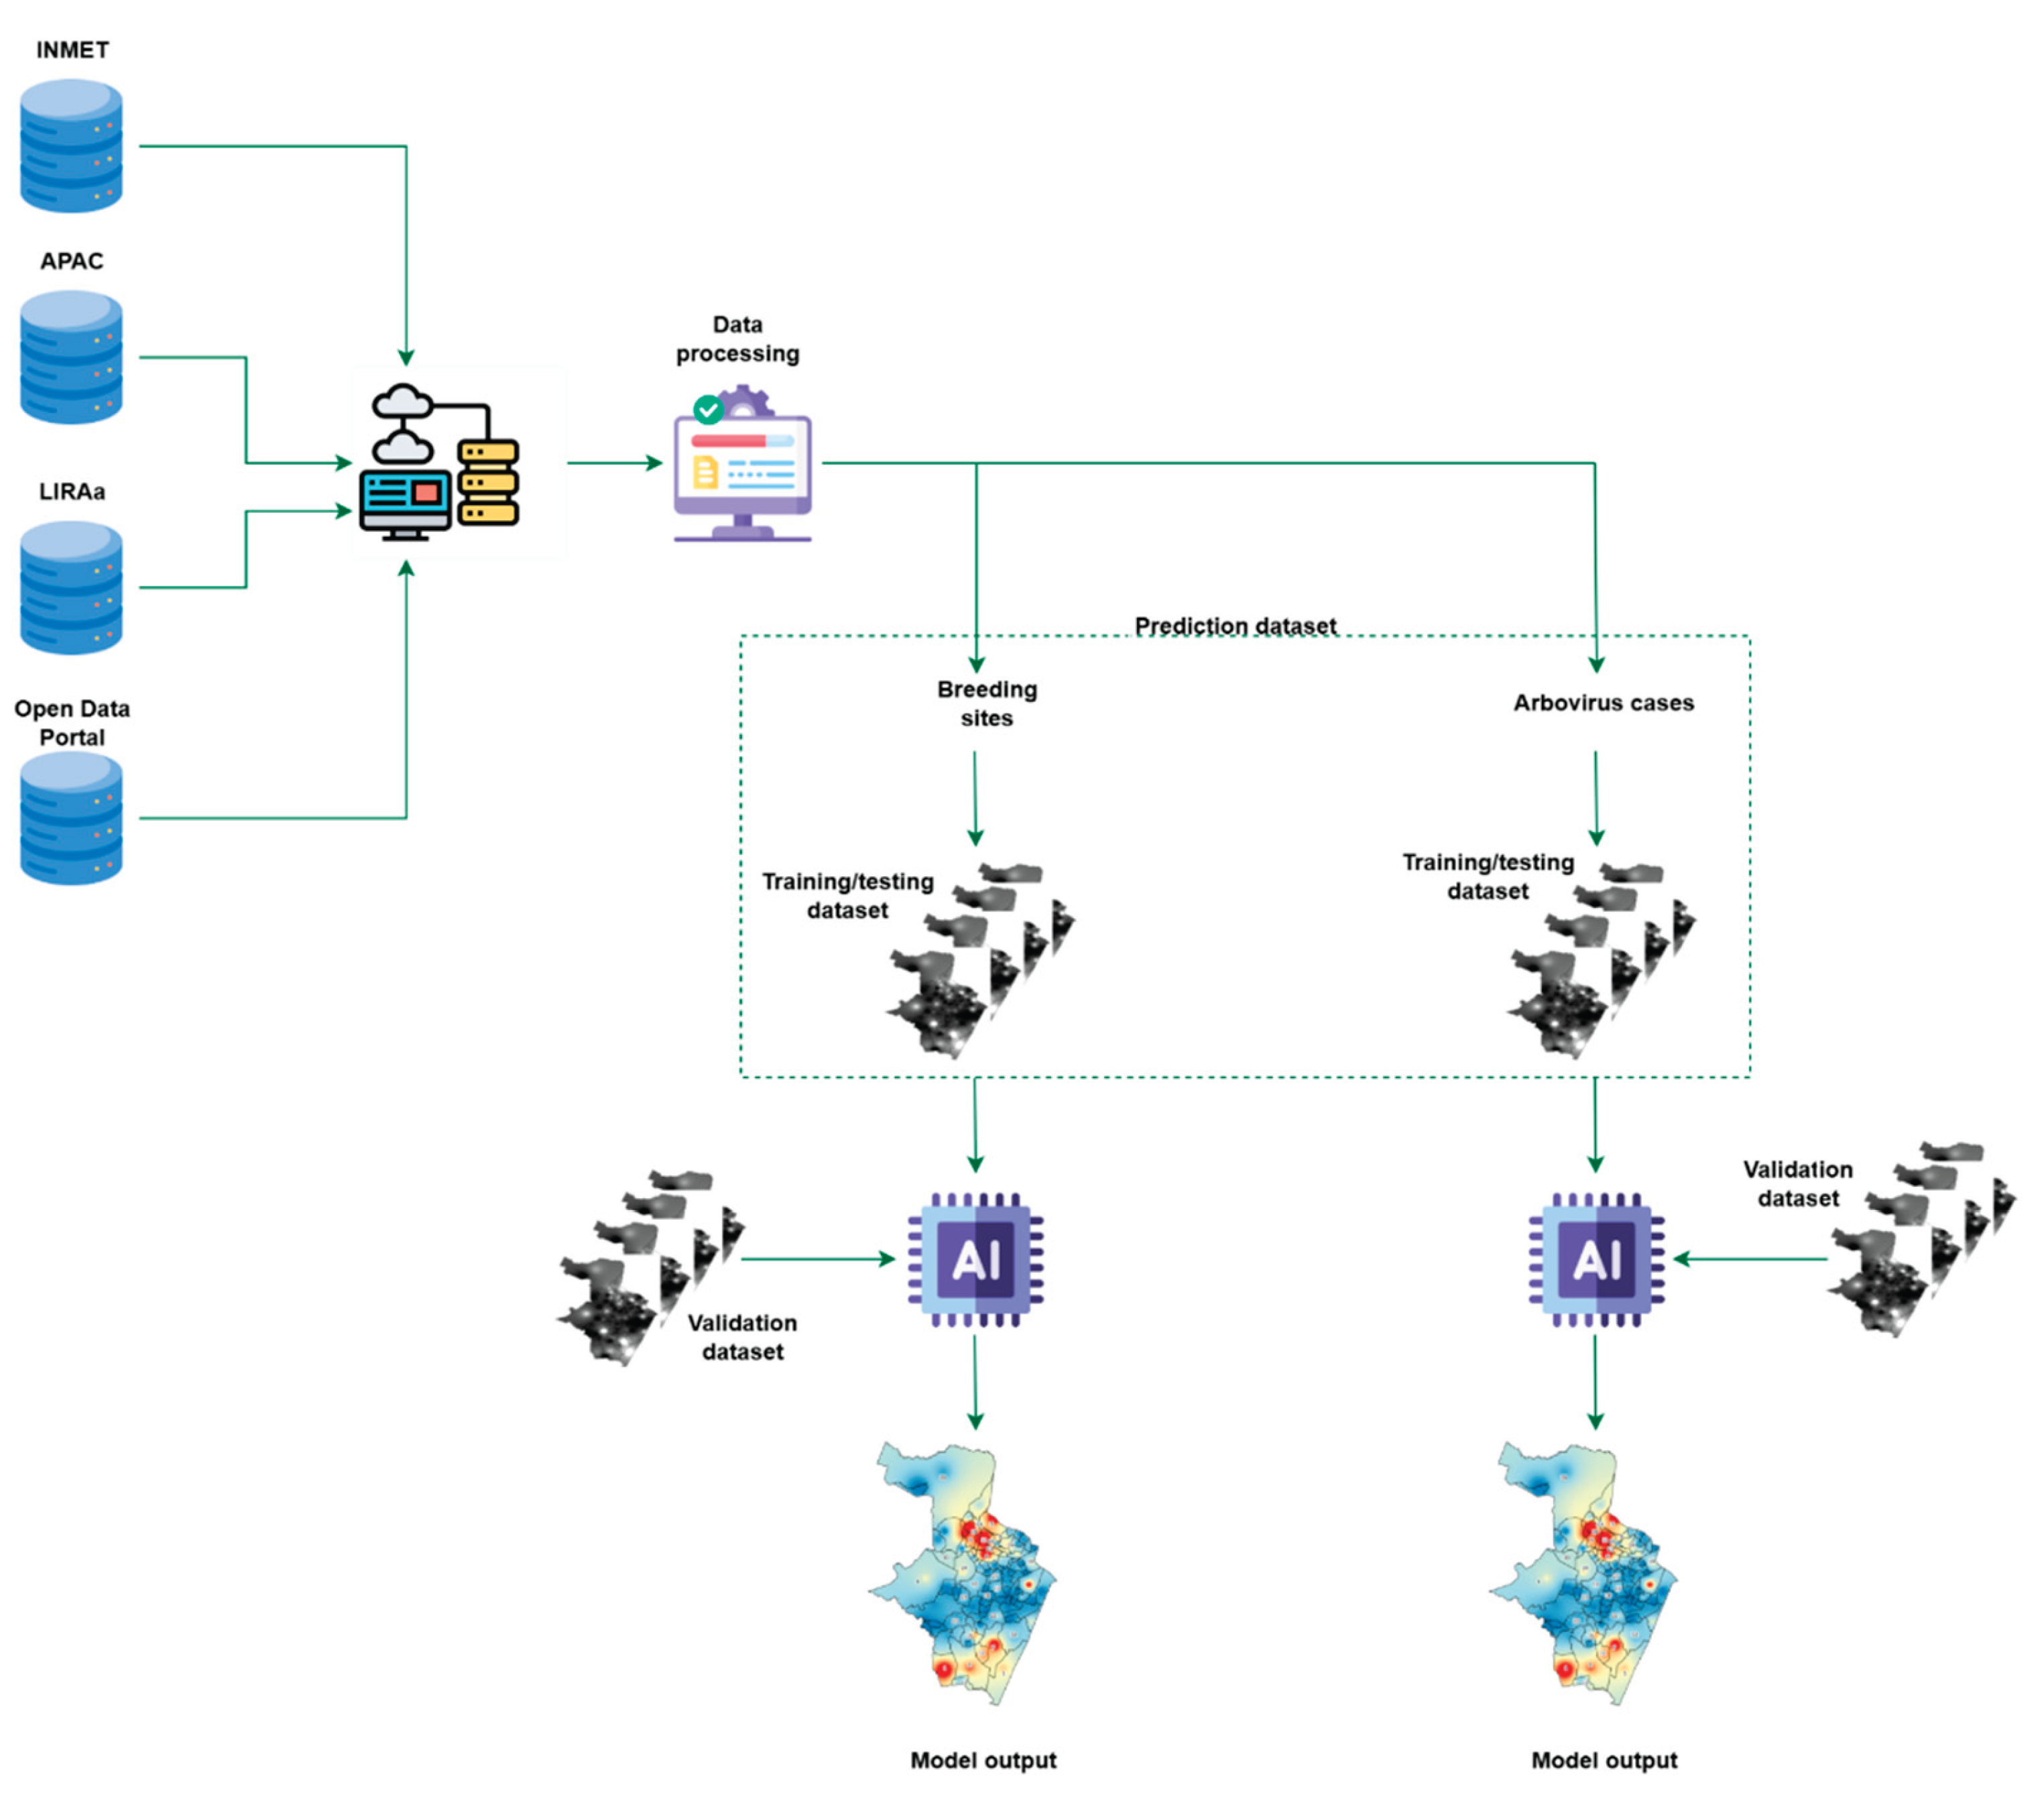
Table 1.
Prediction results for the number of breeding sites using the Linear Regression model.
| MAE | RMSE | RRSE (%) | Correlation Coeficient | Training time (s) | ||||||
|---|---|---|---|---|---|---|---|---|---|---|
| Regression method | mean | std | mean | std | mean | std | mean | std | mean | std |
| Linear Regression | 0.646 | 0.24 | 1.12 | 0.416 | 36.857 | 6.518 | 0.928 | 0.026 | 0.044 | 0.022 |
Table 2.
Prediction results for the number of breeding sites using Random Forest models.
| MAE | RMSE | RRSE (%) | Correlation Coefficient | Training time (s) | |||||||
|---|---|---|---|---|---|---|---|---|---|---|---|
| Regression method | Setup | mean | std | mean | std | mean | std | mean | std | mean | std |
| Random Forest | 10 trees | 0.227 | 0.078 | 0.530 | 0.215 | 18.005 | 4.109 | 0.984 | 0.008 | 0.223 | 0.085 |
| 20 trees | 0.203 | 0.070 | 0.480 | 0.199 | 16.313 | 3.944 | 0.988 | 0.007 | 0.382 | 0.122 | |
| 30 trees | 0.191 | 0.064 | 0.459 | 0.192 | 15.619 | 3.937 | 0.989 | 0.007 | 0.867 | 0.699 | |
| 40 trees | 0.118 | 0.065 | 0.454 | 0.192 | 15.421 | 3.925 | 0.989 | 0.007 | 0.852 | 0.170 | |
| 50 trees | 0.216 | 0.067 | 0.521 | 0.205 | 15.627 | 3.703 | 0.989 | 0.006 | 1.007 | 0.140 | |
| 60 trees | 0.213 | 0.066 | 0.517 | 0.204 | 15.490 | 3.703 | 0.990 | 0.006 | 0.956 | 0.146 | |
| 70 trees | 0.211 | 0.066 | 0.514 | 0.204 | 15.405 | 3.711 | 0.990 | 0.006 | 1.250 | 0.311 | |
| 80 trees | 0.209 | 0.065 | 0.511 | 0.203 | 15.333 | 3.713 | 0.990 | 0.006 | 1.621 | 0.238 | |
| 100 trees | 0.207 | 0.065 | 0.508 | 0.203 | 15.226 | 3.704 | 0.990 | 0.006 | 1.761 | 0.257 | |
Table 4.
Prediction results for the number of breeding sites using Multilayer Perceptron models.
| MAE | RMSE | RRSE (%) | Correlation Coefficient | Training time (s) | |||||||
|---|---|---|---|---|---|---|---|---|---|---|---|
| Regression method | Setup | mean | std | mean | std | mean | std | mean | std | mean | std |
| MLP | 10 neurons | 0.114 | 0.065 | 0.181 | 0.104 | 6.084 | 2.648 | 0.998 | 0.002 | 69.651 | 31.176 |
| 20 neurons | 0.106 | 0.062 | 0.168 | 0.101 | 5.630 | 2.561 | 0.999 | 0.002 | 111.492 | 36.160 | |
| 30 neurons | 0.097 | 0.056 | 0.156 | 0.097 | 5.220 | 2.533 | 0.999 | 0.002 | 124.706 | 34.655 | |
Table 5.
Prediction results for the number of breeding sites using Extreme Learning Machines model.
| MAE | RMSE | RRSE (%) | Correlation Coefficient | Training time (s) | ||||||||
|---|---|---|---|---|---|---|---|---|---|---|---|---|
| Regression method | Setup | Neurons | mean | std | mean | std | mean | std | mean | std | mean | std |
| ELM | 1 layers | 500 | 0.002 | 0.001 | 0.007 | 0.006 | 4.375 | 3.463 | 0.998 | 0.004 | 0.268 | 0,168 |
| 700 | 0.001 | 0.001 | 0.006 | 0.007 | 3.366 | 3.789 | 0.999 | 0.005 | 0.338 | 0.200 | ||
| 900 | 0.001 | 0.000 | 0.004 | 0.005 | 2.575 | 2.846 | 0.999 | 0.002 | 0.405 | 0.215 | ||
| 1000 | 0.001 | 0.000 | 0.004 | 0.005 | 2.386 | 2.717 | 0.999 | 0.002 | 0.339 | 0.135 | ||
| 2 layers | 500 | 0.021 | 0.004 | 0.037 | 0.015 | 22.570 | 9.005 | 0.973 | 0.024 | 0.401 | 0.162 | |
| 700 | 0.017 | 0.005 | 0.036 | 0.071 | 22.510 | 46.623 | 0.975 | 0.059 | 0.557 | 0.305 | ||
| 900 | 0.015 | 0.003 | 0.030 | 0.030 | 18.237 | 18.225 | 0.982 | 0.044 | 0.700 | 0.259 | ||
| 1000 | 0.014 | 0.003 | 0.032 | 0.037 | 19.810 | 22.472 | 0.977 | 0.055 | 0.903 | 1.867 | ||
| 5 layers | 500 | 0.073 | 0.012 | 0.104 | 0.017 | 63.867 | 5.068 | 0.773 | 0.039 | 0.887 | 0.254 | |
| 700 | 0.073 | 0.011 | 0.101 | 0.016 | 62.498 | 5.181 | 0.785 | 0.037 | 2.180 | 64.080 | ||
| 900 | 0.071 | 0.011 | 0.098 | 0.015 | 60.249 | 5.031 | 0.804 | 0.034 | 2.760 | 77.216 | ||
| 1000 | 0.070 | 0.011 | 0.096 | 0.016 | 59.154 | 5.060 | 0.812 | 0.033 | 2.183 | 11.042 | ||
| 10 layers | 500 | 0.111 | 0.020 | 0.160 | 0.027 | 97.911 | 3.102 | 0.299 | 0.061 | 1.711 | 0.293 | |
| 700 | 0.115 | 0.020 | 0.162 | 0.027 | 99.447 | 3.684 | 0.298 | 0.066 | 3.855 | 2.446 | ||
| 900 | 0.117 | 0.020 | 0.162 | 0.027 | 99.753 | 4.122 | 0.328 | 0.062 | 4.097 | 0,.574 | ||
| 1000 | 0.119 | 0.021 | 0.165 | 0.027 | 101.475 | 4.287 | 0.312 | 0.062 | 4.599 | 0.712 | ||
Disclaimer/Publisher’s Note: The statements, opinions and data contained in all publications are solely those of the individual author(s) and contributor(s) and not of MDPI and/or the editor(s). MDPI and/or the editor(s) disclaim responsibility for any injury to people or property resulting from any ideas, methods, instructions or products referred to in the content. |
© 2025 by the authors. Licensee MDPI, Basel, Switzerland. This article is an open access article distributed under the terms and conditions of the Creative Commons Attribution (CC BY) license (http://creativecommons.org/licenses/by/4.0/).
Copyright: This open access article is published under a Creative Commons CC BY 4.0 license, which permit the free download, distribution, and reuse, provided that the author and preprint are cited in any reuse.


