
Submitted:
06 November 2025
Posted:
20 November 2025
You are already at the latest version
Abstract
This research examines the persistent shoreline erosion along the Damietta coast and the problem of sediment buildup within the navigation channel of Damietta Port, both of which provide major obstacles to navigation efficiency and coastal balance. To address these issues, the research uses the LITPACK numerical model to forecast shoreline evolution along the Damietta coast, which is divided into two sections of 3.3 km each, during the next 20 years. Considering both planned and existing coastal constructions, two realistic alternatives were proposed. The Coastal Modeling System (CMS) was then used to perform a two-dimensional simulation in order to examine sediment transport and hydrodynamic behavior in the port region. This phase concentrated on examining the effects of sedimentation rates following the most recent port development plan, which included building a massive 5560-meter-long western jetty and a new navigation channel with a depth of 9 m to service the dirty ballast terminal. In comparison to the benchmark case, the simulation results showed a 93% decrease in sedimentation rates within the navigation channel. The study's final phase evaluated the impact of changing the crest levels of the current detached breakwaters along the Ras El-Bar coastline on reducing coastal erosion. The study's conclusions promote the creation of effective and sustainable coastal protection plans in the Damietta area by providing insightful information for future coastal zone management and planning.
Keywords:
coastal erosion management
; Damietta harbor
; siltation
; breakwater design
; numerical modeling
; climate-resilient coastlines
1. Introduction
The Damietta Coast, forming a vital part of the Nile Delta shoreline and located in northeastern Egypt along the Mediterranean Sea (Figure 1), is a coastal zone characterized by dynamic natural processes and intensive human activities. It extends from the western side of Damietta Harbor (DH) (31° 27' 45.91" N, 31° 40' 24.26" E) to the Damietta promontory (31° 31' 31.75" N, 31° 50' 36.82" E). The Nile River's Damietta estuary is essential for the transport of sediment, but because of significant human changes, most notably the Aswan High Dam, its importance has rendered (ElKotby et al., 2023). This has caused considerable shoreline retreat, particularly around Ras El-Bar and DP, mandating the installation of coastal protection measures such jetties at Damietta promontory, seawalls around Damietta promontory, eastern and western jetties for DP, and groins east DH (see Figure 1A). Nevertheless, the effectiveness of these measures remains mixed, as some structures facilitate sediment deposition while simultaneously intensifying erosion in adjacent areas (El-Asmar and Taha, 2022; El-Asmar et al., 2025a; Romero-Martín et al., 2025). Rising sea levels and frequent storm surges further alter sediment transport patterns (Cheon et al., 2016). Studies have shown that wave-induced longshore currents, predominantly eastward and driven by dominant northwesterly waves, strongly influence sediment accumulation and shoreline retreat dynamics (El-Asmar, 2002; Deng et al., 2017; Bacino et al., 2019; Li et al., 2021; Frihy and Stanley, 2023; Darwish, 2024; Eelsalu et al., 2024).
The hub of the coastal tourism business is Ras El-Bar, a popular resort town east of DP, where erosion threatens residential areas and recreational activities. The erosion is most obvious on the eastern side of DP, which has severe sediment deficiencies, since the port's jetties obstruct normal sediment transport, as declared by El-Asmar et al. (2016, 2025a) and ElKotby et al. (2023). In an attempt to solve these issues and protect the Damietta coastline for generations to come, eight detached breakwaters (DBWs), each 200 m long and 200 m apart, were constructed in 2002 to protect the Ras El-Bar beach. To ensure shoreline stability, the government began construction of two more DBWs in 2023, which is nearly complete as part of the area’s future development plan. Directly east of the port, four Y-groins were also built in 2019 to combat ongoing erosion; the first three were 170 m long, and the fourth was 120 m. The distance between these groins was 400 m. Because of its proximity to the sea, Damietta has mild, fairly rainy winters (23°C to 26°C) with some rain that increases along the coast, and warm, humid summers (28°C to 31°C) (Abd El-Hamid, 2020). The wave rose, as shown in Figure 1B, indicates a predominance of waves from the NW (55%), while 10% of the waves originate from the N, and 7% and 13% originate from the NE and W directions, respectively. These prevailing wave directions generate an eastward-flowing alongshore current. The maximum wave height during the strongest storms is almost 6.7 m; the wave period is either ≤ 7.5 sec (99.5% of the time) or between 3 and 5 sec (83.1% of the time). Wind speed ranges from 0.5 to 19.5 m/sec. Furthermore, the tide is microtidal and semidiurnal, with a range of ≈ 30 cm (ElKotby et al., 2024b). Similar observations were described on a global scale (Bazzichetto et al., 2020; Marks et al., 2025; Tang et al., 2025).
1.1. The Study Area
DH is a cornerstone of Egypt’s maritime economy, consistently ranking among the top three commercial ports and handling a significant share of the nation’s trade, with contributions to total imports rising from 4.1% in 2000 to 9.5% in 2023, and exports from 9.3% to 10% over the same period (Ragab, 2025). In 2023, the port handled a peak of 3572 ships, with an average 3111 ship/yr from 2018-2023, reinforcing its status as a leader in ship traffic among Egyptian ports. The port generated revenues of 5.1 billion EGP, underscoring its economic vitality, while supporting thousands of jobs and regional industries such as logistics and shipping (Damietta Port Authority [DHA], 2023).
Due to the inland design of DP (Figure 2), it allows year-round ship traffic with significant growth, even during extreme weather conditions. This is facilitated by the construction of two jetties in 1985: the old western jetty (DP-OWJ) and the old eastern jetty (DP-OEJ). These reduced the littoral drift at the entrance of the approach channel. The DP-OWJ was initially constructed to a length of ≈ 1,000 m in the N011° direction and was extended in 1985 to a total length of 1,500 m, reaching a depth of 7 m, nearly parallel to the navigation channel (El-Asmar and White, 2002). Construction of the harbor and its navigation channel began in 1981, with two jetties established to delineate and safeguard the entrance channel, which was excavated to a depth of 15 m. The eastern and western jetties were ≈ 0.74 and 1.64 km long, respectively. Following the port’s opening, the basin area was 2.77 km2, but this decreased slightly to 2.76 km2 in 1996 due to the construction of petroleum quays west of the inner basin. It then increased to 3.0 km2 in 2010 after the United Petroleum Company quay’s water area was expanded and a multipurpose station was built in the south, and it exceeded 3.42 km2 at the start of 2023 after erection of the new container terminal “Tahya Misr-1” began, as illustrated in Figure 2.
However, the port contends with operational challenges due to sedimentation along the navigation channel, resulting in reduced water depth and constraints on docking vessel sizes (Ragab, 2025). These sedimentation issues are evident in the bathymetric changes observed between 2022 and 2024, as shown in Figure 3. The persistent sedimentation necessitates costly dredging and deepening operations, with annual dredging volumes averaging 1.5 million m3 and costs escalating to 273 million EGP (≈ 15.29 million USD) in 2018 (DPA, 2023). Major deepening projects, such as the 2014–2016 effort, which removed 2.78 million m3 and the 2021–2024 initiative targeting a 19-meter depth for 79 million USD, highlight the significant financial burden required to maintain navigational efficiency and accommodate larger vessels, which are critical for sustaining the port’s economic contributions (DPA, 2023).
1.2. The Shoreline Changes
Remote sensing became very essential in tracking coastal changes due to its effectiveness, low resource needs, and quick coverage of wide regions. Various studies have focused on shoreline changes (Jerin Joe et al., 2025) along the Nile Delta region (Esmail et al., 2018; Abou Samra and Ali, 2021; Dewidar and Bayoumi, 2021; Abd-Elhamid et al., 2023; Aziz 2024; Youssef et al., 2024; El-Asmar et al., 2019; 2025a, b).
Prior to the construction of the port, the Damietta coast experienced significant erosion and accretion, with rates of -0.11 m/yr and +1.29 Km2 from 1977 to 1985, respectively (Figure 4A). The shoreline along the DP-OEJ experienced substantial deterioration, with an average retreat of -7.6 m/yr and -3.65 m/yr during the 2000–2005 and 2005–2016 periods, respectively (ElKotby et al., 2024a; El-Asmar et al., 2025a, b). On the other hand, Ras El-Bar coast suffered significant erosion between 1977 and 1980, with rates reaching -10.38 m/yr. (Dewidar and Frihy, 2010). Similar rates ranging from -5.35 m/yr to -10.26 m/yr and average of -9.9 m/yr were observed from 1977 and 1980 and 1984 to 1991 respectively (White and El-Asmar, 1999; El-Asmar et al., 2014). To address this issue, eight DBWs were implemented between 1991 and 2002. These breakwaters created a shadow zone with low wave energy, allowing sediments to accumulate and promoting the formation of a salient and embayment in the area (El-Asmar 1994; El-Asmar et al. 2016, 2025a). The erosion decreased at the shadow of the DBWs from 0.101 km2 between 1984 and 1997 to 0.066 km2 between 1997 and 2011, coinciding with a rise in the accreted areas from 0.234 km2 to 1.152 km2 respectively. Average rates of accretion were recorded as +4.96 m/yr, +6.05 m/yr, +6.3 m/yr, during the periods of 2000–2005, 2005–2020, 2020–2023, respectively (El-Zeiny et al., 2016) (Figure 4B). These rates demonstrate the positive impact of the breakwaters in mitigating erosion and promoting land growth in the area (El-Asmar and Taha 2022; El-Asmar et al., 2025a), with an average of +12.0 m/yr from 1999–2003 (Esmail et al., 2018), later the rate of accretion gradually decreased, eventually reaching a near-stable state by 2015 (El-Asmar et al., 2025a). From 2016-2019, four Y-groins were constructed to address erosion concerns in the eastern part of the port (Figure 4C) (El-Asmar and Taha, 2022; El-Asmar et al., 2025a). The analysis indicates that this area experienced erosion at an average rate of -2.58 m/yr from 2005 to 2016. Between 2016 and 2020, shoreline retreat averaged -2.9 m/yr. However, during the period from 2020 to 2023, the erosion rate decreased to an average of -2.55 m/yr (El-Asmar and Taha, 2022; ElKotby et al., 2024a).
The study’s goal is to use remote sensing and GIS techniques to first examine the changes in the coastline east of DP, which is heavily impacted by erosion, between 1977 and 2023. The behavior of the coastline under the proposed alternatives, which essentially reflect the reality being implemented, from 2020 to 2040 was then predicted using the Littoral Processes and Coastline Kinetics software package developed by the Danish Hydraulic Institute (DHI-LITPACK). Furthermore, the CMS 2D numerical model, which consists of two modules, CMS-Flow and CMS-Wave, was employed to track sedimentation within DP following a one-year simulation of the latest port update. Finally, the impact of alternatives involving alterations to the crest level of the DBWs situated along the Ras El-Bar beach and the geometry of the Y-groins on the coastline's morphology was examined.
2. Methods
2.1. Digital Shoreline Analysis System (Dsas)
In the current study, the end point rate (EPR), a statistical parameter function of the Digital Shoreline Analysis System (DSAS) in ArcGIS 10.8, is used to analyse Landsat Multispectral Scanner (MSS), Thematic Mapper (TM), Enhanced Thematic Mapper (ETM+), and Operational Land Imager (OLI) data in order to automatically quantify the shoreline change rates attributable to erosion and accretion patterns around DP from 1977 to 2023 (Figure 4) (Thieler et al., 2009).
2.2. Litpack Model
The coastal kinetics 1D numerical model (DHI-LITPACK) is used to simulate the influence of two distinct alternatives that were implemented in reality and to forecast shoreline behavior (Sarhan et al., 2020; Pareta, 2024). The 1D LITPACK model has been applied in multiple research projects in Egypt and worldwide to predict long-term shoreline deformation (Hendriyono et al., 2015; Khalifa et al., 2017; Nassar et al., 2018; Sarhan et al., 2020; Athira and Lekshmi Devi, 2023; Moghazy et al., 2024). LITPACK integrates and enhances several predefined numerical models, specifically non-cohesive sediment transport (STP), longshore current and littoral drift (LITDRIFT), coastline evolution (LITLINE), sedimentation in trenches (LITREN), and cross-shore profile evolution (LITPROF) (Nassar et al., 2018). The LITPACK module (1D) is a component of the MIKE 21 software. This program simulates sediment migration in response to currents and waves, as well as resulting coastline changes (Balah et al., 2012).
The natural coastal conditions along the east coast of DH were simulated using wave, current, and tide data collected for the entire year 2015. The model encompasses 6.7 km of the study area (see Figure 1C), which is divided into two zones: the first zone, which starts at the eastern jetty of the DP and includes 4 Y-groins, covers 3.3 km, and the second zone, which includes 8 DBWs on the Ras El-Bar coast, covers 3.4 km. The model's initial state is the coastline as measured in 2020. To reproduce the changes in bathymetry across the research region, five profiles are employed. Data on the initial coastline, cross-shore profiles in profile series, wave climates in time series, and sediment properties are entered at the start of the simulation. From beach to sea, the average grain size in the DH region tends to steadily decrease. The mean grain size of sea bottom sediments at up to 6 m water depth ranges from 0.08 mm to 0.22 mm with an overall average of 0.11 mm, while the mean grain size of beach sand ranges from 0.14 mm to 0.58 mm with an overall average of 0.25 mm (Khalifa et al., 2017). The LINTABL modules were used to calibrate the data to ensure accurate results, while the LITLINE module was applied to simulate shoreline evolution sequentially. The governing equation of the LITLINE model is described in detail by Saha and Rahman (2022). The shoreline 2021 survey data were used to calibrate the simulation's results.
2.3. CMS Model
The Coastal Modeling System (CMS), developed by the U.S. Army Corps of Engineers, is a numerical modeling framework designed to analyze coastal hydrodynamics (water levels, waves, and currents), sediment transport (sediment movement driven by wave–current interactions), and morphodynamics (morphological evolution of the seabed and shoreline) in coastal and estuarine environments (Reed et al., 2011; Masria et al., 2013; Wu et al., 2014). It is widely used to evaluate shoreline protection measures, sediment management strategies, and coastal engineering projects. The CMS comprises two primary modules: CMS-Flow, which simulates hydrodynamics and sediment transport, and CMS-Wave, which models wave transformation and wave–current interaction. These two modules are typically coupled to provide an integrated representation of coastal processes. The governing equations for CMS-Wave and CMS-Flow are described in detail by Nassar et al. (2019) and ElKotby et al. (2024a).
For this study, a variable-sized rectangular grid was constructed in CMS-Flow, extending 4 km offshore, 3.5 km inland, 4 km west, and 8 km east of DH, with spatial resolution ranging from 20 × 20 m at the harbor entrance to 150 × 150 m near the offshore boundary. A CMS-Wave grid with identical spatial coverage was also generated (Figure 5A). The observed water surface elevation (WSE) at the open ocean boundary in 2018 was used to drive CMS-Flow and generate the flow field (Figure 5B). Based on an analysis of wave data from 2004 to 2014, the 2014 wave conditions were identified as representative and employed in the modeling process (Figure 5C). The CMS-Wave half-plane model was adopted for this simulation.
Five alternatives were developed to evaluate sedimentation within the Damietta Port navigation channel (DP-NC) and the erosion patterns along the coastal zone east of the port (Figure 6). Alternative 1 represents the port’s projected condition following the construction of two new western jetties, measuring 5,400 m and 5,560 m in length, respectively. Alternative 2 is identical to Alternative 1 but includes the addition of two detached breakwaters (DBWs) to the existing series, with crest levels elevated to +2 m above the water surface. Alternative 3 is similar to Alternative 2, except that the crest levels of all ten DBWs are adjusted to the 0.00 m water level. Alternative 4 also resembles Alternative 2, but the DBWs are converted from emerged to submerged structures (Saengsupavanich et al., 2022), with crest levels positioned 1 m below the water surface. Finally, Alternative 5 maintains the same configuration as Alternative 2, except that the existing Y-shaped groins are infilled, and a seawall is constructed seaward of the groin field.
3. Results and Discussions
3.1. Litpack
The coastline changes in the study area were simulated for one year, from 2020 to 2021. To compare the model-predicted coastline with the shoreline measured in 2021, the model was calibrated using the 2020 surveyed shoreline as the initial boundary. The extension of the sediment transport table, which defines the distance between the initial coastline and the surf zone limit, and the active depth, which determines the closure depth of the study area, are the key parameters used during the calibration process (Sanhory et al., 2022). The final calibration was performed by adjusting the sediment transport table’s extension with values of 30, 70, 100, and 150 m (Figure 7A, B). The active depth of the study area was assumed to be 8 m, and the diffraction spreading factor, representing the wave energy dispersion in deep water, was set to 25. The model is considered calibrated when the simulated and observed shoreline evolutions are in good agreement
Where, the distance between the baseline and the observed coastline is indicated by Po, the distance between the baseline and the modeled shoreline by Pf, the number of grids is N, is the difference between modeled and observed shoreline position at each location or time and is the average difference (bias) between model results and observations.
The discrepancies between the simulation results and the observed data were evaluated using the Root Mean Square Percentage Error (RMSPE) and standard deviation (SD), as defined by Sarhan et al. (2020), using the following equation:
where, the distance between the baseline and the observed coastline is indicated by Po, the distance between the baseline and the modeled shoreline by Pf, the number of grids is N, is the difference between modeled and observed shoreline position at each location or time and is the average difference (bias) between model results and observations
The lowest computed RMSPE, according to the calibration approach using RMPSE data, is 0.84% and 0.75% for the two zones, respectively. The lowest computed SD is 15 m and 14.5 m for the two zones, respectively. Standard deviation quantifies the spread of the residuals (i.e., the differences between modeled and observed values) and reflects how consistently the model can replicate real-world behavior. These values are by 30 m of the extension of the sediment transport table and may be used as a setting for tuning to measure shoreline variations. The calibration findings utilizing the 2020 shoreline observation at a value of 30 m extended transport table at zone 1 are displayed in Figure 7A. With an average rate of 4.5 m/yr, the model can accurately predict severe accretion rates. It can also accurately anticipate erosion behavior, with an average rate of -3.7 m/yr and a maximum pace of -15 m/yr. These rates are entirely comparable to those determined from 2021 measured data and DSAS coastline change rates from Landsat images. Also, Figure 7B displayed the final calibration findings at zone 2. In the shaded area of DBWs, the model accurately predicted severe accretion rates with an average of 2.25 m/yr and a maximum of 12 m/yr; erosion behavior was also accurately predicted with an average of -2.9 m/yr and a maximum of -14 m/yr. Additionally, these rates are completely comparable to those determined from the 2021 measured data and DSAS shoreline change rates from Landsat images. Similar observations were mentioned in Nakamura et al. (2024).
The current case is divided into two portions, each distanced by 3.3 km. Figure 8A illustrates the initial 3.3 km of the shoreline, revealing notable trends of shoreline modification. The maximum measured accretion rates near the eastern jetty of DH are around 22.5 m/yr, 51.85 m/10yr, and 73.66 m/20yr. The erosion trend was quantified with peak values of -15.83 m/yr, -52.81 m/10yr, and -84.26 m/20y localized at the centers of the gabs between 4Y-shaped groins. Figure 8C shows the remaining 3300 m to the end of the research area, including the DBWs. Ras El-Bar, which is shielded by breakwaters, remains completely stable and the salient growth is easily visible, however, accretion slowed down after the fourth DBW. After 10 and 20 yr, the maximum sedimentation rates climbed to 45.5 m and 68.9 m, respectively, from their initial maximum of 11.6 m/yr. The magnitude of a salient behind a breakwater is often correlated with the circulation currents produced by the zigzag movement of the water body brought on by wave run-up and rundown, as well as the movements brought on by the collision of wave crests behind the breakwater centers (Nassar et al., 2018).
Alternative 1 considers reclamation work that has commenced between the four Y-shaped groins east of DP, along with the emergence of a seawall, as observed in satellite imagery. This alternative was the first to evaluate whether these interventions could restore the coastline toward equilibrium, examining shoreline changes after one year, as well as after ten and twenty years. The results indicate that this alternative would have a substantial impact on the coastline updrift of the seawall after the first year, with an average accretion of 23.14 m. After 10 and 20 years, this effect is predicted to increase, reaching maximum gains of 285.7 m and +504.811 m, respectively (Figure8B). In contrast, shoreline evolution down-drift of the seawall shows severe erosion, with significant average retreat of -99.152 m and -1379m, after one-year and 20 years simulation, respectively .
Alternative 2 shows how shoreline changes over a one-, ten-, and twenty-y period might be affected by the building of two more DBWs west of the current breakwaters on the Ras El-Bar coast, making ten. The breakwaters are situated 350 m from the beach and measure 250 m in length, 230 m in gap width, and 4.0 m in active water depth. Given that accretion rates would only reach 30.8 m as maximum value over 20 years, we may infer from the model findings that the new DBWs had no discernible effect on the shoreline as identified in Figure 8D. There is a relation between the salient growth and the current, wave run up and wave crests intersects at the shadow zone of the breakwaters. We see that the amount of sediments has remained rather stable over time after offshore breakwater No. 4.
3.2. CMS Results and Discussion
The CMS-Wave half-plane model was adopted for this simulation. The CMS model was calibrated for DH and the surrounding ocean area using bathymetry maps to 2022 (Figure 1D). The model was run to predict the bottom change one year later, from 2022 to 2023, after the wave and flow mode input data were specified. To perform sensitivity analysis and model calibration, three profiles in the vicinity of DP were examined. Important considered calibration variables are manning coefficients (0.01, 0.025, and 0.04) and a number of sediment transport equations (Lund-CIRP, Van Rijn, and Watanabe). A comparative study was carried out at DH profiles 1, 2, and 3 in 2022 for a one-year simulation in order to emphasize the disparities between measured and anticipated profiles in 2023. With a Manning coefficient of 0.01; a d50 of 0.2 mm; a 400-sec time step; a scaling factor of 2.0; and an adaptation length of 20 m, and using the VanRijn formula, the model is highly qualified to predict coastal morpho-dynamic processes by calculating the Root Mean Square Error (RMSE) for each profile, as shown in Figure 9.
Impact of the latest developments on sedimentation in Damietta Port's navigation channel: DP has recently undergone several modifications and interventions, including the deepening of the navigation channel to 19 m, the extension of the port's eastern and western jetties, and the construction of a new DP-NWJ, which were intended to be the final modifications. The current simulation produced color-filled scalar maps illustrating morphological changes at DH inlets over a one-year period (Figure 10A, F), based on bathymetric data from 2022. Compared to the no-action alternative, sand deposition in the navigation channel decreased significantly by 93% (Figure 11), whereas previous reductions in sedimentation rates were estimated at 72.1% (ElKotby et al., 2024b). The current simulations indicate that the various alternatives have no significant effect on sediment accumulation rates within the approach channel.
The effect of changing the crest level of the 10 Ras El-Bar DBWs on the shoreline morphology was discussed (Figure 10C, D, E). Over the course of a year, simulations using the CMS 2D model were created at various crest levels of breakwaters (+2 above water level, 0 at water level, and -1 below water level). The main difference between the first and second Alternatives is that two more breakwaters are added, making a total of 10 DBWs along Ras El-Bar coast with crest elevations of +2 m above sea level along the coastline. Sediment buildup in the wave shadow zones is a strong suggesting positive restoration of coastal stability in the area (Figure 10C). While the zone between the Y-shaped groins system shows an apparent erosion pattern.
It was initially anticipated that reducing the height of the offshore breakwaters would increase wave energy transmission (Sulisz, 1985; Nguyen et al., 2022), thereby exacerbating shoreline retreat. However, the observed results contradicted this expectation, particularly in the areas behind breakwaters 9 and 10. Severe erosion previously reported was significantly reduced, and the beaches in those areas remained relatively stable, with only minor sediment accumulation. In contrast, breakwaters 7 and 8 experienced more pronounced impacts, and the adjacent beaches began to undergo substantial erosion. When the offshore breakwaters were submerged to a level of -1 m below the water surface, as in Alternative 4, conditions resembled those of Alternative 3, although the situation began to deteriorate further (Figure 10D, E).
Overall, morphological changes across all proposed alternatives, including erosion patterns and sediment deposition, are summarized in Figure 10, highlighting the varying effects on shoreline stability. Four detailed profiles along Ras El-Bar beach (Figure 11) were strategically selected to provide further insight into morphological alterations under Alternatives 2, 3, and 4. These profiles corroborate the finding that these structures play a critical role in maintaining shoreline integrity. Table 1 provides detailed information on the cumulative eroded and accreted zones at the zones behind detached breakwaters along Ras El-bar coast.
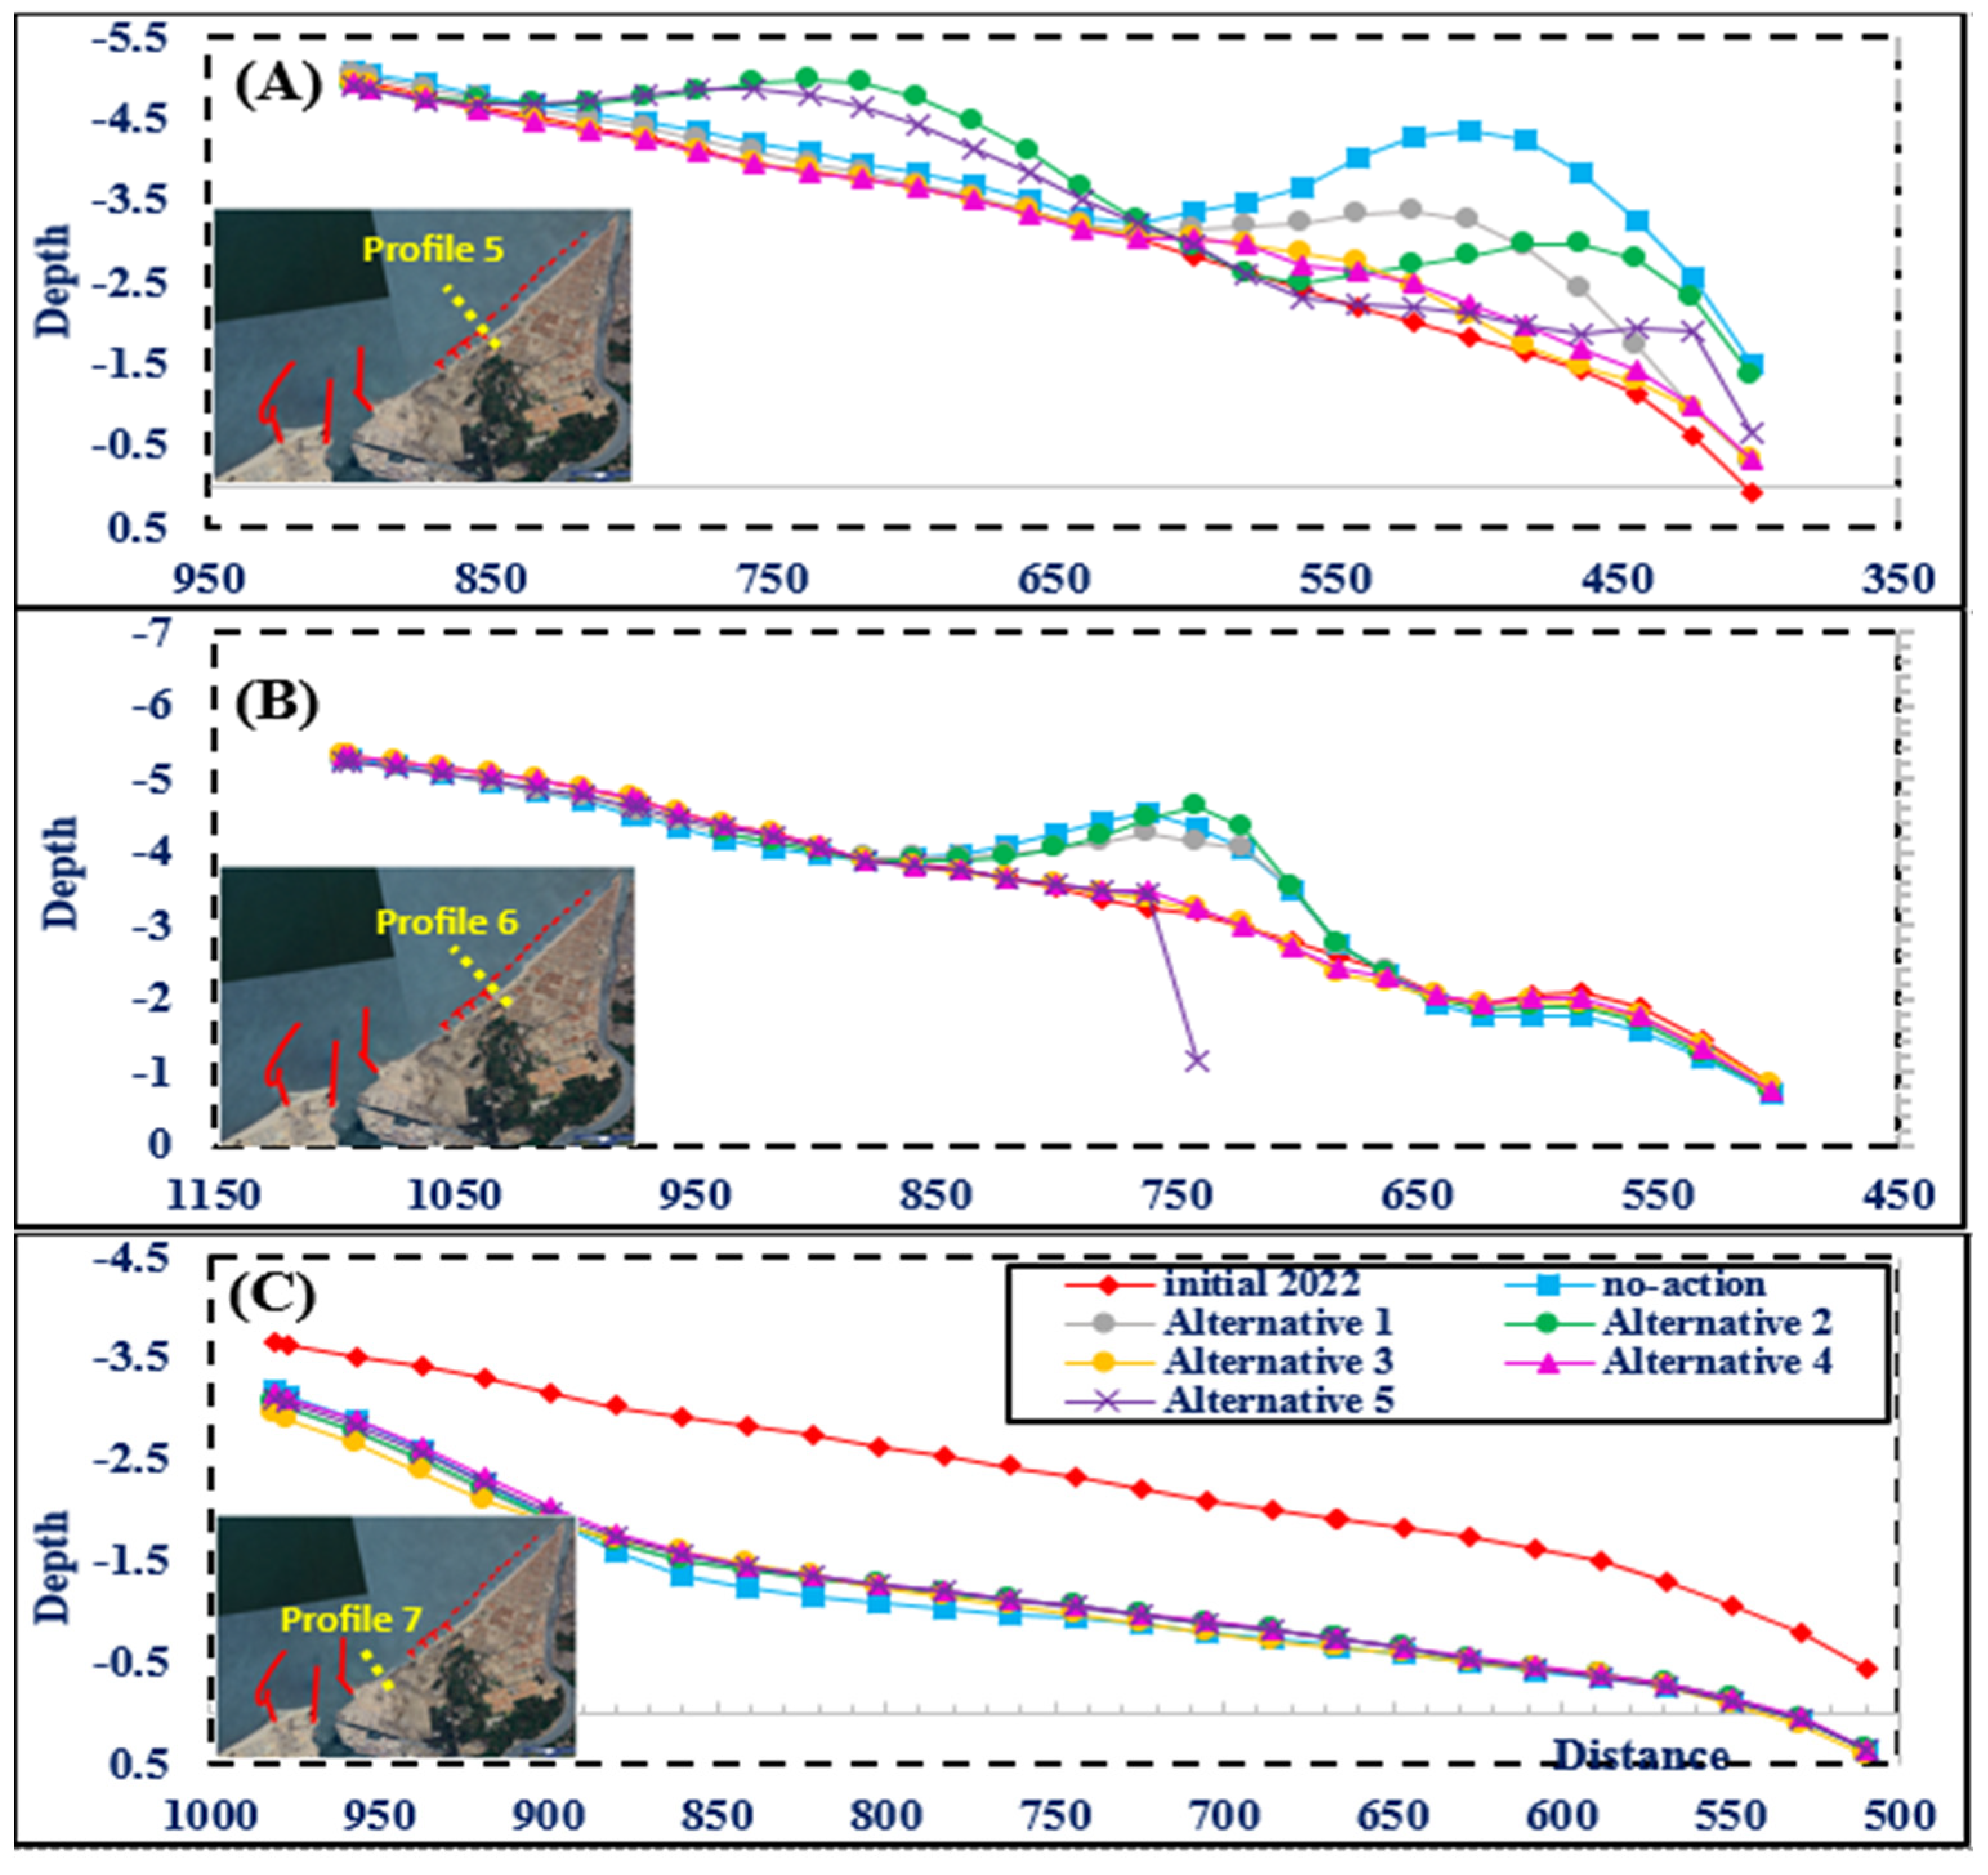
Alternative 5 entails filling in the gaps between the current groins with sediment before building a seawall. Although the findings indicate that this intervention would not have an apparent impact on shoreline dynamics, it does provide a considerable economic chance by recovering a sizable portion of land that would be used for a projected tourism development project (Figure 10F). The three profiles that were shown in Figure 12 all asserted the same outcomes. Erosion predominated in all considered alternatives inside Zone 1, with minor variations among them. In Zone 2, as illustrated in Table 1, situated between the groin system and the offshore breakwaters, the volume of eroded sediment was -147,180 m³ under benchmark case. This amount significantly decreased to -67,491.4 m³ in Alternative 1. In Alternative 2, sediment accumulation increased to +604.457 m³, further rising to +7967.1 m³ in Alternative 3, which represented the maximum accumulation. However, in Alternative No. 4, erosion occurred again, resulting in -6670.95 m³, followed by a sediment accumulation of +1482.12 m³ in Alternative 5. The benchmark value for the accumulated sediment in Zone 3 was +60432.8 m3. This quantity decreased in Alternative 1 to +21083.5 m3, while in the other alternatives, sedimentation turned into substantial erosion, with Alternative 3 recording the greatest value at -14970.1m3.
4. Conclusions
The current study employs an integrated numerical modeling procedure to look into the interrelated challenges of coastal erosion and sediment accumulation affecting the Damietta coastal zone and the navigation channel of DP, Egypt. Utilizing the LITPACK shoreline evolution model, long-term shoreline changes were simulated over a 20-year forecast period under two realistic development alternative s including adding two DBWs and creating seawall after infilling regions between Y-groins with sediment. The shoreline updrift seawall advanced as maximum value of 504.811 m/ yr while shoreline in downdrift seawall suffered from significant erosion with average value of -1379 m/20y .
With an emphasis on sediment transport behavior in the wake of the most recent DH design modifications, a two-dimensional hydrodynamic and morphological simulation was carried out using the Coastal Modeling System (CMS). These modifications include digging a secondary navigation canal that is 9 m deep to serve the dirty casting berth, as well as building a 5,560-meter western jetty. The efficiency of the port expansion layout in eliminating accumulation was shown by model outputs that showed a 93% reduction in sedimentation rates within the navigation channel when compared to benchmark situation. The study also evaluated the DBWs’ morphodynamical response to different crest levels along the Ras El-Bar shoreline, highlighting their crucial role in influencing beach stability and erosion trends. The results demonstrate that, when compared to other simulated alternative s, DBWs with crest levels at sea levels perform the best. Comparing what came out of the LITPACK and CMS models, it was found that they were very consistent across two common alternatives.
Acknowledgments
This paper is part of the project “Sustainable Development of the Coastal zone between Ras El-Bar and Damietta Harbor in response to sea-level rise and climatic changes”. The authors would like to express their sincere gratitude to the Academy of Scientific Research and Technology (ASRT) for funding the project through COP-27.
References
- Abd El-Hamid, H.T., 2020. Geospatial analyses for assessing the driving forces of land use/land cover dynamics around the Nile Delta Branches, Egypt. Journal of the Indian Society of Remote Sensing, 48(12), pp.1661-1674.
- Abd-Elhamid, H.F., Zeleňáková, M., Barańczuk, J., Gergelova, M.B. and Mahdy, M., 2023. Historical trend analysis and forecasting of shoreline change at the Nile Delta using RS data and GIS with the DSAS tool. Remote Sensing, 15(7), p.1737. [CrossRef]
- Abo Zed, B.I, 2007. Effects of waves and currents on the siltation problem of Damietta harbor, Nile Delta coast, Egypt, Mediterr. Mar. Sci. 8, 33–47.
- Abou Samra, R.M., El-Gammal, M., Al-Mutairi, N., Alsahli, M.M. and Ibrahim, M.S., 2021. GIS-based approach to estimate sea level rise impacts on Damietta coast, Egypt. Arabian Journal of Geosciences, 14, pp.1-13. [CrossRef]
- Athira, C.A. and Lekshmi Devi C A., 2023. Assessment of Longshore Sediment Transport Using LITPACK.
- Aziz, K.M.A., 2024. Quantitative Monitoring of Coastal Erosion and Changes Using Remote Sensing in a Mediterranean Delta. Civil Engineering Journal, 10(6), pp.1842-1862.
- Bacino, G.L., Dragani, W.C. and Codignotto, J.O., 2019. Changes in wave climate and its impact on the coastal erosion in Samborombón Bay, Río de la Plata estuary, Argentina. Estuarine, Coastal and Shelf Science, 219, 71-80. [CrossRef]
- Balah M. I., Elshinnawy I., Tolba E. R. and Youness M., 2012. Impact of Coastal Erosion and Sedimentation along the Northern Coast of Sinai Peninsula, Case Study: AL-ARISH Harbor Coast. Port-Said Engineering Research Journal, 16(1), pp.118-125.
- Bazzichetto, M., Sperandii, M.G., Malavasi, M., Carranza, M.L. and Acosta, A.T.R., 2020. Disentangling the effect of coastal erosion and accretion on plant communities of Mediterranean dune ecosystems. Estuarine, Coastal and Shelf Science, 241, 106758. [CrossRef]
- Cheon, S.H. and Suh, K.D., 2016. Effect of sea level rise on nearshore significant waves and coastal structures. Ocean Engineering, 114, 280-289. http://dx.doi.org/10.1016/ j.oceaneng.2016.01.026.
- Damietta Port Authority, 2023. Annual Operational and Financial Report. Damietta Port Authority, Damietta, Egypt.
- Darwish, K.S., 2024. Monitoring Coastline Dynamics Using Satellite Remote Sensing and Geographic Information Systems: A Review of Global Trends. Catrina: The International Journal of Environmental Sciences, pp.1-23.
- Deabes, E.A.E.H.M., 2010. Sedimentation processes at the navigation channel of the liquefied natural gas (LNG) port, Nile Delta, Egypt. International Journal of Geosciences, 1(1), pp.14-20.
- Deng, B., Wu, H., Yang, S. and Zhang, J., 2017. Longshore suspended sediment transport and its implications for submarine erosion off the Yangtze River Estuary. Estuarine, Coastal and Shelf Science, 190, pp.1-10. [CrossRef]
- Dewidar, K. M., and Frihy, O. E., 2010. Automated techniques for quantification of beach change rates using Landsat series along the North-eastern Nile Delta, Egypt. In Journal of Oceanography and Marine Science 1(2).
- Dewidar, K., Bayoumi, S., 2021. Forecasting shoreline changes along the Egyptian Nile Delta coast using Landsat image series and Geographic Information System. Environ Monit Assess 193, 429. [CrossRef]
- Eelsalu, M., Montoya, R.D., Aramburo, D., Osorio, A.F. and Soomere, T., 2024. Spatial and temporal variability of wave energy resource in the eastern Pacific from Panama to the Drake passage. Renewable Energy, 224, 120180. [CrossRef]
- El-Asmar, H. M., and Taha, M. M. N., 2022. Monitoring Coastal Changes and Assessing Protection Structures at the Damietta Promontory, Nile Delta, Egypt, to Secure Sustainability in the Context of Climate Changes. Sustainability (Switzerland), 14(22). [CrossRef]
- El-Asmar, H. M., El-Kafrawy, S. B., and Taha, M. M. N., 2014. Monitoring Coastal Changes along Damietta Promontory and the Barrier Beach toward Port Said East of the Nile Delta, Egypt. Journal of Coastal Research, 297, 993–1005. [CrossRef]
- El-Asmar, H.M., 1994. Severe coastal damage along Ras El-Bar shoreline, north of the Nile Delta: An effect of the construction of the detached breakwater system. Journal of Geology, Egypt 38, 793–812.
- El-Asmar, H.M., 2002. Short term coastal changes along Damietta-port Said coast northeast of the Nile Delta, Egypt. Journal of Coastal Research 18, 433–441.
- El-Asmar, H.M., Felfla, M.Sh., ElKotby, M.R., El-Kafrawy, S.B., Naguib, D.M., 2025a. Multi-Decadal shoreline dynamics of Ras El-Bar, Nile Delta: Unraveling human interventions and coastal resilience. Scientific African e02937. [CrossRef]
- El-Asmar, H.M., Felfla, M.Sh., Ragab, M.T., Naguib, D.M., El-Kafrawy, S.B., 2025b. New beach geomorphic features associated with a temporal climate storm event, coinciding with the February 6, 2023, little tsunami, Ras El-Bar, Nile Delta coast, Egypt. Geoscience Letters 12. [CrossRef]
- El-Asmar, H.M., Taha, M.M. and El-Sorogy, A.S., 2016. Morphodynamic changes as an impact of human intervention at the Ras El-Bar-Damietta Harbor coast, NW Damietta promontory, Nile Delta, Egypt. Journal of African Earth Sciences, 124, pp.323-339.
- El-Asmar, H.M., White, K., 2002. Changes in coastal sediment transport processes due to construction of New Damietta Harbour, Nile Delta, Egypt. Coastal Engineering 46, 127–138. [CrossRef]
- ElKotby, M. R., Sarhan, T. A., and El-Gamal, M., 2023. Assessment of human interventions presence and their impact on shoreline changes along Nile delta, Egypt. Oceanologia, 65(4), 595–611. [CrossRef]
- ElKotby, M.R., Sarhan, T.A., El-Gamal, M. and Masria, A., 2024a. Impact evaluation of development plans in the Egyptian harbors on morphological changes using numerical simulation (case study: Damietta harbor, northeastern coast of Egypt). Remote Sens. Appl.: Soc. Environ., p.101301. [CrossRef]
- ElKotby, M.R., Sarhan, T.A., El-Gamal, M. and Masria, A., 2024b. Evaluation of coastal risks to Sea level rise: Case study of Nile Delta Coast. Regional Studies in Marine Science, 78, p.103791. [CrossRef]
- Elnabwy, M.T., Elbeltagi, E., El Banna, M.M., Alshahri, A.H., Hu, J.W., Choi, B.G., Kwon, Y.H. and Kaloop, M.R., 2024. Harbor Sedimentation Management Using Numerical Modeling and Exploratory Data Analysis. Advances in Civil Engineering, 2024(1), p.1209460.
- El-Zeiny, A., Gad, A.-A., El-Gammal, M., and Ibrahim, M., 2016. Space-borne technology for monitoring temporal changes along Damietta shoreline, Northern Egypt. In International Journal of Advanced Research 4(1). http://glovis.usgs.gov/.
- Esmail, M., Mahmod, W., and Fath, H., 2018. Influence of Coastal Measures on Shoreline Kinematics Along Damietta coast Using Geospatial Tools. IOP Conf. Ser. Earth Environ. Sci., 151(1), p.012027. [CrossRef]
- Frihy, O.E. and Stanley, J.D., 2023. The modern Nile delta continental shelf, with an evolving record of relict deposits displaced and altered by sediment dynamics. Geographies, 3(3), pp.416-445.
- Frihy, O.E., Abd El Moniem, A.B. and Hassan, M.S., 2002. Sedimentation processes at the navigation channel of the Damietta Harbour on the Northeastern Nile Delta coast of Egypt. Journal of Coastal Research, pp.459-469.
- Hendriyono, W., Wibowo, M., Al Hakim, B. and Istiyanto, D.C., 2015. Modeling of sediment transport affecting the coastline changes due to infrastructures in Batang-Central Java. Procedia Earth and Planetary Science, 14, pp.166-178.
- Jerin Joe, R.J., Pitchaimani, V.S., Mirra, T.N.S. and Karuppannan, S., 2025. Shoreline dynamics and anthropogenic influences on coastal erosion: A multi-temporal analysis for sustainable shoreline management along a southwest coastal district of India. Environmental and Sustainability Indicators, 27, p.100744. [CrossRef]
- Khalifa, A. M., Soliman, M. R., and Yassin, A. A., 2017. Assessment of a combination between hard structures and sand nourishment eastern of Damietta harbor using numerical modeling. ALEX ENG J., 56(4), 545–555. [CrossRef]
- Li, Y., Zhang, C., Cai, Y., Xie, M., Qi, H. and Wang, Y., 2021. Wave dissipation and sediment transport patterns during shoreface nourishment towards equilibrium. Journal of Marine Science and Engineering, 9(5), 535. [CrossRef]
- Marks, D., Middleton, C. and Pratomlek, O., 2025. Precarity between a megacity and coastal erosion: A political economy of (un) managed retreat pathways in Thailand's peri-urban Khun Samut Chin. Ocean & Coastal Management, 270, 107919. [CrossRef]
- Masria, A., El-Adawy, A. and Eltarabily, M.G., 2021. Simulating mitigation scenarios for natural and artificial inlets closure through validated morphodynamic models. Reg. Stud. Mar. Sci., 47, p.101991. [CrossRef]
- Masria, A.A., Negm, A.M., Iskander, M.M., Saavedra, O.C., 2013. Hydrodynamic modeling of outlet stability case study Rosetta promontory in Nile delta. Water Science 27, 39–47. [CrossRef]
- Moghazy, N.H., Soliman, A. and ELTahan, M., 2024. Effect of Human Interventions on Hydro-dynamics of Sidi-Abdel Rahman Bay “North Western Coast of Egypt”.
- Nakamura, R., Ohizumi, K., Ishibashi, K., Katayama, D. and Aoki, Y., 2024. Dynamics of beach scarp formation behind detached breakwaters. Estuarine, Coastal and Shelf Science, 298, 108651. [CrossRef]
- Nassar, K., Mahmod, W. E., Masria, A., Fath, H., and Nadaoka, K., 2018. Numerical simulation of shoreline responses in the vicinity of the western artificial inlet of the Bardawil Lagoon, Sinai Peninsula, Egypt. Appl. Ocean Res., 74, 87–101. [CrossRef]
- Nassar, K., Masria, A., Mahmod, W. E., Negm, A., and Fath, H., 2019. Hydro-morphological modeling to characterize the adequacy of jetties and subsidiary alternatives in sedimentary stock rationalization within tidal inlets of marine lagoons. Appl. Ocean Res., 84, 92–110. [CrossRef]
- Nguyen, N.-M., Van, D.D., Duy, T.L., Pham, N.T., Dang, T.D., Tanim, A.H., Wright, D., Thanh, P.N., Anh, D.T., 2022. The influence of crest width and working states on wave transmission of Pile–Rock breakwaters in the coastal Mekong Delta. Journal of Marine Science and Engineering 10, 1762. [CrossRef]
- Pareta, K., 2024. 1D-2D hydrodynamic and sediment transport modelling using MIKE models. Discover Water 4. [CrossRef]
- Ragab, M.T.M., 2025. The use of remote sensing techniques in the observation and evaluation of sediments movement in the marine belt environment of Damietta Harbor. Unpublished M.Sc. thesis, Damietta University, Damietta, Egypt.
- Reed, C.W., Brown, M.E., Sánchez, A., Wu, W., Buttolph, A.M., 2011. The Coastal Modeling System Flow Model (CMS-Flow): past and present. Journal of Coastal Research 59, 1–6. [CrossRef]
- Romero-Martín, R., Valdemoro, H. and Jiménez, J.A., 2025. Unveiling coastal adaptation demands: Exploring erosion-induced spatial imperatives on the Catalan Coast (NW Mediterranean). Landscape and Urban Planning, 263, 105450. [CrossRef]
- Saengsupavanich, C., Ariffin, E.H., Yun, L.S. and Pereira, D.A., 2022. Environmental impact of submerged and emerged breakwaters. Heliyon, 8 (12). [CrossRef]
- Saha, D., Rahman, Md.A., 2022. Simulation of longshore sediment transport and coastline changing along Kuakata Beach by mathematical modeling. IOSR Journal of Mechanical and Civil Engineering 19, 15–31. [CrossRef]
- Sanhory, A., El-Tahan, M., Moghazy, H.M. and Reda, W., 2022. Natural and manmade impact on Rosetta eastern shoreline using satellite Image processing technique. Alexandria Engineering Journal, 61(8), pp.6247-6260.
- Sarhan, T., Mansour, N.A. and El-Gamal, M., 2020. Prediction of Shoreline Deformation around Multiple Hard Coastal Protection Systems. MEJ-Mansoura Engineering Journal, 45(3), pp.11-21. [CrossRef]
- Sharaan, M., Ibrahim, M.G., Iskander, M., Masria, A., Nadaoka, K., 2018. Analysis of sedimentation at the fishing harbor entrance: case study of El-Burullus, Egypt. Journal of Coastal Conservation 22, 1143–1156. [CrossRef]
- Sulisz, W., 1985. Wave reflection and transmission at permeable breakwaters of arbitrary cross-section. Coastal Engineering 9, 371–386. [CrossRef]
- Tang, B., Nederhoff, K. and Gallien, T.W., 2025. Quantifying compound coastal flooding effects in urban regions using a tightly coupled 1D–2D model explicitly resolving flood defense infrastructure. Coastal Engineering, 199, 104728.
- Thieler, E.R., Himmelstoss, E.A., Zichichi, J.L., Ergul, A., 2009. The Digital Shoreline Analysis System (DSAS) Version 4.0 - An ArcGIS extension for calculating shoreline change. Antarctica a Keystone in a Changing World. [CrossRef]
- White, K. and El-Asmar, H.M., 1999. Monitoring changing position of coastlines using Thematic Mapper imagery, an example from the Nile Delta. Geomorphology, 29(1-2), 93-105.
- Wu, W., Rosati, J.D., Brown, M.E., Demirbilek, Z., Li, H., Reed, C.W., Sanchez, A., Laboratory, C. and H., Program, C.I.R., 2014. Coastal Modeling System : Mathematical formulations and numerical methods. URL https://hdl.handle.net/11681/7361.
- Youssef, Y.M., Gemail, K.S., Atia, H.M. and Mahdy, M., 2024. Insight into land cover dynamics and water challenges under anthropogenic and climatic changes in the eastern Nile Delta: inference from remote sensing and GIS data. Science of the Total Environment, 913, p.169690. [CrossRef]
Figure 1.
(A) Study area location WITH zoom-in Airal photograps and map wiews showing the vital sites. (B) Wave date from 2004 to 2014. (C) Echo sounder-drived bathymetry data 2020 for LITPACK model. (D) Bathymetry data 2022 for CMS model.
Figure 1.
(A) Study area location WITH zoom-in Airal photograps and map wiews showing the vital sites. (B) Wave date from 2004 to 2014. (C) Echo sounder-drived bathymetry data 2020 for LITPACK model. (D) Bathymetry data 2022 for CMS model.
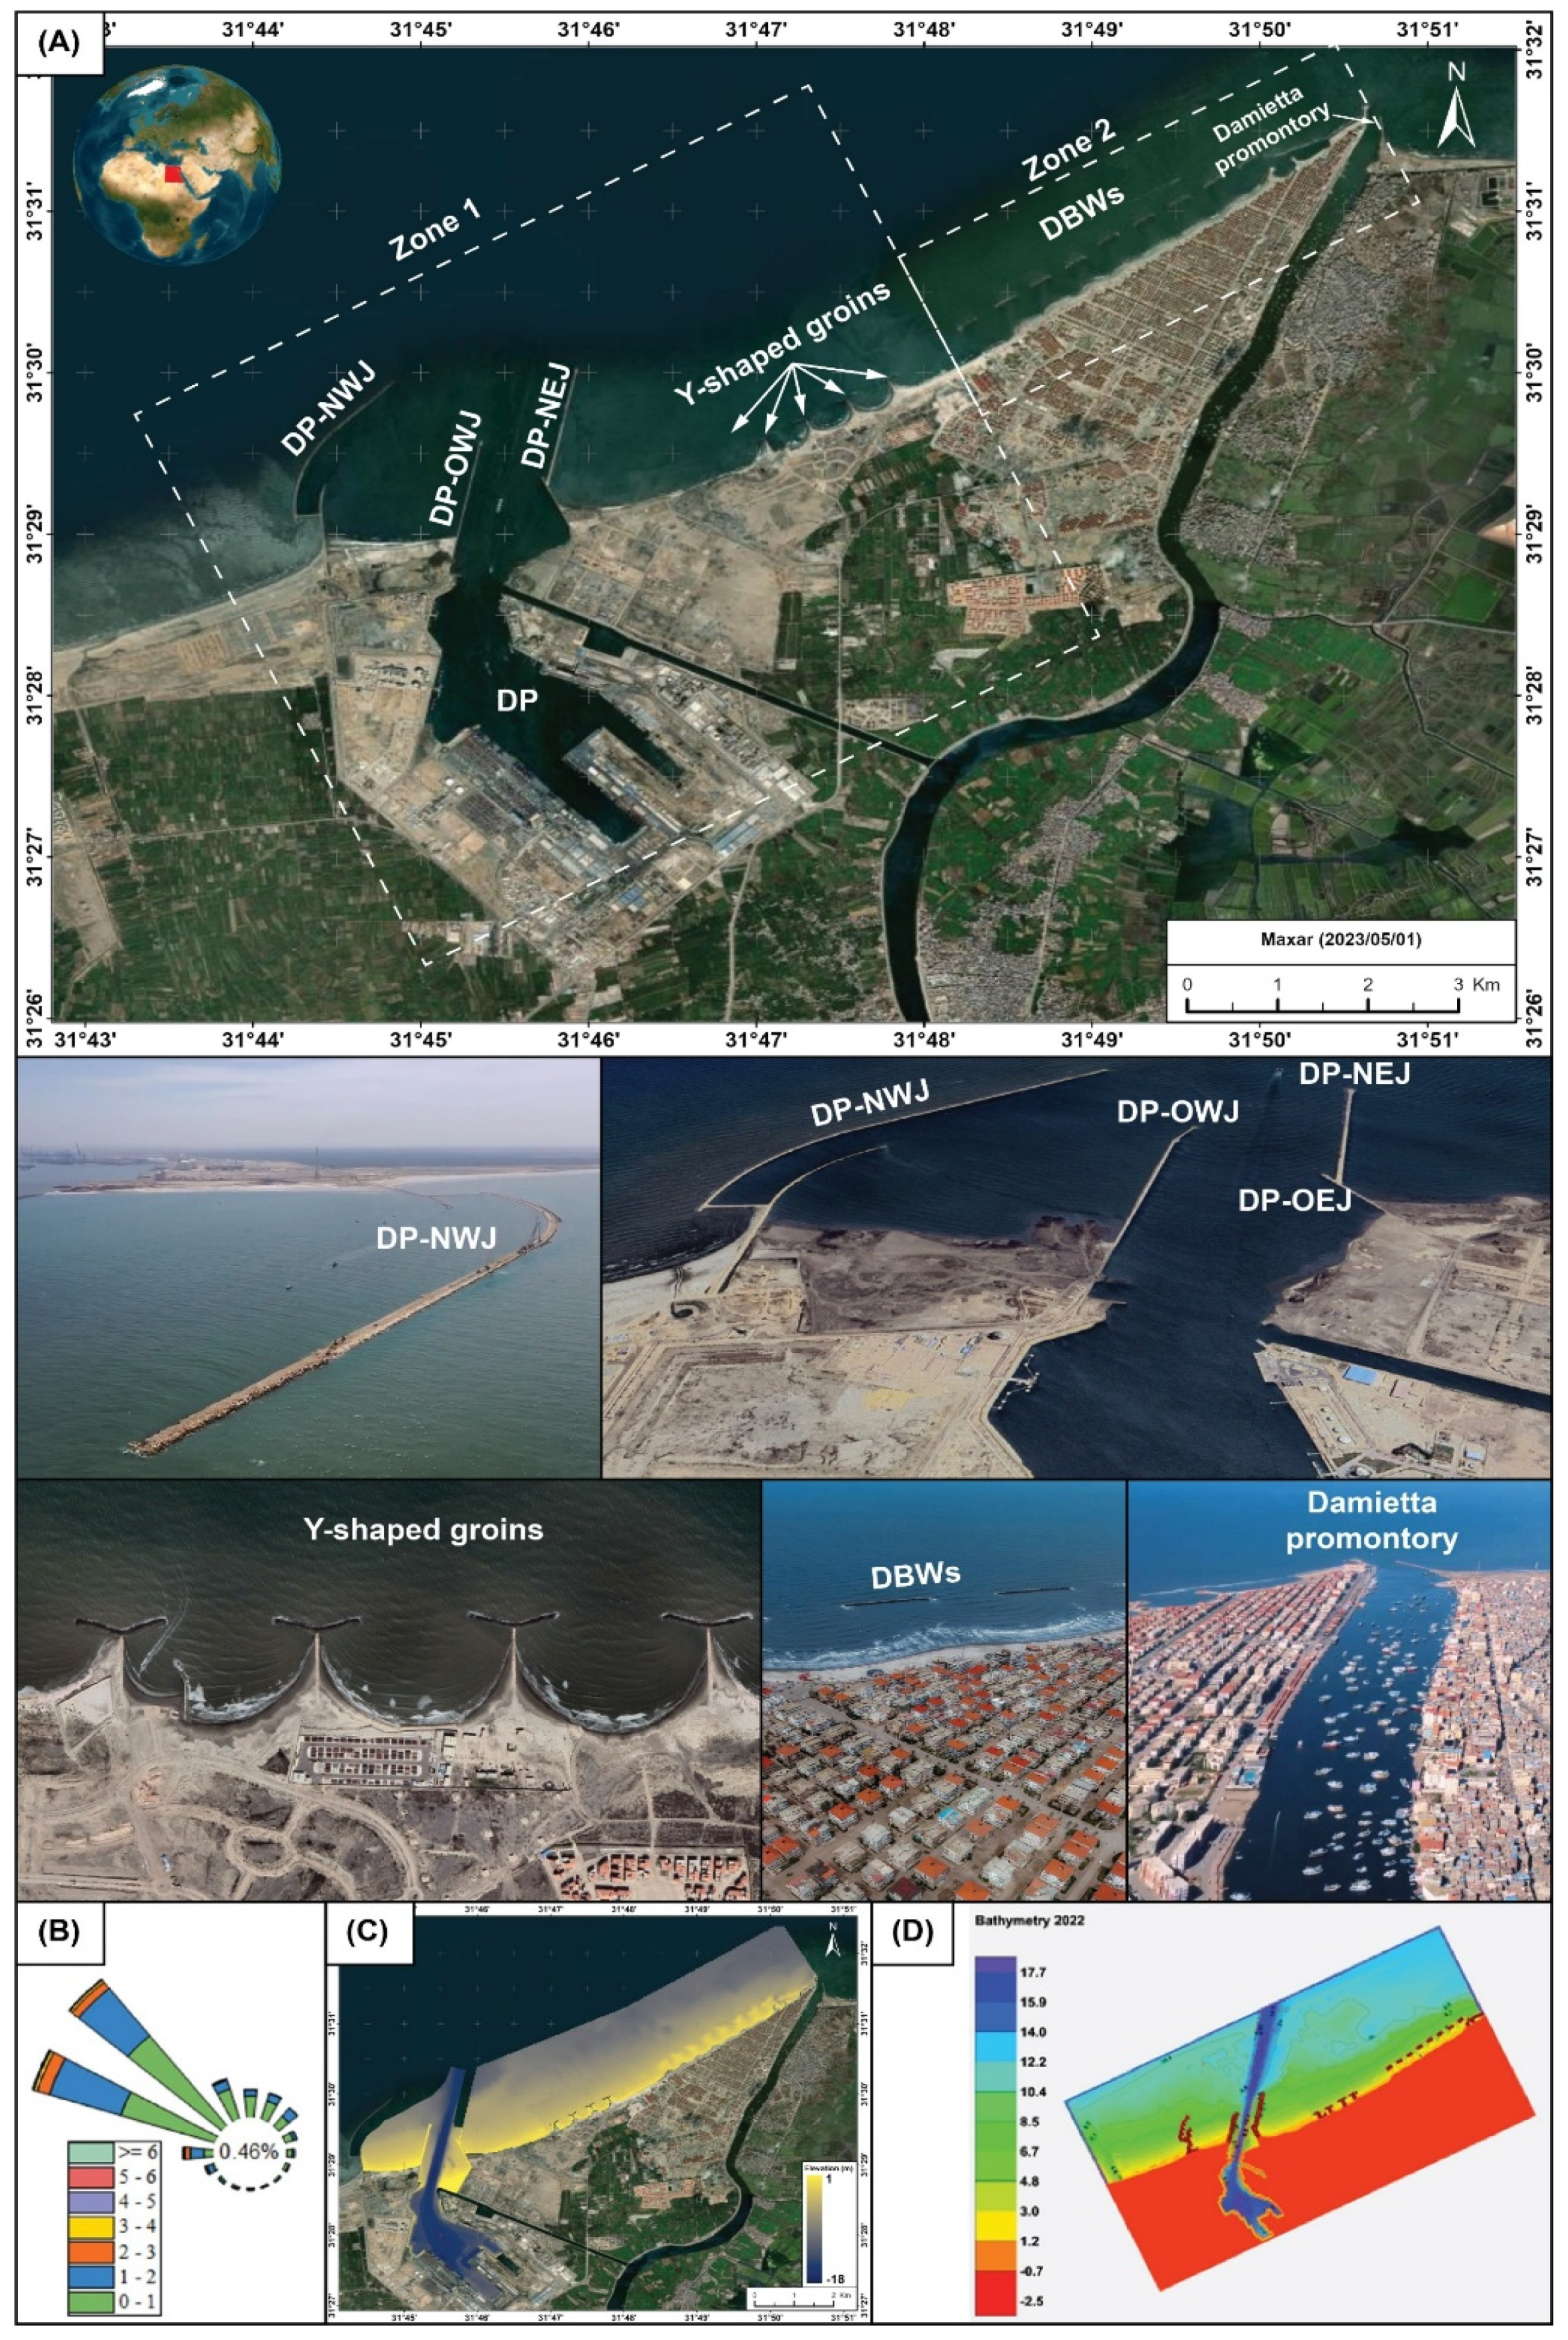
Figure 2.
Time-series Landsat satellite imagery (Bands 2 from Landsat 4, 5, and 8) illustrating the morphological and infrastructural development of DP from October 9, 1982, to March 13, 2025. The images highlight significant changes including port excavation, construction and extension of jetties, development of the navigation channel, progressive land reclamation, and port infrastructure expansion.
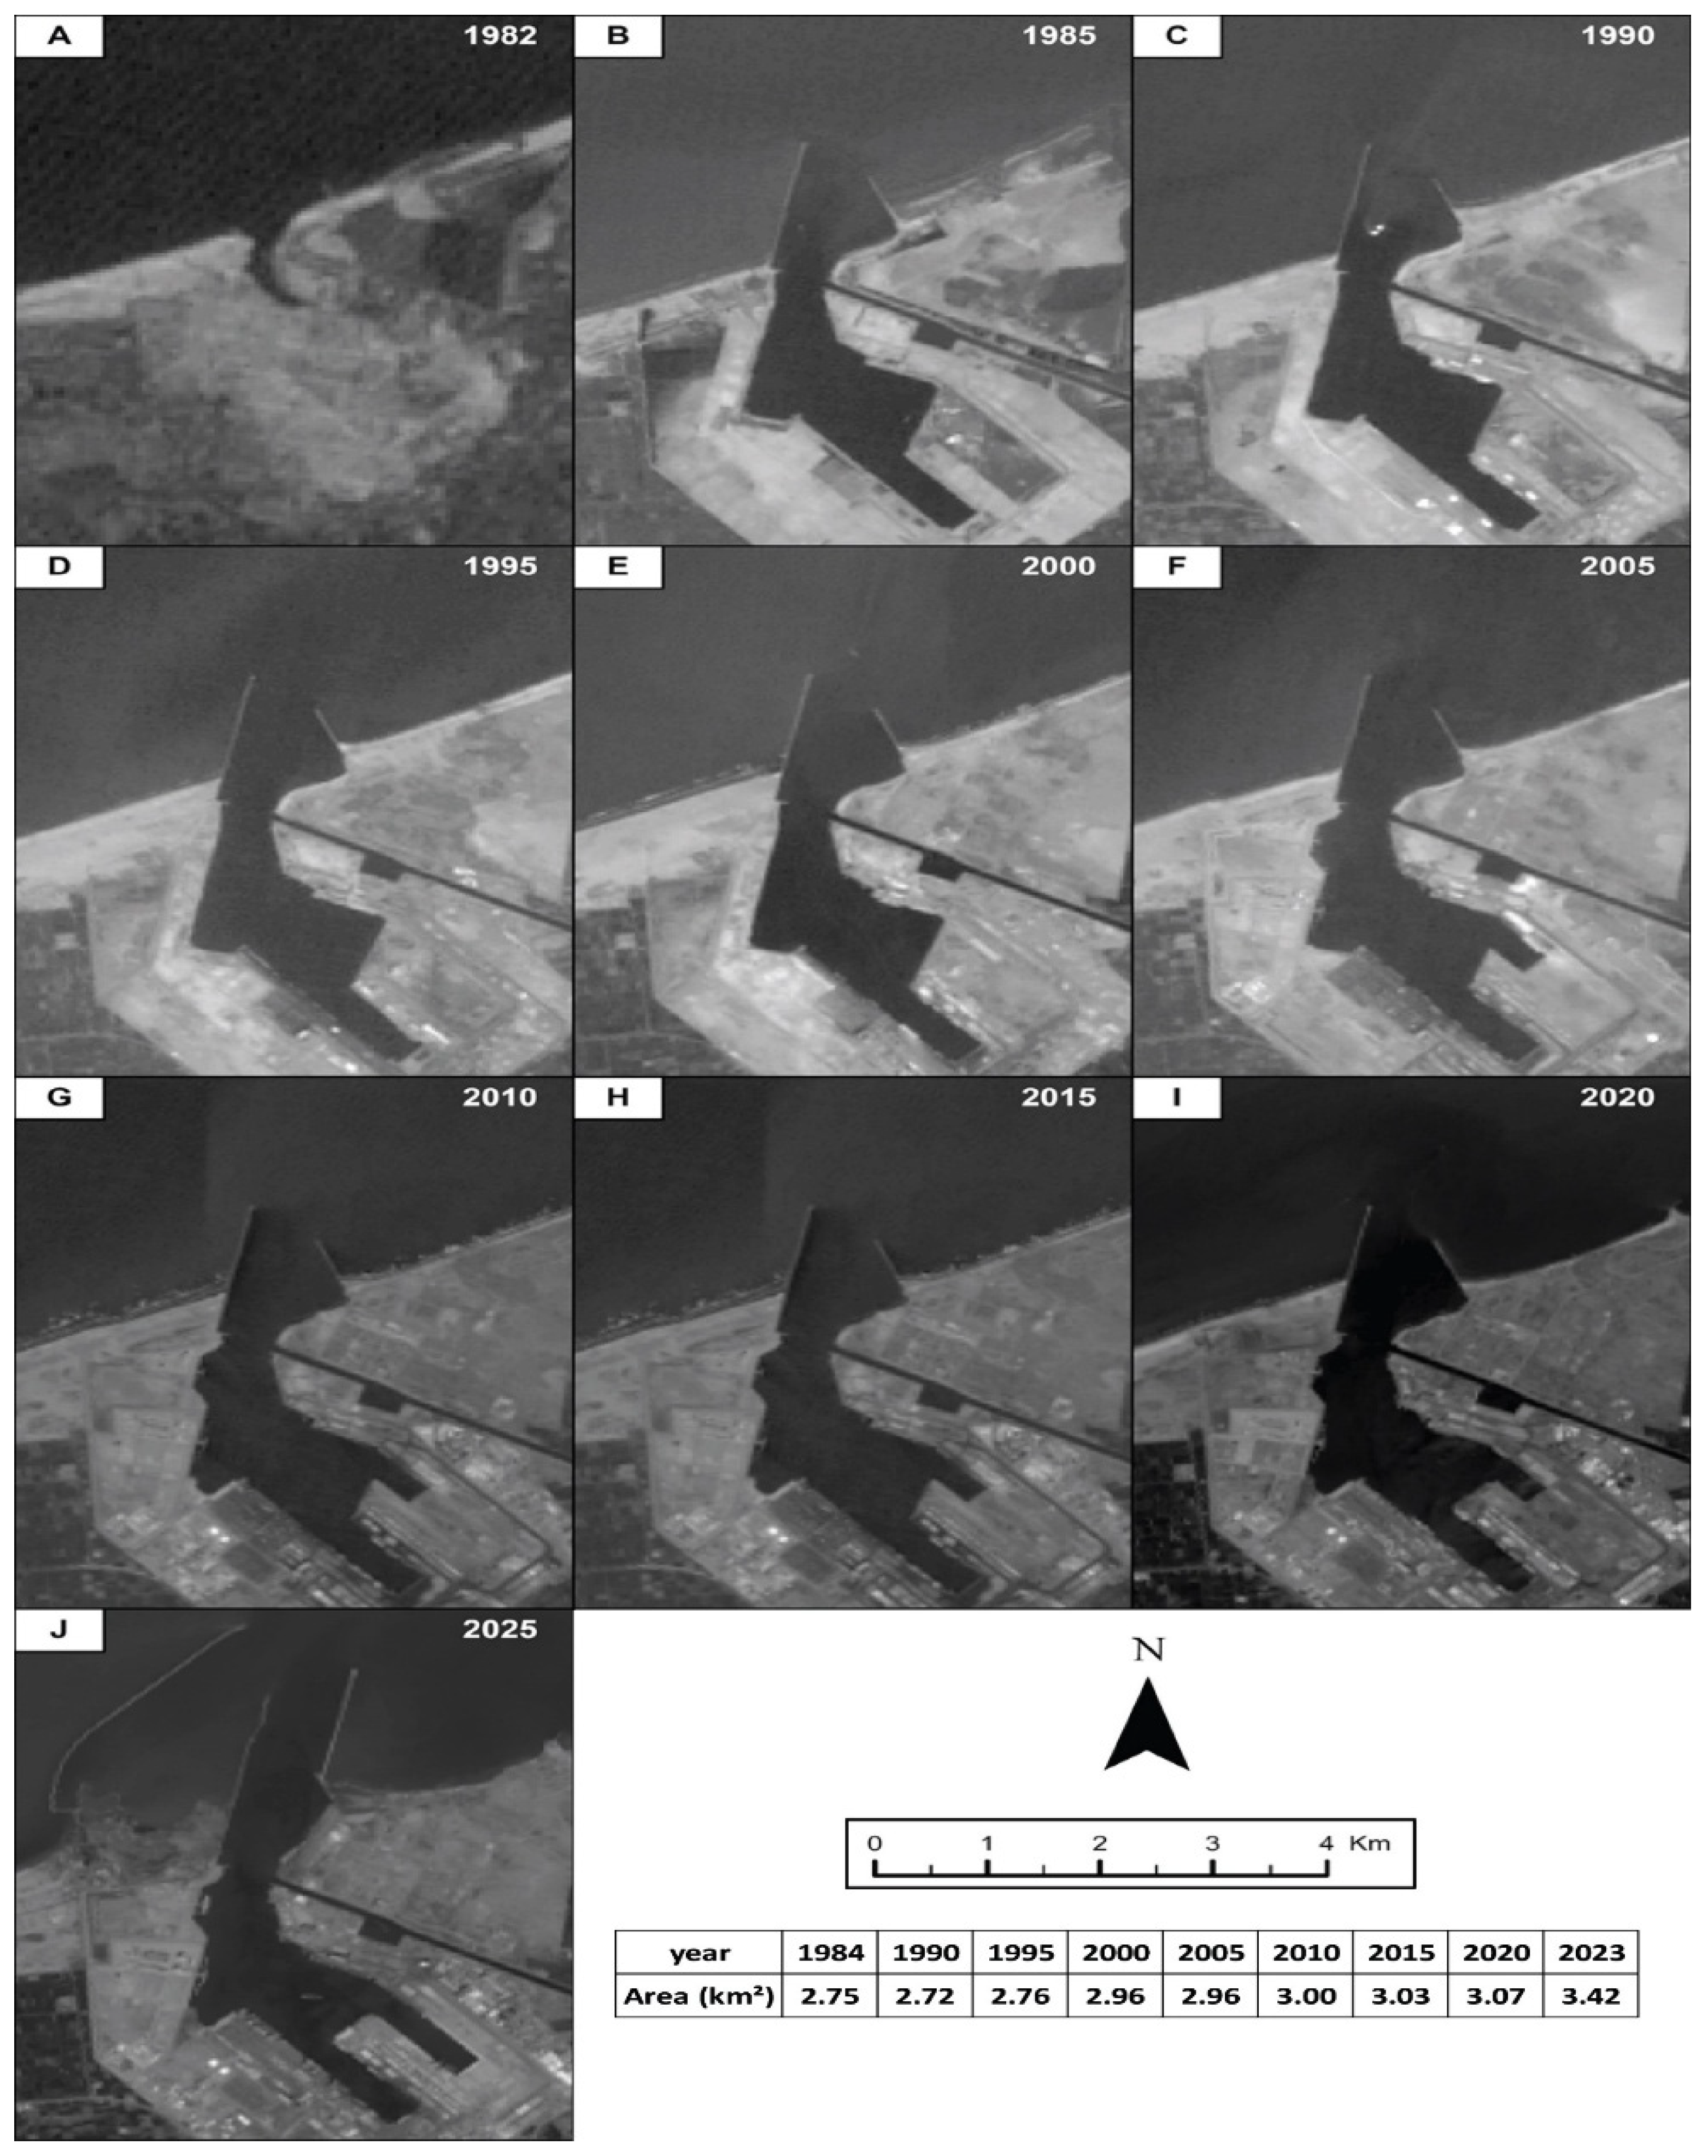
Figure 3.
Echo sounder-derived bathymetry maps of DP in 2022 (A) and 2024 (B). (C) W-E cross-sectional profile along DP-Navigation channel shows the change in bathymetry between the two surveys.
Figure 3.
Echo sounder-derived bathymetry maps of DP in 2022 (A) and 2024 (B). (C) W-E cross-sectional profile along DP-Navigation channel shows the change in bathymetry between the two surveys.
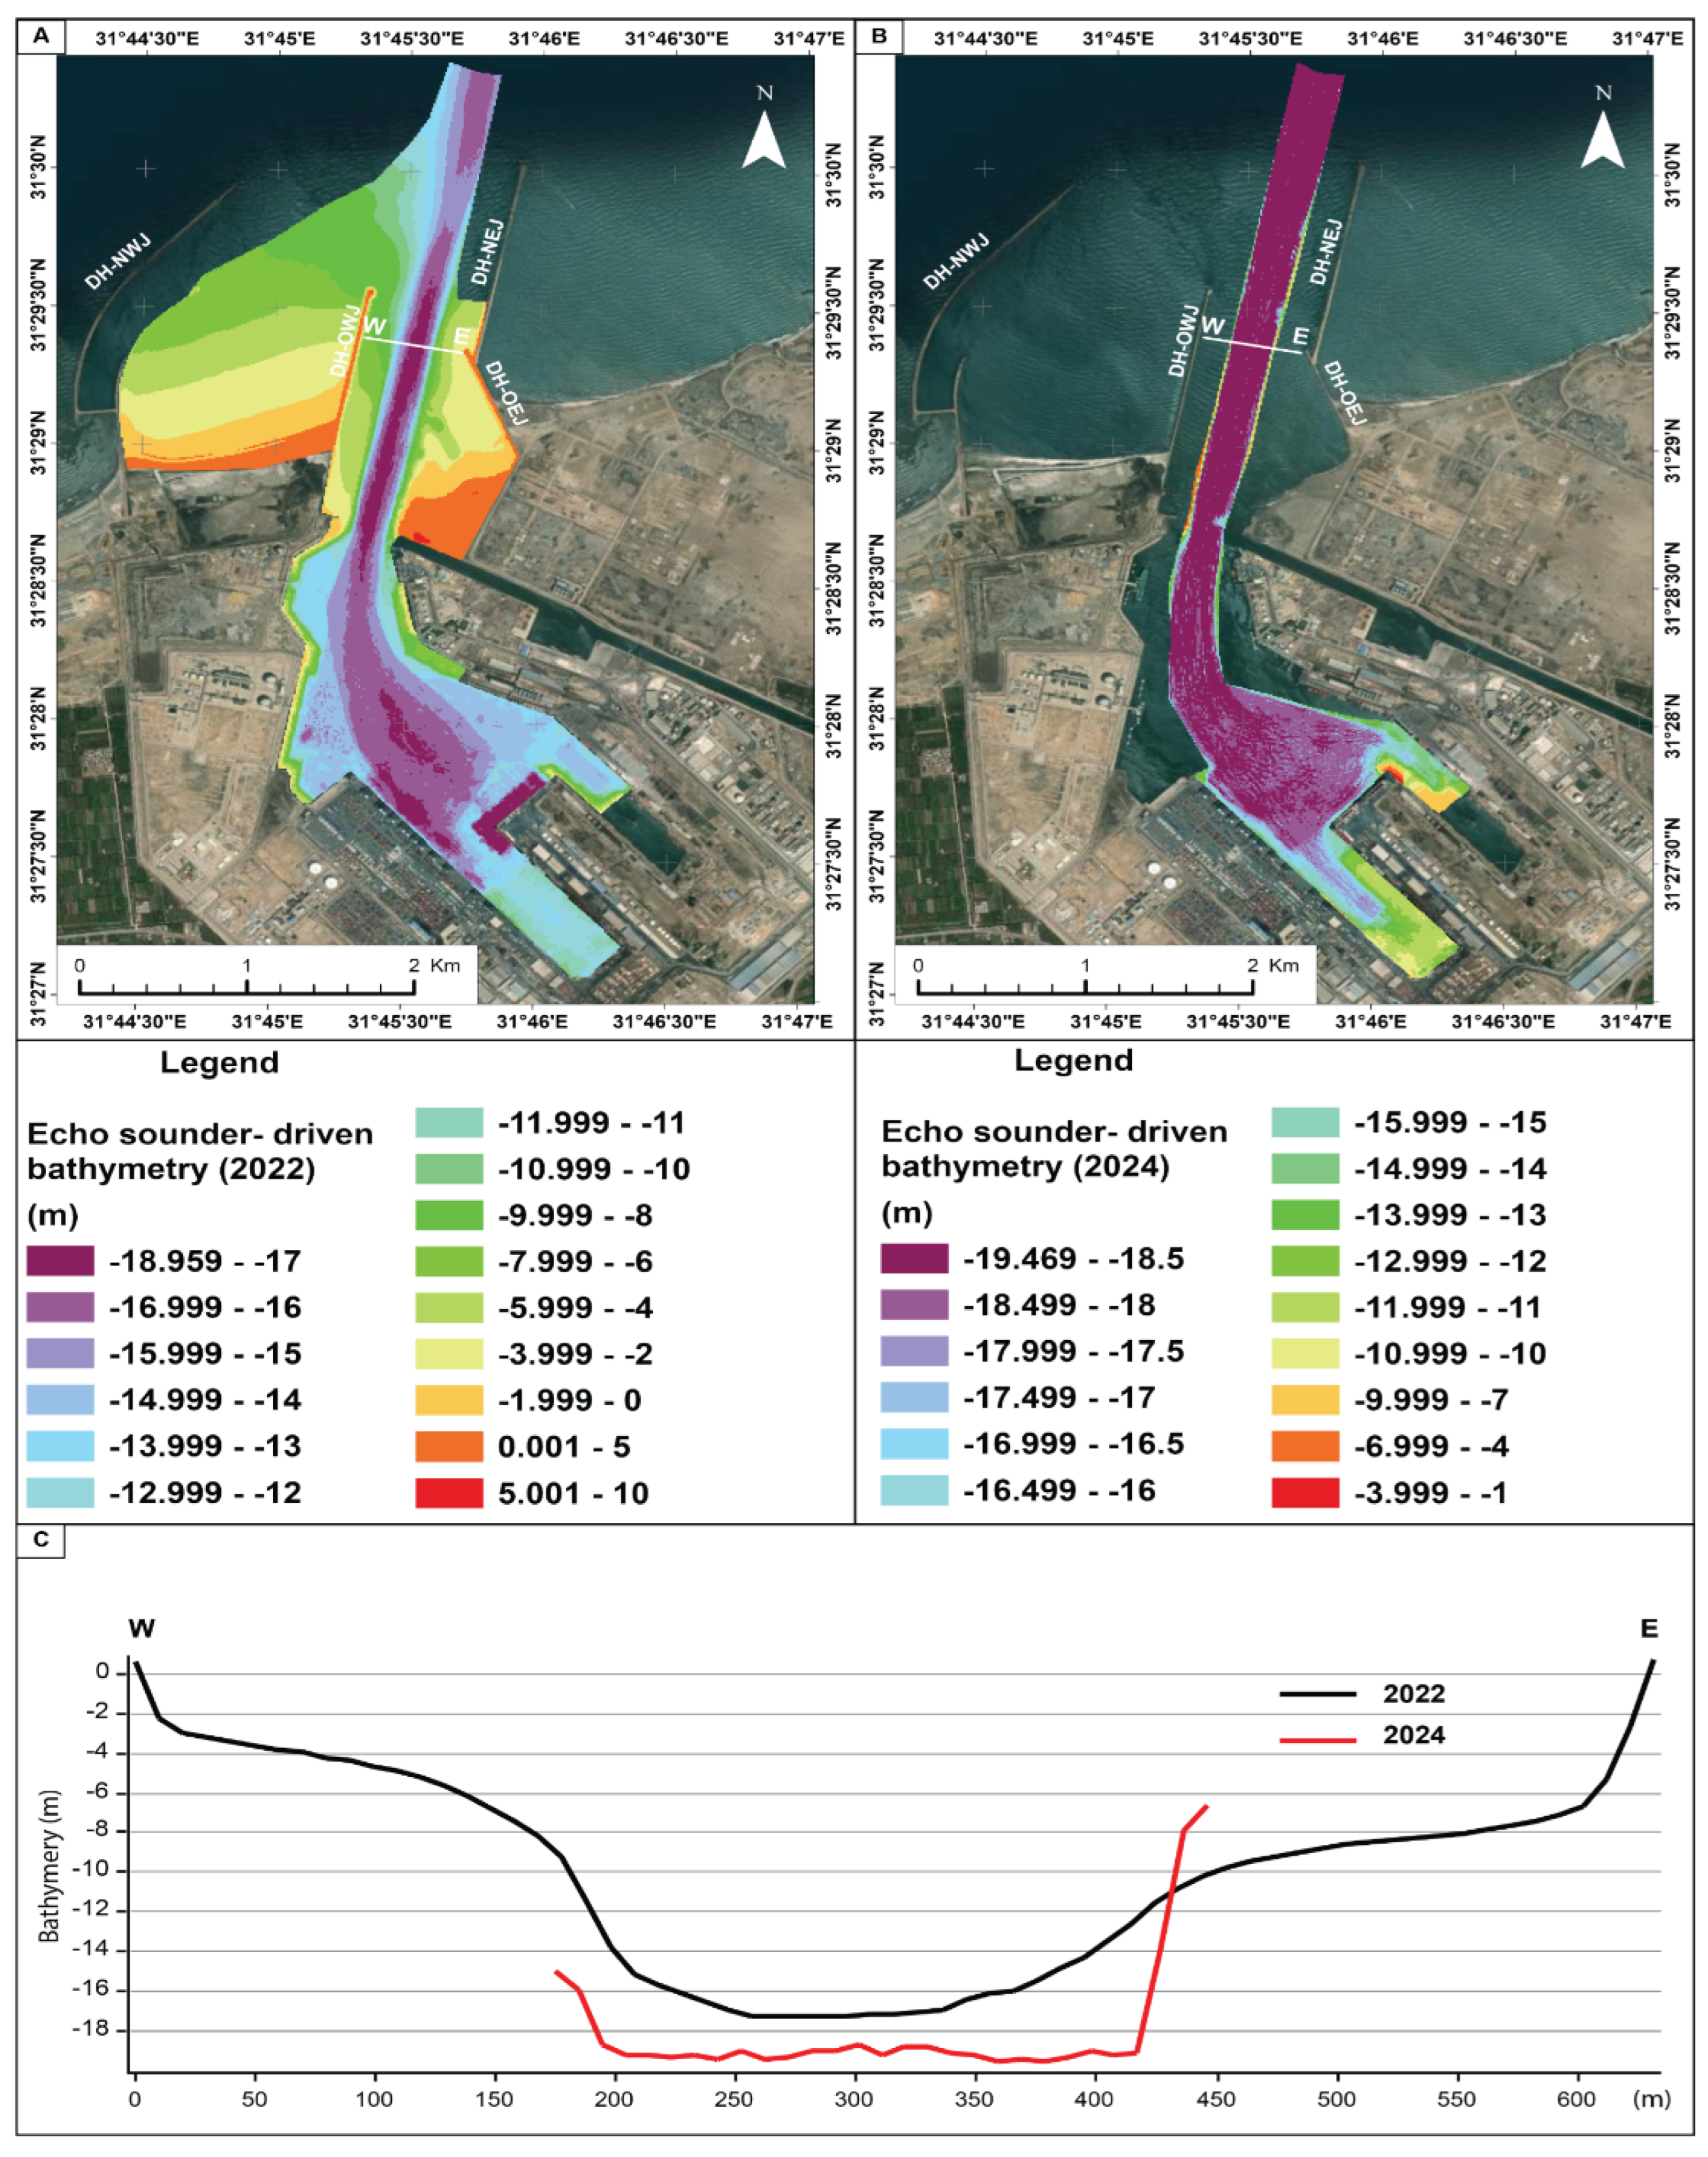
Figure 4.
Areas of shoreline erosion and accretion along the Damietta coast between 1977 and 2023.
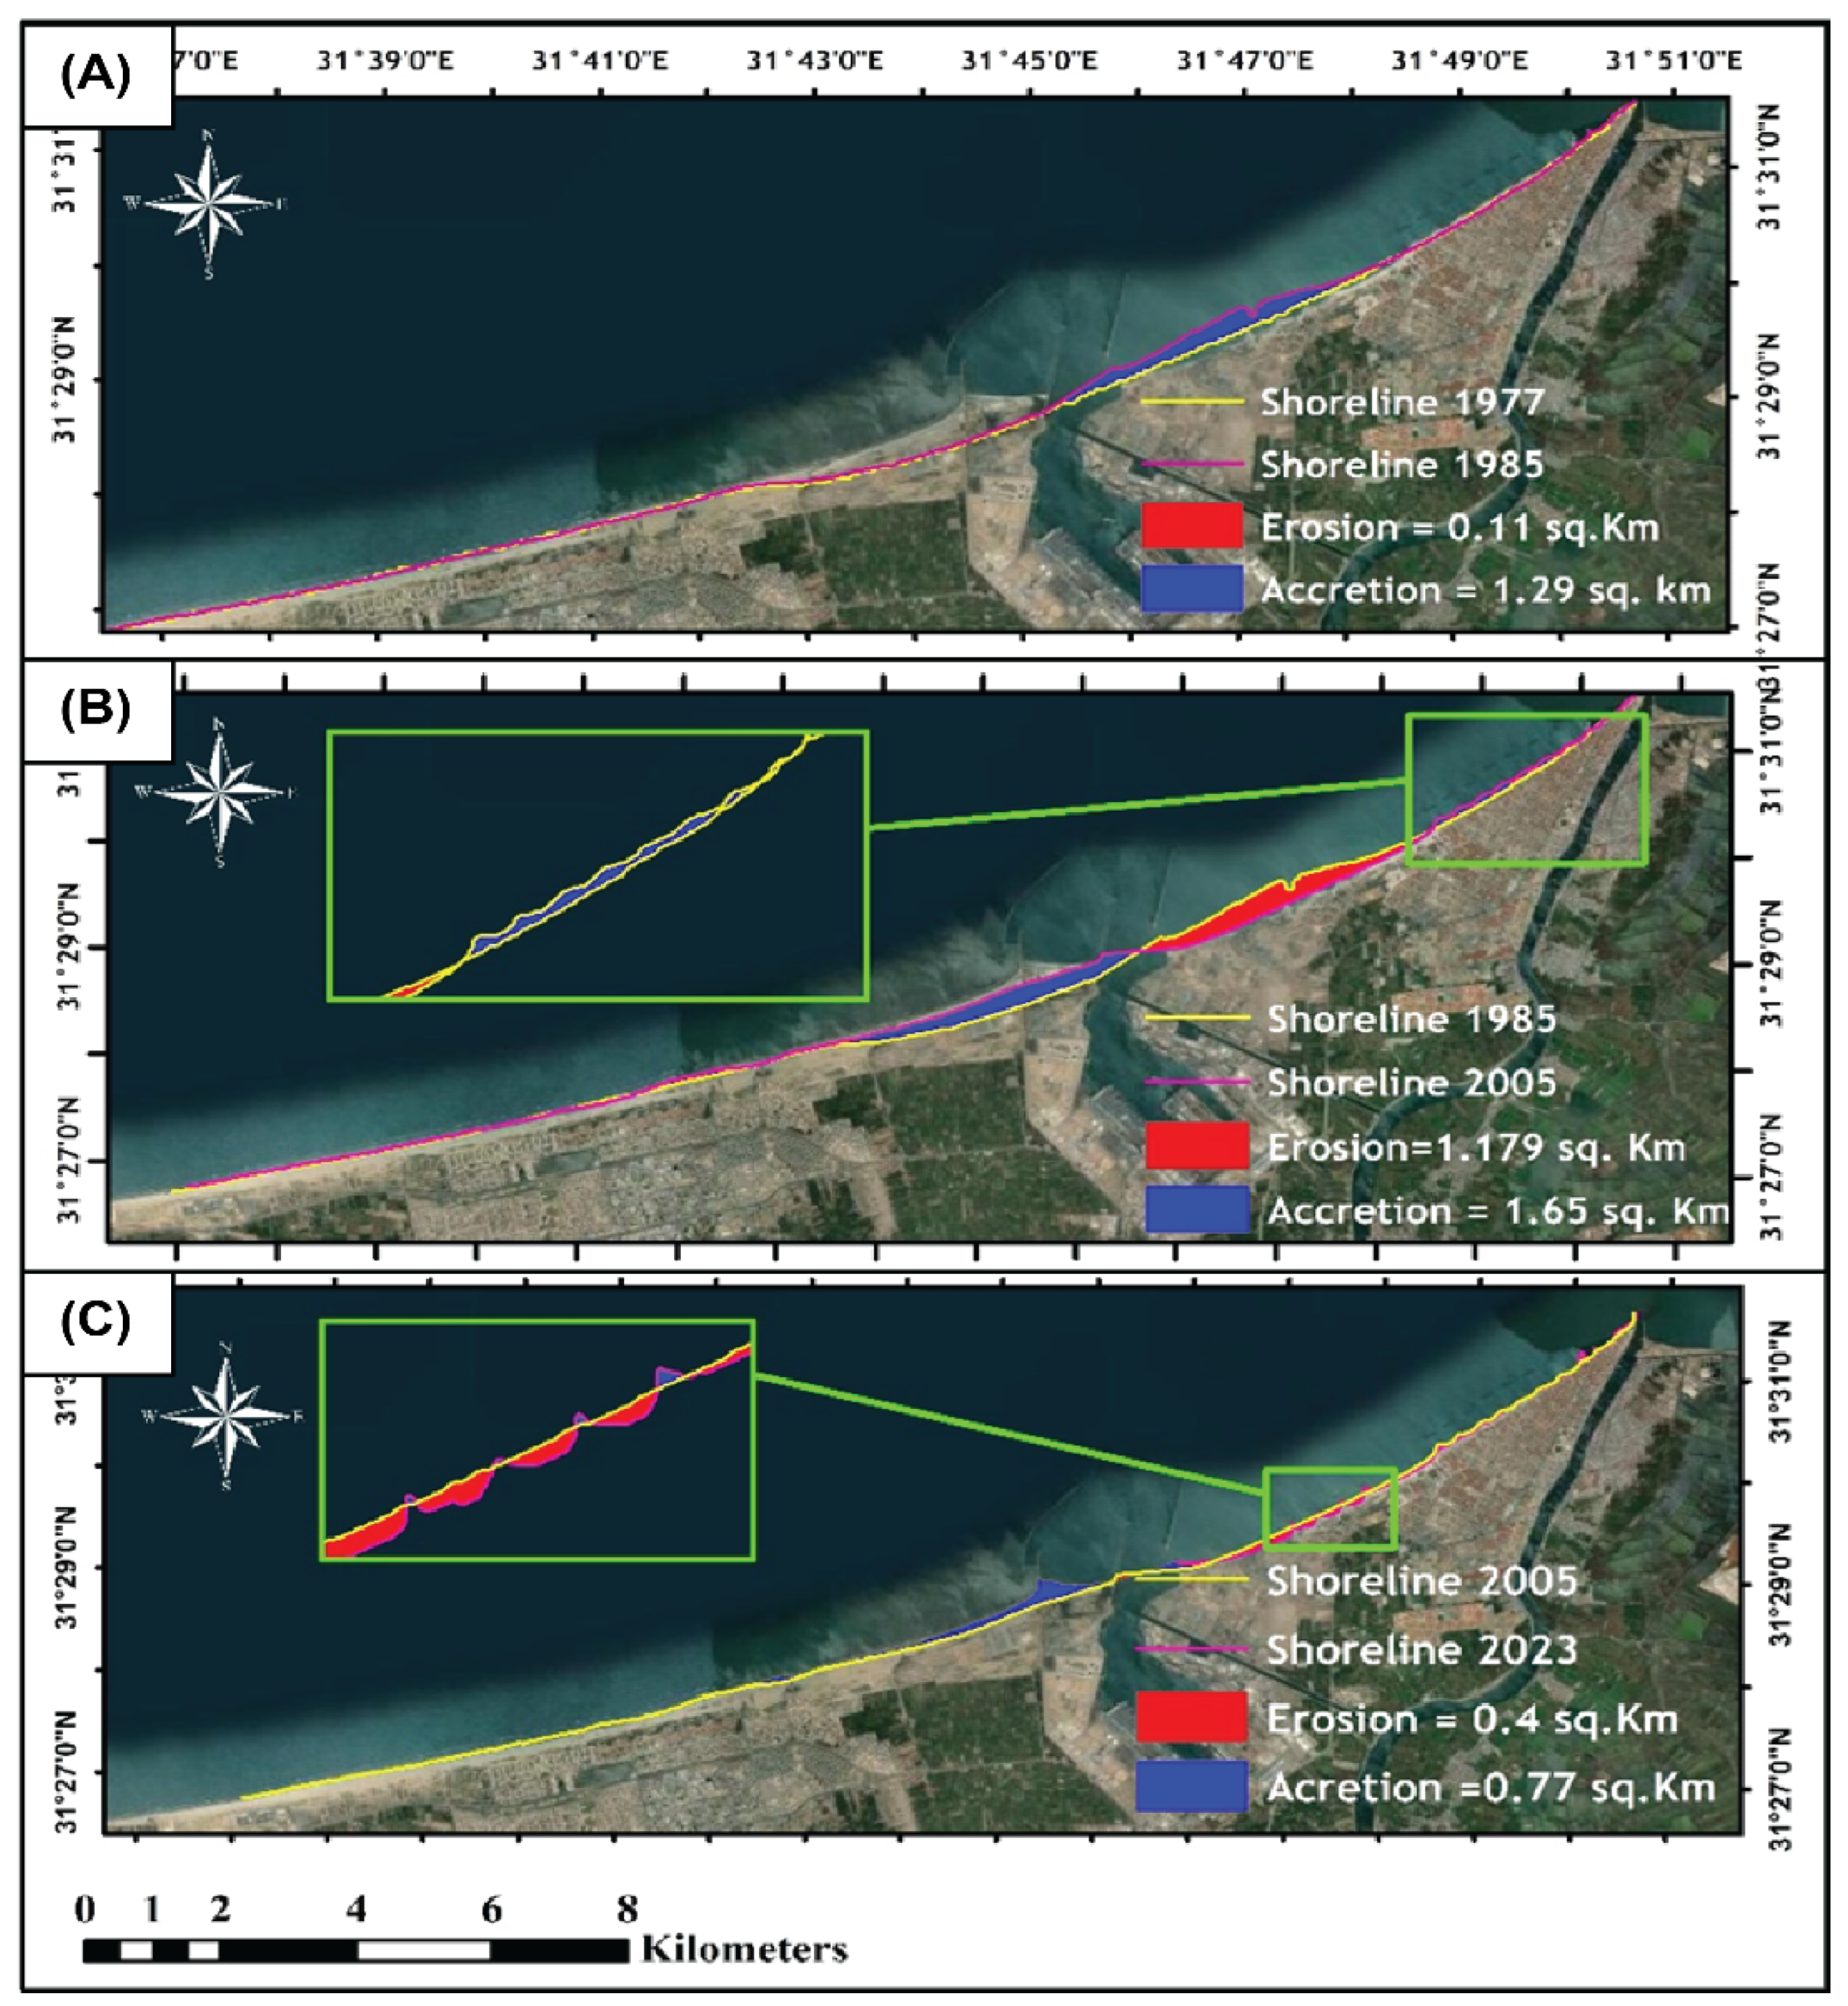
Figure 5.
(A) CMS modules details. (B) Water surface elevation (2018). (C) wave data (2014).
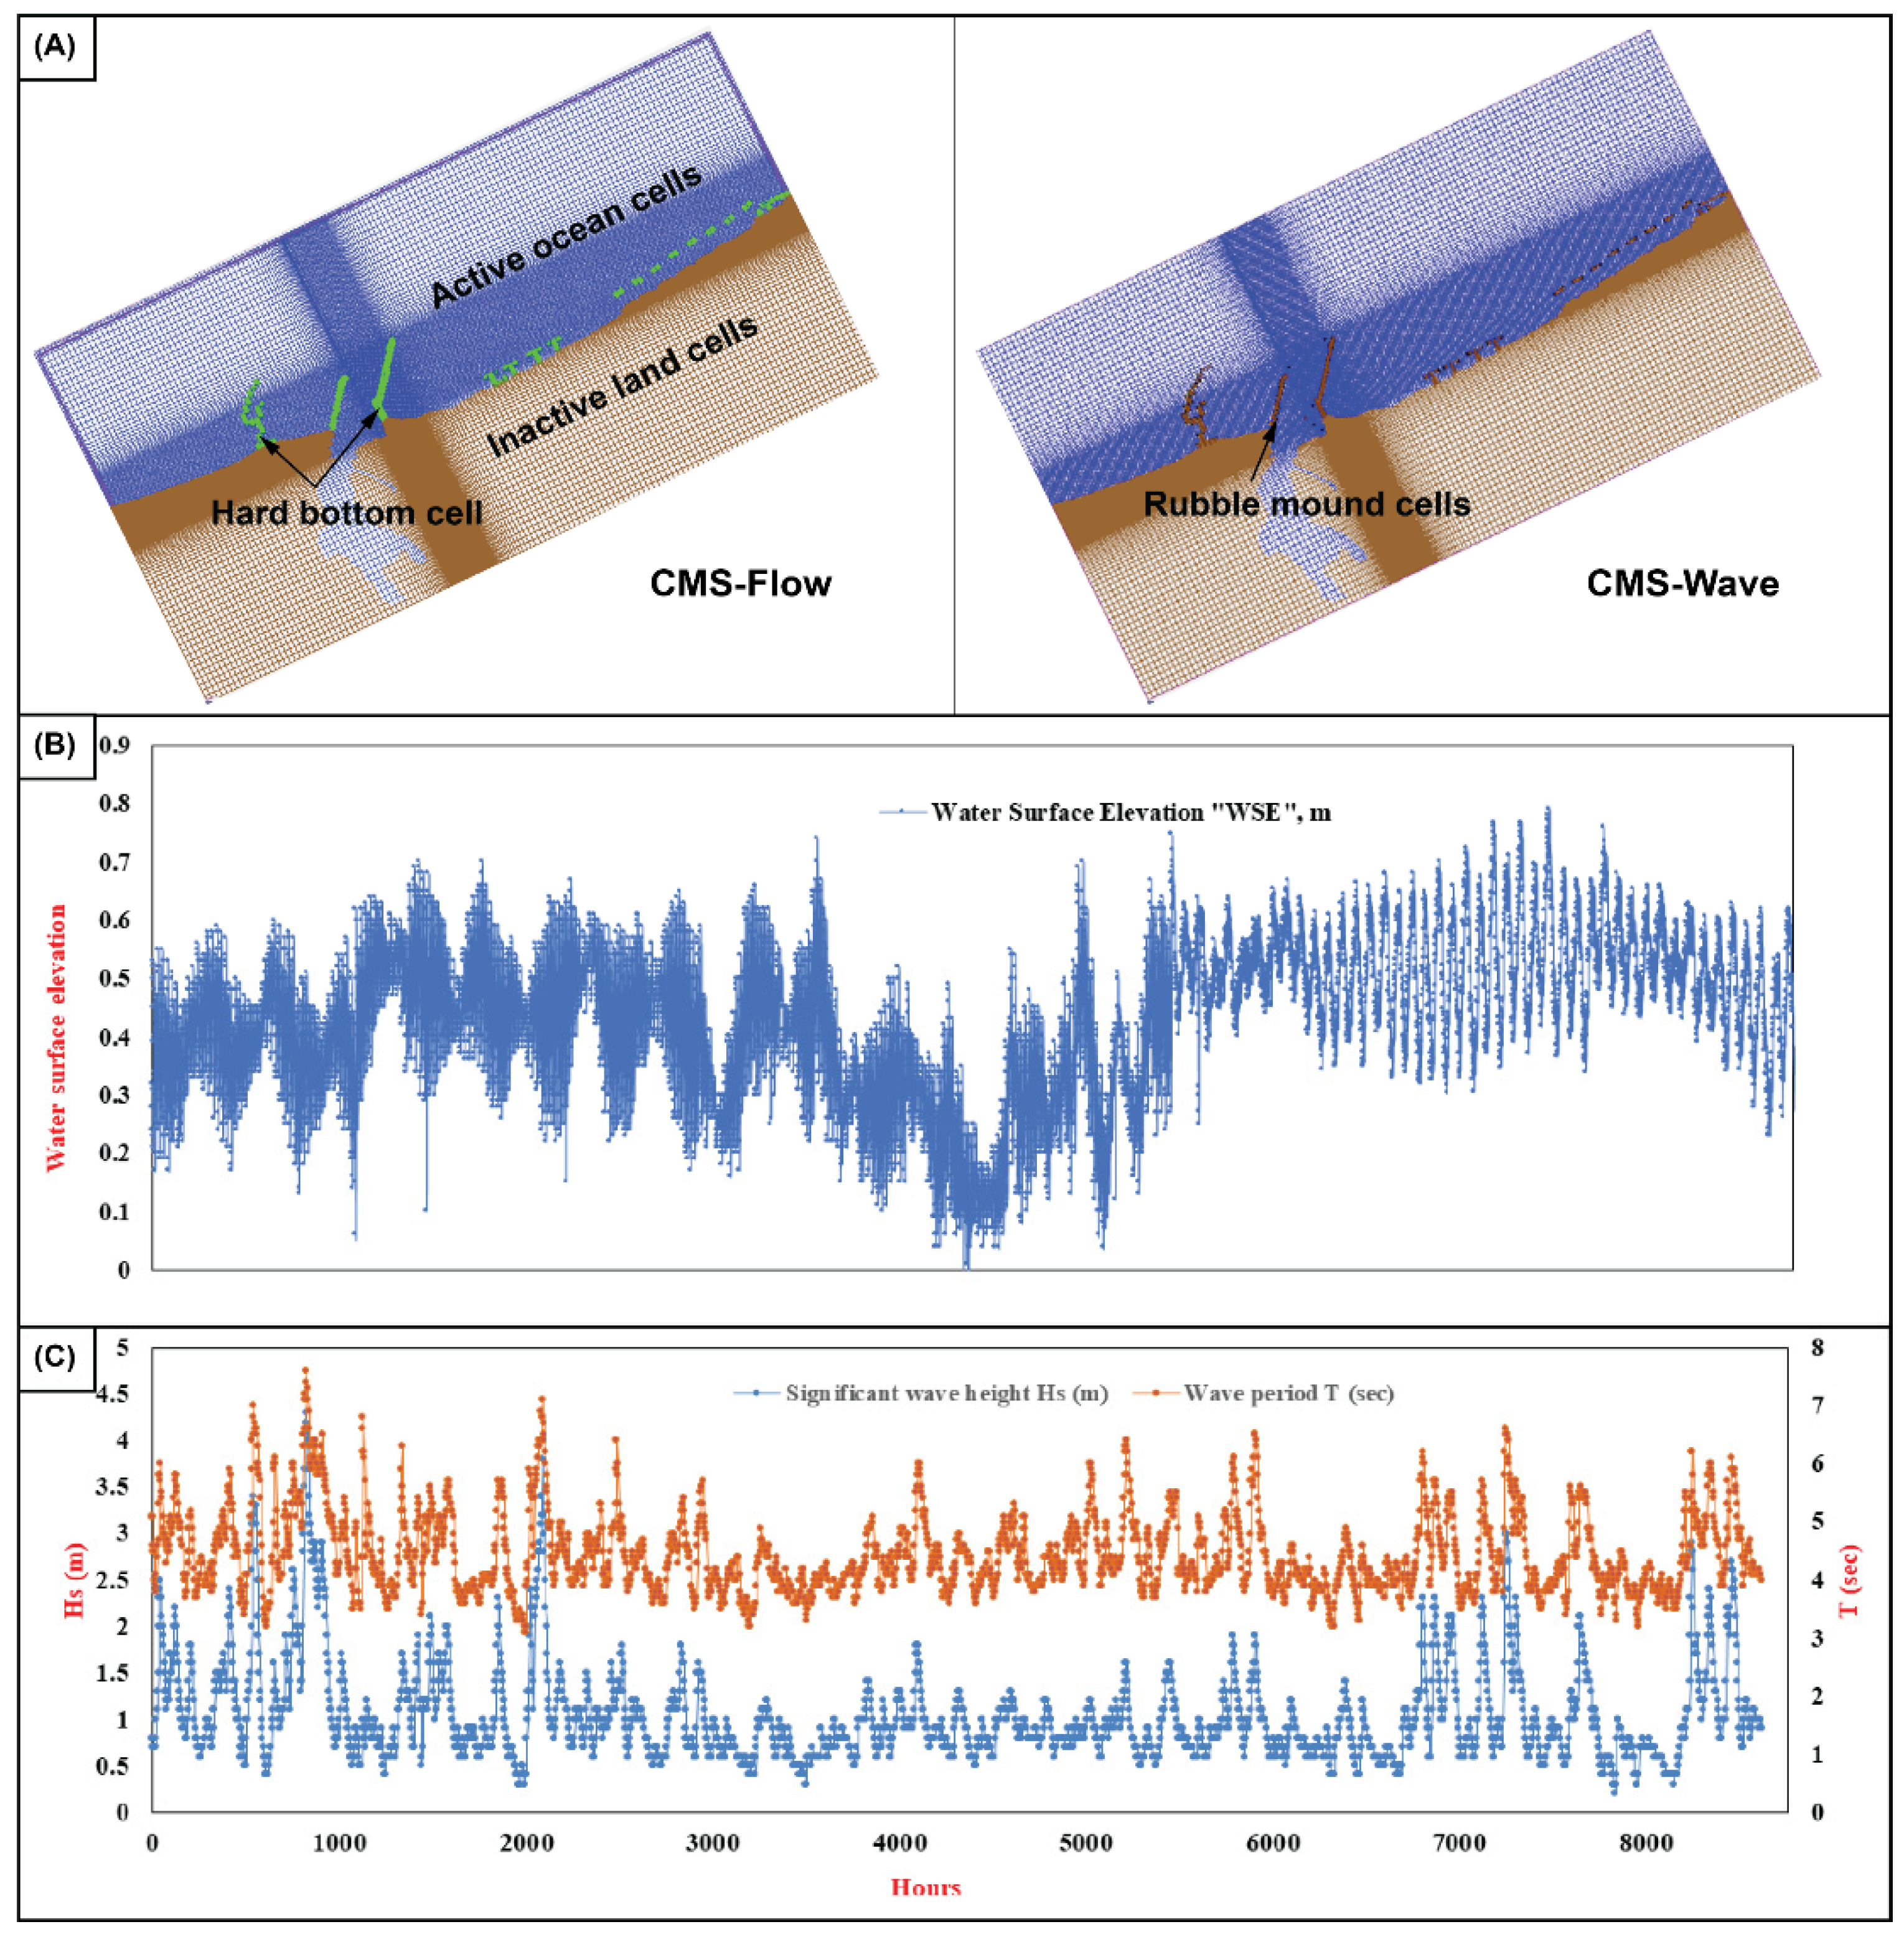
Figure 6.
Proposed scenarios dimensions. *Description (L BW: overall length, Th: thickness, ELEV: elevation, d: depth, S: spacing) in meter, n: number of breakwaters.
Figure 6.
Proposed scenarios dimensions. *Description (L BW: overall length, Th: thickness, ELEV: elevation, d: depth, S: spacing) in meter, n: number of breakwaters.
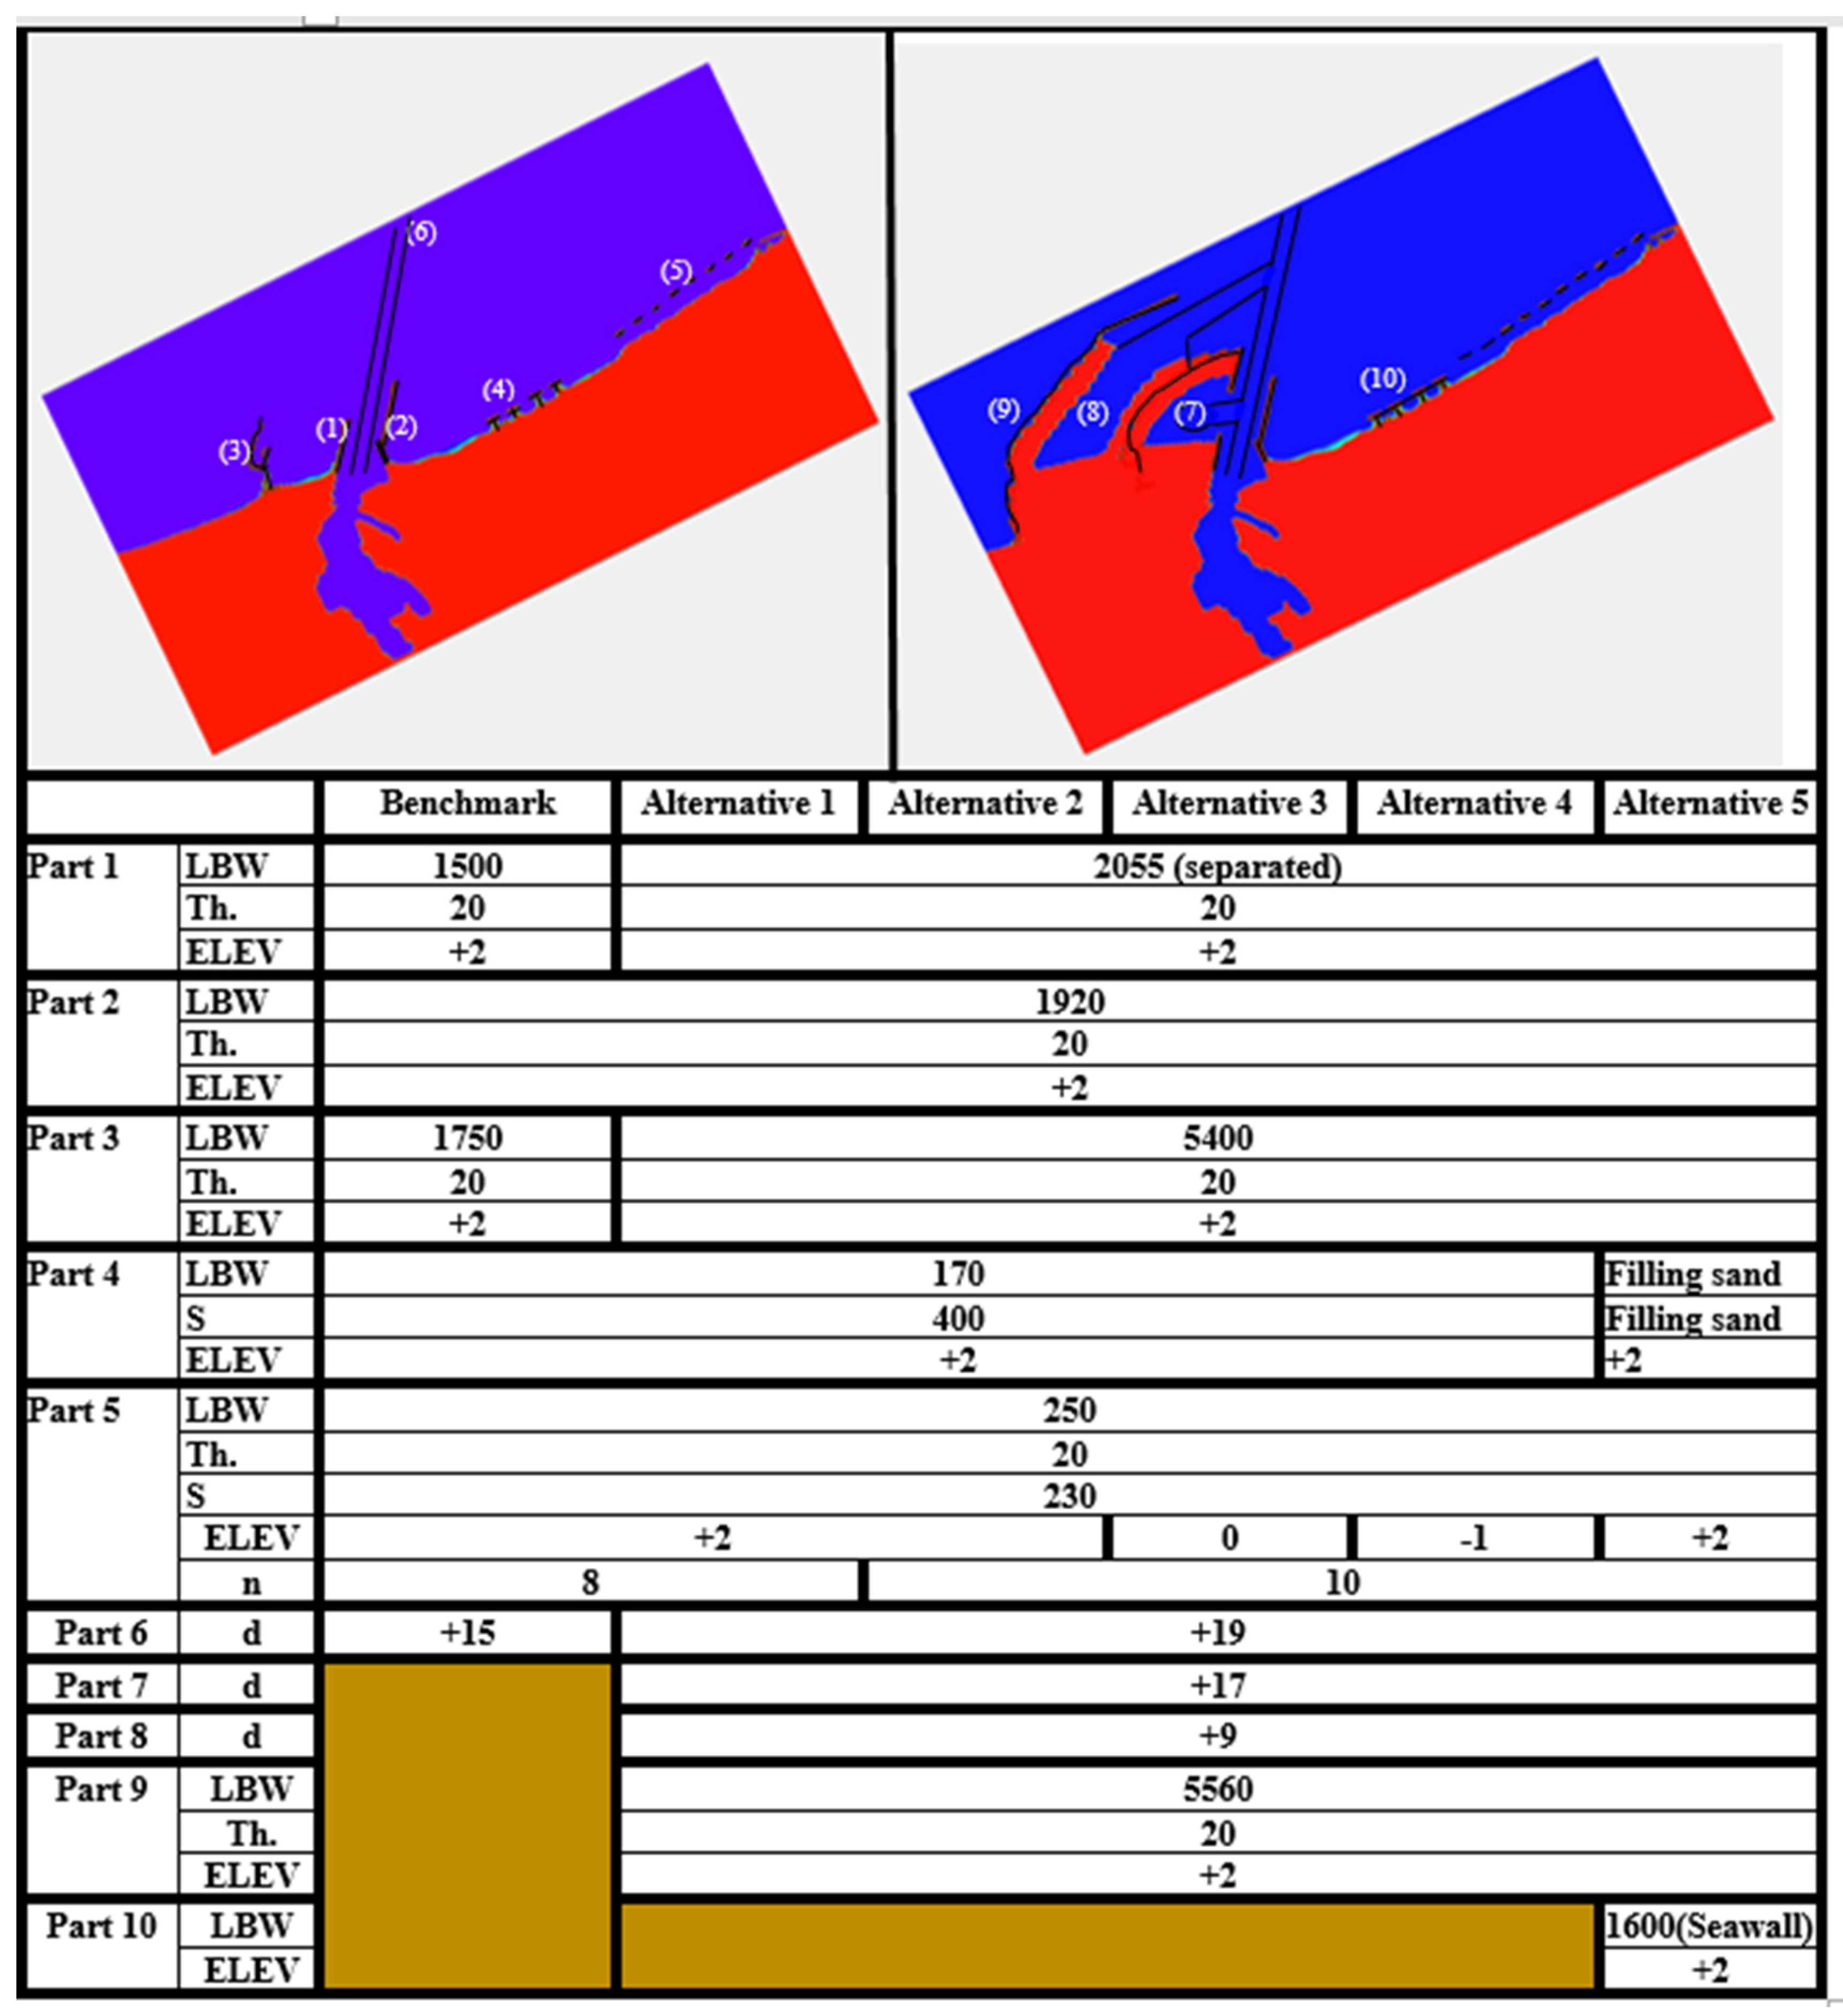
Figure 7.
Calibration process dividing the model domain into two parts 3.3 km for each shown as: (A), (B) represents the shoreline measured in 2020 and their residuals with RMPSE results with different extensions of the transport parameter.
Figure 7.
Calibration process dividing the model domain into two parts 3.3 km for each shown as: (A), (B) represents the shoreline measured in 2020 and their residuals with RMPSE results with different extensions of the transport parameter.
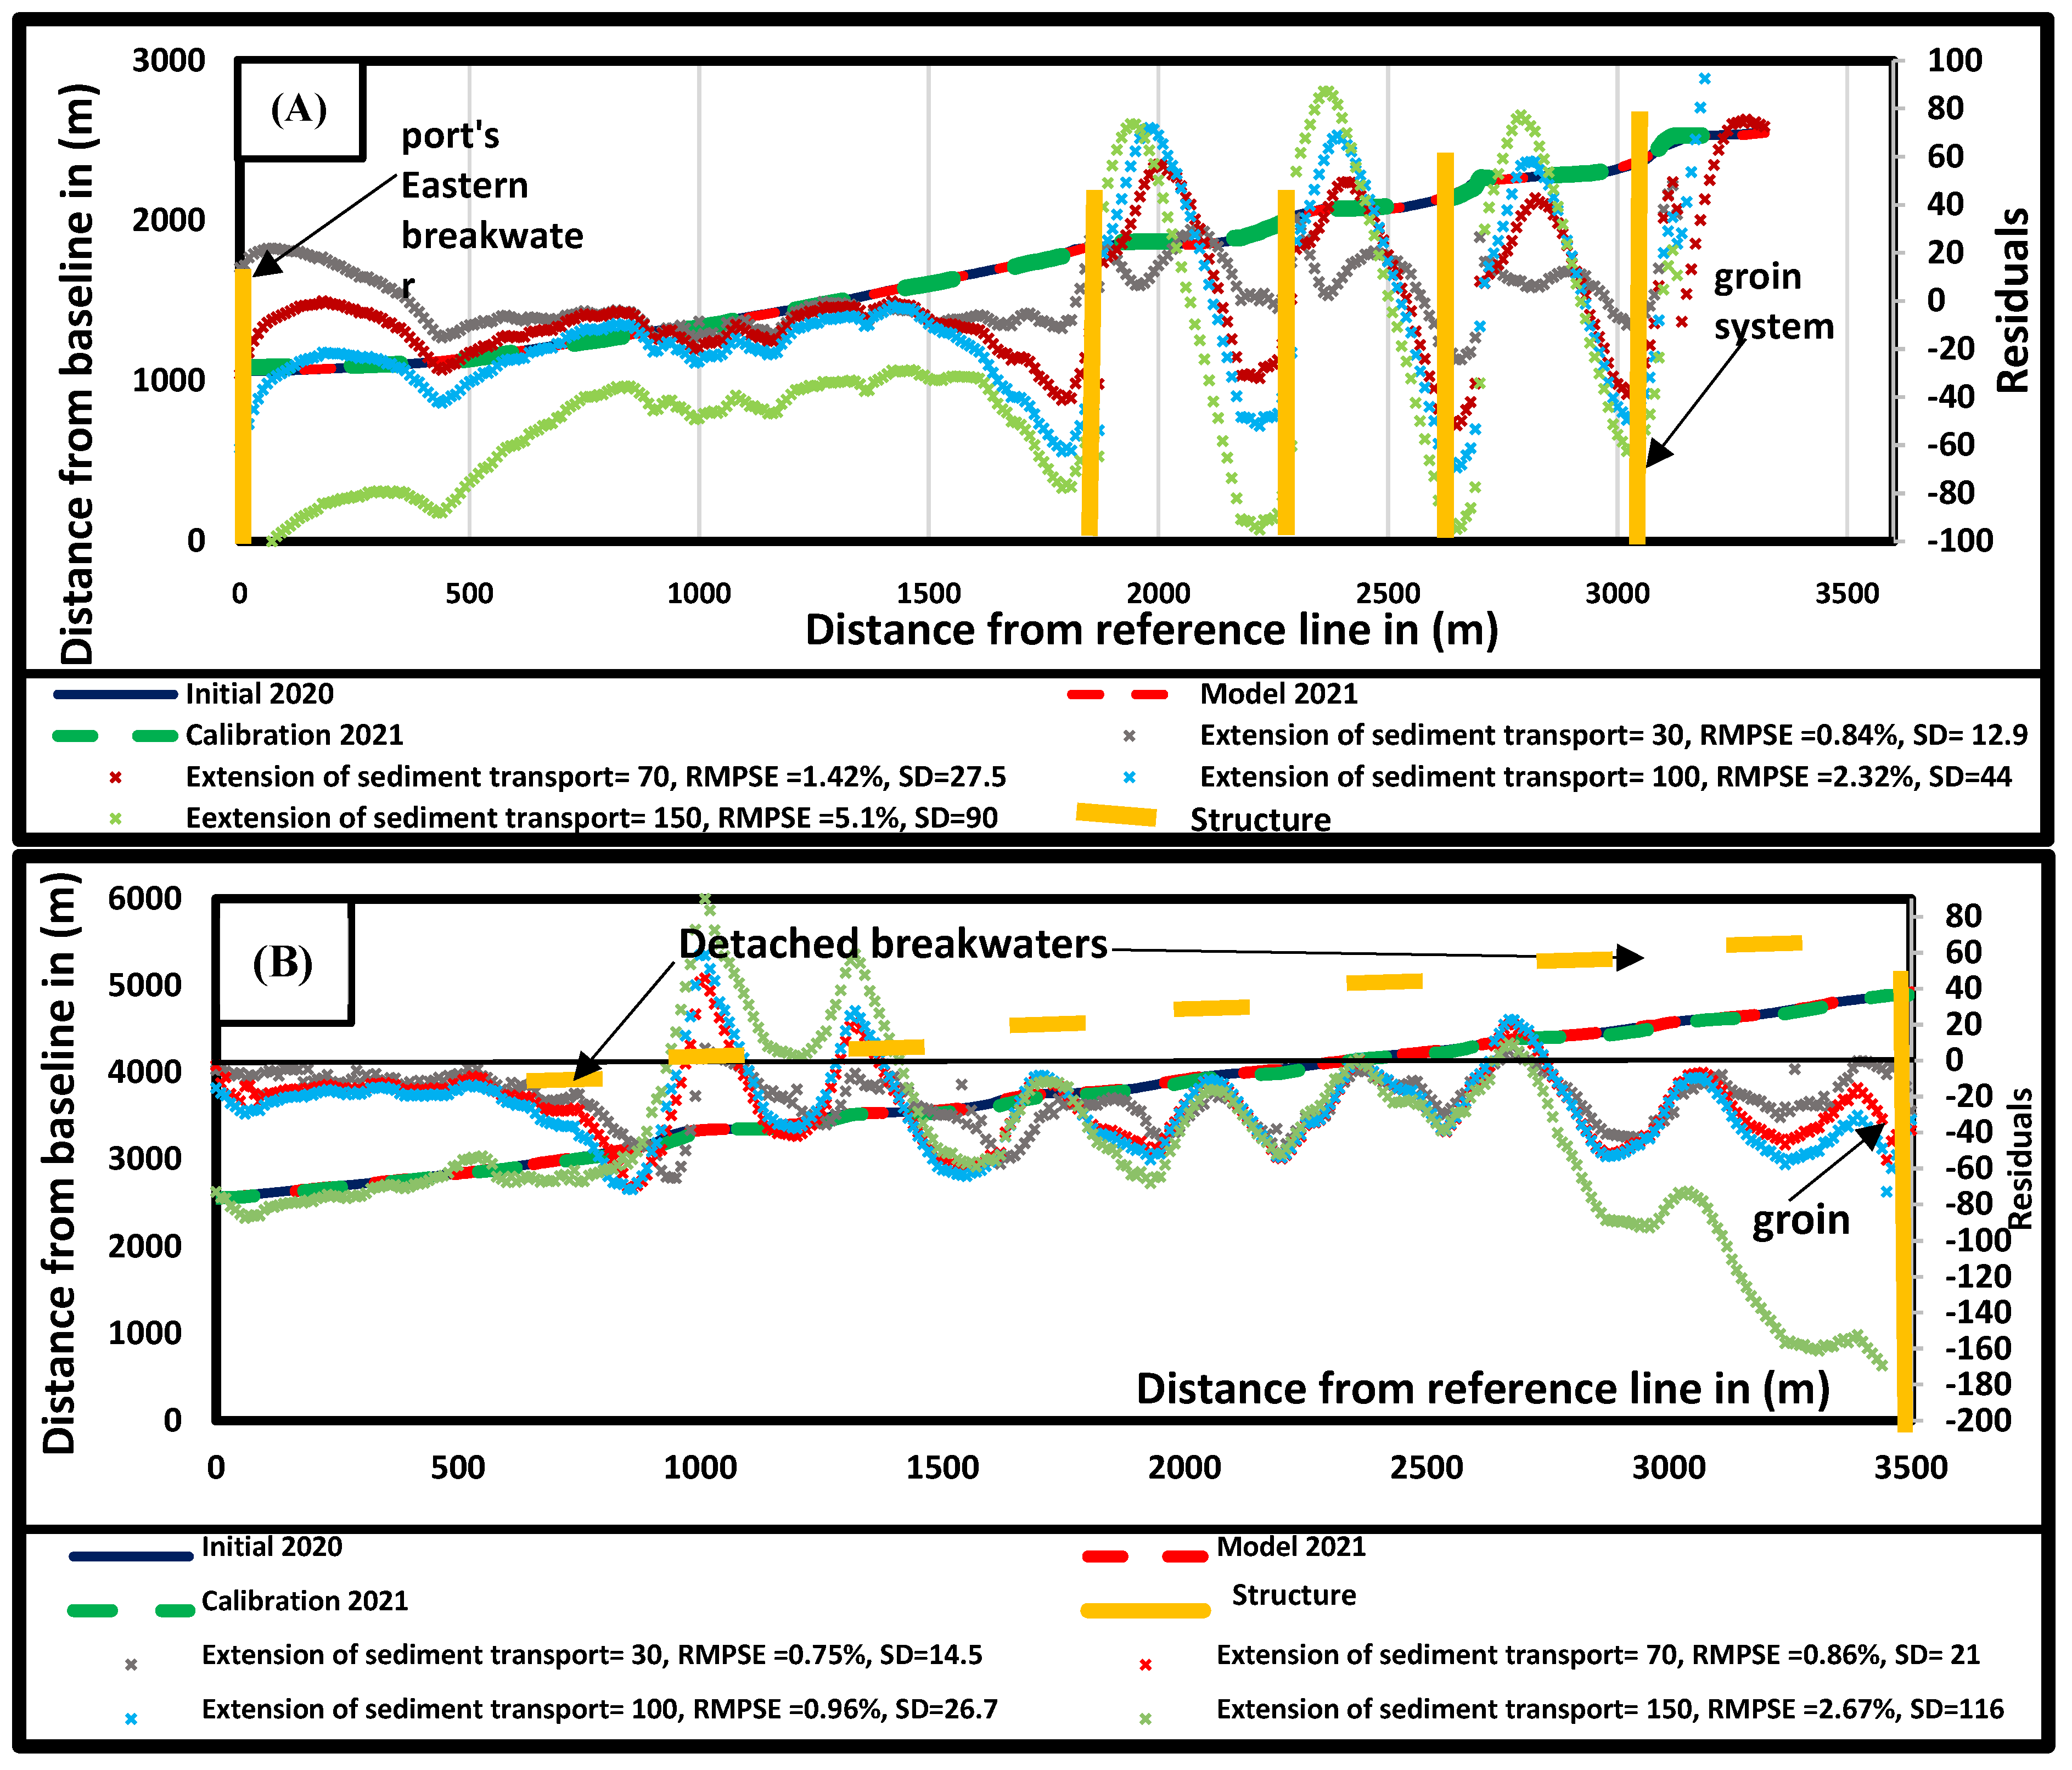
Figure 8.
Scenarios shoreline prediction in 2021, 2030, 2040 divided into two parts 3300m for each shown as (A) represents first 3.3 km, (B) represents scenario 1 and (C) represents last 3.3 km of the model, (D) represents scenario 2.
Figure 8.
Scenarios shoreline prediction in 2021, 2030, 2040 divided into two parts 3300m for each shown as (A) represents first 3.3 km, (B) represents scenario 1 and (C) represents last 3.3 km of the model, (D) represents scenario 2.
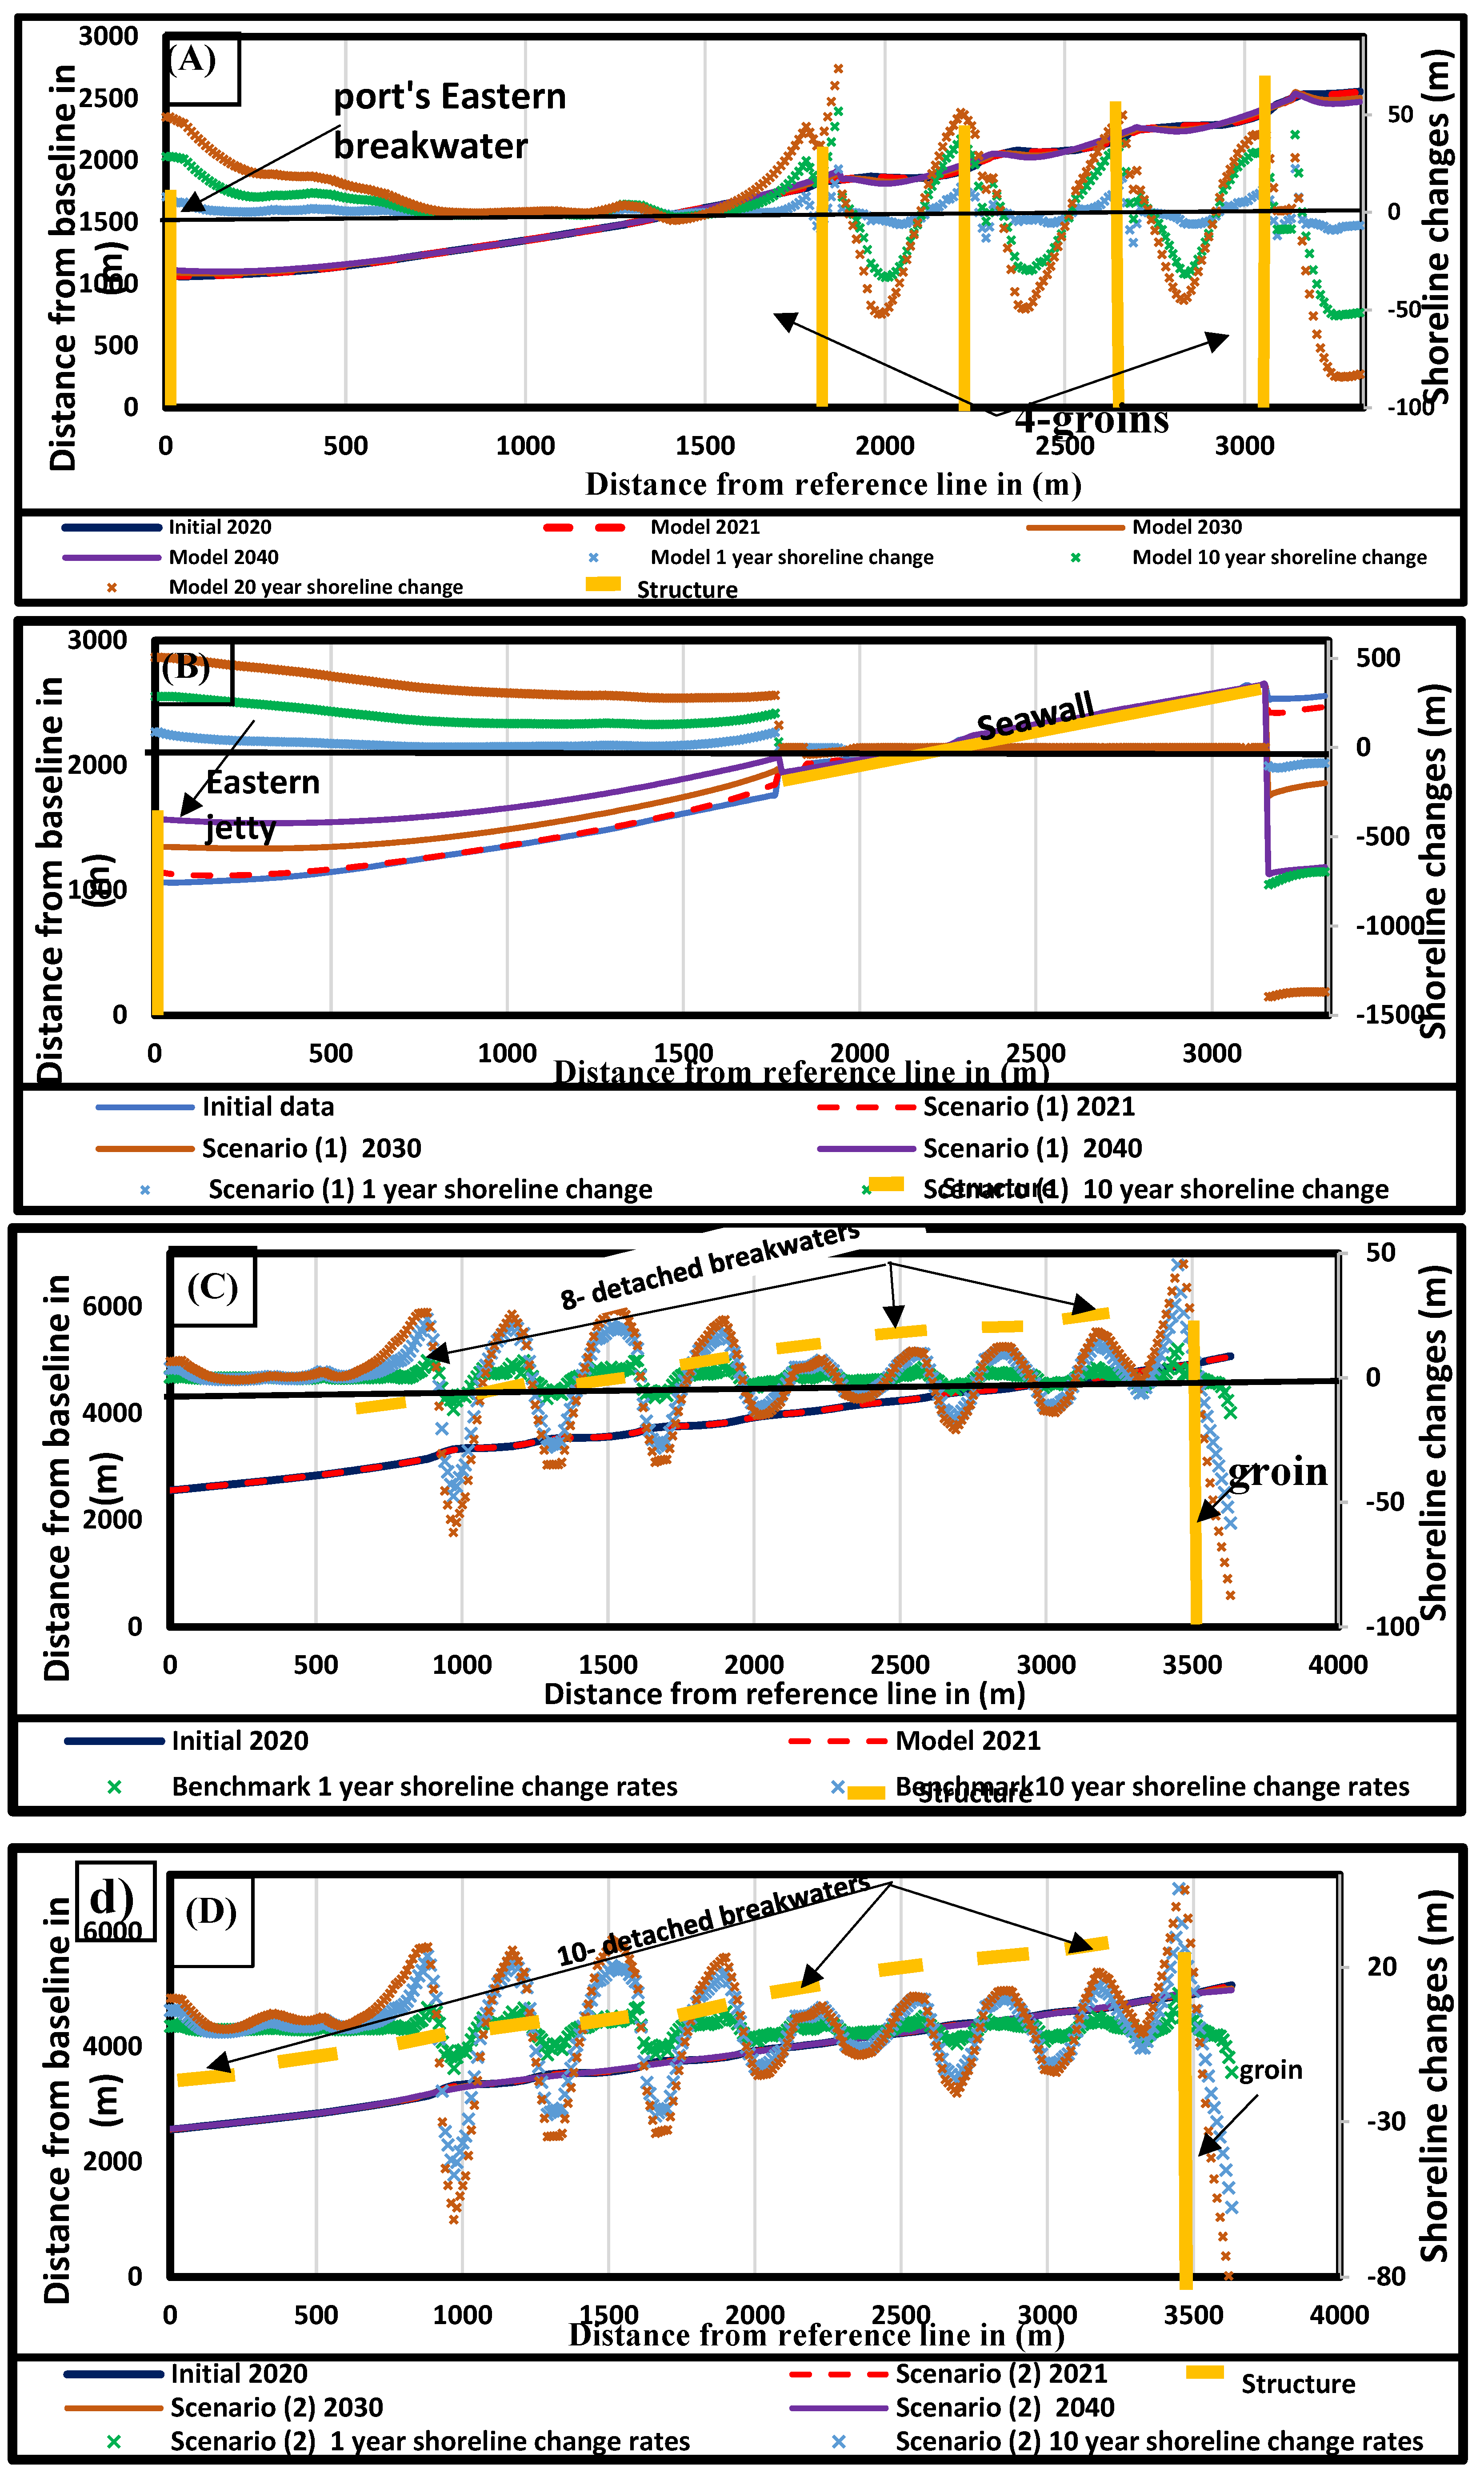
Figure 9.
Calibration process for different sediment transport formulas at (A) Profile 1, (B) Profile 2, and (C) Profile 3.
Figure 9.
Calibration process for different sediment transport formulas at (A) Profile 1, (B) Profile 2, and (C) Profile 3.
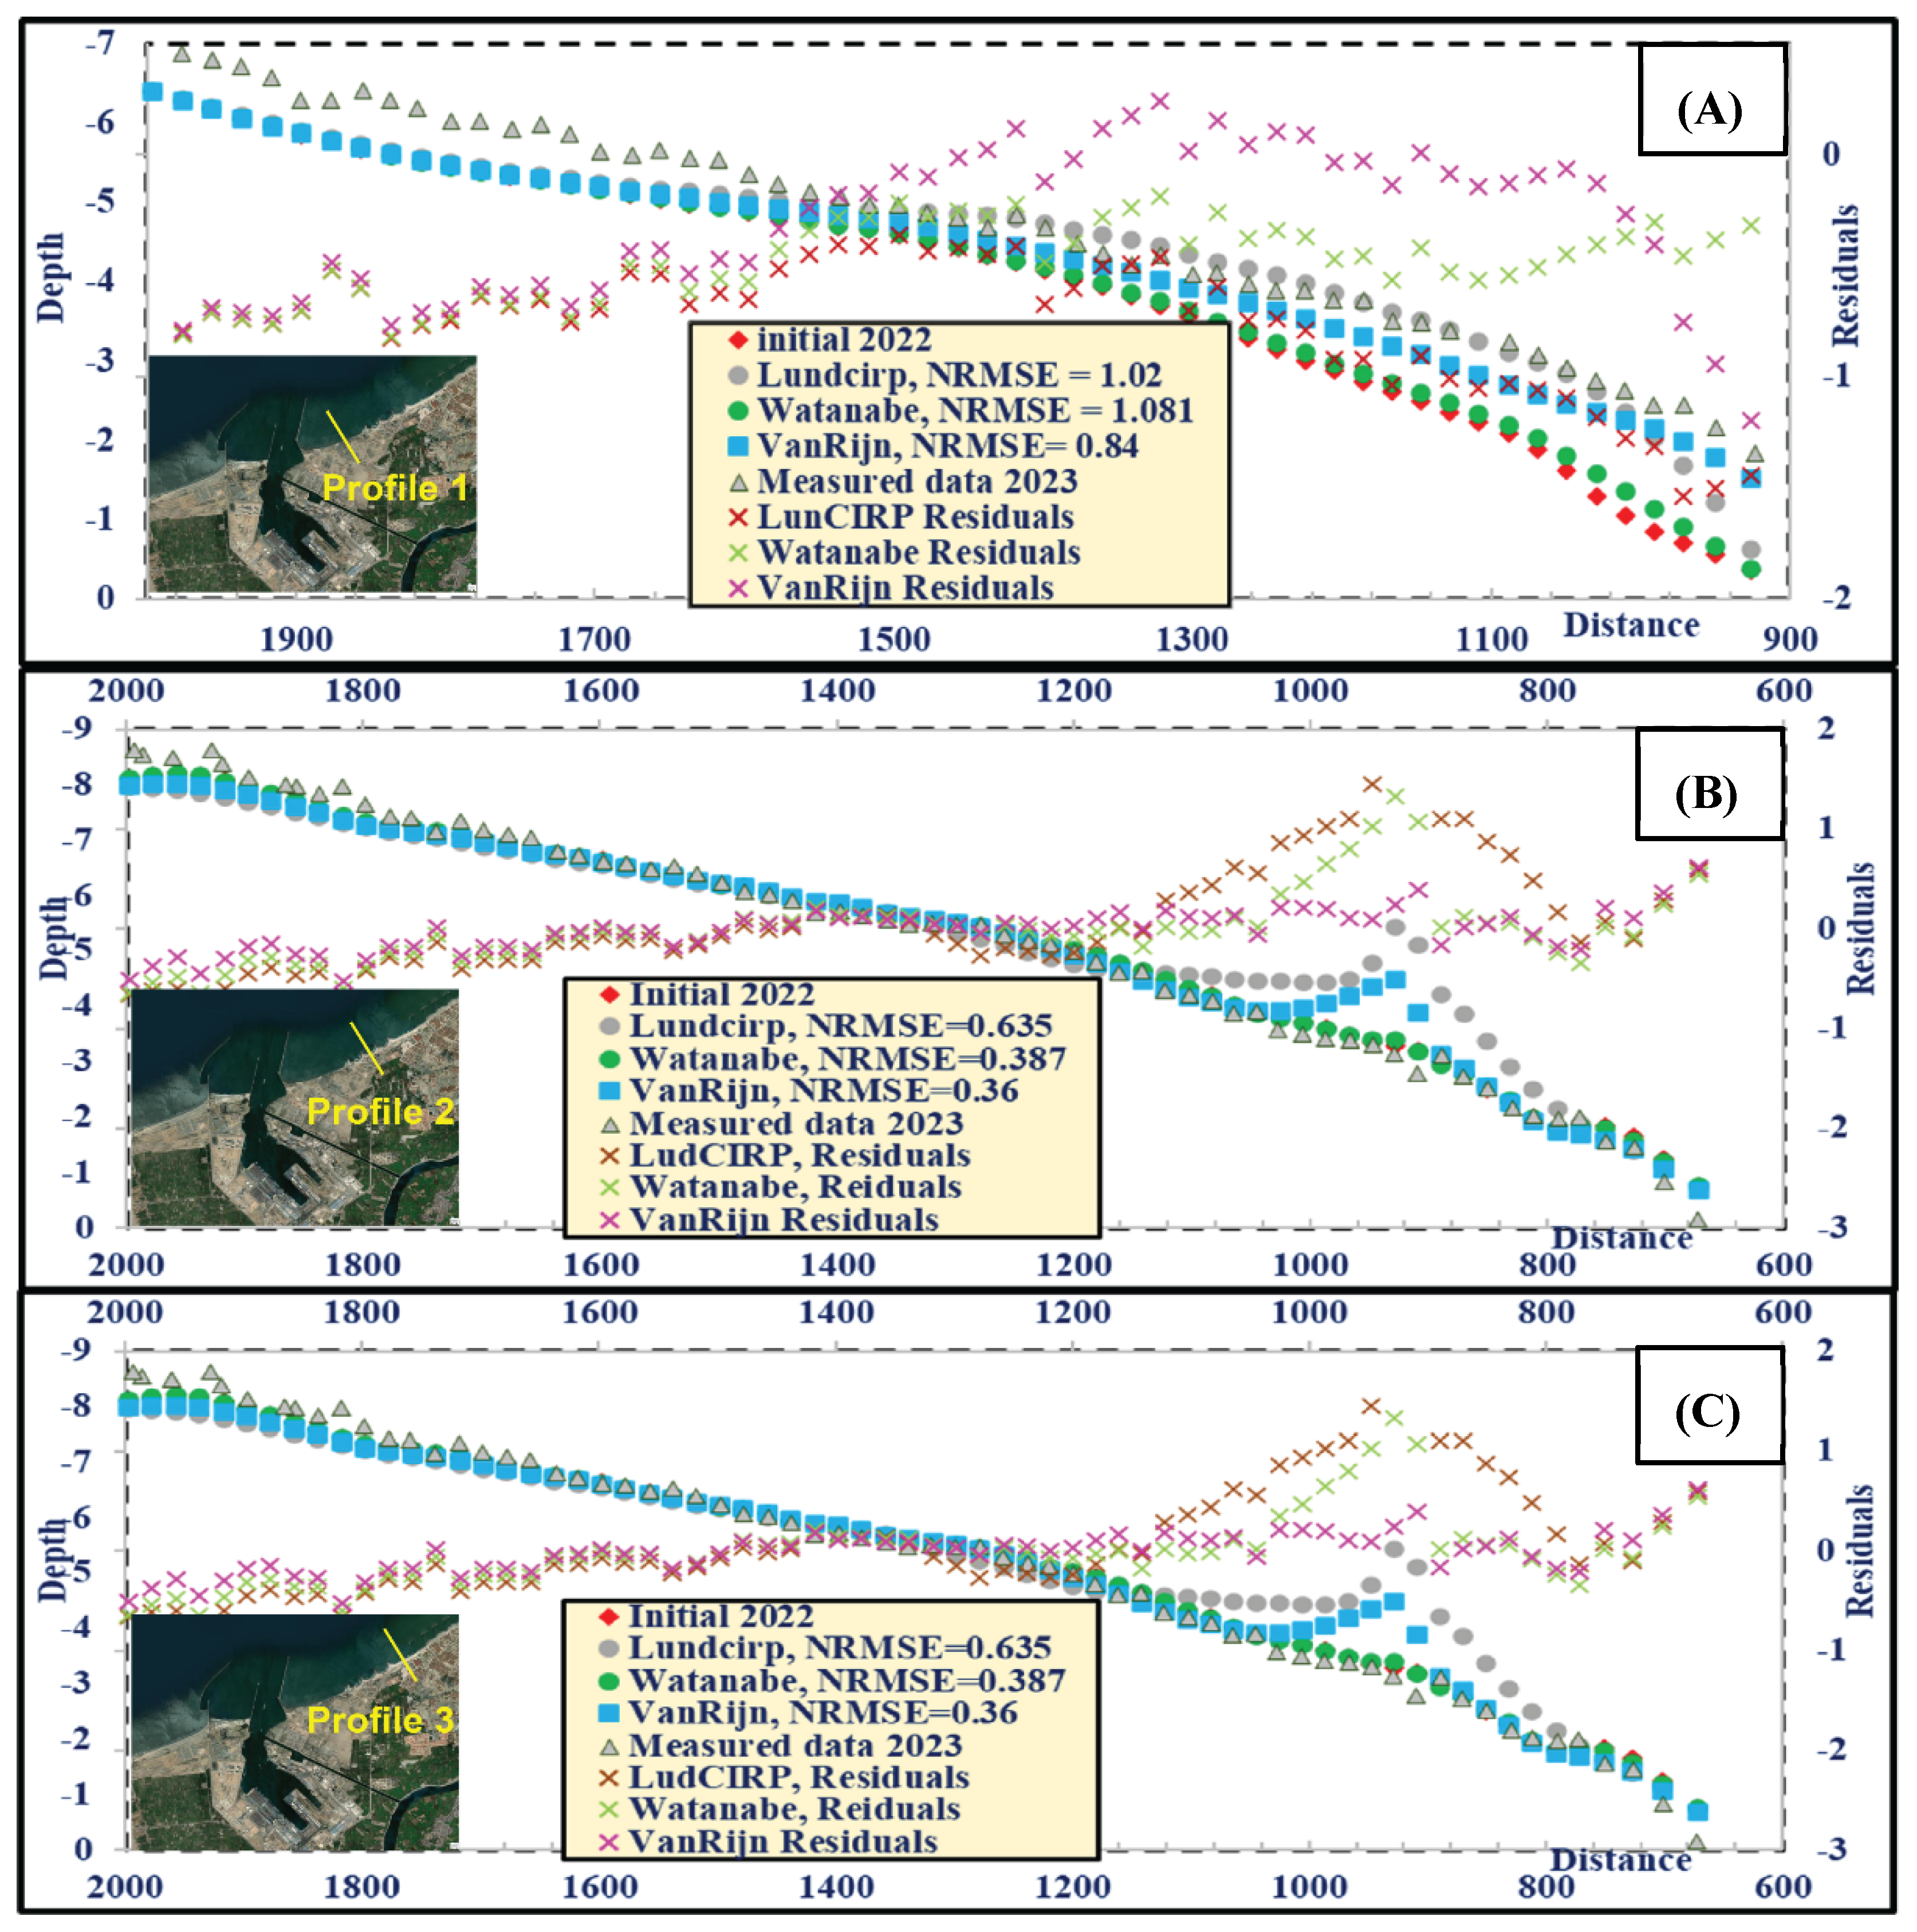
Figure 10.
Morphplpgy change for proposed alternatives.
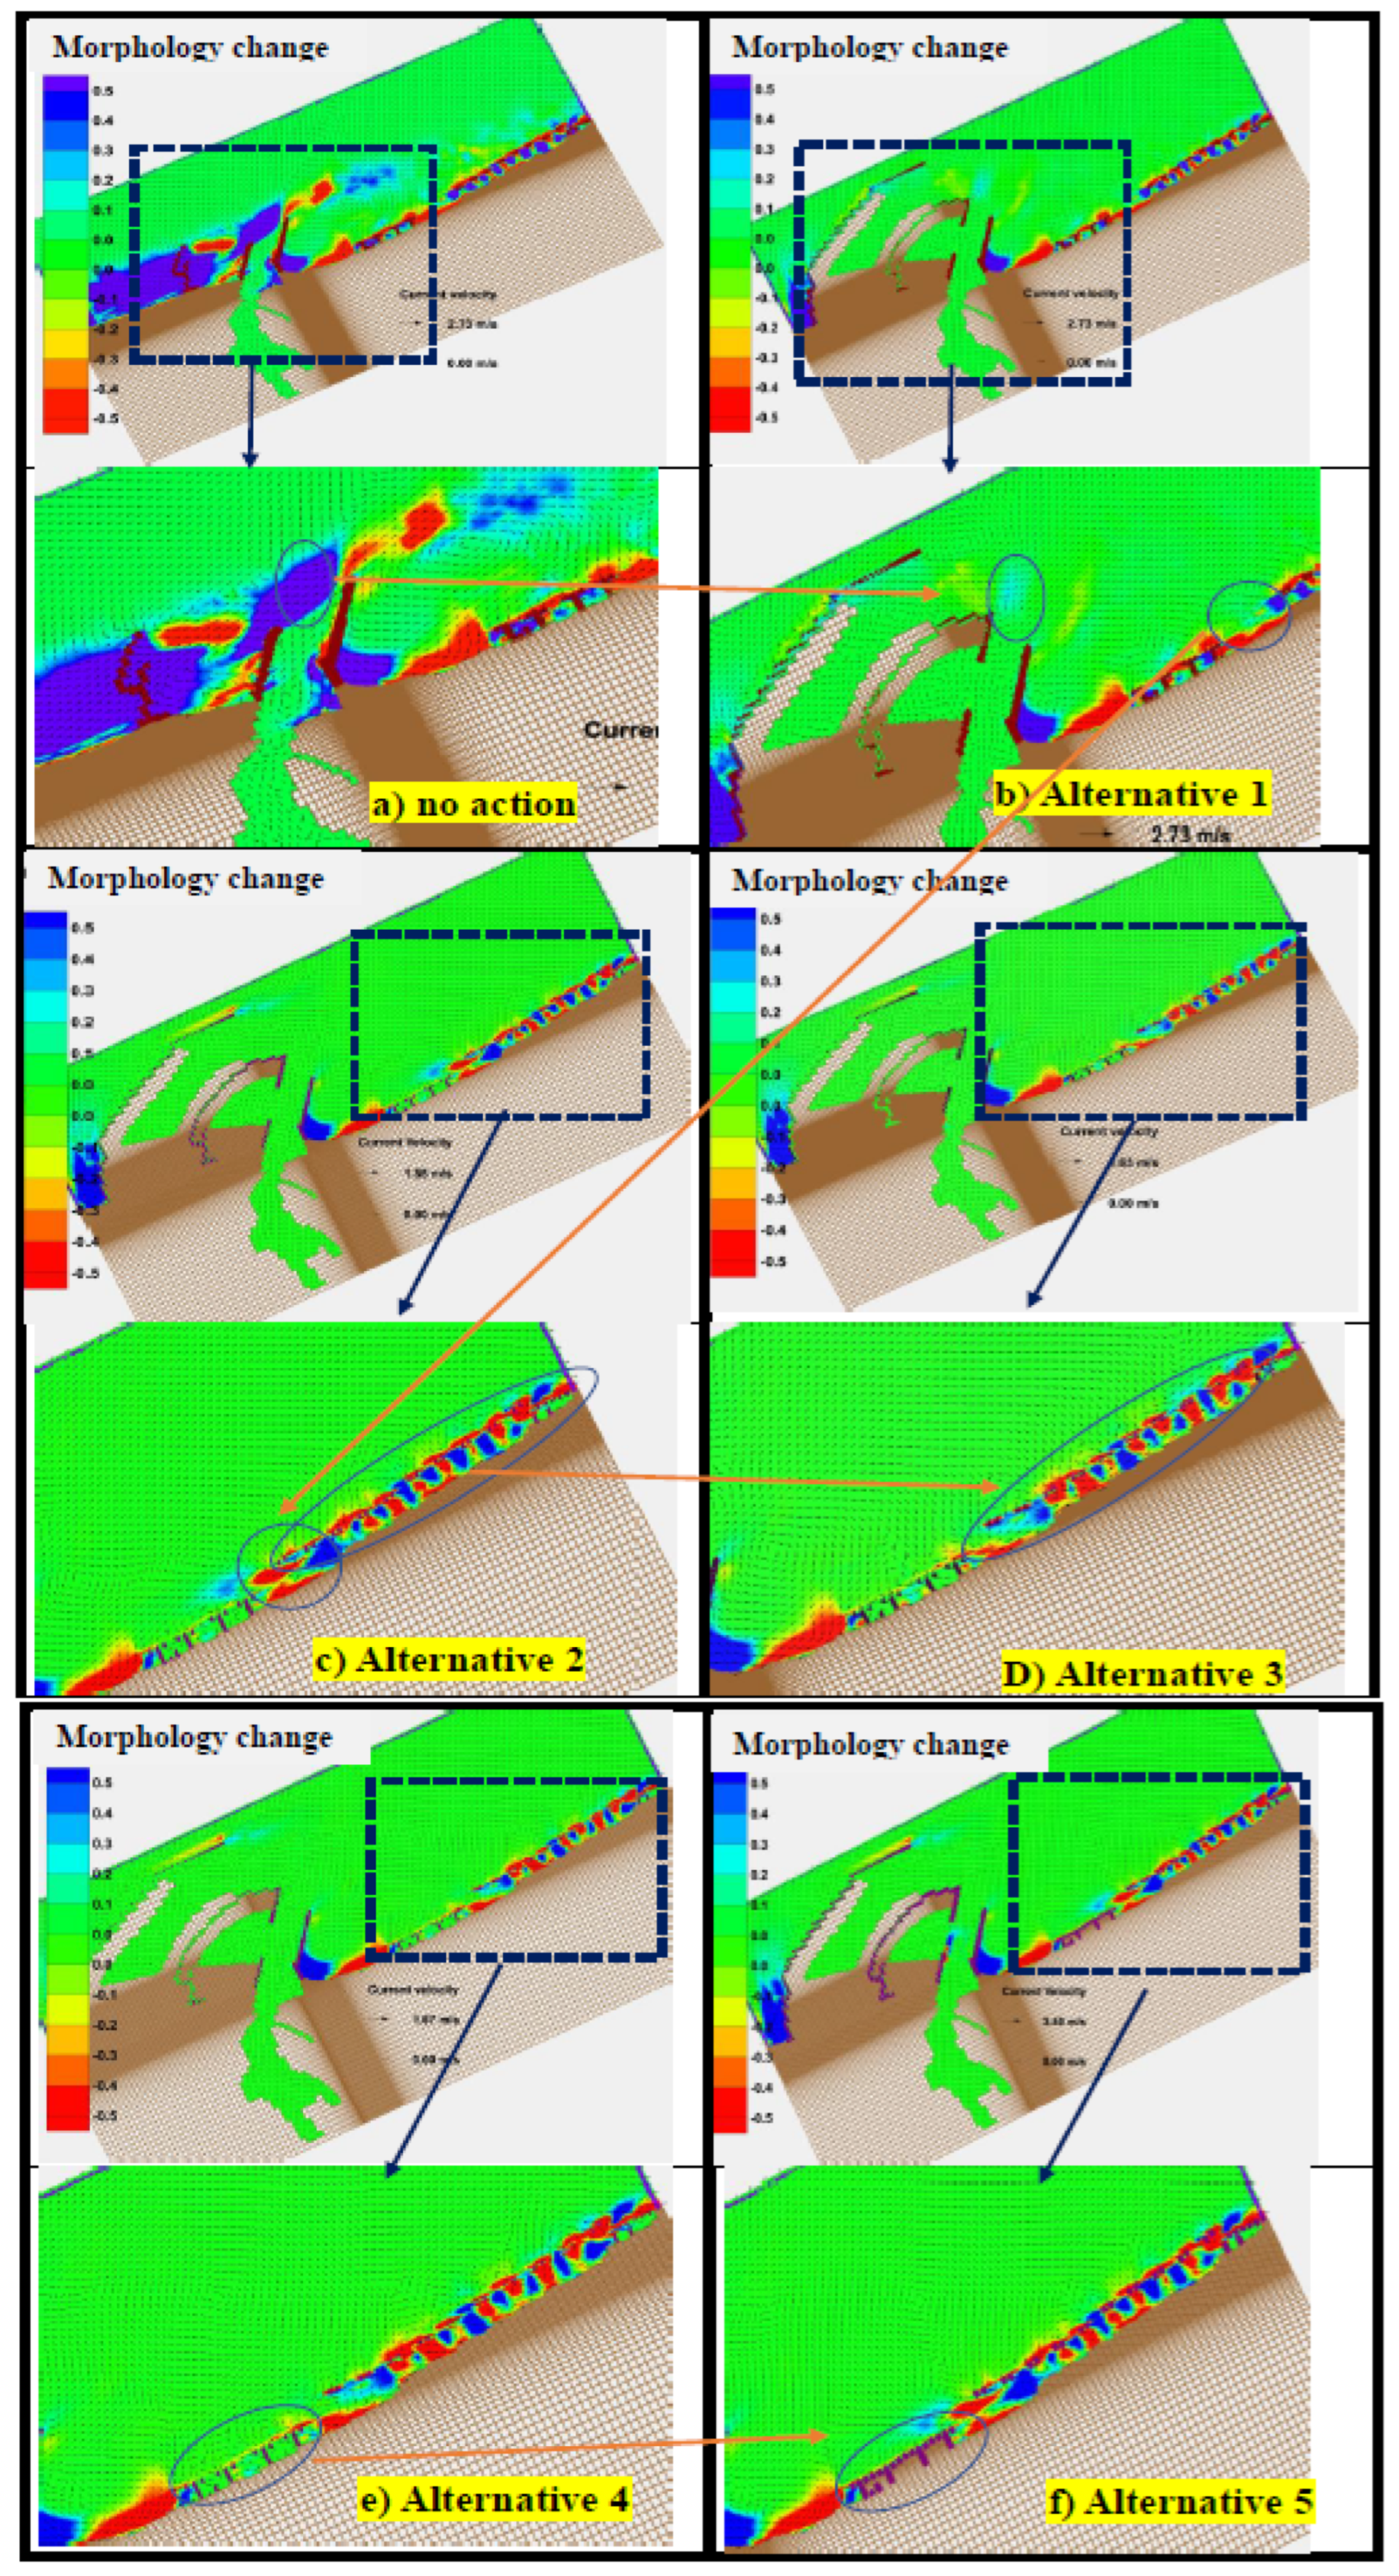
Figure 11.
Bed elevation changes resulting from varios alternatives for (A) Profile 1, (B)Profile 2, (C) Profile 3, (D) Profile 4.
Figure 11.
Bed elevation changes resulting from varios alternatives for (A) Profile 1, (B)Profile 2, (C) Profile 3, (D) Profile 4.
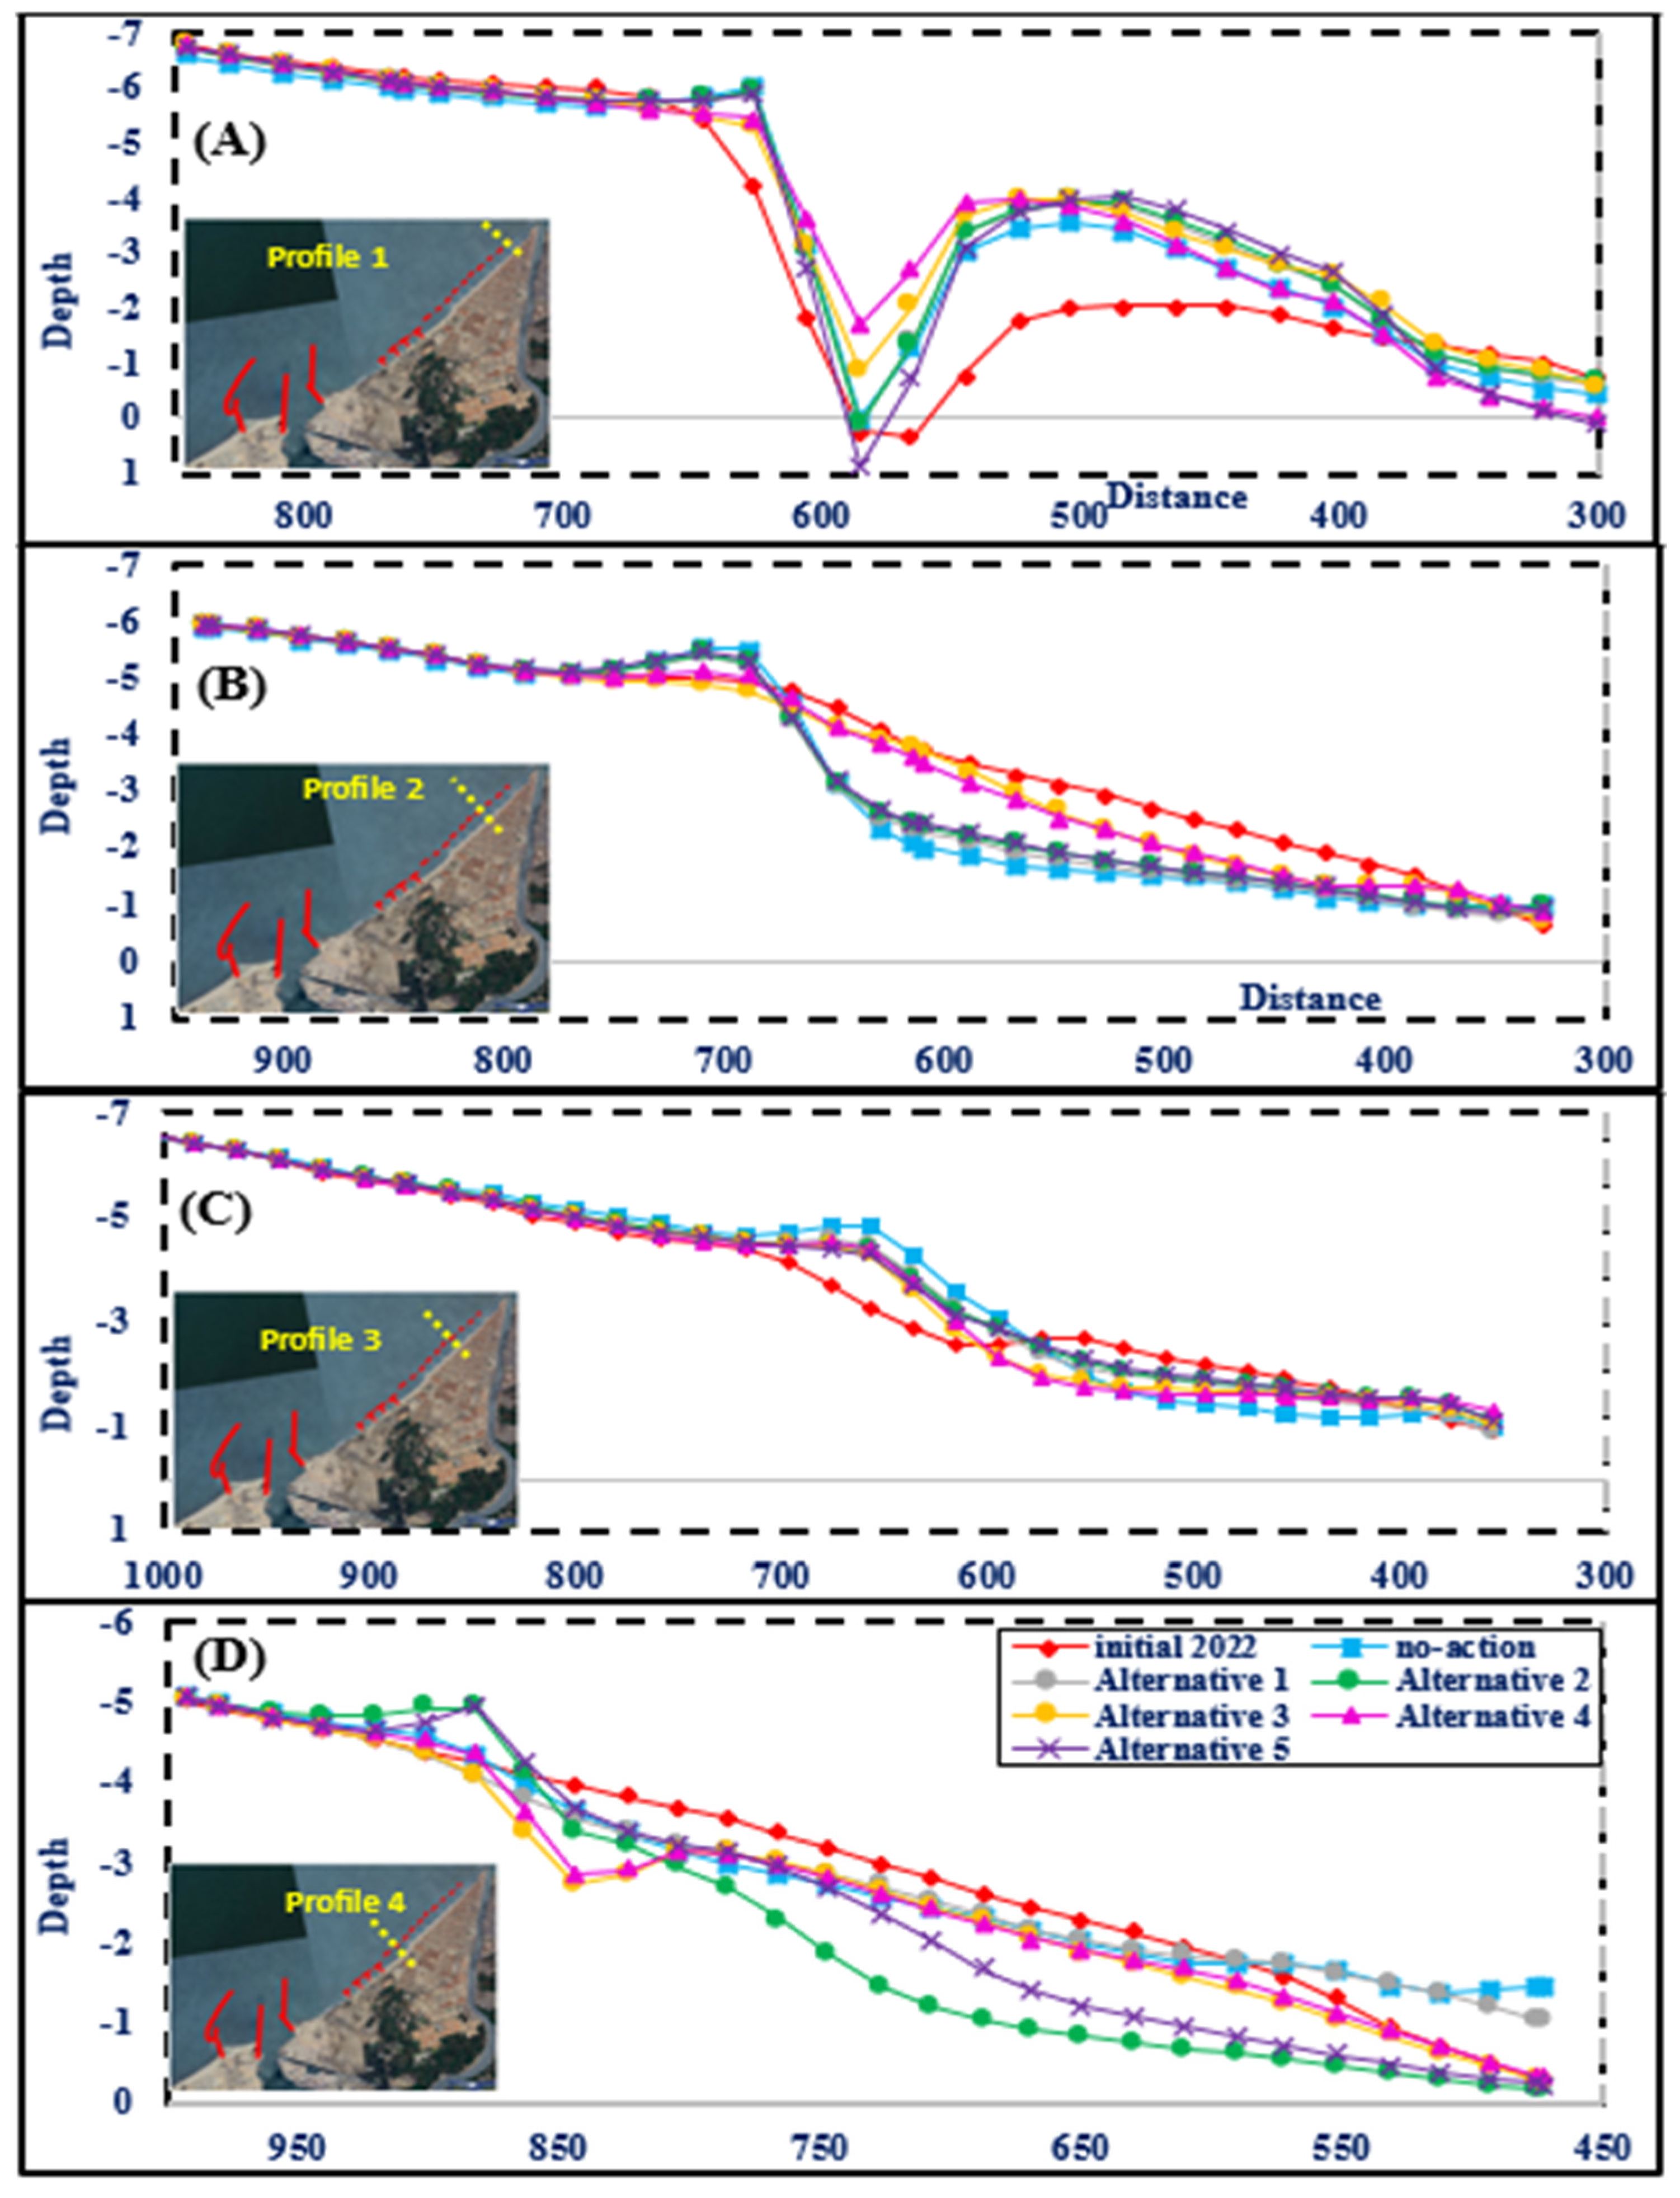
Figure 12.
Bed elevation changes resulting from varios alternatives for (A) Profile 5, (B) Profile 6, (C) Profile 7.
Figure 12.
Bed elevation changes resulting from varios alternatives for (A) Profile 5, (B) Profile 6, (C) Profile 7.
Disclaimer/Publisher’s Note: The statements, opinions and data contained in all publications are solely those of the individual author(s) and contributor(s) and not of MDPI and/or the editor(s). MDPI and/or the editor(s) disclaim responsibility for any injury to people or property resulting from any ideas, methods, instructions or products referred to in the content. |
© 2025 by the authors. Licensee MDPI, Basel, Switzerland. This article is an open access article distributed under the terms and conditions of the Creative Commons Attribution (CC BY) license (http://creativecommons.org/licenses/by/4.0/).
Copyright: This open access article is published under a Creative Commons CC BY 4.0 license, which permit the free download, distribution, and reuse, provided that the author and preprint are cited in any reuse.


