
Submitted:
04 November 2025
Posted:
05 November 2025
You are already at the latest version
Abstract
Flood hazards in arid oil-producing regions are significantly influenced by both natural hydrological processes and terrain changes resulting from subsidence. This study develops a deformation-adjusted approach to flood risk assessment for the Yibal field in the northern part of the Sultanate of Oman, where long-term hydrocarbon production has led to measurable ground deformation. A high-resolution digital elevation model (DEM) from an aerial survey in 2013 was adjusted using cumulative surface deformation data (2013–2023) derived from PS-InSAR measurements. By subtracting the surface deformation from the baseline DEM, an updated DEM for 2023 was produced that explicitly incorporates subsidence into hydrological modeling. Weighted flood risk mapping was then performed using slope, precipitation, land use/land cover, and drainage parameters. Results show a marked increase of flood vulnerability, with high- to very high-risk zones (8.0-8.6, 8.7-9.6) expanding in areas affected by surface deformation. These findings demonstrate that conventional flood risk mapping, which neglects subsidence, can underestimate hazard levels in petroleum fields where ground deformation alters drainage pathways. Incorporating subsidence-adjusted terrain data into hydrological risk assessment provides more realistic flood susceptibility maps, improving early warning, infrastructure protection, and sustainable petroleum field management. Beyond the Yibal field, the method is transferable to other petroleum basins and arid regions where subsidence interacts with surface hydrology.
Keywords:
hydrological modeling
; subsidence
; flash flood risk
; digital elevation model
; multi-criteria analysis
; deformation
; arid regions
1. Introduction
In the context of this study, hazard and risk are treated as related but distinct concepts [1]. A hazard refers to the potential occurrence of a damaging hydrological or geomorphological event—such as flash flooding, surface ponding, or terrain deformation—that may cause adverse effects on the environment or infrastructure. In contrast, risk represents the likelihood that such a hazard will occur combined with the severity of its potential impacts on exposed assets, including wells, flowlines, and access roads.
Hazards describe what could happen, while risks indicate the severity and location of potential impacts. Hazard analysis in this research maps and quantifies physical drivers, including precipitation, slope, subsidence, and drainage [2]. Risk assessment then combines these drivers with the spatial exposure and sensitivity of petroleum infrastructure. This distinction clarifies the concepts and enables the study to assess both the occurrence of hydrological processes and the increase in field system vulnerability due to subsidence [3].
Floods are among the most frequent and destructive natural hazards, causing significant social, economic, and environmental impacts [4]. These effects are especially severe in arid and semi-arid regions, where infrequent but intense rainfall can trigger rapid flash floods. The sudden onset and limited early warning often led to infrastructure damage, loss of life, and economic disruption. In oil-producing basins, the risks are greater because petroleum infrastructure is highly vulnerable to flood damage, which can lead to significant financial losses and environmental harm [5].
Accurately assessing flood hazards in such settings requires reliable representations of terrain, since topography dictates runoff pathways, drainage patterns, and water accumulation zones. Digital elevation models (DEM) are therefore central to hydrological modeling and flood risk assessment. However, most flood hazard studies assume that topography remains static over time. In reality, terrain conditions evolve due to natural processes such as erosion and tectonic activity, as well as human activities including mining and hydrocarbon extraction. In petroleum fields, subsidence induced by reservoir compaction can exceed one meter, often developing gradually over several years as cumulative pressure decline and stress redistribution within the reservoir, resulting in localized depressions that alter surface gradients and drainage pathways [6]. When such changes are ignored, conventional flood risk levels may underestimate hazard maps and misrepresent vulnerable zones [7].
The impact of subsidence on hydrological processes remains a topic of debate. Some research indicates that rainfall intensity and land cover have a greater influence on flood risk than ground displacement [8]. At the same time, other studies show that even minor subsidence can alter runoff patterns and increase flood vulnerability [9]. This disagreement highlights the need to test methods that directly account for subsidence in hydrological risk assessments [10]. The issue is especially urgent in oil fields, where engineered landscapes, infrastructure, and ground movement interact in ways that static DEM cannot capture.
The literature offers differing views on how subsidence affects hydrology. Some researchers maintain that rainfall intensity and land cover are the primary drivers, with subsidence playing a minor role [11]. Others have shown that vertical displacements of just a few tens of centimeters can alter runoff patterns, increase ponding, and raise flood risks for infrastructure [12]. These differences highlight the need for empirical studies that compare subsidence-adjusted terrain models with standard DEM-based analysis. This research is critical in engineered environments, where even minor topographic changes can significantly impact the vulnerability of infrastructure [13].
Numerous methodologies have been developed for flood hazard analysis. Traditional statistical approaches utilize rainfall intensity–duration–frequency (IDF) relationships [14], [15] to estimate flood magnitudes and return periods. Physically based hydrological models, including HEC-HMS [16] and SWAT [17], simulate rainfall–runoff processes in detail and require extensive meteorological and soil datasets. GIS-based multi-criteria evaluation (MCE) [18] approaches integrate terrain, precipitation, land cover, and drainage factors to generate spatially explicit flood susceptibility maps. Recent advances incorporate machine learning and probabilistic frameworks [19] to improve predictive accuracy and address uncertainty. Despite differences in complexity and data requirements, all methods fundamentally depend on the accuracy of the digital elevation model (DEM) as the spatial representation of terrain. If the DEM does not accurately reflect subsidence-induced changes, flood pathways and hazard zones may be misrepresented, regardless of the model's sophistication [20].
Remote sensing is essential for advancing hydrological hazard analysis. Satellite-derived precipitation products enhance rainfall estimates in data-scarce regions, and land cover classifications from optical sensors improve runoff models. InSAR provides precise, wide-area ground deformation monitoring over extended periods [21]. Integrating InSAR-derived subsidence with DEM-based hydrological modeling is an underexplored but logical step to improve flood risk assessments. This approach integrates geodetic monitoring with hydrological analysis, allowing for terrain adjustments that accurately reflect real surface changes rather than relying on static assumptions [22].
Despite recent advances, many flood studies in areas affected by subsidence continue to examine ground deformation and hydrological processes separately. Hydrologists often create flood maps without considering changes in the terrain, while geoscientists record subsidence without connecting it to flooding. This separation leads to incomplete assessments and missed chances for better hazard modeling [23]. It is crucial to integrate these fields in oil-producing regions, where subsidence, flood risks, and infrastructure vulnerability intersect. Using deformation-adjusted DEM in flood modeling can make hydrological risk assessments much more accurate, giving decision-makers better information for planning and mitigation [24].
Localized hydrology studies provide additional insight by focusing on fine-scale terrain dynamics and infrastructure exposure. Such studies move beyond regional or national models to capture site-specific conditions, including wadi alignments, land cover changes, and micro-topographic variations that influence runoff behavior. In oil field environments, localized analysis is essential because infrastructure is often concentrated in narrow corridors where pipelines, flowlines, and well pads intersect with drainage systems. High-resolution DEM and deformation data enable such localized assessments, ensuring that indirect but critical topographic changes are incorporated into flood risk evaluations [25]. By applying a site-specific perspective, localized studies complement broader hydrological models and provide operationally relevant guidance for hazard mitigation.
The Sultanate of Oman represents a relevant case study for developing such an integrated approach. Flash floods are recurrent hazards across the country, periodically damaging infrastructure and affecting communities. The Yibal field [26], one of Oman’s most mature and productive petroleum fields, has experienced sustained hydrocarbon production for decades, resulting in measurable ground subsidence [27]. At the same time, the field is intersected by wadis that act as conduits for floodwaters during heavy rainfall events. This convergence of anthropogenic subsidence [28] and natural flood susceptibility [29] provides a unique opportunity to evaluate how subsidence-adjusted DEM influences hydrological risk assessments [30] in petroleum basins.
This study addresses this gap by developing a subsidence-adjusted flood risk assessment for the Yibal field in the northern part of the Sultanate of Oman. The approach explicitly incorporates surface deformation into terrain modeling to generate more realistic hydrological risk maps. By demonstrating how subsidence alters flood pathways and increases hazard levels, the study advances current flood risk assessment practices and provides a transferable methodology for arid petroleum basins worldwide.
2. Materials and Methods
This study used a structured workflow to assess flood vulnerability in subsidence-affected areas of the Yibal field, Sultanate of Oman. The methodology included three main steps: characterizing the study area with relevant climatic, geomorphological, and industrial features; acquiring and processing datasets such as a 2013 high-resolution DEM, PS-InSAR-derived subsidence data from 2013 to 2023, precipitation records, land use and cover, and drainage information; and generating a deformation-adjusted DEM for 2023 to support weighted multi-criteria flood risk mapping. The following sections outline the study area, data sources, and methods, providing support for replication and adaptation in similar petroleum field settings.
2.1. Study Area
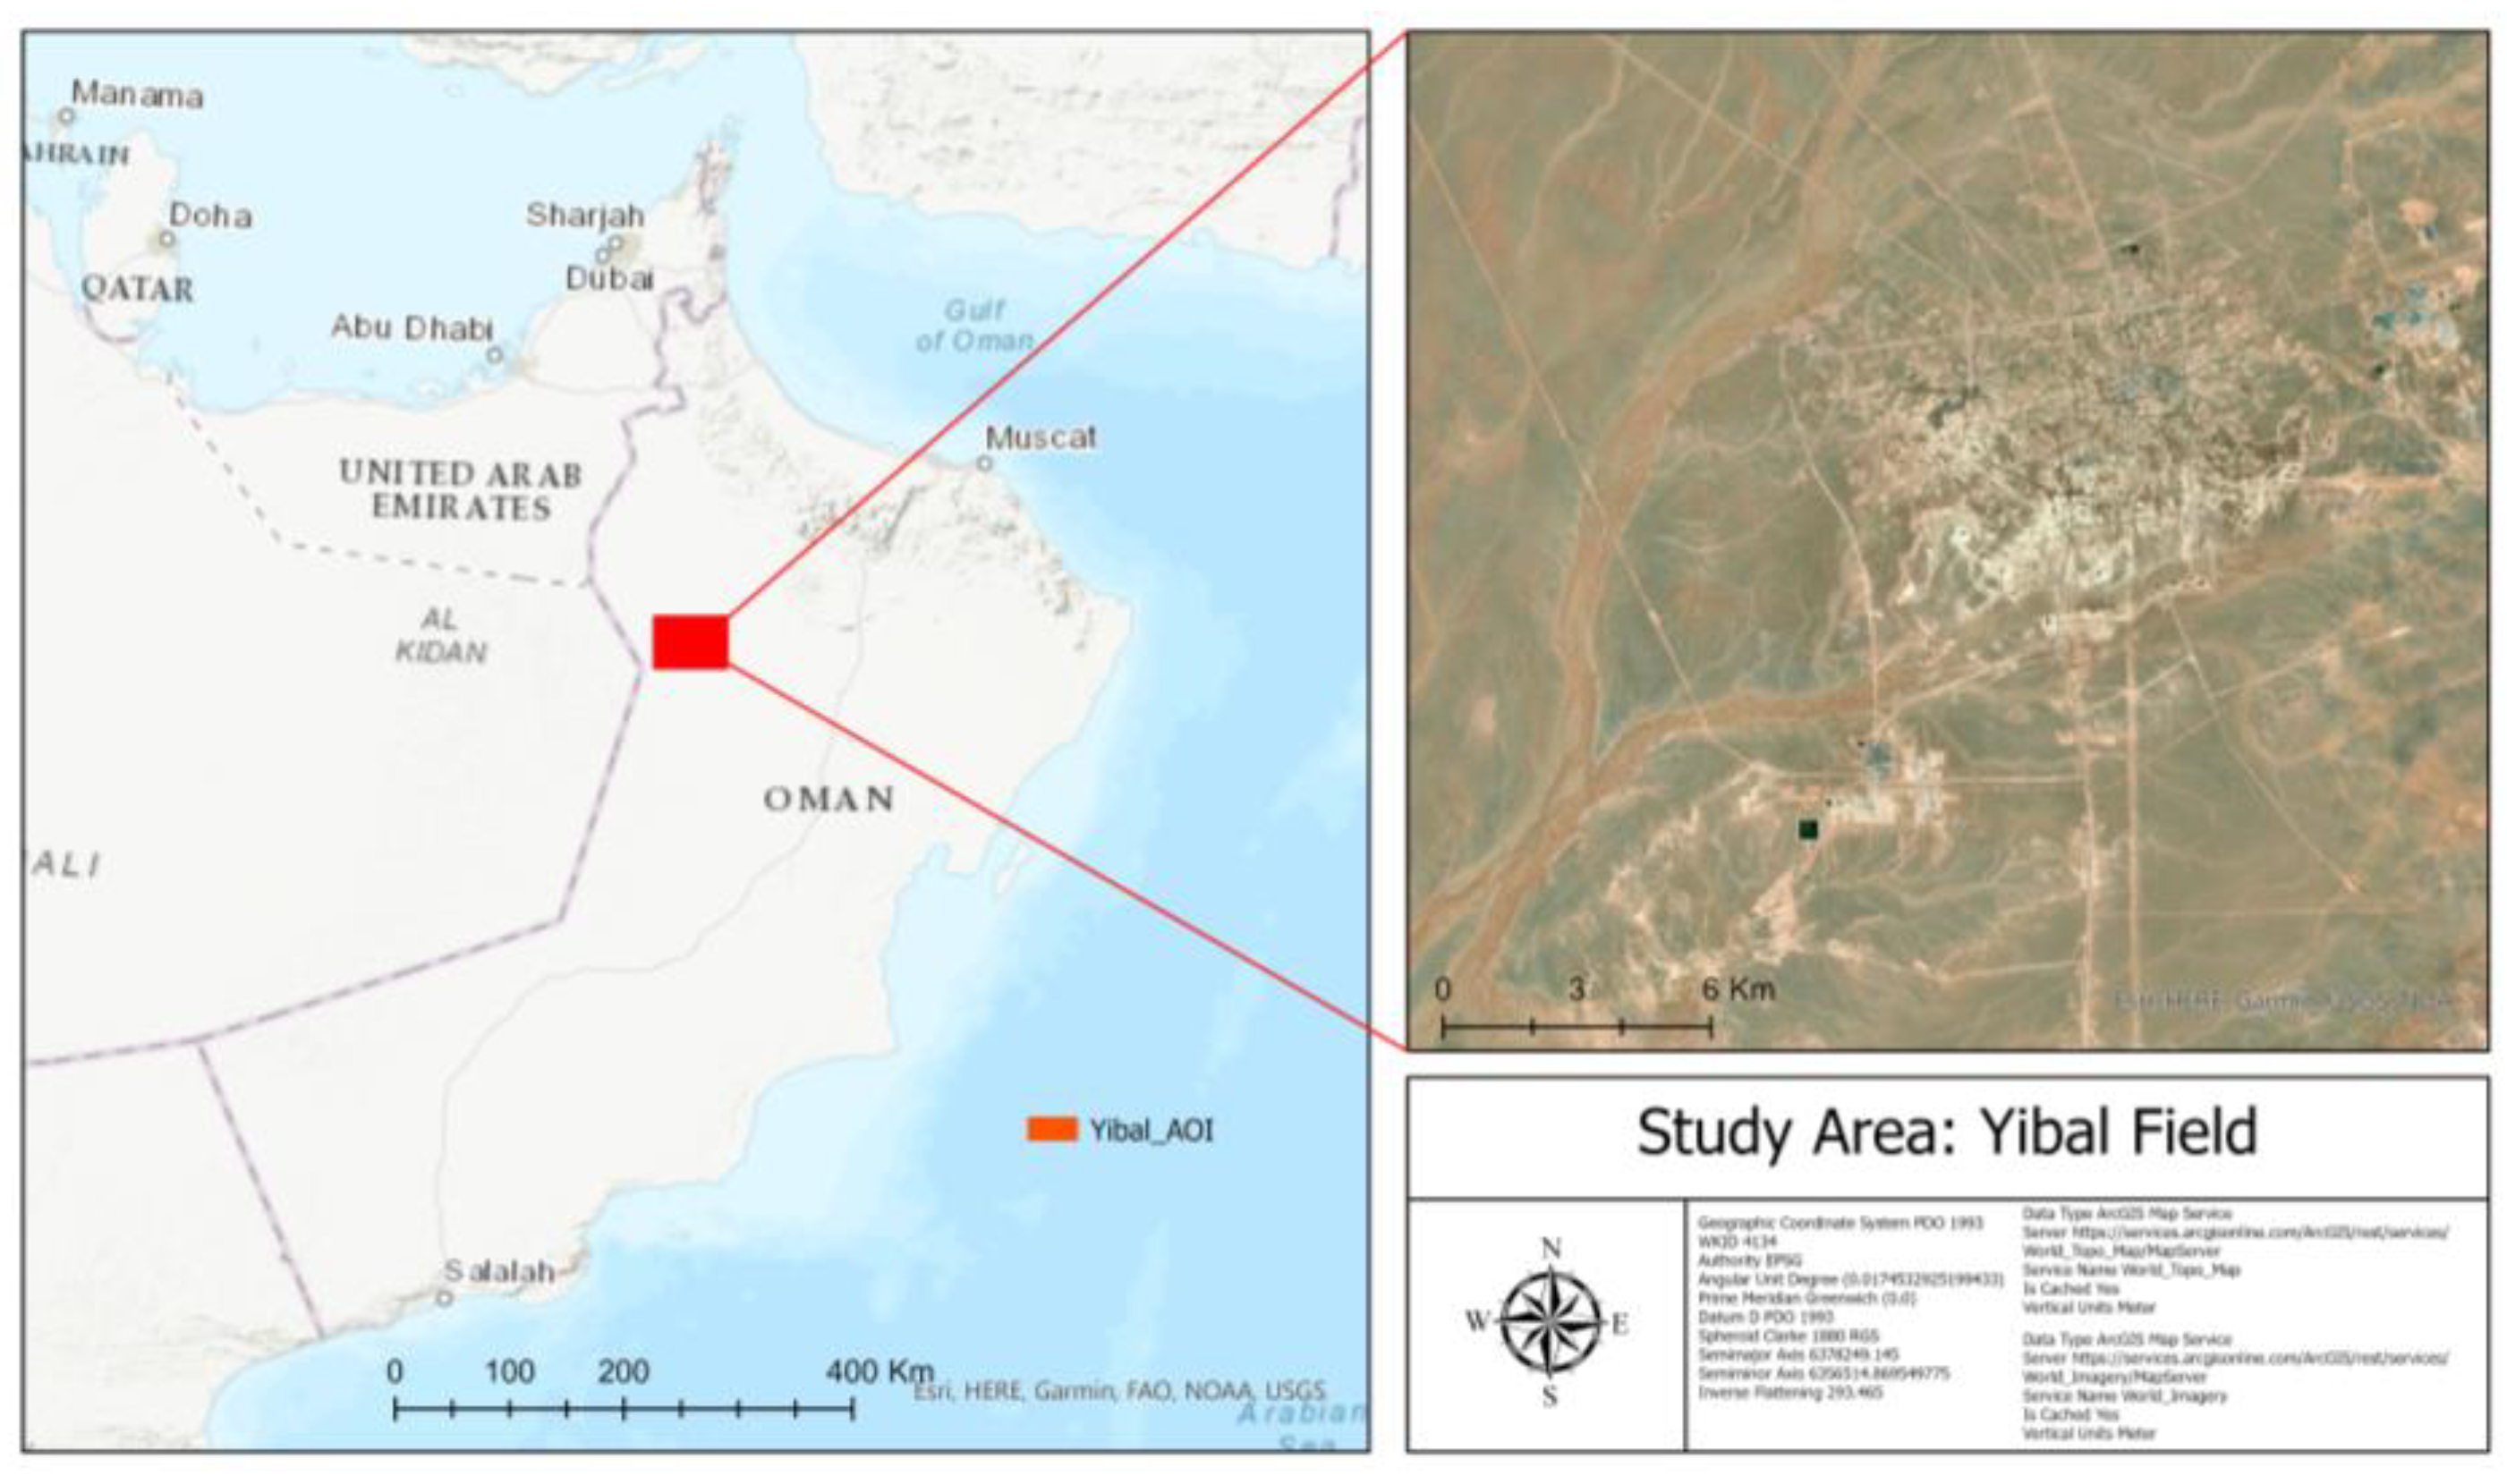
The Yibal field is located in the northern part of the Sultanate of Oman’s Al Dhahirah Governorate, about 350 kilometers west of Muscat. It sits between the Hajar Mountains and the Rub al Khali Desert, an area known for its dry climate and sensitive desert environment. Yibal has been a key petroleum field in Oman since the 1960s, with production continuing for many years. The field’s main reservoirs are the Natih and Shuaiba carbonate formations [31], developed using both conventional and enhanced oil recovery methods. Continued reservoir compaction and fluid extraction have led to subsidence, with vertical displacements exceeding one meter recorded in some areas from 2013 to 2023 [32]. This deformation has altered surface gradients and drainage patterns, potentially affecting the distribution of flood hazards.
The region is hyper-arid, receiving less than 30 mm of rain annually, mainly from short, intense storms. These storms cause flash floods that move quickly through ephemeral wadis, several of which cross the Yibal field and drain into closed desert basins. During storms, these wadis channel floodwater, creating areas of high hydrological risk. Field infrastructure, such as pipelines, flowlines, roads, and well pads, is often located near these wadis, increasing exposure to flood hazards. The combination of subsidence and flood-prone terrain makes Yibal an intense case study for flood vulnerability in areas experiencing subsidence [32]. This study utilizes high-resolution terrain and deformation data to assess the impact of changing topography on hydrological risk in oil and gas fields [12].
Figure 1.
Location of the Yibal field in the northern part of the Sultanate of Oman, showing major wadis, drainage systems, and field infrastructure.
Figure 1.
Location of the Yibal field in the northern part of the Sultanate of Oman, showing major wadis, drainage systems, and field infrastructure.
2.2. Data Sources
High-resolution terrain data, surface deformation measurements, and hydrological datasets were integrated to generate a subsidence-adjusted digital elevation model (DEM) and extract parameters essential for flood risk mapping. All spatial datasets were projected to the PDO National Grid (EPSG: 3440, UTM Zone 40N, PSD93) to ensure spatial consistency and were resampled to a uniform resolution before analysis.
The baseline Digital Elevation Model (DEM) was derived from an aerial photogrammetric survey conducted in 2013. The DEM features a spatial resolution of 5 meters, providing a detailed representation of the topography at the time of data acquisition. This dataset was chosen due to its high vertical accuracy relative to global DEM such as SRTM, ASTER, and ALOS PALSAR, which is essential for localized hydrological analysis in the relatively flat field environment where minor topographic variations significantly affect flood pathways [33]. Quality assurance was conducted using ground control points, resulting in an estimated vertical accuracy of ±0.1 meters.
The surface deformation dataset was created by merging multi-temporal PS-InSAR products from RADARSAT-2 (2013–2020) and TerraSAR-X (2020–2023) [34], [35]. This combined dataset was processed into a continuous lookup table showing cumulative vertical displacement across the study area from 2013 to 2023. It identified localized subsidence exceeding 1.0 m in parts of the field. The merged product was resampled to 5 m resolution and integrated with the 2013 photogrammetry DEM to produce a subsidence-adjusted DEM reflecting 2023 terrain conditions.
The land use and land cover (LULC) dataset was obtained from the European Space Agency’s Sentinel-2 imagery [36], covering the year 2023. With a 10 m spatial resolution, Sentinel-2's multispectral bands enabled the detailed classification of land cover types, including vegetation, bare soil, and built-up areas. These categories were later reclassified into hydrologically relevant groups for use in weighted flood risk mapping [34].
The precipitation dataset represents the average annual rainfall for 2023 (in millimeters), sourced from global satellite-based climate products and downscaled to approximately 1 kilometer resolution for the study area [37]. Using 2023 rainfall data offers a more current and representative input for hydrological risk mapping in this arid region, where flood events vary significantly from year to year [38].
Together, these four primary datasets—elevation, cumulative surface deformation, land cover, and precipitation—formed the foundation for developing the subsidence-adjusted DEM and generating subsequent flood risk maps.

Table 1.
Primary datasets used in this study.
| Dataset | Source/Provider | Year/Period | Resolution | Purpose |
| Digital Elevation Model (DEM) | Aerial (NSA) | 2013 | 5m | Baseline topography |
| Surface Deformation | Satellite (Radarsat-2, TerraSAR-X) | 2013-2023 | 20–30 m (resampled to 5 m) | Subsidence adjustment of baseline DEM |
| Land Use Land Cover (LULC) | Sentinel-2, European Space Agency | 2023 | 10m | Land cover classification |
| Precipitation | Satellite-Based Data, WorldClim | 2023 (annual average) | ~1km | Rainfall input for flood risk analysis |
2.3. Study Framework and Workflow
In this study, hazard refers to the probability of harmful hydrological events. Risk considers both the likelihood of these events and the potential severity of their impact on petroleum infrastructure. Hazard identifies possible sources of damage, while risk links these hazards to exposed assets and likely consequences. Additionally, vulnerability refers to the extent to which field infrastructure is exposed and sensitive to hydrological hazards in areas affected by subsidence. Resilience is the ability to absorb these impacts and maintain operations. These are opposite yet complementary aspects of risk assessment. The study used a step-by-step approach to combine terrain data adjusted for subsidence with hydrological information to create weighted flood risk maps. The process included four main steps: adjusting the DEM for subsidence, identifying hydrological and environmental factors, reclassifying factors into standard risk categories, and using a weighted overlay to produce the final flood risk map.
2.3.1. DEM Adjustment Based Subsidence
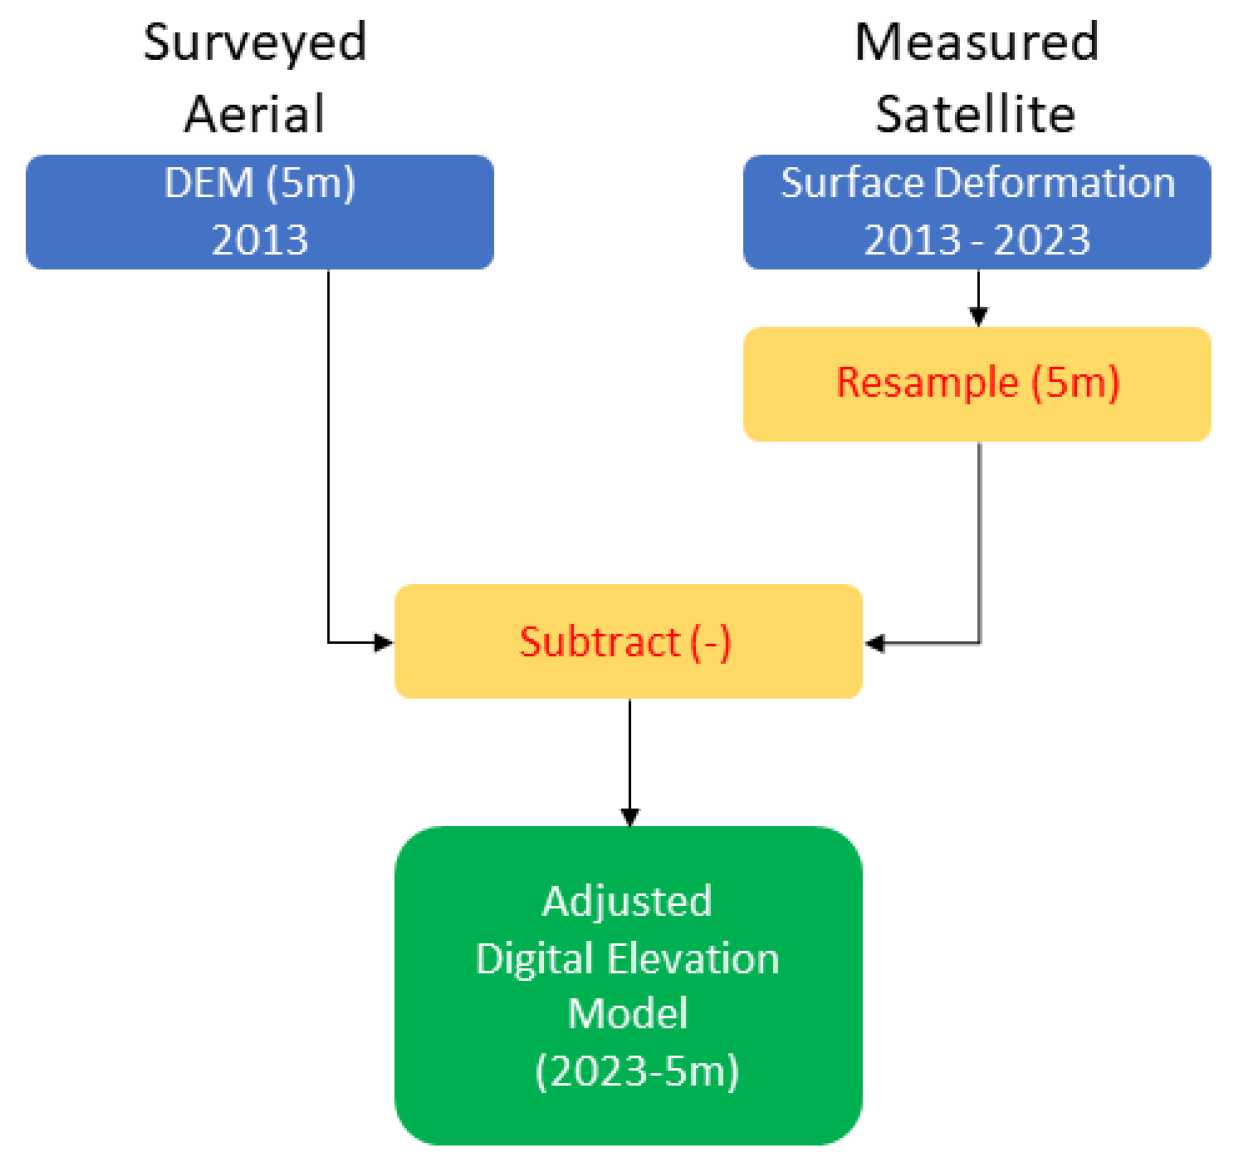
The baseline digital elevation model (DEM) derived from the 2013 aerial photogrammetry survey was corrected for ground subsidence using cumulative deformation data from PS-InSAR sources, specifically RADARSAT-2 (2013–2020) and TerraSAR-X (2020–2023). A merged lookup table of vertical displacement was resampled to a 5-meter resolution and subtracted from the 2013 DEM on a cell-by-cell basis. This procedure produced a subsidence-adjusted DEM for 2023, which identified localized deformation greater than approximately 1.0 meters in several areas of the Yibal field.
Figure 2.
Adjusted Digital Elevation Model based on Cumulative Subsidence 2023.
2.3.2. Slope Derivation
Slope gradients were calculated from the subsidence-adjusted DEM using a standard 5×5 moving window algorithm. This slope layer captures local elevation changes that affect runoff velocity and water accumulation. Using the adjusted DEM ensures the dataset represents both natural topography and terrain changes from deformation, providing an accurate basis for 2023 flood risk modeling.
2.3.3. Hydrological Processing and Proximity-to-streams Derivation
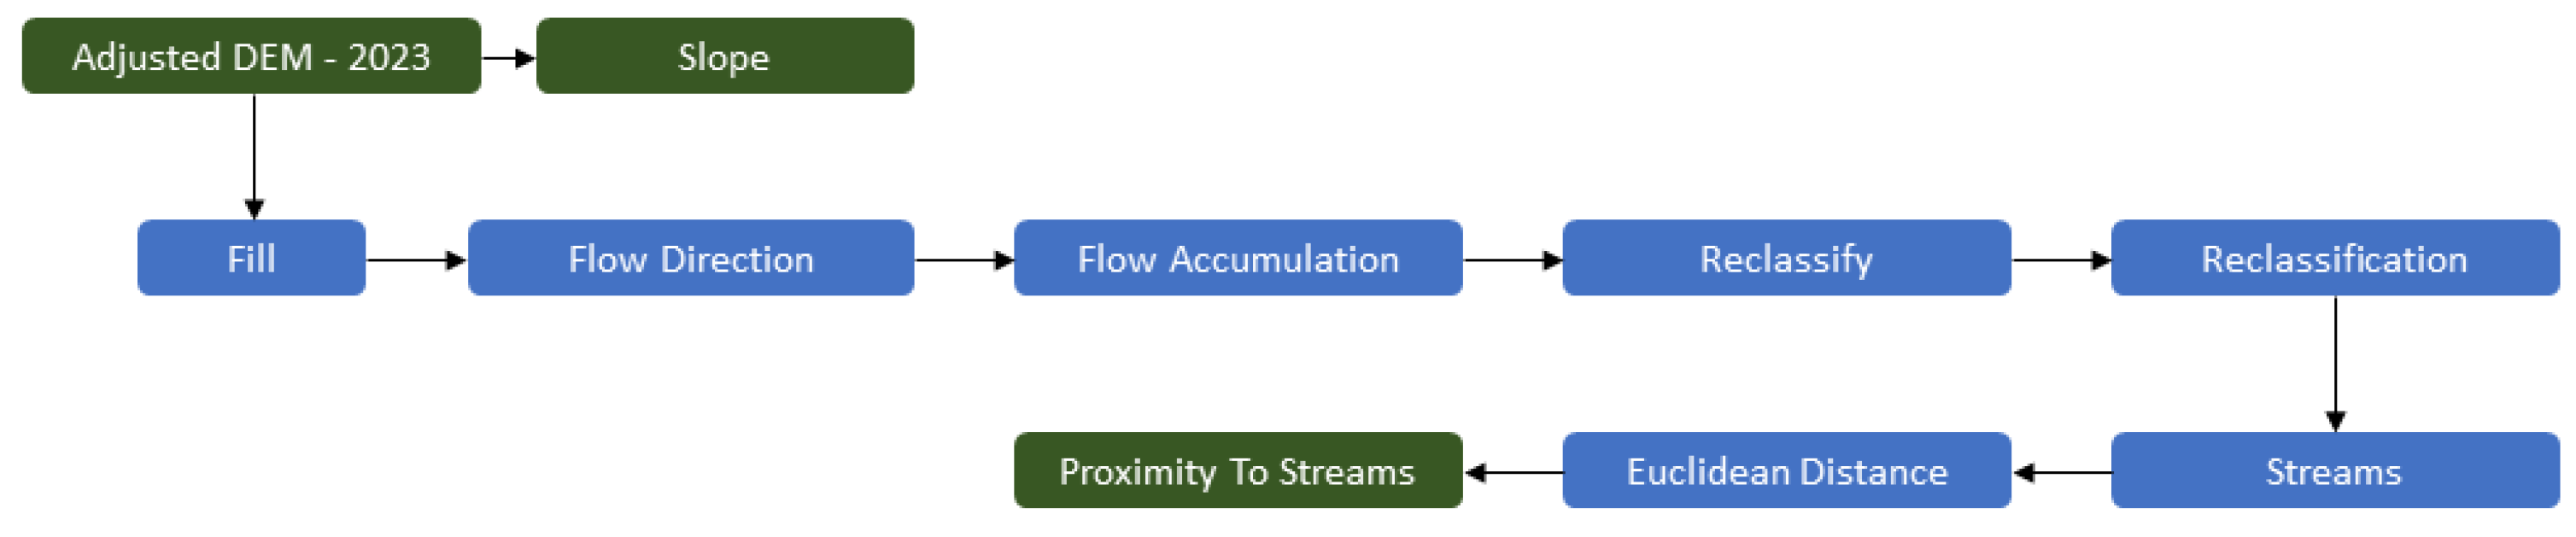
The adjusted DEM (2023) was first filled to remove sinks, ensuring correct water flow modeling. Flow direction and flow accumulation layers were then generated, from which stream networks were delineated. Using the extracted stream features, Euclidean distance was computed to create a proximity-to-streams layer, representing areas most likely to concentrate runoff.
Figure 3.
Workflow of hydrological processing applied to the subsidence-adjusted DEM.
2.3.4. Factor Reclassification
To facilitate the integration of heterogeneous datasets, each factor was standardized and reclassified into five deformation flood risk susceptibility classes: very low, low, moderate, high, and very high (corresponding to values 2, 4, 6, 8, and 10). This approach ensured comparability across factors measured in different units of measurement. The classification criteria were based on hydrological principles and tailored to the specific conditions of the Yibal field.
- ▪ Elevation: Low-lying and flat areas were classified as very high susceptibility due to their tendency to accumulate water. In contrast, higher elevations and mountainous regions were assigned a very low susceptibility due to their adequate natural drainage.
Table 2.
Classification of Elevation into Risk Zones.
| Class Number | Min(m) | Max(m) | Risk Class |
| 2 | 138 | 170 | Very Low |
| 4 | 120 | 138 | Low |
| 6 | 104 | 120 | Medium |
| 8 | 87 | 104 | High |
| 10 | 61 | 87 | Very High |
- ▪ Slope: Gentle slopes received higher susceptibility values, reflecting slower runoff and increased potential for ponding. Steep slopes were assigned a lower susceptibility because they promote rapid drainage.
Table 3.
Classification of Slope into Risk Zones.
| Class Number | Min(degree) | Max(degree) | Risk Class |
| 2 | 3.5 | 12 | Very Low |
| 4 | 2 | 3.5 | Low |
| 6 | 1 | 2 | Medium |
| 8 | 0.5 | 1 | High |
| 10 | 0 | 0.5 | Very High |
- ▪ Proximity to Streams: Cells nearest to drainage networks were classified as having very high susceptibility due to the increased likelihood of floodwater concentration. Areas located farther from streams were assigned lower susceptibility.
Table 4.
Classification of Stream Values into Risk Zones.
| Class Number | Min(meter) | Max(meter) | Risk Class |
| 2 | 1750 | 3000 | Very Low |
| 4 | 1150 | 1750 | Low |
| 6 | 700 | 1150 | Medium |
| 8 | 335 | 700 | High |
| 10 | 0 | 335 | Very High |
- ▪ Precipitation: Areas experiencing higher rainfall intensity in 2023 were assigned higher susceptibility values, as increased rainfall elevates runoff generation and flood risk. Areas with lower precipitation were classified as medium susceptibility.
Table 5.
Classification of Precipitation Values into Risk Zones.
| Class Number | Precipitation (mm) | Risk Class |
| 6 | 21 | Medium |
| 8 | 22 | High |
| 10 | 23 | Very High |
- ▪ Land Use/Land Cover (LULC): Built-up and urbanized areas were assigned low susceptibility due to the presence of engineered drainage systems. Vegetated and grassland areas were classified as having medium susceptibility due to their higher infiltration capacity. Wetlands and bare soils received high susceptibility ratings due to their limited infiltration capacity and increased potential for saturation. Open water bodies were classified as very high susceptibility, as they represent areas of permanent or recurring inundation.
Table 6.
Classification of Land Use Land Cover into Risk Zones.
| Class Number | Class Name | Risk Class |
| 4 | Built Area | Low |
| 6 | Grassland/Vegetation | Medium |
| 8 | Bare Soil | High |
| 10 | Open Water | Very High |
Each factor (adjusted digital elevation model, slope, proximity to streams, precipitation, and land cover) was converted into a raster with integer values ranging from 2 (very low) to 10 (very high). These standardized layers served as the foundation for the weighted overlay analysis in the subsequent stage of the framework.
2.3.5. Weighted Overlay Analysis
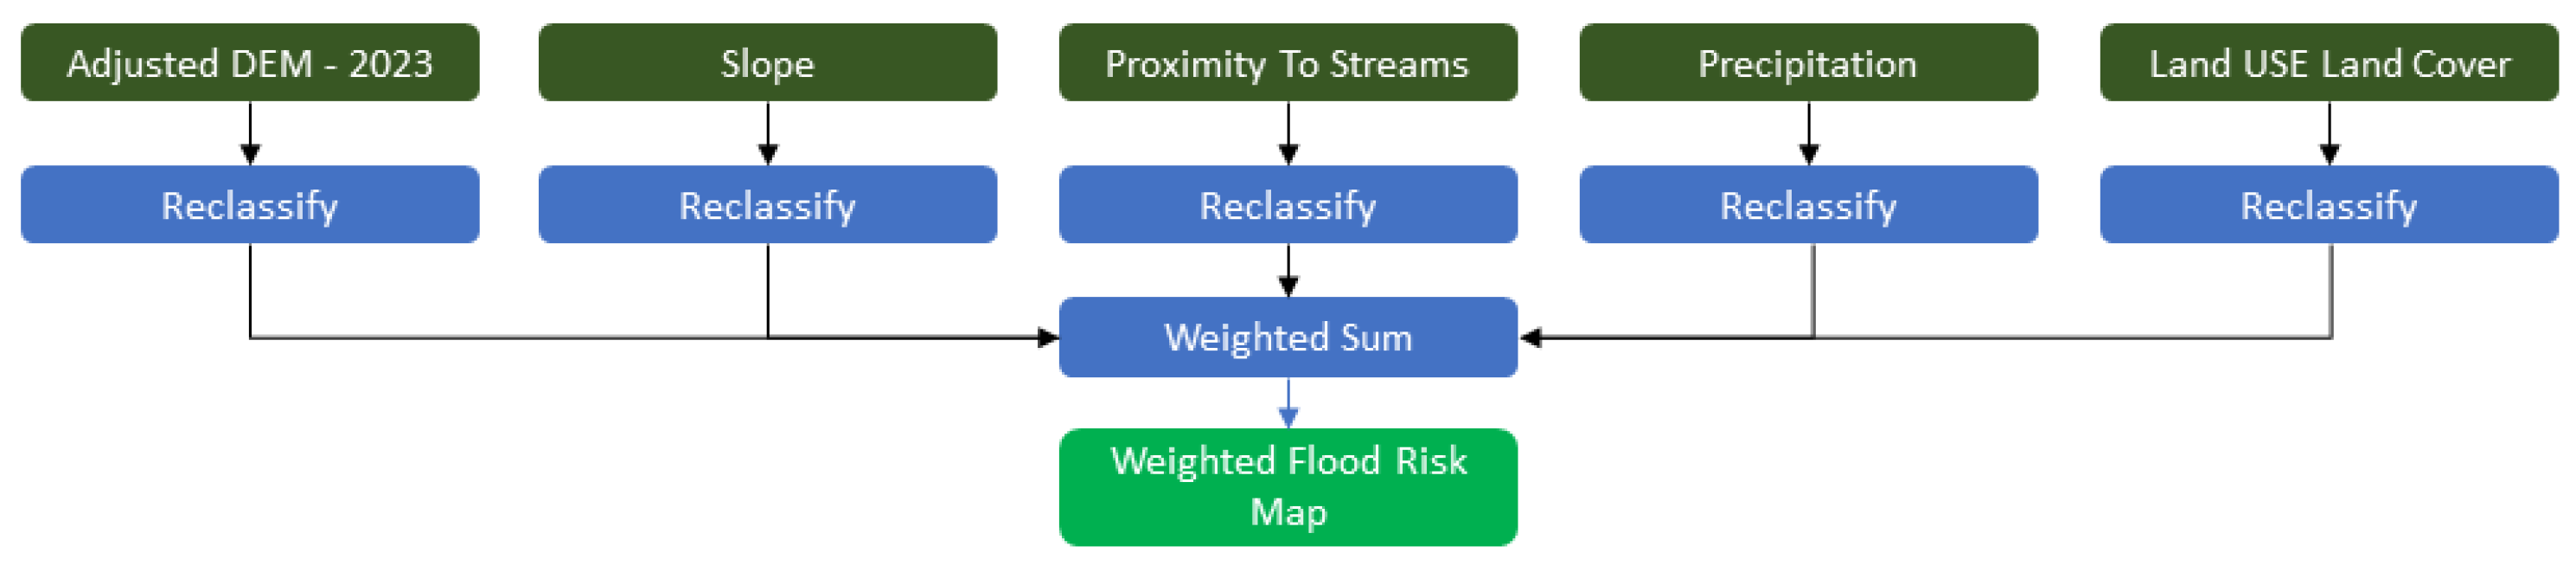
Following reclassification, all input factors were combined into a composite Flood Risk Index (FRI) using weighted overlay analysis in ArcGIS. Weights were determined by the influence of each factor on flood generation in arid environments, based on literature and input from researchers. Precipitation received the highest weight (35%) for its direct impact on flash floods, followed by proximity to streams (30%) for its effect on runoff concentration and pathways. Slope (15%) and DEM (10%) represented the terrain's influence on flow and water accumulation, while LULC (10%) accounted for variations in infiltration and runoff across different land cover types.
The weighted overlay was implemented using a linear summation model:
(1)
where represents the weight of the factor , and represents the standardized reclassified score (ranging from 2 = Very Low to 10 = Very High).
Each factor contributes a value between 2 and 10, and the weights sum to 1.0. Therefore, the theoretical range of the FRI is approximately 4.9 (all factors Very Low) to 9.6 (all factors Very High). To improve interpretation, continuous FRI values were grouped into five risk zones. Thresholds were set using equal interval partitioning and refined based on spatial patterns in flood-prone areas.
Table 7.
Classification of Weighted Scores (Overlay Analysis) into Risk Zones.
| Weighted Score Range | Risk Class |
| 4.9-6.5 | Very Low |
| 6.6-7.2 | Low |
| 7.3-7.9 | Medium |
| 8.0-8.6 | High |
| 8.7-9.6 | Very High |
This final output produced a spatially explicit flood risk map under subsidence-adjusted terrain conditions, allowing comparison with conventional DEM-based models.
Figure 4.
Workflow of weighted overlay analysis showing the integration of reclassified factors (elevation, slope, precipitation, LULC, and proximity to streams) into the final flood risk map.
Figure 4.
Workflow of weighted overlay analysis showing the integration of reclassified factors (elevation, slope, precipitation, LULC, and proximity to streams) into the final flood risk map.
2.4. Data Availability and Reproducibility
The cumulative surface deformation datasets (RADARSAT-2 and TerraSAR-X, 2013–2023) and the 2013 aerial photogrammetry DEM used in this study were provided by Petroleum Development Oman (PDO) under confidentiality agreements and are not publicly available. Derived products, including reclassified layers and weighted flood risk maps, may be requested from the corresponding author, subject to approval by PDO and NSA. Publicly available datasets used in this study include Sentinel-2 land use and land cover imagery (European Space Agency) and annual average precipitation data (WorldClim).
Spatial processing was performed using ArcGIS Pro (Esri), while data handling and visualization were performed using Python scripts (NumPy, Rasterio, Matplotlib). Generative AI tools assisted with language editing and grammar correction. All scientific analysis, data processing, interpretation, and validation were conducted exclusively by the authors.
3. Results
The study's results demonstrate the individual contributions of each factor as well as their combined effects on flood susceptibility in the Yibal field. Input datasets were initially analyzed in their original formats and subsequently reclassified into standardized flood risk classes to ensure comparability across diverse data sources. Factor-specific maps illustrate the spatial distribution of susceptibility drivers, and the final weighted overlay synthesizes these factors into a comprehensive flood risk map.
3.1. Factor-Specific Results before and after Reclassification
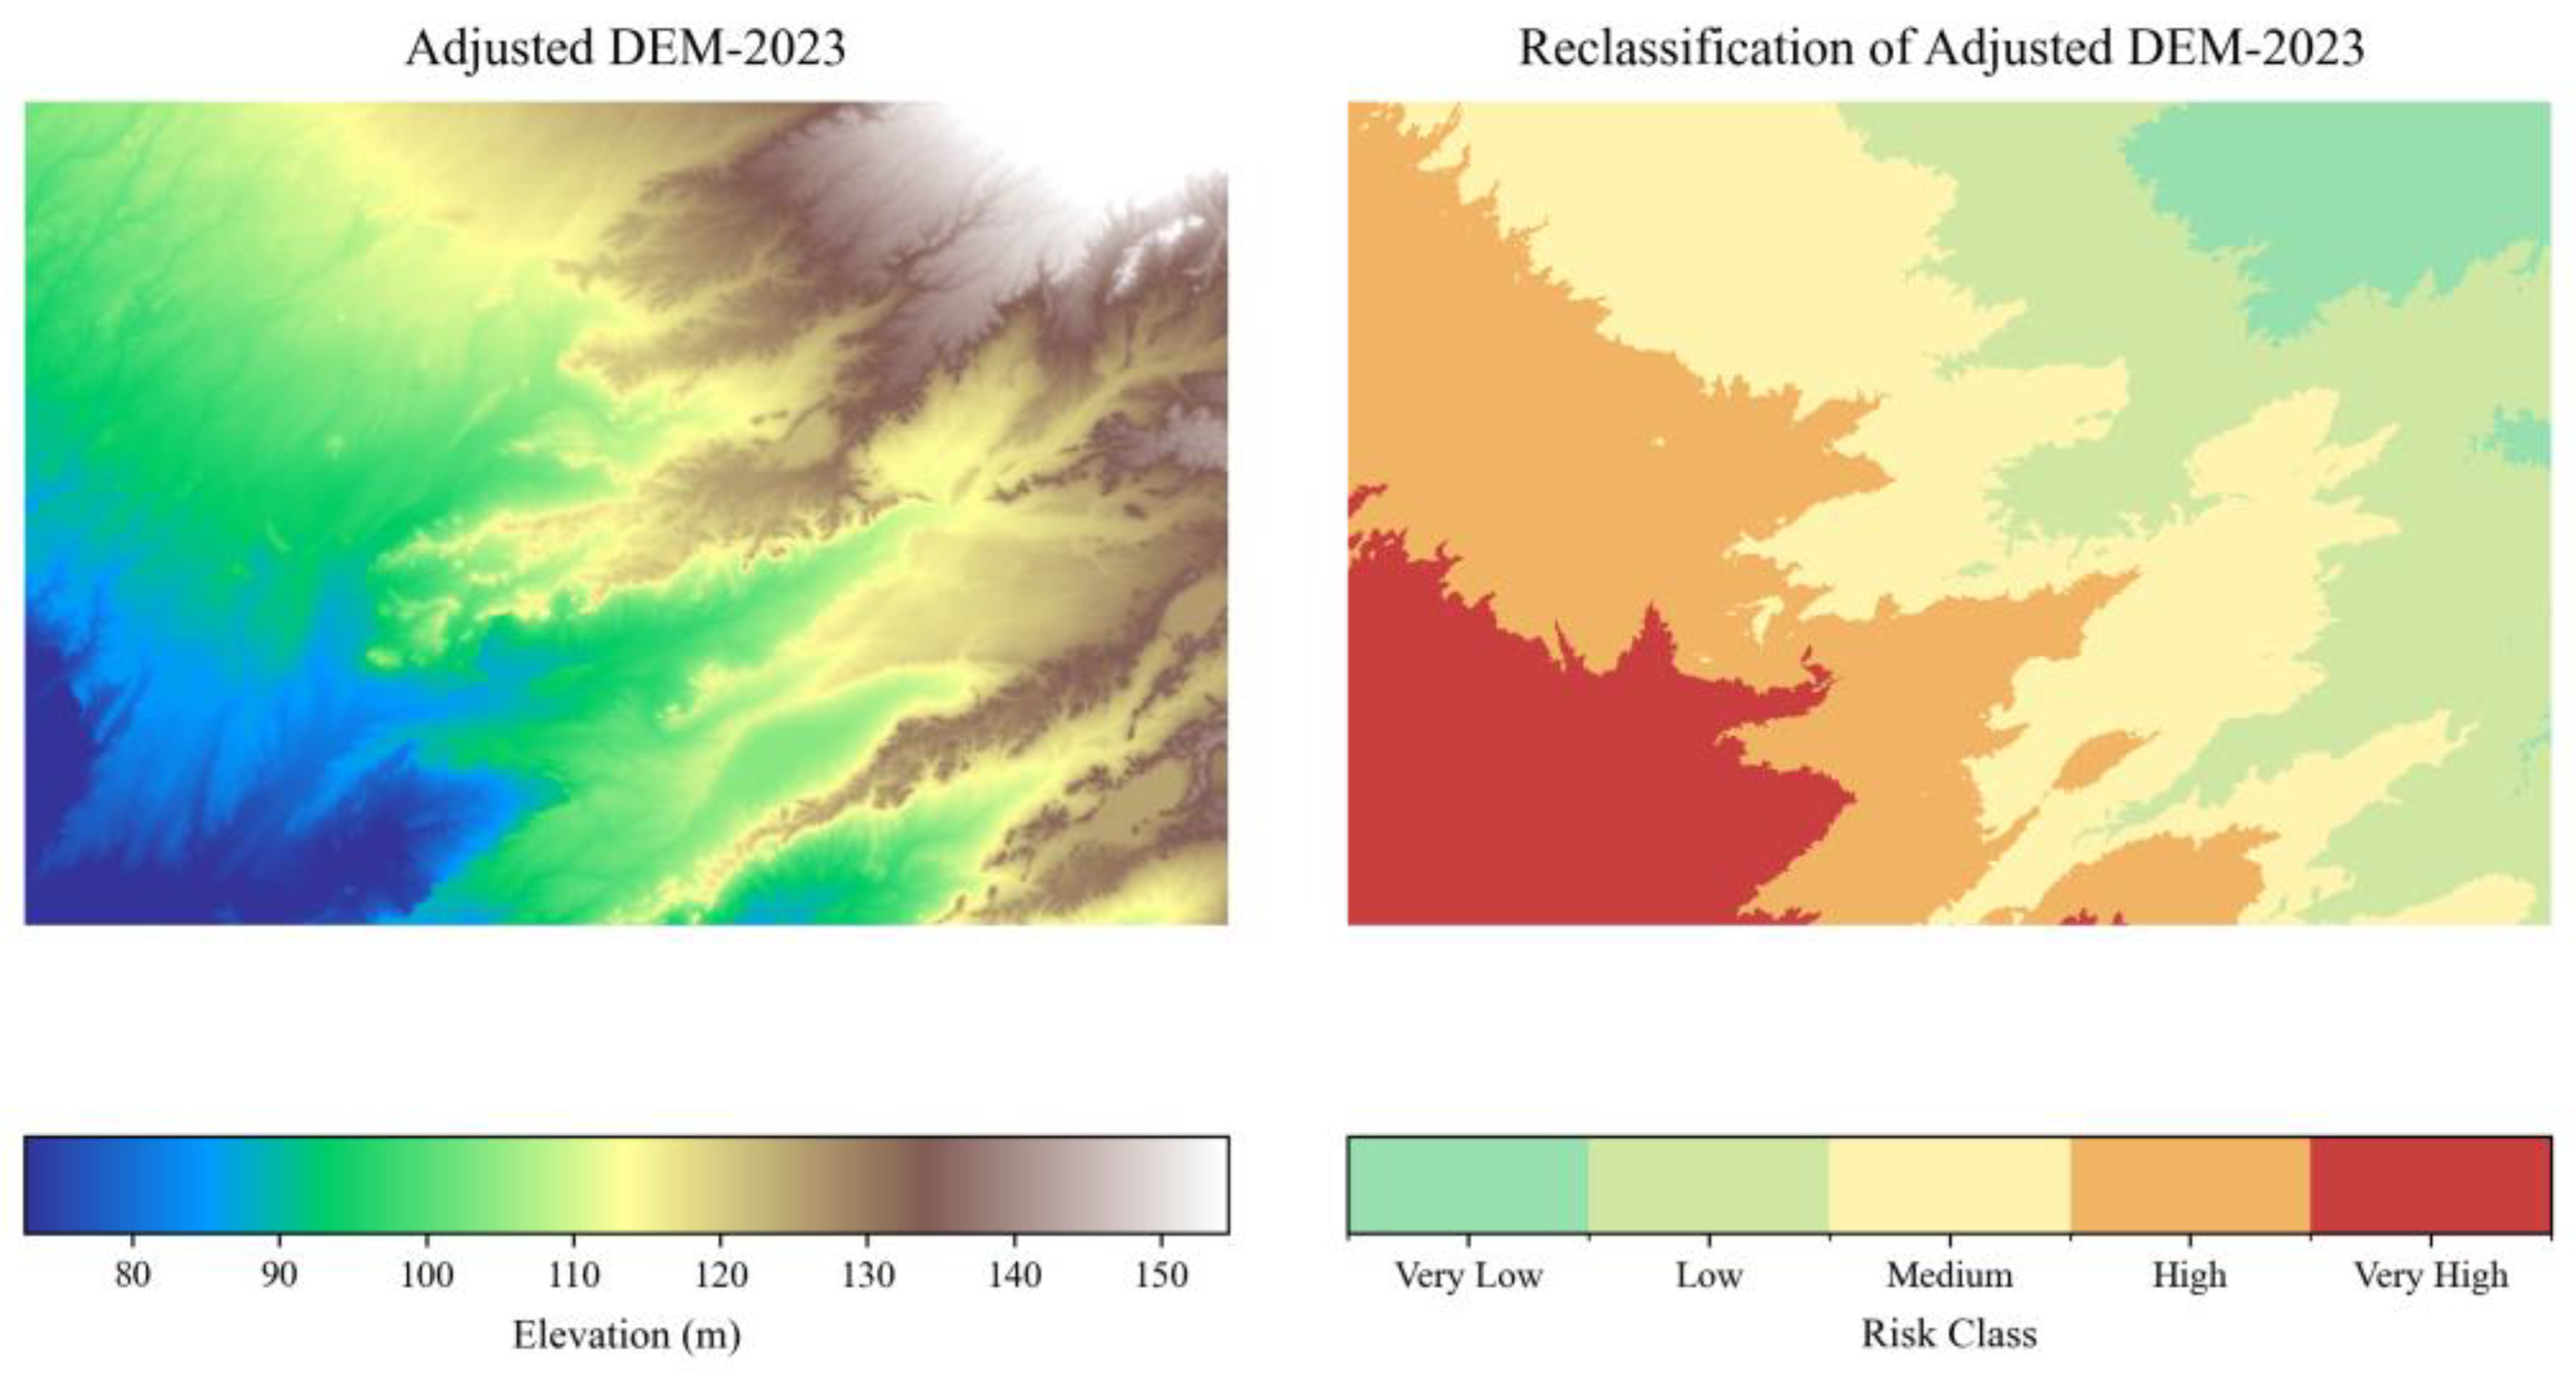
The adjusted DEM for 2023 shows terrain variation between ~80–150 m. Low-lying zones dominate the central basin. Reclassification highlighted these flat and low-elevation areas as high to very high flood susceptibility zones, while elevated ridges were classified as very low risk.
Figure 5.
Adjusted DEM (2023) and its reclassification into flood susceptibility classes.
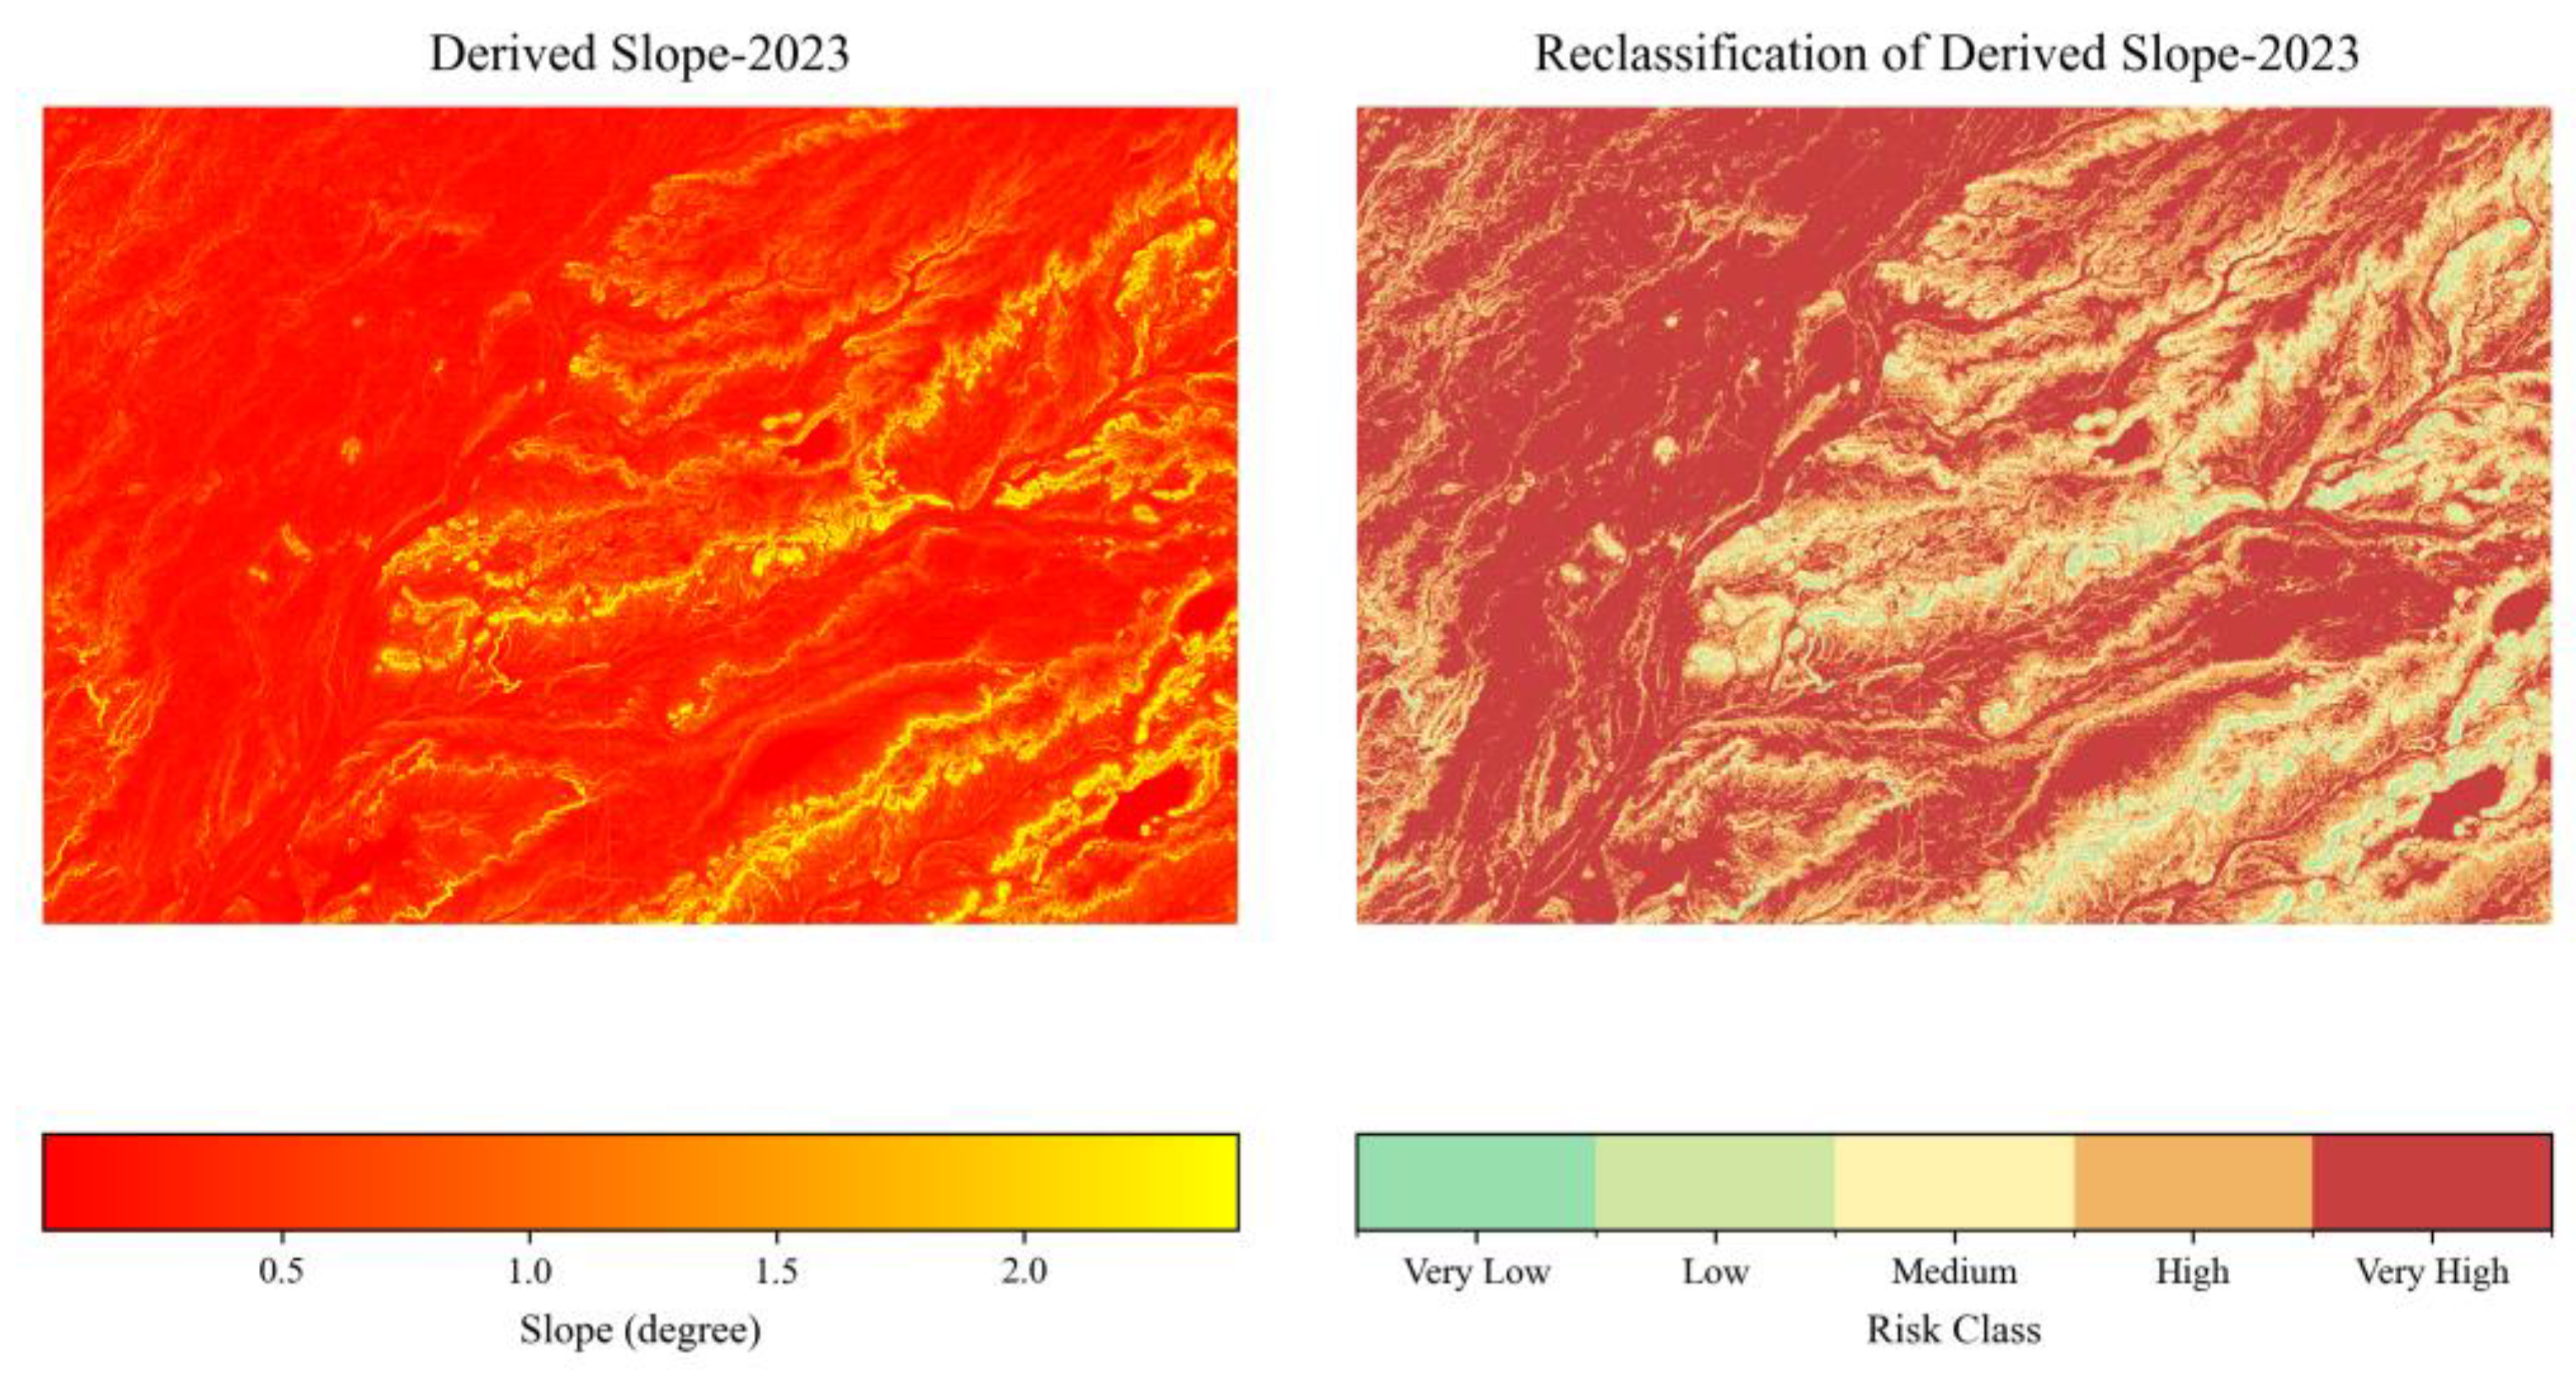
The derived slope map revealed generally low gradients across much of the Yibal field. Reclassification emphasized gentle slopes as high-susceptibility zones, while steep terrain, which facilitates rapid runoff, was classified as low to very low risk.
Figure 6.
Derived slope (2023) and its reclassification into flood susceptibility classes.
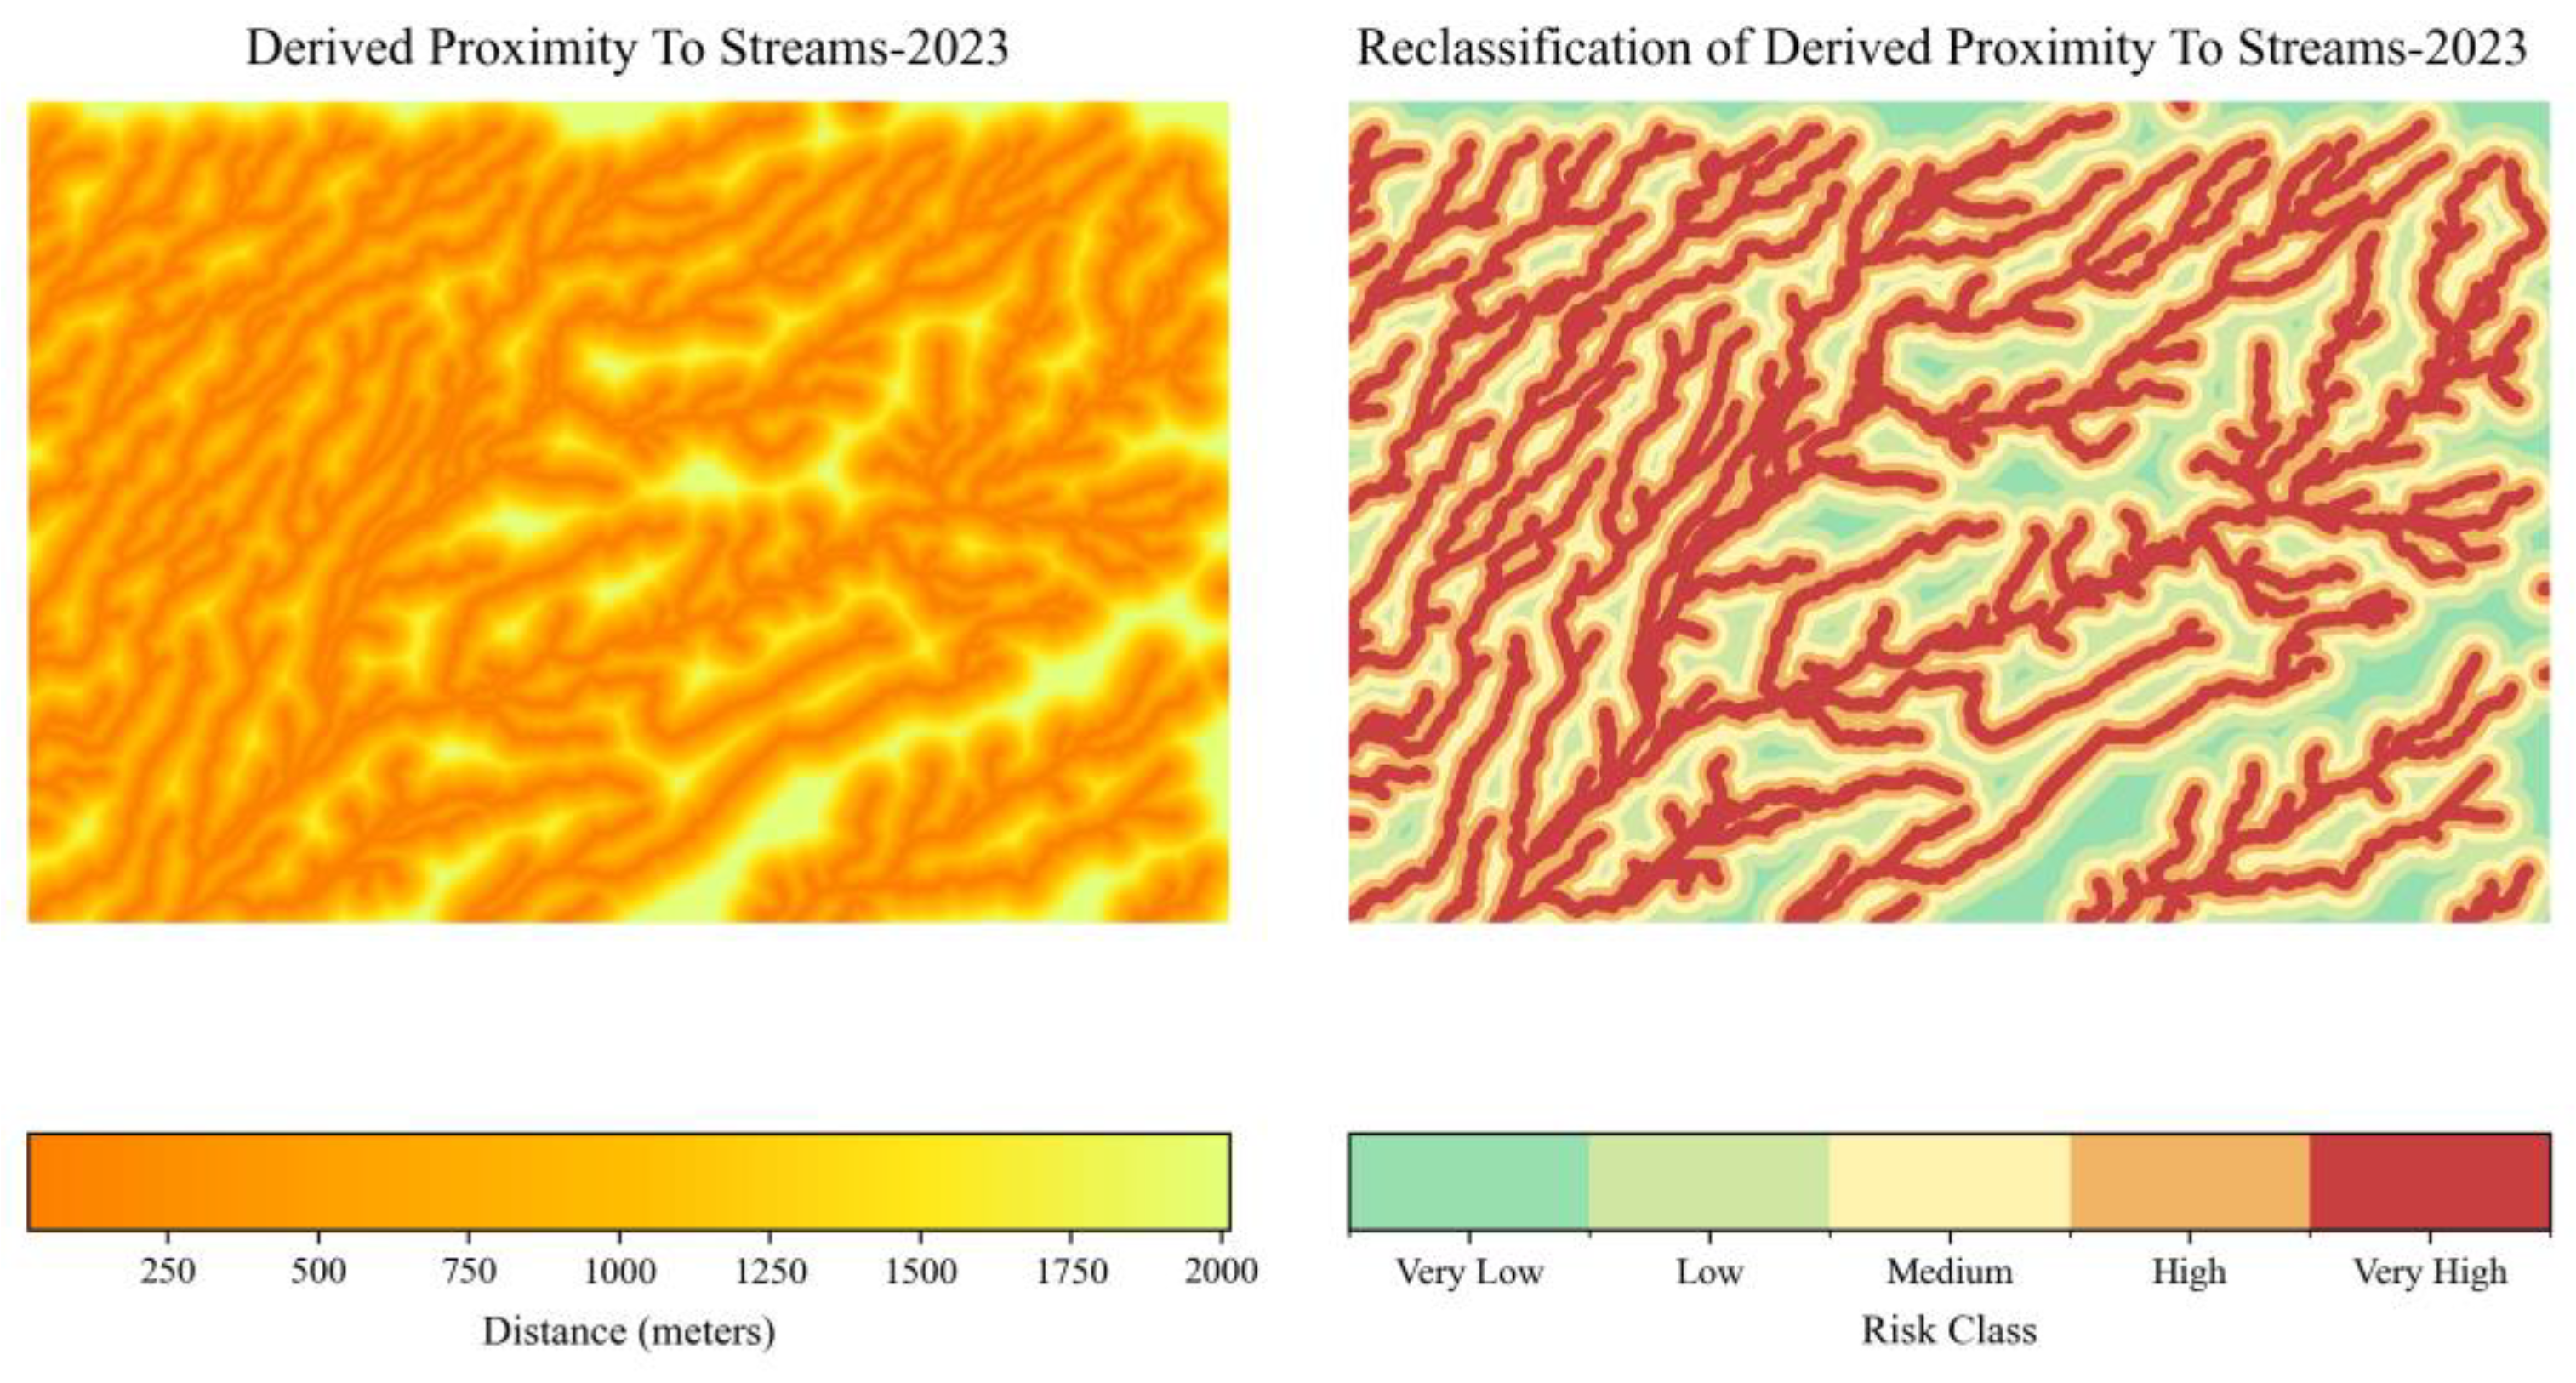
An Euclidean distance analysis revealed that a dense network of drainage characterizes the field. After reclassification, areas immediately adjacent to streams and channels were mapped as very high susceptibility, with risk declining gradually at greater distances.
Figure 7.
Proximity to streams (2023) and its reclassification into flood susceptibility classes.
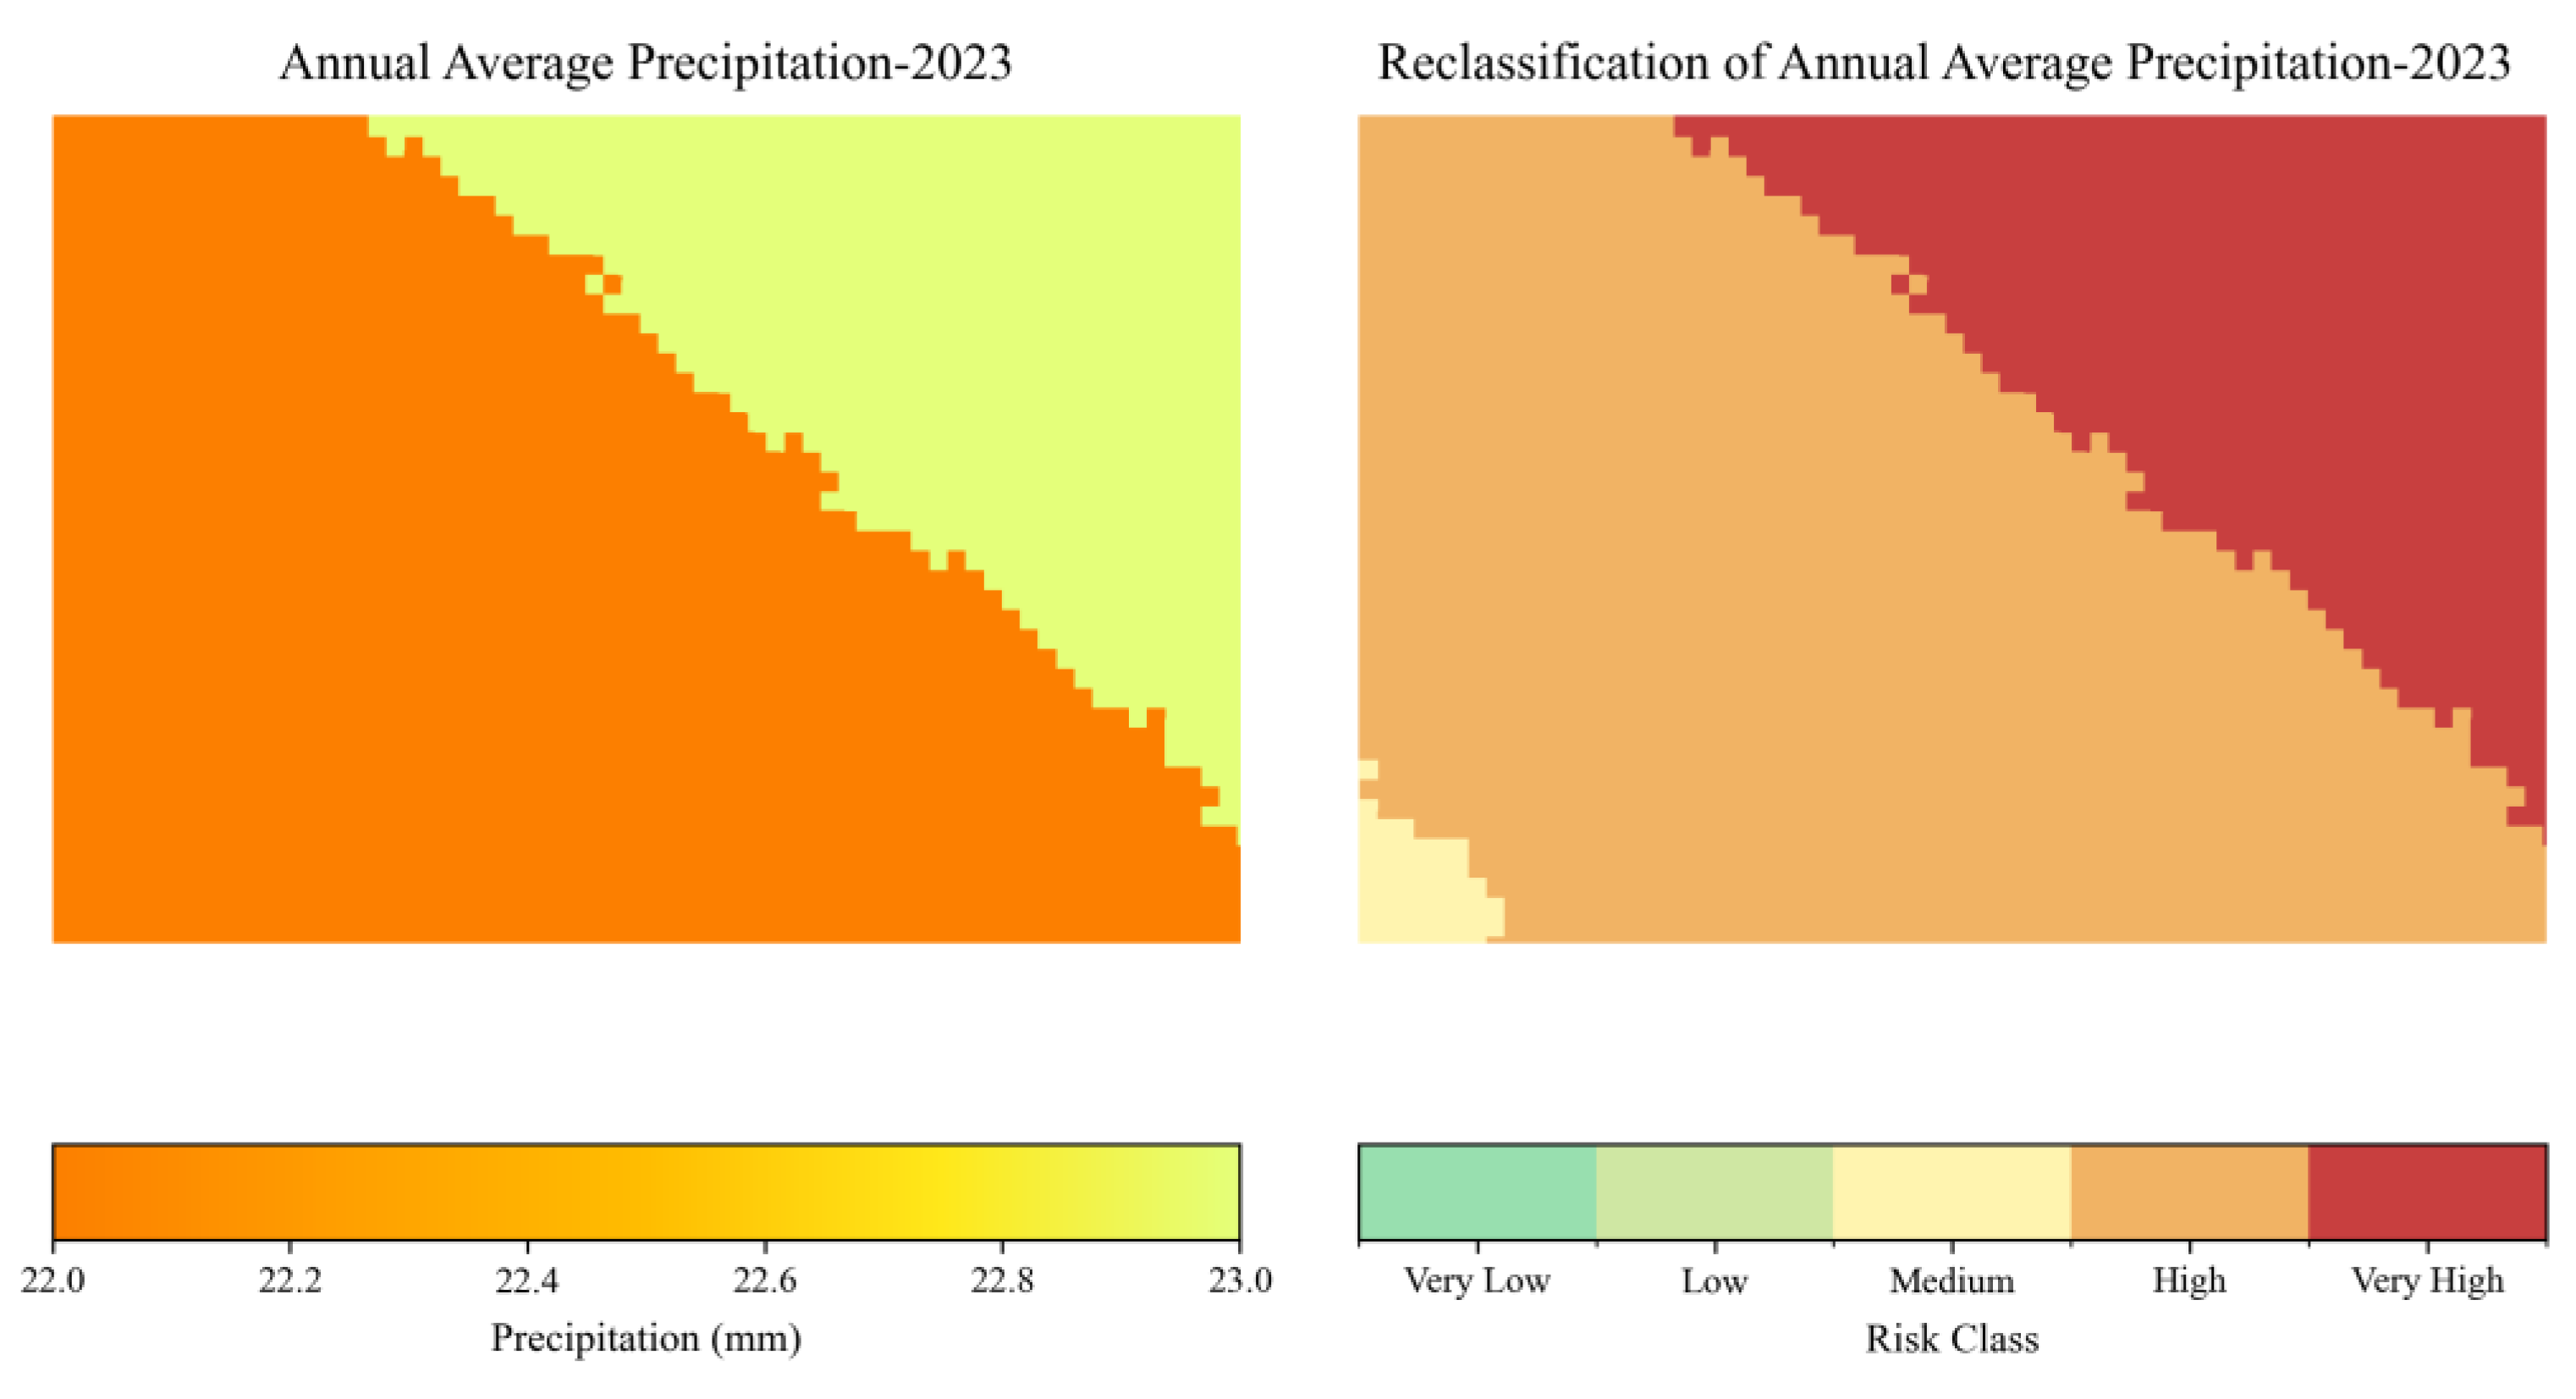
The Average annual precipitation in 2023 was low in absolute terms (~22–23 mm), but spatial variation was sufficient to differentiate flood susceptibility. Regions with slightly higher precipitation were assigned higher susceptibility, consistent with localized flash-flood risk patterns.
Figure 8.
Annual average precipitation (2023) and its reclassification into flood susceptibility classes.
Figure 8.
Annual average precipitation (2023) and its reclassification into flood susceptibility classes.
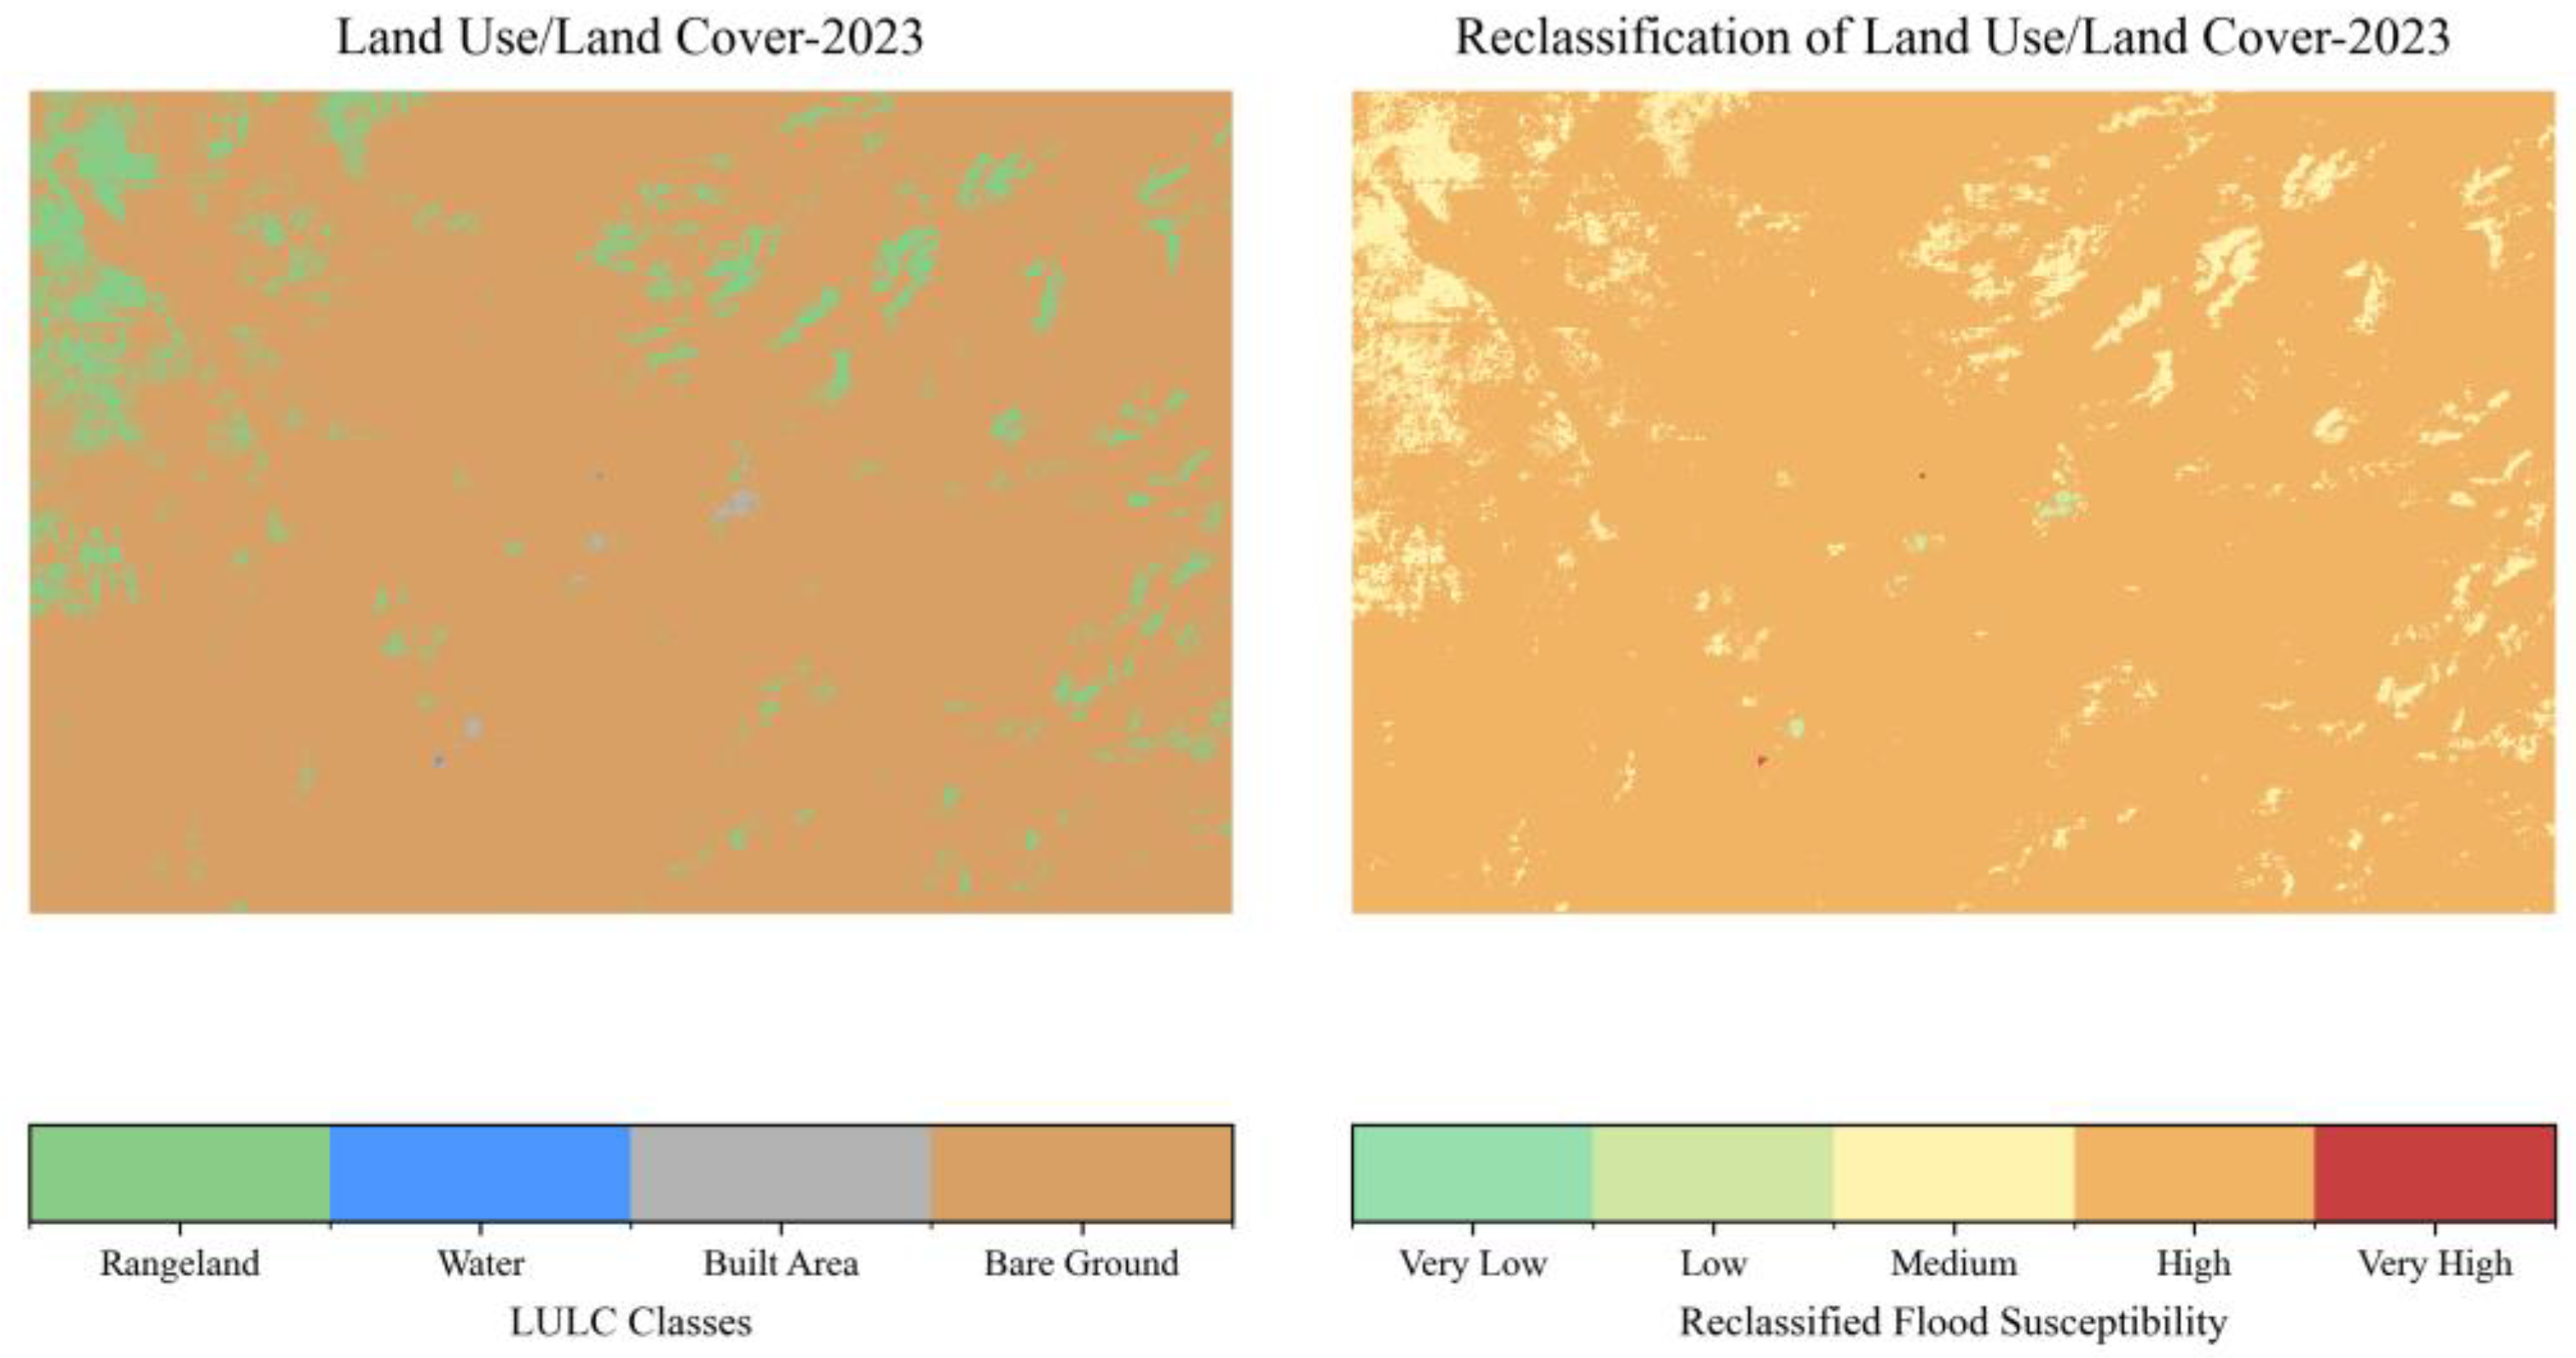
The original LULC map contained four main classes: rangeland, water, built-up areas, and bare soils. After reclassification, open water bodies were mapped as having very high susceptibility, wetlands/bare soils as having high susceptibility, vegetation/grassland as moderate susceptibility, and built-up areas as having low susceptibility due to engineered drainage capacity.
Figure 9.
Land use/land cover (2023) and its reclassification into flood susceptibility classes.
3.2. Weighted Flood Risk Map
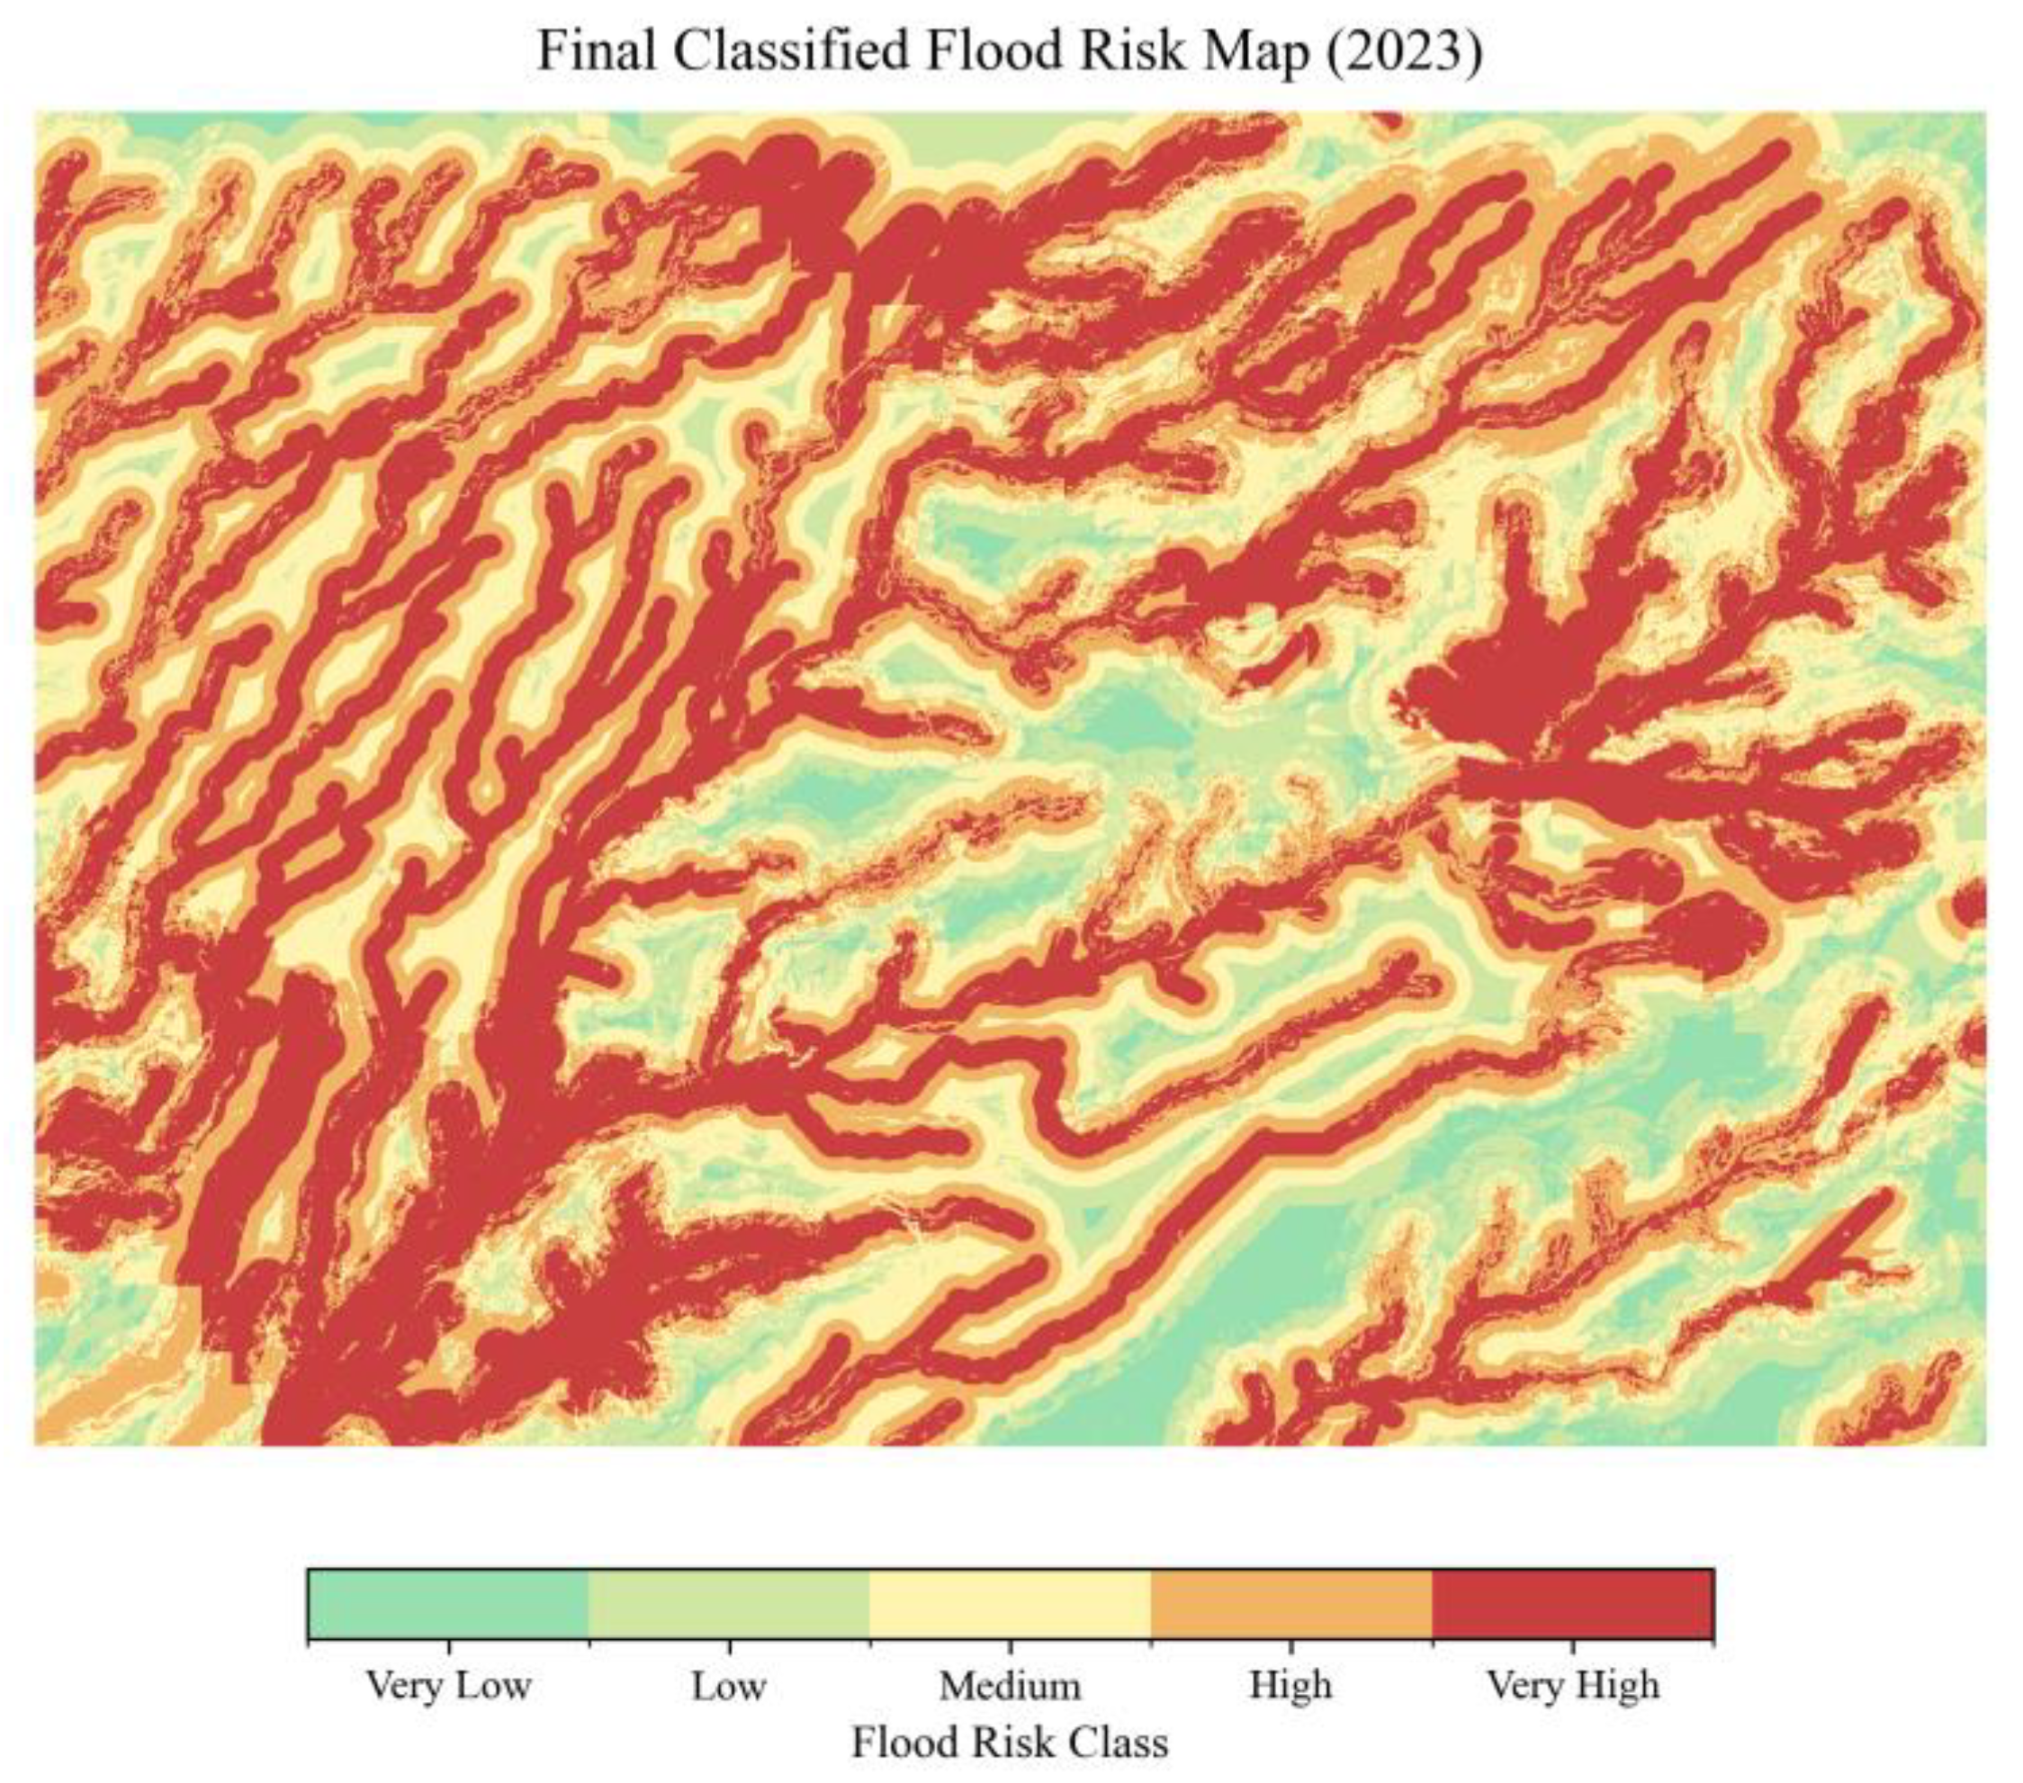
The weighted flood risk map shows clear patterns of vulnerability across the Yibal field. The highest risk areas are located along natural drainage paths, wadis, and the low-lying regions where subsidence and surface water converge. These places are closely linked to the stream network, highlighting how the shape of the land can exacerbate flood hazards. Medium-risk zones lie between the drainage areas and higher ground. In comparison, the safest zones are located on higher ground and in built-up areas, where natural drainage and infrastructure help mitigate risk.
Figure 10.
Final Weighted Risk Map 2023.
4. Discussion
The deformation-adjusted flood risk assessment for the Yibal field illustrates the combined impact of ground subsidence and surface hydrological processes in arid petroleum-producing environments. Conventional flood risk assessments typically rely on static digital elevation models (DEM), assuming terrain remains unchanged over time. Incorporating InSAR-derived subsidence into DEM updates yields a more accurate representation of flood-prone areas, with high- to very high-risk zones corresponding to subsidence bowls and drainage corridors [12]. This result advances recent hydrological research, underscoring the significance of dynamic terrain in risk analysis.
Deformation-adjusted flood hazard maps highlight areas susceptible to water accumulation due to subsidence and rainfall. Risk assessment builds on this by considering the exposure and sensitivity of field infrastructure. While hazard refers to the physical processes that create flooding potential, risk measures the severity and likelihood of impacts on petroleum assets. This distinction is crucial in oil and gas fields, where even moderate hazards can pose significant risks, as critical installations such as pipelines, well pads, and flowlines are often concentrated in deformation-prone zones.
The strong influence of precipitation (35 %) and proximity to streams (30%) in the weighted overlay highlights the dominant role of rainfall and drainage network configuration in shaping flood hazards in arid landscapes [39]. Slope, land use and land cover, and elevation also remain important modifiers of local susceptibility. Previous studies in the Sultanate of Oman and comparable arid environments have documented the role of ephemeral wadis and depressions in channeling floodwater [40]. The present findings extend this knowledge by demonstrating that subsidence deepens or redirects these pathways, thereby amplifying hazard levels.
The overlap between very high flood susceptibility zones and field infrastructure identifies areas of compounded vulnerability. This finding has direct implications for the safety of infrastructure and the long-term management of oil and gas fields. The methodology provides a transferable workflow suitable for application in other petroleum basins where ground deformation interacts with surface hydrology.
Several limitations persist. Precipitation data were derived from annual averages for 2023, which do not fully capture the variability of extreme rainfall events. Using a ground weather station will ensure the accuracy of precipitation information derived from the satellite and enhance the results. Land use and land cover classification relied on four generalized classes from Sentinel-2 imagery, potentially oversimplifying local infiltration characteristics [41]. Future research should incorporate high-resolution rainfall extremes, detailed soil properties, and dynamic hydrological models that simulate flood propagation under varying conditions. Integration with climate change scenarios could further enhance predictive capacity for future flood risks.
5. Conclusion
This study developed a new framework for mapping flood risk in the Yibal field in Oman, taking into account ground deformation. By using an InSAR-corrected DEM from 2013 to 2023 in a multi-criteria weighted overlay, the research produced a more accurate flood risk map that considers both hydrological factors and changes in terrain caused by subsidence. The findings indicate that areas with subsidence have experienced a notable increase in high and very high flood risk, underscoring the limitations of traditional DEM-based flood assessments.
This approach helps petroleum field operators by pinpointing key areas where drainage paths, subsidence zones, and field infrastructure come together. The method can also be applied in other oil and gas fields affected by surface deformation.
Author Contributions
Conceptualization, M.A.S.; methodology, M.A.S.; software, ArcGIS and Python; validation, M.A.S.; formal analysis, M.A.S.; investigation, M.A.S.; resources, Petroleum Development Oman (PDO); data curation, M.A.S.; writing—original draft preparation, M.A.S.; writing—review and editing, M.A.S., R.A, M.D, and A.T.; visualization, M.A.S.; supervision, R.A, M.E.D., A.A., and M.E.G.; project administration, A.T. All authors have read and agreed to the published version of the manuscript.
Funding
This research received no external funding. Sultan Qaboos University funded the APC.
Data Availability Statement
The cumulative surface deformation datasets (RADARSAT-2 and TerraSAR-X, 2013–2023) and the aerial photogrammetry DEM (2013) were provided by Petroleum Development Oman (PDO) under confidentiality agreements and cannot be shared publicly. Sentinel-2 LULC data are available from the European Space Agency (https://scihub.copernicus.eu). Precipitation data are available from WorldClim (https://www.worldclim.org).
Acknowledgment
The authors acknowledge Petroleum Development Oman (PDO) for providing access to surface deformation datasets and a high-resolution digital elevation model, which was obtained under a confidentiality agreement. They also acknowledge Sultan Qaboos University, College of Science, Earth Science Department, for its research support. The authors would also like to thank the Ministry of Energy and Minerals (MEM) for their approval to publish this article. During the preparation of this manuscript, the author used Generative AI for language editing, grammar correction, and checks. The author reviewed and edited the output and takes full responsibility for the content of this publication.
Conflict of Interest
No conflicts of interest are declared. The funding sources did not influence the study design, data collection, analysis, interpretation, manuscript preparation, or the decision to publish the findings.
Abbreviations
The following abbreviations are used in this manuscript:
| PDO | Petroleum Development Oman |
| NSA | National Survey Authority |
| DEM | Digital Elevation Model |
| PS-InSAR | Persistent Scatter – Interferometric Synthetic Aperture Radar |
| LULC | Land Use Land Cover |
| SQU | Sultan Qaboos University |
| MEM | Ministry of Energy and Minerals |
References
- Kumpulainen, S., Vulnerability concepts in hazard and risk assessment. Special paper-geological survey of Finland, 2006. 42: p. 65.
- Zimmermann, K., et al., Subsidence modeling for fluid reservoirs aids hazard mitigation Subsidence prediction in fluid reservoirs is more difficult than in coal, salt, or ore deposits. Reservoir geometry, physical-mechanical rock mass parameters, and pressure distribution have more uncertainty in oil and gas reservoirs, resulting in a predicted subsidence range rather than a precise subsidence map.
- Raia, S., et al., Improving predictive power of physically based rainfall-induced shallow landslide models: a probabilistic approach. Geoscientific Model Development, 2014. 7(2): p. 495-514.
- Toyoda, M., et al., Flood Impact and Evacuation Behavior in Toyohashi City, Japan: A Case Study of the 2 June 2023 Heavy Rain Event. Sustainability, 2025. 17(15): p. 6999.
- Żyluk, A., et al., Implementation of the mean time to failure indicator in the control of the logistical support of the operation process. Applied Sciences, 2023. 13(7): p. 4608.
- Ertekin, T., Subsidence as a result of petroleum production. Earth Miner. Sci.; (United States), 1978. 47:8(None; Journal ID: ISSN EMISA).
- Anees, M.T., et al., Prioritization of flood vulnerability zones using remote sensing and GIS for hydrological modelling. Irrigation and Drainage, 2019. 68(2): p. 176-190.
- Cong, S., et al., EOR mechanism of fracture oil displacement agent for ultra-low permeability reservoir. Energy Reports, 2023. 9: p. 4893-4904.
- Li, J. and S.J. Burian, Effects of Nonstationarity in Urban Land Cover and Rainfall on Historical Flooding Intensity in a Semiarid Catchment. Journal of Sustainable Water in the Built Environment, 2022. 8(2): p. 04022002.
- Andaryani, S., et al., Assessment of land use and climate change effects on land subsidence using a hydrological model and radar technique. Journal of Hydrology, 2019. 578: p. 124070.
- Li, J. and J. Burian Steven, Effects of Nonstationarity in Urban Land Cover and Rainfall on Historical Flooding Intensity in a Semiarid Catchment. Journal of Sustainable Water in the Built Environment, 2022. 8(2): p. 04022002.
- Navarro-Hernández, M.I., et al., Analysing the Impact of Land Subsidence on the Flooding Risk: Evaluation Through InSAR and Modelling. Water Resources Management, 2023. 37(11): p. 4363-4383.
- Ohenhen, L.O., M. Shirzaei, and P.L. Barnard, Slowly but surely: Exposure of communities and infrastructure to subsidence on the US east coast. PNAS Nexus, 2024. 3(1).
- Koutsoyiannis, D., D. Kozonis, and A. Manetas, A mathematical framework for studying rainfall intensity-duration-frequency relationships. Journal of hydrology, 1998. 206(1-2): p. 118-135.
- Kourtis, I.M. and V.A. Tsihrintzis, Update of intensity-duration-frequency (IDF) curves under climate change: a review. Water Supply, 2022. 22(5): p. 4951-4974.
- Sahu, M.K., H.R. Shwetha, and G.S. Dwarakish, State-of-the-art hydrological models and application of the HEC-HMS model: a review. Modeling Earth Systems and Environment, 2023. 9(3): p. 3029-3051.
- Janjić, J. and L. Tadić, Fields of application of SWAT hydrological model—a review. Earth, 2023. 4(2): p. 331-344.
- Chentouf, S., et al., GIS-based multi-criteria evaluation (MCE) methods for aquaculture site selection: A systematic review and meta-analysis. ISPRS International Journal of Geo-Information, 2023. 12(10): p. 439.
- Che, Y., et al., Data efficient health prognostic for batteries based on sequential information-driven probabilistic neural network. Applied Energy, 2022. 323: p. 119663.
- Ou, Z., et al., DRUM: Diffusion-based runoff model for probabilistic flood forecasting. arXiv preprint arXiv:2412.11942, 2024.
- de Moraes Cordeiro, A.L. and C.J.C. Blanco, Assessment of satellite products for filling rainfall data gaps in the Amazon region. Natural Resource Modeling, 2021. 34(2): p. e12298.
- Lu, Z., et al., Monitoring and characterizing natural hazards with satellite InSAR imagery. Annals of GIS, 2010. 16(1): p. 55-66.
- Zhou, Q., et al., A GIS-based hydrological modeling approach for rapid urban flood hazard assessment. Water, 2021. 13(11): p. 1483.
- McClean, F., R. Dawson, and C. Kilsby, Implications of Using Global Digital Elevation Models for Flood Risk Analysis in Cities. Water Resources Research, 2020. 56(10): p. e2020WR028241.
- Aristizabal, F., et al., Effects of high-quality elevation data and explanatory variables on the accuracy of flood inundation mapping via Height Above Nearest Drainage. Hydrol. Earth Syst. Sci., 2024. 28(6): p. 1287-1315.
- Litsey, L.R., et al., Shuaiba Reservoir Geological Study, Yibal Field, Oman. Journal of Petroleum Technology, 1986. 38(06): p. 651-661.
- Rahmoune, R., et al., Multitemporal SAR interferometry for monitoring of ground deformations caused by hydrocarbon production in an arid environment: Case studies from the Sultanate of Oman. Leading Edge, 2021. 40: p. 45-51.
- Candela, T. and K. Koster, The many faces of anthropogenic subsidence. Science, 2022. 376(6600): p. 1381-1382.
- Kaya, C.M. and L. Derin, Parameters and methods used in flood susceptibility mapping: a review. Journal of Water and Climate Change, 2023. 14(6): p. 1935-1960.
- Saber, M., et al., Enhancing flood risk assessment through integration of ensemble learning approaches and physical-based hydrological modeling. Geomatics, Natural Hazards and Risk, 2023. 14(1): p. 2203798.
- Litsey, L.R., et al., Shuaiba reservoir geological study, Yibal field, Oman. Journal of petroleum technology, 1986. 38(06): p. 651-661.
- Dudley, J.W., A. van der Linden, and G.F. Mueller. Geomechanical Modelling of a Pore Collapsing Carbonate: Compaction and Subsidence of a Field in Oman. in International Petroleum Technology Conference. 2005.
- Grohmann, C.H., Evaluation of TanDEM-X DEMs on selected Brazilian sites: Comparison with SRTM, ASTER GDEM and ALOS AW3D30. Remote Sensing of Environment, 2018. 212: p. 121-133.
- Habibie, M.I., et al., Integrating Sentinel-2 and ESA World Cover for Effective Land Use and Land Cover Assessment Using Machine Learning. Advances in Space Research, 2025.
- Shi, X., et al., Expressway deformation mapping using high-resolution TerraSAR-X images. Remote Sensing Letters, 2014. 5(2): p. 194-203.
- Chaaban, F., J. El Khattabi, and H. Darwishe, Accuracy assessment of ESA WorldCover 2020 and ESRI 2020 land cover maps for a Region in Syria. Journal of Geovisualization and Spatial Analysis, 2022. 6(2): p. 31.
- He, K., et al., SMPD: a soil moisture-based precipitation downscaling method for high-resolution daily satellite precipitation estimation. Hydrol. Earth Syst. Sci., 2023. 27(1): p. 169-190.
- Matanó, A., et al., Drought decreases annual streamflow response to precipitation, especially in arid regions. Hydrol. Earth Syst. Sci., 2025. 29(13): p. 2749-2764.
- Alharbi, T., A Weighted Overlay Analysis for Assessing Urban Flood Risks in Arid Lands: A Case Study of Riyadh, Saudi Arabia. Water, 2024. 16(3): p. 397.
- Al-Shukaili, A., et al., Salinity Variations along the Beds of Ephemeral Streams Caused by Perched Wadi Aquifers in Arid Regions, in AGU Fall Meeting Abstracts. 2020. p. H090-0007.
- Shadmehri Toosi, A., et al., Land use-land cover and hydrological modeling: A review. Wiley Interdisciplinary Reviews: Water, 2025. 12(2): p. e70013.
Disclaimer/Publisher’s Note: The statements, opinions and data contained in all publications are solely those of the individual author(s) and contributor(s) and not of MDPI and/or the editor(s). MDPI and/or the editor(s) disclaim responsibility for any injury to people or property resulting from any ideas, methods, instructions or products referred to in the content. |
© 2025 by the authors. Licensee MDPI, Basel, Switzerland. This article is an open access article distributed under the terms and conditions of the Creative Commons Attribution (CC BY) license (http://creativecommons.org/licenses/by/4.0/).
Copyright: This open access article is published under a Creative Commons CC BY 4.0 license, which permit the free download, distribution, and reuse, provided that the author and preprint are cited in any reuse.


