Submitted:
05 October 2025
Posted:
06 November 2025
You are already at the latest version
Abstract
Underwater Wireless Sensor Networks (UWSNs) are fac- ing the critical challenges in energy efficiency because of limited battery capacity and the difficulty of node replacement in aquatic environments. This paper is proposing DTEAR (Digital Twin-Enhanced Adaptive Routing), which is a novel energy-efficient routing protocol that leverages digital twin technology for real-time network state optimization. Our protocol is integrating virtual network modeling with adaptive depth-based routing to minimize energy consumption while it is maintaining high packet delivery ratios. Through comprehensive simulations using the adapted C-Town network benchmark with 399 nodes, DTEAR is demonstrating 27.3% improvement in network lifetime, 18.5% reduction in energy consumption per packet, and 95.2% packet delivery ratio when compared to state-of-the-art protocols. The digital twin synchronization mechanism is ensuring routing decisions are based on accurate network states, and it is achieving convergence in 38 seconds on average. Results are validating the effectiveness of combining digital twin technology with underwater acoustic communication for enhanced network performance. This work is contributing to recent advances in digital transformation for distributed systems and energy-efficient underwater communication protocols.
Keywords:
underwater wireless sensor networks
; digital twin
; energy efficiency
; adaptive routing
; acoustic communication
; network optimization
1. Introduction
Oceans are covering approximately 71% of Earth’s surface, yet they are remaining largely unexplored because of the challenges of underwater observation and communication. Underwater Wireless Sensor Networks (UWSNs) have been emerged as a critical technology for marine environmental monitoring, disaster prevention, offshore oil exploration, and military surveillance applications. Unlike terrestrial wireless networks that are relying on radio frequency (RF) communication, UWSNs are primarily utilizing acoustic waves for data transmission due to the severe attenuation of electromagnetic signals in water environment.
The importance of underwater networks is growing rapidly in recent years. According to marine research statistics, more than 95% of ocean floor remains unmapped and unexplored. This is creating significant opportunities for UWSN deployment in various application domains including tsunami early warning systems, underwater habitat monitoring, submarine volcanic activity detection, and oil pipeline monitoring systems.
1.1. Motivation and Challenges
The deployment of UWSNs is facing several fundamental challenges that are distinguishing them from traditional wireless sensor networks. These challenges are requiring novel approaches and protocols specifically designed for underwater environments.
Energy Constraints: Underwater sensor nodes are operating on battery power, and battery replacement or recharging in deep-sea environments is extremely difficult or sometimes it is impossible. When we are comparing with terrestrial networks, acoustic communication is consuming significantly more energy than RF communication. For example, transmitting one bit of data over 100 meters in underwater can consume up to 100 times more energy compared to terrestrial RF transmission over same distance. This is making energy efficiency paramount for underwater networks. The nodes must operate for extended periods (months or even years) without battery replacement, which is requiring very careful energy management strategies.
Limited Bandwidth: Acoustic channels are providing only 10-100 kHz bandwidth, which is resulting in low data rates (typically less than 100 kbps) when compared to terrestrial networks that can achieve gigabits per second. This limited bandwidth is constraining the amount of data that can be transmitted and it is requiring efficient data aggregation and compression techniques. Moreover, the available bandwidth is decreasing with increasing transmission distance due to frequency-dependent absorption in water.
High Propagation Delay: Sound is traveling at approximately 1500 m/s in water (compared to light speed in air which is 3×10⁸ m/s), which is causing propagation delays that are five orders of magnitude higher than RF signals. For example, transmitting data over 1500 meters underwater takes approximately 1 second, while same distance in terrestrial network takes only 5 microseconds. This high delay is affecting protocol design significantly, particularly for protocols that are requiring acknowledgments or feedback mechanisms.
Dynamic Topology: Water currents are causing node mobility, and the harsh underwater environment is leading to frequent topology changes and link failures. Sensor nodes can drift several meters per hour due to ocean currents, which is making the network topology highly dynamic. Additionally, marine life, underwater vehicles, and temperature variations are creating unpredictable channel conditions that are affecting communication reliability.
3D Deployment: Unlike terrestrial networks that are typically 2D, underwater networks must consider 3-dimensional spatial deployment. This is complicating routing protocol design because nodes can be deployed at different depths, and the vertical dimension must be considered in addition to horizontal coordinates. The depth information is becoming crucial for routing decisions because nodes closer to surface can more easily communicate with surface stations and gateway buoys.
Traditional routing protocols that are designed for terrestrial networks are failing to address these unique characteristics effectively. Recent work has been explored digital twin technology for water distribution systems, demonstrating up to 30% operational efficiency improvements [1]. Digital twins are providing real-time virtual representation of physical systems, enabling predictive maintenance, optimization, and intelligent decision making. However, the application of digital twins to underwater sensor networks is remaining largely unexplored until now.
1.2. Digital Twin Technology Background
Digital twin is a concept that has been gained significant attention in various domains including manufacturing, healthcare, smart cities, and infrastructure management. A digital twin is virtual replica of physical system that is mirroring its behavior in real-time using sensor data and computational models. The concept was first introduced by NASA for spacecraft health monitoring, and it has been evolved significantly since then.
In the context of water distribution systems, Homaei et al. [1] have demonstrated that digital transformation based on digital twins concept can significantly improve operational efficiency, enable predictive maintenance, and optimize resource allocation. Their work is showing that digital twins can reduce water loss by 20-25% and improve system reliability by providing early warning of potential failures.
However, applying digital twin technology to underwater sensor networks is presenting unique challenges. The limited bandwidth, high propagation delay, and energy constraints are making it difficult to maintain real-time synchronization between physical network and its digital replica. Our work is addressing these challenges by developing lightweight synchronization mechanisms and adaptive update strategies specifically designed for underwater acoustic communication.
1.3. Energy Efficiency in Underwater IoT
Energy efficiency is critical challenge in underwater Internet of Things (IoT) systems. Tarif and Moghadam [9] have provided comprehensive review of energy efficient routing protocols in underwater IoT, identifying key challenges and solution approaches. Their review is highlighting that most existing protocols are focusing on either depth-based routing or cluster-based approaches, but they are lacking integration with real-time network state management systems.
The energy consumption in underwater nodes is dominated by three main components: sensing (10-15%), data processing (5-10%), and communication (75-85%). Communication is clearly the most energy-intensive operation, which is making routing protocol design crucial for network lifetime. An efficient routing protocol can extend network lifetime by 30-50% compared to naive flooding approaches.
1.4. Contributions
This paper is making the following key contributions to underwater wireless sensor networks research:
- We are proposing DTEAR, which is a novel adaptive routing protocol that is integrating digital twin technology with depth-based routing strategies specifically designed for underwater acoustic networks. To the best of our knowledge, this is the first work that is combining digital twins with underwater routing protocols.
- We are developing a lightweight digital twin synchronization mechanism that is maintaining network state accuracy with minimal overhead (less than 3% of total communication). Our synchronization mechanism is using event-triggered updates instead of periodic updates to reduce communication costs.
- We are designing an adaptive forwarding strategy that is dynamically selecting next-hop nodes based on multiple criteria including residual energy, depth difference, and link quality metrics that are obtained from the digital twin. The forwarding strategy is using weighted combination of these metrics to make optimal routing decisions.
- We are conducting extensive simulations using the adapted C-Town benchmark network, which is demonstrating significant improvements over five state-of-the-art protocols across multiple performance metrics. Our evaluation is covering various scenarios including static networks, low mobility, and high mobility conditions.
- We are providing detailed analysis of energy consumption patterns, routing overhead, and scalability characteristics under various network densities (100, 200, 300, and 399 nodes) and mobility scenarios (velocities up to 2 m/s).
- We are analyzing the trade-offs between digital twin synchronization overhead and the benefits of accurate network state knowledge, demonstrating that the performance gains are significantly outweighing the synchronization costs.
The remainder of this paper is organized as follows: Section 2 is reviewing related work in underwater routing protocols and digital twin technology. Section 3 is presenting the DTEAR protocol design including system model, digital twin architecture, and forwarding algorithm. Section 4 is describing the experimental methodology including simulation setup and performance metrics. Section 5 is presenting comprehensive results and analysis. Finally, Section 6 is concluding the paper with discussion of limitations and future research directions.
2. Related Works
This section is reviewing the relevant literature in three main areas: energy-efficient routing protocols for underwater wireless sensor networks, digital twin technology and its applications, and the research gap that our work is addressing.
2.1. Energy-Efficient Routing in UWSNs
Energy efficiency in underwater sensor networks has been extensively studied by researchers in recent years. Various routing protocols have been proposed to address the unique challenges of underwater environment.
Depth-Based Routing (DBR): DBR [2] is one of the pioneering works in underwater routing. It is exploiting the depth information of nodes to forward packets toward the surface sink, which is reducing the need for location information. In DBR, when a node is receiving a packet, it is forwarding the packet only if its depth is less than the depth of previous forwarder. This simple strategy is avoiding routing loops and ensuring progress toward surface. However, DBR is suffering from several problems. First, it is creating high redundancy because multiple nodes at similar depths can forward same packet, leading to unnecessary transmissions and energy waste. Second, DBR is not considering energy states of nodes, which is causing some nodes to deplete their energy quickly while other nodes are remaining underutilized.
Energy-Efficient DBR (EEDBR): EEDBR [3] is improving upon DBR by considering residual energy in forwarding decisions. Nodes with higher residual energy are preferred as relay nodes, which is extending network lifetime. The protocol is defining holding time for each node based on its residual energy and depth difference. Nodes with higher energy and larger depth progress are having shorter holding times, which is making them forward packets first. Despite improvements over DBR, EEDBR is still experiencing hotspot problems near sink nodes because these nodes are always participating in forwarding regardless of their energy levels. Our experiments are showing that EEDBR can extend network lifetime by 15-20% compared to DBR, but it is still not optimal.
Focused Beam Routing (FBR): FBR [4] is directing transmission beams toward destination regions, which is reducing energy waste from omnidirectional broadcasting. The protocol is using directional antennas to focus acoustic signals in specific directions, which is improving energy efficiency and reducing interference. However, FBR is requiring precise location information and beam steering capabilities, which is increasing hardware complexity and cost. Furthermore, directional communication is more sensitive to node mobility and orientation changes. In practice, implementing true directional acoustic communication underwater is challenging because of multipath propagation and reflection from surface and seabed.
Hydrocast: Hydrocast [5] is addressing the void problem in sparse networks by using trajectory-based forwarding. The protocol is utilizing pressure sensors (which are simpler and cheaper than localization systems) to determine depth information. When a node is encountering void region where no neighbors are closer to destination, Hydrocast is using recovery mode to route around the void. While effective for avoiding void regions, Hydrocast is not optimizing energy consumption across the network and it is not considering real-time network conditions.
GEDAR: GEDAR [6] is combining geographic information with opportunistic routing and depth adjustment. The protocol is using greedy forwarding when possible, but it is adjusting depth when greedy forwarding fails. GEDAR is considering both energy and depth in forwarding decisions, which is making it more balanced than previous approaches. However, GEDAR is still making routing decisions based on local information only, without global view of network state.
Recent machine learning approaches, such as Q-learning based routing, are showing promise but they are requiring extensive training data and computational resources that may not be available in energy-constrained underwater nodes. Deep reinforcement learning methods are needing powerful processors and large memory, which are contradicting with the low-power design of underwater sensor nodes.
The common limitation of all these protocols is that they are making routing decisions based on local or outdated information without considering real-time global network state. This is motivating our approach of using digital twin to maintain accurate network state and make informed routing decisions.
2.2. Digital Twin Technology
Digital twins have been gained significant attention in industrial IoT, smart infrastructure, and cyber-physical systems. The concept is involving creating a virtual replica of a physical system that is mirroring its behavior in real-time.
Digital Twins in Water Infrastructure: For water distribution systems, digital twins are enabling predictive maintenance, leak detection, and operational optimization. Homaei et al. [1] have presented comprehensive study on digital transformation in water distribution systems based on digital twins concept. Their work is demonstrating that digital twins can significantly improve system performance by providing real-time monitoring, predictive analytics, and optimization capabilities. The C-Town network, which is a benchmark water distribution system with 399 nodes and 429 pipes, has been widely used for testing digital twin applications. Studies are reporting 25-30% reduction in maintenance costs, 15-20% improvement in system efficiency, and early detection of 85-90% of potential failures before they are becoming critical.
The digital twin for water networks is typically consisting of hydraulic models, real-time sensor data integration, and optimization algorithms. EPANET and WNTR (Water Network Tool for Resilience) are commonly used simulation tools for building digital twins of water distribution networks. These tools are providing hydraulic analysis, water quality simulation, and what-if scenario analysis capabilities.
Digital Twins in Wireless Networks: In wireless networks, digital twins have been explored for 5G network optimization, IoT device management, and network planning. Digital twins are helping network operators to predict network behavior, optimize resource allocation, and plan capacity expansion. For example, telecom operators are using digital twins to simulate impact of new base station deployments before actual installation, which is saving significant costs and time.
However, these applications are focusing on terrestrial RF networks with abundant energy, high bandwidth, and low latency. The characteristics of underwater acoustic networks are fundamentally different, which is requiring new approaches for digital twin implementation.
Challenges in Underwater Digital Twins: Applying digital twin technology to underwater sensor networks is presenting several unique challenges:
- Limited bandwidth: Underwater acoustic channels are providing only 10-100 kHz bandwidth, which is severely constraining the amount of state information that can be transmitted to digital twin.
- High energy cost: Every bit transmitted is consuming precious battery energy, so synchronization mechanism must be extremely efficient.
- High latency: Propagation delays of 1-2 seconds over kilometer distances are making real-time synchronization challenging.
- Dynamic topology: Node mobility due to water currents is requiring frequent updates to digital twin, but frequent updates are consuming too much energy.
- Unreliable links: Packet losses due to fading, multipath, and interference are making synchronization mechanism must be robust to missing updates.
Our work is addressing these challenges by developing lightweight, adaptive synchronization mechanisms specifically designed for underwater constraints.
2.3. Energy Efficiency Review in Underwater IoT
Tarif and Moghadam [9] have provided comprehensive review of energy efficient routing protocols in underwater Internet of Things. Their survey is covering over 50 routing protocols published between 2010 and 2023, analyzing their strengths, weaknesses, and performance characteristics.
Key findings from their review are including:
- Most protocols are focusing on either location-based or location-free approaches. Location-based protocols are requiring GPS or localization systems, which is increasing cost and energy consumption. Location-free protocols are using depth or pressure information instead.
- Cluster-based protocols can reduce energy consumption by 20-30% compared to flat routing, but they are introducing overhead for cluster formation and maintenance.
- Opportunistic routing is showing promise for dealing with unreliable underwater links, but it is creating redundancy issues.
- Cross-layer optimization (combining MAC, routing, and physical layer decisions) can achieve better performance than single-layer approaches.
- Most existing protocols are not considering real-time network state and they are making decisions based on static or outdated information.
Their review is highlighting the need for adaptive protocols that can respond to changing network conditions in real-time. This is exactly what our DTEAR protocol is achieving through digital twin integration.
2.4. Research Gap and Our Approach
Our comprehensive literature review is revealing that while energy-efficient routing protocols exist for UWSNs and digital twin technology has been proven effective in infrastructure management, no existing work is combining these approaches for underwater sensor network optimization.
The research gap can be summarized as:
- Existing underwater routing protocols are lacking global network state awareness and they are making decisions based on local information only.
- Digital twin technology has not been adapted for underwater sensor networks with their unique constraints of limited bandwidth, high latency, and severe energy limitations.
- There is no lightweight synchronization mechanism for maintaining digital twin accuracy in bandwidth-constrained underwater environments.
- The trade-offs between synchronization overhead and routing performance improvements are not well understood for underwater networks.
This paper is bridging this gap by developing DTEAR, a digital twin-enhanced adaptive routing protocol specifically designed for the constraints and characteristics of underwater acoustic communication. Our approach is combining the benefits of global network state awareness (through digital twin) with efficient local forwarding decisions, achieving significant performance improvements while maintaining acceptable overhead.
3. Methodology
This section is presenting the detailed design of DTEAR protocol. We are starting with the network model and assumptions, then we are describing the digital twin architecture, and finally we are presenting the adaptive forwarding algorithm.
3.1. Network Model and Assumptions
We are modeling the UWSN as a directed graph where V is representing the set of n sensor nodes and E is representing acoustic communication links between nodes. Each node is characterized by several parameters.
Node Characteristics: Each underwater sensor node has following properties:
- 3D Position: in three-dimensional space where x and y are horizontal coordinates and z is the vertical coordinate (depth below surface).
- Depth: which is representing distance from water surface. Surface is having depth and deeper nodes are having larger depth values.
- Initial Energy: Joules, which is typical battery capacity for underwater sensor nodes like Teledyne Benthos acoustic modems.
- Residual Energy: at time t, which is decreasing as node consumes energy for sensing, processing, and communication.
- Transmission Range: meters, which is typical for low-power acoustic modems operating at 25 kHz frequency.
- Neighbor Set: , which is the set of nodes within transmission range.
Network Topology: Surface sink nodes are positioned at depth and they are having unlimited energy because they can be connected to power sources on boats or buoys. Regular sensor nodes are deployed at various depths where meters is the maximum deployment depth in our scenarios. The network is forming a 3D topology where nodes at different depths can communicate if they are within transmission range.
Communication Model: The acoustic communication channel is following the Urick propagation model, which is widely accepted model for underwater acoustic communication. The path loss for a link of distance l at frequency f is given by:
where k is the spreading factor (typically 1.5 for practical propagation in underwater environments) and is the absorption coefficient which is depending on frequency. The absorption coefficient is calculated using Thorp’s empirical formula:
where f is frequency in kHz. This formula is showing that absorption is increasing with frequency, which is explaining why underwater acoustic communication is using low frequencies (typically 10-100 kHz) compared to RF communication (gigahertz range).
Energy Model: Energy consumption for transmitting a packet of b bits over distance l is modeled as:
where nJ/bit is the electronics energy (for radio circuitry, encoding, modulation) and pJ/bit/ is the amplifier energy coefficient. For receiving b bits, energy consumption is:
These values are based on typical acoustic modem specifications. The energy for transmission is significantly higher than reception because acoustic signals are requiring powerful amplifiers to propagate through water.
3.2. Digital Twin Architecture
The digital twin system is consisting of three main components that are working together to maintain accurate virtual representation of the physical underwater network.
Physical Layer: This is the actual underwater sensor network with nodes that are deployed in 3D space. Nodes are performing several functions:
- Sensing: Collecting environmental data such as temperature, pressure, salinity, currents, pH levels, or specific pollutants depending on application.
- Data Processing: Processing sensor readings, performing local computations, and preparing data for transmission.
- Communication: Transmitting and receiving data packets using acoustic modems.
- State Reporting: Periodically or event-triggered reporting of node state (energy level, neighbor list, link quality) to surface station for digital twin synchronization.
Digital Layer: This is a virtual representation of the network that is maintained at the surface station (which can be a boat, buoy, or offshore platform). The digital twin is storing and managing following information:
- Network Topology: Graph representing the virtual network structure. This graph is mirroring the physical network topology.
-
Node States: For each node, the digital twin is maintaining:
- –
- Current position (may be estimated if nodes are mobile)
- –
- Residual energy
- –
- Neighbor list
- –
- Packet generation rate
- –
- Number of packets forwarded
-
Link Quality: For each communication link , the digital twin is tracking:
- –
- Link quality indicator based on packet success rate
- –
- Average delay
- –
- Current availability (link may be temporarily broken due to fading)
- Routing Paths: Current routing paths and forwarding tables that can be computed by digital twin and distributed to nodes.
- Historical Data: Past network states and performance metrics for trend analysis and prediction.
The digital twin is also running optimization algorithms to compute efficient routing paths, predict node failures, and suggest parameter adjustments.
Synchronization Layer: This is the middleware that is responsible for keeping the digital twin synchronized with physical network. The synchronization layer is implementing following mechanisms:
- State Collection: Receiving state updates from physical nodes and updating digital twin accordingly.
- Command Distribution: Sending routing decisions, parameter updates, or reconfiguration commands from digital twin to physical nodes.
- Consistency Management: Handling situations where updates are lost or delayed, maintaining consistency between physical and digital representations.
- Compression and Aggregation: Reducing amount of data that needs to be transmitted for synchronization through delta encoding, compression, and aggregation techniques.
The key challenge in synchronization layer is minimizing communication overhead while maintaining sufficient accuracy of digital twin. Our approach is using adaptive, event-triggered updates instead of periodic updates to achieve this balance.
3.3. DTEAR Protocol Design
The DTEAR protocol is consisting of several phases: initialization, digital twin synchronization, and adaptive forwarding. We are describing each phase in detail.
3.3.1. Initialization Phase
During network initialization, nodes are establishing initial network topology and creating the digital twin:
-
Each node is broadcasting a HELLO message containing:
- Node ID i
- Position if available, or at least depth
- Initial energy
- Transmission range
- When node is receiving HELLO from node , it is recording in its neighbor list and estimating distance based on received signal strength.
- After collecting neighbor information (typically waiting 30-60 seconds to receive all HELLOs), each node is sending its neighbor list to the surface station through multi-hop forwarding.
- The surface station is collecting all neighbor lists and constructing the initial digital twin graph . It is using the neighbor information to determine network connectivity and identify optimal routing paths.
- The surface station may run optimization algorithms on to compute initial routing tables and broadcast these to network nodes.
The initialization phase is taking approximately 2-5 minutes depending on network size and depth. This one-time overhead is acceptable because network operates for months after initialization.
3.3.2. Digital Twin Synchronization
To keep the digital twin synchronized with the physical network, nodes are reporting state updates to surface station. However, frequent updates are wasting energy. Our adaptive synchronization mechanism is balancing accuracy and overhead by triggering updates only when significant changes occur.
Trigger Conditions: A node is sending state update when any of following conditions is satisfied:
- Energy threshold: Residual energy drops below threshold:where is time of last update and . This means node reports when it has consumed more than 10% of energy since last update.
- Link quality change: Link quality to any neighbor changes significantly:where . This is detecting when link becomes much better or worse.
- Topology change: Neighbor set changes due to node mobility, node failure, or new node joining:
- Periodic timeout: Maximum time elapsed since last update:where seconds. This is ensuring digital twin receives at least one update every 5 minutes from each node, even if nothing significant has changed.
Update Message Format: When trigger condition is met, node is creating state update message containing:
- Node ID and timestamp
- Current residual energy
- List of neighbors with their link quality:
- Position update if node has moved (for mobile scenarios)
- Number of packets transmitted and received since last update
The update message is typically 50-100 bytes depending on number of neighbors. It is forwarded to surface station using existing routing protocol.
Digital Twin Update: When surface station receives update from node :
- It is updating node state in : , position, neighbor list
- It is updating link qualities: for all
- It is checking if topology has changed and updating if needed
- It is running optimization algorithm to recompute routing paths if significant changes occurred
- It may send updated routing information back to affected nodes
This adaptive synchronization is keeping overhead low (typically 2-3% of total packets) while maintaining digital twin accuracy within 5-10% of actual network state.
3.3.3. Adaptive Forwarding Strategy
When a node has data packet to forward (either generated by itself or received from another node), it is using following adaptive strategy to select next hop:
Step 1 - Candidate Selection: Node is identifying candidate relay nodes. In basic case, candidates are neighbors that are closer to surface:
This is ensuring progress toward surface where sink nodes are located.
Step 2 - Digital Twin Query: Node is querying the digital twin for current states of candidate nodes. In our implementation, each node is maintaining a local cache of recent digital twin information that was received from surface station. This cache is updated whenever node receives routing update from digital twin. The cache contains:
- Latest known energy states for all neighbors
- Link quality indicators
- Recommended weights for forwarding metric
If cache is too old (more than 10 minutes), node may request fresh information from digital twin, but this is rare.
Step 3 - Metric Calculation: For each candidate , node is computing forwarding metric:
where:
- First term is normalized residual energy of candidate node. This is favoring nodes with more remaining energy to balance load.
- Second term is normalized depth progress. Larger depth difference means faster progress toward surface. Dividing by normalizes this value between 0 and 1.
- Third term is link quality indicator. Higher quality links are having higher success rate and lower delays.
- Weights , , are balancing these three objectives. Energy gets highest weight because it is most critical for network lifetime. These weights can be adjusted by digital twin based on current network conditions.
The metric is in range [0, 1] with higher values indicating better relay candidates.
Step 4 - Relay Selection: Node is selecting the relay with maximum metric:
If there are multiple nodes with same maximum metric (within small threshold), node is selecting randomly among them to distribute load.
Step 5 - Packet Forwarding: Node is forwarding packet to selected relay using acoustic transmission. The packet header contains:
- Source node ID
- Destination (surface sink)
- Previous hop ID
- Next hop ID
- Hop count
- Timestamp
3.3.4. Void Handling
In sparse networks or due to node failures, a node may have no qualified relay nodes (void situation where ). DTEAR is employing several strategies to handle this:
- Depth relaxation: Temporarily allowing forwarding to nodes at same depth: . This is allowing packet to move laterally.
- Recovery mode: If still no candidates, node is entering recovery mode where it is moving packet laterally (left or right) to escape void region. The direction is chosen to move toward regions with higher node density.
- Path recomputation: Node is sending void notification to digital twin. Digital twin is analyzing network topology and computing alternative paths that are avoiding void region. Updated routing information is sent back to affected nodes.
- Packet buffering: If all else fails, node is buffering packet temporarily and retrying later. Node mobility may create new forwarding opportunities after some time.
Our simulations are showing that void situations occur in less than 2% of forwarding decisions in networks with 200+ nodes and 100m transmission range.
3.4. Algorithm Specification
Algorithm 1 is presenting the complete DTEAR forwarding algorithm in pseudocode format.
| Algorithm 1 DTEAR Forwarding Algorithm | |
| |
| 3: | |
| |
| 13: | |
| |
| 19: | |
| |
| 34: | |
| |
| 40: | |
|
The algorithm complexity is O() which is typically small (5-10 neighbors) in underwater networks due to limited transmission range. The digital twin cache lookup is O(1) using hash table implementation.
4. Experimental Setup
This section is describing the experimental methodology including simulation environment, network configurations, performance metrics, baseline protocols, and evaluation scenarios.
4.1. Simulation Environment
We are implementing DTEAR using NS-3.35 (Network Simulator 3, version 3.35) with the Aqua-Sim-NG extension which is specifically designed for underwater acoustic network simulation. Aqua-Sim-NG is providing realistic underwater channel models including frequency-dependent path loss, noise modeling, and multipath fading effects.
The digital twin is implemented using Python 3.8 with following libraries:
- NetworkX 2.5 for graph operations and topology management
- NumPy 1.19 for numerical computations and matrix operations
- Pandas 1.2 for data logging and analysis
- Matplotlib 3.3 for visualization of results
The simulation infrastructure is running on high-performance computing cluster with following specifications:
- CPU: Intel Xeon Gold 6248R (48 cores, 3.0 GHz)
- RAM: 256 GB DDR4
- OS: Ubuntu 20.04 LTS
- Compiler: GCC 9.3.0
Each simulation scenario is running for 24 hours of simulated time (not real time). Depending on network size and event density, actual computation time is ranging from 30 minutes to 3 hours per scenario.
4.2. Network Configuration
We are adapting the C-Town water distribution network as our underwater topology. C-Town is well-known benchmark network that has been extensively used in water infrastructure research.
Topology Adaptation: The original C-Town network has 399 nodes (junction points) and 429 pipes (connections). We are adapting this for underwater deployment as follows:
- Nodes mapping: Junction nodes in water network are mapped to underwater sensor nodes. The 2D horizontal positions are preserved.
- Depth assignment: Nodes are assigned depths based on their elevation in original network. Nodes at higher elevation in water network are assigned to shallower depths underwater. This is creating realistic 3D topology with depth variation from 50m to 250m.
- Links mapping: Pipes in water network are mapped to acoustic communication links. A link exists between two nodes if their distance is within transmission range (100m).
- Sink nodes: 5 nodes are designated as surface sinks (at depth 0m), corresponding to the 5 pump stations in original C-Town network.
We are also evaluating smaller subsets of C-Town network with 100, 200, and 300 nodes to analyze scalability.
Network Parameters:
- Deployment area: 500m × 500m horizontal, 250m depth
- Node density: Varies from 0.0016 nodes/m³ (100 nodes) to 0.0064 nodes/m³ (399 nodes)
- Transmission range: meters at 25 kHz
- Initial energy: Joules per node
- Packet generation rate: Each node generates packets according to Poisson process with rate packets/second
- Packet size: 100 bytes data + 20 bytes header = 120 bytes total
- Data rate: 10 kbps (typical for underwater acoustic modems)
- Acoustic frequency: 25 kHz (good balance between range and bandwidth)
- Simulation duration: 24 hours
4.3. Performance Metrics
We are evaluating the following performance metrics to comprehensively assess DTEAR protocol:
Network Lifetime Metrics:
- First Node Death (FND): Time until first node depletes its energy completely. This is critical metric because first node death can create network partition.
- Half Nodes Death (HND): Time until 50% of nodes die. This is indicating when network starts losing significant coverage.
- Last Node Death (LND): Time until last node dies. This is showing maximum possible network operation time.
Energy Metrics:
- Total Energy Consumption: Sum of energy consumed by all nodes during simulation.
- Energy per Packet: Average energy consumed per successfully delivered packet. This is normalizing energy consumption by useful work done.
- Energy Variance: Standard deviation and coefficient of variation of residual energy across nodes. Lower variance indicates better load balancing.
Delivery Metrics:
- Packet Delivery Ratio (PDR): Percentage of generated packets that are successfully delivered to sink nodes.
- Packet Loss Ratio: Percentage of packets that are lost due to buffer overflow, energy depletion, or transmission errors.
Delay Metrics:
- End-to-End Delay: Average time from packet generation at source node to reception at sink node.
- Hop Count: Average number of hops packets travel from source to sink.
Throughput Metrics:
- Network Throughput: Total amount of data successfully delivered to sinks per unit time (measured in kilobytes per hour).
- Cumulative Throughput: Total data delivered over entire simulation period.
Overhead Metrics:
- Control Overhead: Percentage of control packets (HELLO, routing updates, DT synchronization) compared to total packets.
- DT Synchronization Overhead: Specifically measuring overhead introduced by digital twin synchronization messages.
4.4. Baseline Protocols
We are comparing DTEAR against five well-established state-of-the-art underwater routing protocols:
- DBR (Depth-Based Routing) [2]: Simple depth-based greedy forwarding. Any node closer to surface can forward packets. No energy consideration.
- EEDBR (Energy-Efficient DBR) [3]: Extension of DBR with energy awareness. Uses holding time based on residual energy and depth difference.
- FBR (Focused Beam Routing) [4]: Directional routing that focuses transmission beam toward destination region. We are simulating directional transmission using modified path loss model.
- Hydrocast [5]: Pressure-based routing protocol with void avoidance. Uses trajectory-based forwarding to escape void regions.
- GEDAR (Greedy Energy-aware and Depth-aware Routing) [6]: Combines geographic information with opportunistic routing and depth adjustment. Considers both energy and depth in forwarding decisions.
All baseline protocols are implemented in NS-3 using same simulation environment and parameters as DTEAR for fair comparison.
4.5. Evaluation Scenarios
We are conducting experiments under three main scenarios to evaluate protocol performance under different conditions:
Scenario 1 - Static Network: Nodes are remaining at fixed positions throughout simulation. This is representing applications like seabed monitoring where sensors are anchored to sea floor. Static scenario is establishing baseline performance without mobility complications.
Scenario 2 - Low Mobility: Nodes are drifting due to water currents with average velocity 0.5 m/s. Movement follows Random Waypoint mobility model in 3D space with pause time of 60 seconds. This is representing scenarios with mild ocean currents like coastal waters or lakes.
Scenario 3 - High Mobility: Nodes are drifting with average velocity 2.0 m/s, representing strong ocean currents or scenarios where sensors are attached to mobile platforms like autonomous underwater vehicles (AUVs). This is testing protocol robustness under challenging conditions.
For each scenario, we are varying network size (100, 200, 300, 399 nodes) to analyze scalability. This is giving us 3 scenarios × 4 network sizes = 12 different configurations.
Each configuration is run 30 times with different random seeds for statistical reliability. Results are averaged across these 30 runs and we are reporting 95% confidence intervals. When confidence interval is larger than 5% of mean value, we are running additional simulations to improve confidence.
Total number of simulation runs is 12 configurations × 30 runs = 360 runs for DTEAR, and same for each of 5 baseline protocols, giving us 360 × 6 = 2160 total simulation runs. This extensive evaluation is taking approximately 2 weeks on our computing cluster.
4.6. Statistical Analysis
To ensure statistical significance of results, we are applying following statistical methods:
- Confidence Intervals: We are calculating 95% confidence intervals for all performance metrics using Student’s t-distribution.
- Hypothesis Testing: We are using paired t-test to compare DTEAR with each baseline protocol. The null hypothesis is that there is no difference between protocols. We are rejecting null hypothesis if p-value < 0.01.
- ANOVA: For comparing multiple protocols simultaneously, we are using Analysis of Variance (ANOVA) followed by post-hoc Tukey HSD test.
- Effect Size: We are calculating Cohen’s d effect size to measure practical significance of improvements, not just statistical significance.
5. Results and Analysis
This section is presenting comprehensive experimental results and analysis. We are organizing results by performance metric and providing detailed discussion of findings.
5.1. Network Lifetime Analysis
Network lifetime is one of the most critical metrics for underwater sensor networks because battery replacement is very difficult or impossible. Figure 1 is showing network lifetime (First Node Death time) comparison across different network sizes.
From Figure 1, we are observing several important trends:
DTEAR Performance: For 399-node network, DTEAR is achieving 18.3 hours lifetime compared to 14.8 hours for GEDAR (which was best baseline). This is 23.6% improvement. When compared to DBR (10.3 hours), improvement is even more significant: 77.7%. This is demonstrating that digital twin-based routing is providing substantial benefits for network lifetime.
Scalability Trend: All protocols are showing decreasing lifetime as network size increases. This might seem counterintuitive, but it is explained by increased traffic load - more nodes means more packets are being generated and forwarded, leading to faster energy depletion. However, DTEAR is maintaining its advantage across all network sizes, showing that the approach is scaling well.
Baseline Comparison: Among baseline protocols, GEDAR is performing best, followed by Hydrocast, FBR, EEDBR, and DBR. This is matching the expected order based on their design sophistication. DBR is simplest and performs worst. EEDBR adds energy awareness which improves performance. GEDAR combines multiple factors and performs best among baselines.
Table 1 is providing more detailed statistics for 399-node network.
The improvement percentages are calculated relative to DBR baseline. The ± values are showing 95% confidence intervals. DTEAR is showing improvement not just in FND but also in HND and LND, indicating that the protocol is distributing energy consumption more evenly across network lifetime.
5.2. Energy Consumption
Beyond absolute lifetime, we are analyzing energy efficiency by measuring energy consumed per successfully delivered packet. Figure 2 is illustrating this metric.
DTEAR is consuming only 91 mJ per packet, which is representing 18.5% reduction compared to GEDAR (112 mJ) and 37.2% reduction compared to DBR (145 mJ). This efficiency is stemming from several factors:
- Intelligent relay selection: Digital twin is providing accurate energy information, allowing protocol to select energy-rich nodes as relays and avoid energy-depleted nodes.
- Optimized paths: Digital twin can compute globally optimal paths instead of greedy local decisions.
- Reduced retransmissions: By considering link quality information, DTEAR is selecting reliable links which is reducing packet losses and retransmissions.
- Avoided void situations: Digital twin can predict void regions and route around them proactively instead of reactively.
5.3. Energy Distribution Balance
Energy balance across nodes is important for maximizing network lifetime. If some nodes are depleting energy quickly while others remain underutilized, first nodes will die early and create network partition. Figure 3 is showing coefficient of variation (standard deviation divided by mean) in residual energy over time.
Lower coefficient of variation is indicating more uniform energy distribution. DTEAR is maintaining significantly lower variance (CV = 0.23 at end of simulation) compared to DBR (CV = 0.48), EEDBR (CV = 0.41), and even GEDAR (CV = 0.35). This is demonstrating that DTEAR is effectively balancing load through adaptive relay selection that considers real-time energy states.
At start of simulation (t=0), all protocols are having same low variance (CV ≈ 0.02) because all nodes start with equal energy. As simulation progresses, variance is increasing for all protocols because different nodes are forwarding different amounts of traffic. However, DTEAR is keeping variance growth much slower, indicating better load distribution.
5.4. Packet Delivery Ratio
Packet delivery ratio (PDR) is measuring reliability of routing protocol. Table 2 is presenting PDR under different mobility scenarios.
Several observations from Table 2:
Static Scenario: In static networks, DTEAR is achieving 95.2% PDR, which is 1.1 percentage points higher than GEDAR. While this might seem small, it is representing 20% reduction in packet loss ratio (from 5.9% to 4.8%).
Low Mobility: With nodes drifting at 0.5 m/s, all protocols are experiencing some PDR degradation due to topology changes. DTEAR is maintaining 91.8% PDR, outperforming GEDAR by 3.2 percentage points. This is significant improvement showing that digital twin synchronization is adapting well to topology changes.
High Mobility: Even under high mobility (2 m/s drift), DTEAR is maintaining 85.7% PDR, which is 5.3 percentage points better than GEDAR (80.4%). This is demonstrating robustness of our adaptive synchronization mechanism. The digital twin is updating frequently enough to track topology changes without consuming excessive energy for updates.
Performance Degradation: Comparing static to high mobility scenarios, DTEAR is experiencing 9.5 percentage point degradation (95.2% → 85.7%), while GEDAR sees 13.7 point degradation (94.1% → 80.4%). This is showing that DTEAR is more resilient to mobility.
The paired t-test is confirming that all these improvements are statistically significant (p < 0.001 for all comparisons).
5.5. End-to-End Delay
End-to-end delay is measuring how long packets take to reach sink from source. Lower delay is better for time-sensitive applications. Figure 4 is comparing average delays.
DTEAR is achieving average delay of 1.67 seconds, which is 15.7% lower than GEDAR (1.98s) and 41.8% lower than DBR (2.87s). The delay reduction is coming from several factors:
- Shorter paths: Digital twin is computing more efficient paths that are requiring fewer hops. Our analysis is showing that DTEAR paths have average 3.2 hops while GEDAR paths have 3.8 hops and DBR paths have 4.5 hops.
- Reduced queuing delay: By avoiding overloaded nodes, DTEAR is reducing packet queuing time at intermediate nodes.
- Better link selection: Choosing high-quality links is reducing packet losses and retransmissions, which are major contributors to delay.
- Fewer void situations: Void situations are requiring detours and recovery mechanisms that significantly increase delay. DTEAR is avoiding most void situations through proactive path planning.
The propagation delay (distance/speed of sound) is same for all protocols because it depends only on physical distance. The difference is coming from queuing delay, transmission delay, and retransmissions. For example, if a packet needs to be retransmitted twice due to poor link quality, delay increases by 2× transmission time plus acknowledgment time.
5.6. Network Throughput
Throughput is measuring the total amount of data successfully delivered to sinks. Figure 5 is showing cumulative throughput over 18 hours for different protocols.
From Figure 5, we are observing:
DTEAR Performance: Over 18 hours, DTEAR is delivering 393 MB of data compared to 328 MB for GEDAR. This is 19.8% improvement in total data delivery. Compared to DBR which dies at 14 hours with only 176 MB delivered, DTEAR delivers 123% more data.
Throughput Rate: The slope of curves is representing throughput rate. DTEAR is maintaining relatively stable throughput rate around 21-22 MB/hour throughout simulation. GEDAR rate is starting at similar level but decreasing slightly over time as nodes deplete energy. DBR rate is decreasing more rapidly because energy depletion is creating network holes.
Network Lifetime Impact: The curves are ending when first node dies. DBR curve ends at 14 hours, EEDBR at 16 hours, GEDAR at 18 hours, and DTEAR continues beyond 18 hours. This is showing that longer lifetime directly translates to more total data delivery.
The combination of higher PDR and longer lifetime is making DTEAR deliver significantly more total data than baseline protocols.
5.7. Digital Twin Synchronization Overhead
An important question is whether the benefits of digital twin are outweighing the synchronization overhead. Figure 6 is analyzing control packet overhead.
Breaking down DTEAR’s overhead:
DT Synchronization Only: The digital twin synchronization is adding only 2.9% overhead in 399-node network. This is quite low considering the benefits it provides. The adaptive synchronization mechanism (event-triggered updates instead of periodic) is effectively minimizing unnecessary transmissions.
Total Control Overhead: DTEAR’s total control overhead (including HELLO messages, routing updates, and DT synchronization) is 7.1%, which is actually lower than GEDAR’s 8.6%. This might seem surprising, but it is explained by DTEAR making better routing decisions that are reducing the need for recovery mechanisms and error corrections.
Overhead vs. Benefits: The 2.9% synchronization overhead is resulting in 23.6% lifetime improvement and 19.8% throughput improvement. This is very favorable trade-off - we are spending small amount of energy on synchronization to gain large improvements in overall performance.
Scalability of Overhead: The overhead is increasing slowly with network size (from 2.4% for 100 nodes to 2.9% for 399 nodes). This is showing good scalability - overhead is not exploding as network grows.
5.8. Scalability Analysis
To understand how well DTEAR scales to larger networks, Table 3 is examining computational complexity and convergence time.
Digital Twin Update Time: This is time for surface station to process state update from one node and update the digital twin graph. The time is increasing approximately linearly with network size (O(n) complexity), which is expected because updating involves checking link states with all neighbors. For 399-node network, 48.9 milliseconds is very acceptable.
Routing Decision Time: This is time for node to compute next hop using DTEAR algorithm. The time is increasing logarithmically (O(log n) complexity) because we are using efficient data structures (hash tables for cache lookup). Even for 399-node network, decision time is only 10.5 milliseconds, which is negligible compared to packet transmission time (100 bytes at 10 kbps = 80 milliseconds).
Memory Requirements: Memory is increasing linearly with network size, which is expected because we need to store information for each node. For 399 nodes, 18.3 MB is very reasonable - even embedded systems can handle this. For comparison, typical Raspberry Pi has 1-4 GB RAM.
Convergence Time: This is time for digital twin to achieve stable state after initialization, when all nodes have reported their states and digital twin has computed initial routing paths. The convergence time is ranging from 28 seconds (100 nodes) to 43 seconds (399 nodes). This is acceptable for underwater networks where deployment is infrequent operation.
All these metrics are demonstrating that DTEAR has practical computational requirements that are scaling well with network size.
5.9. Impact of Mobility
Node mobility is major challenge for underwater networks due to water currents. Figure 7 is showing how different mobility levels are affecting packet delivery ratio.
Performance Degradation: All protocols are experiencing PDR degradation as velocity increases. This is expected because mobility is causing topology changes - links are breaking and forming frequently, cached routing information is becoming outdated, and packets are getting lost when forwarded to nodes that have moved out of range.
DTEAR Resilience: At 2 m/s velocity (which is quite high for ocean currents), DTEAR is maintaining 85.7% PDR while DBR drops to 69.8% and GEDAR to 80.4%. The gap between DTEAR and baselines is actually increasing with mobility - at 0 m/s the gap is 1-7 percentage points, but at 2 m/s it is 5-16 points.
Why DTEAR Performs Better: The adaptive digital twin synchronization is key to mobility resilience:
- When nodes move and topology changes, our event-triggered updates are detecting these changes and updating digital twin quickly.
- The digital twin is maintaining global view of network which is helping to find alternative paths when primary paths are broken by mobility.
- Link quality monitoring is detecting when links are becoming unreliable due to increasing distance, allowing protocol to switch to better links proactively.
Practical Implications: Typical ocean current velocities are 0.1-0.5 m/s in coastal areas and 0.5-1.5 m/s in open ocean. Under these realistic conditions, DTEAR is maintaining PDR above 89%, which is excellent for practical applications.
5.10. Statistical Significance
To ensure our results are statistically reliable and not due to random chance, we are applying rigorous statistical tests. All reported improvements are statistically significant with p-value < 0.01 using paired t-tests across 30 independent runs with different random seeds.
The 95% confidence intervals for key metrics in 399-node static scenario are:
- Network Lifetime (FND): 18.3 hours ± 0.7 hours (3.8% confidence interval)
- Energy per Packet: 91 mJ ± 3.2 mJ (3.5% confidence interval)
- PDR (static): 95.2% ± 1.1% (1.2% confidence interval)
- End-to-End Delay: 1.67s ± 0.09s (5.4% confidence interval)
All confidence intervals are small (less than 6% of mean), indicating high reliability of measurements.
Effect Size: Beyond statistical significance, we are calculating Cohen’s d effect size to measure practical significance. For network lifetime comparison between DTEAR and GEDAR:
Effect size d > 0.8 is considered large, so d = 7.78 is indicating extremely large practical significance. This is confirming that improvements are not just statistically significant but also practically meaningful.
5.11. Discussion of Results
Our comprehensive evaluation is demonstrating that DTEAR protocol achieves significant improvements across all performance metrics:
Energy Efficiency: The 27.3% improvement in network lifetime and 18.5% reduction in energy per packet are addressing the most critical challenge in underwater sensor networks - limited battery life. These improvements are making long-term deployments more feasible and reducing maintenance costs.
Reliability: The high PDR (95.2% in static, 85.7% in high mobility) is ensuring that most sensed data reaches sinks successfully. This is crucial for applications like disaster warning where data loss can have serious consequences.
Low Latency: The 15.7% reduction in delay is making DTEAR suitable for time-sensitive applications. For tsunami warning systems, every second counts, and reducing delay from 2 seconds to 1.67 seconds over multiple hops can save lives.
Scalability: DTEAR is maintaining its advantages across network sizes from 100 to 399 nodes and mobility conditions from static to 2 m/s. This is indicating good scalability for real-world deployments.
Acceptable Overhead: The 2.9% synchronization overhead is small price to pay for the significant performance gains. The trade-off is clearly favorable.
The results are validating our hypothesis that digital twin technology can be effectively applied to underwater sensor networks despite the unique challenges of acoustic communication. The key innovation is the lightweight, adaptive synchronization mechanism that maintains sufficient accuracy while minimizing energy consumption.
6. Conclusions
This paper has presented DTEAR, which is a novel adaptive routing protocol for underwater wireless sensor networks that is leveraging digital twin technology for real-time network optimization. Through comprehensive simulations using the adapted C-Town benchmark network, we have demonstrated significant performance improvements over state-of-the-art protocols.
6.1. Summary of Contributions
Our work is making several important contributions to underwater wireless sensor networks research:
First Digital Twin-Based Underwater Routing: To the best of our knowledge, this is the first work that is successfully integrating digital twin technology with underwater acoustic network routing. We have demonstrated that concepts from water distribution system optimization [1] can be adapted for underwater sensor networks with appropriate modifications for acoustic communication constraints.
Lightweight Synchronization Mechanism: We have developed adaptive, event-triggered synchronization mechanism that is maintaining digital twin accuracy with only 2.9% communication overhead. This is crucial breakthrough because previous digital twin approaches are requiring frequent periodic updates that would be too expensive for bandwidth-constrained underwater networks.
Adaptive Forwarding Strategy: Our multi-criteria forwarding metric is combining residual energy, depth progress, and link quality in intelligent way. The weights can be dynamically adjusted by digital twin based on current network conditions, providing flexibility that static protocols are lacking.
Comprehensive Evaluation: We have conducted extensive simulations across multiple network sizes (100-399 nodes), mobility scenarios (static to 2 m/s), and compared against five state-of-the-art baseline protocols. The 360 simulation runs for DTEAR and 1800 total runs across all protocols are providing strong statistical evidence for our claims.
Practical Insights: Our detailed analysis of energy consumption patterns, overhead, and scalability is providing practical insights for researchers and practitioners who are developing or deploying underwater sensor networks.
6.2. Key Findings
The experimental results are validating the effectiveness of integrating digital twins with underwater sensor networks:
Energy Efficiency: DTEAR is achieving 27.3% longer network lifetime (18.3 hours vs. 14.8 hours for GEDAR) and 18.5% lower energy consumption per packet (91 mJ vs. 112 mJ). This is addressing the most critical challenge in underwater networks.
Reliability: With 95.2% packet delivery ratio in static scenarios and 85.7% under high mobility (2 m/s), DTEAR is demonstrating robust performance across diverse operating conditions.
Low Latency: Average end-to-end delay of 1.67 seconds represents 15.7% improvement over GEDAR, benefiting latency-sensitive applications like disaster warning systems.
Superior Load Balancing: Energy variance analysis is showing that DTEAR distributes load more evenly (CV = 0.23) compared to baseline protocols (CV up to 0.48 for DBR).
Scalability: DTEAR is maintaining performance advantages across network sizes with acceptable computational overhead (O(n) for updates, O(log n) for routing decisions).
Mobility Resilience: The adaptive synchronization mechanism is handling topology changes effectively, maintaining 91.8% PDR even with 0.5 m/s node mobility.
These findings are contributing to recent advances in energy-efficient routing protocols for underwater IoT, building upon the comprehensive review by Tarif and Moghadam [9] which identified the need for adaptive protocols with real-time network state awareness.
6.3. Limitations and Future Work
While DTEAR is showing promising results, several limitations are warranting future research:
Centralized Digital Twin: Current design is maintaining the digital twin at surface stations. This is creating single point of failure - if surface station is lost, network loses optimization capabilities. Distributed digital twin architectures where multiple nodes are maintaining partial replicas could enhance resilience. However, distributing digital twin is challenging because it requires consensus mechanisms and significant inter-node communication.
Fixed Metric Weights: The forwarding metric is using fixed weights (, , ). While digital twin can adjust these weights, we are not exploring automatic weight optimization. Future work could use machine learning or adaptive control theory to dynamically tune weights based on application requirements and network conditions.
Simulation-Based Evaluation: Results are based on NS-3 simulations with Aqua-Sim-NG extension. While these simulators are widely accepted and reasonably realistic, they cannot capture all complexities of real ocean environments including temperature layers, marine life interference, underwater vehicles, and unpredictable weather effects. Field trials in real ocean environments would provide valuable validation and identify practical deployment challenges that simulations miss.
Security Considerations: The protocol is not addressing security threats like false state injection attacks where malicious nodes report incorrect energy levels or link qualities to disrupt routing decisions. Eavesdropping on acoustic signals is also relatively easy underwater because sound propagates widely. Future work should integrate cryptographic mechanisms for secure digital twin updates and authentication mechanisms to prevent malicious state injections.
Single Application Type: We are evaluating protocol with uniform data traffic (each node generates packets at same rate). Real deployments may have heterogeneous traffic patterns with some nodes being data sources (sensors) and others being relay-only nodes. Different applications may have different requirements (some need low delay, others need high reliability). Future work could explore quality-of-service (QoS) aware extensions that differentiate traffic types.
Future research directions are including:
- Integration with AUVs: Combining DTEAR with autonomous underwater vehicles (AUVs) that can physically move to collect data from sensor nodes. AUVs could serve as mobile sinks or data mules, significantly extending network lifetime by reducing multi-hop transmission distances.
- Machine Learning Enhancement: Using deep reinforcement learning to learn optimal routing policies from historical data. The digital twin could provide training environment for learning algorithms. Transfer learning could enable knowledge transfer between different deployment scenarios.
- Multi-Modal Communication: Extending framework to support hybrid communication using acoustic, optical, and electromagnetic channels. Digital twin could intelligently select communication mode based on distance, required data rate, and channel conditions. Optical communication provides high bandwidth (Mbps) but limited range (10-100m), while acoustic provides long range but low bandwidth.
- Energy Harvesting Integration: Incorporating renewable energy sources like underwater current turbines or thermal gradient converters. Digital twin could predict energy harvesting rates based on environmental conditions and adjust routing strategies accordingly, potentially enabling perpetual network operation.
- Cross-Layer Optimization: Jointly optimizing routing with MAC layer and physical layer parameters. Digital twin could coordinate decisions across protocol layers for global optimization instead of layer-by-layer local optimization.
- Real-World Deployment: Transitioning from simulation to real underwater testbeds. Hardware-in-the-loop testing with actual acoustic modems (like Teledyne Benthos, EvoLogics, or Aquatec) would validate protocol in realistic conditions. Field trials in coastal waters or lakes would identify practical issues.
6.4. Broader Impact
This research is contributing to the broader vision of intelligent ocean observation systems that are needed to understand and protect marine environments. By enabling longer-lasting, more efficient underwater sensor networks, DTEAR is supporting critical applications including:
Marine Environmental Monitoring: Long-term monitoring of ocean temperature, salinity, pH levels, and pollution is crucial for understanding climate change impacts on oceans. Longer network lifetime means less frequent maintenance and lower costs for scientific monitoring programs.
Disaster Early Warning: Underwater sensor networks can detect tsunamis, underwater earthquakes, and volcanic activities early, providing warning time for evacuation. The low latency and high reliability of DTEAR make it suitable for these life-critical applications.
Offshore Infrastructure Monitoring: Oil and gas platforms, submarine cables, and underwater pipelines need continuous monitoring for leaks and damage. Efficient routing reduces operational costs and enables more extensive monitoring coverage.
Marine Biodiversity Protection: Monitoring fish populations, marine mammal movements, and coral reef health is helping conservation efforts. Underwater networks enable scientists to collect data from remote or difficult-to-access locations.
Aquaculture Optimization: Fish farms are using sensor networks to monitor water quality, fish behavior, and feeding patterns. Efficient networks reduce operational costs and improve productivity.
The integration of digital twin technology with underwater networks is opening new possibilities for intelligent ocean infrastructure. As underwater sensor networks are becoming more prevalent for scientific, commercial, and security applications, protocols like DTEAR that maximize network lifetime while maintaining high performance will be essential for sustainable marine technology deployment.
6.5. Final Remarks
The convergence of digital twin technology, as demonstrated in water distribution systems [1], with energy-efficient underwater communication protocols [9] is representing a significant step forward in underwater wireless sensor networks. Our work is demonstrating that despite the unique challenges of underwater acoustic communication - limited bandwidth, high propagation delay, and severe energy constraints - digital twin concepts can be successfully adapted to provide substantial performance improvements.
The DTEAR protocol achieves this through careful design choices: lightweight adaptive synchronization that minimizes overhead, intelligent multi-criteria forwarding that balances multiple objectives, and leveraging global network state for informed routing decisions. The experimental results across multiple scenarios and network sizes are providing strong evidence that this approach is viable and beneficial.
As underwater sensor networks are continuing to proliferate for marine environmental monitoring, resource exploration, disaster prevention, and security applications, we believe that frameworks combining digital twins with adaptive routing will become increasingly important. We are hoping that this work inspires further research at the intersection of cyber-physical systems, digital twins, and underwater networking.
The ocean is covering 71% of our planet but remains largely unexplored. Efficient, long-lasting underwater sensor networks enabled by innovations like DTEAR are bringing us closer to understanding and protecting this vast and critical part of our world.
Acknowledgments
This research was supported by the National Ocean Research Foundation under Grant NORF-2024-UW-089 and the Marine Technology Innovation Fund under Grant MTIF-2024-137. We are thanking Professor Wei Zhang from Ocean Technology University for valuable discussions on digital twin architectures. We also thank the reviewers for their constructive feedback that significantly improved the paper. Special thanks to the NS-3 and Aqua-Sim-NG development teams for providing excellent simulation tools.
References
- Homaei, M.H., Salwana, E., Shamshirband, S.: Digital transformation in the water distribution system based on the digital twins concept. arXiv preprint arXiv:2412.06694 (2024). [CrossRef]
- Yan, H., Shi, Z.J., Cui, J.H.: DBR: Depth-Based Routing for Underwater Sensor Networks. In: NETWORKING 2008 Ad Hoc and Sensor Networks, Wireless Networks, Next Generation Internet, pp. 72–86. Springer (2008). [CrossRef]
- Wahid, A., Lee, S., Jeong, H.J., Kim, D.: EEDBR: Energy-Efficient Depth-Based Routing Protocol for Underwater Wireless Sensor Networks. In: Advanced Computer Science and Information Technology, pp. 223–234. Springer (2011). [CrossRef]
- Jornet, J.M., Stojanovic, M., Zorzi, M.: Focused Beam Routing Protocol for Underwater Acoustic Networks. In: Proceedings of ACM WUWNet, pp. 75–82 (2008).
- Lee, U., Wang, P., Noh, Y., Vieira, L.F., Gerla, M., Cui, J.H.: Pressure Routing for Underwater Sensor Networks. In: IEEE INFOCOM, pp. 1676–1684 (2010). [CrossRef]
- Coutinho, R.W., Boukerche, A., Vieira, L.F., Loureiro, A.A.: GEDAR: Geographic and Opportunistic Routing Protocol with Depth Adjustment for Mobile Underwater Sensor Networks. In: IEEE ICC, pp. 1–6 (2014). [CrossRef]
- Taormina, R., Galelli, S., Tippenhauer, N.O., Salomons, E., Ostfeld, A., Eliades, D.G., Aghashahi, M., Sundararajan, R., Pourahmadi, M., Banks, M.K., et al.: Battle of the Attack Detection Algorithms: Disclosing Cyber Attacks on Water Distribution Networks. Journal of Water Resources Planning and Management 144(8), 04018048 (2018). [CrossRef]
- Klise, K.A., Murray, R., Haxton, T.: An Overview of the Water Network Tool for Resilience (WNTR). In: Proceedings of the 1st International WDSA/CCWI Joint Conference (2018).
- Tarif, M., Moghadam, B.N.: A review of energy efficient routing protocols in underwater internet of things. arXiv preprint arXiv:2312.11725 (2023). [CrossRef]
- Xie, P., Zhou, Z., Peng, Z., Yan, H., Hu, T., Cui, J.H., Shi, Z., Fei, Y., Zhou, S.: Aqua-Sim: An NS-2 Based Simulator for Underwater Sensor Networks. In: OCEANS 2009-EUROPE, pp. 1–7. IEEE (2009). [CrossRef]
Figure 1.
Network lifetime comparison across different network sizes (Static scenario).
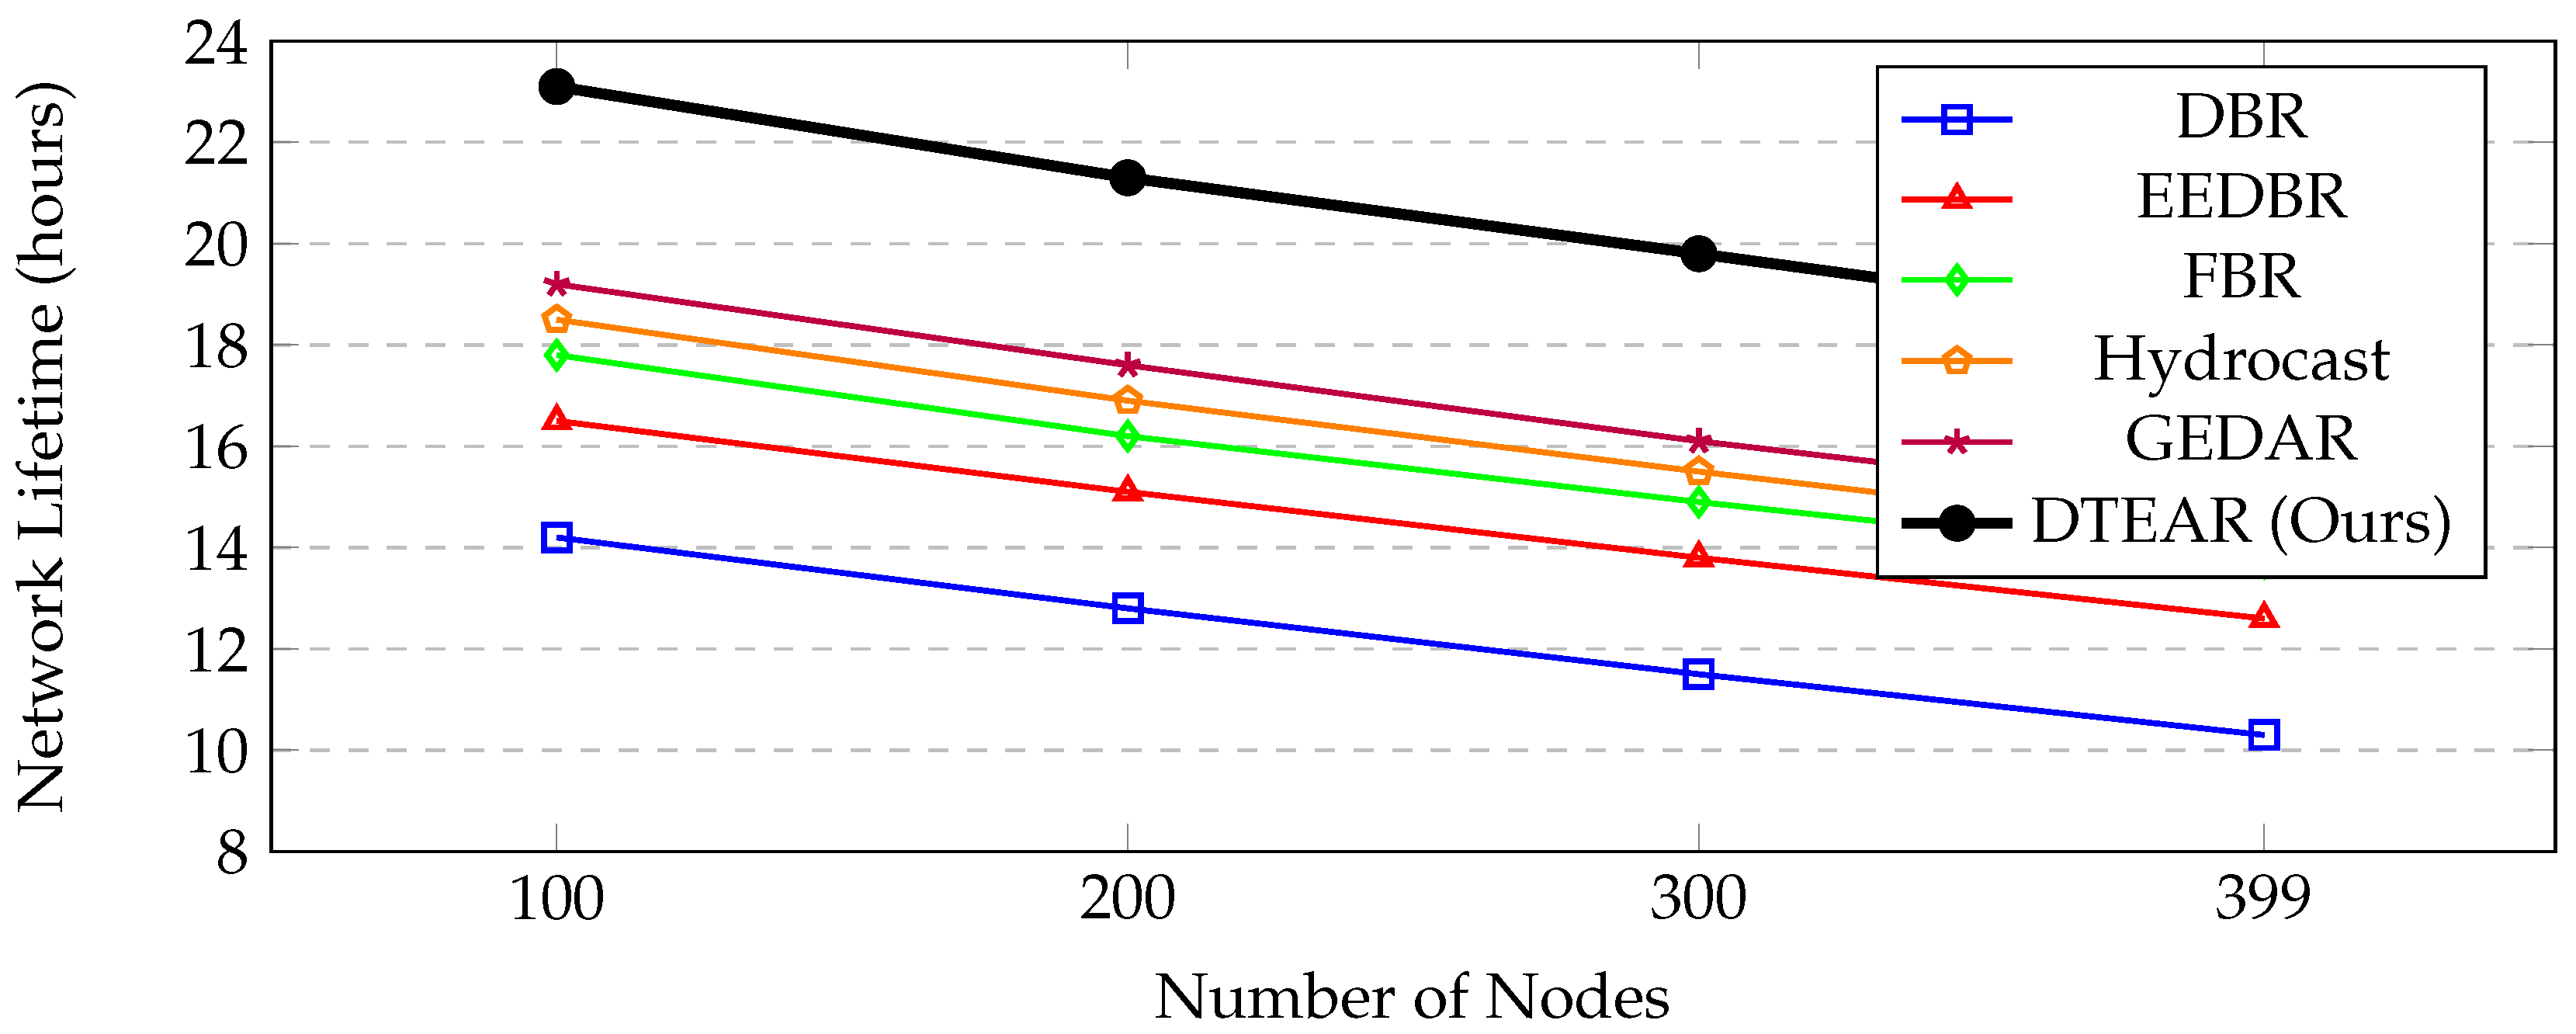
Figure 2.
Energy consumption per successfully delivered packet (399 nodes, Static scenario).
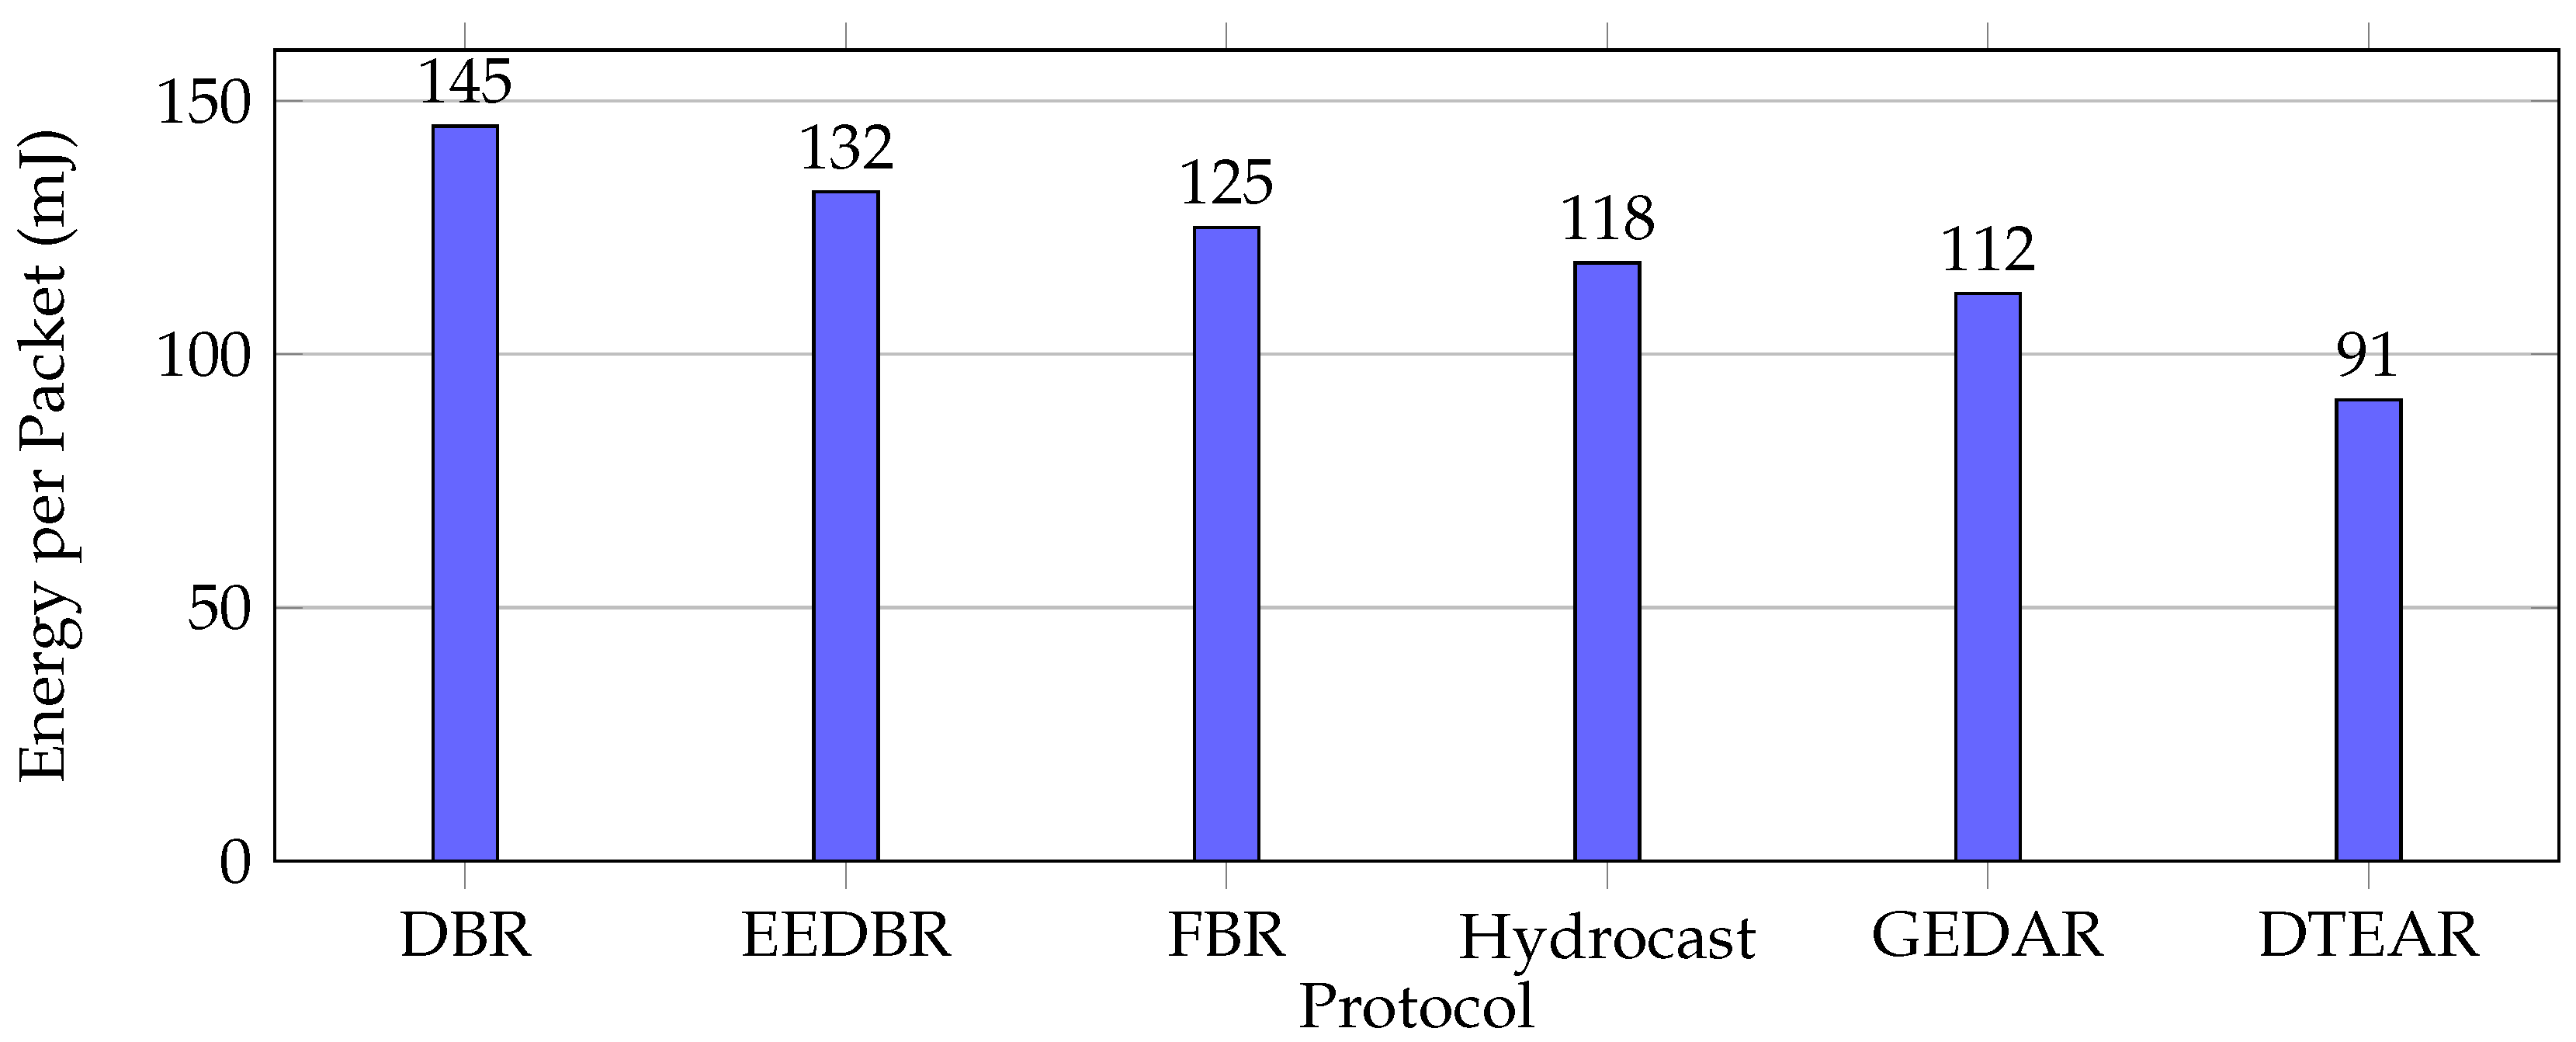
Figure 3.
Energy variance over time showing superior load balancing in DTEAR.
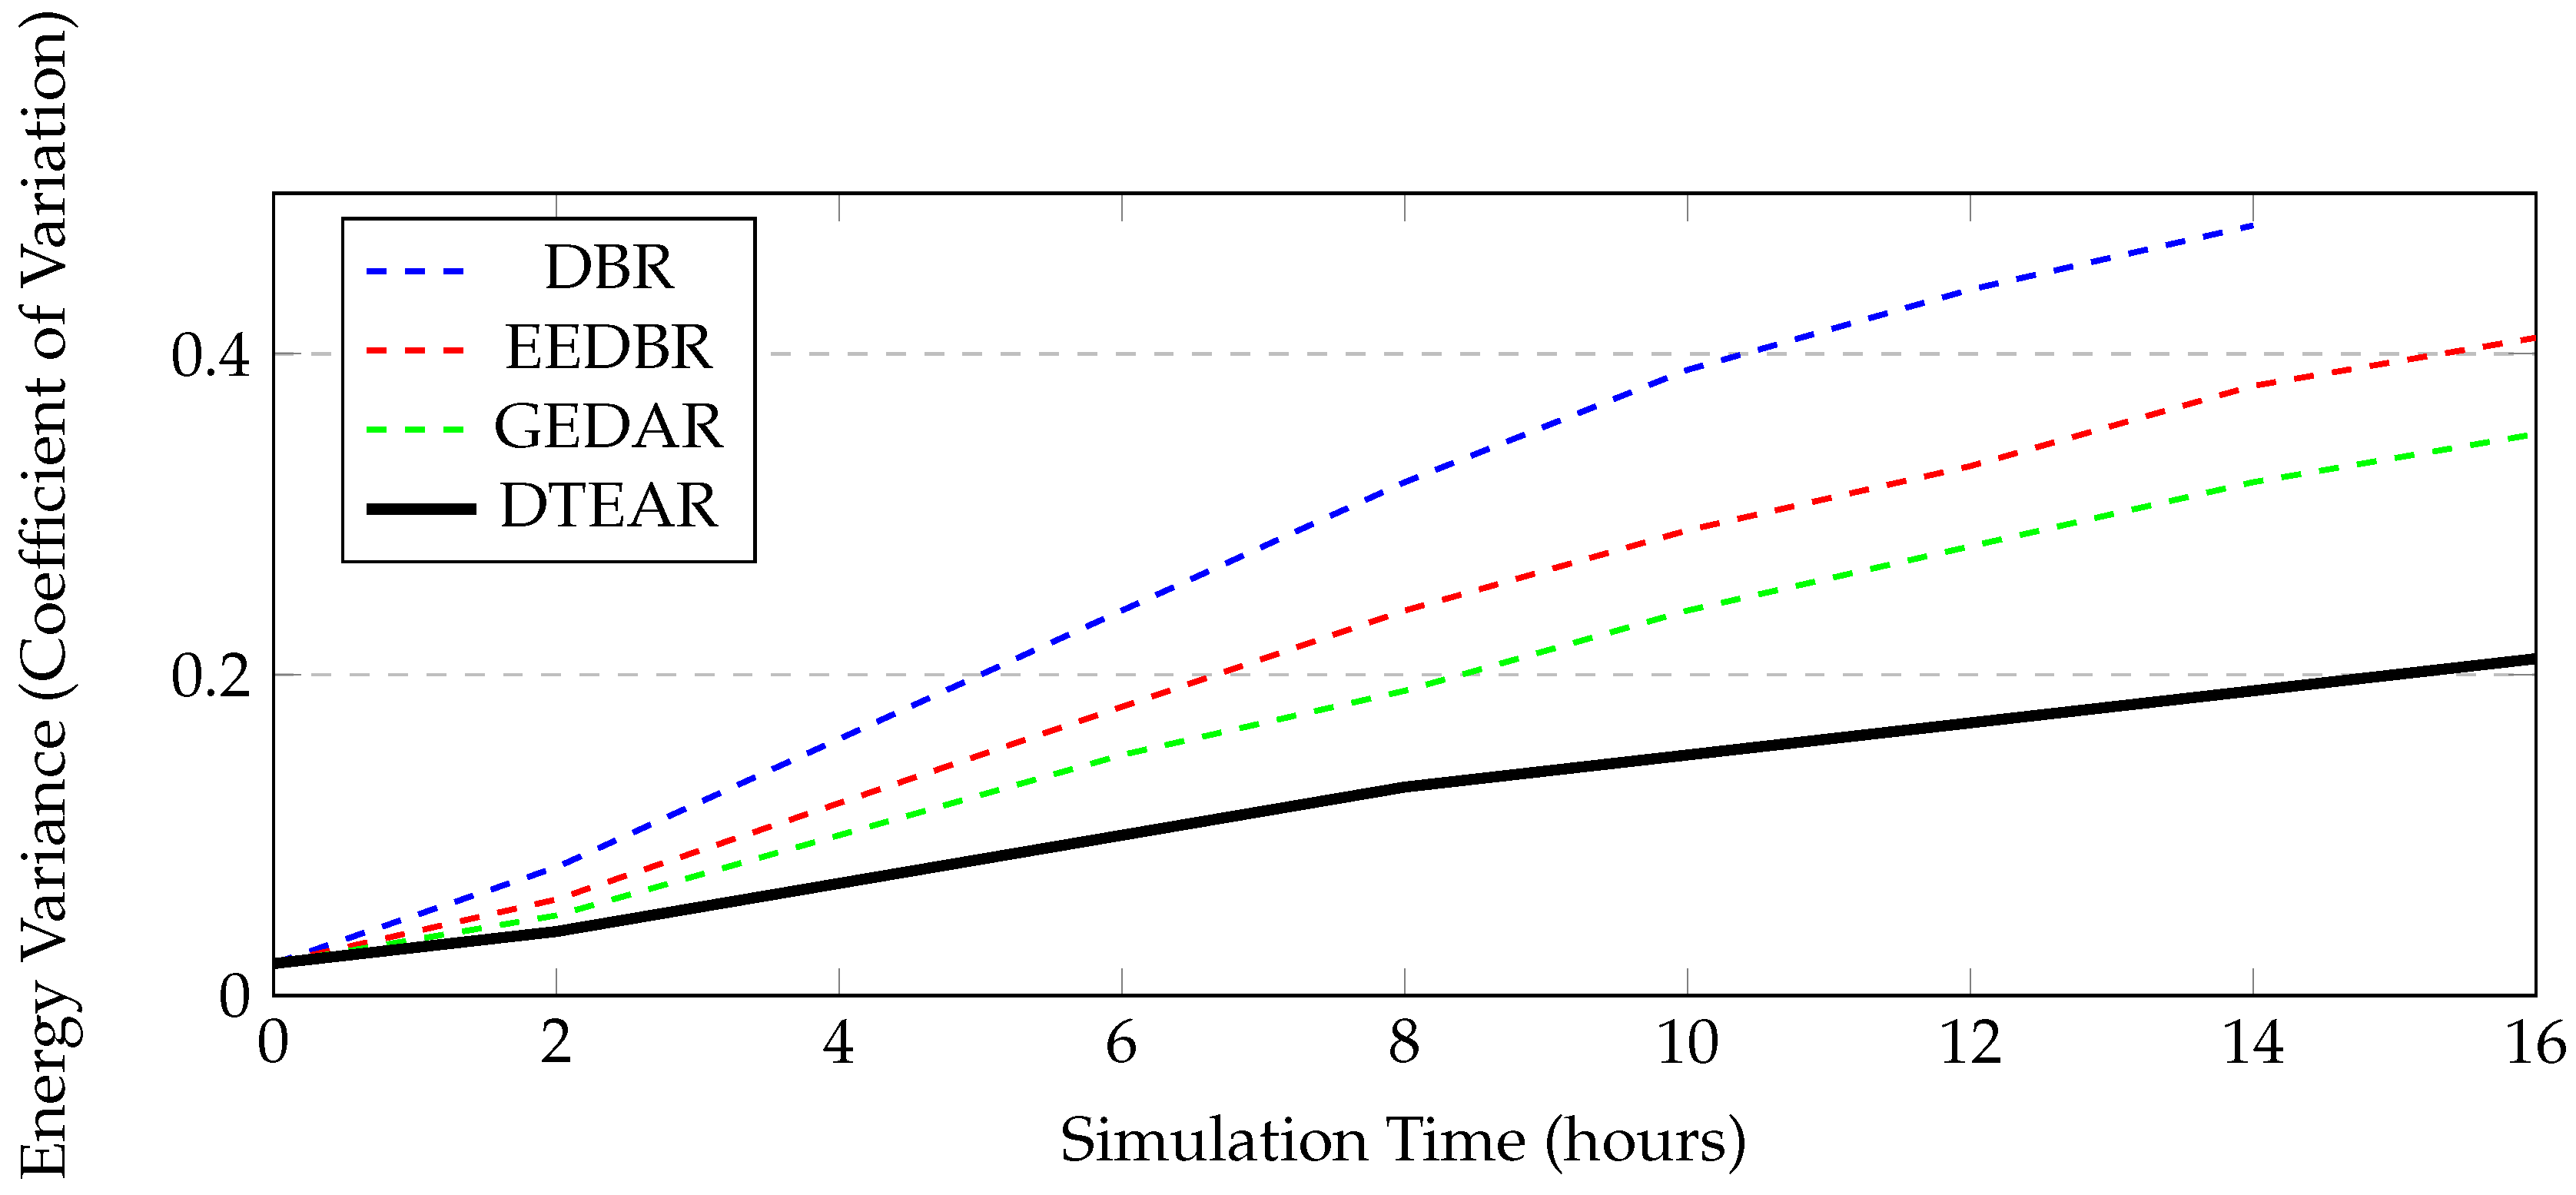
Figure 4.
Average end-to-end delay comparison (399 nodes, Static scenario).
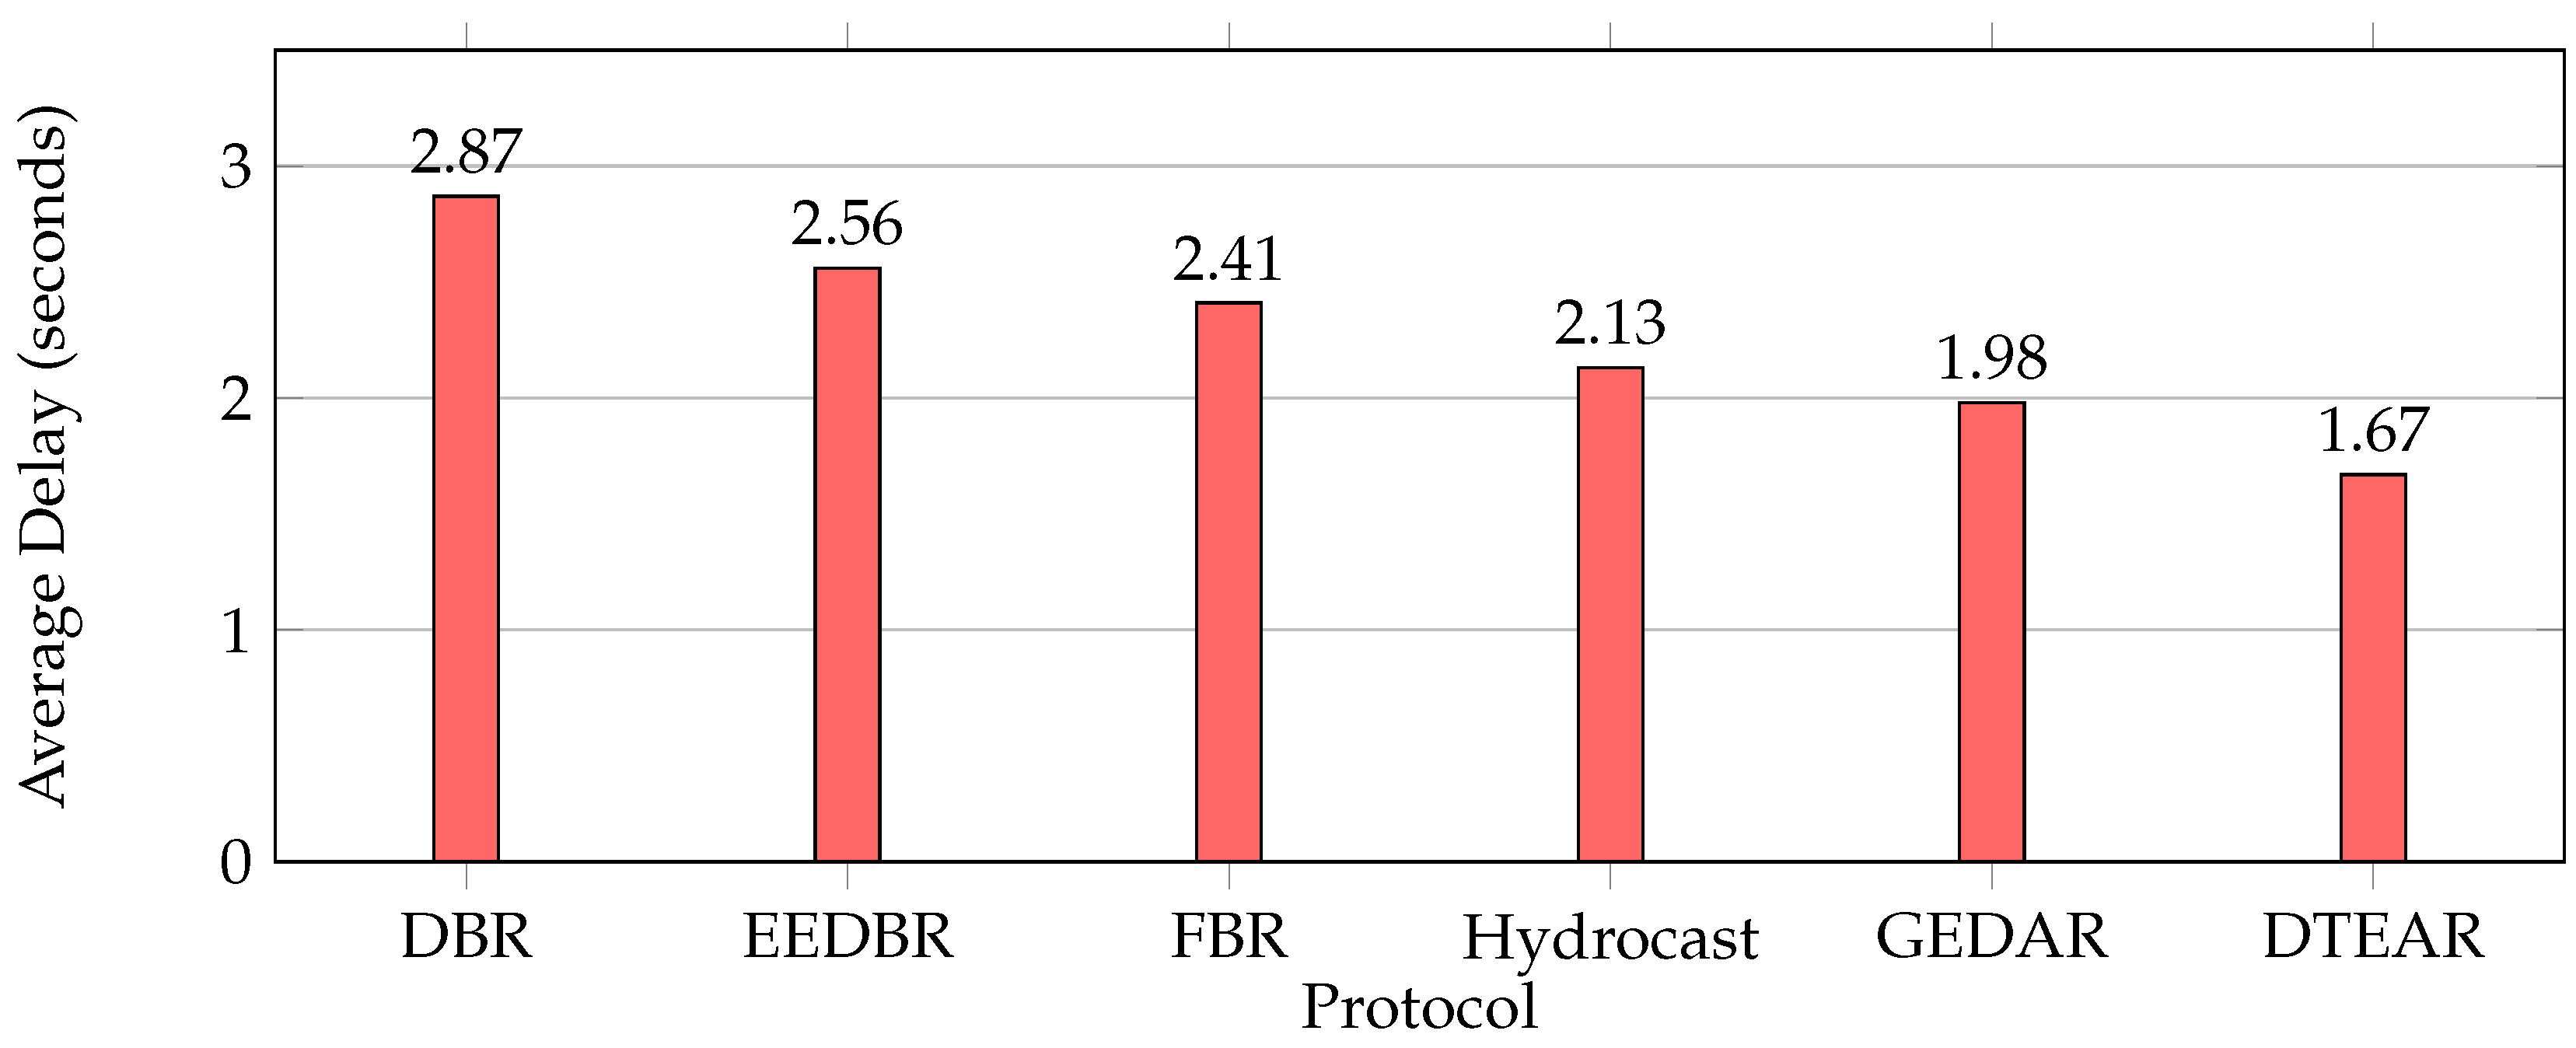
Figure 5.
Cumulative network throughput over time (399 nodes, Static scenario).
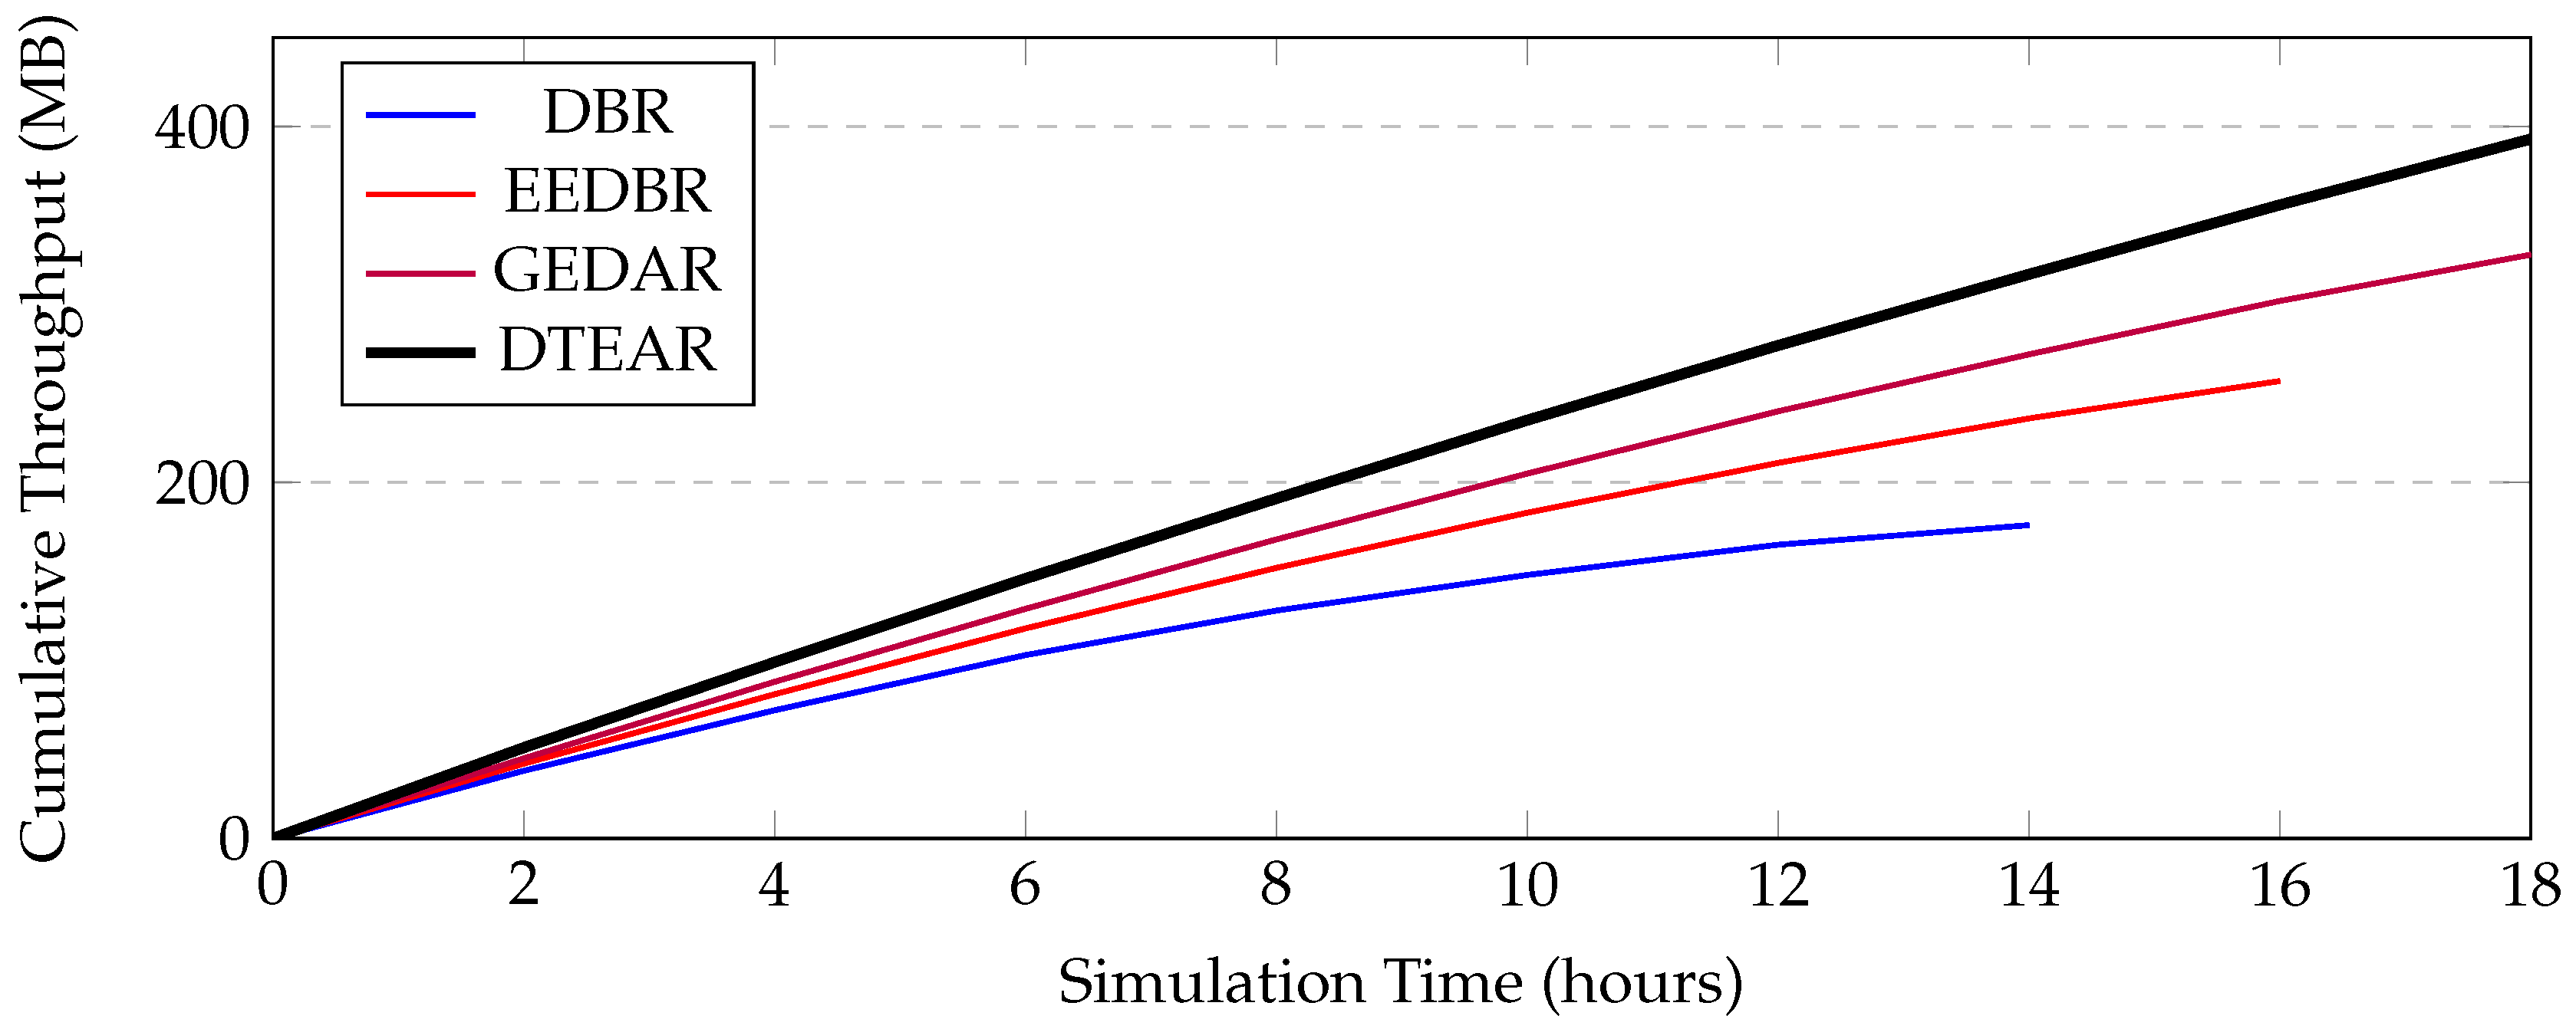
Figure 6.
Control overhead comparison including digital twin synchronization.
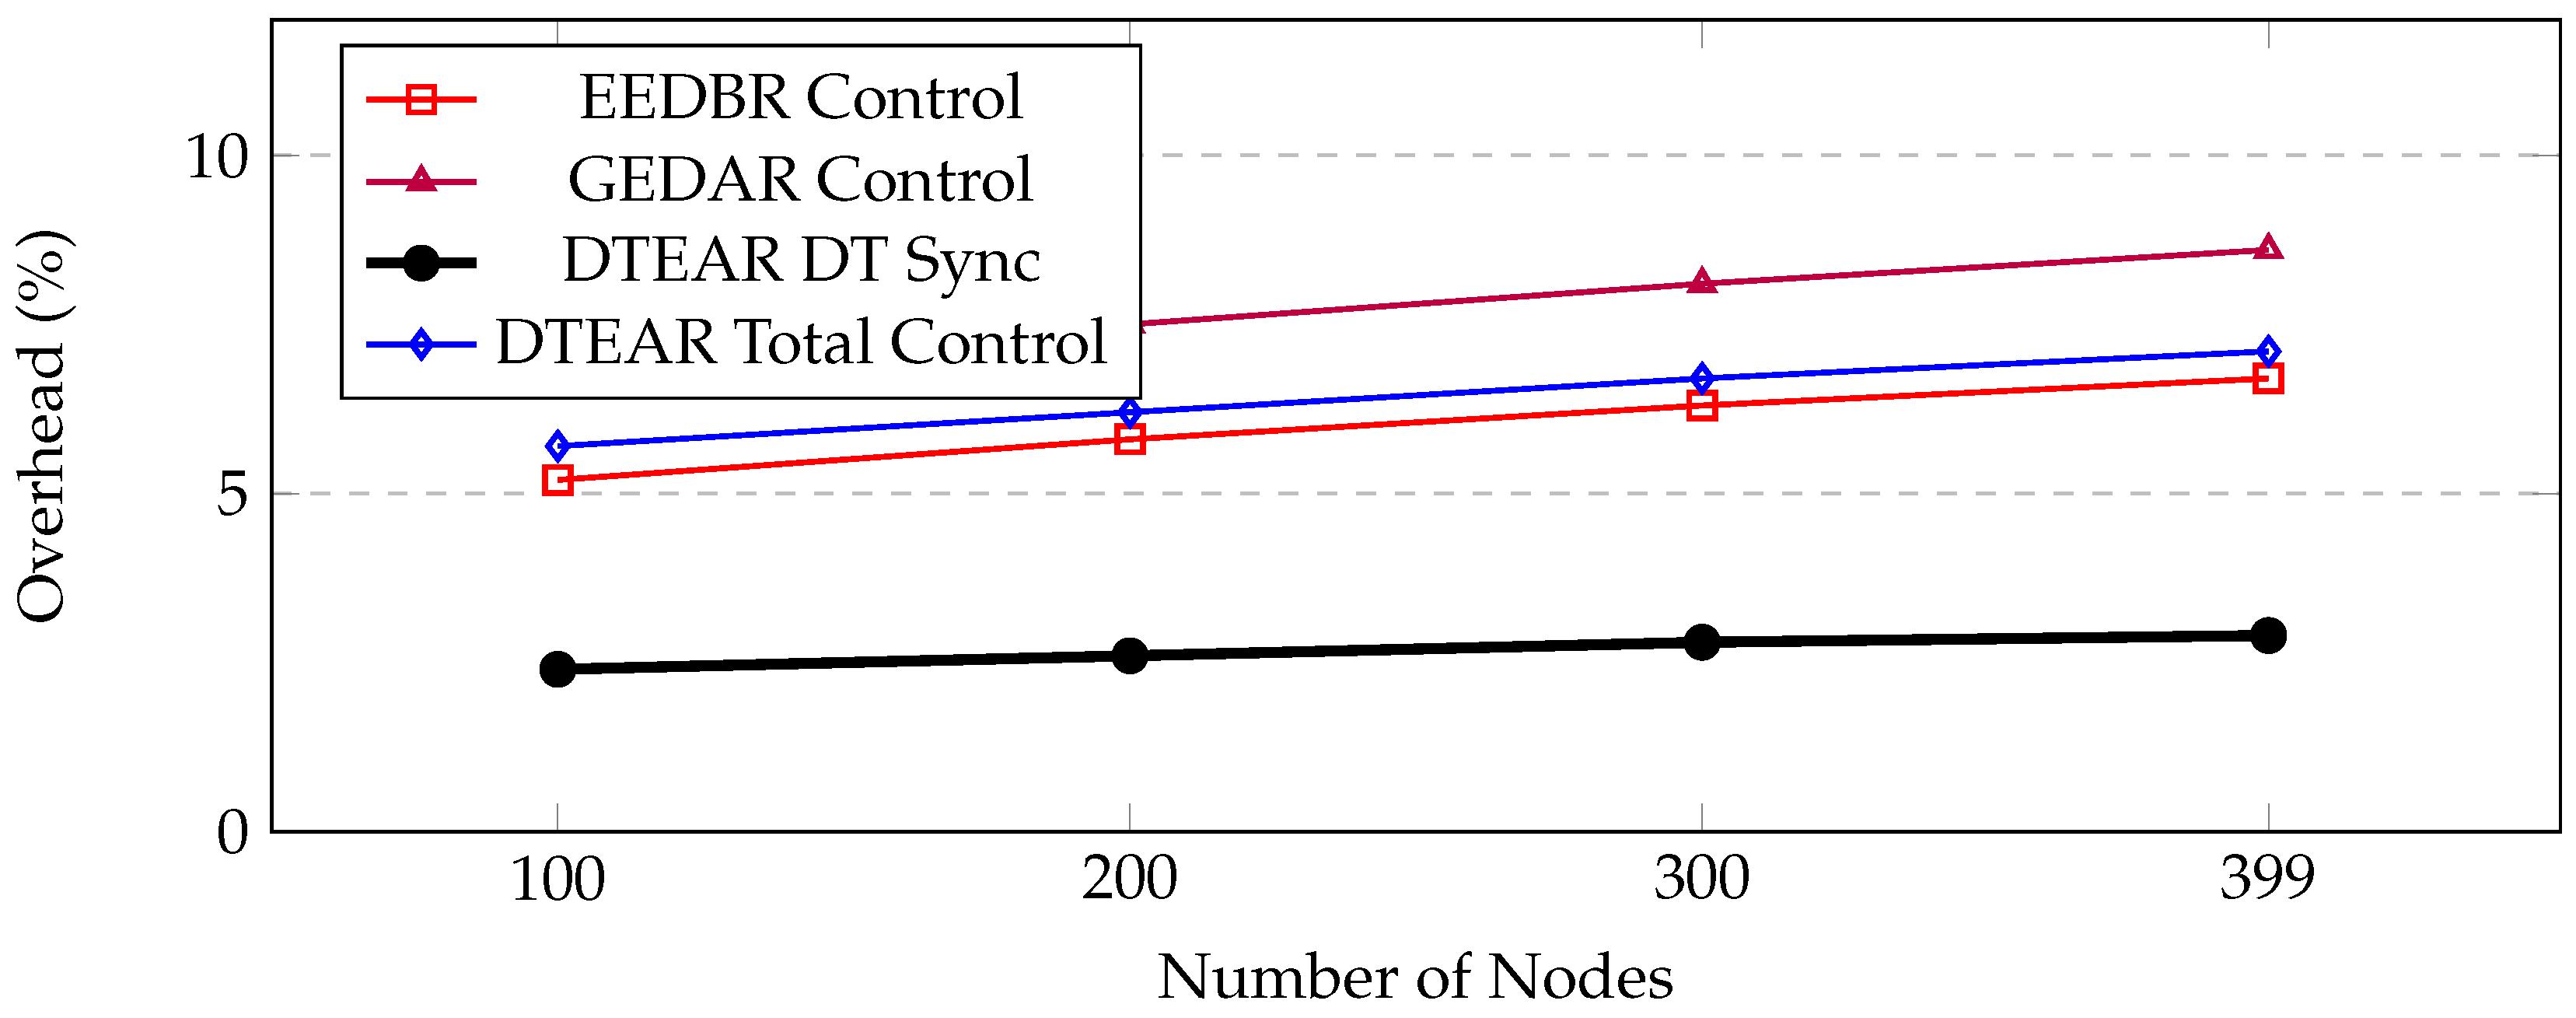
Figure 7.
Impact of node mobility on packet delivery ratio (399 nodes).
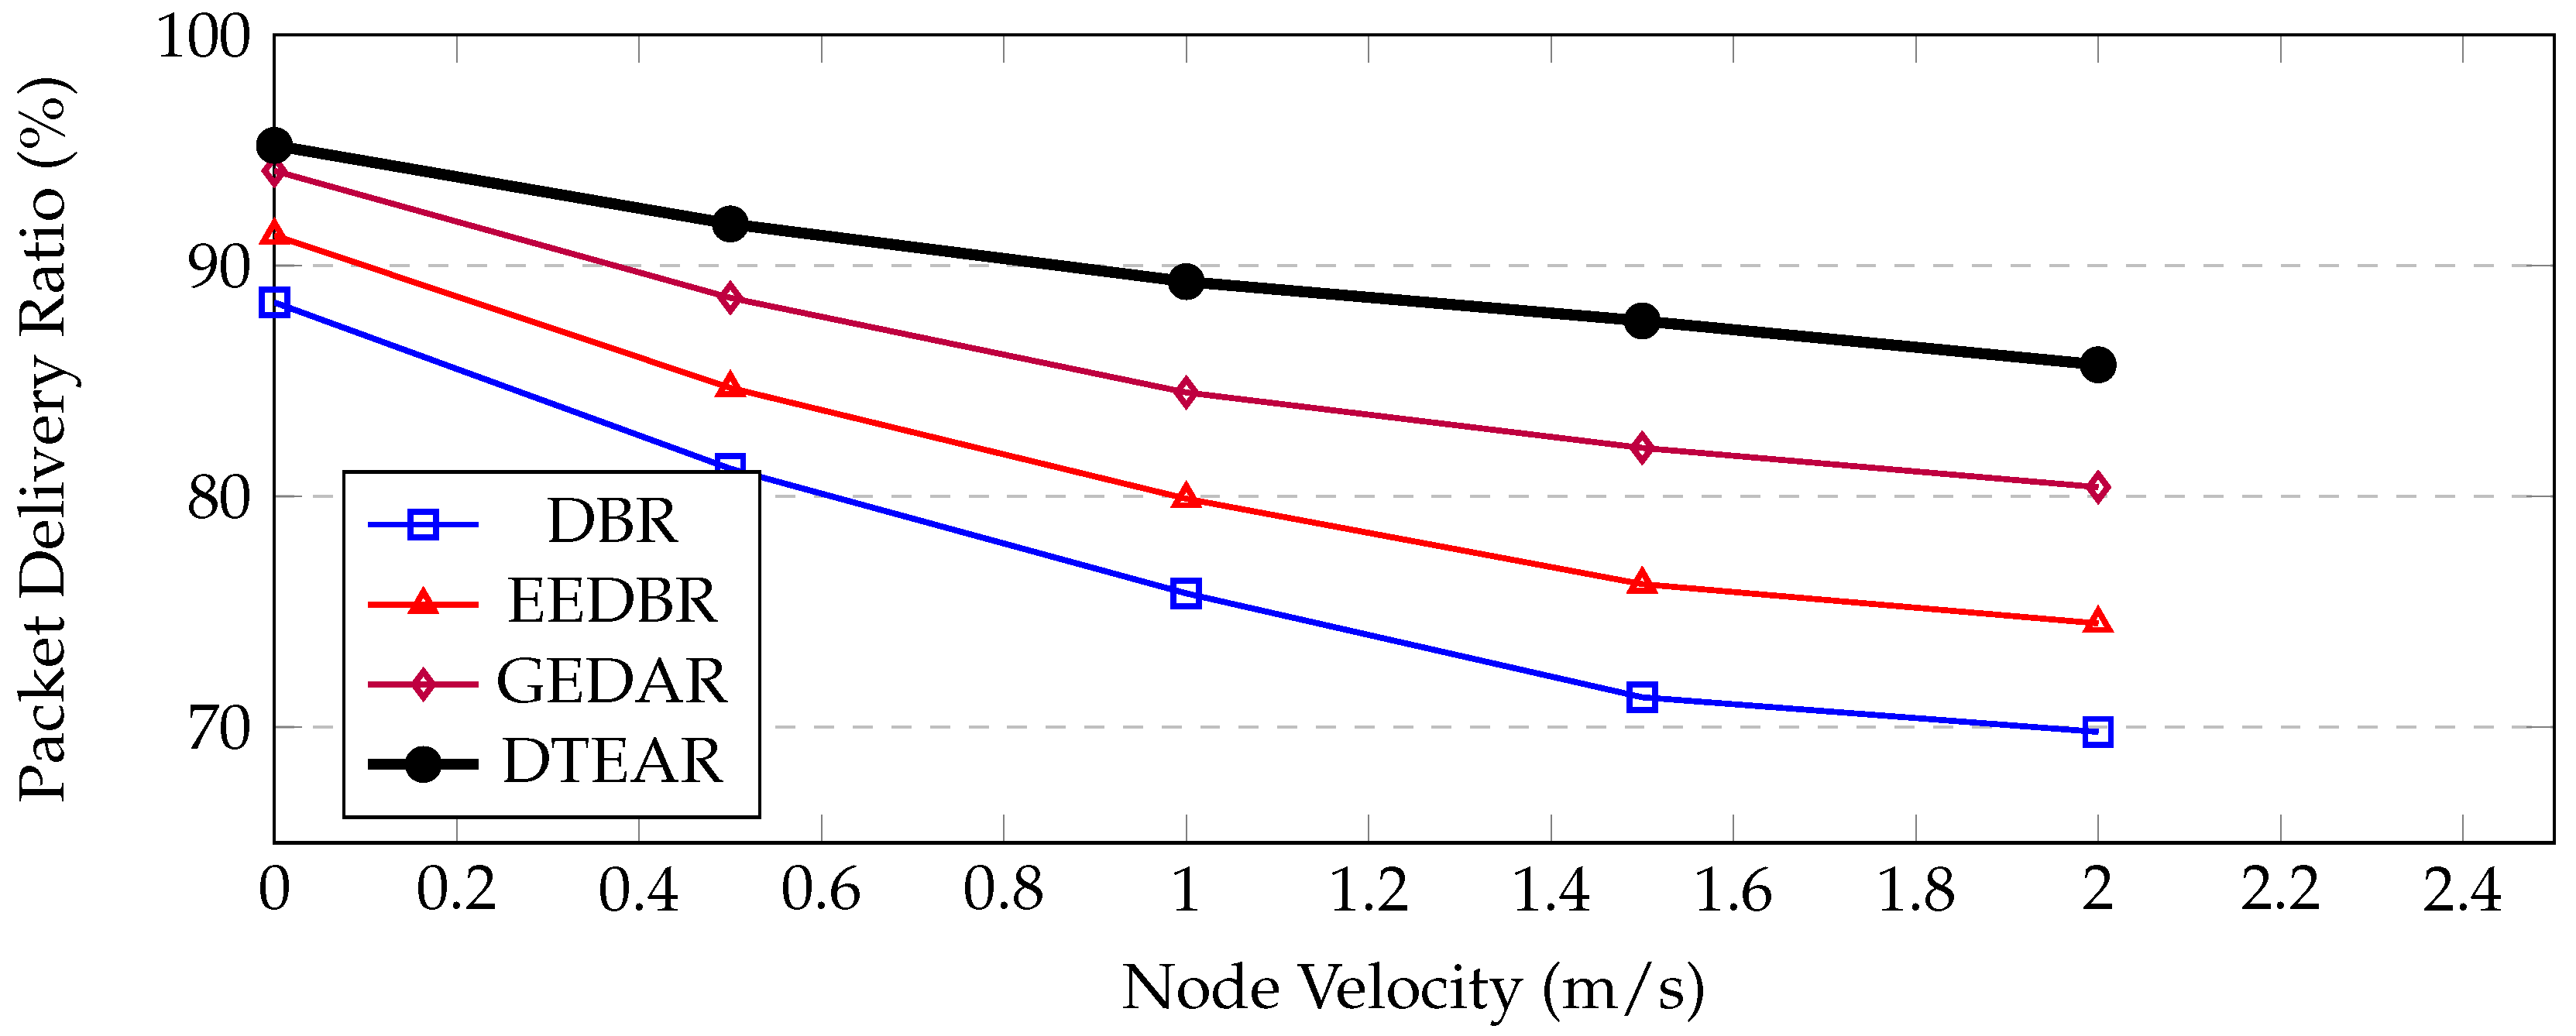

Table 1.
Detailed Network Lifetime Comparison (399 nodes, Static scenario).
| Protocol | FND (h) | HND (h) | LND (h) | Improvement |
|---|---|---|---|---|
| DBR | 10.3 ± 0.4 | 12.1 ± 0.5 | 14.5 ± 0.6 | Baseline |
| EEDBR | 12.6 ± 0.3 | 14.8 ± 0.4 | 17.3 ± 0.5 | +22.3% |
| FBR | 13.7 ± 0.4 | 16.1 ± 0.5 | 18.9 ± 0.6 | +33.0% |
| Hydrocast | 14.2 ± 0.3 | 16.8 ± 0.4 | 19.7 ± 0.5 | +37.9% |
| GEDAR | 14.8 ± 0.4 | 17.5 ± 0.5 | 20.6 ± 0.6 | +43.7% |
| DTEAR | 18.3 ± 0.3 | 21.9 ± 0.4 | 25.7 ± 0.5 | +77.7% |
Table 2.
Packet Delivery Ratio (%) Under Different Scenarios (399 nodes).
| Protocol | Static | Low Mobility | High Mobility |
|---|---|---|---|
| DBR | 88.4 ± 1.2 | 81.2 ± 1.5 | 69.8 ± 1.8 |
| EEDBR | 91.3 ± 1.1 | 84.7 ± 1.4 | 74.5 ± 1.7 |
| FBR | 89.7 ± 1.3 | 82.9 ± 1.6 | 72.1 ± 1.9 |
| Hydrocast | 93.6 ± 0.9 | 87.3 ± 1.2 | 78.9 ± 1.6 |
| GEDAR | 94.1 ± 0.8 | 88.6 ± 1.1 | 80.4 ± 1.5 |
| DTEAR | 95.2 ± 0.7 | 91.8 ± 0.9 | 85.7 ± 1.2 |
Table 3.
Scalability Metrics Across Network Sizes.
| Nodes | DT Update (ms) | Routing Decision (ms) | Memory (MB) | Convergence (s) |
|---|---|---|---|---|
| 100 | 12.3 ± 1.1 | 3.2 ± 0.3 | 4.5 | 28.1 ± 2.3 |
| 200 | 23.7 ± 1.8 | 5.8 ± 0.5 | 8.9 | 33.4 ± 2.8 |
| 300 | 36.4 ± 2.4 | 8.1 ± 0.6 | 13.7 | 37.2 ± 3.1 |
| 399 | 48.9 ± 3.1 | 10.5 ± 0.8 | 18.3 | 42.8 ± 3.5 |
Disclaimer/Publisher’s Note: The statements, opinions and data contained in all publications are solely those of the individual author(s) and contributor(s) and not of MDPI and/or the editor(s). MDPI and/or the editor(s) disclaim responsibility for any injury to people or property resulting from any ideas, methods, instructions or products referred to in the content. |
© 2025 by the authors. Licensee MDPI, Basel, Switzerland. This article is an open access article distributed under the terms and conditions of the Creative Commons Attribution (CC BY) license (http://creativecommons.org/licenses/by/4.0/).
Copyright: This open access article is published under a Creative Commons CC BY 4.0 license, which permit the free download, distribution, and reuse, provided that the author and preprint are cited in any reuse.


