Submitted:
03 November 2025
Posted:
05 November 2025
You are already at the latest version
Abstract
The transition from non-renewable to renewable energy sources has emerged as a pressing global issue, driven by concerns over climate change, resource depletion, and sustainable development. This study undertakes a comparative analysis of Canada, a nation rich in energy resources, and Bangladesh, an energy-scarce country, to understand their respective dynamics of energy transition. We examine data on energy production, energy consumption, policy frameworks, resource capacity, and economic impacts, highlighting the energy transition challenges faced by each country using an extensive survey of available literature and both univariate and multivariate time series analysis. Canada, with a diverse energy portfolio of renewable and non-renewable energy resources and with congenial policy implementations, including employment subsidies, feed-in tariffs, and emission reduction targets, exhibits potential for a relatively more straightforward energy transition. It has been making progress in that direction and targets to achieve net-zero emissions by 2050. However, despite progress, Canada faces challenges, including infrastructure limitations, regional disparities, and resistance from established energy sectors, which cause long delays in implementing projects. Bangladesh, with a limited amount of natural gas, relies entirely on imports to meet its energy demand. Its energy resources, both renewable and non-renewable, are minimal. Despite such limitations, it also targets to increase its renewable energy share to 40% by 2041 through targeted promotion of solar energy. However, such a target is more of an illusion than a reality as it has numerous limitations. The unavailability of sufficient natural resources, inadequate infrastructure, and financial and institutional constraints prevent the country from reaping the benefits of energy transition. Despite a preference for clean energy, coal consumption is still increasing. Nonetheless, public opinions in both countries lean towards clean energy and a better environment, but concerns about affordability and reliability persist, particularly in Bangladesh.
Keywords:
energy transition
; renewable energy
; Canada
; Bangladesh
; energy security
; energy policy
; fossil fuels
1. Introduction
1.1. Background and Context of the Study
Fossil fuels currently dominate the global energy landscape, driving economic activity across all sectors. This dependence on fossil fuels has resulted in significant environmental consequences. A vast body of research establishes a causal link between fossil fuel combustion and global warming (Castaneda, 2011; Nel, 2011; Rezai and Ploeg, 2017; Dincer, 2000; Hansen et al., 2001; Rashedi et al., 2020; Kivimaki et al., 2023; Mhadhbi, 2024). Global energy-related carbon emissions in 2019 reached 33.4 Gt CO2, accounting for approximately three-quarters of total carbon emissions worldwide (IEA, 2020b). These emissions contribute substantially to global warming and climate change, posing a severe threat to the planet. Furthermore, the finite nature of fossil fuels, coupled with uneven geographical distribution and volatile prices, necessitates a global transition from non-renewable to renewable energy sources in the energy sector. Global annual renewable capacity increased by almost 50 percent in 2023 to nearly 510 GW (IEA, 2025).
The massive growth of renewable energy in recent years has several reasons: the uncertain price and supply volatility of fossil fuels, the environmental impact of fossil fuel production and consumption, and concerns about the exhaustion of fossil fuels (Asad, 2024). Nonetheless, it is imperative that the world moves toward finding substitutes for fossil fuels, and renewable energy is the most promising option. Not all economies and regions are progressing at the same rate, which is not unexpected. Different economies have distinct issues, problems, and resource bases, so they require different policies and procedures for transforming the energy sector. The paper examines such potential transformations for energy-rich and energy-poor economies.
Globally, fossil fuels remain the principal source of energy. In 2021, 29.5%, 27.2%, and 23.6% of energy came from oil, coal, and natural gas, respectively, totaling 83.6% from fossil fuels (Our World in Data, 2023). Per capita energy supply continues to increase.
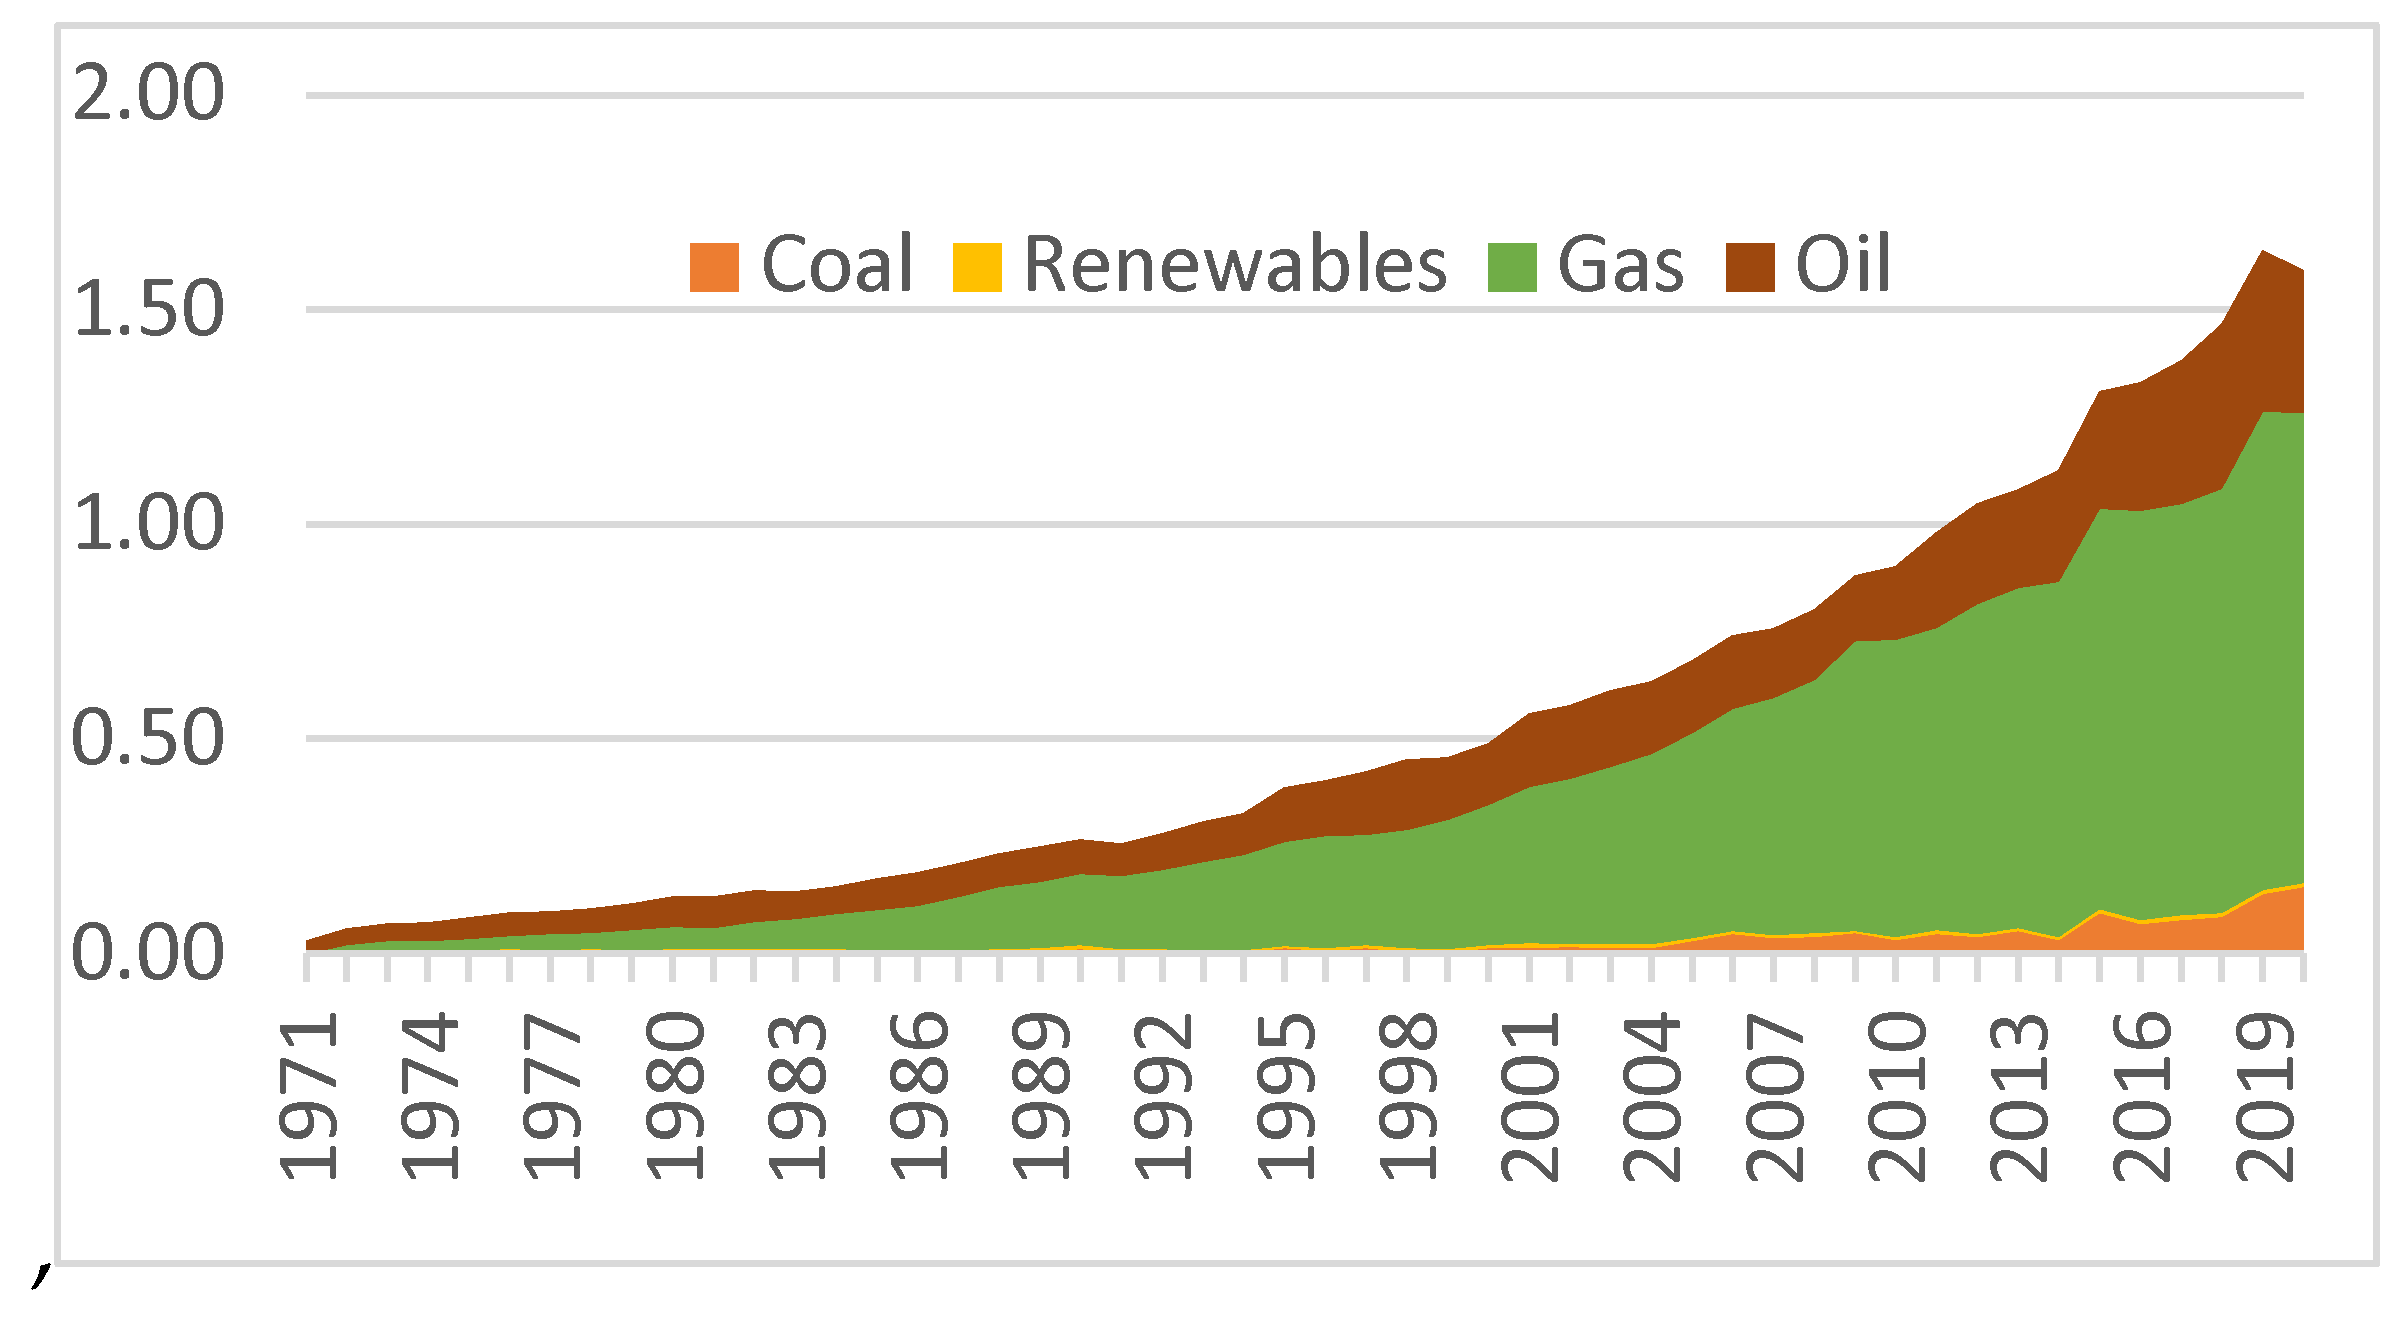
Currently, renewable energy constitutes nearly one-quarter of global primary energy consumption. Renewable energy sources accounted for 29.1 percent of global electricity generation in 2022 (IRENA, 2024). Renewable energy is contributing faster to electricity generation than fossil fuels. Not all renewable sources contribute at the same rate. Wind energy has exhibited the fastest growth during the last two decades, followed by solar energy (Figure 1).
However, significant disparities in energy production and access persist among nations, particularly between developed and underdeveloped nations (Pereira et al., 2025). Different countries are endowed with varying renewable and non-renewable energy resources, and not all nations have a similar capability to transition from non-renewable to renewable energy sources. Indeed, the trend in energy consumption varies across different economies and regions [Figure 2]. In this study, we plan to address the difficulties and challenges in energy transition faced by a developed country that is also energy-rich, namely Canada, in contrast to a developing country, Bangladesh, which is inherently energy-deficient but populous and experiencing consistent economic growth.
1.2. Research Objectives and Scope
This paper first tries to discern the evolving energy demand and supply trends in Bangladesh [an energy-deficient, populous, and developing country] and Canada [an energy-rich, sparsely populated, and developed country]. Through an extensive review of existing literature, we examine the dynamic shifts in the proportional contributions of diverse energy sources, both renewable and non-renewable categories, to both countries’ overall energy consumption and development landscape. Subsequently, we will attempt to forecast energy consumption and demand for non-renewable and renewable energy in each country up to 2035 based on economic progress. We conduct an extensive literature survey and employ univariate forecasting techniques, such as ARIMA, ETS, and Profit methods, for forecasting energy demand. Then, we examine the potential for transforming non-renewable energy sources into renewable energy, considering existing policies and capabilities.
The rest of the paper is organized as follows. Section 2 discusses the energy situation in Bangladesh. Section 3 focuses on the energy situation in Canada. Section 4 provides the methodological details, while Section 5 examines the transition potential of the respective countries. Section 6 concludes and provides some policy recommendations.
2. Energy Situation in Bangladesh
Bangladesh’s rapid population and high economic growth have made it one of the most energy-hungry economies in the world (Islam et al, 2023). Energy is considered one of the main driving forces of economic growth and development. While energy promotes economic growth, it also causes environmental problems by producing pollutants and generating greenhouse gases that contribute to global warming (Hossain and Tamim, 2007). Bangladesh’s energy sector remains heavily reliant on fossil fuels, particularly natural gas, imported oil, and coal, which account for most of its electricity production. As of 2024, less than 5% of the country’s electricity comes from renewable sources, primarily solar and one small hydroelectric dam (Payel et al., 2024). Although the government has set targets to increase renewable energy capacity, progress has been slow. In this section, we present the energy situation in Bangladesh in terms of its supply, demand, and potential transformation toward more renewable energy production and use.
2.1. Energy Supply in Bangladesh
Traditionally, the people of Bangladesh relied on firewood for cooking and heating their homes. Total energy supply (TES) encompasses all the energy produced in or imported into a country, minus that which is exported or stored (IEA, 2024a). It represents all the energy required to supply end users in the country. Some of these energy sources are used directly, while most are transformed into fuels or electricity for final consumption. Natural gas has become the predominant energy supply in recent years, as this is the only energy form available in Bangladesh. The remaining energy is imported from various countries. Figure 3 below illustrates the total energy supply and consumption of various energy resources. As Bangladesh is an energy-deficient economy, it relies substantially on imports, and all imported energy resources are consumed.
The supply of most energy forms continues to increase in Bangladesh. Figure 4 below illustrates the trend of the supply of various energy forms. Among these, natural gas, biofuel, and waste are domestic, while the rest are imported.
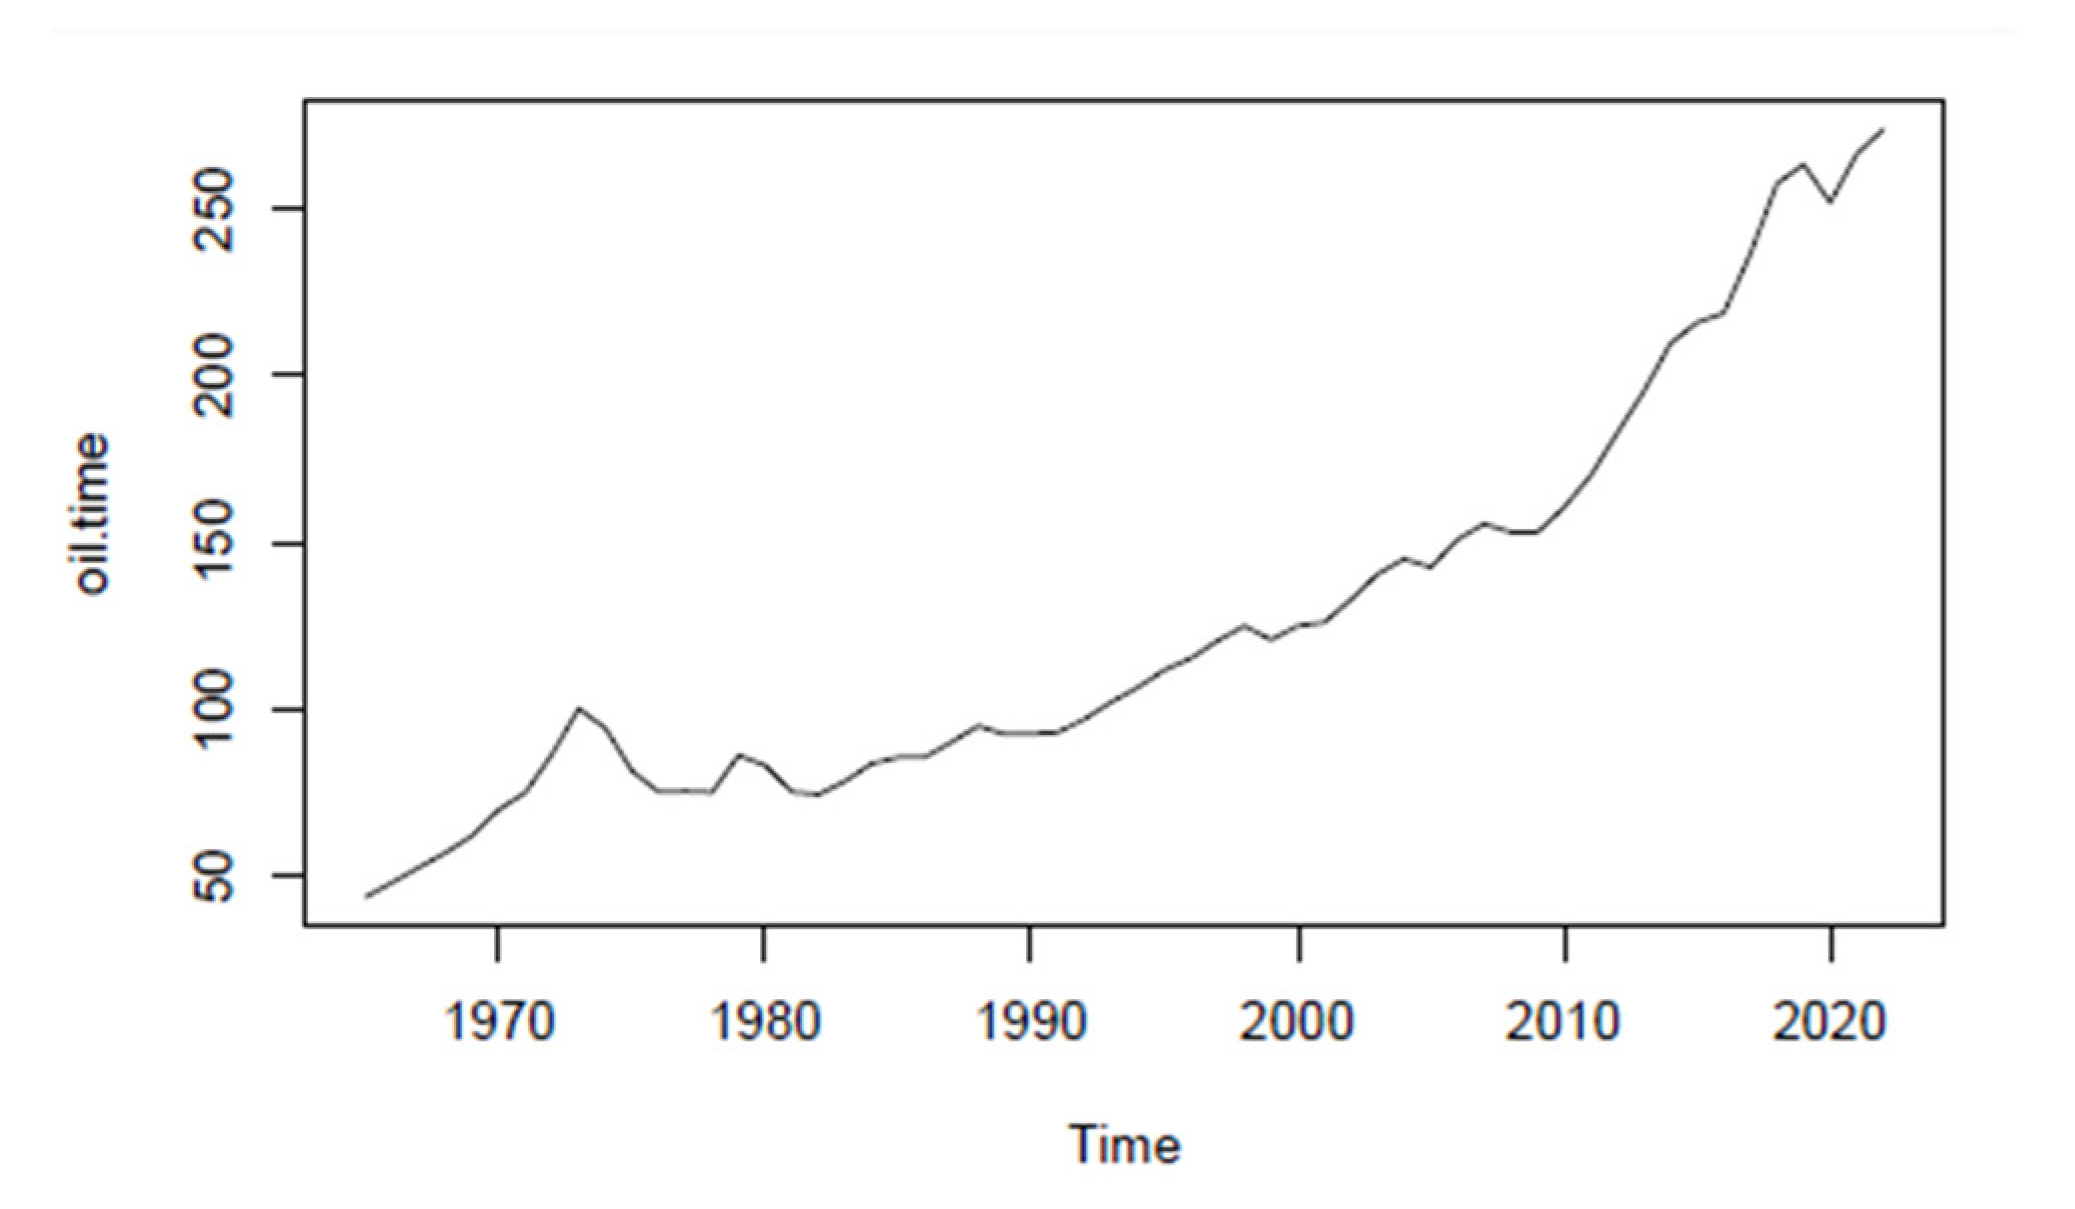
Natural gas is the only indigenous fossil fuel in Bangladesh. Natural gas exploration in Bangladesh began in the late 1800s, and several small gas fields were discovered occasionally. However, major natural gas extraction and supply to consumers did not happen until the 1980s, when natural gas reserves were at their highest. Natural gas production continued to increase until 2018, when the reserve was depleted to a point where sustained production at the existing high level became impossible (Figure 5). Production continued to increase after the turn of the century, but the reserves were being depleted sharply. Shetol et al. (2019) conclude that the existing gas reserves in Bangladesh will be depleted within a decade unless new reserves are discovered. With several explorations, both onshore and offshore, the possibility of natural gas reserve growth is low. In recent years, production has slowed down simply because of low reserves.
Natural gas was discovered by the Burmah Oil Company in 1955, and a test for commercial extraction was conducted in 1959. The Chhatak Cement Factory first used the natural gas produced at an early stage. In the same area, the Fenchuganj Fertilizer Factory started using natural gas from the Sylhet gas field. The first power generation from natural gas was achieved by the Siddhirganj Power Plant, which commenced operations around the same time on a small scale (Petrobangla, 2017). The scale of use remained small and restricted within a couple of factories (GoB, 2024).
With the shortage of biomass fuel, increasing urbanization, and improving income and living standards, the demand for natural gas increased, and eventually, natural gas began to be extracted from more gas fields and piped to the capital city, Dhaka, for domestic and other industrial use (Hasan and Liu, 2023). Natural gas is cleaner than other fossil fuels, such as oil and coal, and produces less carbon dioxide per unit of energy released. For an equivalent amount of heat, burning natural gas produces about 30% less carbon dioxide than burning petroleum and about 45% less than burning coal. Figure 5 below illustrates the annual production of natural gas, along with its reserves, since 1980.
As can be seen, natural gas production continues to increase, reaching a maximum in 2017 and then declining [Figure 5]. This is primarily due to the exhaustion of reserves, as reflected during the last two decades. The maximum reserve was estimated in the 1990s and has continued to decline since then. As of 2020, Bangladesh’s natural gas reserve is estimated at only 0.1 TCM (B.P., 2023).
Most of the gas reserves in Bangladesh are small and fragmented, having been discovered by different companies at various times. In 1993, there were 27 gas fields in the country with an estimated total reserve of 0.35 TCM, which increased to 0.90 TCM by 1990 (Shetol et al., 2019). In 2014, the number of gas fields grew to 26, but the reserve continued to decline (B.P., 2023). Many estimates predicted that Bangladesh’s natural gas reserves would be exhausted within a decade, unless substantial new gas fields were discovered offshore or in other locations.
2.2. Energy Demand in Bangladesh
As mentioned before, Bangladesh is one of the most energy-hungry countries in the world. Immediately after its independence, the total primary energy consumption (TPEC) increased from 0.17 Exajoules in 1972 to 1.64 Exajoules in 2019, an almost 10-fold increase (B.P., 2023). The growing population, shifting lifestyle, increasing per capita income, declining indigenous energy supply, and rising reliance on imported fossil fuels pose a significant challenge to energy security (Asad, 2024). With very limited domestic energy sources available, Bangladesh requires a comprehensive strategy to meet its increasing energy demand. Persistently plagued by serious environmental concerns, including severe droughts, floods, air pollution, and contaminated water supplies, resulting from its heavy dependence on fossil fuels, the Bangladesh government is currently formulating policies to promote the greater utilization of lower-carbon energy sources (GoB, 2024).
Per capita and total energy consumption in Bangladesh have increased since the country’s independence in 1972 (Figure 6). The downward trend for both series in 2020 is due to the COVID-19 pandemic, which may be considered an outlier. As an energy-deficient country, this poses a unique challenge as it must rely almost entirely on imports.
The natural gas consuming sectors in Bangladesh are (i) Power generation, (ii) Industrial use, (iii) Fertilizer production, (iv) Captive power generation, (v) Domestic household use, (vi) Commercial or business use, and (vii) Transportation of motor vehicles (CNG – clean natural gas). The power and industrial sectors are the largest consumers of natural gas, accounting for 43 percent and 17 percent, respectively (Petrobangla, 2017). Nonetheless, per capita, primary commercial energy consumption in Bangladesh is still one of the lowest in the world.
Examining the energy consumption mix for Bangladesh, we find that the most significant increase is in natural gas, the only domestic fuel that is expected to expire soon. Natural gas accounts for around 75% of the commercial energy consumption in Bangladesh.
Figure 7.
Energy consumption by source in Bangladesh [Data Source: B.P., 2023].
Bangladesh was primarily an agricultural economy, with a significant share of its GDP coming from the agricultural sector (59.61% in 1972), steadily declining to 11.61% by 2021-22 (BBS, 2023). The economy has undergone a significant shift in its production sectors, transitioning from agriculture to manufacturing and services, which has contributed substantially to the increasing energy demand. This demand continues to grow and evolve in tandem with economic development (Islam et al., 2022).
Bangladesh’s total primary energy consumption increased from 0.06 Exajoules in 1972 to 1.64 Exajoules in 2019, a considerable expansion (B.P., 2023). Interestingly, the growth in per capita energy use, from 0.09 Gigajoules in 1972 to 10.1 Gigajoules in 2019, exceeds that of total energy use (BP, 2023).
With the rapid economic growth in Bangladesh, the energy requirement is expected to keep increasing. Amin et al. (2021) recently highlighted that industries face a constraint due to inadequate electricity supply. In fact, load-shedding [electricity rationing] is a well-known phenomenon in Bangladesh. The challenge of securing adequate energy in line with the requirements of economic growth is a cause of concern for a country like Bangladesh, as it is highly dependent on imported energy and is becoming increasingly reliant on imports.
Intra-sectoral transformation in energy use contributed significantly to increasing energy demand. For example, increased mechanization in the agriculture sector boosts energy demand (Islam et al, 2022). In recent years, machinery used in agricultural practices, such as irrigation, land preparation, intercultural operations, and threshing, has become widespread (Hossen et al., 2020). This trend, as noted by Hossen et al. (2020), underscores how technological advancements within a single economic sector can lead to substantial increases in overall energy requirements.
The use of energy in the industrial sector has also been transformed by replacing biological energy [human power] with mechanical energy supplied through fossil fuels and electricity. Much of the construction, manufacturing, and transportation activities have now been automated, replacing human and animal power with mechanical power (Raihan and Khan, 2000). This process is ongoing, and the rate of increase is expected to accelerate even further in the future.
The use of energy is a key indicator of social, economic, and infrastructural development, as well as the standard of living. The extent of energy consumption is often related to economic development [growth of GDP] and the lifestyle of a society (Zhixin and Xin, 2011). Although the relationship between energy consumption and economic growth has not been without dispute, it is well accepted in the scientific community that they are interlinked. The demand for energy is expected to continue increasing with Bangladesh’s economic development. Over the past few years, total energy consumption in Bangladesh has increased by over 10 percent annually (BBS, 2021). Electricity consumption per capita in Bangladesh in 2019 was 488 kWh, compared to an average of 3,316 kWh worldwide (Our World in Data, 2021), which is only 15 percent of the global average. Economically well-off countries consume more energy than poor countries. For example, in 2019, Canada’s per capita primary energy consumption was 388.24 gigajoules, whereas Bangladesh’s was 36.89 gigajoules (B.P., 2023). This clearly indicates that with rapid economic growth in Bangladesh, the demand for energy consumption will continue to grow at an increasing rate.
Along with the increase in GDP, the mode of energy consumption changes. Mujeri et al. (2014) observe that in developing countries, energy consumption rises rapidly when per capita income reaches between $1,000 and $10,000. Accordingly, Bangladesh’s energy demand is expected to increase quickly as its current per capita income is within this range. This situation is compounded by rising population density and rapid urbanization. The urban population increased from only 2.6 percent in 1911 to 28.0 percent in 2011, with a much higher rate in recent years (BBS, 2015b), reaching 38.18 percent in 2020 (World Bank, 2021). Indeed, considering population density, nearly the entire country has become urban. The population density in Bangladesh is 1,123 people per square kilometer, compared to 25 globally and 36 in the USA (World Bank, 2021).
Electricity coverage has increased rapidly from 72 percent of the population to 97 percent during 2015 – 2020 (GoB, 2020). In 2019-20, nearly 92.2% of the total population was reported to have access to electricity (Our World in Data, 2021). However, such access is far from secure, as load-shading and electricity rationing are regular phenomena in Bangladesh. Domestic electricity use, primarily for lighting, heating, cooling, and other purposes, remains the largest consumption sector (Figure 8). This is an indication of the success of the rural electrification effort and a change in lifestyle.
The increasing demand for electricity, and consequently, the raw materials used in its production, is expected to continue in the years to come. Continuous increases in income and affordability, resulting in an improved lifestyle, will require more and more energy. It is also worth noting that as a country develops, it typically transitions from an agriculture-based to an industry-based to a service-based economy (Islam et al., 2023). Bangladesh is on a trajectory of such development, and the trend is likely to continue, coupled with sustained increases in energy demand.
2.3. Significance of Transition to Renewables
Transforming Bangladesh’s energy sector from non-renewable to renewable sources is crucial on both the scarcity and environmental fronts. Bangladesh is inherently deficient in fossil fuels like coal, oil, and natural gas. The amount of natural gas Bangladesh has is expected to run out soon, as depicted in the energy supply subsection. On the second front, from a global warming perspective, Bangladesh, although not a significant contributor, repeatedly confronts the impacts of climate change–including heatwaves, tropical cyclones, floods, and droughts (Huq et al., 2024). Therefore, it is prudent to become involved in clean energy production and consumption as much as possible. This subsection will examine the potential for different renewable energy production in Bangladesh. Several researchers made an effort to explore the potential from engineering, social, and economic points (Arafat and Chowdhury, 2013; Islam et al, 2014; Halder et al., 2015; Baky et al., 2017; Bosu and Rafiq, 2019; Uddin et al., 2019; Gulagi et al, 2020; Siddique et al, 2021; Mahmud and Roy, 2021; Shufian et al., 2022; Hossain et al., 2023; Rahman et al., 2024; Sultana and Islam, 2024).
Although Bangladesh is not a significant greenhouse gas-producing nation, due to its geographical location, it bears a disproportionately higher cost of global climate change, resulting in frequent flooding, cyclones, and droughts (Huq et al., 2024). However, its CO2 production has continued to increase. From 1972 to 2017, per capita CO2 production increased from 0.05 tons to 0.50 tons (Our World in Data, 2021). Much of the CO2 emissions comes from agriculture, but the energy sector plays an increasingly higher role. From 2010 to 2020, the consumption of coal in Bangladesh increased from 0.03 Exajoules to 0.15 Exajoules (B.P., 2021), representing a 400% increase over the decade. Because of a rapid rise in energy demand, Bangladesh has had to find energy from every possible source. Recently, with increasing concern about the environment, several studies (Islam et al., 2008; Arafat and Chowdhury, 2013; Baky et al., 2017; Bosu and Rafiq, 2019; Alam et al., 2020; Masud et al., 2020; Bhuiyan et al., 2021) focused on the potential for renewable energy in Bangladesh. Over the past several years, efforts to produce and use renewable energy have grown.
Research and development on examining the potential for renewable energy in Bangladesh to meet its energy demand are ongoing. Siddique et al (2021) provide a review of the renewable energy sector in Bangladesh, and Mahmud and Roy (2021) give barriers to overcome in accelerating renewable energy. Bangladesh has varying potential for different renewable energy sources, including solar, wind, Biomass, hydro, tidal, geothermal, waste, ocean wave, etc. (Arafat and Chowdhury, 2013; Islam et al., 2014; Halder et al., 2015; Baky et al, 2017; Bosu and Rafiq, 2019).
Bangladesh has the potential to transition to renewable energy generation from various sources, but it has made modest progress in this direction. Technological advancements, combined with social and economic motivations, have contributed to the shift toward renewable energy and a reduction in fossil fuel use. This subsection examines various renewable options, including solar, wind, biomass, hydro, hydrogen, nuclear, tidal, and other sources.
2.3.1. Solar
Bangladesh has moved relatively extensively toward developing and adopting solar technology in recent years. It exhibits semi-tropical weather, as it is situated in the northern hemisphere, within 20.30–26.38 degrees north latitude and 88.04–92.44 degrees east longitude. On average, it receives sunlight for more than 70 percent of the time in a year (Shariar et al., 2011). The average sunshine hours are 6.69, 6.16, and 4.81 in winter, summer, and monsoon, respectively (Bahauddin and Salahuddin, 2012). Bangladesh receives 4–6.5 kWh/m2 of solar radiation daily (Halder et al., 2025). Therefore, there exists considerable potential for expanding solar energy in Bangladesh, and indeed, as we have seen before, solar energy in Bangladesh has expanded significantly. Solar energy is used in two ways: thermal route – heat from solar energy to use for various purposes, like home heating, water purification, power generation, etc., and photovoltaic route – used for lighting, pumping, and power supply in many rural areas, where grid electricity is either not available, or not reliable if available (Kumar et al., 2010; Baky et al., 2017).
Most of the solar energy in Bangladesh is generated and used through the solar home system (SHS), which uses solar panels on rooftops to convert sunlight into electricity for household use. Beginning in 2003, the system has provided over 4.1 million SHS by 2018. The total solar P.V. capacity installed was 163 MW (Cabraal et al., 2021). The SHS Program was economically justifiable from both the national and global perspectives, with an EIRR of 20 percent without considering global emission reduction benefits and 25 percent with them, based only on benefits from savings in kerosene/grid electricity costs for lighting (Cabraal et al., 2021). It provided electricity services that were adopted by rural households cost-effectively and with net benefits to all participants except kerosene dealers, while also reducing kerosene consumption by 4.4 billion liters and reducing greenhouse gas (GHG) emissions by 9.6 million tons. The SHS program expanded until 2013 and then slowed down, primarily due to the availability of electricity through the electric grid and the government’s shortage of loan programs (Cabraal et al., 2021). This is an indication that a sustained support system is required. Commercial and residential buildings also feature rooftop solar systems to meet their electricity requirements. In rural areas, solar water heating systems, solar-powered drinking water systems, solar irrigation, and solar charging systems are becoming popular (Baky et al., 2017).
Solar energy is the most abundant and promising renewable energy resource for Bangladesh (Table 1). It has the highest potential for providing energy through two routes: thermal and photovoltaic. Although Bangladesh is a subtropical country and home heating is not a general requirement, the thermal route can provide heating during winter, water purification, and power generation. The photovoltaic route is more important for Bangladesh, as it can produce electricity that can be used for nearly anything – from lighting to powering equipment. In recent years, the SHS has gained popularity among households, and numerous national and international organizations have emerged to promote solar energy development in Bangladesh (Hossain et al., 2023). Several solar park projects have been completed, while others are ongoing, and some are still in the planning stage (BSREA, 2025). However, there is still room for continuous improvement, and solar energy production is expected to grow further.
2.3.2. Wind
Wind energy is one of the world’s fastest-growing renewable energy production systems. However, in Bangladesh, the potential of wind energy is relatively limited, except in some coastal areas (Islam et al., 2014; Baky et al., 2017). Bangladesh has a coastline of over 700 km with some potential for harvesting wind energy. Some efforts have been made to harvest wind energy in the southeastern coastal area [Feni and Kutubdia districts]. However, episodic natural calamities (such as cyclones), insufficient wind speed during calm weather, and inadequate investment capacity do not make it feasible to have a large-scale wind energy harvest in Bangladesh. An extensive and highly technical survey conducted by USAID and the Energy Research Laboratory of the United States, in collaboration with the Government of Bangladesh, estimated that wind energy alone could meet the country’s 10 percent renewable energy target (Jacobson et al., 2018). However, such studies did not consider many risk factors, and the country’s wind energy production remains in its infancy; the 10 percent renewable energy production target is far from reality. Moreover, further research on physical ability, considering all risk factors, and the economic feasibility needs to be conducted before concluding the true potential of wind energy in Bangladesh.
2.3.3. Biomass
Historically, the people of Bangladesh relied on bio-energy sources for heating (cooking), transport, and other purposes. Before independence in 1971, only about 3% of the people of Bangladesh had access to some form of electricity. The country was primarily rural and agriculture-based, utilizing energy from plant sources (fuelwood), animal sources (draft power), and manual labor (for all agricultural activities). Even today, Biomass remains a prominent source of energy in most developing countries, especially for rural populations (WBA, 2024). Biomass fuels are principally supplied from trees around homesteads and/or other secondary plantations and natural forests.
The overexploitation of forest resources has made biomass fuel scarce, and the change in lifestyle of most of the population has increased the demand for fossil fuels (de Goncalves et al., 2021). Some non-bio energies were used in marine transportation (river-current, wind-sail) and coal-fired steam engines in railway and marine transportation. With the transformation of the world’s primary energy source from coal to liquid oil, Bangladesh began modernizing its energy sources to use oil and gas.
Historically, Bangladesh has used biomass fuel, which is renewable, storable, and transportable. It remains a vital energy source for rural populations, particularly for cooking and heating. However, its importance is waning primarily due to the lack of availability and changes in lifestyle. Bangladesh has a significant amount of biomass resources due to its year-round congenial growing environment, characterized by a warm and humid climate that supports fast-growing plants. Biomass sources include agricultural, forest, animal, and human manure, as well as municipal solid waste (Halder et al., 2014; Huda et al., 2014). Despite a dramatic reduction in natural forest areas, forest biomass remains significant due to plantation forests and trees established through agroforestry or social forestry, as well as plantations of trees around homesteads. Both animal manure and municipal solid waste continue to increase due to the commercial farming of animals and poultry, as well as the rise of urbanization. Halder et al. (2014) argued that biomass energy resources have both advantages and disadvantages. Still, with the use of appropriate technology and policy, biomass resources can make a significant contribution to meeting the future energy challenge in Bangladesh. Masud et al. (2019) seconded the argument, stating that biomass has the capacity to contribute to the adaptability of the UN’s Sustainable Development Goal 7, an aspiration to ensure affordable, reliable, sustainable, and modern energy for all people.
2.3.4. Hydro
Bangladesh is a land of rivers carrying over 1.4 trillion cubic meters of water every year (Siddique et al., 2021). However, the river flow is not conducive to developing hydroelectric dams as the country is relatively flat, and a dam can cause a considerable area to be flooded upstream, leading to water shortages downstream. In addition, the water flow is uneven. During the monsoon season, the rivers become filled with water and sometimes overflow their embankments. However, during the dry season, the rivers lack sufficient water to generate hydroelectricity. Bangladesh’s primary hydropower facility is the Kaptai Hydroelectric Power Plant, with a total capacity of 230 MW, consisting of two 40 MW and three 50 MW turbines (BPDB, 2024).
Since Bangladesh does not have a water flow system to create a large-scale hydroelectricity production capacity, it can resort to a mini [small-scale] hydroelectricity production facility (Halder et al., 2015). Globally, small-scale hydropower has become prevalent and acceptable due to its simplicity, low cost, reliability, and environmental sustainability (Karki, 2024; Retscreen International, 2004). In Bangladesh, both the Bangladesh Power Development Board and the Sustainable Rural Energy project under the Local Government and Engineering Department examined the potential for a mini-hydro facility. The table below shows the potential sites identified by Sustainable Rural Energy (Wazed and Ahmed, 2008; Miskat et al., 2021).
2.3.5. Geothermal
Bangladesh has limited potential for exploring geothermal energy as it is not on active tectonic plates. However, further investigation is needed. There are a few thermal gradient sites in Bangladesh where geothermal energy can be harnessed to generate electricity (Hasan et al., 2013; Mamun et al., 2024). However, in-depth knowledge is required to assess geothermal energy. The government approved a 200 MW geothermal project in Thakurgaon and Habiganj (Mamun et al., 2024). More efforts should be made by the government and the private sector to evaluate the potential of geothermal energy, allowing this resource to be utilized effectively.
2.3.6. Tidal Energy
Tidal energy is produced from the natural tide - surge and fall of the ocean water level due to the tidal rise and fall. Bangladesh has access to the Bay of Bengal, which receives semi-diurnal tides. Arafat and Chowdhury (2013) state that Bangladesh has a 740-kilometre coastal belt with a regular tidal range of between two and eight meters. Given the difference in water levels between the rise and the fall on a diurnal basis, Bangladesh can potentially harvest substantial energy through low-head tidal and medium-head tidal movement technologies (Arafat and Chowdhury, 2013). As the coastal area of Bangladesh is uneven and there are plenty of lagoons and embankments for protecting people and resources from coastal cyclones, it can produce tidal energy in three different ways: (1) general tidal streams – using the diurnal variation of water levels, (2) barrages – keeping the water inside the embankments to produce hydroelectricity during the fall and filling then during the rise, and (3) tidal lagoons – using the natural lagoon areas, where no artificial embankment is needed (Kempener and Neumann, 2014; Sikder et al, 2014).
The development of tidal energy is still in its infancy. Although the theoretical potential exists in many of the world’s oceans, only a few tidal energy production plants have been built. The biggest ones are in South Korea, France, the United Kingdom, and Canada. Nonetheless, this is an area of power generation that the world has not explored to its full potential. Given the limited resource capacity, Bangladesh will likely not be able to produce much of this energy in the near future. Additionally, there are natural challenges. The Bay of Bengal is highly prone to tropical cyclones. Singh (2007), using data from 129 years, observed that both the frequency and severity of tropical cyclones in the Bay of Bengal are increasing.
Given all the different options for renewable energy production, Bangladesh can easily adopt solar energy, which it has already expanded significantly. Solar power and some wind power are likely to continue growing. The other options – hydro, geothermal, and tidal – need substantial initial investment, which Bangladesh may not be able to afford at this time. However, as time passes, the situation will change, and with the increase in income at both the individual and national levels, Bangladesh must explore other renewable energy options.
2.3.7. Nuclear Energy
Bangladesh does not have nuclear energy, although efforts to produce such energy began several decades ago, even before the country was established. The region, being energy-deficient, received the exploration of nuclear energy in 1961 with the selection of a site in 1963 (IAEA 2022). The country planned for a nuclear power plan of approximately 2GW capacity [either one or two plants with a total capacity of 2GW]. The table below indicates that, despite many international contacts and assistance, no nuclear power plant has been completed. Both the political situation and public perception varied at different times, and the process exhibited a rollercoaster behavior (Karim et al., 2018). Finally, the construction is underway, and after several postponements, the plants are expected to start the production process in late 2025. However, no one can say for sure, unless the production process begins. The cost of establishment is expected to be much higher than in many competitive countries (Islam and Bhuiyan, 2020; Goswami et al., 2023).
2.4. Energy Policy in Bangladesh
The government of Bangladesh has established the Sustainable and Renewable Energy Development Authority with a view to generating a significant amount of electricity from renewable sources (GoB, 2008). With the shift in privatization policies of the energy sector, several non-governmental organizations have emerged in recent years. In 2019, over 13 million beneficiaries of solar energy in Bangladesh were principally from the private sector (Masud et al, 2020). Even in many remote parts of the country, installing a solar home system is noticeable. Bangladesh can harness wind energy as another renewable source, particularly in coastal areas. Although there are only a few wind energy facilities in Bangladesh, primarily through the private sector, the potential exists for further improvement.
Despite its potential, renewable energy has not significantly impacted Bangladesh’s total energy production and consumption. In 2020, the share of renewable energy remained below 1 percent, while natural gas accounted for over 68 percent. This suggests that renewable energy can play a significant role, but it will not be able to make a substantial contribution to the energy challenge in Bangladesh in the near future.
The government of Bangladesh planned to supply electricity to all citizens by the end of 2021, and it has taken various initiatives to increase electricity generation and improve its distribution system (BPDB, 2021). The government identified the availability of insufficient energy as a significant constraint on GDP growth and overall economic development. The primary objective of the 2004 energy policy was “To provide energy for sustainable economic growth so that the economic development activities of different sectors are not constrained due to a shortage of energy” (GoB, 2004). In the Seventh Five-Year Plan (fiscal years 2015/16 to 2019/20), the government aimed to adopt a balanced approach between increasing supply through new investments and managing demand through policy interventions. With support from international financial institutions, such as the World Bank and the Asian Development Bank, it made plans to deploy utility-scale solar, wind, and biomass plants at selected places wherever possible, with a target of 10 percent renewable energy production capacity (GED, 2015). Interestingly, in the following plan, the focus was on power generation, claiming that the power generation capacity exceeded demand and that the share of renewables remained less than one percent. The total production from renewable sources increased GED, 2020).
Domestic energy supply receives complements from imported energy, including liquefied natural gas (LNG). The Government of Bangladesh’s stated policy objectives are to make the gas sector financially viable, improve its efficiency and quality of supply, and increase private sector participation and investment. The government of Bangladesh has given continuing attention to the sector’s overall development through survey, exploration, exploitation, production, transmission, and distribution, and will allocate adequate resources to develop gas infrastructure.
3. Energy Situation in Canada
Canada has a large land mass, a small population, and one of the world’s largest and most diverse energy sources. Its rivers carry about seven percent of the world’s freshwater – a tremendous source of hydroelectric power. It has the fourth-largest proven oil reserves and third-largest reserves of uranium (Table 2). Canada is rich in energy resources and a leader in developing and implementing innovative technologies for producing and using energy. Its production and consumption systems offer significant attention to the evolving electricity mix. In fact, wind and solar photovoltaic (PV) energy are Canada’s fastest-growing sources of electricity generation (NRC, 2024a). Traditional coal-fired electricity plants are being dismantled to reduce greenhouse gas (GHG) emissions. In the electricity system, cogeneration has increased energy-efficient practices and reduced GHG emissions in areas such as the oil sands. Ongoing developments in areas such as grid-scale electricity storage, carbon capture and storage, hydrogen, and electric and alternative fuel vehicles have the potential to further transform the energy system.
Canadians spent almost $35 billion in 2004 on energy to heat and cool their homes, as well as to operate their appliances, cars, and industrial processes. Many other Canadians benefit indirectly from energy sector developments, through activities such as manufacturing steel and pipe, supplying mining equipment to oil sands plants and coal mines, and transporting these goods to where they are needed. Canada is fortunate to have a strong and diverse energy sector, but like most countries, it faces several energy challenges as well.
The energy sector achieved a significant milestone in 2019 with the establishment of the Canadian Center for Energy Information (CCEI). Housed at Statistics Canada, the CCEI brings together Canada’s existing energy information in one place, facilitating access to products like the Energy Fact Book. For over ten years, the Energy Fact Book has provided a solid foundation for Canadians to understand and discuss significant developments across the energy sector (NRC, 2024a).
3.1. Energy Supply in Canada
As mentioned in the previous subsection, Canada is blessed with large quantities of diverse energy sources, including hydro, wind, solar, ocean (tidal and wave), biomass, uranium, oil, natural gas, coal, oil sands/bitumen, and coal-bed methane. It is an “energy superpower” on the world stage. It is the sixth-largest energy producer in the world (NRC, 2024a). It is the third-largest hydroelectric power-generating country, after China and Brazil, and the fourth-largest oil producer, after the US, Russia, and Saudi Arabia. Additionally, it is the fifth-largest natural gas producer, alongside the US, Russia, Iran, and China. It is the second-largest uranium producer in the world after Kazakhstan (Canada Action, 2025).
Canada has some of the world’s largest and safest nuclear-generating stations and several crucial nuclear research facilities. It is one of the few countries in the world that is not only energy-rich but also fully capable of increasing its energy production in an environmentally and economically sustainable manner. These resources, combined with the intellectual and technological skills possessed by Canadians, have made Canada’s domestic and export energy sector one of its biggest economic drivers. The energy sector provides significant employment and economic opportunities, contributing significantly to the lifestyle that Canadians have come to enjoy and expect. For example, in 2006, the industry accounted for 5.9 percent of the national GDP, fuelled by energy production and generation, with over 345,000 people employed in the oil and gas, as well as electricity sectors alone (NRC, 2024b). Canada’s energy sector is substantial in terms of both the quantity produced and traded, as well as its contribution to the country’s GDP. In 2023, the energy sector contributed 10.3 percent to Canada’s GDP and employed 697,000 people (NRC, 2024b). Among different provinces, Alberta alone employs over 150,000 workers. Canada, with only 0.5 percent of the world’s population, produces a substantial amount of energy. Interestingly, it is rich in all forms of energy.
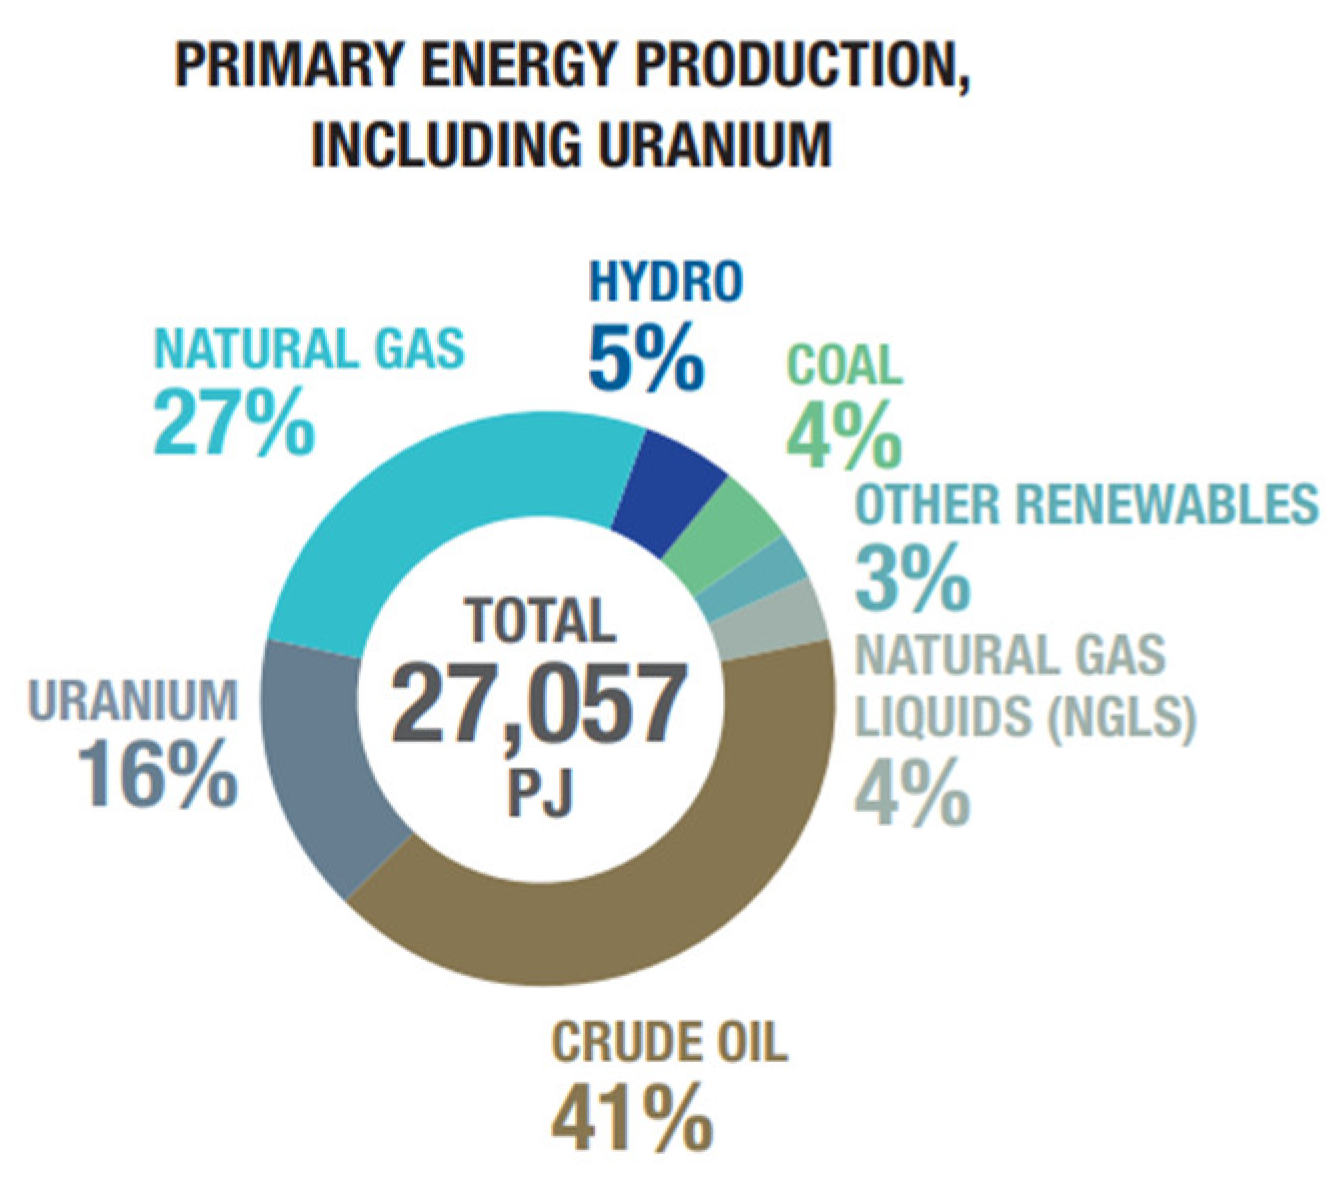
Because of its abundance of energy resources, Canada produces, uses, and exports a diverse portfolio of energy, commonly known as the “energy mix”. The following figure shows the energy mix for Canada in 2021. There may be some variations from one year to the next, but the overall distribution of energy remains more or less the same.
Figure 9.
Canada’s energy production mix, including uranium [Source: NRC, 2024a].
Canada’s energy production and domestic supply are not the same, as it exports nearly all forms of energy it produces. So, the domestic supply is calculated as:
Total Energy Supply = Production + Imports – Exports + Stock Changes.
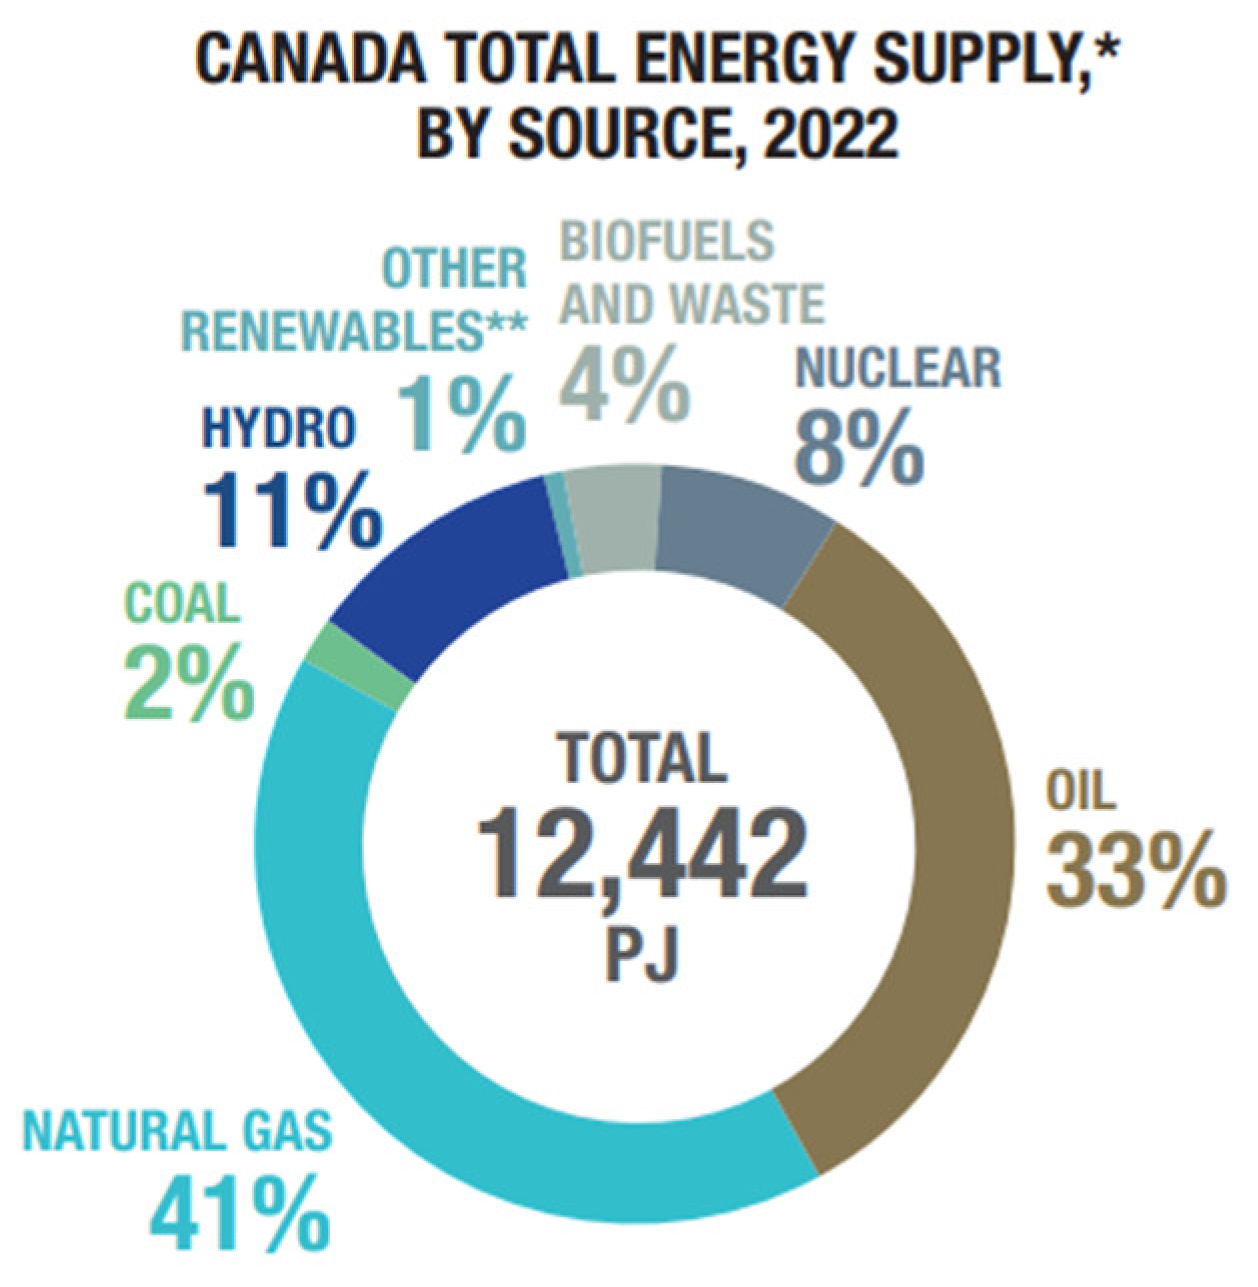
In 2022, Canada’s energy supply mix was 76 percent fossil fuel (2, 41, and 33 percent coal, natural gas and oil, respectively) [Figure below], 16 percent renewable and eight percent nuclear, compared to the global energy mix of 81 percent fossil fuel (28, 23, and 28 percent, coal, natural gas, and oil, respectively), 14 percent renewable and five percent nuclear (NRC, 2024a).
Figure 10.
Canada’s energy supply mix [Source: NRC, 2024a].
The energy sector is also a major contributor to several provincial treasuries and, potentially, to territorial treasuries. In 2005, petroleum companies and electrical utilities contributed over $3 billion in royalties, bonuses, fees, dividends, and taxes to Canadian provinces and territories, which support critical programs such as health and education.
Canadian energy production, particularly in the non-renewable sector, faces significant challenges. While Canada’s conventional energy sources, such as oil, natural gas, and coal, still have significant potential to meet demand over the short to medium term, these non-renewable energy sources are becoming increasingly challenging to find and more costly to extract. Therefore, new sources must be developed (CAPP, 2006). As the world has turned its attention to the critical issue of climate change, it is increasingly essential to create, transport, and use energy resources in an environmentally responsible manner. Many stakeholders, communities, and Aboriginal peoples are seeking increased opportunities to provide input into energy policy and resource management.
3.1.1. Fossil Energy Supply in Canada
Canada has three primary fossil energies – coal, oil, and natural gas. Over time, due to climate change and environmental concerns, coal production has been declining steadily. Indeed, the Government of Canada is in the process of phasing out the extensive use of coal for electricity production. Canada holds vast reserves of fossil fuels, particularly in the western provinces. The most prominent resource is crude oil, particularly in the form of oil sands, with Alberta serving as the hub of production. In 2021, Canada was the sixth-largest primary energy-producing country in the world, with over 80 percent of its energy coming from fossil fuels (NRC, 2024a). Crude oil is by far the most significant primary energy source in Canada. The energy sector contributes over 10 percent of the country’s GDP and employs more than half a million people (NRC, 2024a). It has a vast amount of primary energy reserves in various forms.
Figure 11.
Fossil fuel (Coal, oil, and natural gas) production in Canada, 1991-2024, indexed to 1991. [Source: Energy Institute, 2025].
Figure 11.
Fossil fuel (Coal, oil, and natural gas) production in Canada, 1991-2024, indexed to 1991. [Source: Energy Institute, 2025].
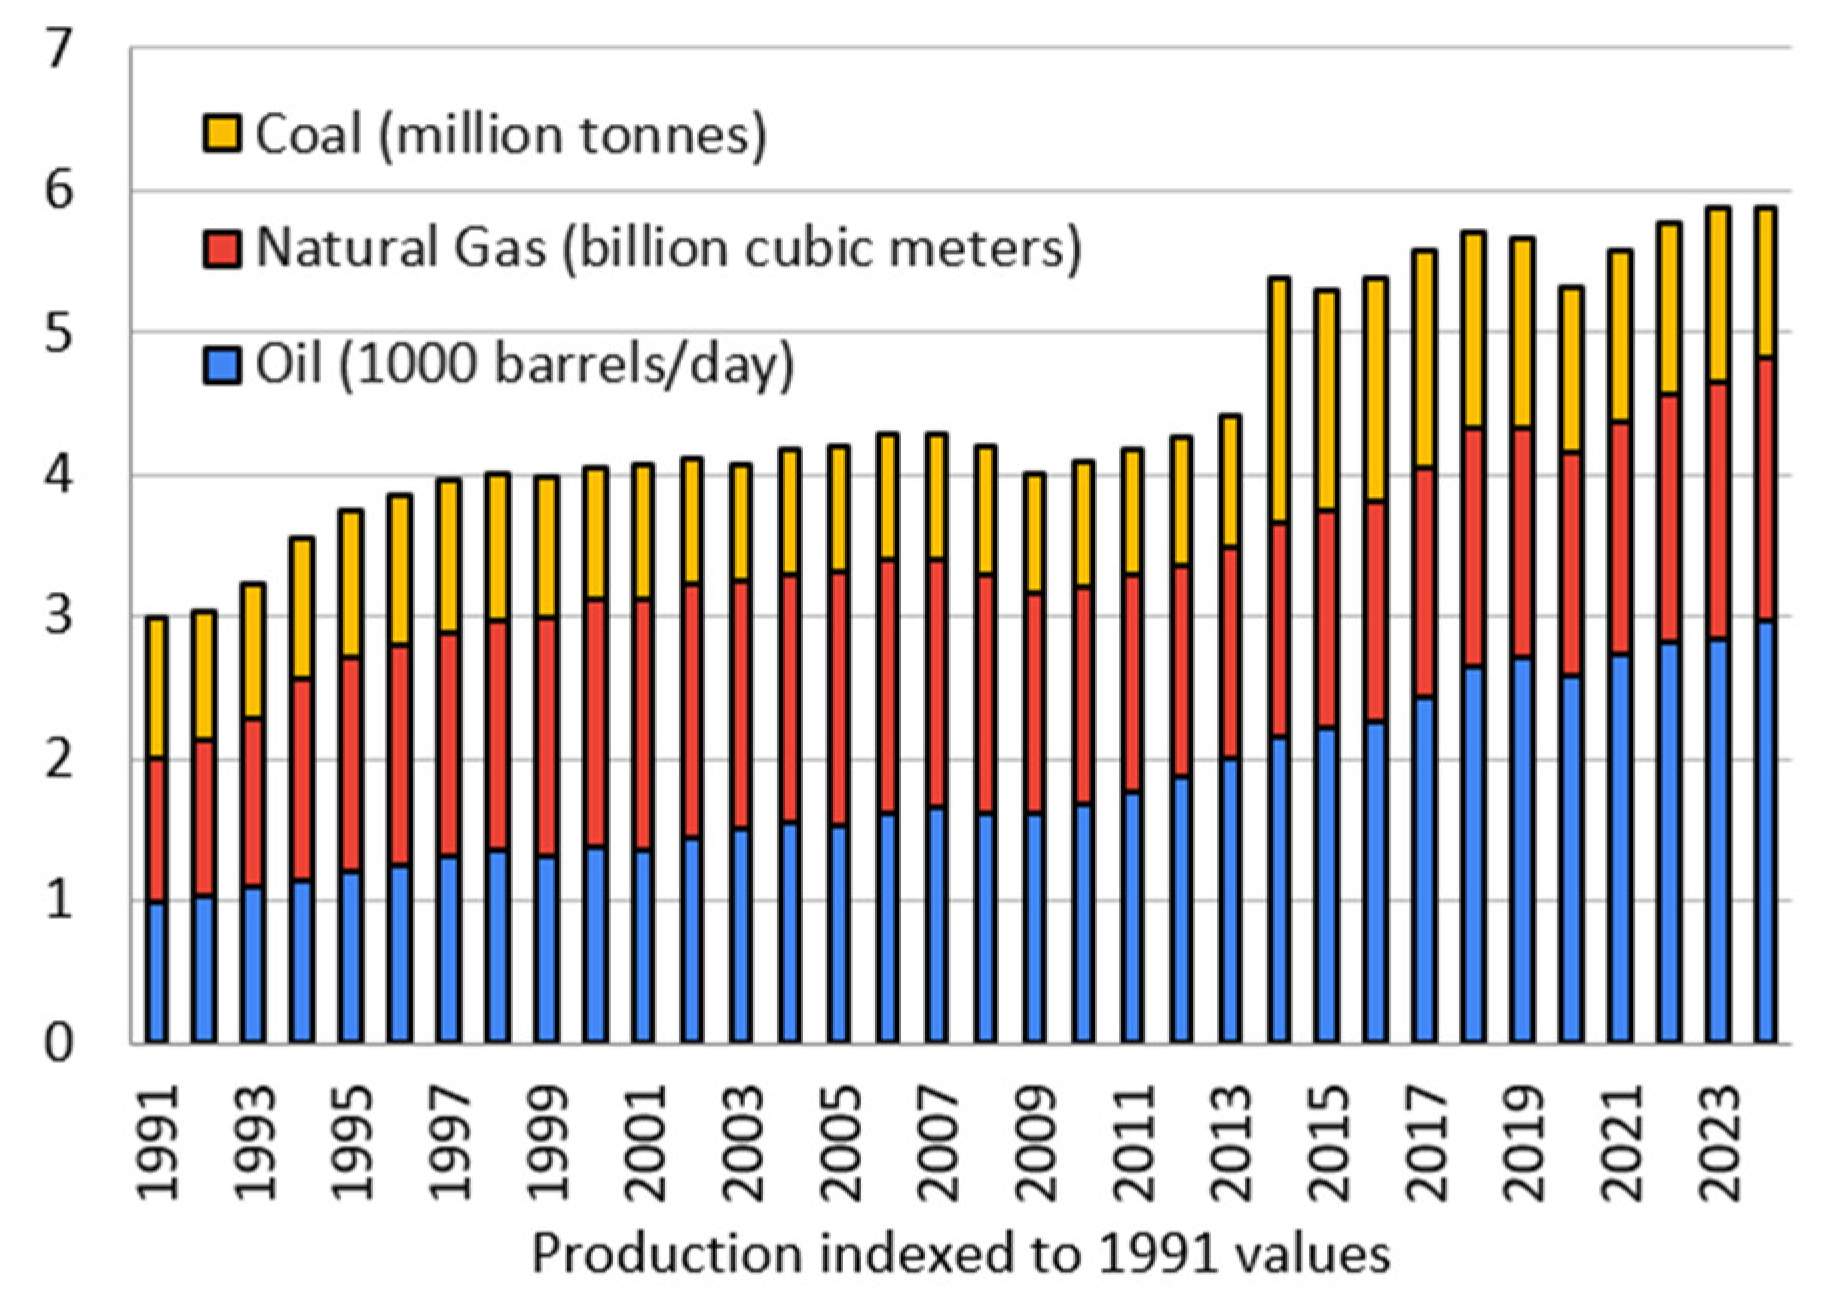
Oil is the primary source of energy and a major contributor to Canada’s export earnings. Although not all provinces have oil resources, some areas are richer than others. Oil production in Canada continued to increase, primarily due to the sustained rise in international crude oil prices and technological advancements in extracting oil from oil sands. New technology, successfully employed in shale gas developments (including horizontal drilling and multi-stage fracture stimulation), has been successfully used in several projects in Alberta and Saskatchewan. Canada now focuses more on its unconventional oil production. By the end of this decade, oilsands production is expected to account for nearly 90 percent of Canadian oil production (NRC, 2013). The shift towards unconventional production has long been anticipated, as 97 percent of Canada’s proved oil reserves are in the form of oil sands.
Canada’s fossil energy sector receives substantial support from the Government, primarily through subsidies (Levin, 2025). The energy sector also generates a considerable income for the resource-rich provincial and federal governments. However, in response to recent environmental concerns, the government has decided to reduce subsidies on the fossil energy sector (Scarpaleggia, 2023). Canada has agreed to phase out coal, which substantially contributes to human health (WHO, 2025). New processes and efficiency improvements are also helping curb the expected demand for natural gas per barrel of oil sands produced. With significant reserves in Alberta, British Columbia, and Saskatchewan, Canada is among the world’s top five natural gas producers, with output exceeding 15 billion cubic feet per day in recent years (Energy Institute, 2025). In contrast, coal production has declined due to environmental policies and decreased domestic demand; however, Canada still exports coal, particularly metallurgical coal used in the steelmaking process.
Canada’s natural gas industry began to take off in the mid-20th century, driven by discoveries in Alberta and British Columbia. Today, Canada possesses one of the largest natural gas reserves in the world (Energy Institute, 2025), primarily located in the Western Canadian Sedimentary Basin, which spans Alberta, British Columbia, and Saskatchewan. Unconventional sources, such as shale gas and tight gas, have become increasingly important due to advancements in horizontal drilling and hydraulic fracturing (Cai et al., 2017; Kong et al., 2024).
Canada is a major exporter of natural gas, with the United States being its primary destination. In 2024, Canada produced over 194 billion cubic meters of natural gas (Energy Institute, 2025), most of which came from Alberta and northeastern British Columbia. Ghose and Islam (2023) used a theoretical model to find that Canada’s entry into the LNG market benefits Canadian firms. The industry has long tried to export its natural gas to the international market beyond the USA with little success. Only recently did the shipment of LNG to Asia from one of its plants begin (Kitimat). Several LNG projects are in development or under construction. These projects aim to diversify Canada’s export markets and enhance energy security for international partners. However, LNG infrastructure development faces challenges, including high costs, regulatory hurdles, and concerns from Indigenous communities and environmental groups. The first LNG shipment from Canada to Asia was on June 30, 2025 (LNG Canada, 2025).
The fossil fuel industry is Canada’s largest source of greenhouse gas (GHG) emissions, contributing significantly to the country’s climate footprint. Oil sands production, in particular, is energy and water-intensive, raising concerns about air and water pollution, habitat disruption, and Indigenous rights. The future of fossil energy in Canada is uncertain but evolving. While global demand for oil and gas is expected to persist for decades, particularly in developing economies, there is growing pressure to decarbonize. Canada’s fossil energy industry is exploring ways to adapt, such as investing in cleaner extraction technologies, transitioning to hydrogen production, and incorporating carbon capture systems. There is a growing movement toward diversification and innovation in clean energy. Public opinion, investor preferences, and international climate commitments are pushing Canada to rethink its reliance on fossil fuels and invest in a more sustainable energy future.
Fossil energy has long been a pillar of Canada’s economy and energy system. (Clark and Matthews, 2023). While the country remains a major player in global oil and gas markets, it faces mounting challenges related to environmental sustainability and climate change. Balancing economic interests with environmental responsibility will be critical as Canada navigates the transition to a low-carbon future. The evolution of its fossil energy supply will shape not only the nation’s economic trajectory but also its role in the global effort to combat climate change.
Figure 12.
Oil production trend in Canada [Data source: B.P., 2023; Energy Institute, 2025].
Two ways to combat GHG emissions from Canada are reducing coal production and increasing natural gas production as a transition fuel. Among the three fossil fuels, coal is the worst for contributing to GHG emissions. Canada recognized this almost half a century ago and has made an effort to cut back coal production (Gurtler et al., 2021; Solarin et al., 2021; Bennett et al., 2023). The target is to eliminate coal-fired electricity plants by 2030. However, progress is slow, and the sector may not realize its objectives by 2030 (Gurtler et al., 2021). Nonetheless, the trajectory is in the right direction, and at some point, Canada’s GHG emissions will decline.
The country’s total coal production has been declining since the 1990s, following a period of increase in the 1970s and 1980s (Figure 13), in response to the world’s energy crisis. The trend continues in the right direction with a more rapid decline in recent years.
Canada is one of the world’s leading producers of natural gas, with vast reserves that play a crucial role in both the national economy and the global energy market. As the world increasingly looks for cleaner energy alternatives, natural gas is positioned as a transitional fuel, offering a lower-carbon option compared to coal and oil. In Canada, the production and export of natural gas have undergone significant evolution in recent decades (Figure 14), driven by technological advances, market demands, and environmental considerations.
As the world transitions to net-zero emissions, natural gas in Canada may serve as a bridge fuel, supporting energy reliability and economic development. In contrast, renewable energy capacity continues to expand (IRENA, 2025). However, this will require ongoing investment, robust regulation, and meaningful engagement with Indigenous communities to ensure sustainable development.
3.1.2. Renewable Energy Supply in Canada
Canada, with its vast natural resources and commitment to environmental sustainability, is a global leader in renewable energy production. The country’s energy landscape is undergoing a significant transformation as it shifts from traditional fossil fuels to cleaner, more sustainable energy sources (NEB, 2019). The development and expansion of renewable energy technologies such as hydroelectricity, wind, solar, and biomass are central to Canada’s strategy to reduce greenhouse gas emissions, promote economic growth, and ensure energy security (Figure 15).
Canada’s renewable energy supply is dominated by hydroelectric power, which accounts for nearly 60 percent of the country’s total electricity generation (NRC, 2024c). The abundance of rivers and lakes, particularly in provinces like Quebec, British Columbia, Manitoba, and Newfoundland and Labrador, has made hydroelectric power a cornerstone of Canada’s energy strategy. Large-scale hydroelectric dams provide reliable, low-cost electricity and play a key role in reducing the nation’s carbon footprint.
Wind energy is the second-largest source of renewable electricity in Canada, making up about six percent of the country’s total generation (NRC, 2024c). Wind farms are primarily located in Ontario, Quebec, and Alberta, where government policies and favorable wind conditions support their development. The growth of wind power has been rapid over the past two decades, driven by technological advancements and increasing investments from both the public and private sectors.
Solar energy is growing steadily, while still a minor contributor to Canada’s electricity supply (Figure 15). It is most prevalent in Ontario, which benefits from a combination of solar-friendly policies and relatively high radiation. As solar panel technology becomes more efficient and affordable, it is expected to play an increasingly important role, particularly in distributed energy systems and remote communities.
Biomass and bioenergy also contribute significantly to Canada’s renewable energy portfolio, particularly in regions with substantial forestry and agricultural industries. Biomass energy is derived from organic materials such as wood waste, agricultural residues, and landfill gas. It provides a valuable opportunity for waste reduction while generating heat and electricity.
Canada has committed to achieving net-zero greenhouse gas emissions by 2050 (Navius, 2021). To achieve this target, federal and provincial governments have implemented a range of policies and incentives to promote renewable energy development. These include carbon pricing, renewable portfolio standards, feed-in tariffs, and investments in clean energy infrastructure.
Despite the progress, several challenges remain. Integrating variable renewable energy sources, such as wind and solar, into the grid requires significant investment in energy storage, grid modernization, and transmission infrastructure (Bratt, 2021; Bennett et al., 2023). Moreover, energy projects must be developed in partnership with Indigenous communities, respecting land rights and ensuring mutual benefit.
Nevertheless, the transition to renewable energy presents numerous opportunities (Abdolmaleki et al., 2024). Canada can create thousands of green jobs, attract international investment, and develop new export markets for clean technologies. Moreover, renewable energy can provide a reliable and affordable power supply to remote and northern communities, many of which currently rely on expensive and polluting diesel generators.
Canada’s renewable energy supply is vital to its transition to a sustainable, low-carbon economy (Abdolmaleki et al., 2024). While hydro power remains the backbone of its clean energy system, the growth of wind, solar, and biomass signals a diversified and resilient energy future. With continued investment, supportive policies, and a commitment to innovation, Canada is well-positioned to lead the global shift toward renewable energy and climate resilience (Bennett et al., 2023).
3.2. Energy Demand in Canada
Canada, with its vast geography and diverse climate, is one of the world’s highest per-capita energy consumers (Energy Institute, 2025). Several factors, including economic growth, industrial activity, weather conditions, population trends, and technological advancements, impact energy demand in Canada. Understanding how and why Canadians consume energy is crucial for shaping effective policies on energy production, sustainability, and climate change.
Canada’s total energy demand in 2020 was 11,059 petajoules, which can be divided among four major sectors: industrial, transportation, residential, and commercial/institutional (CER, 2023). The industrial sector is by far the largest consumer, accounting for nearly 50% of the country’s total energy use. This includes energy-intensive industries such as oil and gas extraction, mining, pulp and paper, and manufacturing. The transportation sector follows, consuming about 25 percent, largely in the form of gasoline and diesel fuels.

Table 3.
Canada’s energy demand by sector in 2020. [Source: CER, 2023. Canada’s Energy Future: Data appendix for end-use demand].
Table 3.
Canada’s energy demand by sector in 2020. [Source: CER, 2023. Canada’s Energy Future: Data appendix for end-use demand].
| Sector | Percent |
| Industrial | 53 |
| Transportation | 20 |
| Residential | 14 |
| Commercial | 13 |
In the residential and commercial sectors, energy is primarily used for heating, specifically for space and water heating, due to Canada’s cold climate (NRC, 2012). Electricity, natural gas, and heating oil are the primary energy sources for these sectors. In recent years, electricity demand has remained relatively stable, while natural gas use has grown due to its affordability and efficiency.
Provinces vary in their reliance on fossil fuels. For example, Alberta and Saskatchewan are heavily dependent on oil and gas, whereas Quebec and British Columbia utilize more hydroelectricity. This regional variation shapes provincial policies and public attitudes toward energy development (CER, 2025).
Over the past two decades, energy intensity (energy use per unit of GDP) in Canada has improved, reflecting gains in energy efficiency (NRC, 2024b). Federal and provincial programs promoting building retrofits, appliance standards, electric vehicle adoption, and industrial efficiency have contributed to slowing the growth of demand. However, population growth and economic development continue to exert upward pressure. Electrification of heating and transportation is expected to increase electricity demand in the coming decades.
Canada’s energy demand reflects both its natural resource wealth and its ambitions for a cleaner, more sustainable future. While the country faces challenges in aligning high energy consumption with climate targets, it also has the tools and opportunities to lead in the global energy transition. Although energy use has both positive and negative aspects, in all its sectors, energy intensity continues to improve (Figure 16). Strategic investments in clean technology, infrastructure, and policy will be essential to meeting future energy needs while reducing environmental impact (Bennett et al., 2023).
3.2.1. Environmental Concerns and Conflicts
Canada, known for its vast natural landscapes and abundant resources, faces growing environmental concerns that reflect the tension between economic development and ecological protection. As a developed country with a resource-based economy, Canada faces complex environmental challenges, including climate change, biodiversity loss, Indigenous land rights, and industrial pollution. These challenges often give rise to conflicts between governments, industries, Indigenous communities, environmental groups, and the public. Nonetheless, Canada has the highest environmental performance index among G7 countries, indicating that it has the highest energy self-sufficiency, economic development, and environmental performance potential (Ehsanullah et al., 2021).
Canada is one of the world’s highest per-capita greenhouse gas (GHG) emitters, primarily due to its reliance on fossil fuels for energy and transportation. The oil sands in Alberta are a significant contributor to national emissions, and although the country has set ambitious targets (reaching net-zero emissions by 2050), progress remains slow. Increasing wildfire activity, extreme weather events, and melting permafrost are visible consequences of a warming climate across the country.
Canada has some of the world’s most extensive intact forests, but logging, particularly in provinces such as British Columbia and Quebec, has raised concerns about habitat loss and declining biodiversity. Old-growth forests, which are crucial for carbon storage and species protection, are being cut at unsustainable rates in certain regions, resulting in public protests and legal challenges (Sikkema et al., 2013).
Industrial activities, including mining and oil and gas extraction, have caused significant water contamination in certain areas (Spang et al., 2013). For example, tailings ponds from oil sands operations pose long-term risks to surrounding ecosystems and communities (ED 2013). Agricultural runoff and urban wastewater also contribute to water quality issues in lakes and rivers, including Lake Winnipeg and the Great Lakes (Glynn et al., 2002).
One of the most significant environmental conflicts in Canada involves the rights of Indigenous peoples to their traditional lands. Many natural resource projects—including pipelines, mining operations, and logging—occur on unceded or contested Indigenous territory. While some Indigenous communities support development for economic reasons, others oppose it due to environmental and cultural concerns (Kellner, 2025). Major pipeline projects such as the Trans Mountain Expansion (TMX) and Coastal GasLink have sparked nationwide debates (Hoberg, 2016; Kraushaar-Friesen and Busch, 2020). Proponents argue that these projects are essential for job creation and energy security, while opponents point to the risks of oil spills, increased emissions, and violations of Indigenous consent. Protests and legal actions have delayed several such projects, underlining the deep divisions they cause. Environmentalists and some First Nations oppose the destruction of ancient forests, arguing that conservation should take priority over short-term economic gain. (Gunton et al., 2021).
Balancing economic interests with ecological sustainability is no easy task, but it is essential for Canada’s long-term health and global climate commitments. Canada’s environmental concerns and conflicts reflect the country’s complex relationship with its natural environment. While it benefits from immense ecological wealth, it also faces significant pressures from development, climate change, and political divisions. Addressing these challenges requires collaboration across sectors and a commitment to justice, sustainability, and respect for nature, as well as the rights of Indigenous peoples.
3.3. Significance of Transition to Renewables
Transitioning to renewable energy is a goal for many government policies, but significant investment is required to ensure a smooth transition (Stringer and Joanis, 2022). According to Stringer and Joanis (2022), previous research papers have shown that the transition is possible at a national scale for Canada, but may not be equally feasible for each province independently. One case study examines the transition to renewable energy sources in Saskatchewan, focusing on a framework known as strategic environmental assessment (SEA) (Nwanekezie et al., 2022). This approach is used to explore the risks, capacities, and challenges that exist in certain institutions and governance; there are opportunities to determine not only the energy security concerns but also implement distributed generation and address the economic impact that may occur when transitioning away from a fossil-fueled run economy (Nwanekezie et al., 2022). Results have shown that there needs to be clear transition goals and objectives in place, along with strategies and tools to implement these goals, and, most importantly, a complete commitment to these objectives (Nwanekezie et al., 2022). They further state that there needs to be clarity and responsibility in place to ensure proper implementation and manage complexity when creating a new assessment for transition-based SEA.
Climate change, specifically CO2 emissions, is a significant global concern, as it impacts humans, resources, and critical environmental systems (Hussain et al., 2025). Global leaders are implementing various energy policies to reduce emissions and promote economic development while ensuring environmental sustainability (Hussain et al., 2025). Canada is a country that heavily relies on grey energy sources such as fossil fuels (Onyinyechukwu et al., 2024). Canada produces 17.7 million tons of carbon emissions, ranking 34th in environmental performance (Hussain et al., 2025). In fact, as of 2020, Canada’s electric power system is responsible for nine percent of Canada’s Greenhouse gas (GHG) emissions, of which 53 percent comes from Alberta alone (Miri and McPherson, 2024).
Canada, a nation with abundant fossil fuel reserves, faces a critical juncture regarding its energy sector, mainly due to its commitment to achieving net-zero emissions across the economy by 2050 (NRC, 2025). While currently a leading producer of hydropower, diversifying its energy mix beyond non-renewable sources is essential. The country’s energy supply is dominated by non-renewable sources, with fossil fuels accounting for 75 percent of total primary energy production in 2022 (NRC, 2024c). However, the adverse environmental impacts of fossil fuel combustion, including greenhouse gas emissions and air pollution, pose a significant threat to Canada’s efforts to mitigate climate change and meet its commitments under the Paris Agreement. The Intergovernmental Panel on Climate Change (IPCC, 2022) has emphasized the need for a rapid transition to renewable energy sources to limit global warming to 1.5°C above pre-industrial levels. Canada has substantial renewable energy potential, with the Canadian Renewable Energy Association (2022) estimating that the country could generate up to 64 percent of its electricity from renewable sources by 2050. Hydroelectricity already accounts for 60 percent of Canada’s electricity generation, while other renewables contribute only 6.2 percent (Canada Energy Regulator, 2021). Transitioning to renewable energy sources, such as wind and solar, offers a compelling solution. These resources are abundant in Canada, with wind and solar capacity experiencing significant growth (NEB, 2019; NRC, 2024a). By embracing this transition to renewables, Canada can enhance its energy security, mitigate the impacts of climate change, and unlock new economic opportunities associated with renewable energy technologies.
3.3.1. Solar Energy
Canada, known for its vast landscapes and diverse energy resources, is increasingly turning to renewable energy to meet its environmental and economic goals. Among these renewables, solar energy is gaining momentum as a clean, sustainable, and accessible source of power (NRC, 2025). Solar energy installations in Canada continued to increase until 2015, after which they slowed down, but reached a peak in 2021 (Figure 17). From 2023 to 2024, solar energy production in Canada increased by 8.2 percent (Energy Institute, 2025).
Although Canada is not the sunniest country in the world, its advancing technology, declining costs, and growing climate awareness have positioned solar energy as a key player in the country’s energy transition, and production is expected to continue to increase (Gaucher-Loksts and Pellan, 2024). British Columbia aspires to have net-zero energy by 2032 (Shirinbakhsh and Harvey, 2024). Canada has certain advantages when it comes to solar energy, as it is not only abundant but also has a significant solar energy potential in most of the southern part of the country, as well as in the western part of Prince Edward Island (Karayel and Dincer, 2024b). There are over 43,000 solar photovoltaic systems across Canada that supply electricity to commercial, residential, and industrial rooftop areas (Karayel and Dincer, 2024b).
3.3.2. Wind Energy
Wind energy is one of the fastest-growing sources of renewable electricity in Canada. With its vast open landscapes and strong wind resources, Canada is well-positioned to harness the power of the wind to generate clean, reliable energy. As global efforts to reduce carbon emissions intensify, wind energy is playing an increasingly important role in helping Canada transition to a low-carbon economy. Although annual installations vary, the cumulative total wind energy capacity continues to increase (Figure 18). From 2023 to 2024, wind energy in Canada grew at a rate of 8.2 percent (Energy Institute, 2025).
Canada, being the second-largest country in the world, has a vast area with high wind energy production potential. Wind power systems are generally viable where annual average wind velocity exceeds 15 km/h (Das et al, 2014; Savelle, 2025). Despite considerable seasonal variations in wind and temperature, particularly extreme winter temperatures, adequate wind resources exist throughout Canada for wind power generation. Socio-economic aspects play a significant role in implementing the wind energy production projects. The market size, remoteness, transmission facilities, grid connection, local acceptance, installation and maintenance expenses, and energy storage capabilities are some of the key challenges. An environmentally friendly energy production does not necessarily become acceptable to everyone (Walker et al, 2016).
In Canada, wind energy has grown rapidly since 2008, accounting for approximately five percent of the country’s overall electrical energy generation (CER, 2019; NEB, 2021). Canada, being the second-largest country in the world, has a vast landmass and varying capacities among its geographical regions. Ontario and Quebec together produce over 66 percent of Canada’s total wind energy (Figure 19). However, one small province, Prince Edward Island, produces over 95 percent of its electricity from wind.
In Canada, potential exists for a continuous increase in wind electricity generation. Canada’s geography, especially the Prairies and coastal regions, offers consistent and powerful wind currents that are ideal for large-scale wind farms (IEA, 2022). The four principal advantages of wind energy are: clean and renewable, abundant and sustainable, low operating costs, job creation, and economic growth. However, despite these advantages, wind energy has several issues, including intermittency, impact on wildfires and landscapes, community composition, and competition with hydroelectricity.
Despite these organizations, Canada has difficulty adopting wind energy. The three most common ones are: (1) intermittency and storage of wind electricity, (2) impacts on wildlife and landscapes, (3) community opposition, and (4) transmission infrastructure (Sanij et al, 2022). The federal government has played a significant role in promoting wind energy through various programs. Examples include feed-in tariffs and renewable energy targets in Ontario, carbon pricing across Canada, green infrastructure funding, and Indigenous partnerships.
The future of wind energy in Canada is promising. With global and domestic pressure to reduce emissions, wind power is expected to expand rapidly. According to the Canadian Renewable Energy Association (CREA, 2021), wind and solar together could make up 30–35 percent of Canada’s electricity by 2050.
3.3.3. Biomass
Biomass energy refers to the use of organic matter, such as wood chips, pellets, crop waste, and even animal manure, to generate heat, electricity, or transportation fuels. Biomass can be burned directly, converted into biogas, or processed into liquid biofuels such as ethanol and biodiesel. Biomass energy is a vital yet often underappreciated component of Canada’s renewable energy portfolio. Derived from organic materials such as wood, agricultural residues, and municipal waste, biomass provides a sustainable means of producing electricity, heat, and biofuels. In a country as rich in forests and agricultural land as Canada, biomass presents a unique opportunity to support rural economies, reduce waste, and contribute to national climate goals (NRC, 2025a).
Unlike fossil fuels, biomass is renewable, as new crops or forests can regrow to replace what is used. While burning biomass releases carbon dioxide, the emissions are generally offset by the carbon absorbed by the plants during their growth, making the process carbon-neutral when sustainably managed.
Canada is one of the world’s leading producers and consumers of biomass energy, largely due to its extensive forest sector (Figure 20). Canada is investing in advanced biofuels and biochemical technologies to produce cleaner alternatives for aviation, shipping, and heavy industries. It is expected to remain a crucial component of Canada’s clean energy strategy, particularly in rural, remote, and industrial settings. With improved efficiency, emissions controls, and sustainable sourcing, biomass can complement other renewables like wind, solar, and hydro.
3.3.4. Hydro
Hydroelectricity, or hydro energy, is the backbone of Canada’s electricity system. Thanks to its abundant rivers, lakes, and elevation changes, Canada has become one of the world’s largest producers of hydroelectric power (Table 1). As a clean, renewable, and reliable energy source, hydro energy plays a key role in helping Canada reduce greenhouse gas emissions and transition to a sustainable energy future. Canada is the second-largest producer of hydroelectricity in the world, after China. As of 2024, over 60 percent of Canada’s electricity comes from hydro power, making it the dominant source of renewable energy in the country (NRC, 2025). Among Canadian provinces, Quebec and British Columbia are the homes of massive hydropower. Manitoba, Newfoundland, and Labrador also rely heavily on hydro. Nonetheless, the production capacity remains relatively stable, with a moderate increase (Figure 21 and Figure 22).
Canada’s hydroelectricity projects are aging and face challenges from various fronts, including ecosystem disruptions, indigenous land claims, greenhouse gas emissions, and high maintenance costs. Nonetheless, hydro will remain a cornerstone of Canada’s energy system, but future projects are expected to focus more on community partnerships, environmental sustainability, and respect for Indigenous rights.
Hydro energy has powered Canada for over a century and remains central to its clean energy leadership. With its ability to provide large-scale, low-emission, and reliable electricity, hydro plays a key role in meeting national climate goals. However, to maintain public trust and sustainability, future hydro development must be balanced with ecological protection and meaningful Indigenous engagement. By doing so, Canada can continue to lead the world in clean, responsible energy production.
3.3.5. Geothermal
In Canada, geothermal energy remains underdeveloped, despite the country’s vast geothermal resources. As Canada seeks to reduce emissions and diversify its renewable energy mix, geothermal energy presents a promising, though challenging, opportunity [Joseph, 1991; Wang et al, 2024].
Geothermal energy is derived from the natural heat of the Earth’s interior. It can be accessed in several ways: (1) Shallow geothermal systems (also called ground-source heat pumps) for residential and commercial heating and cooling; (2) Deep geothermal systems for producing electricity by using hot water or steam to drive turbines and (3) Direct-use applications, such as heating greenhouses, fish farms, or industrial facilities [Grasby et al., 2012; Wang et al 2024]. Geothermal energy is a reliable, renewable source that has a very low environmental footprint when developed responsibly. Canada has significant geothermal potential—especially in British Columbia, Alberta, Yukon, and Saskatchewan (Majorowicz and Grasby, 2013; Leitcha et al, 2019). Increased interest in low-carbon heating systems, as part of Canada’s push for net-zero emissions by 2050, could further boost demand for geothermal heating in urban and suburban areas (Wang et al, 2024).
Geothermal energy in Canada is still in its early stages, but its future looks promising (Huang et al., 2024). As technology improves, costs decrease, and climate policies become more ambitious, geothermal is expected to play a supporting role in Canada’s clean energy transition. Particularly in provinces like Saskatchewan and Alberta, geothermal energy can help repurpose oil and gas expertise, create new jobs, and decarbonize heat and electricity (Leitcha et al., 2019).
Though underutilized, geothermal energy represents a robust and sustainable resource beneath Canada’s surface. With the right mix of investment, research, and policy support, geothermal could help Canada achieve its clean energy goals while providing reliable power and heating—especially in remote and resource-rich regions. Unlocking this potential will require collaboration between governments, Indigenous communities, industry, and researchers.
3.3.6. Tidal Energy
As the world moves toward cleaner energy solutions, tidal energy—the power generated from the natural rise and fall of ocean tides—offers a predictable and sustainable source of renewable electricity. With its vast coastlines and strong tidal currents, Canada is uniquely positioned to become a global leader in tidal power (Cornett, 2006; Fisch, 2016a, b; MRC, 2018). While the technology is still emerging, it holds great promise for contributing to Canada’s clean energy goals, especially in coastal and remote communities.
Tidal energy harnesses the gravitational forces of the moon and sun, which create the daily movement of tides in oceans and bays. This energy can be captured using several technologies, including (1) Tidal stream turbines – Underwater turbines that operate like underwater windmills in fast-moving tidal currents, (2) Tidal barrages – Dams built across tidal estuaries that trap water at high tide and release it through turbines, and (3) Tidal lagoons – Man-made enclosures that work similarly to barrages, but with potentially less environmental disruption (Kempener and Neumann, 2014).
Unlike wind and solar, tidal energy is highly predictable, making it a reliable option for enhancing grid stability and supporting long-term planning. Canada is home to one of the most powerful tidal zones in the world: the Bay of Fundy, located between Nova Scotia and New Brunswick. This bay experiences tidal ranges of up to 16 metres—the highest on Earth (Fisheries and Oceans Canada, 2024). Tidal energy has not yet been widely commercialized in Canada, and the number of operational projects remains relatively small (Cornett, 2006).
Tidal energy in Canada is still in the early stages of commercial development, but its long-term potential is substantial. As technology improves and costs fall, tidal power could play a complementary role alongside wind, solar, and hydro in Canada’s renewable energy mix. For coastal provinces like Nova Scotia and British Columbia, tidal energy offers a unique opportunity to generate clean power while supporting local economies and Indigenous energy sovereignty (MRC, 2018).
3.3.7. Nuclear Energy
Nuclear energy has been a cornerstone of Canada’s electricity system for over half a century. As the country seeks to decarbonize its energy grid and meet its climate targets, nuclear power, particularly with the emergence of new technologies like small modular reactors (SMRs), is receiving renewed attention (NEB, 2018). With a strong domestic industry, an established safety record, and significant uranium resources, Canada is the sixth-largest producer of nuclear energy, accounting for approximately four percent of the world’s total nuclear energy production (NEB, 2018). The largest nuclear energy-producing and consuming countries are the USA, China, France, Russia, and South Korea (Figure 23).
Canada began developing nuclear technology in the 1940s and launched its first commercial nuclear power station in the early 1970s (Atomic Energy Canada Limited, 1997; Brooks, 2002). Today, nuclear energy accounts for approximately 15 percent of Canada’s electricity, with over 60 percent of this energy used in Ontario, where it serves as a primary power source. Canada operates 19 nuclear reactors, primarily in Ontario, with additional reactors located in New Brunswick and Quebec (CNA, 2020). It is the birthplace of the CANDU reactor (CANada Deuterium Uranium), a unique technology that uses natural (unenriched) uranium and heavy water. Canada is also one of the world’s top producers and exporters of uranium, with major mining operations in Saskatchewan (Brooks, 2002; CNA 2020). Canada’s nuclear energy production has remained stable in the last two decades (Figure 24).
Ontario and New Brunswick are the only two provinces in Canada that operate nuclear power plants. Nuclear generation accounted for 58 percent of Ontario’s total generated electricity in 2016, and 30 percent of the total in New Brunswick (NEB, 2018). In both provinces, it was the largest source of electricity generation. From 2005 to 2016, total nuclear generation in Canada increased by 10 percent. No new nuclear facilities were built during this time. Refurbishments and improvements at existing nuclear facilities in Ontario and New Brunswick were responsible for the increase. Similarly, a decrease in 2024 (Figure 24) is due to maintenance.
Nuclear energy is a vital part of Canada’s clean energy strategy (Hervas and Noyahr, 2024). With its low-carbon footprint, reliable output, and potential for innovation through SMRs, nuclear power can help Canada meet its climate commitments while supporting economic growth. However, its future depends on addressing public concerns, managing waste responsibly, and ensuring the safe and cost-effective deployment. If implemented correctly, nuclear energy will continue to be a powerful and sustainable contributor to Canada’s energy future (Winfield, 2006; Wilde et al., 2018; Hervas and Noyahr, 2024).
3.4. Energy Policy in Canada
Canada’s energy policy framework represents a complex governance and public administration challenge, fundamentally shaped by two persistent tensions. First, there exists an ongoing competition between economic development tied to resource extraction and environmental protection, mandating rapid decarbonization. More specifically, it has vast fossil fuel reserves, with its economy heavily dependent on this sector. Simultaneously, it always positioned itself internationally as a proponent of ambitious climate commitments, from its early ratification of the Kyoto Protocol to its more recent obligations under the Paris Agreement to achieve net-zero emissions by 2050 (Government of Canada, 2023).
Second, the distribution of energy authority is spread across multiple levels of government, requiring sophisticated coordination mechanisms between federal, provincial, territorial, and Indigenous authorities. This intricate constitutional division of powers creates systematic challenges for policy coordination, as energy-consuming provinces with larger populations can elect federal governments that favour consumers. In contrast, energy-producing provinces exercise constitutional authority over natural resources to resist such policies (Viens, 2022).
Recent policy developments provide crucial insights into these dynamics. The 2025 restructuring of federal carbon pricing, the completion of the Trans Mountain Pipeline expansion, and the finalization of the Clean Electricity Regulations demonstrate both the adaptive capacity and inherent limitations of Canada’s federal system in managing energy transition (Government of Canada, 2025a). These developments reveal a pattern of policy effectiveness that varies dramatically across economic sectors, with notable success in decarbonizing electricity contrasting sharply with persistent challenges in reducing emissions from oil and gas.
3.4.1. Energy-Environment Competition
Policy Architecture and Constitutional Framework:
Canada’s contemporary climate policy framework is anchored by the Canadian Net-Zero Emissions Accountability Act (2021), which establishes legally binding interim targets, including a 40–45 percent reduction below 2005 levels by 2030 and net-zero emissions by 2050. This legislation represents a significant institutional innovation, establishing independent oversight mechanisms through the Net-Zero Advisory Body and requiring comprehensive emissions reduction plans with mandatory progress reporting.
The federal carbon pricing system underwent fundamental restructuring in March 2025, representing a significant departure from the comprehensive approach implemented since 2019 (Government of Canada, 2025b). The government eliminated the consumer-facing fuel charge, effective April 1, 2025, by setting federal fuel charge rates to zero and removing the requirement for provinces and territories to maintain consumer-facing carbon pricing (Department of Finance Canada, 2025). Prior to this restructuring, the system had reached $80 per ton CO2 in 2024 and was scheduled to increase annually by $15 per ton, reaching $170 per ton by 2030 (Government of Canada, 2025c).
This policy shift reflects persistent implementation challenges that arise when federal environmental policies intersect with provincial constitutional authority and regional economic interests. The elimination of consumer-facing carbon pricing while maintaining industrial carbon pricing systems represents a strategic recalibration that prioritizes federal authority over large emitters while accommodating provincial resistance to broad-based carbon pricing.
The Two-Track Pattern of Policy Effectiveness
The empirical evidence reveals stark differences in policy effectiveness across economic sectors, with emissions outcomes varying dramatically based on structural characteristics. Analysis of greenhouse gas emissions data demonstrates a clear pattern of policy impact across the Canadian economy.
Table 4.
Sectoral Greenhouse Gas Emissions in Canada (Mt CO2eq).
| Economic Sector | 2005 | 2023 | Change 2005-2023 (%) |
|---|---|---|---|
| Oil and Gas | 194.5 | 208.0 | +6.9% |
| Transportation | 156.2 | 156.6 | +0.3% |
| Electricity | 115.9 | 48.8 | -57.9% |
| heavy industry | 86.8 | 78.3 | -9.8% |
| Buildings | 82.3 | 82.7 | +0.5% |
| Total National | 759.0 | 694.0 | -8.6% |
Source: Environment and Climate Change Canada (2025), Greenhouse Gas Emissions data.
The electricity sector achieved remarkable decarbonization success, with emissions declining from 115.9 million tons of CO2 equivalent in 2005 to 48.8 million tons of CO2 equivalent in 2023, representing a decrease of nearly 58 percent. This transformation was primarily driven by Ontario’s provincially mandated phase-out of coal, which resulted in the elimination of coal-fired electricity generation between 2005 and 2014 (IIS, 2015). The success reflects the structural advantages of government intervention in sectors dominated by Crown corporations and regulated utilities, which are directly susceptible to government mandates.
Conversely, the oil and gas sectors present fundamentally different implementation challenges. Emissions from this sector increased from 194.5 million tons of CO2 equivalent in 2005 to 208.0 million tons of CO2 equivalent in 2023, representing a 6.9 percent increase despite the implementation of comprehensive federal climate policies. The transportation sector exhibited similar resistance to policy intervention, with emissions remaining relatively stable at approximately 157 million metric tons of CO2 equivalent in 2023 (Environment and Climate Change Canada, 2025).
This differential effectiveness reflects distinct characteristics of economic sectors and their susceptibility to government intervention. Electricity systems, dominated by provincial utilities and Crown corporations, present clear regulatory pathways for government action. Oil and gas production, characterized by private ownership, global market integration, and significant regional economic dependence, presents far more complex implementation challenges that resist direct government control (Viens, 2022).
Renewable Energy Policy Implementation
Federal renewable energy policies have achieved substantial deployment outcomes, though implementation has varied significantly across technologies and regions. The Clean Technology Investment Tax Credit offers a 30 percent refundable tax credit for renewable technologies implemented until 2034, while the Clean Electricity Investment Tax Credit provides additional support for generation projects that meet emission intensity thresholds of no greater than 65 tons of CO2 per gigawatt-hour (Natural Resource Canada, 2024).
Table 5.
Renewable Energy Capacity Growth in Canada.
| Technology | 2019 Capacity (GW) | 2014 Capacity (GW) | Growth Rate (%) |
|---|---|---|---|
| Wind | 13.4 | 18.0 | +34.3% |
| Solar (Utility-scale) | 2.1 | 4.0 | +90.5% |
| Solar (On-site) | 0.5 | 1.0 | +100.0% |
| Energy Storage | 0.11 | 0.33 | +200.0% |
Source: Canadian Renewable Energy Association (2025).
Provincial approaches to renewable energy policy implementation reveal significant variation in effectiveness. Quebec’s renewable energy auction system has achieved some of the lowest prices for wind and solar power in North America, demonstrating successful policy design that leverages competitive market mechanisms. Alberta’s Renewable Electricity Program facilitated significant wind and solar development through long-term contracts, though policy momentum has varied with changes in provincial government priorities (Patel and Parkins, 2023).
The Canada Infrastructure Bank’s commitment of over $3 billion to clean energy projects represents an innovative approach to addressing private sector investment gaps, though implementation has been slower than initially anticipated. This experience illustrates the broader challenges of translating federal policy intentions into operational outcomes within Canada’s complex institutional environment (IEA, 2020).
3.4.2. Interjurisdictional Conflict and Cooperation
Constitutional Constraints and Federal-Provincial Dynamics
Canada’s federal system presents fundamental implementation challenges for a coherent energy policy, stemming from the constitutional division of powers outlined in sections 91 and 92 of the Constitution Act, 1867. Provinces maintain constitutional jurisdiction over natural resources under section 92A, while the federal government holds authority over interprovincial trade, international commerce, and matters of national concern. This division creates overlapping jurisdictions and institutional friction, which significantly complicates policy implementation (Bratt, 2021).
The constitutional framework enables energy-consuming provinces with larger populations to elect federal governments that favor energy consumers. In contrast, energy-producing provinces can exercise constitutional authority over natural resources to resist federal policies that may constrain development. This structural dynamic creates persistent implementation challenges, as federal climate policies must navigate provincial resistance from jurisdictions whose economies heavily depend on fossil fuel production (Banks, 2018; Choudhury, 2019; Bratt, 2021).
Clean Electricity Regulations Implementation
The development and finalization of the Clean Electricity Regulations (CER) illustrate the complex negotiation processes required for implementing federal environmental policy within Canada’s federal system. Initially proposed to require electricity systems to achieve net-zero emissions by 2035 (Canada Gazette, 2024), these regulations illustrate the complexities of federal environmental policy implementation within Canada’s federal system. The regulations faced significant opposition from several provinces, particularly Saskatchewan and Alberta (Viens, 2022; Wang, 2025).
The final regulations, enacted in December 2024, represent substantial federal accommodation to provincial concerns (Canada Gazette, 2024). The emissions intensity limit was revised from the originally proposed 30 tons of CO2 per gigawatt-hour to 65 tons, with additional flexibility through offset credits. The timeline for achieving net-zero was extended from 2035 to 2050, with emission restrictions not taking effect until January 1, 2035 (Canada Gazette, 2024)
Alberta’s Electric System Operator concluded that the regulations pose significant risks to reliability and affordability, projecting $30 billion in additional costs and 35% higher wholesale electricity prices between 2035 and 2050. Saskatchewan has rejected the regulations as unconstitutional, while Alberta has announced its intention to launch a constitutional challenge (Schulz, 2024).
Indigenous Rights and Energy Development
Indigenous consultation requirements, established through Supreme Court decisions and the United Nations Declaration on the Rights of Indigenous Peoples Act (2021), introduce additional layers of complexity in implementing energy projects (Government of Canada, 2021). The federal government’s commitment to free, prior, and informed consent has significantly empowered Indigenous communities to influence decisions related to energy development. Yet, implementation remains challenging due to complex governance structures and varying community perspectives. The Energy Council of Canada recognizes that the risks faced by Indigenous communities and individuals were underappreciated and emphasizes this to bring it to the public sphere (Energy Council of Canada, 2022).
International Constraints and Policy Implementation
Canada’s energy policy operates within international constraints that limit domestic policy flexibility and complicate implementation. However, the United States-Mexico-Canada Agreement (CUSMA) does not include energy provisions that affect Canadian policy options, particularly the proportionality clause, which requires Canada to maintain energy export levels to the United States during supply shortages, which was previously present in NAFTA (Global Affairs Canada, 2019).
Cross-border electricity trade relationships with the United States create both opportunities and constraints for policy implementation. Quebec exports significant hydroelectric power to New England, while Manitoba exports to the US Midwest, requiring regulatory coordination between Canadian and American authorities. These relationships create interdependencies that affect domestic energy policy choices and limit unilateral Canadian action.
The completion of the Trans Mountain Pipeline expansion in May 2024 highlights ongoing federal support for fossil fuel infrastructure, despite climate commitments. The project, which cost over $34.2 billion and increased capacity from 300,000 to 890,000 barrels per day, represents the largest federal investment in energy infrastructure in decades (Government of Canada, 2024). This juxtaposition, namely federal financing of major hydrocarbon infrastructure alongside renewed commitments to net-zero, illustrates the deep structural contradictions that continue to define Canada’s energy policy landscape.
Together, the evidence across Section 3.4.1 and Section 3.4.2 reveals a policy architecture marked by impressive institutional sophistication but constrained by systemic fragmentation. It has achieved world-leading decarbonization in sectors under direct regulatory authority, like electricity. However, entrenched provincial autonomy, fossil-fuel dependence, and uneven federal–provincial coordination continue to limit the scope and speed of its economy-wide energy transition. This highlights that governance coherence, rather than technological capacity, remains the decisive factor in Canada’s pathway to net zero.
4. Methodology
The methodology of this paper includes a review of the literature, gathering secondary data, and statistical analysis. We conducted an extensive review of the literature to examine the energy situation in Canada and Bangladesh. Comprehensive database searches through the university library, which is connected to the consortium of libraries in the province. The university’s library system has access to 333 databases covering all subject areas. For our specific areas, we used various relevant keywords and key phrases. A single keyword or key phrase can yield numerous outcomes, including both relevant and irrelevant documents. We refined the search using more appropriate key phrases to obtain more targeted literature, and then applied our judgment to determine the relevance of the selected literature. This type of literature search was a continuous process from the project’s inception to its completion, as well as the writing of the final draft.
The library system often documents peer-reviewed and other scholarly articles. However, for a comprehensive energy transition literature, we need to consider non-peer-reviewed literature, including government and private industry reports, government policy documents, and reports and publications from advocacy groups. We used Google search for soft literature, which yielded many unpublished but worthwhile literature on policies, procedures, and arguments. These include research reports, government documents, policy briefs, and other departmental publications. As this is an academic article, we have avoided biased and unscientific documents. Consequently, newspaper editorials, op-eds, and similar electronic publications, such as blog posts or social media posts (e.g., Facebook or Instagram), are excluded.
Energy data are typically annual data that often exhibit long-term trends driven by economic growth, policy changes, technological advancements, and external factors such as GDP, population, or energy prices. We collected secondary data from several sources, including various issues of the Statistical Review of World Energy published by the Energy Institute [previously published by the British Petroleum (BP)], the International Energy Agency (IEA), the International Renewable Energy Association (IRENA), Statistics Canada, the Bangladesh Bureau of Statistics (BBS), Statista, and others. As most of the energy data we used are annual, seasonality is minimal compared to monthly or daily data; however, autocorrelation, non-stationarity, and nonlinear patterns are standard. In this paper, we applied the ARIMA (Auto Regressive Integrated Moving Average), ETS (Error, Trend, Seasonality), and Prophet models to forecast energy production and consumption for the period from 2025 to 2035, based on historical data from 1965 to 2024.
ARIMA models (Box and Jenkins, 1976) forecast future values based on past observations, incorporating autoregressive (AR), differencing for stationarity (I), and moving average (MA) components. It is well-known that ARIMA models are effective in modeling univariate non-stationary time series with trends and autocorrelation. The general ARIMA(p, d, q) model can be expressed as:
where,
- is the AR polynomial
- is the MA polynomial
- is the backshift operator:
- is white noise
- is the degree of differencing.
Alternatively, the ARIMA model can be expressed explicitly as:
where is the differenced series. For annual data, parameters like (p, d, q) are tuned to capture trends without seasonal components.
The ETS model (Hyndman et al., 2002; 2008) is a generalized, state-space formulation of exponential smoothing. It provides a systematic way to model time series by combining: (1) error: additive (A) or multiplicative (M); (2) trend: none (N), additive (A), damped additive (Ad), multiplicative (M), or damped multiplicative (Md); (3) seasonality: none (N), additive (A), or multiplicative (M). It is a generalized, state-space formulation of exponential smoothing. Below are some popular ETS models.
- ETS(A, N, N) model is equivalent to Simple Exponential Smoothing (additive error, no trend, no seasonality). The observation equation is with the state (transition equation consisting of only the level component: where (0 ≤ ≤ 1) is a smoothing parameter controlling how much weight is given to the most recent error.
- ETS(A, A, N) corresponds to Holt’s Linear Trend model (additive error, additive trend, no seasonality). The observation equation is with the state (transition) equations, i.e., level (smoothed value) and trend (slope) updates: and . Both and are smoothing parameters (0 ≤ ≤ 1, 0 ≤ ≤ 1).
- ETS(A, A, A) is equivalent to Holt-Winters’ seasonal model with additive error (additive error, additive trend, and additive seasonality). The observation equation is with level, trend and seasonal updates:where , and are smoothing parameters (0 ≤ ≤ 1, 0 ≤ ≤ 1, 0 ≤ ≤ 1), and is the seasonal period.
- ETS(A, A, M) is mathematically equivalent to Holt-Winters’ model with additive errors and multiplicative seasonality (additive error, additive trend, and multiplicative seasonality). The observation equation is with level, trend, and seasonal updates:where , and are smoothing parameters (0 ≤ ≤ 1, 0 ≤ ≤ 1, 0 ≤ ≤ 1), and is the seasonal period. All these parameters can be estimated using the maximum likelihood methods.
- ETS(M, A, A) is mathematically equivalent to Holt-Winters’ model with multiplicative errors and additive seasonality (multiplicative error, additive trend, and additive seasonality). The observation equation is with level, trend, and seasonal updates:where , and are smoothing parameters (0 ≤ ≤ 1, 0 ≤ ≤ 1, 0 ≤ ≤ 1), and is the seasonal period.
For damped trend models, replace with where is the damping parameter. The “ets()” function in the R package “forecast” automatically identifies the best model by evaluating all possible combinations of error, trend, and seasonal components (up to 30 models) and selecting the one with the lowest information criterion (e.g., AICc).
The Prophet model (Taylor and Letham, 2018), developed by Meta AI, is a time series forecasting tool designed for robust and flexible modeling of time series data that includes trends, seasonality, and holidays. Prophet is an additive model that decomposes a time series into: 1) trend: a piecewise linear or logistic growth curve to capture long-term changes; 2) seasonality: annual or multi-year cycles (if present); 3) holidays/events: user-defined impacts of specific events (e.g., policy changes); 4) exogenous regressors: external variables like GDP or oil prices. Bayesian methods estimate model parameters. While the Prophet model handles univariate series well, its accuracy improves with relevant external variables.
Mathematically, the Prophet model decomposes a time series as follows:
- : Observed value at time .
- : Trend component (piecewise linear or logistic).
Piecewise Linear Trend (default):
where is the base growth rate, is the change in growth rate at the changepoint , is the base offset, is the offset adjustment for continuity.
Logistic Trend (for bounded exponential growth):
where is the carrying capacity.
- : Seasonal component (yearly, weekly, etc.) is modelled with a Fourier series:where is the period (e.g., 365.25 for yearly, 7 for weekly), is the number of Fourier terms. Multiple seasonalities (e.g., yearly, weekly) can be included.
- : Holiday component (optional) can be modelled aswhere is the effect of the holiday and is the date for the holiday .
- : Additive error, assumed .
The “prophet()” function in the R package “prophet” can be used to fit the Prophet model. Unlike “auto.arima()” and “ets()”, which automatically select the best model by testing multiple parameter combinations, the Prophet model does not automatically select a different model class entirely. Instead, it uses a single, flexible additive model framework that automatically tunes its parameters (e.g., trend flexibility, seasonality strength, and holiday effects) to fit the data. It achieves this through a Bayesian approach and optimization techniques. Users can further fine-tune the model by adjusting parameters (e.g., ‘changepoint.prior.scale’ for trend flexibility) or adding custom seasonality/holidays.
ARIMA, ETS, and Prophet are all time series forecasting models, but they have different strengths. ARIMA is well-suited for stationary data and is computationally efficient for simple patterns, whereas ETS (Error, Trend, Seasonality) is effective for data with trends and seasonality, often outperforming ARIMA in such cases (Gao, 2024). Prophet is designed for real-world data with strong seasonal effects and holidays, is flexible, and user-friendly, though it may not always be the most accurate model. Muhlehner et al. (2023) conclude, based on a comprehensive analysis, that each model has its distinct advantages and shortcomings.
ARIMA, ETS, and Prophet models are selected for their robust flexibility and powerful forecasting capabilities. Despite the absence of intra-year seasonality in annual data, these models effectively capture long-term trends through their distinct components. ARIMA leverages autoregressive and moving average terms to model trends and dependencies, ETS employs exponential smoothing for smooth trend forecasting, and Prophet uses piecewise linear trends with automatic changepoint detection. Each model’s ability to adapt to trending patterns makes it well-suited for annual energy data, ensuring accurate and reliable forecasts.
5. Transition Potential – A Comparative Analysis
The world is seeking a transition to renewable energy, regardless of whether it is a developed or developing country, rich or poor, resource-rich or resource-poor, northern or southern. However, not all economies have the same or similar capability for transition from non-renewable to renewable energy. Examining transition also has many dimensions, and as such, challenges have been addressed from several directions (Weijnen et al., 2021; OECD, 2023). Several studies have addressed the energy transition for specific regions or countries (Kaminski, 2022; Asuka and Jin, 2022; Hunter and Pearce, 2023; Spence, 2024; Wolff and Young, 2024). Fabra and Reguant (2024), upon an extensive theoretical and practical analysis, find that the energy transition is a balancing act. They identify that determining the most effective way of operationalizing the transition is the most challenging. Finding a cost-effective policy option is neither necessary nor sufficient for energy transition; rather, the policy option must be feasible, fair, effective, and credible, hence the requirement for a balancing act (Fabra and Reguant, 2024). Yang et al. (2024) presented the external and connotative aspects of energy transition, including its mechanisms and effects. They also explained the mechanisms of energy transition, including technological innovation, market mechanisms, policy arrangements, and cultural factors. The ramifications are social, economic, and ecological effects (Yang et al., 2024). Pereira et al (2025) compared transition potential between developed and developing countries. We compare two economies: one energy-rich, such as Canada, and the other energy-poor, like Bangladesh.
5.1. Bangladesh – A Case of Limited Potential
As the global shift toward renewable energy intensifies in response to climate change, countries like Bangladesh face a unique set of challenges. Despite growing awareness of environmental degradation and the urgent need to reduce greenhouse gas emissions, Bangladesh’s transition to renewable energy remains limited in both scope and impact. Economic constraints, high population density, limited natural resources, and infrastructural deficiencies all contribute to the country’s struggle to embrace a fully renewable future.
Bangladesh faces a significant challenge due to being one of the most densely populated countries in the world (Moazzem et al, 2024; Cunningham, 2024). This poses a significant barrier to large-scale solar farms or wind turbine installations, which require vast tracts of land. Land is already under pressure from housing, agriculture, and industry, leaving little room for utility-scale renewable projects. Unlike countries with consistent wind patterns or large mountainous regions for hydroelectric projects, Bangladesh lacks the natural conditions for reliable wind and hydropower development. The flat deltaic topography and variable wind speeds make large-scale wind power inefficient and unfeasible in most areas.
Bangladesh is deficient in all three fossil fuels: coal, natural gas, and oil. It only has some natural gas. However, as a growing economy, it consumes all three fossil fuels. It is expected that the demand for consuming fossil fuels in Bangladesh will continue to grow. Although coal is the dirtiest fossil fuel, its consumption in Bangladesh is expected to increase, as forecasted by all three models: ARIMA, ETS, and Prophet models (Figure 25). Since the trend of the forecast of all three models is the same, we can rely on the estimates being robust. Upon cross-validation, all models yield similar outcomes, and for brevity, we’ll not further elaborate on the minor differences among the models. Additionally, since all three models yield similar results, we have included only the results from the ARIMA model for the renewable energy forecasts.
The production and consumption of natural gas are similar, as Bangladesh historically has not imported or exported natural gas. However, the reserve has started to decline, and as a result, production continues to decline. The forecast for natural gas production and consumption remains highly variable (Figure 25), as both sides contain substantial uncertainty. The future trend of natural gas production depends on future discoveries, and future consumption depends on both domestic production and imports. In recent years, Bangladesh has started importing LNG by establishing a floating regasification plant.
Figure 25 illustrates the increasing disparity between production and consumption of coal in Bangladesh. Bangladesh does not have quality coal (Appendix Table). The small amount it has (Energy Data Centre, 2024) is of lower quality, but it imports a substantial amount of coal due to high energy demand. It produces a limited amount of coal through its Barapukuria coal mine in the northern part, whose economic and power-generation capacity is small. Much of the coal it uses is imported (Pressburger et al. 2022a; Energy Data Center 2024). Recently, Bangladesh has commissioned a coal-fired electricity plant near the Sundarban area. Even though the claim is for using clean coal [coal dust] for a lower environmental footprint, reviews suggest otherwise. Samiullah et al. (2024) report that coal-fired power plants can cause thermal pollution, chemical contaminants, acidification, habitat disruption, and endocrine disruptors through degraded water bodies and aquatic ecosystems, and suggest the need for rigorous monitoring and strict restrictions.
As discussed earlier, natural gas is the only indigenous fossil fuel Bangladesh has, which is being depleted at a drastic rate. By 2023, 71 percent of the natural gas reserve will have already been produced, and the remaining reserve is only 29 percent (Hydrocarbon Unit, 2024). Our forecast shows a similar trend (Figure 25), and by 2035, natural gas may be completely exhausted, with no economic reserve remaining (Appendix). The difference between production and consumption is to be met by imported natural gas in the form of LNG. Bangladesh has already begun importing LNG, and future LNG imports are expected to continue increasing (Islam et al., 2023; Alam, 2024).
Oil is another fossil fuel that Bangladesh is entirely dependent on imports. Despite being energy-poor, especially in terms of fossil energy, the demand for energy continues to increase due to economic growth and an improving standard of living. Therefore, attention must be paid to the potential for developing renewable energy sources.
Developing and deploying renewable energy technologies requires significant capital investment, technical expertise, and infrastructure, which Bangladesh currently lacks. While international aid and private sector investment have contributed to some progress, the pace remains slow due to limited financial resources, bureaucratic delays, and a lack of local manufacturing capacity for renewable equipment.
The country’s aging and fragmented electricity grid is ill-equipped to handle variable and decentralized power sources, such as solar and wind energy. Integrating renewable energy into the national grid would require major upgrades and investment, which adds to the financial burden. Like most developing countries, the energy sector in Bangladesh is highly subsidized, which disproportionately benefits the wealthy, and the removal of energy subsidies would be beneficial to the economy, increasing GDP (Timilsina and Pargal, 2020). The magnitude of the impact, however, depends on how the budgetary savings from the removal of the subsidy and the increased revenues from natural gas are reallocated to the economy. Government subsidies for natural gas and coal have kept fossil fuel prices artificially low, making them more attractive than renewables in the short term. This distorts the energy market and reduces incentives for renewable investment (Gass and Echeverria. 2017)
Despite these challenges, Bangladesh has made progress in certain areas, particularly in the implementation of solar home systems (SHS). Over sis million rural households now have solar panels, making Bangladesh a global leader in off-grid solar. These systems have helped improve access to electricity in remote areas and reduce reliance on kerosene (BPDB, 2021; Hossain et al, 2023). Other initiatives, such as rooftop solar installations for commercial buildings and pilot biogas projects in rural areas, show that renewables can be effective on a small scale in specific contexts. However, scaling these up to meet national energy demands remains a significant hurdle (BPDB 2021).
Ironically, while Bangladesh is one of the least responsible for global carbon emissions, it is among the most vulnerable to the impacts of climate change—rising sea levels, extreme weather, and temperature increases. Yet, its dependence on fossil fuels may deepen in the short term, as the country prioritizes economic development and energy security over environmental concerns.
Recently, with substantial pressure from the Government and private organizations, there has been an impetus on producing renewable energy as much as possible, especially through the installation of solar panels (Uddin et al., 2019; Payel et al., 2024). A forecasting model, based on ARIMA, shows an exponential increase (Figure 26), but that is unrealistic. Among the three renewable energy sources, only solar energy shows a rapid growth. This is simply because the forecast demonstrates the recent trend. Bangladesh has minimal space for solar panels, as it is a highly densely populated country. Nonetheless, the potential for further increase exists, but not to a considerable extent.
Bangladesh’s path to renewable energy is marked by structural limitations that restrict its potential for a large-scale transition (Hossain et al, 2023). Although it has demonstrated leadership in certain areas, such as rural solar home systems, broader adoption of renewables is hindered by land constraints, limited resources, financial barriers, and infrastructural weaknesses. Without significant international support, technology transfer, and long-term planning, Bangladesh is likely to remain a case of limited potential in the global renewable energy movement—despite its urgent need for sustainable solutions.
5.2. Canada – A Case of Enormous Potential
Canada is one of the world’s most resource-rich and technologically advanced countries, positioning it exceptionally well to lead the global transition to renewable energy. With vast land, abundant natural resources, low population density, and a strong policy framework, Canada has the geographic, economic, and political capacity to become a renewable energy powerhouse. It has a significant amount of fossil energy reserves and production facilities. It is rich in all three fossil fuels: crude oil, natural gas, and coal (Dubreuil, 2001).
Coal production and consumption increased up to the late 1090s but consistently declined since then. On the other hand, both natural gas and oil production and consumption continue to grow (Figure 27). Coal mining was intimately related to Canada’s economic and social development history (Muise and McIntosh, 1996). Several factors have contributed to the recent decline and potential elimination of coal production in Canada. Increasing production costs resulting from the exhaustion of surface mining, lower global prices due to increased substitution by oil and natural gas, and environmental concerns are cited as the major ones (Smith, 2004; BC, 2021). Our forecast indicates that coal production will continue on a smaller scale, but consumption is expected to decline to zero by 2030, which is precisely the expected result (PPCA, 2022).
Both oil and natural gas production are expected to continue to increase. Canada is building new and expanding existing pipelines to export more oil and has started its first shipment of LNG in July 2005 (CAPP, 2025; Aliakbary and Mejia, 2025).
The energy situation in Canada can be compared to that of Norway, except that Norway’s economy is based on oil and natural gas, rather than coal (Rosendal et al., 2019). With the reduction of coal production, such similarity becomes even closer. Norway has successfully transitioned its energy sector from non-renewable to renewable sources. It produces all its electricity from renewable sources, primarily from hydro, with some contributions from wind, thermal, and solar (Kallbekken et al., 2025). In addition to its exports of oil and gas, it also exports its electricity produced from renewable sources.
Like Norway, Canada has an enormous potential for producing renewable energy, and it is increasingly vital for meeting climate targets and building a sustainable energy future. Canada already generates over 65 percent of its electricity from renewable sources, with hydropower being the dominant contributor (NRC, 2024a). The remaining energy mix includes nuclear, natural gas, and a small but growing share of wind, solar, biomass, and tidal power. As of 2024, Canada is actively expanding its clean energy infrastructure through public investment, Indigenous partnerships, and private innovation (Solarin et al., 2021; Bennett et al., 2023; Abdolmaleki et al., 2024).
Canada’s vast land, with its variable topography and weather patterns, provides it with a diverse range of renewable energy-producing capacities. Some parts, particularly Quebec and British Columbia, have large potential for hydropower. Rivers, such as the St. Lawrence, Peace, and Nelson, are a good source of large hydroelectric power capacities. The prairie provinces, like Alberta, Saskatchewan, Manitoba, and Ontario, have vast open land with substantial opportunity for wind and solar power. The maritime provinces in the east and British Columbia’s coast in the west offer an excellent facility for offshore wind energy. However, its cold weather and variable sunlight between winter and summer pose substantial challenges. Its extensive forests and agricultural sector produce large amounts of organic waste suitable for bioenergy. Coastal provinces like Nova Scotia and British Columbia are exploring tidal and geothermal energy, representing untapped future sources.
Canada has a well-developed energy sector with the engineering, manufacturing, and technological infrastructure needed to support a large-scale renewable transition. From smart grids and battery storage to electric vehicles and hydrogen research, Canada has the tools to support clean energy innovation. The Canada Electricity Advisory Council forecasts a continuous increase in electricity production until 2050 (Figure 28). This is a highly optimistic scenario, but not impossible.
The federal government has committed to achieving net-zero emissions by 2050 and has introduced carbon pricing, clean energy subsidies, and a Clean Electricity Standard. Provinces such as Quebec and British Columbia have also implemented aggressive climate policies to support renewable energy development (Environment and Climate Change Canada, 2022). Many renewable energy projects in Canada are co-developed with Indigenous communities, offering economic development opportunities and respecting traditional knowledge and sovereignty. This collaborative model strengthens social support for clean energy while fostering equity (Indigenous Clean Energy, 2020).
As a G7 nation, Canada has a responsibility to lead on climate action. A shift to 100 percent renewable energy would drastically reduce emissions from electricity, buildings, transportation, and industry. Canada could become a global exporter of clean energy, including hydrogen, renewable electricity, and critical minerals used in the production of batteries and solar panels. Job Creation and Economic Diversification Renewable energy development can create tens of thousands of jobs, especially in rural and Indigenous communities, while reducing reliance on volatile fossil fuel markets (Canada Electricity Advisory Council, 2024).
Canada’s renewable energy is almost entirely domestically sourced, with negligible impact from other governments. It is immune to global fuel price shocks and increasingly cost-competitive with fossil fuels. Despite its enormous potential, Canada must overcome several barriers:
- (i)
- Fossil Fuel Dependence: The oil and gas sector remains economically significant, particularly in Alberta and Newfoundland. A just transition will require retraining workers and managing economic impacts. Transitioning to renewable energy does not mean eliminating fossil fuels; instead, following Norway’s system (Kallbekken et al, 2025), Canada can continue to export fossil energy while building renewables to become self-sufficient.
- (ii)
- Interprovincial Grid Limitations: Canada’s electricity grid is fragmented by province, which limits the interconnection required to transfer renewable power across regions. It is more integrated with the US than it is with the other provinces, which is a concern for energy security.
- (iii)
- Permitting and Bureaucracy: Long timelines for environmental assessments and project approvals can delay renewable projects. Recently, the federal government announced that it would streamline the approval process for energy projects.
- (iv)
- Equity Concerns: Ensuring that low-income, remote, and Indigenous communities benefit from the energy transition requires inclusive planning and investment. Most energy projects are located in remote and rural areas, but the benefits are disproportionately distributed to affluent areas, leaving local communities with little to gain. Policies need to be developed and implemented so that the local community sees the benefits and does not oppose the developments.
With the right policies, investments, and partnerships, Canada can become a global leader in renewable energy. By expanding wind and solar, modernizing its grid, phasing out fossil fuel subsidies, and supporting clean technology innovation, Canada could achieve 100% clean electricity well before 2050 (Canada Electricity Advisory Council, 2024). Provinces like Quebec, British Columbia, and Prince Edward Island are already leading the way, demonstrating how regional solutions can contribute to a national clean energy vision.
Canada possesses enormous and diverse renewable energy potential, unmatched by many other countries. From hydropower and wind to bioenergy and emerging technologies, Canada has the resources, knowledge, and political will to transition to a sustainable energy future. While challenges exist—especially in aligning provincial and federal agendas—the path toward clean energy is not only possible, but economically and environmentally necessary. By harnessing its renewable strengths, Canada can ensure a resilient, equitable, and carbon-free energy system for generations to come.
Our short-term (ten-year) forecast, based on ARIMA, paints a different picture (Figure 29). The general increasing trend of wind and solar energy production makes sense. The growing trend of nuclear energy is also realistic, as discussions are underway to establish nuclear facilities in various parts of the country. However, the declining trend of hydro seems counterintuitive. In recent years, hydroelectricity generation has faced challenges due to low precipitation, and the lower trend forecast is the result of the recent downward trend.
As of 2021, only around 1% of the globally produced hydrogen comes from renewable energy sources (Karayel and Dincer, 2024a). Canada can become a leader in hydrogen production if it can utilize it correctly; the value is determined by several factors, such as geographical location, wind potential, and topological constraints (Karayel and Dincer, 2024a). Canada possesses specific innate advantages for developing a sustainable hydrogen economy, including a robust livestock sector, a strong energy sector, and robust international relationships (Ghorbani et al., 2025). In fact, many of the provinces, such as Alberta, Quebec, and Ontario, have wind projects across the country (Karayel and Dincer, 2024). To implement this, a robust framework is necessary to integrate storage technologies for hydrogen, industrial applications, research and development, and international partnerships.
5.3. Comparative Potential – What Is at Stake
By comparing and contrasting the energy consumption patterns, production levels, investment trends, and policy effectiveness in Canada and Bangladesh, we uncover valuable insights and lessons:
- Energy Consumption and Production: Canada’s energy consumption is significantly higher per capita than that of Bangladesh, reflecting disparities in economic development and industrialization. While Canada is a net exporter of energy, Bangladesh heavily relies on imported fossil fuels, posing challenges to its energy security and economic stability.
- Investment and Policy Effectiveness: Canada has substantially invested in renewable energy infrastructure, supported by various policy incentives and emission reduction targets. However, the effectiveness of these policies has been uneven across provinces and territories. In contrast, while ambitious, Bangladesh’s renewable energy policies have faced implementation challenges due to financial constraints and infrastructure limitations.
- Economic Implications: The energy transition has divergent economic implications for the two nations. For Canada, the shift towards renewables has the potential to create new industries and jobs while reducing reliance on volatile fossil fuel markets. However, it also poses risks of economic disruption for established energy sectors. On the other hand, Bangladesh seeks energy security and affordability through renewable sources, which could alleviate the financial burden of importing fossil fuels.
- Lessons Learned: Canada’s gradual and decentralized approach to the energy transition, accounting for regional disparities and stakeholder interests, offers valuable lessons for managing complex energy systems. Conversely, Bangladesh’s targeted policies and rural electrification through solar home systems provide insights into addressing energy access and affordability challenges in developing nations.
- Given these various circumstances, Canada exhibits substantial potential for transitioning to renewable energy, leveraging its natural resources, environmental conditions, and financial, institutional, and technological capabilities, similar to Norway. In contrast, Bangladesh has limited natural and ecological resources, as well as poor financial, institutional, and technological capabilities.
6. Conclusion and Policy Recommendations
6.1. Synthesis of Key Findings
This comparative analysis of Canada and Bangladesh demonstrates that the transition from fossil fuels to renewables is shaped not only by resource endowment but by governance quality, institutional coordination, and policy coherence. Our econometric analysis & forecasts (Section 4) reveal that renewable-energy trajectories in both countries are characterized by asymmetrical transition potential: Canada possesses abundant renewable resources but faces governance inertia, whereas Bangladesh exhibits strong policy intent but limited financial and infrastructural capacity.
Forecasting results further indicate that Bangladesh’s renewable energy share will grow steadily yet insufficiently under a business-as-usual scenario, reaching only 15–18 percent of total electricity generation by 2041, unless accelerated investment and institutional reforms occur. Conversely, Canada’s renewable share, already exceeding 65 percent of electricity generation, is projected to plateau after 2030 due to persistent dependence on oil and gas and the absence of coherent federal–provincial coordination mechanisms. These projections underscore that policy and institutional variables, rather than merely technological or resource availability, determine the transition speed.
In Bangladesh, Section 2 and Section 4 indicate that the dominance of natural gas (accounting for around 68 percent of primary energy) and reliance on imported fuels create fiscal and external sector vulnerabilities. Despite ambitious national targets, namely 5 percent renewable energy by 2015, 10 percent by 2020, and 40 percent by 2041, the country failed to achieve early milestones due to limited investment capacity, bureaucratic overlap, and slow project implementation.
In Canada, Section 3 reveals that while electricity decarbonization has been highly successful (a 58 percent emissions reduction since 2005), emissions in oil, gas, and transportation have mainly remained static or have increased. The federal system’s constitutional fragmentation, combined with entrenched fossil-fuel political influence, constrains a unified transition pathway.
Across both contexts, the empirical findings reinforce a central conclusion: the energy transition is not a linear technological substitution, but a socio-political transformation that requires coordinated institutions, stable financing for renewables, and ensuring public and political acceptance of the transition costs.
6.2. Comparative Reflections on Transition Pathways
The divergent paths of Bangladesh and Canada reflect differences in four structural dimensions: economic context, institutional capacity, financial resources, and political legitimacy.
Economically, Bangladesh faces the dual challenge of expanding energy access and decarbonizing its energy system simultaneously. Its low per capita electricity consumption (less than 700 kWh annually) contrasts sharply with Canada’s high consumption levels (over 14,000 kWh per capita), reflecting fundamentally different stages of development. For Bangladesh, the transition to renewables is both an environmental and developmental necessity. Canada, conversely, faces the challenge of decarbonizing a mature energy system heavily integrated with global hydrocarbon markets. Forecasts from Section 4 suggest that, absent major policy innovation, Canada’s oil- and gas-sector emissions will continue to offset gains in other sectors, limiting net reductions.
Institutionally, Canada’s federal structure enables policy experimentation but also produces interjurisdictional conflict, particularly between energy-producing and energy-consuming provinces. Bangladesh’s centralized system allows more unified planning, but it suffers from limited institutional capacity and overlaps among agencies, such as SREDA and BPDB.
Financially, Bangladesh’s energy transition is hindered by limited access to affordable long-term financing. Section 2.4 notes that green projects struggle to attract investment due to high perceived risks and long payback periods. In contrast, Canada’s financial markets and institutions have greater access to capital, but investment flows remain concentrated in fossil fuel projects due to established infrastructure and entrenched interests. As noted in section 3.4, the fossil fuel sector’s lobbying power has further skewed federal investment patterns toward hydrocarbons, despite formal commitments to decarbonization (Viens, 2022).
Politically, both countries must navigate challenges to social acceptance. In Canada, opposition often arises from fossil-fuel-dependent communities concerned about job losses and regional inequities. In Bangladesh, resistance is more closely tied to the affordability and accessibility of energy. However, in both cases, public engagement and community participation emerge as crucial factors for building trust and sustaining momentum during the transition. Studies from other contexts, such as Germany’s community energy cooperatives (Boucher and Pigeon, 2024), demonstrate that public ownership and participation can significantly enhance the legitimacy and speed of energy transitions.
Together, these dimensions confirm that effective energy transition requires aligning economic priorities, governance structures, financial incentives, and citizen participation within coherent national strategies.
6.3. Policy Recommendations
Based on comparative analysis and drawing from successful international experiences, we propose differentiated policy recommendations tailored to each country’s specific context and capabilities:
Bangladesh
Bangladesh’s transition will succeed only if renewable expansion is integrated with economic stability and institutional reform. Based on our findings, we recommend the following policies:
1. Strengthen coordination through a National Energy Transition Authority (NETA).
As shown in Section 2.4, overlapping mandates among the Power Division, SREDA, and BPDB hinder effective planning and coordination. A dedicated NETA should coordinate renewable strategies, streamline approvals, and monitor progress. Morocco’s centralized agency (MASEN) offers a valuable precedent for ensuring accountability and unified implementation (Bhattarai et al., 2022).
2. Scale solar energy through targeted, bankable programs.
Building on the success of Solar Home Systems (Section 2.3), Bangladesh should prioritize grid-connected solar parks, rooftop systems, and urban microgrids. Fast-track permitting, net-metering expansion, and blended financing mechanisms, like Vietnam’s solar model (World Bank, 2021), can accelerate capacity growth while minimizing fiscal strain.
3. Diversify energy supply and reduce import dependence.
Given the rising costs of LNG and oil imports, Bangladesh should expedite the exploration of onshore and offshore gas blocks under transparent Production Sharing Agreements, while utilizing natural gas as a bridge fuel during the transition to renewable energy. Strategic use of domestic resources will enhance short-term energy security and reduce exposure to volatile global markets.
4. Mobilize finance through innovative instruments.
Bangladesh Bank’s green refinancing should be expanded to include risk-sharing facilities and concessional loans for renewable projects. Establishing a Green Energy Fund, supported by development partners, can provide long-term financing for grid modernization and storage. Experiences from India and Kenya show that such dedicated funds attract private capital (IEA, 2023).
5. Upgrade grid infrastructure and storage capacity.
Section 2.3.4 notes that system losses and weak transmission lines constrain the integration of renewable energy sources. Investments in smart grids, advanced metering, and battery storage, supported by international partnerships, are critical to reducing inefficiency and enabling large-scale solar and wind connectivity.
6. Build human and technical capacity.
As discussed in Section 5, Bangladesh’s energy transition depends on skilled manpower. Targeted programs in universities and vocational institutions, developed in collaboration with industry, can enhance local technical expertise and skills. Over time, this will reduce reliance on foreign contractors and enhance domestic innovation.
Canada
For Canada, the central barriers are political and institutional rather than technical or financial. Drawing on Section 3 and Section 5, the following recommendations address these systemic issues:
- Reform intergovernmental coordination for coherent climate policy.
As shown in Section 3.4, provincial control over natural resources creates fragmented policy outcomes. Canada should adopt a binding federal–provincial emissions framework aligning renewable targets and transition timelines. Germany’s federal climate law, which sets sectoral emission budgets and enforces corrective action, provides a relevant model (IEA, 2022).
- 2.
- Curb fossil fuel influence in policymaking.
Long-standing industry lobbying has perpetuated hydrocarbon dependency (Viens, 2022). Stronger lobbying disclosure rules, the exclusion of fossil fuel representatives from climate advisory bodies, and robust conflict-of-interest safeguards for policymakers would enhance transparency and credibility. Similar reforms in Norway and Denmark have strengthened public trust (Avelino et al., 2016).
- 3.
- Revitalize community-based renewables through cooperatives.
Section 3.5 notes the sharp decline in Renewable Energy Cooperatives (RECs) since 2016. The federal government should create a Cooperative Energy Fund, reintroduce stable price incentives (e.g., feed-in tariffs or contracts for difference), and enable virtual net metering. Germany’s REScoop federation demonstrates how community participation can accelerate the adoption of renewable energy (Boucher and Pigeon, 2024).
- 4.
- Implement a Just Transition Strategy for fossil fuel regions.
Resistance in Alberta and Saskatchewan reflects legitimate fears of economic loss. A Just Transition Fund should support worker retraining, regional diversification, and Indigenous-led renewable projects. Spain’s experience demonstrates that well-designed regional funds can build social consensus and maintain momentum (OECD, 2023).
- 5.
- Improve data transparency and progress monitoring.
Section 3.5 observes that incomplete data on community generation and emissions hinder evaluation. Canada should establish a national database that integrates renewable energy production, employment, and social equity indicators to promote a more comprehensive understanding of these aspects. Open data platforms, as utilized in the EU’s Clean Energy Observatory, can enhance accountability and facilitate policy learning.
6.4. Concluding Reflections and Future Directions
This study, employing forecasting and comparative analysis, presents new evidence that governance coherence, institutional adaptability, and inclusive finance are more significant determinants of transition success than resource endowment. For Bangladesh, empirical projections suggest that without significant institutional reform and financial mobilization, renewable energy expansion will fall short of its target. For Canada, the forecasts confirm that progress in electricity decarbonization cannot compensate for continued growth in fossil fuels unless federal–provincial coordination is substantially strengthened.
The broader implication is that policy design must evolve from fragmented, sector-based interventions to more coordinated transition strategies that integrate fiscal, regulatory, and social dimensions. Future research should extend the time-series models introduced in Section 4 to incorporate behavioral and distributional variables—such as income effects, employment, and regional disparities—better to predict the feasibility of transitions and social equity outcomes.
Comparative lessons also highlight the value of cross-national learning. Canada’s institutional experience with advanced technology and regulatory frameworks can inform Bangladesh’s capacity-building efforts, while Bangladesh’s rapid diffusion of decentralized solar systems offers insights for Canada’s community-energy initiatives. Both countries can benefit from collaborative mechanisms for technology transfer, climate finance, and knowledge exchange under multilateral platforms such as the Clean Energy Ministerial.
A promising avenue of strategic cooperation lies in natural gas trade. Canada’s emerging LNG export capacity through the new Kitimat terminal on the Pacific coast provides an opportunity to establish long-term supply partnerships with energy-importing economies such as Bangladesh. Such an arrangement could be mutually beneficial: Canada would diversify its export markets beyond North America while Bangladesh would enhance short- to medium-term energy security by securing stable and predictable LNG supplies. Because natural gas is the least carbon-intensive of the fossil fuels, this North–South energy cooperation would provide a pragmatic pathway for transition. It will facilitate the gradual displacement of higher-emission fuels, such as coal, in Bangladesh, while allowing Canada to align its export strategy with global decarbonization objectives.
Ultimately, the findings reaffirm that the pace and direction of the global energy transition are more closely governed by governance and institutional coherence than by resource endowments. Canada and Bangladesh illustrate that ambition and technology alone cannot drive transformation without coordinated, accountable policy frameworks. Lasting progress toward a low-carbon future will require aligning innovation, finance, and social inclusion within governance systems capable of turning ambition into measurable and just outcomes.
Appendix A. Production and Consumption Forecast Data with Confidence Interval for all Energy Resources, for Canada and Bangladesh
Canada: Coal Production (Exajoule) Forecasts with 95% CI
| ARIMA | ETS | Prophet | |||||||
| Year | Forecast | Lower | Upper | Forecast | Lower | Upper | Forecast | Lower | Upper |
| 2025 | 1.1 | 0.9 | 1.3 | 1.1 | 0.9 | 1.3 | 1.2 | 1.0 | 1.3 |
| 2026 | 1.1 | 0.9 | 1.4 | 1.1 | 0.9 | 1.4 | 1.1 | 1.0 | 1.2 |
| 2027 | 1.1 | 0.8 | 1.5 | 1.1 | 0.8 | 1.5 | 1.1 | 1.0 | 1.2 |
| 2028 | 1.1 | 0.7 | 1.5 | 1.1 | 0.7 | 1.5 | 1.1 | 1.0 | 1.2 |
| 2029 | 1.1 | 0.7 | 1.6 | 1.1 | 0.7 | 1.6 | 1.1 | 1.0 | 1.2 |
| 2030 | 1.1 | 0.6 | 1.6 | 1.1 | 0.6 | 1.6 | 1.1 | 0.9 | 1.2 |
| 2031 | 1.1 | 0.6 | 1.7 | 1.1 | 0.6 | 1.7 | 1.0 | 0.9 | 1.2 |
| 2032 | 1.1 | 0.6 | 1.7 | 1.1 | 0.6 | 1.7 | 1.0 | 0.9 | 1.2 |
| 2033 | 1.1 | 0.5 | 1.7 | 1.1 | 0.5 | 1.8 | 1.0 | 0.9 | 1.1 |
| 2034 | 1.1 | 0.5 | 1.8 | 1.1 | 0.5 | 1.8 | 1.0 | 0.8 | 1.1 |
| 2035 | 1.1 | 0.5 | 1.8 | 1.1 | 0.5 | 1.8 | 1.0 | 0.8 | 1.1 |
Canada: Coal Consumption (Exajoule) Forecasts with 95% CI
| ARIMA | ETS | Prophet | |||||||
| Year | Forecast | Lower | Upper | Forecast | Lower | Upper | Forecast | Lower | Upper |
| 2025 | 0.2 | 0.1 | 0.4 | 0.2 | 0.2 | 0.3 | 0.3 | 0.2 | 0.4 |
| 2026 | 0.2 | 0.0 | 0.4 | 0.2 | 0.1 | 0.2 | 0.3 | 0.2 | 0.3 |
| 2027 | 0.1 | -0.1 | 0.4 | 0.1 | 0.1 | 0.2 | 0.2 | 0.1 | 0.3 |
| 2028 | 0.1 | -0.2 | 0.4 | 0.1 | 0.0 | 0.1 | 0.2 | 0.1 | 0.3 |
| 2029 | 0.1 | -0.3 | 0.5 | 0.0 | 0.0 | 0.1 | 0.1 | 0.0 | 0.2 |
| 2030 | 0.0 | -0.5 | 0.5 | 0.0 | -0.1 | 0.0 | 0.1 | 0.0 | 0.2 |
| 2031 | 0.0 | -0.6 | 0.5 | -0.1 | -0.2 | 0.0 | 0.0 | -0.1 | 0.1 |
| 2032 | -0.1 | -0.7 | 0.5 | -0.1 | -0.2 | 0.0 | 0.0 | -0.1 | 0.1 |
| 2033 | -0.1 | -0.8 | 0.5 | -0.2 | -0.3 | -0.1 | -0.1 | -0.2 | 0.0 |
| 2034 | -0.2 | -0.9 | 0.5 | -0.2 | -0.4 | -0.1 | -0.1 | -0.2 | 0.0 |
| 2035 | -0.2 | -1.0 | 0.5 | -0.3 | -0.4 | -0.2 | -0.2 | -0.3 | 0.0 |
| Note: Canada’s coal consumption is projected to fall below zero after 2032, indicating that coal use may cease entirely in the country beyond this point. | |||||||||
Canada: Gas Production (bcm) Forecasts with 95% CI
| ARIMA | ETS | Prophet | |||||||
| Year | Forecast | Lower | Upper | Forecast | Lower | Upper | Forecast | Lower | Upper |
| 2025 | 198.2 | 188.8 | 207.6 | 197.9 | 187.8 | 207.9 | 203.0 | 178.1 | 227.6 |
| 2026 | 200.9 | 183.7 | 218.1 | 200.8 | 183.4 | 218.1 | 205.6 | 179.5 | 229.6 |
| 2027 | 203.5 | 181.0 | 226.0 | 203.1 | 178.3 | 227.9 | 208.2 | 183.1 | 232.9 |
| 2028 | 206.1 | 179.4 | 232.8 | 204.9 | 172.6 | 237.3 | 210.8 | 185.2 | 236.6 |
| 2029 | 208.8 | 178.4 | 239.1 | 206.4 | 166.7 | 246.2 | 213.4 | 189.0 | 237.8 |
| 2030 | 211.4 | 177.8 | 245.0 | 207.6 | 160.7 | 254.5 | 216.0 | 192.4 | 242.5 |
| 2031 | 214.0 | 177.5 | 250.6 | 208.6 | 154.7 | 262.4 | 218.6 | 193.7 | 245.3 |
| 2032 | 216.7 | 177.4 | 256.0 | 209.3 | 148.8 | 269.9 | 221.2 | 196.2 | 243.2 |
| 2033 | 219.3 | 177.4 | 261.2 | 209.9 | 143.0 | 276.9 | 223.8 | 198.2 | 250.2 |
| 2034 | 221.9 | 177.7 | 266.2 | 210.4 | 137.3 | 283.6 | 226.5 | 200.3 | 252.2 |
| 2035 | 224.6 | 178.0 | 271.2 | 210.8 | 131.8 | 289.9 | 229.1 | 202.0 | 251.6 |
Canada: Gas Consumption (bcm) Forecasts with 95% CI
| ARIMA | ETS | Prophet | |||||||
| Year | Forecast | Lower | Upper | Forecast | Lower | Upper | Forecast | Lower | Upper |
| 2025 | 130.1 | 124.6 | 135.6 | 130.4 | 120.2 | 140.6 | 129.3 | 126.3 | 132.2 |
| 2026 | 130.9 | 123.5 | 138.2 | 132.4 | 118.5 | 146.3 | 131.4 | 128.4 | 134.7 |
| 2027 | 132.6 | 124.7 | 140.6 | 134.5 | 117.6 | 151.4 | 133.6 | 130.6 | 136.9 |
| 2028 | 134.4 | 125.9 | 143.0 | 136.6 | 117.1 | 156.1 | 135.8 | 132.6 | 139.0 |
| 2029 | 136.2 | 127.1 | 145.3 | 138.7 | 116.8 | 160.5 | 138.0 | 134.9 | 141.5 |
| 2030 | 138.0 | 128.4 | 147.6 | 140.7 | 116.7 | 164.8 | 140.2 | 136.9 | 143.6 |
| 2031 | 139.8 | 129.7 | 149.8 | 142.8 | 116.7 | 168.9 | 142.4 | 138.9 | 145.9 |
| 2032 | 141.5 | 131.0 | 152.1 | 144.9 | 116.8 | 173.0 | 144.6 | 140.8 | 148.4 |
| 2033 | 143.3 | 132.3 | 154.3 | 146.9 | 116.9 | 176.9 | 146.8 | 143.2 | 150.7 |
| 2034 | 145.1 | 133.7 | 156.5 | 149.0 | 117.2 | 180.9 | 149.0 | 145.0 | 153.3 |
| 2035 | 146.9 | 135.0 | 158.7 | 151.1 | 117.4 | 184.7 | 151.2 | 146.4 | 155.7 |
Canada: Oil Production (kb/d) Forecasts with 95% CI
| ARIMA | ETS | Prophet | |||||||
| Year | Forecast | Lower | Upper | Forecast | Lower | Upper | Forecast | Lower | Upper |
| 2025 | 6072.8 | 5829.5 | 6316.0 | 6043.4 | 5421.8 | 6664.9 | 6166.3 | 6029.4 | 6300.1 |
| 2026 | 6206.6 | 5761.4 | 6651.8 | 6198.7 | 5240.4 | 7157.0 | 6347.6 | 6216.5 | 6478.5 |
| 2027 | 6340.4 | 5744.0 | 6936.8 | 6354.1 | 5080.7 | 7627.5 | 6528.9 | 6380.4 | 6671.6 |
| 2028 | 6474.2 | 5744.4 | 7204.0 | 6509.4 | 4921.2 | 8097.7 | 6710.3 | 6554.5 | 6869.7 |
| 2029 | 6608.0 | 5753.5 | 7462.6 | 6664.8 | 4754.6 | 8575.0 | 6892.1 | 6721.0 | 7062.1 |
| 2030 | 6741.8 | 5767.3 | 7716.3 | 6820.2 | 4577.3 | 9063.1 | 7073.4 | 6889.7 | 7268.7 |
| 2031 | 6875.6 | 5783.8 | 7967.4 | 6975.5 | 4387.4 | 9563.7 | 7254.7 | 7026.1 | 7461.4 |
| 2032 | 7009.4 | 5801.8 | 8217.1 | 7130.9 | 4183.8 | 10078.0 | 7436.0 | 7199.4 | 7679.7 |
| 2033 | 7143.3 | 5820.4 | 8466.2 | 7286.3 | 3965.7 | 10606.8 | 7617.8 | 7344.9 | 7883.6 |
| 2034 | 7277.1 | 5839.0 | 8715.1 | 7441.6 | 3732.6 | 11150.6 | 7799.2 | 7497.7 | 8112.1 |
| 2035 | 7410.9 | 5857.3 | 8964.4 | 7597.0 | 3484.2 | 11709.8 | 7980.5 | 7613.8 | 8323.2 |
Canada: Oil Consumption (kb/d) Forecasts with 95% CI
| ARIMA | ETS | Prophet | |||||||
| Year | Forecast | Lower | Upper | Forecast | Lower | Upper | Forecast | Lower | Upper |
| 2025 | 2354.0 | 2186.0 | 2521.9 | 2334.6 | 2146.7 | 2522.5 | 2340.7 | 2230.7 | 2453.5 |
| 2026 | 2374.7 | 2137.2 | 2612.3 | 2335.9 | 2069.9 | 2601.9 | 2336.9 | 2218.3 | 2452.7 |
| 2027 | 2395.5 | 2104.6 | 2686.4 | 2337.1 | 2011.0 | 2663.3 | 2333.0 | 2221.1 | 2454.9 |
| 2028 | 2416.3 | 2080.3 | 2752.2 | 2338.3 | 1961.3 | 2715.3 | 2329.2 | 2217.8 | 2446.9 |
| 2029 | 2437.0 | 2061.4 | 2812.6 | 2339.4 | 1917.4 | 2761.3 | 2325.3 | 2199.6 | 2441.1 |
| 2030 | 2457.8 | 2046.3 | 2869.3 | 2340.4 | 1877.7 | 2803.0 | 2321.5 | 2192.5 | 2449.5 |
| 2031 | 2478.6 | 2034.1 | 2923.0 | 2341.3 | 1841.1 | 2841.5 | 2317.7 | 2196.7 | 2442.7 |
| 2032 | 2499.3 | 2024.2 | 2974.4 | 2342.2 | 1806.9 | 2877.4 | 2313.8 | 2178.5 | 2445.9 |
| 2033 | 2520.1 | 2016.2 | 3024.0 | 2343.0 | 1774.8 | 2911.2 | 2310.0 | 2181.4 | 2451.9 |
| 2034 | 2540.9 | 2009.7 | 3072.0 | 2343.8 | 1744.3 | 2943.3 | 2306.2 | 2161.6 | 2447.4 |
| 2035 | 2561.6 | 2004.5 | 3118.7 | 2344.5 | 1715.2 | 2973.8 | 2302.3 | 2147.5 | 2447.9 |
Bangladesh: Coal Production (Exajoule) Forecasts with 95% CI
| ARIMA | ETS | Prophet | |||||||
| Year | Forecast | Lower | Upper | Forecast | Lower | Upper | Forecast | Lower | Upper |
| 2025 | 0 | 0 | 0 | 0 | 0 | 0 | 0 | 0 | 0 |
| 2026 | 0 | 0 | 0 | 0 | 0 | 0 | 0 | 0 | 0 |
| 2027 | 0 | 0 | 0 | 0 | 0 | 0 | 0 | 0 | 0 |
| 2028 | 0 | 0 | 0 | 0 | 0 | 0 | 0 | 0 | 0 |
| 2029 | 0 | 0 | 0 | 0 | 0 | 0 | 0 | 0 | 0 |
| 2030 | 0 | 0 | 0 | 0 | 0 | 0 | 0 | 0 | 0 |
| 2031 | 0 | 0 | 0 | 0 | 0 | 0 | 0 | 0 | 0 |
| 2032 | 0 | 0 | 0 | 0 | 0 | 0 | 0 | 0 | 0 |
| 2033 | 0 | 0 | 0 | 0 | 0 | 0 | 0 | 0 | 0 |
| 2034 | 0 | 0 | 0 | 0 | 0 | 0 | 0 | 0 | 0 |
| 2035 | 0 | 0 | 0 | 0 | 0 | 0 | 0 | 0 | 0 |
Bangladesh: Coal Consumption (Exajoule) Forecasts with 95% CI
| ARIMA | ETS | Prophet | |||||||
| Year | Forecast | Lower | Upper | Forecast | Lower | Upper | Forecast | Lower | Upper |
| 2025 | 0.3 | 0.3 | 0.4 | 0.3 | 0.3 | 0.4 | 0.3 | 0.2 | 0.3 |
| 2026 | 0.4 | 0.3 | 0.4 | 0.4 | 0.3 | 0.4 | 0.3 | 0.3 | 0.3 |
| 2027 | 0.4 | 0.4 | 0.5 | 0.4 | 0.4 | 0.5 | 0.3 | 0.3 | 0.3 |
| 2028 | 0.4 | 0.4 | 0.5 | 0.5 | 0.4 | 0.5 | 0.3 | 0.3 | 0.4 |
| 2029 | 0.5 | 0.4 | 0.6 | 0.5 | 0.4 | 0.6 | 0.3 | 0.3 | 0.4 |
| 2030 | 0.5 | 0.4 | 0.6 | 0.5 | 0.5 | 0.6 | 0.4 | 0.3 | 0.4 |
| 2031 | 0.6 | 0.4 | 0.7 | 0.6 | 0.5 | 0.7 | 0.4 | 0.4 | 0.4 |
| 2032 | 0.6 | 0.5 | 0.7 | 0.6 | 0.5 | 0.8 | 0.4 | 0.4 | 0.4 |
| 2033 | 0.6 | 0.5 | 0.8 | 0.7 | 0.5 | 0.8 | 0.4 | 0.4 | 0.4 |
| 2034 | 0.7 | 0.5 | 0.9 | 0.7 | 0.5 | 0.9 | 0.4 | 0.4 | 0.5 |
| 2035 | 0.7 | 0.5 | 0.9 | 0.8 | 0.6 | 1.0 | 0.5 | 0.4 | 0.5 |
Bangladesh: Gas Production (bcm) Forecasts with 95% CI
| ARIMA | ETS | Prophet | |||||||
| Year | Forecast | Lower | Upper | Forecast | Lower | Upper | Forecast | Lower | Upper |
| 2025 | 18.2 | 17.2 | 19.2 | 18.5 | 15.4 | 21.6 | 23.4 | 21.9 | 24.9 |
| 2026 | 16.6 | 14.7 | 18.5 | 17.2 | 13.2 | 21.1 | 23.4 | 22.0 | 25.0 |
| 2027 | 15.6 | 12.5 | 18.6 | 15.8 | 10.7 | 21.0 | 23.4 | 21.9 | 24.9 |
| 2028 | 14.8 | 10.4 | 19.3 | 14.5 | 7.8 | 21.2 | 23.4 | 21.8 | 24.9 |
| 2029 | 13.9 | 8.2 | 19.7 | 13.2 | 4.8 | 21.6 | 23.4 | 21.8 | 25.0 |
| 2030 | 13.3 | 6.4 | 20.3 | 11.8 | 1.6 | 22.1 | 23.4 | 21.7 | 25.0 |
| 2031 | 13.0 | 4.7 | 21.3 | 10.5 | -1.7 | 22.8 | 23.4 | 21.6 | 25.4 |
| 2032 | 12.5 | 3.0 | 22.0 | 9.2 | -5.1 | 23.5 | 23.4 | 21.4 | 25.4 |
| 2033 | 12.1 | 1.5 | 22.8 | 7.9 | -8.6 | 24.3 | 23.4 | 21.1 | 25.6 |
| 2034 | 12.0 | 0.2 | 23.8 | 6.5 | -12.2 | 25.2 | 23.4 | 20.9 | 25.8 |
| 2035 | 11.7 | -1.2 | 24.7 | 5.2 | -15.8 | 26.2 | 23.4 | 20.9 | 26.0 |
Bangladesh: Gas Consumption (bcm) Forecasts with 95% CI
| ARIMA | ETS | Prophet | |||||||
| Year | Forecast | Lower | Upper | Forecast | Lower | Upper | Forecast | Lower | Upper |
| 2025 | 27.1 | 25.5 | 28.6 | 29.2 | 24.5 | 33.9 | 31.4 | 30.1 | 32.5 |
| 2026 | 26.9 | 24.4 | 29.3 | 30.1 | 24.5 | 35.8 | 32.0 | 30.7 | 33.3 |
| 2027 | 26.7 | 23.3 | 30.0 | 31.0 | 24.5 | 37.8 | 32.7 | 31.6 | 33.9 |
| 2028 | 26.5 | 22.3 | 30.6 | 31.9 | 24.8 | 39.8 | 33.4 | 32.1 | 34.6 |
| 2029 | 26.3 | 21.3 | 31.3 | 32.8 | 24.8 | 41.8 | 34.0 | 32.8 | 35.3 |
| 2030 | 26.1 | 20.2 | 32.0 | 33.7 | 25.1 | 43.6 | 34.7 | 33.4 | 36.0 |
| 2031 | 26.0 | 19.2 | 32.7 | 34.5 | 25.2 | 45.5 | 35.4 | 33.9 | 36.8 |
| 2032 | 25.8 | 18.2 | 33.4 | 35.4 | 25.3 | 47.7 | 36.0 | 34.4 | 37.6 |
| 2033 | 25.7 | 17.2 | 34.2 | 36.3 | 25.5 | 49.1 | 36.7 | 35.0 | 38.5 |
| 2034 | 25.6 | 16.2 | 34.9 | 37.2 | 25.5 | 51.2 | 37.3 | 35.6 | 39.2 |
| 2035 | 25.4 | 15.2 | 35.7 | 38.0 | 25.9 | 52.9 | 38.0 | 36.0 | 40.2 |
Bangladesh: Oil Production (kb/d) Forecasts with 95% CI
| ARIMA | ETS | Prophet | |||||||
| Year | Forecast | Lower | Upper | Forecast | Lower | Upper | Forecast | Lower | Upper |
| 2025 | 0 | 0 | 0 | 0 | 0 | 0 | 0 | 0 | 0 |
| 2026 | 0 | 0 | 0 | 0 | 0 | 0 | 0 | 0 | 0 |
| 2027 | 0 | 0 | 0 | 0 | 0 | 0 | 0 | 0 | 0 |
| 2028 | 0 | 0 | 0 | 0 | 0 | 0 | 0 | 0 | 0 |
| 2029 | 0 | 0 | 0 | 0 | 0 | 0 | 0 | 0 | 0 |
| 2030 | 0 | 0 | 0 | 0 | 0 | 0 | 0 | 0 | 0 |
| 2031 | 0 | 0 | 0 | 0 | 0 | 0 | 0 | 0 | 0 |
| 2032 | 0 | 0 | 0 | 0 | 0 | 0 | 0 | 0 | 0 |
| 2033 | 0 | 0 | 0 | 0 | 0 | 0 | 0 | 0 | 0 |
| 2034 | 0 | 0 | 0 | 0 | 0 | 0 | 0 | 0 | 0 |
| 2035 | 0 | 0 | 0 | 0 | 0 | 0 | 0 | 0 | 0 |
Bangladesh: Oil Consumption (kb/d) Forecasts with 95% CI
| ARIMA | ETS | Prophet | |||||||
| Year | Forecast | Lower | Upper | Forecast | Lower | Upper | Forecast | Lower | Upper |
| 2025 | 321.5 | 300.0 | 343.0 | 279.0 | 223.0 | 334.7 | 272.7 | 260.1 | 286.4 |
| 2026 | 296.4 | 265.5 | 327.3 | 295.9 | 220.2 | 377.7 | 284.9 | 271.2 | 297.5 |
| 2027 | 293.8 | 260.9 | 326.8 | 313.8 | 220.3 | 420.8 | 297.1 | 283.5 | 310.2 |
| 2028 | 349.6 | 308.5 | 390.7 | 332.8 | 222.3 | 471.0 | 309.3 | 296.9 | 322.3 |
| 2029 | 351.7 | 298.3 | 405.1 | 352.9 | 226.1 | 514.0 | 321.5 | 308.3 | 335.7 |
| 2030 | 331.8 | 273.2 | 390.4 | 374.2 | 232.6 | 560.5 | 333.7 | 320.4 | 348.0 |
| 2031 | 370.4 | 305.6 | 435.3 | 396.9 | 236.9 | 611.5 | 345.9 | 331.0 | 359.6 |
| 2032 | 394.6 | 318.1 | 471.1 | 420.9 | 244.0 | 675.1 | 358.1 | 343.4 | 372.2 |
| 2033 | 374.7 | 290.2 | 459.2 | 446.3 | 248.3 | 735.8 | 370.3 | 354.9 | 385.0 |
| 2034 | 391.5 | 301.0 | 482.1 | 473.3 | 253.8 | 785.6 | 382.5 | 365.7 | 397.5 |
| 2035 | 425.6 | 325.1 | 526.2 | 501.9 | 262.2 | 864.2 | 394.7 | 378.6 | 412.0 |
Canada: Renewable Energy Forecasts with 95% CI (TWh)
| Nuclear | Hydro | Solar | Wind | |||||||||
| Year | Forecast | Lower | Upper | Forecast | Lower | Upper | Forecast | Lower | Upper | Forecast | Lower | Upper |
| 2025 | 86.9 | 75.5 | 98.4 | 341.5 | 316.4 | 366.6 | 11.7 | 11.0 | 12.5 | 49.5 | 44.7 | 54.3 |
| 2026 | 88.4 | 72.1 | 104.6 | 339.7 | 302.8 | 376.7 | 13.0 | 11.9 | 14.2 | 52.2 | 44.8 | 59.6 |
| 2027 | 89.8 | 69.9 | 109.7 | 338.0 | 290.9 | 385.1 | 15.1 | 13.3 | 17.0 | 54.9 | 45.1 | 64.7 |
| 2028 | 91.3 | 68.3 | 114.3 | 336.3 | 279.8 | 392.7 | 16.6 | 14.0 | 19.2 | 57.6 | 45.4 | 69.7 |
| 2029 | 92.7 | 67.0 | 118.4 | 334.5 | 269.1 | 400.0 | 18.6 | 15.2 | 22.0 | 60.3 | 45.7 | 74.8 |
| 2030 | 94.2 | 66.0 | 122.3 | 332.8 | 258.5 | 407.1 | 20.1 | 15.8 | 24.4 | 63.0 | 46.0 | 79.9 |
| 2031 | 95.6 | 65.2 | 126.0 | 331.1 | 248.0 | 414.2 | 22.0 | 16.8 | 27.3 | 65.6 | 46.2 | 85.1 |
| 2032 | 97.1 | 64.6 | 129.6 | 329.3 | 237.4 | 421.2 | 23.7 | 17.4 | 30.0 | 68.3 | 46.3 | 90.4 |
| 2033 | 98.5 | 64.1 | 133.0 | 327.6 | 226.9 | 428.3 | 25.5 | 18.1 | 32.9 | 71.0 | 46.3 | 95.7 |
| 2034 | 100.0 | 63.6 | 136.3 | 325.9 | 216.3 | 435.5 | 27.2 | 18.7 | 35.7 | 73.7 | 46.3 | 101.1 |
| 2035 | 101.4 | 63.3 | 139.5 | 324.1 | 205.5 | 442.8 | 29.0 | 19.3 | 38.7 | 76.4 | 46.2 | 106.6 |
Bangladesh: Renewable Energy Forecasts with 95% CI (TWh)
| Hydro | Solar | Wind | |||||||
| Year | Forecast | Lower | Upper | Forecast | Lower | Upper | Forecast | Lower | Upper |
| 2025 | 0.9 | 0.6 | 1.2 | 1.6 | 1.5 | 1.7 | 0.1 | 0.1 | 0.2 |
| 2026 | 0.9 | 0.6 | 1.2 | 1.9 | 1.7 | 2.2 | 0.1 | 0.1 | 0.2 |
| 2027 | 0.9 | 0.6 | 1.2 | 2.2 | 1.8 | 2.7 | 0.1 | 0.0 | 0.2 |
| 2028 | 0.9 | 0.6 | 1.2 | 2.6 | 2.0 | 3.2 | 0.1 | 0.0 | 0.2 |
| 2029 | 0.9 | 0.6 | 1.3 | 2.9 | 2.1 | 3.7 | 0.1 | 0.0 | 0.2 |
| 2030 | 0.9 | 0.6 | 1.3 | 3.2 | 2.2 | 4.2 | 0.1 | 0.0 | 0.2 |
| 2031 | 0.9 | 0.6 | 1.3 | 3.6 | 2.3 | 4.8 | 0.1 | -0.1 | 0.2 |
| 2032 | 0.9 | 0.6 | 1.3 | 3.9 | 2.4 | 5.4 | 0.1 | -0.1 | 0.2 |
| 2033 | 1.0 | 0.6 | 1.3 | 4.2 | 2.5 | 5.9 | 0.0 | -0.1 | 0.2 |
| 2034 | 1.0 | 0.6 | 1.4 | 4.5 | 2.5 | 6.5 | 0.0 | -0.1 | 0.2 |
| 2035 | 1.0 | 0.6 | 1.4 | 4.9 | 2.6 | 7.2 | 0.0 | -0.1 | 0.2 |
References
- Abdolmaleki, L., Jahanbin, A., and Berardi, U. 2024. Net-zero energy management through multi-criteria optimizations of a hybrid solar-hydrogen energy system for a laboratory in Toronto, Canada. Energy & Buildings 312:114186. [CrossRef]
- Alam, S. 2024. Industrial Energy Efficiency to Curt Bangladesh’s Short-term LNG Demand Growth: Imported fossil fuel dependencies and fiscal strains call for more efficient use of energy, Institute for Energy Economics and Financial Analysis. May 2024.
- Aliakbari, E. and Mejia, J. 2025. Exporting Canadian LNG to the World: A practical solution for reducing GHG Emissions. Fraser Institute, 2025.
- Amin, S., Jamasb, T., Llorca, M., Marsiliani, L., and Renstrom, T. 2021. The role of captive power plants in the Bangladesh Electricity sector. ADBI Working Paper 1238. Tokyo: Asian Development Bank Institute.
- Asad, S. 2024. Why renewable energy gained attention and demand globally? Nature, Environment and Pollution Technology 23(1):467-473. [CrossRef]
- Asuka, J., and Jin, D. (eds.). 2022. Energy Transition and Energy Democracy in East Asia. First Edition, Springer Nature, Singapore. [CrossRef]
- Avelino, F., Grin, J., Pel, B., and Jhagroe, S. 2016. The politics of sustainability transitions. Journal of Environmental Policy & Planning, 18:557–567. [CrossRef]
- B.P. 2023. Statistical Review of World Energy. B.P. Statistical Review of World Energy, 2023 http://bp.com/statisticalreview.
- Bahauddin, K. M., and Salahuddin, T. M. 2012. Prospect and trend of renewable energy and its technology toward climate change mitigation and sustainable development in Bangladesh. International Journal of Advanced Renewable Research 1:156-166.
- Baky, M. A. H., Rahman, M. M., and Islam, A. K. M. S. 2017. Development of renewable energy sector in Bangladesh: Current status and future potential. Renewable and Sustainable Energy Reviews 73:1184-1197. [CrossRef]
- Banks, N. 2018. Pipelines and the Constitution: A Special Issue of the Review of Constitutional Studies. Review of Constitutional Studies 23:1-24.
- BBS. 2015. Changing Patterns of Urbanization in Bangladesh: An analysis of census data. Population Monograph: Volume 12. November 2015, 62 pages.
- BBS. 2021. Statistical Yearbook of Bangladesh 2020. Bangladesh Bureau of Statistics.
- BBS. 2023. Statistical Yearbook of Bangladesh 2022, 42nd Edition. Bangladesh Bureau of Statistics, Ministry of Planning, Government of Bangladesh, Dhaka, Bangladesh. June 2023.
- BC. 2021. British Columbia Coal Industry Overview 2020. Information Circular 2021-02. Ministry of Energy, Mines and Low Carbon Innovation, Government of British Columbia, Canada. January 2021.
- Bennett, C., Blanchet, J., Trowell, K., and Bergthorson, J. 2023. Decarbonizing Canada’s energy supply and exports with solar PV and e-fuels. Renewable Energy 217:119178. [CrossRef]
- Bhattarai, U., Maraseni, T., and Apan. A. 2022. Assay of renewable energy transition: A systematic literature review. Science of the Total Environment 833:155159. [CrossRef]
- Bosu, A. K. and Rafiq, M. A.. 2019. Future of renewable energy in Bangladesh as a potential solution to energy crisis. Proceedings of the 2019 5th International Conference on Advances in Electrical Engineering (ICAEE) 26-28 September, Dhaka, Bangladesh.
- Boucher, M., and Pigeon, M. A. 2024. Community energy cooperatives and the Canadian energy transition. Energy Research & Social Science, 115, 103618.
- Box, G. E. P. and Jenkins, G. M. 1976. Time series analysis: Forecasting and control (Rev. ed.). Holden-Day.
- BPDB (Bangladesh Power Development Board). 2024. Annual Report 2022-23. Bangladesh Power Development Board. 2024. https://bpdb.portal.gov.bd/sites/default/files/files/bpdb.portal.gov.bd/page/771c9a89_a06c_4c2f_9b8c_699d17ed769a/2024-01-03-06-02-dda85c69e3462d6de89b6486edd08779.pdf Accessed: September 25, 2025.
- Bratt, D. 2021. Energy Environment Federalism in Canada: Positive Energy, finding a path forward for the future, University of Ottawa, March 2021. https://www.uottawa.ca/research-innovation/sites/g/files/bhrskd326/files/2022-08/energy_federalism_web.pdf Accessed: October 4, 2025.
- Brooks, G. L. 2002. A Short History of the CANDU Nuclear Power System, Ontario Hydro demand/supply hearing 1993, Updated, December 2002. https://canteach.candu.org/content%20library/19930101.pdf Accessed: October 4, 2025.
- BSREA. 2025. Bangladesh Sustainable and Renewable Energy Association (BSREA) National Database of Renewable Energy - The Bangladesh Sustainable and Renewable Energy Association. Accessed: September 25, 2025.
- Cabraal, A., Ward, W. A., Bogach, V. S., and Jain, A. 2021. Living in the Light: The Bangladesh Solar Home System story, The World Bank, Dhaka, Bangladesh.
- Cai, L., Xu, G., Polak, M. A., and Knight, M. 2017. Horizontal directional drilling pulling forces prediction methods – a critical review. Tunnelling and Underground Space Technology 69:85-93. [CrossRef]
- Canada Action. 2025. Canada is a Top 10 Global Energy Producer - We Should Be Proud! Canada Action, https://www.canadaaction.ca/canada-top-global-energy-producer Accessed: September 25, 2025.
- Canada Energy Regulator. 2021. Canada’s Energy Future 2021: Energy supply and demand projections to 2020. Canada Energy Regulator, Government of Canada. https://www.cer-rec.gc.ca/en/data-analysis/canada-energy-future/2021/.
- Canada Gazette. 2024. Clean Electricity Regulations: SOR/2024-263. Canada Gazette, Volume 158, Number 26. Available: https://gazette.gc.ca/rp-pr/p2/2024/2024-12-18/html/sor-dors263-eng.html.
- Canadian Renewable Energy Association. 2025. By the numbers. https://renewablesassociation.ca/by-the-numbers/.
- CanREA, 2021. Powering Canada’s Journey to Net-Zero. Canadian Renewable Energy Association.
- CAPP. 2025. The Case of Canadian LNG. Canadian Association of Petroleum Producers. April 2025.
- Castaneda, C. 2011. Natural disasters in the making: Fossil fuels, humanity, and the environment. OAH Magazine of History 25(4):21–25. [CrossRef]
- CER. 2019. Canada’s Energy Future 2019: Energy Supply and Demand Projections to 2040: Macro Indicators; 2017, Canada Energy Regulator (CER), Government of Canada.https://apps.neb-one.gc.ca/ftrppndc/dflt.aspx?GoCTemplateCulture=en-CA.
- CER. 2023. Provincial and Territorial Energy Profiles – Canada. Canadian Energy Regulator. https://www.cer-rec.gc.ca/en/data-analysis/energy-markets/provincial-territorial-energy-profiles/provincial-territorial-energy-profiles-canada.html#s3 Accessed: July 29, 2025.
- CER. 2025. Provincial and territorial energy profiles – Canada. Canada Energy Regulator. https://www.cer-rec.gc.ca/en/index.html. Accessed: September 25, 2025.
- Choudhry, S. 2019. Constitutional Law and the Politics of Carbon Pricing in Canada. IRPP Study 74. Montreal: Institute for Research on Public Policy.
- Clark, A. and Matthews, M., April 2023. Clean Energy and Pathways to Net-Zero: Jobs and Skills for Future Leaders. Information and Communications Technology Council (ICTC). Ottawa, Canada.
- CNA. 2020. The Canadian Nuclear Factbook 2020. Canadian Nuclear Association, https://cna.ca/wp-content/uploads/2019/08/2020-Factbook-EN-digital.pdf Accessed: October 4, 2025.
- Cornett, A. 2006. Inventory of Canada’s marine renewable energy resources. Canadian Hydraulics Centre, CHR-TR-031. Natural Resources Canada. April 2006. https://natural-resources.canada.ca/sites/www.nrcan.gc.ca/files/canmetenergy/files/pubs/CHC-TR-041.pdf Accessed: September 27, 2025.
- Cunningham, E. 2024. Powering Bangladesh’s Future: Risks and Opportunities in Solar Energy Deployment, Occasional Paper series, Harvard Kennedy School. Rajawali Foundation Institute for Asia. December 2024.
- CWEA. 2019. Canada Reaches Nearly 13 GW of Installed Wind Capacity, Canadian Wind Energy Association (CWEA).https://canwea.ca/industry-news/2019/02/01/canada-reaches-nearly-13-gw-of-installed-wind-capacity/.
- Das D, Khanna, N, and Dasgupta C. N. 2014. Biohydrogen production: fundamentals and technology advances. CRC Press; 2014.
- de Goncalves, A., Soisa, A., and de Evora, I. (Eds.). 2021. Forest Biomass: From Trees to Energy. Intech Open Publishing.
- Dincer, I. 2000. Renewable energy and sustainable development: a crucial review. Renewable and Sustainable Energy Reviews 4:157-175. http://www.elsevier.com/locate/rser.
- Dubreuil, A. 2001. Inventory for energy production in Canada. The international journal of life cycle assessment, 2001-09, 6 (5):281-284.
- ED. 2013. Reality check: water and tar sands. A project of Environmental Development. Summary report. https://environmentaldefence.ca/wp-content/uploads/2016/01/WaterandTarSandsReport_FINAL.pdf.
- Ehsanullah, S., Tran, Q. H., Sadiq, M., Bashir, S., Mohsin, M., and Iram, R. 2021. How energy insecurity leads to energy poverty? Do environmental consideration and climate change concerns matters. Environmental Science and Pollution Research 28:55041-55052. [CrossRef]
- Energy Council of Canada. 2022. Indigenous Energy Across Canada: Volume 2 Canada’s energy story. Energy Council of Canada. www.energy.ca.
- Energy Data Center. 2024. Gas and Coal Reserve & Production, Hydrocarbon Unit, Energy and Mineral Resources Division, Government of Bangladesh, March 2024.
- Energy Institute. 2024. Statistical Review of World Energy, 73rd Edition. https://www.energyinst.org/statistical-review.
- Energy Institute. 2025. Statistical Review of World Energy. 74th Edition. https://www.energyinst.org/statistical-review.
- Environment and Climate Change Canada 2022. Net-Zero Challenge Technical Guide. Environment and Climate Change Canada, Government of Canada. Updated 2022.
- Environment and Climate Change Canada. 2025. Climate change: strategies and initiatives, Environment of Climate Change Canada, Government of Canada. https://www.canada.ca/en/services/environment/weather/climatechange.html.
- Fabra, N. and Reguant, M. 2024. The energy transition: a balancing act. Resource and Energy Economics 76:101408. [CrossRef]
- Fisch, J. G. 2016. Tidal energy in Canada: Hindering an untapped potential for international primacy. APPEAL 21:37-58. https://journals.uvic.ca/index.php/appeal/article/download/15658/6229/0 Accessed: September 27, 2025.
- Fisch, J. G. 2016. Tidal Energy Law in Canada: Hindering an Untapped Potential for International Primacy. Appeal, Review of Current Law and Law Reform, 21(21), 37.
- Fisheries and Oceans Canada. 2024. Task Force on Sustainable Tidal Energy Development in the Bay of Fundy: Final Report. https://www.dfo-mpo.gc.ca/pnw-ppe/ffhpp-ppph/publications/fundy-tidal-final-report-baie-fundy-marees-rapport-final-eng.html Accessed: September 27, 2025.
- Gao, Y. 2024. A comparative study of ARIMA and ETS models for time series forecasting. Proceedings of the 3rd International Conference on Financial Technology and Business Analysis.
- Gass, P. and Echeverria, D. 2017. Fossil Fuel Subsidy Reform and the Just Transition: Integrating approaches for complementary outcomes. GSI Report. International Institute for Sustainable Development and Global Subsidies Initiative. December 2017. https://www.iisd.org/system/files/publications/fossil-fuel-subsidy-reform-just-transition.pdf.
- Gaucher-Loksts, E. and Pelland S,. 2024. Assessing the photovoltaic potential of the Canadian building stock. Unclassified document, Natural Resources Canada. https://natural-resources.canada.ca/sites/nrcan/files/canmetenergy/files/pdf/PV_potential_summary_report_appendix-EN.pdf Accessed: September 26, 2025.
- GED. 2015. Seventh Five Year Plan, FY2016-FY2020: Accelerating Growth, Empowering Citizens. Planning Commission, Government of Bangladesh. December 2015.
- GED. 2020. Eighth Five Year Plan, FY2021-FY2025: Accelerating Growth, Empowering Citizens. Planning Commission, Government of Bangladesh. December 2020.
- Ghorbani, B., Zendehboudi, S., Saady, N. M. C., and Naterer, G. F. (2025). Canada’s Hydrogen Future: Innovations, Policies, and Global Perspectives. Energy & Fuels.
- Ghosh, S. and Islam, S. 2023. A game-theoretic analysis of Canada’s entry for LNG exports in the Asia-Pacific market. Commodities 2: 169–187. [CrossRef]
- Global Affairs Canada. 2019. Energy provisions summary: Canada–United States–Mexico Agreement (CUSMA). Government of Canada. July 11, 2019. https://www.international.gc.ca/trade-commerce/trade-agreements-accords-commerciaux/agr-acc/cusma-aceum/energy-energie.aspx?lang=eng.
- Glynn, J. K., Kleinschmit, J. and Muller, M. 2022. Impacts of Agriculture to Water Quantity in the Great Lakes and St. Lawrence River Basin, Outlining a Research Agenda for Agriculture, Trade & Water Quantity Management, Institute for Agriculture and Trade Policy, Minneapolis, MN 55404. February 2022.
- GoB 2004. National Energy Policy, Ministry of Power, Energy and Mineral Resources, Government of Bangladesh. May, 2024. 65 pages.
- GoB 2020. 8th Five Year Plan, July 2020 – June 2025, General Economics Division, Bangladesh Planning Commission, Government of Bangladesh. December 2020.
- GoB. 2024. Annual Report on Gas Production, Distribution and Consumption 2022-23. Hydrocarbon Unit, Energy and Mineral Resources Division, Ministry of Power, Energy and Mineral Resources, Government of Bangladesh. 42 pages.
- Goswami, G. G., Rahman, U., and Chowdhury, M. 2022. Estimating the economic cost of setting up a nuclear power plant at Rooppur in Bangladesh. Environmental Science and Pollution Research 29:35073-35095. [CrossRef]
- Government of Canada. 2021. United Nations Declaration on the Rights of Indigenous Peoples Act, S.C. 2021, c. 14. Justice Laws Website. https://laws-lois.justice.gc.ca/eng/acts/U-2.2/.
- Government of Canada. 2024. Trans Mountain Expansion Project (TMX). https://www.canada.ca/en/campaign/trans-mountain.html.
- Government of Canada. 2025a. Powering Canada’s future: A clean electricity strategy. Natural Resources Canada. https://natural-resources.canada.ca/energy-sources/powering-canada-s-future-clean-electricity-strategy.
- Government of Canada. 2025b. The federal carbon pollution pricing benchmark. Environment and Climate Change Canada. March 14, 2025. https://www.canada.ca/en/environment-climate-change/services/climate-change/pricing-pollution-how-it-will-work/carbon-pollution-pricing-federal-benchmark-information.html.
- Government of Canada. 2025c. Removing the consumer carbon price, effective April 1, 2025. Department of Finance Canada. March 14, 2025. https://www.canada.ca/en/department-finance/news/2025/03/removing-the-consumer-carbon-price-effective-april-1-2025.html.
- Grasby, S.E., Allen, D.M., Bell, S., Chen, Z., Ferguson, G., Jessop, A., Kelman, M., Ko, M., Majorowicz, J., Moore, M., Raymond, J., and Therrien, R., 2012. Geothermal Energy Resource Potential of Canada, Geological Survey of Canada, Open File 6914 (revised), 322 p. [CrossRef]
- Gulagi, A., Ram, M., Solomon, A. A., Khan, M., and Breyer, C. 2020. Current energy policies and possible transition scenarios adopting renewable energy: A case study for Bangladesh. Renewable Energy 155:899-920.
- Gunton, T., Joseph, C., and Dale, D. 2021. Evaluation of the Trans Mountain Expansion Project. School of Resource and Environmental Management, Simon Fraser University. March 2021.
- Gurtler, K., Beer., D. L. and Herberg, J. 2021. Scaling just transitions: Legitimation strategies in coal phase-out commissions in Canada and Germany. Political Geography 88:102406. [CrossRef]
- Halder, P. K., Paul, N. and Beg, M. R. A. 2014. Assessment of biomass energy resources and related technologies practice in Bangladesh. Renewable and Sustainable Energy Reviews. 39:444-460. 1364-0321. [CrossRef]
- Halder, P. K., Paul, N., Joardder, M. U. H., Sarker, M. 2015. Energy security and potential for renewable energy in Bangladesh. Renewable and Sustainable Energy Reviews 51:1636-1649. [CrossRef]
- Hasan, A. S. M., Habibullah, M., Muhammad, A., Siraj, M. W. B., Kabir, M. A., and Hasan, A. S. M. M. 2013. Energy demand and prospect of geothermal energy as the solution of energy crisis of Bangladesh – an approach to green energy solution. International Journal of Renewable le Resources. International Journal of Renewable and Sustainable energy 2(6):217-221.
- Hasan, M. M. and Liu, K. 2022. Decomposition analysis of natural gas composition in Bangladesh using an LMDI approach. Energy Strategy Reviews 40:100724. [CrossRef]
- Hervas, A. and Noyahr, C. 2024. Nuclear for a Net-Zero Canada Pathways to scale by 2050. May, 2024. https://cleanprosperity.ca/wp-content/uploads/2024/05/Clean_Prosperity_Nuclear_for_a_Net-Zero_Canada.pdf Accessed: September 27, 2025.
- Hosan, M. I., Dewan, M. J., Sahadath, M. H., Roy, D., and Roy, D. 2023. Assessment of public knowledge, perception, and acceptance of nuclear power in Bangladesh. Nuclear Engineering and Technology 55:1410-1419. [CrossRef]
- Hossain, I. and Tamim, M. 2007. Energy and Sustainable Development in Bangladesh. A Report. HELIO International Sustainable Energy Watch 2005/2006. 26 pages.
- Hossain, S. M., Biswas, S, and Uddin, M. R. 2023. Sustainable energy transition in Bangladesh: challenges and pathways for the future. Engineering Reports Engineering Reports. 2024;6:e12752. [CrossRef]
- Hossen, M. A., Talukder, M. R. A., Mamun, M. R., Rahaman, H., Paul, S., Rahman, M. M., Miaruddin, M., Ali, M. A., and Islam, M. N. 2020. Mechanization status, promotional activities and government strategies of Thailand and Vietnam in comparison to Bangladesh. Agri Engineering 2:489-510. [CrossRef]
- Huang, K.; Dehghani-Sanij, A.; Hickson, C.; Grasby, S.E.; Smejkal, E.; Miranda, M.M.; Raymond, J.; Fraser, D.; Harbottle, K.; Torres, D.A.; et al. Canada’s Geothermal Energy Update in 2023. Energies 2024, 17, 1807. [CrossRef]
- Huda, A. S. N., Mekhilef, S., and Ahsan, A. 2014. Biomass energy in Bangladesh: Current status and prospects. Renewable and Sustainable Energy Reviews 30:504-517. [CrossRef]
- Huq, S., Khan, M.,Islam, A. K. M. S. and Mirza, A. B. 2024. Climate Change Impacts in Bangladesh: What climate change means for a country and its people. 2024 Report. International Center for Climate Change and Development (ICCCAD), Dhaka, Bangladesh.
- Hussain, K., Jian, Z., Khan, A., Ali, F., and Arif, M. 2025. Disentangling the effects of nonrenewable energy consumption on CO2 emissions in Canada: The moderating role of construction and manufacturing. Energy & Environment, 0958305X241310195. [CrossRef]
- Hydrocarbon Unit. 2024. Annual Report on Gas Production, Distribution and Consumption 2023-24, Hydrocarbon Unit, Energy and Mineral Resources Division, Government of Bangladesh, November 2024.
- Hyndman, R. J., Koehler, A. B., Ord, J. K., & Snyder, R. D. 2008. Forecasting with exponential smoothing: The state space approach. Springer. [CrossRef]
- Hyndman, R. J., Koehler, A. B., Snyder, R. D., & Grose, S. 2002. A state space framework for automatic forecasting using exponential smoothing methods. International Journal of Forecasting, 18(3), 439–454. [CrossRef]
- IAEA. 2019 Country Nuclear Energy Profile: Bangladesh. 2019 Edition. International Atomic Energy Agency. Bangladesh 2019.
- IAEA. 2022. Country Nuclear Power Profiles2022 Edition. Internatonal Atomic Energy Association. https://www-pub.iaea.org/MTCD/publications/PDF/cnpp2022/countryprofiles/Canada/Canada.htm Accessed: September 27, 2025.
- IEA. 2020a. Canada Infrastructure Bank – Growth Plan: Clean power investment. IEA Policies Database. https://www.iea.org/policies/12400-canada-infrastructure-bank-growth-plan-clean-power-investment.
- IEA. 2020b. Total CO2 emissions. International Energy Agency. https://www.iea.org/world/emissions.
- IEA. 2022. Report 2022 IEA Wind TCP Canada 2022. Technology Collaboration Program. International Energy Agency. https://iea-wind.org/wp-content/uploads/2023/10/Canada_2022.pdf.
- IEA. 2024a. Energy System of Bangladesh, International Energy Agency. https://www.iea.org/countries/bangladesh.
- IEA. 2024b. Energy System of Canada. International Energy Agency. https://www.iea.org/countries/canada.
- IEA. 2025. Total CO2 emissions. International Energy Agency. https://www.iea.org/world/emissions.
- IISD. 2015. The end of coal: Ontario’s coal phase-out. International Institute of Sustainable Development. https://www.iisd.org/system/files/publications/end-of-coal-ontario-coal-phase-out.pdf.
- Indigenous Clean Energy 2020. Accelerating Transition: Economic Impacts of Indigenous Leadership in Catalyzing the Transition to a Clean Energy Future Across Canada. Indigenous Clean Energy. June 2020.
- IPCC. 2022. IPCC Sixth Assessment Report: Impacts, adaptation and vulnerability. International Panel of Climate Change, Download: Climate Change 2022: Impacts, Adaptation and Vulnerability | Climate Change 2022: Impacts, Adaptation and Vulnerability.
- IRENA. 2024. Renewable energy highlights. International Renewable Energy Agency, 11 July 2024. https://www.irena.org/-/media/Files/IRENA/Agency/Publication/2024/Jul/Renewable_energy_highlights_FINAL_July_2024.pdf?rev=469292ef67144702b515ecb20575ec7d Accessed: September 18, 2024.
- Islam, M. R., Islam, M. R., and Beg, M. R. A. 2008. Renewable energy resources and technologies practice in Bangladesh. Renewable and Sustainable Energy Reviews 12:299-343. [CrossRef]
- Islam, M. S. and Bhuiyan, T. H. 2020. Assessment of costs of nuclear power in Bangladesh. NUCET Nuclear Energy and Technology 6(3):181-194. [CrossRef]
- Islam, S., Ghosh, S. and Wang, Y. 2023. Energy demand and the potential role of imported liquefied natural gas (LNG) in Bangladesh. The Journal of Developing Areas 53(3):79 – 105. [CrossRef]
- Jacobson, M, C. Draxl, T. Jimenez, B. O’Neill, T. Capozzola, J. A. Lee, F. Vandenberghe, and S. E. Haupt. 2018. Assessing the Wind Energy Potential in Bangladesh Enabling Wind Energy Development with Data Products. Technical Report NREL/TP-5000-71077. USAID and National Renewable Energy Laboratoty. September 2018.
- Kallbekken, S., Skjeflo, S. W., Westberg, N. B. and Jastad, E. O. 2025. Green dilemmas: public opposition and support for Norway’s energy transition. Energy 334:137860. [CrossRef]
- Kamiński, J. 2022. Economic and Policy Challenges of the Energy Transition in CEE Countries. MDPI Books. [CrossRef]
- Karayel, G. K., and Dincer, I. 2024a. A study on green hydrogen production potential of Canada with onshore and offshore wind power. Journal of Cleaner Production, 437, 140660. [CrossRef]
- Karayel, G. K., and Dincer, I. 2024b. Green hydrogen production potential of Canada with solar energy. Renewable Energy, 221, 119766. [CrossRef]
- Karim, R.; Karim, M. E., Sukki, F. M., Abu-Bakar, S. H., Bani, N. A., Munir, A. B., Kabir, A. I., Ardila-Rey, J. A. and Masud, A. A. 2018. Nuclear energy development in Bangladesh: A study of opportunities and challenges. Energies 22:1672. [CrossRef]
- Karki, P. 2014. A brief introduction to small hydropower. https://unfccc.int/resource/cd_roms/na1/mitigation/Module_5/Module_5_1/b_tools/RETScreen/Manuals/Hydro.pdf Accessed: September 25, 2025.
- Kellner, E. 2025. Mineral extraction on Indigenous land: employing a relational approach to navigate the convergence of Indigenous and other ontologies and practices. Energy Research and Social Science 125:104097. [CrossRef]
- Kempener, R and Neumann, F. 2014. Tidal energy – technology brief. IRENA Ocean Energy Technology Brief No 3, International Renewable Energy Agency. June 2014. Accessed: October 2, 2025.
- Kivimaki, M., Batty, G. D., Pentti, J., Suomi, J., Nyberg, S. T., Merikanto, J., Nordling, K., Ervasti, J., Suominen, S. B., Partanen, A., Stenholm, S., Kayhko, J., and Vahtera, J. 2023. Climate change, summer temperature, and heat-related mortality in Finland: Multicohort study with projections for a sustainable vs. fossil-fueled future to 2050. Environmental Health Perspectives 131(12) December 2023, 127020. [CrossRef]
- Kong, L., Wang, H., Cui, L., Zhao, X., Rao, L. Y., and Zhang, S. 2024. Drilling optimization for ultra-long slim hole horizontal wells in Duvernay Shale project, Canada. International Petroleum & Petrochemical Technology Conference (IPPTC), Journal of Physics: Conference Series 2834:012085. [CrossRef]
- Kraushaar-Friesen, N. and Busch, H. 2020. Of pipe dreams and fossil fools: Advancing Canadian fossil fuel hegemony through the Trans Mountain pipeline. Energy Research and Social Science 69:101695. [CrossRef]
- Kumar, A., Kumar, K, Kaushik, N., Sharma, S., and Mishra, S. 2010. Renewable energy in India: current status and future potentials. Renewable and Sustainable Energy Reviews 14:2434-42. [CrossRef]
- Leitcha, A., Haley, B., and Simon, S. H. 2019. Can the oil and gas sector enable geothermal technologies? Socio-technical opportunities and complementarity failures in Alberta, Canada. Energy Policy 125:384-295. [CrossRef]
- Levin, J. 2025. Fossil fuel funding in 2024. Media backgrounder, Environmental Defence. April 2025.
- LNG Canada. 2025. About LNG Canada. A joint venture Company. https://www.lngcanada.ca/who-we-are/overview/.
- Mahmud, H. and Roy, J. 2021. Barriers to overcome in accelerating renewable energy penetration in Bangladesh. Sustainability 13:7694. [CrossRef]
- Majorowicz, J., and Grasby, S. E. 2013. Geothermal Energy for Northern Canada: Is it Economical? Natural Resources Research 23(1):159-173. [CrossRef]
- Masud, M. H., Anonno, A. A., Arefin, A. M. E., Ahamed, R., Das, P., and Jarder, M. U. H. 2019. Perspective of biomass energy conversion in Bangladesh. Clean Technologies and Environmental Policies 21:719-731. [CrossRef]
- Masud, M. H., Nuruzzaman, M., Ahamed, R., Ananno, A. A., and Tomal, A. N. M. A. 2020. Renewable energy in Bangladesh: current situation and future prospect. International Journal of Sustainable Energy 39(2):132-175. [CrossRef]
- Mhadhbi, M. 2024. The interconnected carbon, fossil fuels, and clean energy markets: Exploring Europe and China’s perspectives on climate change. Finance Research Letters 62:105185. [CrossRef]
- Miri, M., and McPherson, M. 2024. Demand response programs: Comparing price signals and direct load control. Energy, 288, 129673. [CrossRef]
- Miskat, M. I., Ahmed, A., Rahman, M. S., Chowdhury, H., Chowdhury, T., Chowdhury, P., Sait, S. M., and Park, Y. K. 2021. An overview of the hydropower production potential in Bangladesh to meet the energy requirements. Environmental Engineering Research 26(6):200514. [CrossRef]
- Moazzem, K. G., Hridoy, M. A. and Alam, R. 2024. Energy Transition in Bangladesh: Its Implications on Employment and Skills in the Power and Energy Sector, CPD Working Paper 152. Centre for Policy Dialogue, January 2024.
- MRC. 2018. Marine Renewable Resources in Canada. 2018 State of the Sector Report, June 2018. https://marinerenewables.ca/wp-content/uploads/2018/06/MRC-State-of-the-Sector-2018.pdf Accessed: September 27, 2025.
- Muhlehner, J., Nan, H., and Ulgen, O. 2023. Sales Time Series Forecasting: Comparing Prophet to other forecasting methods Team 03. Applied Forecasting in Complex Systems 2023, University of Amsterdam.
- Muise, D. A. and McIntosh, R. G. 1996. Coal Mining in Canada: A Historical and Comparative Overview. Transformation Series 5, National Museum of Science and Technology, Ottawa, Ontario, Canada.
- Mujeri, M. K., Chowdhury, T. T., and Shahana, S. 2014. Energy Sector in Bangladesh: An agenda for reforms. Global Subsidies Initiative Report. International Institute for Sustainable Development. March 2014. 25 pages. https://www.iisd.org/gsi/sites/default/files/ffs_bangladesh_agenda.pdf.
- Natural Resources Canada. 2025. Energy Efficiency, Natural Resources Canada, Government of Canada. https://natural-resources.canada.ca/energy-efficiency.
- Navius. 2021. Achieving net zero emissions by 2050 in Canada. An evaluation of pathways to net zero prepared for the Canadian Institute for Climate Choices. Navius Research Inc. Vancouver, Canada. January 20, 2021.
- NEB. 2017. Canada’s Adoption of Renewable Power Sources: Energy market analysis. National Energy Board, May 2017.
- NEB. 2018. Nuclear Energy in Canada - Energy Market Assessment, National Energy Board. August 2018. https://www.cer-rec.gc.ca/en/data-analysis/energy-commodities/electricity/report/archive/2018-nuclear-energy/2018nclrnrg-eng.pdf. Accessed: October 2, 2025.
- NEB. 2021. Provincial and Territorial Energy Profiles, National Energy Board, Government of Canada. https://www.neb-one.gc.ca/nrg/ntgrtd/mrkt/nrgsstmprfls/cda-eng.html.
- Nel, W. P. 2011. A parameterised carbon feedback model for the calculation of global warming from attainable fossil fuel emissions. Energy & Environment 22(7):859-876. [CrossRef]
- NRC. 2012. Energy Use Data Handbook, 1990 – 2009. Natural Resources Canada, Catalogue Number: M141-11/2009E-PDF. 2012.
- NRC. 2013. Oil Sands: A strategic resource for Canada, North America and the global market. Natural Resource Canada. February 2013.
- NRC. 2024a. Energy Fact Book 2024-2025. Natural Resources Canada, Catalog No. M136-1E-PDF, ISSN 2370-5027. Government of Canada. https://energy-information.canada.ca/sites/default/files/2024-10/energy-factbook-2024-2025.pdf. Accessed: September 26, 2025.
- NRC. 2024b. Powering Canada: A blueprint for success. Canada Electricity Advisory Council Final Report. Natural Resources Canada. https://natural-resources.canada.ca/energy-sources/powering-canada-blueprint-success. Accessed on: September 27, 2025.
- NRC. 2024c. Powering Canada’s future: Canada’s clean electricity strategy. Natural Resources Canada, Gouvernement of Canada. https://natural-resources.canada.ca/energy-sources/powering-canada-s-future-clean-electricity-strategy.
- NRC. 2025. Energy efficiency: an essential part of Canada’s net-zero future. Report to Parliament under the Energy Efficiency Act 2022-2023. Natural Resources Canada Cat. No. M141-15E-PDF.. https://natural-resources.canada.ca/sites/admin/files/documents/2025-08/nc368-report-parliament-energy-efficiency-2022-23-jun-2024-25-eng.pdf Accessed: September 26, 2025.
- NRC. 2025a. Bioenergy Systems. Natural Resources Canada website. https://natural-resources.canada.ca/energy-sources/renewable-energy/bioenergy-systems Accessed: July 29, 2025.
- Nwanekezie, K., Noble, B., and Poelzer, G. (2022). Strategic assessment for energy transitions: A case study of renewable energy development in Saskatchewan, Canada. Environmental Impact Assessment Review, 92:106688.
- OECD. 2023. Understanding and Applying the Precautionary Principle in the Energy Transition. First Edition. Organization for Economic Cooperation and Development, Paris,.
- Onyinyechukwu, C., Adetomilola, V. F., Valentine, I. I., Bright, N., Cosmas, D. D., and Kenneth, I. I. 2024. Integration of renewable energy in industrial operations: experiences from Canada, USA, and Africa.
- Our World in Data. 2021. Research and data to make progress against the world’s largest problems. Our World in Data. https://ourworldindata.org/.
- Patel, S., and Parkins, J. R. 2023. Assessing motivations and barriers to renewable energy development: Insights from a survey of municipal decision-makers in Alberta, Canada. Energy Reports, 9, 5788-5798. [CrossRef]
- Payel, S. B., Alam, S. L., Bari, L., Saeed, S. S., and Siraj, M. T. 2024. Bangladesh’s electricity growth: Is Bangladesh truly advancing in renewable energy? Proceedings of the International Conference on Industrial Engineering and Operational Management. IEOM Society International, USA. December 21-22, 2024. [CrossRef]
- Pearce, P. and Hunter, T. S. (eds.). 2023. Energy Transition and Environmental Sustainability. MDPI. April 2023. 284 pages. [CrossRef]
- Pereira, S., Silva, C. and Ferreira, L. M. D. F. 2025. Barriers to energy transition: Comparing developing with developed countries. Energy for Sustainable Development 87(2025) 101753. [CrossRef]
- Petrobangla. 2017. Annual Report 2017. Petrobangla, Bangladesh oil, gas and mineral corporation. Dhaka, Bangladesh.
- PPCA. 2022. Powering Past Coal: The state of global action to end emissions from coal power. Powering Past Coal Alliance, November 2022.
- Pressburger, L., Evans, M., Yu, S., Cui, R., Somani, A., and Iyer, G. 2022. A Comprehensive Economic Coal Transition in South Asia. A Product of South Asia Group of Energy. USAID and Pacific Northwest National Laboratory. January 2022.
- Rahman, M. J., Shahan, and Tuser, M. R. S. 2024. Green hydrogen revolution: A comprehensive analysis and future outlook for sustainable energy transition in Bangladesh. 7th International Conference on Development in Renewable Energy Technology.
- Raihan, S. and Khan, S. S. 2000. Structural transformation, inequality dynamics and inclusive growth in Bangladesh. WIDER Working Paper 2020/44. United Nations University. April 2020.
- Rashedi, A., Khanam, R. and Jonkman, M. 2020. On reduced consumption of fossil fuels in 2020 and its consequences in global environment and energy demand. Energies 13, 6048;. [CrossRef]
- Retscreen International. 2004. Small Hydro Project Analysis. In: Clean energy project analysis: Retscreen Engineering and cases Textbook. https://unfccc.int/resource/cd_roms/na1/mitigation/Module_5/Module_5_1/b_tools/RETScreen/Manuals/Hydro.pdf Accessed: September 25, 2025.
- Rezai, A. and Ploeg, F. V. 2017. Abandoning fossil fuel: How fast and how much. The Manchester School 85 No. S2 e16–e44. [CrossRef]
- Rosendal, K., Skjærseth, J. B., and Andresen, S. 2019. Knowledge-based management of protected areas and hydropower: The case of Norway. International Environmental Agreements: Politics, Law and Economics, 19(4), 515–530. [CrossRef]
- Samiullah, M. S., Aktar, S. Sayed, M. A. A. and Golam, S. M. 2024. Impacts of coal-fired plant emissions on the environment: A Bangladesh perspective. Power System Technology 48(2):1960-76. https://powertechjournal.com.
- Scarpaleggia, F. 2023. The Government of Canada’s Planned Phase-Out of fossil fuel subsidies and of public financing of the fossil fuel sector, Report of the Standing Committee on Environment and Sustainable Development. House of Commons. Canada.
- Schulz, R. [no date] Alberta’s response to the Clean Electricity Regulation. Minister, Ministry of Environment and Protected Areas. Government of Alberta. Available: https://open.alberta.ca/publications/albertas-response-clean-electricity-regulation-public-update-goa-technical-submission.
- Shariar, K. F., Ovy, E. G. and Hossainy, K. T. A. 2011. Closed environment design of solar collectors through using lenses and reflections. World Renewable Congress, Sweden.
- Shetol, M. H., Rahman, M. M., Sarder, R., Hossain, M. I. and Riday, F. K. 2019. Present status of Bangladesh gas fields and future development: A review. Journal of Natural Gas Geoscience 4:347-354. [CrossRef]
- Shirinbakhsh, M., and Harvey, L. D. 2024. Feasibility of achieving net-zero energy performance in high-rise buildings using solar energy. Energy and Built Environment, 5(6), 946-956. [CrossRef]
- Shufian, A., Chowdhury, R., Mohammad, N. and Matin, M. A. 2022. Renewable energy of Bangladesh for Carbon-free clean energy transition (C2ET). International Conference on Advancement in Electrical and Electronic Engineering, 24-26 February, 2022. Gazipur, Bangladesh.
- Siddique, A. H., Rasnim, S., Shahriyar, F., Hasan, M., and Rashid, K. 2021. Renewable energy sector in Bangladesh: The current scenario, challenges and the role of IoT in building smart distribution grid. Energies 14:5083. [CrossRef]
- Sikkema, R., Junginger, M., McFarlane, P., and Faaij, A. 2013. The GHG contribution of the cascaded use of harvested wood products in comparison with the use of wood for energy – A case study on available forest resources in Canada. Environmental Science and Policy 31:96-108. [CrossRef]
- Singh, O. P. 2007. Long-term trend in the frequency of severe cyclones of Bay of Bengal: Observations and simulations. MAUSAM 58(1):59-66. [CrossRef]
- Smith, J. 2004. Productivity Trends in the Coal Mining Industry in Canada. CSLS Research Report 2004-07. Centre for the Study of Living Standards. October 2004.
- Spang, E. S., Moomaw, W. R., Gallagher, K. S., Kirshen,P. H. and Marks, D. H. 2014. The water consumption of energy production: an international comparison. Environmental Research Letters 9:105002. [CrossRef]
- Spence, D. B. 2024. Climate of Contempt: how to rescue the US energy transition form voter partisanship. Columbia University Press. Center on Global Energy Policy.
- Stringer, T., and Joanis, M. 2022. Assessing energy transition costs: Sub-national challenges in Canada. Energy Policy, 164, 112879. [CrossRef]
- Sultana, M. and Islam, M. A. 2024. Driving sustainable transformation and energy transition: Techno-economic analysis of fuel cell electric vehicles and residential electrification for a greener Bangladesh. Proceedings of the 6th International Conference on Electrical Engineering and Information and Communication Technology 02-04 May 2024. Pp: 1433-1438.
- Taylor, S. J. and Letham, B. 2018. Forecasting at scale. The American Statistician, 72(1), 37–45. [CrossRef]
- Timilsina, G. V. and Pargal, S. 2020. Economics of energy subsidy reforms in Bangladesh. Energy Policy 142:111539. [CrossRef]
- Uddin, M. N., Rahman, M. A., Mofijur, M., Taweekun, J., Techato, K., and Rasul, M. G. 2019. Renewable energy in Bangladesh: Status and prospects. Energy Procedia 160:655-661. [CrossRef]
- Viens, N. 2022. Oil and gas interests and energy policy in Canada. Energy Research & Social Science, 91, 102748.
- Walker, C., Stephensonb, L., and Baxter, J. 2016. “His main platform is ‘stop the turbines’ “: Political discourse, partisanship and local responses to wind energy in Canada. Energy Policy 123:670-681.. [CrossRef]
- Wang, J. 2025. Alberta is swimming against the tide on clean electricity. Pembina Institute. April 8, 2025. Available: https://www.pembina.org/blog/alberta-swimming-against-tide-clean-electricity.
- Wang, Z., Lv, B., Li, J., and Yin, S. 2024. Geothermal energy extraction – induced ground movement monitoring by InSAR and its implication for reservoir management. Journal of Energy Engineering 150:05024001. [CrossRef]
- Wazed, M. A. and Ahmed, S. 2008. Micro hydro energy resources in Bangladesh: A review. Australian Journal of Basic and Applied Sciences 2(4):1209-1222.
- WBA. 2024. Global Bioenergy Statistics Report 2024. 11th Edition. World Bioenergy Association. 241023 GBS Report Short Version.pdf Accessed: September 25, 2025.
- Weijnen, M. P. C., Lukszo, Z., and Farahani, S. (Eds). 2021. Shaping on Inclusive Energy Transition. Springer International Publishing. NG Info Open Access. I. [CrossRef]
- WHO, 2025. Phasing our coal-fired electric power generation – implications for public health, Canada: a success story, WHO Air Quality, Energy and Health Science Policy Summaries, World Health Organization, Geneva, 2025.
- Wilde, C., Nickerson, K., and Deleon, J. 2018. Nuclear Energy in Canada : Energy Market Assessment. National Energy Board.
- Winfield. 2006. Nuclear Power in Canada: An Examination of Risks, Impacts and Sustainability. Pembina Institute. https://www.pembina.org/reports/Nuclear_web.pdf.
- Wolff, K. and Young, K. E. (Eds.). 2024. Energy Transition in the Middle East: Challenges and Opportunities, First Edition. I. B. Tauris. Middle East Institute of Policy Series. [CrossRef]
- World Bank. 2021. World Development Indicators, https://datatopics.worldbank.org/world-development-indicators/.
- Yang, Y., Xia, S., Huang, P., and Qian, J. 2024. Energy transition: Connotations, mechanisms and effects. Energy Strategy Reviews 52:101320. [CrossRef]
- Zhixin, Z. and Xin, R. 2011. Causal relationships between energy consumption and economic growth. Energy Procedia 5:2065-2071. [CrossRef]
Figure 1.
Total and share of different renewable energy worldwide during the last two decades [Source: IRENA, 2024].
Figure 1.
Total and share of different renewable energy worldwide during the last two decades [Source: IRENA, 2024].
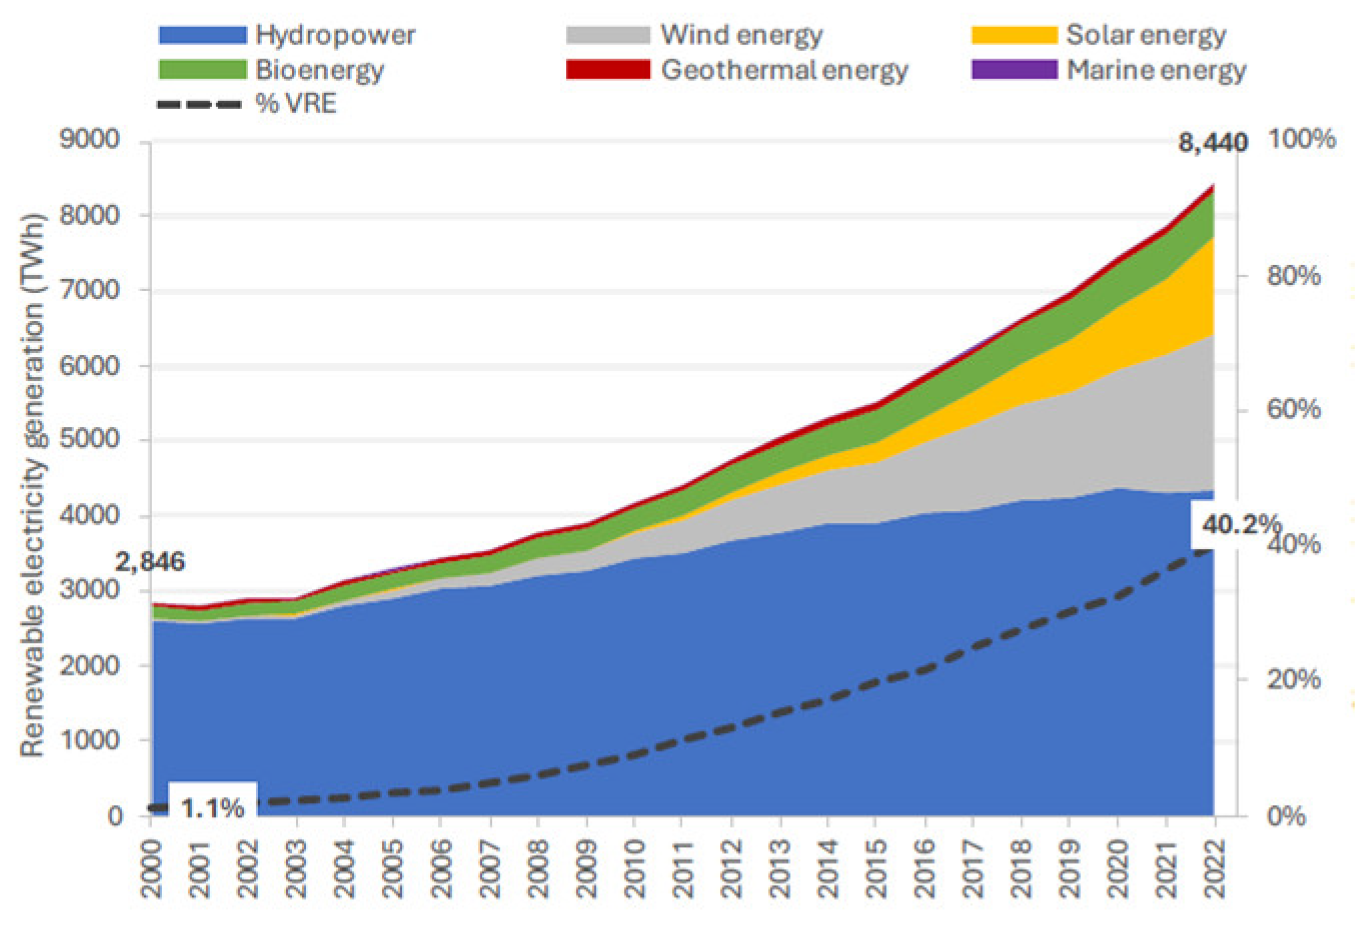
Figure 2.
Trends in total energy consumption in different regions of the world. [Source: UN 2025 Energy Statistics Pocketbook 2025, Statistics Papers Series E No. 8. United Nations, Department of Economic and Social Affairs, New York.].
Figure 2.
Trends in total energy consumption in different regions of the world. [Source: UN 2025 Energy Statistics Pocketbook 2025, Statistics Papers Series E No. 8. United Nations, Department of Economic and Social Affairs, New York.].
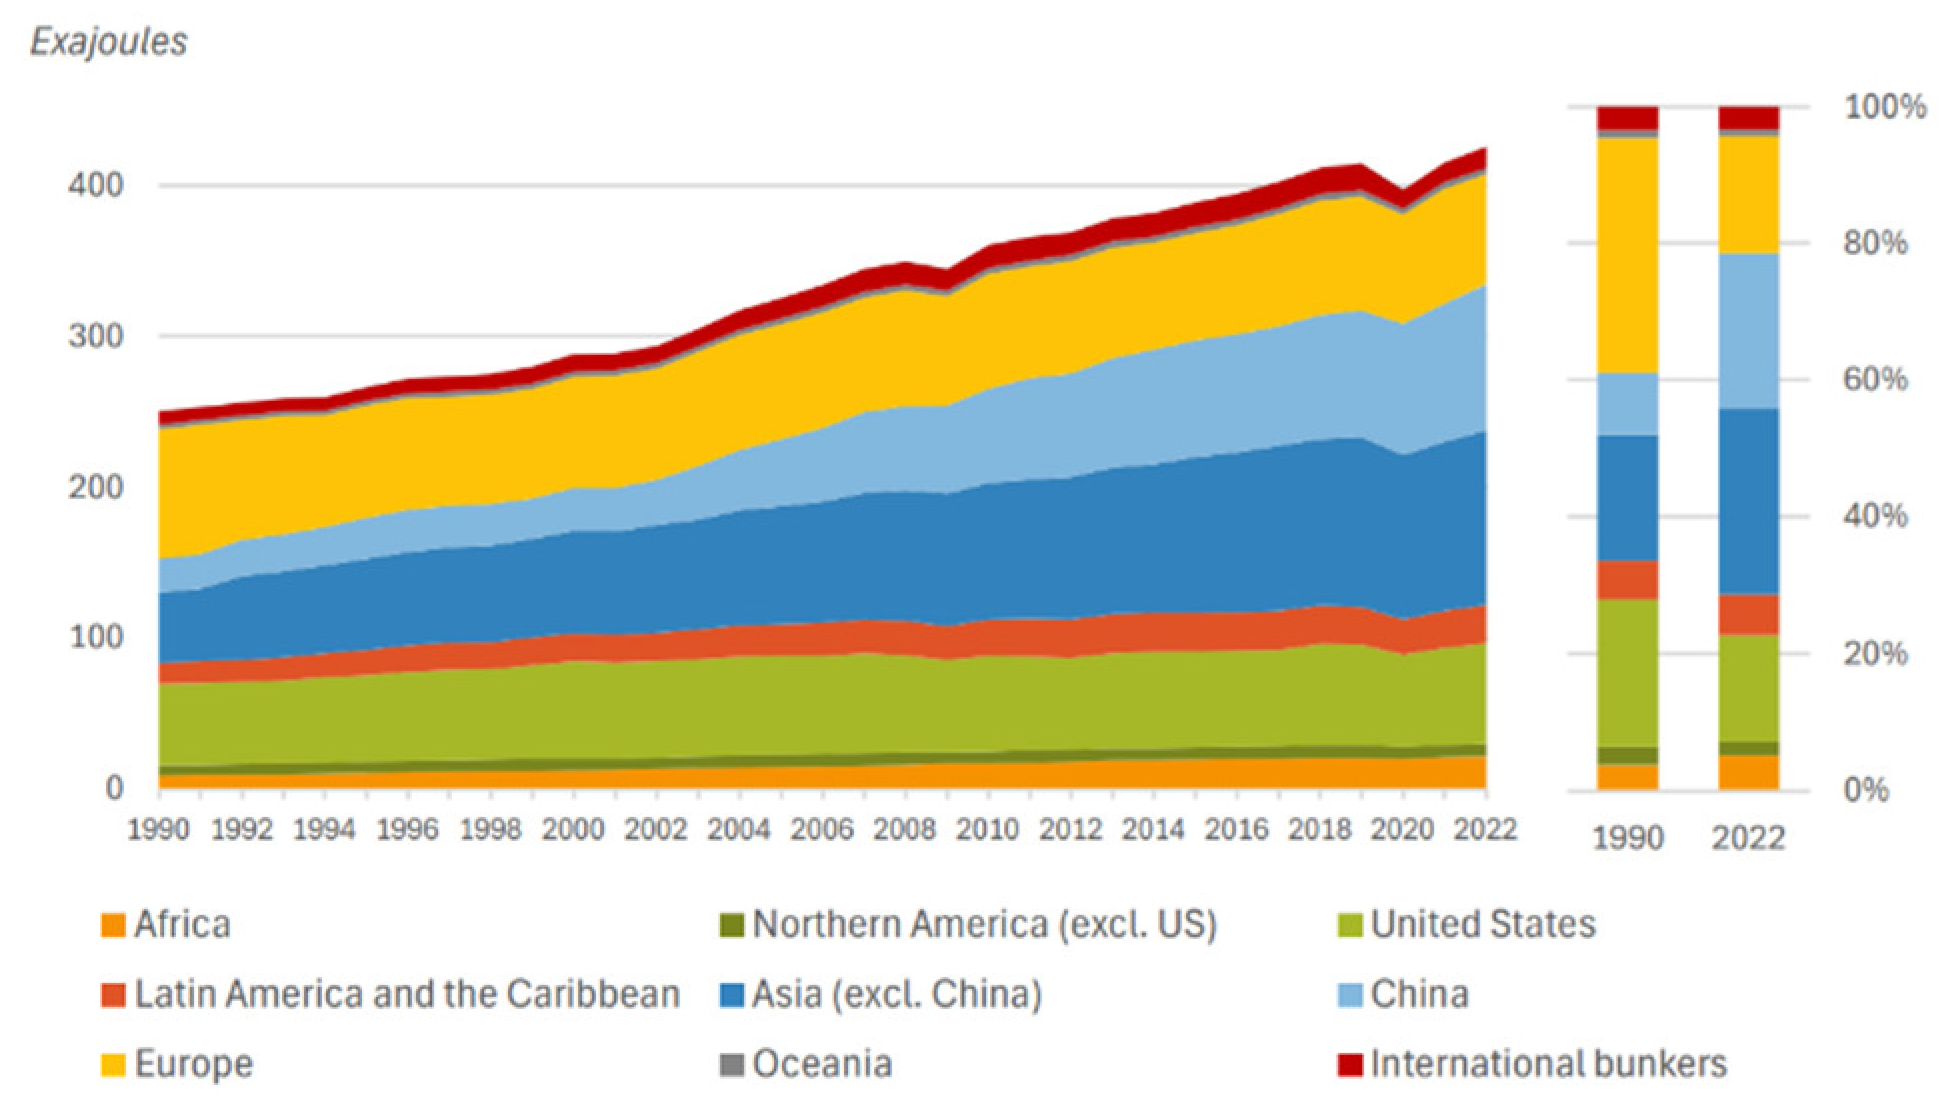
Figure 3.
Total primary energy supply by sources in 2021 [Source: IEA, 2024a].
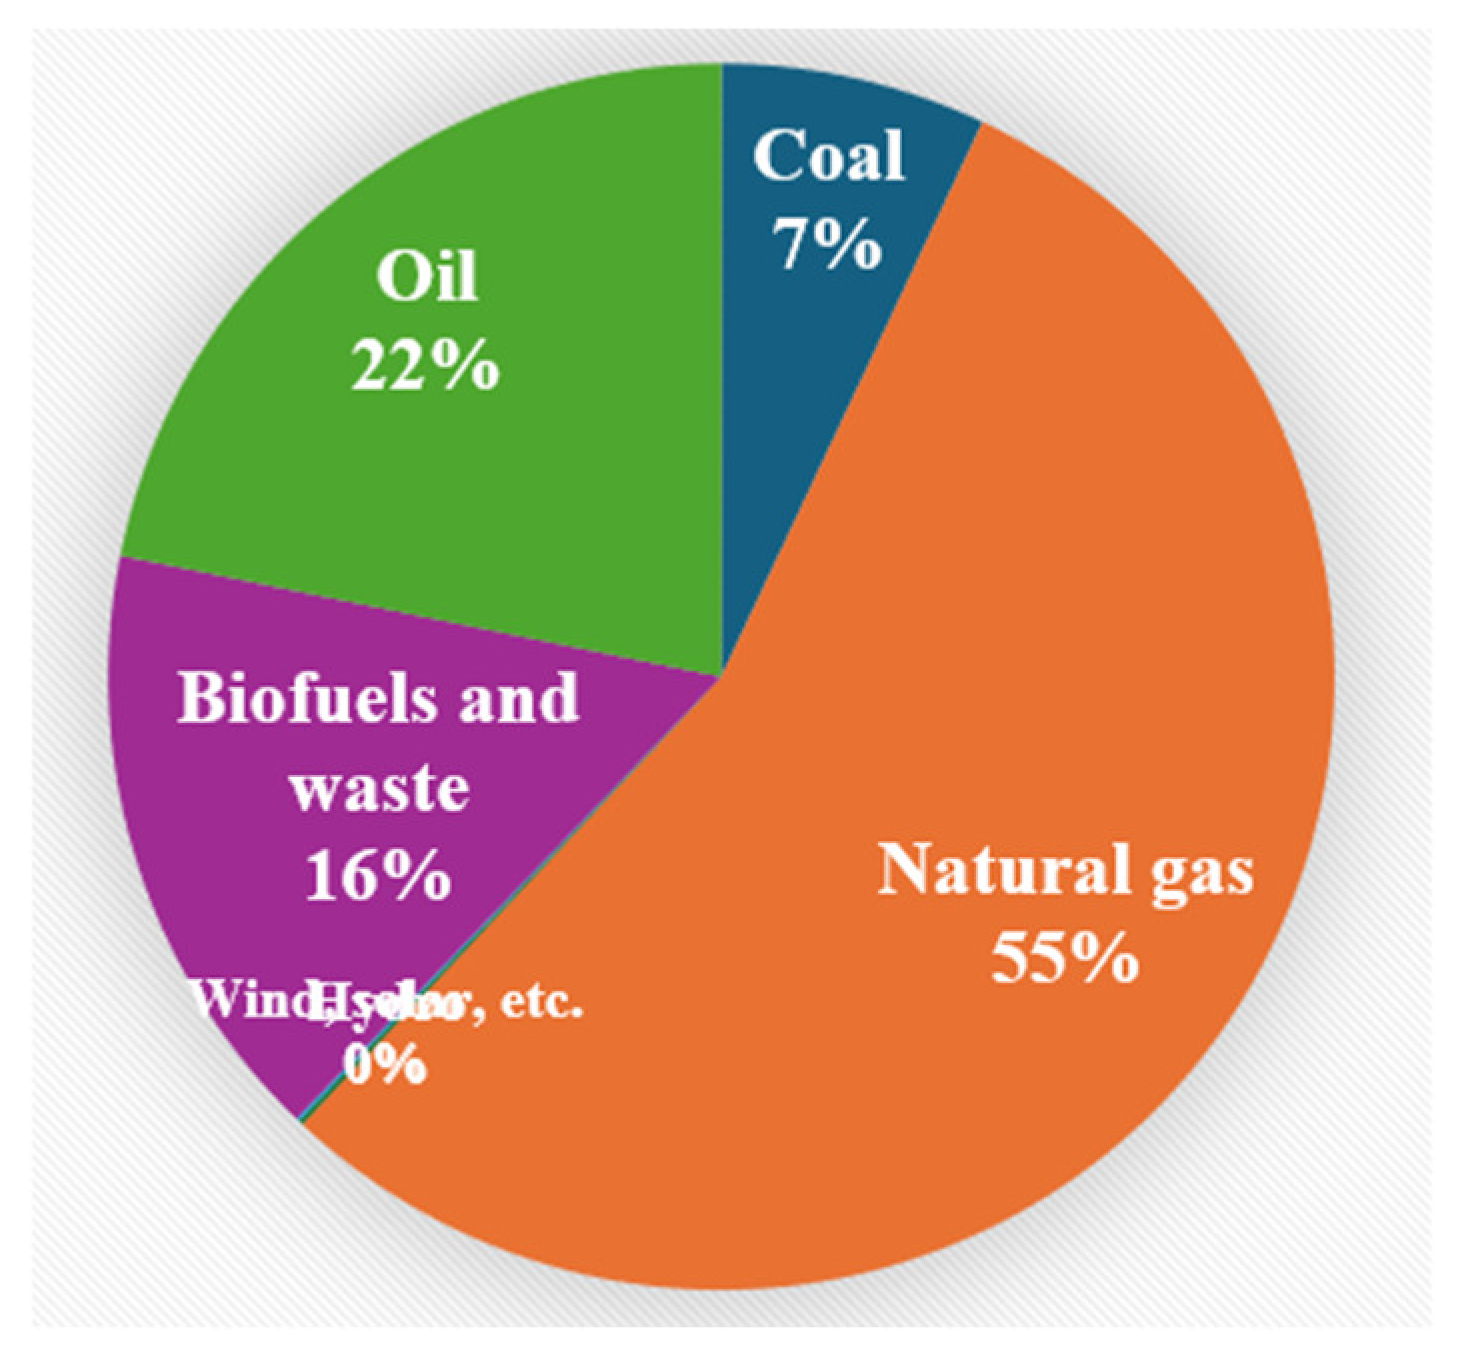
Figure 4.
Trend of different energy supply over the last two decades [Data Source: IEA, 2024a].
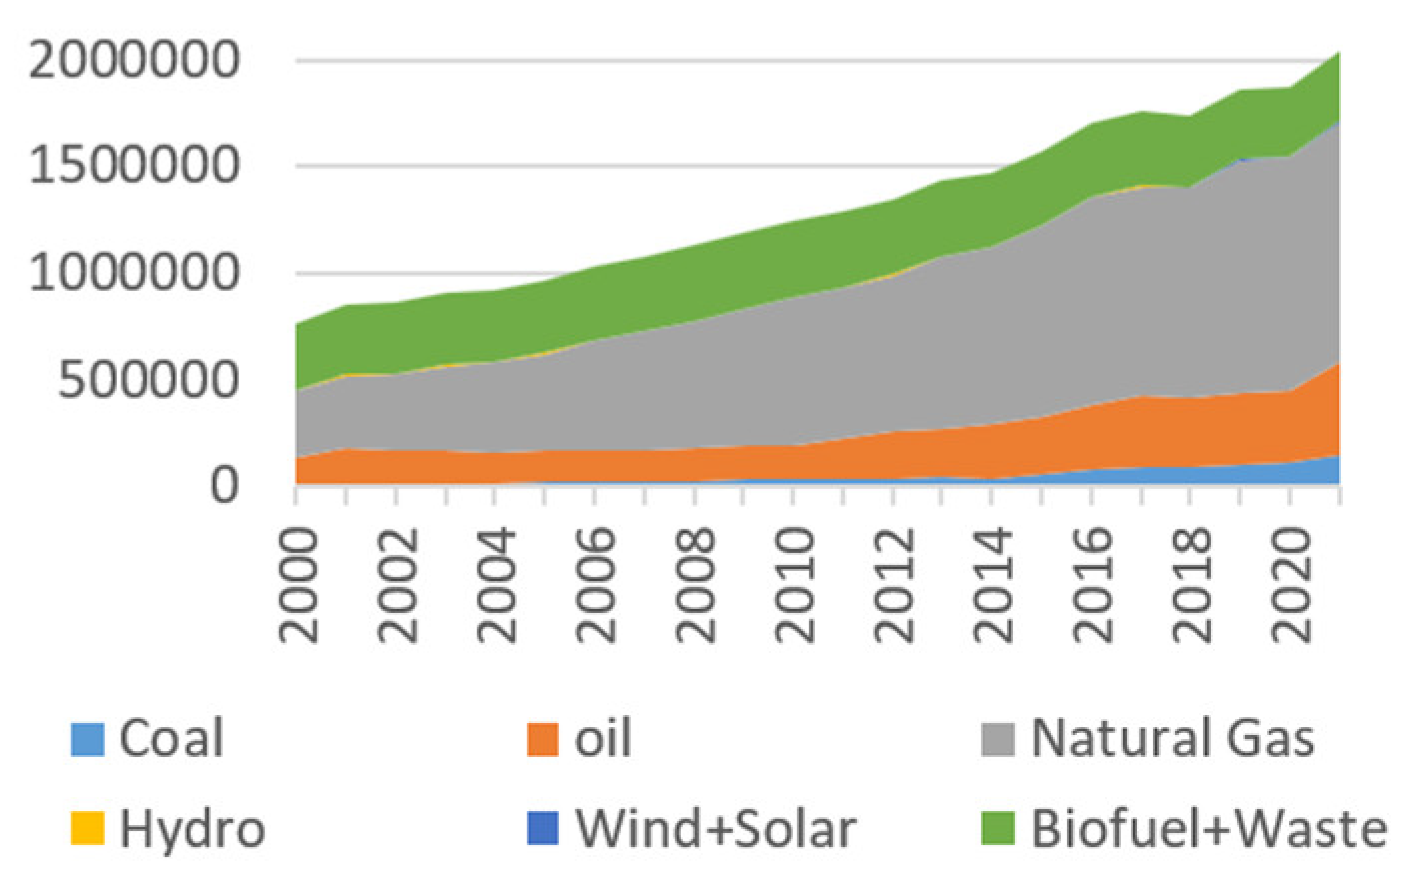
Figure 5.
Natural gas production and reserve in Bangladesh [Data Source: B.P., 2023].
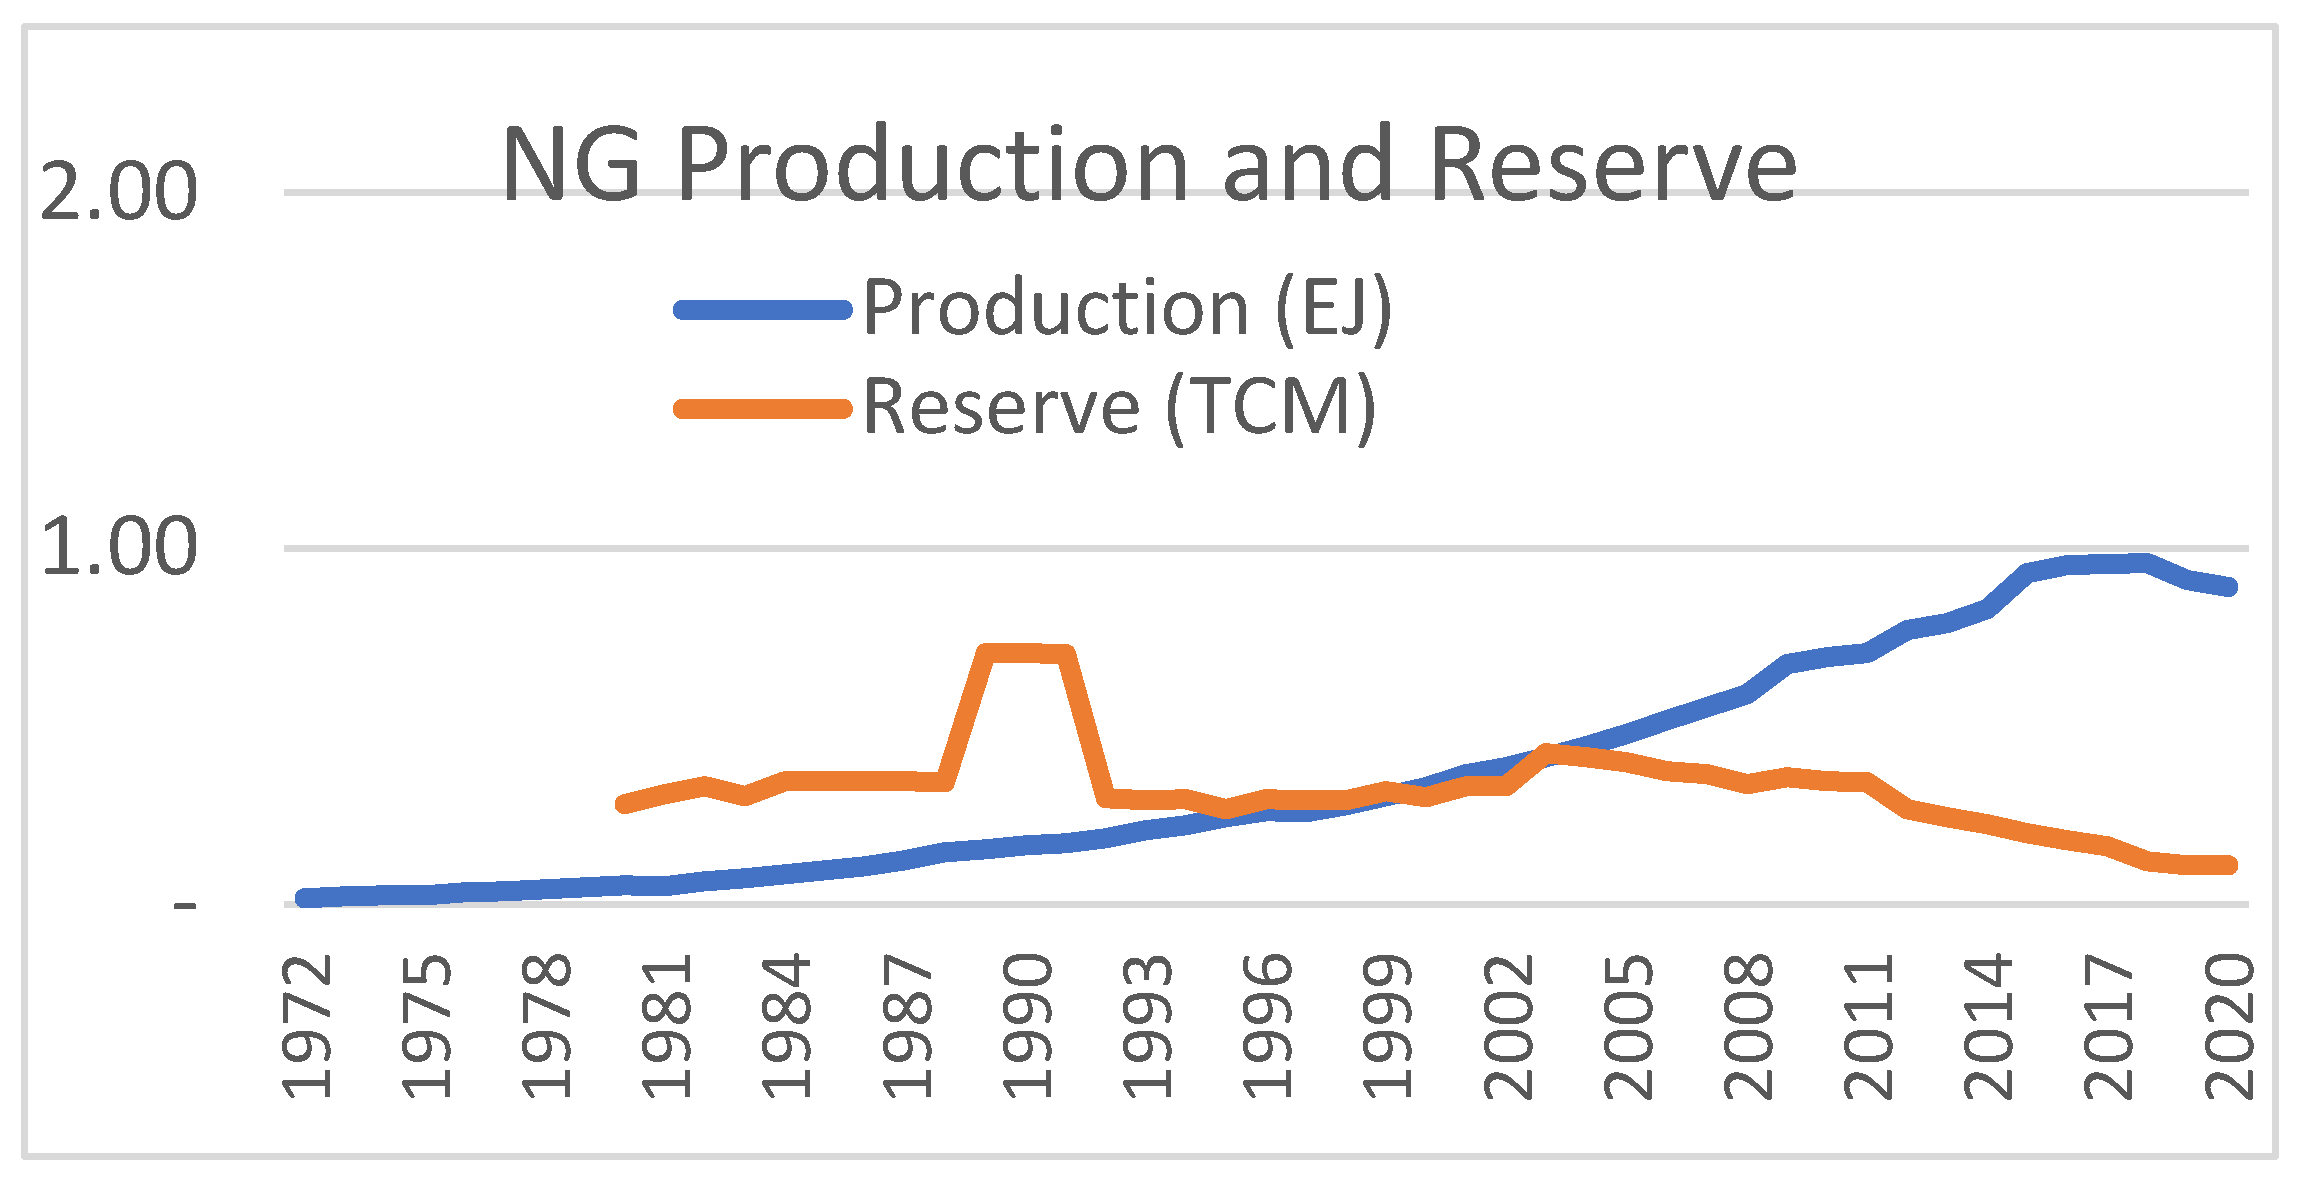
Figure 6.
Primary energy consumption, total and per capita, Bangladesh [Data Source: B.P., 2023].
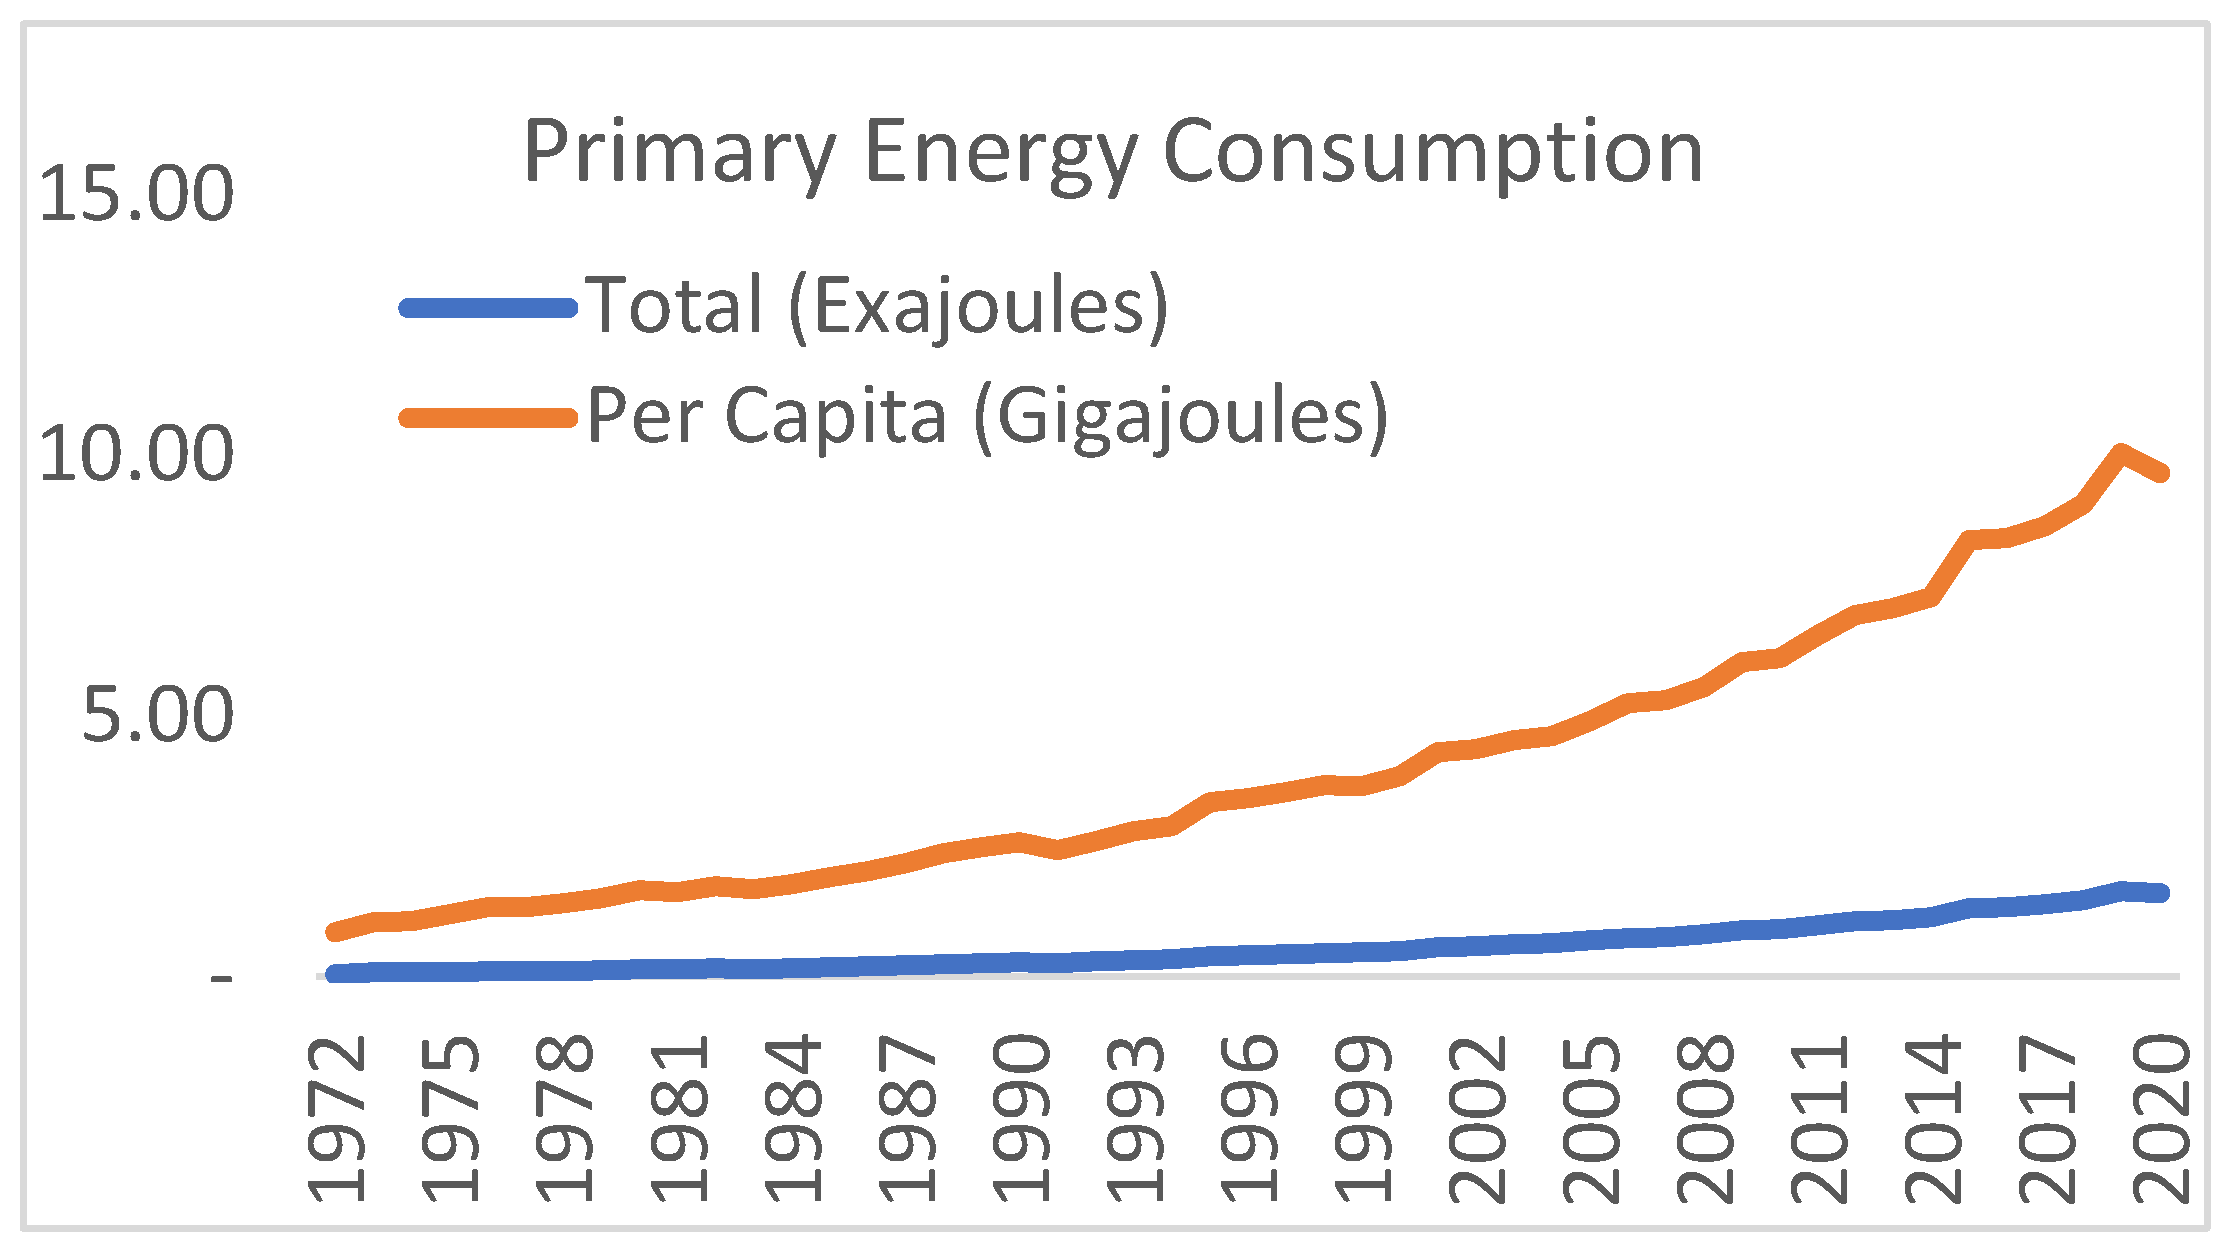
Figure 8.
Electricity consumption in different sectors [Data Source: BPDB, 2021].
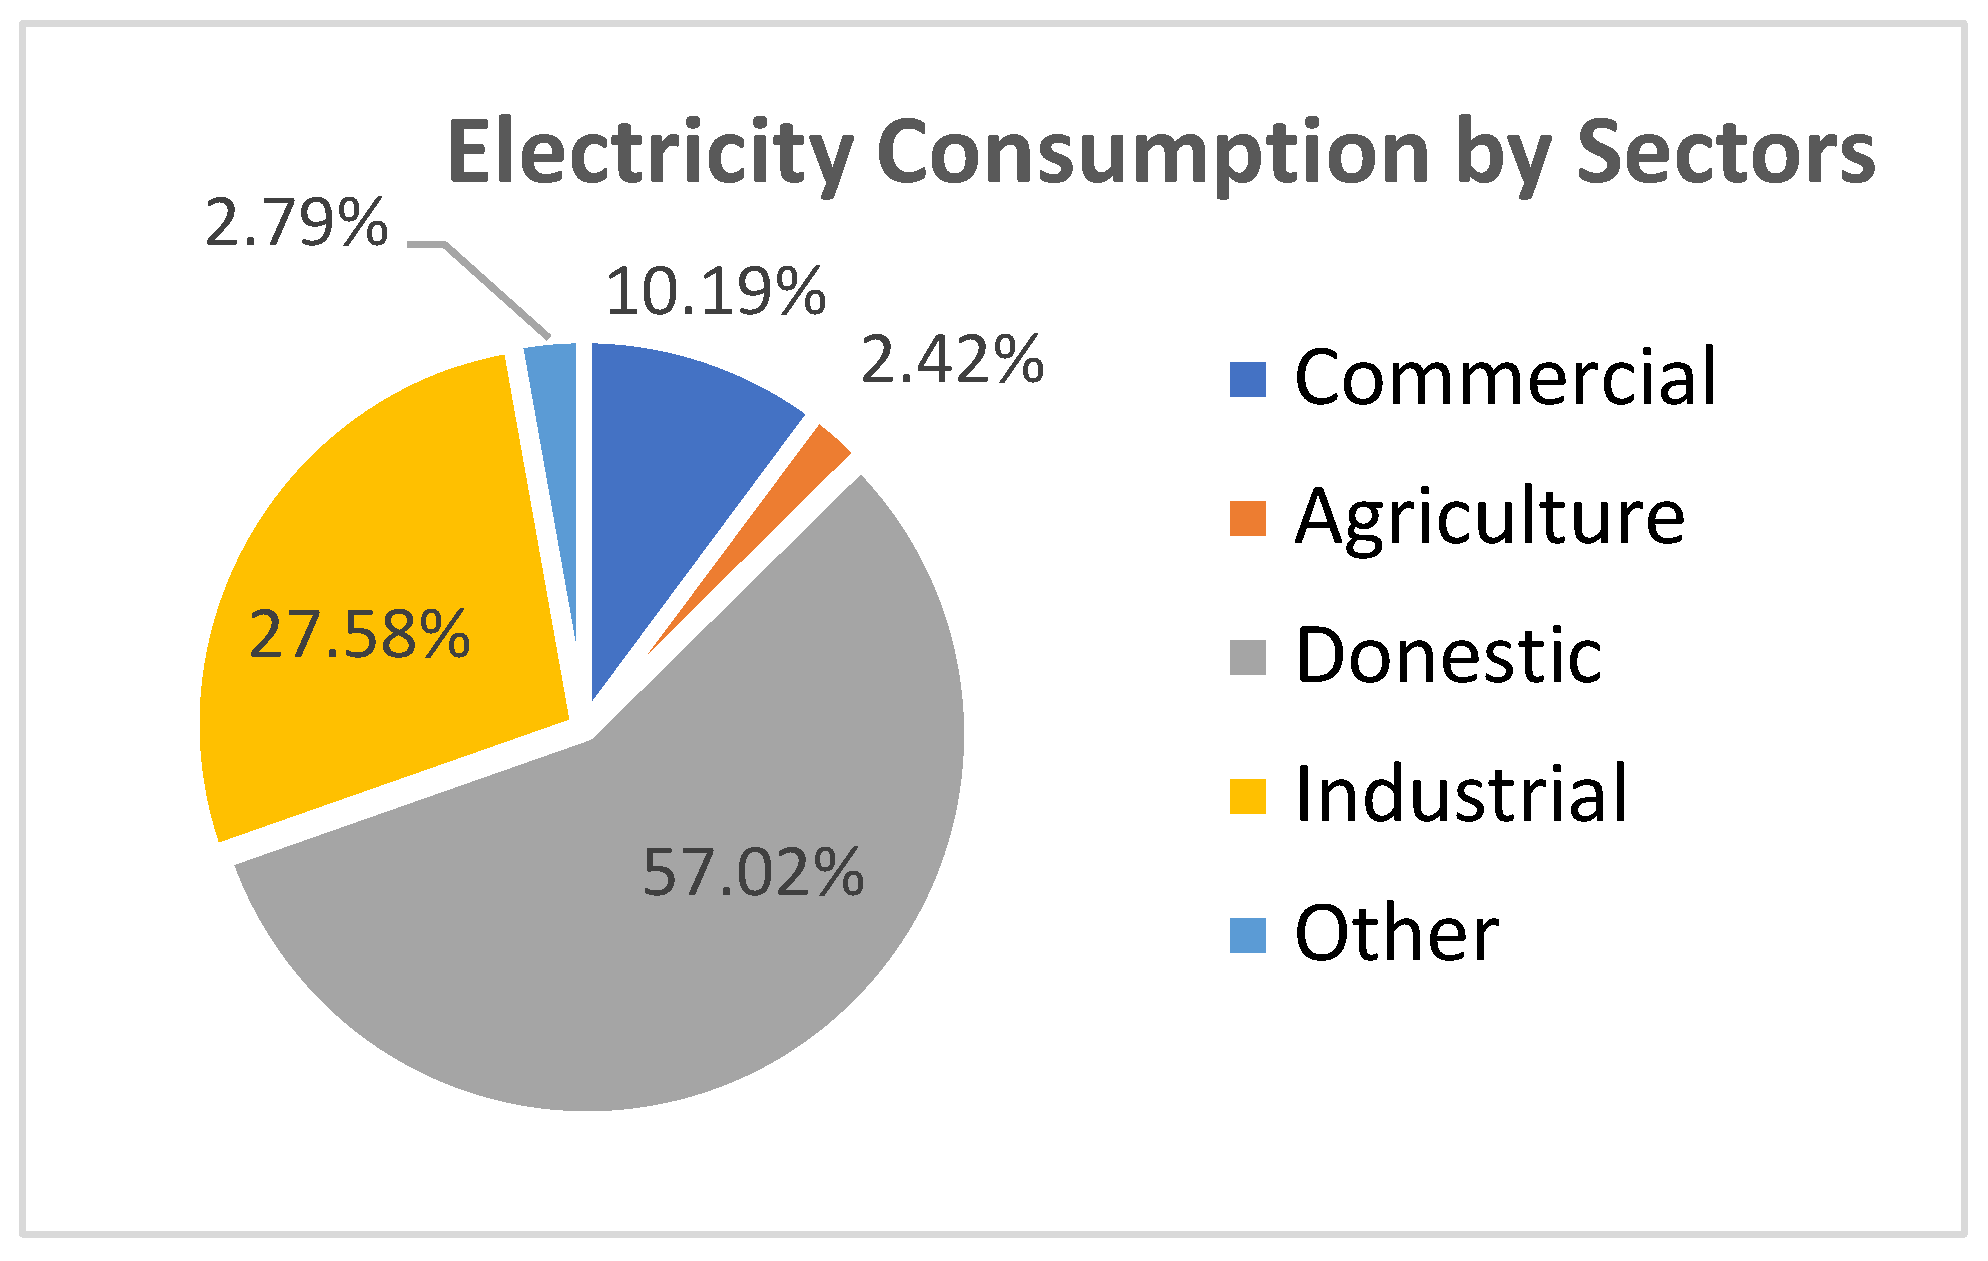
Figure 13.
Coal production in Canada in million metric tons (Data source: B.P., 2023; Energy Institute, 2025).
Figure 13.
Coal production in Canada in million metric tons (Data source: B.P., 2023; Energy Institute, 2025).
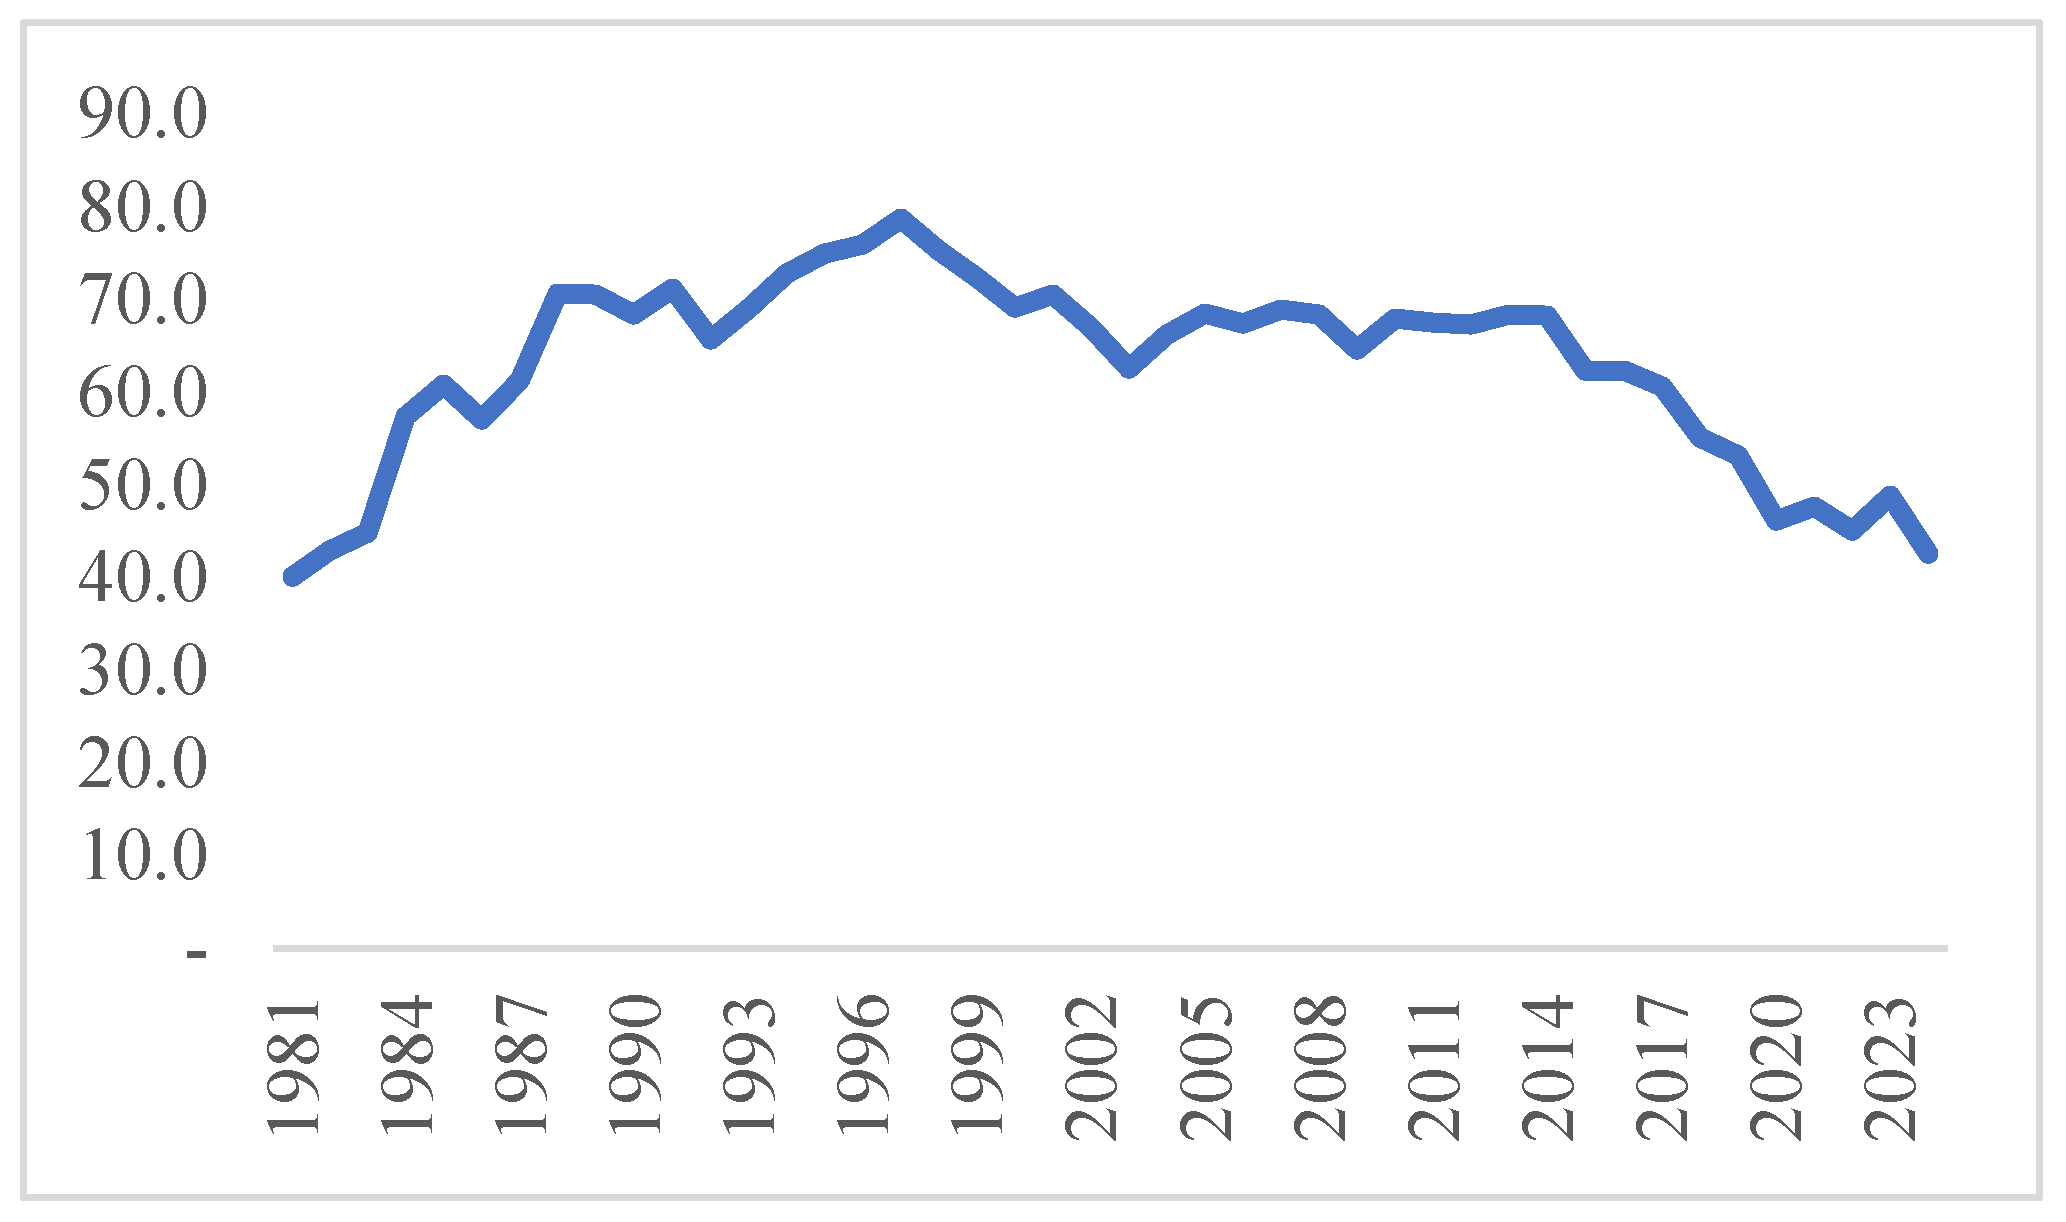
Figure 14.
Natural gas production in Canada [Data source: B.P., 2023; Energy Institute, 2025].
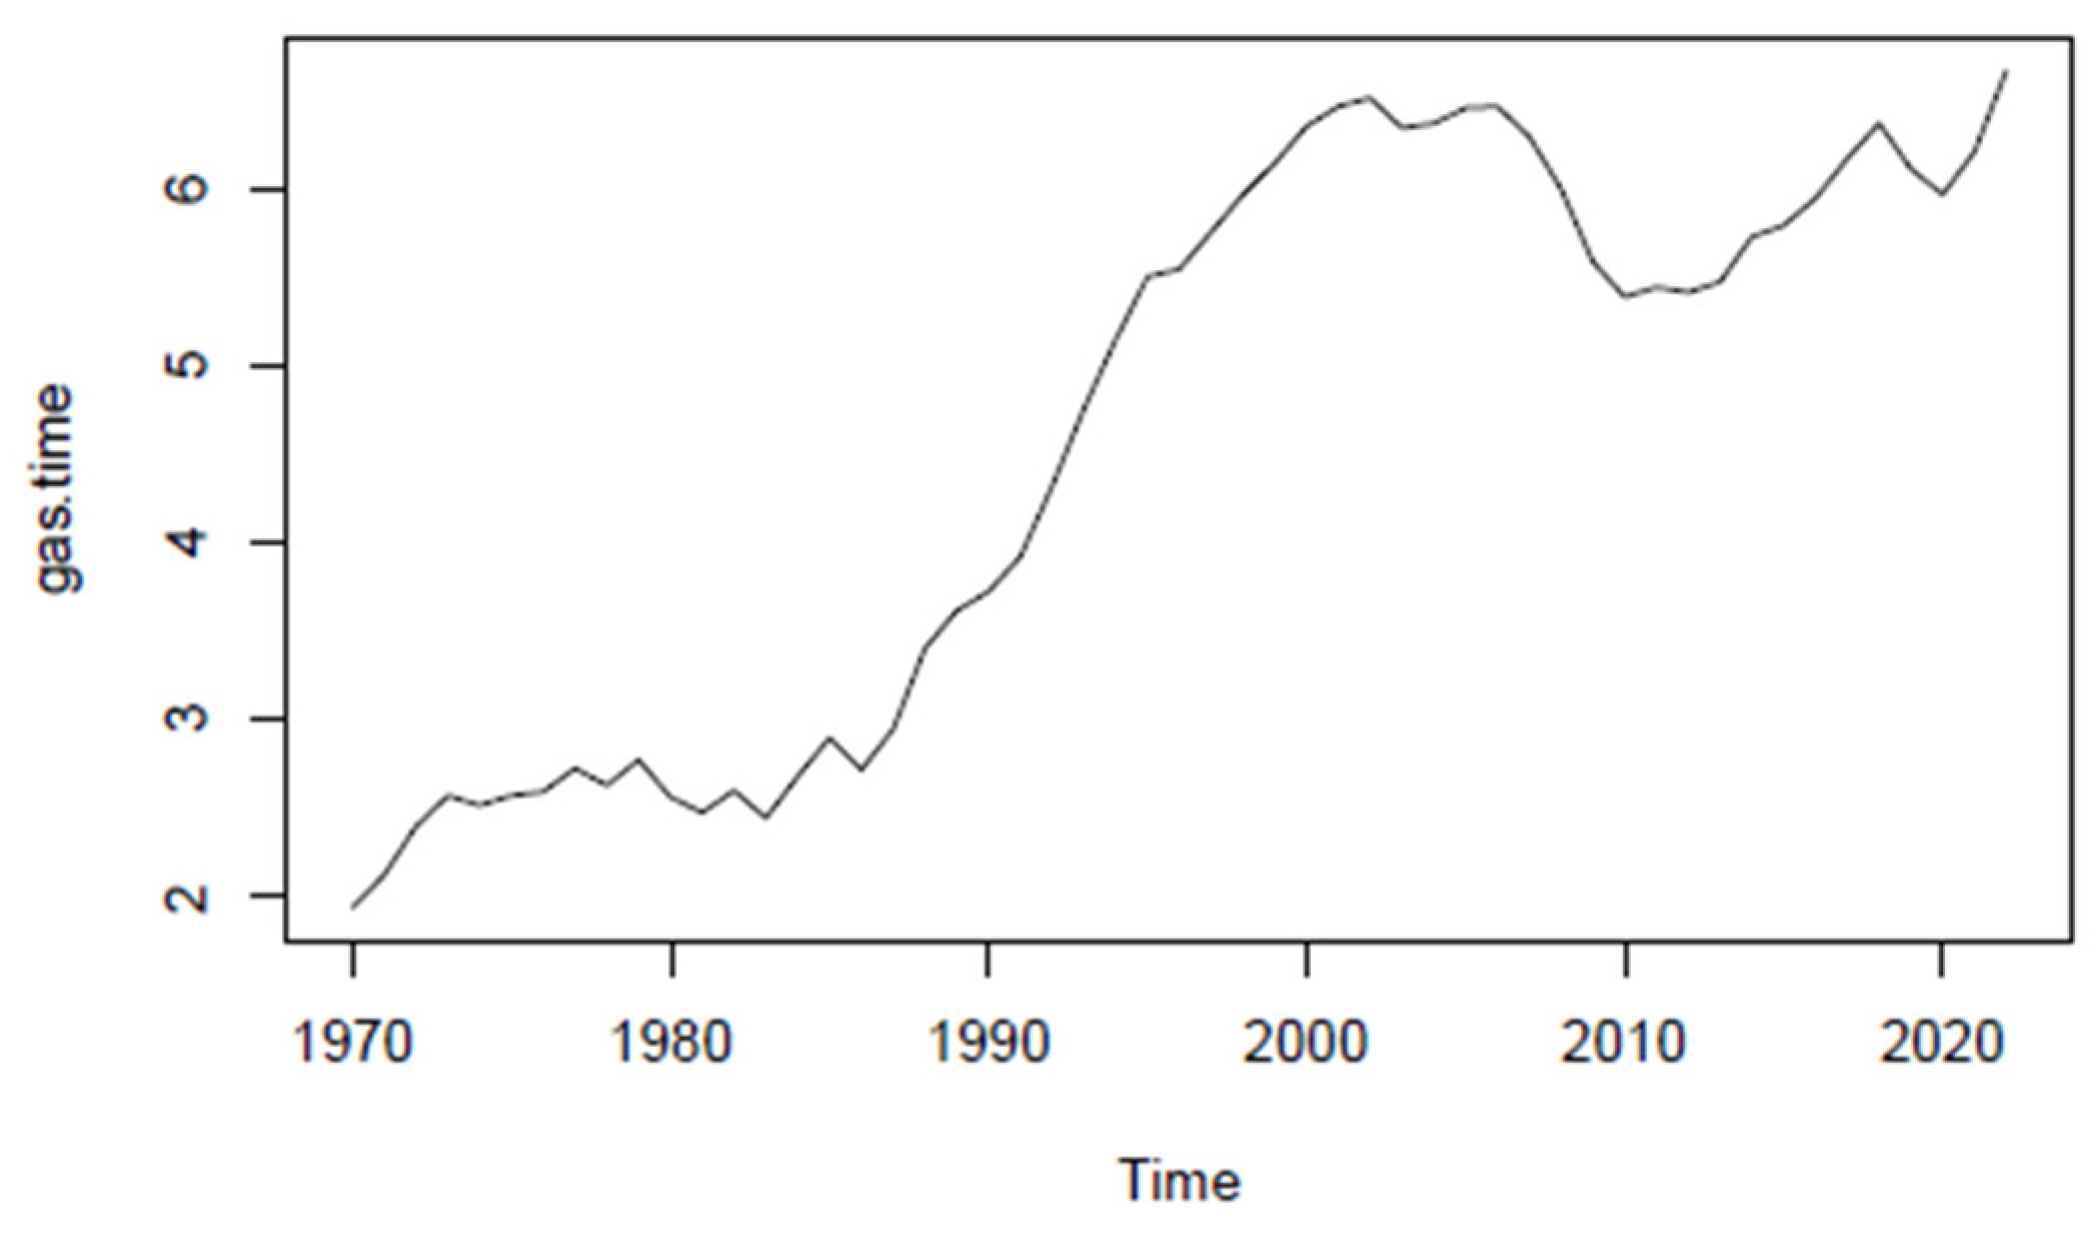
Figure 15.
Canada’s renewable energy generation capacity [Source: NRC 2024a).
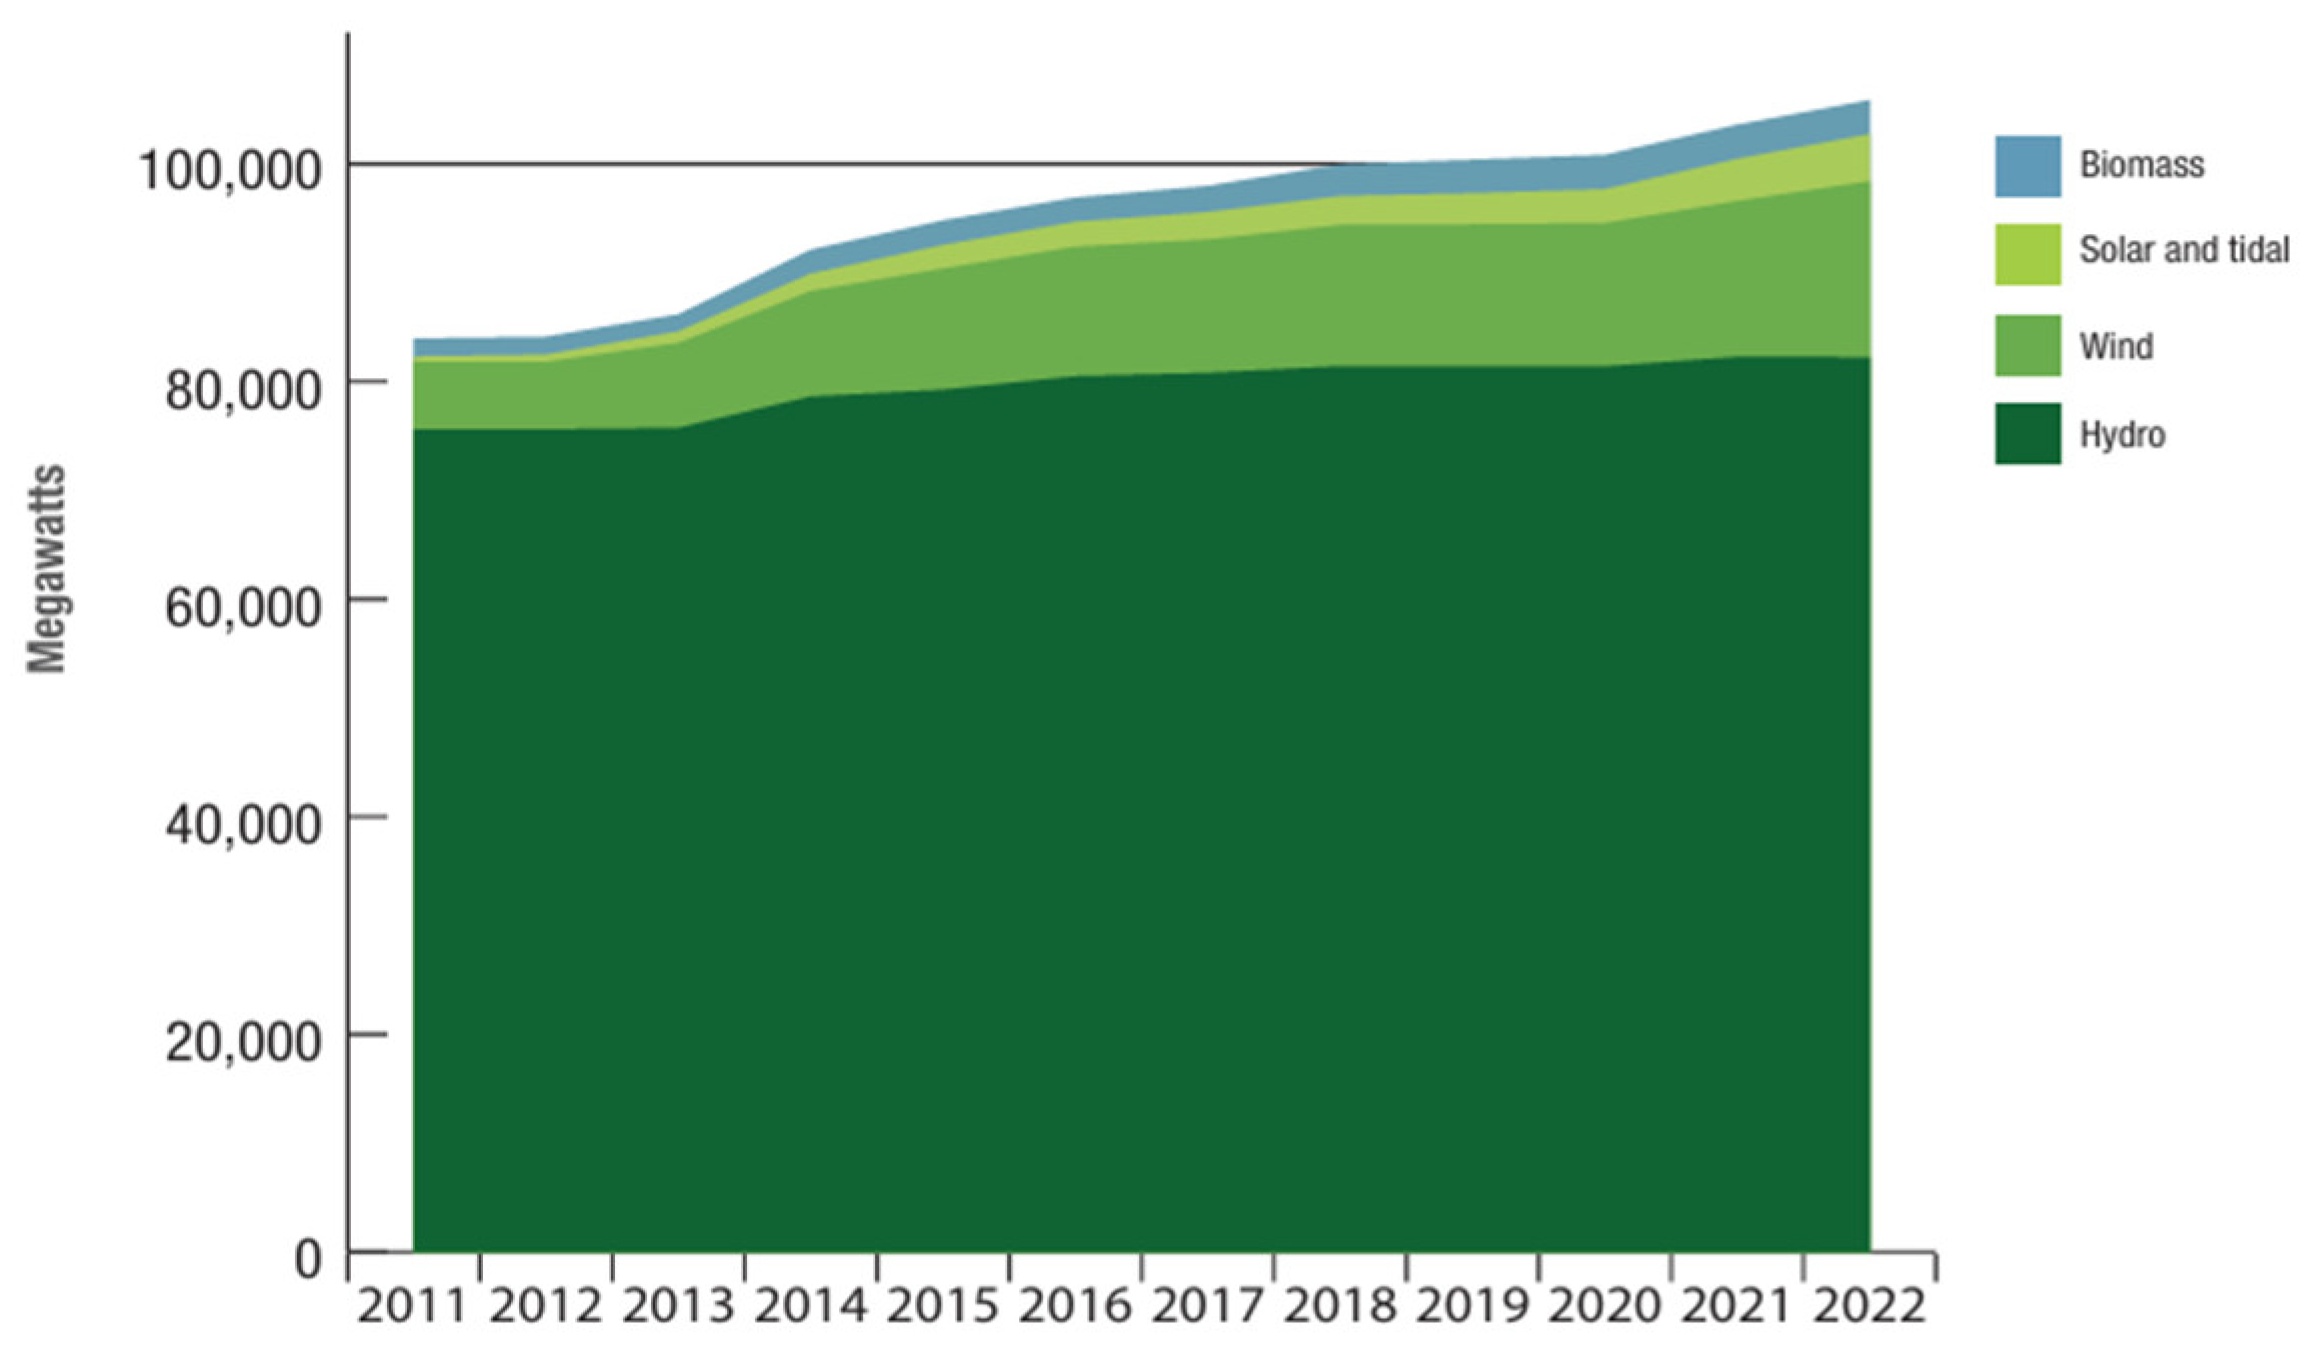
Figure 16.
Trends in energy use and intensity by section, 2000 – 2021. [Source: NRC 2024a Energy Fact Book 2024-25. Natural Resources Canada, Government of Canada].
Figure 16.
Trends in energy use and intensity by section, 2000 – 2021. [Source: NRC 2024a Energy Fact Book 2024-25. Natural Resources Canada, Government of Canada].
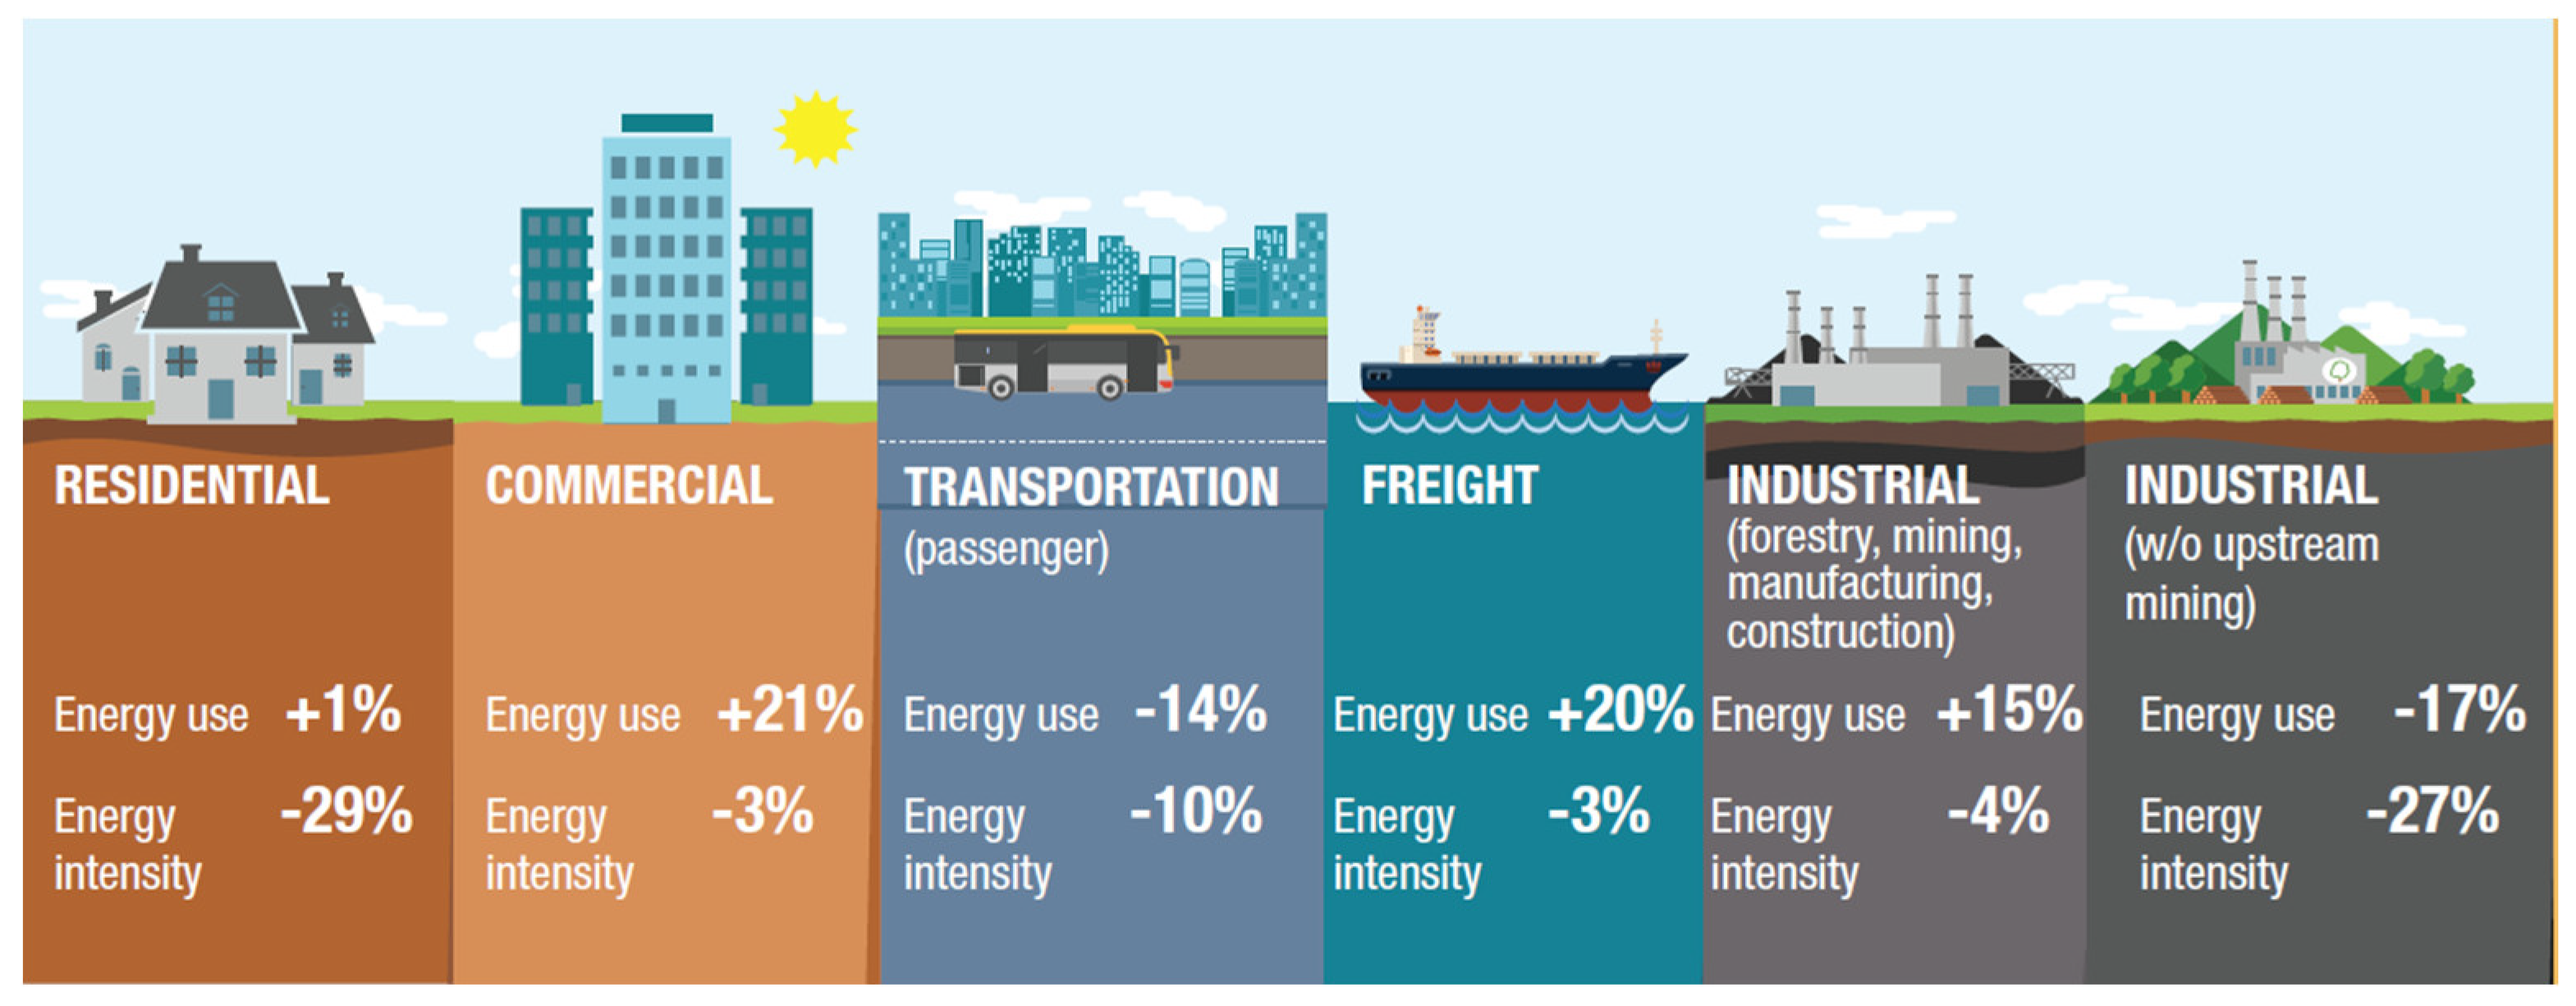
Figure 17.
Solar photovoltaic capacity in Canada 2007-2022 in megawatts. [Source: Natural Resources Canada, 2025; Solar energy. https://natural-resources.canada.ca/energy-sources/renewable-energy/solar-energy].
Figure 17.
Solar photovoltaic capacity in Canada 2007-2022 in megawatts. [Source: Natural Resources Canada, 2025; Solar energy. https://natural-resources.canada.ca/energy-sources/renewable-energy/solar-energy].
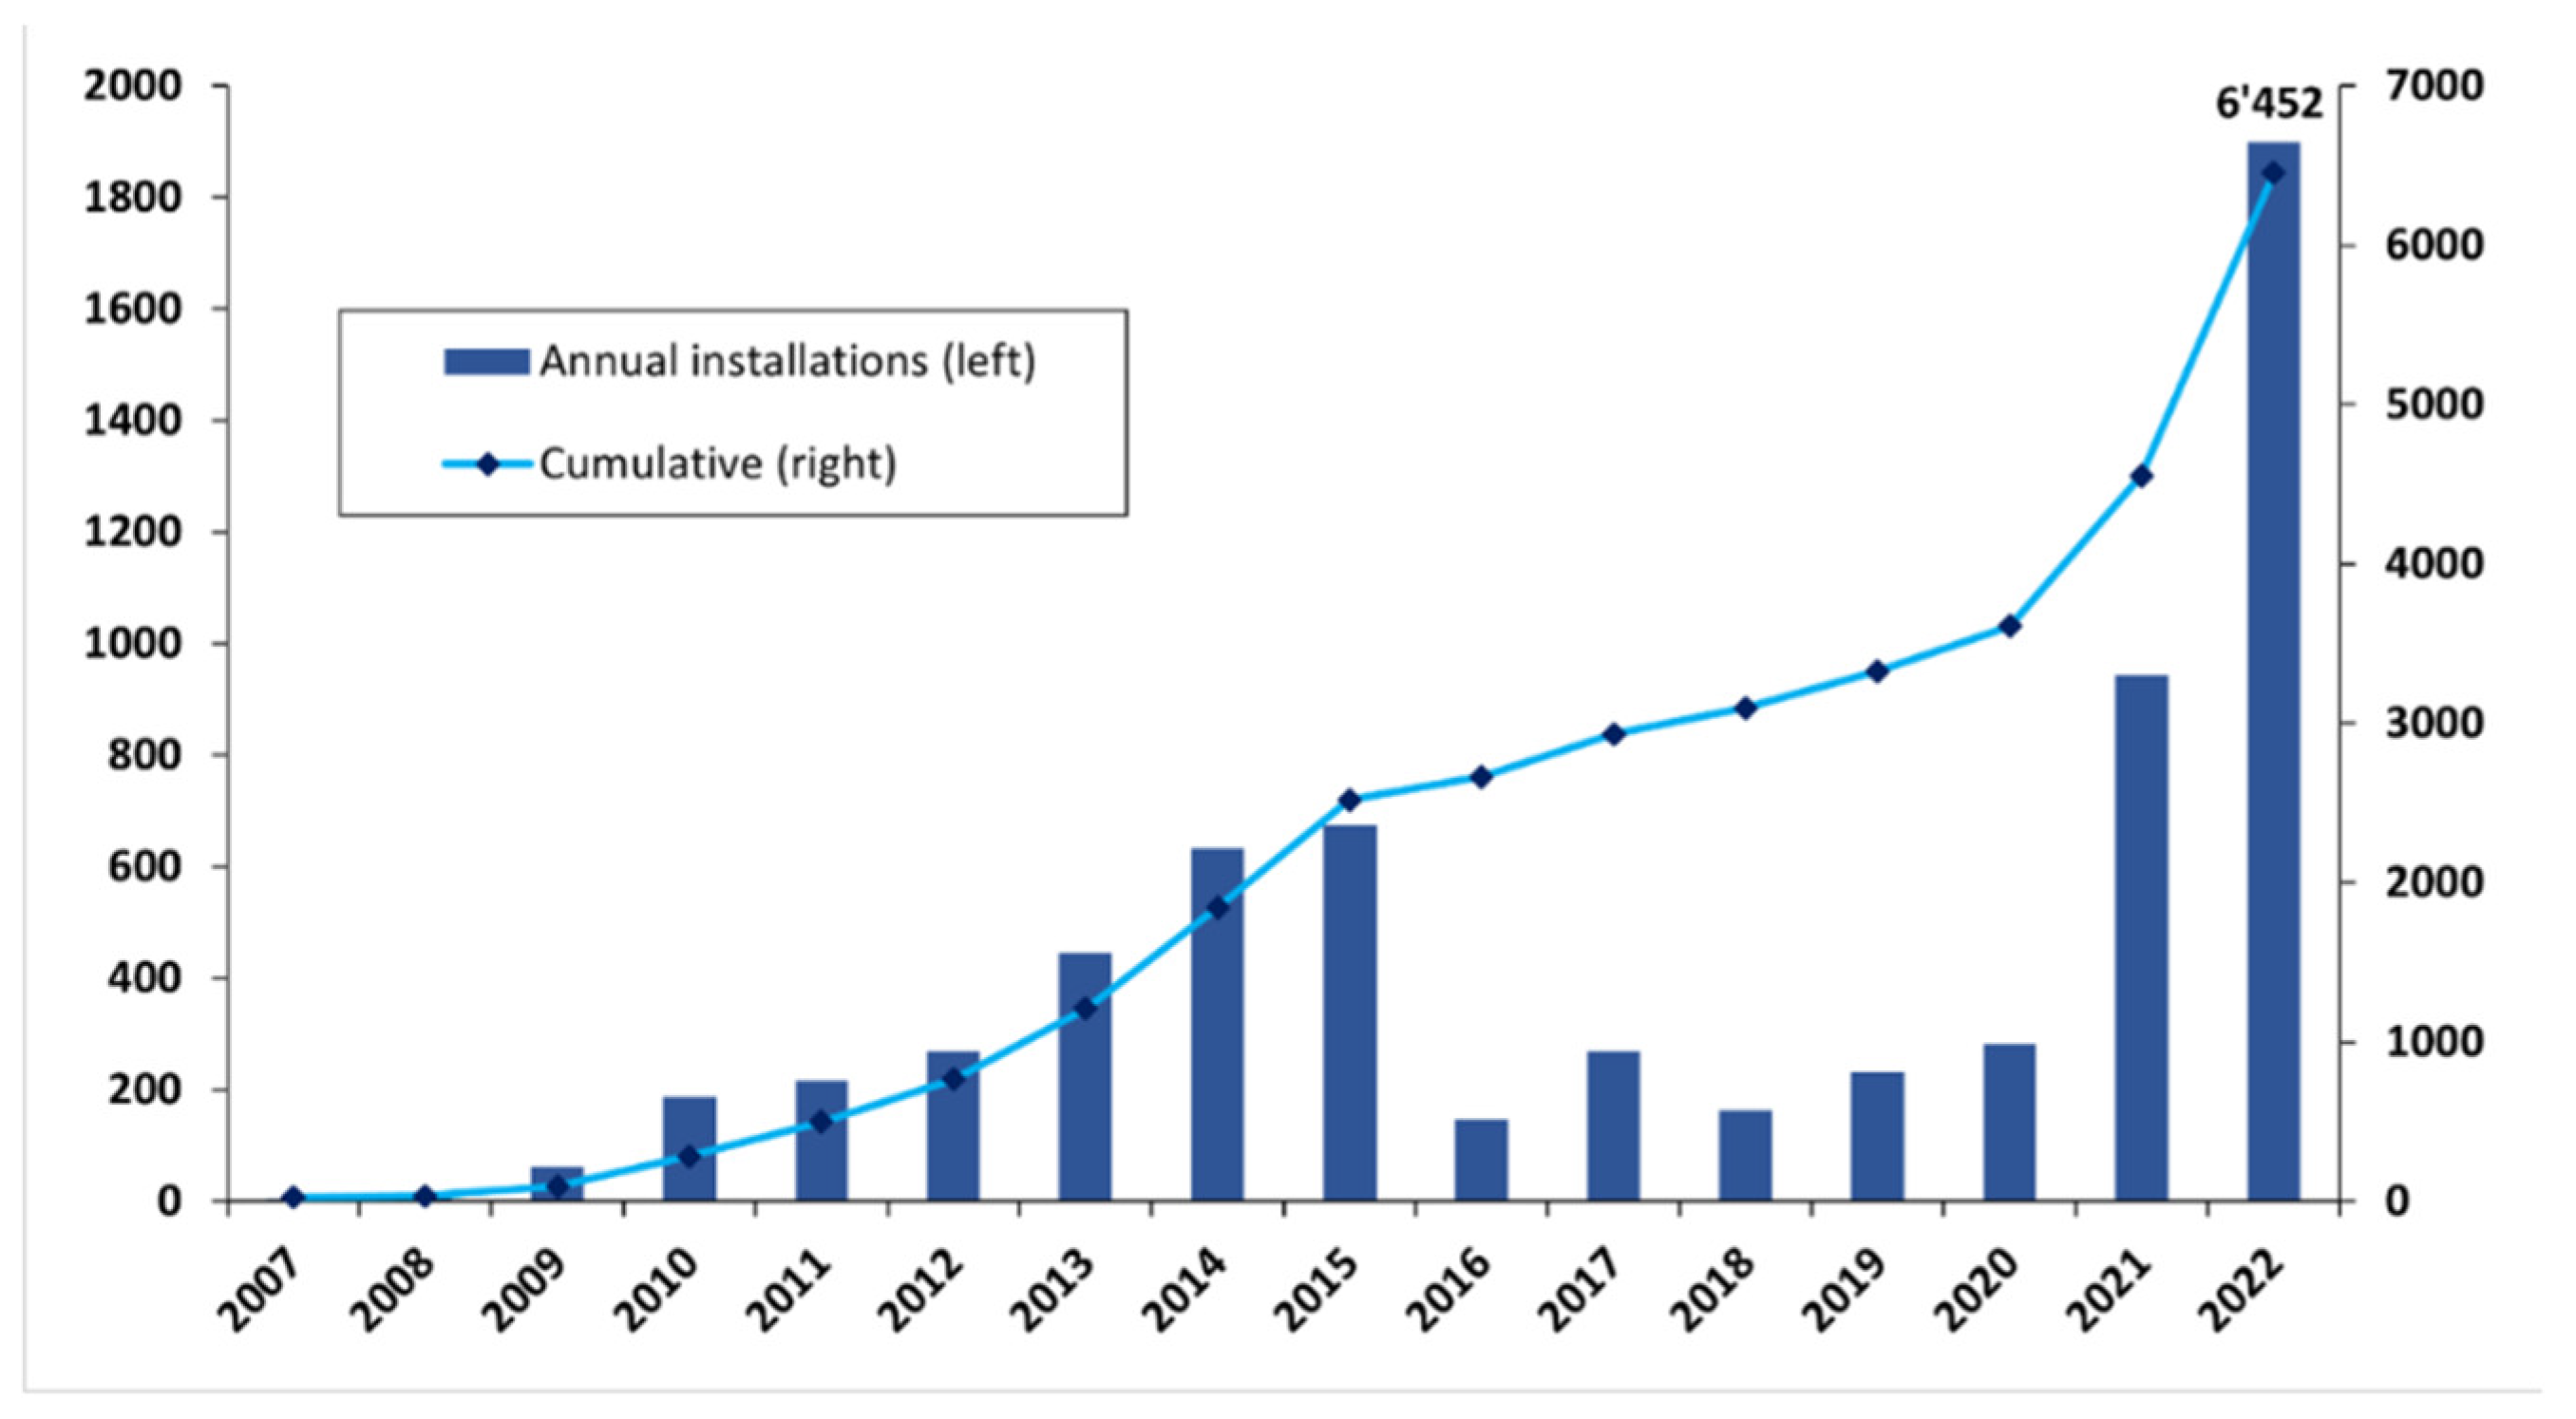
Figure 18.
Wind power capacity in Canada, 2007 – 2022, in megawatts. [Source: Natural Resources Canada, Wind energy. 2025. https://natural-resources.canada.ca/energy-sources/renewable-energy/wind-energy].
Figure 18.
Wind power capacity in Canada, 2007 – 2022, in megawatts. [Source: Natural Resources Canada, Wind energy. 2025. https://natural-resources.canada.ca/energy-sources/renewable-energy/wind-energy].
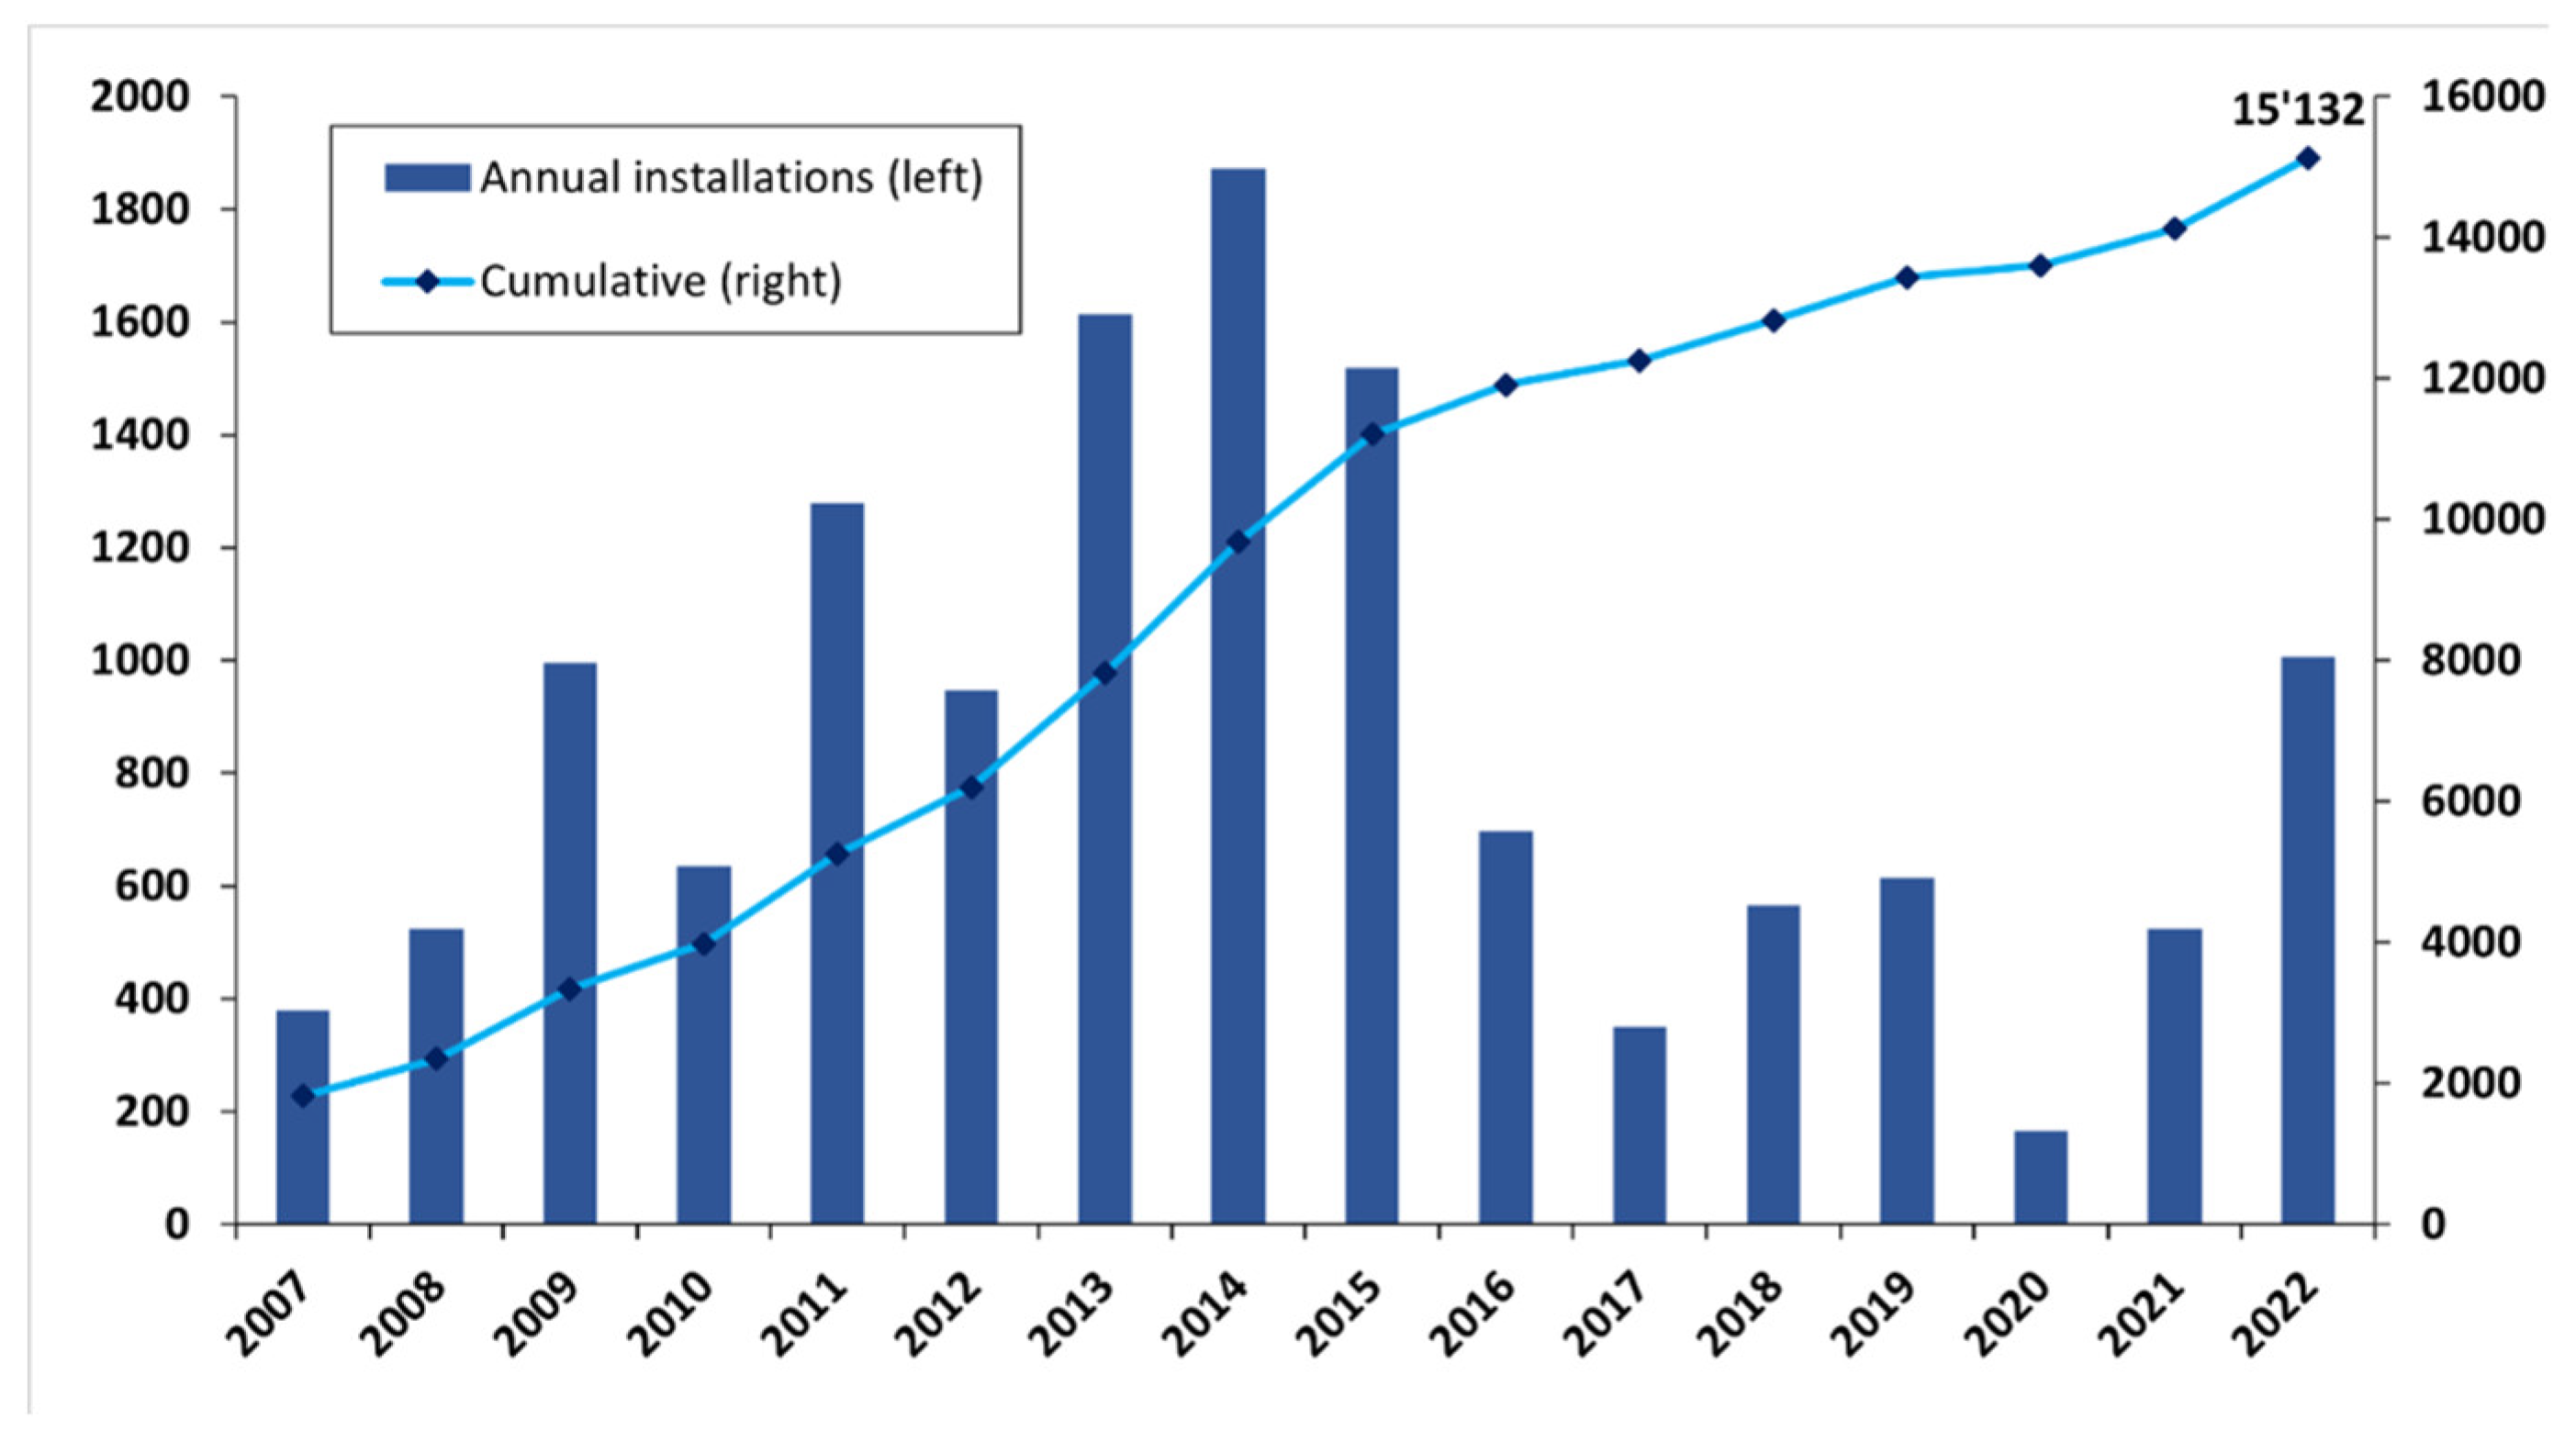
Figure 19.
Wind energy capacity (megawatts) in Canada – a breakdown by provinces [Source: Canada’s Adoption of Renewable Power Sources – Energy Market Analysis.
Figure 19.
Wind energy capacity (megawatts) in Canada – a breakdown by provinces [Source: Canada’s Adoption of Renewable Power Sources – Energy Market Analysis.
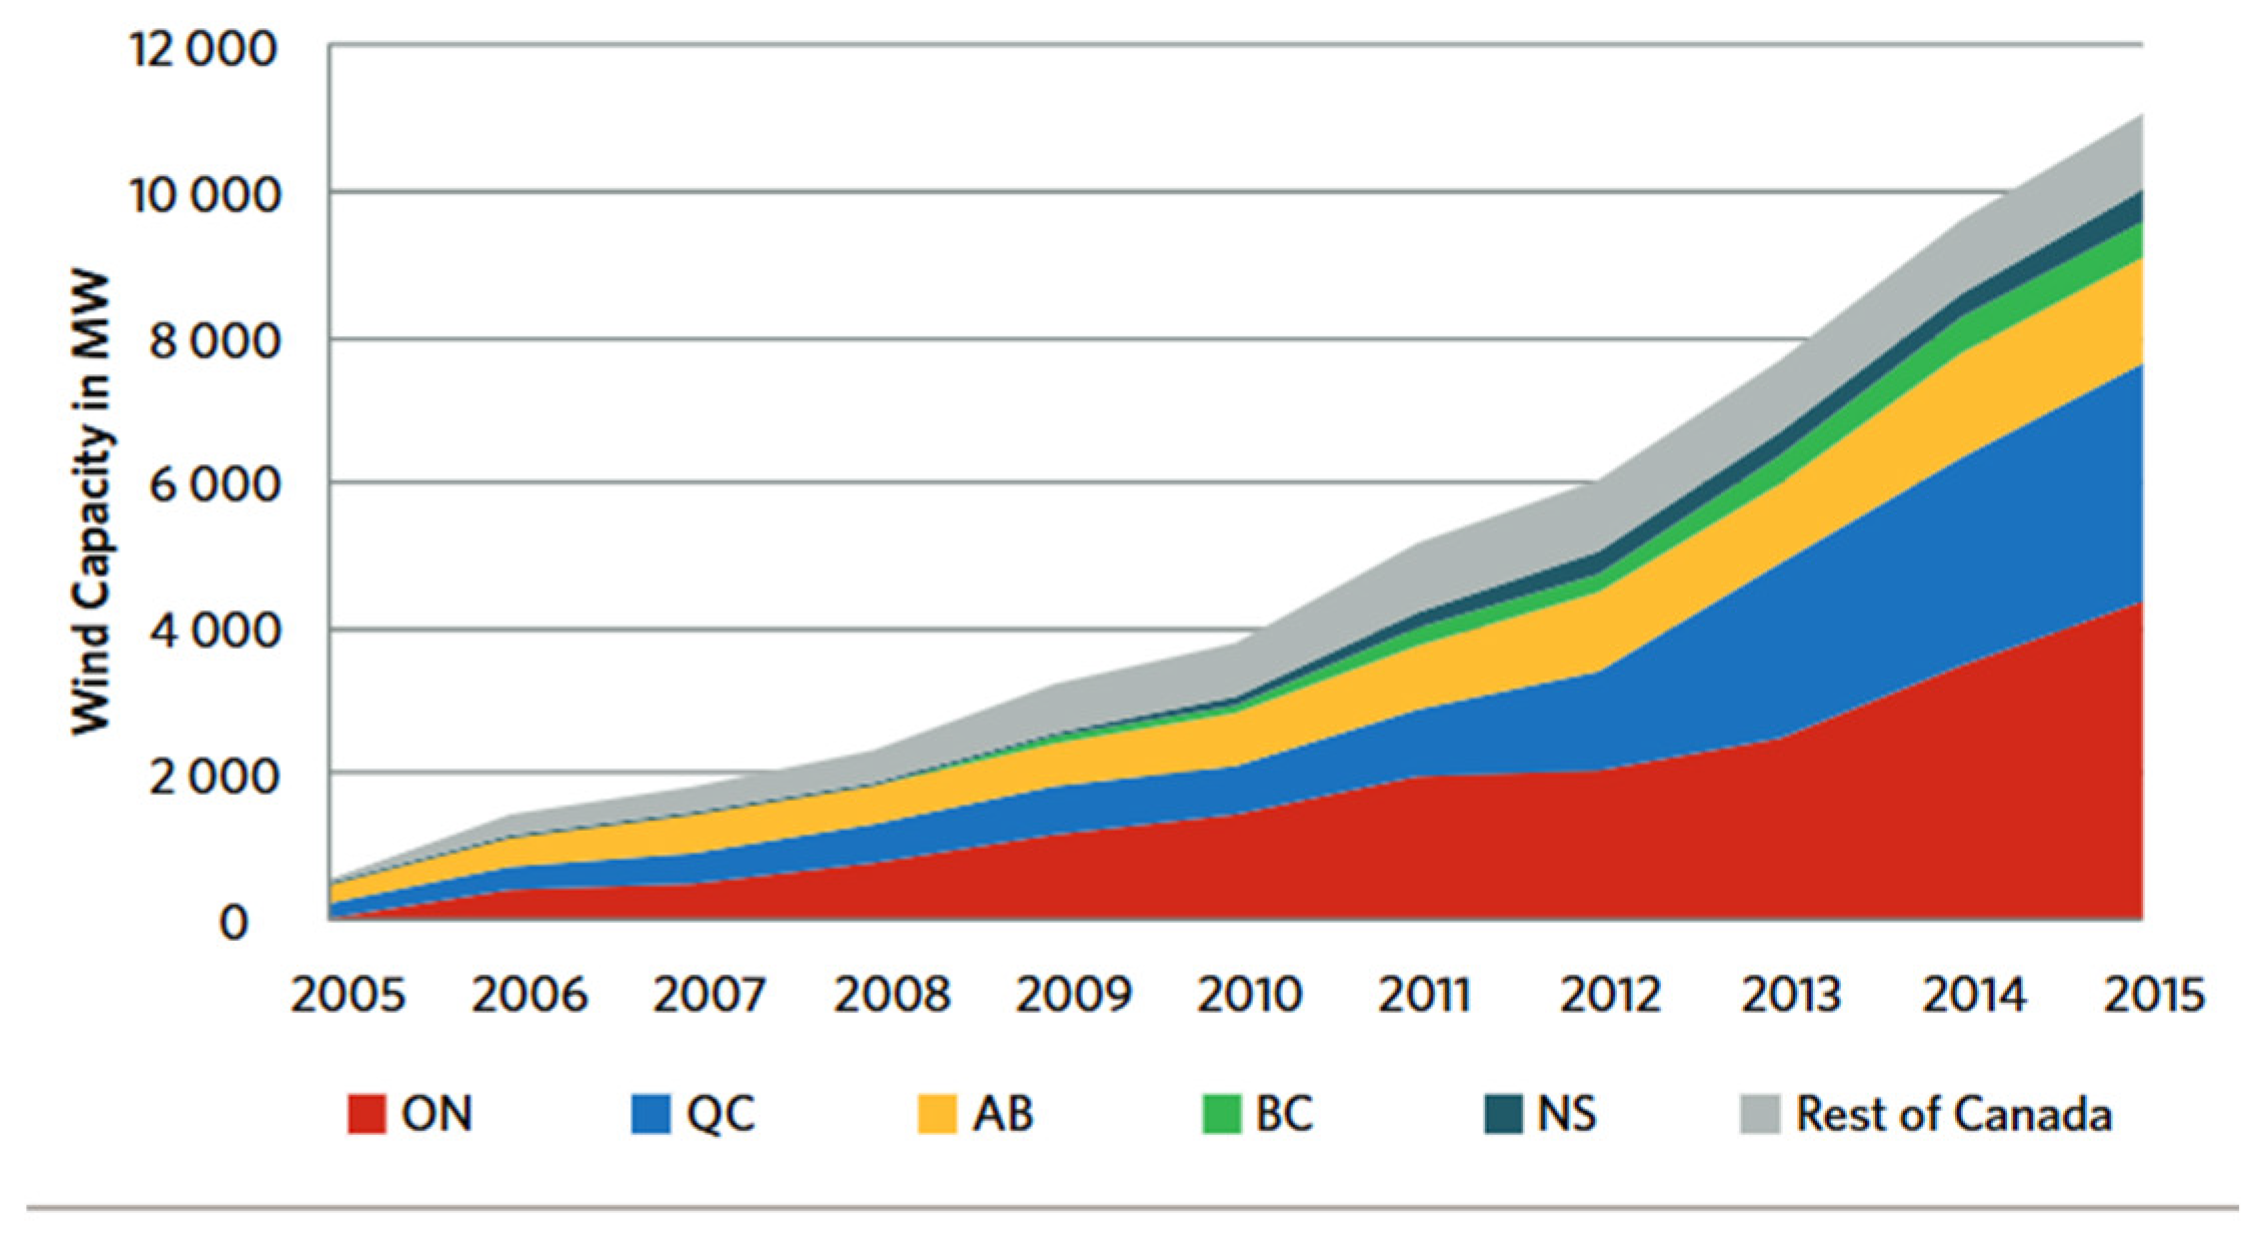
Figure 20.
Biomass energy capacity in Canada [Source: National Energy Board, 2023, Biomass magazine. https://biomassmagazine.com/articles/neb-report-addresses-biomass-power-generation-in-canada-14352].
Figure 20.
Biomass energy capacity in Canada [Source: National Energy Board, 2023, Biomass magazine. https://biomassmagazine.com/articles/neb-report-addresses-biomass-power-generation-in-canada-14352].
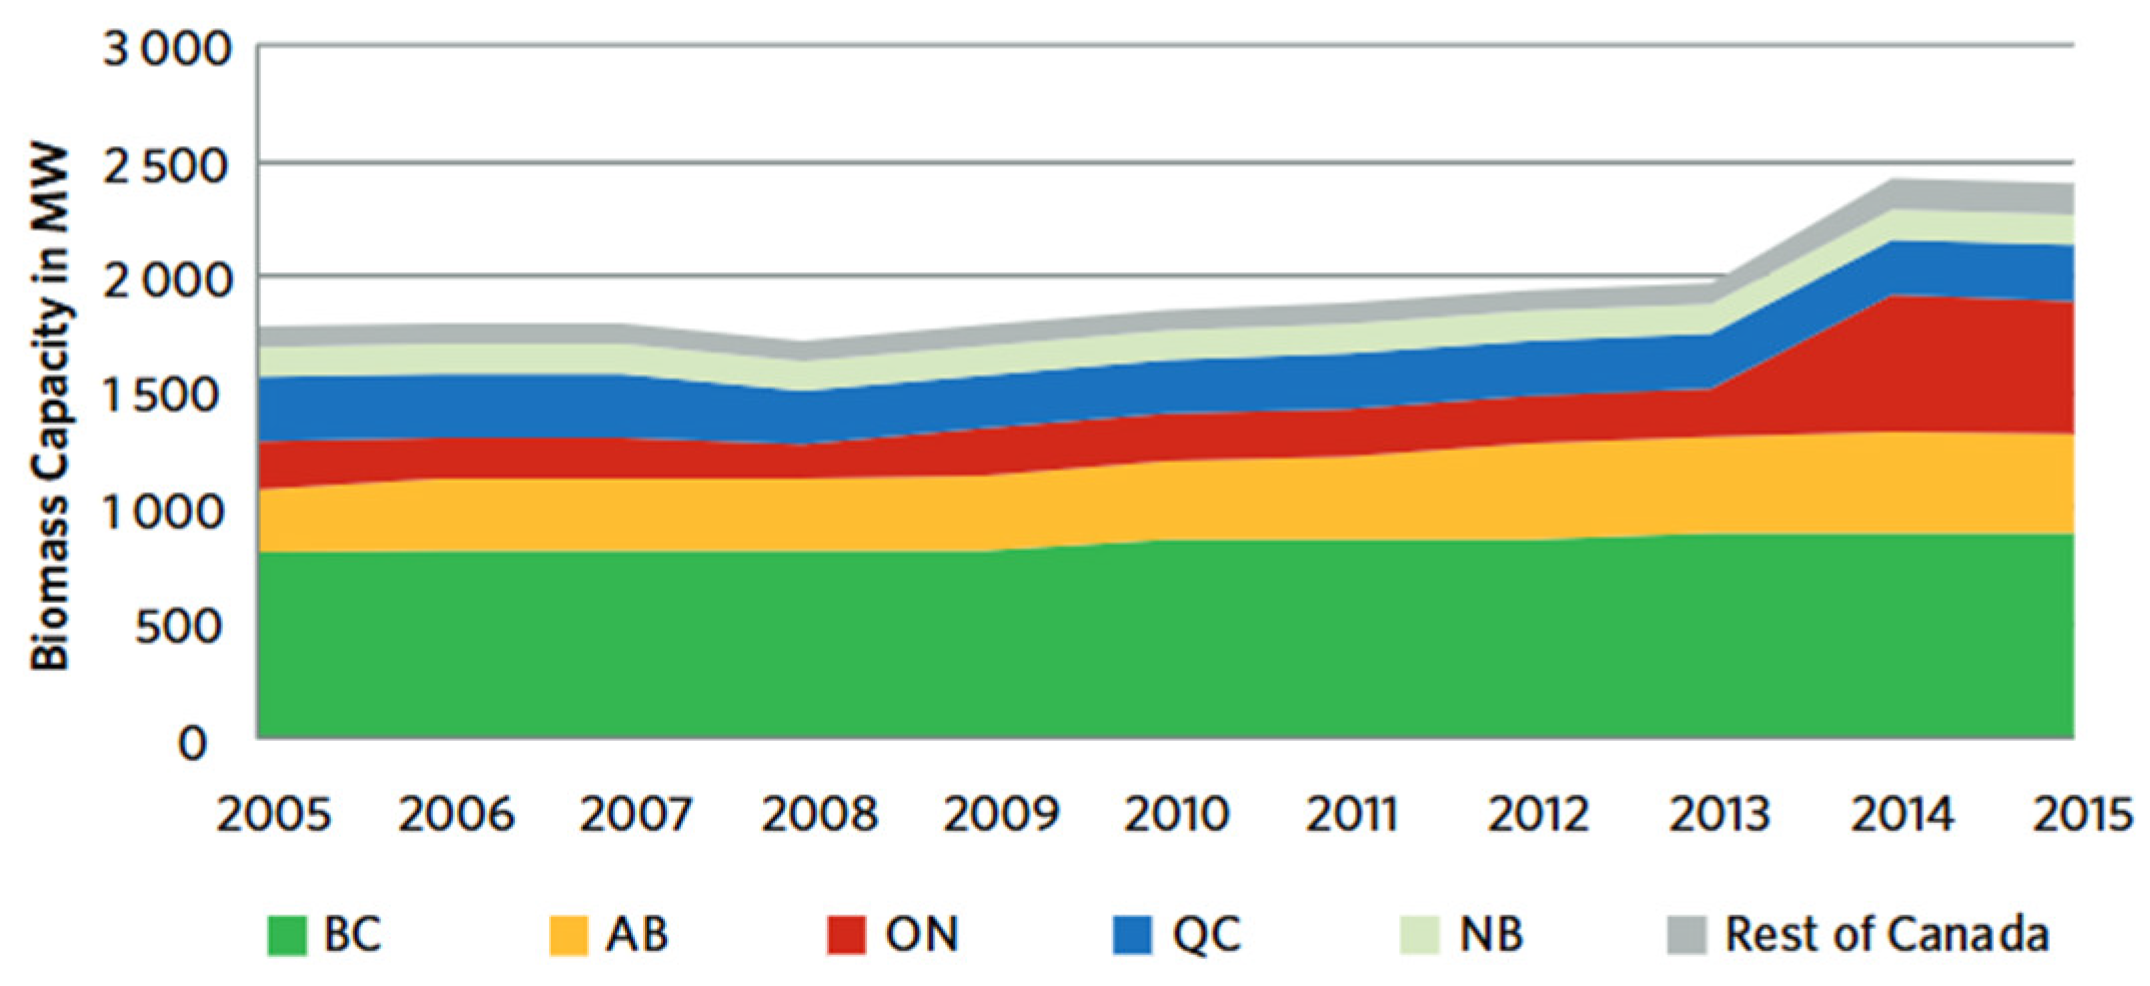
Figure 21.
Annual installations of hydroelectric energy capacity in Canada since 2010, in megawatts. The curve shows the increase in cumulative capacity installations from 75,062 megawatts in 2010 to 82’232 megawatts in 2021. [Source: https://natural-resources.canada.ca/energy-sources/renewable-energy/hydroelectric-energy].
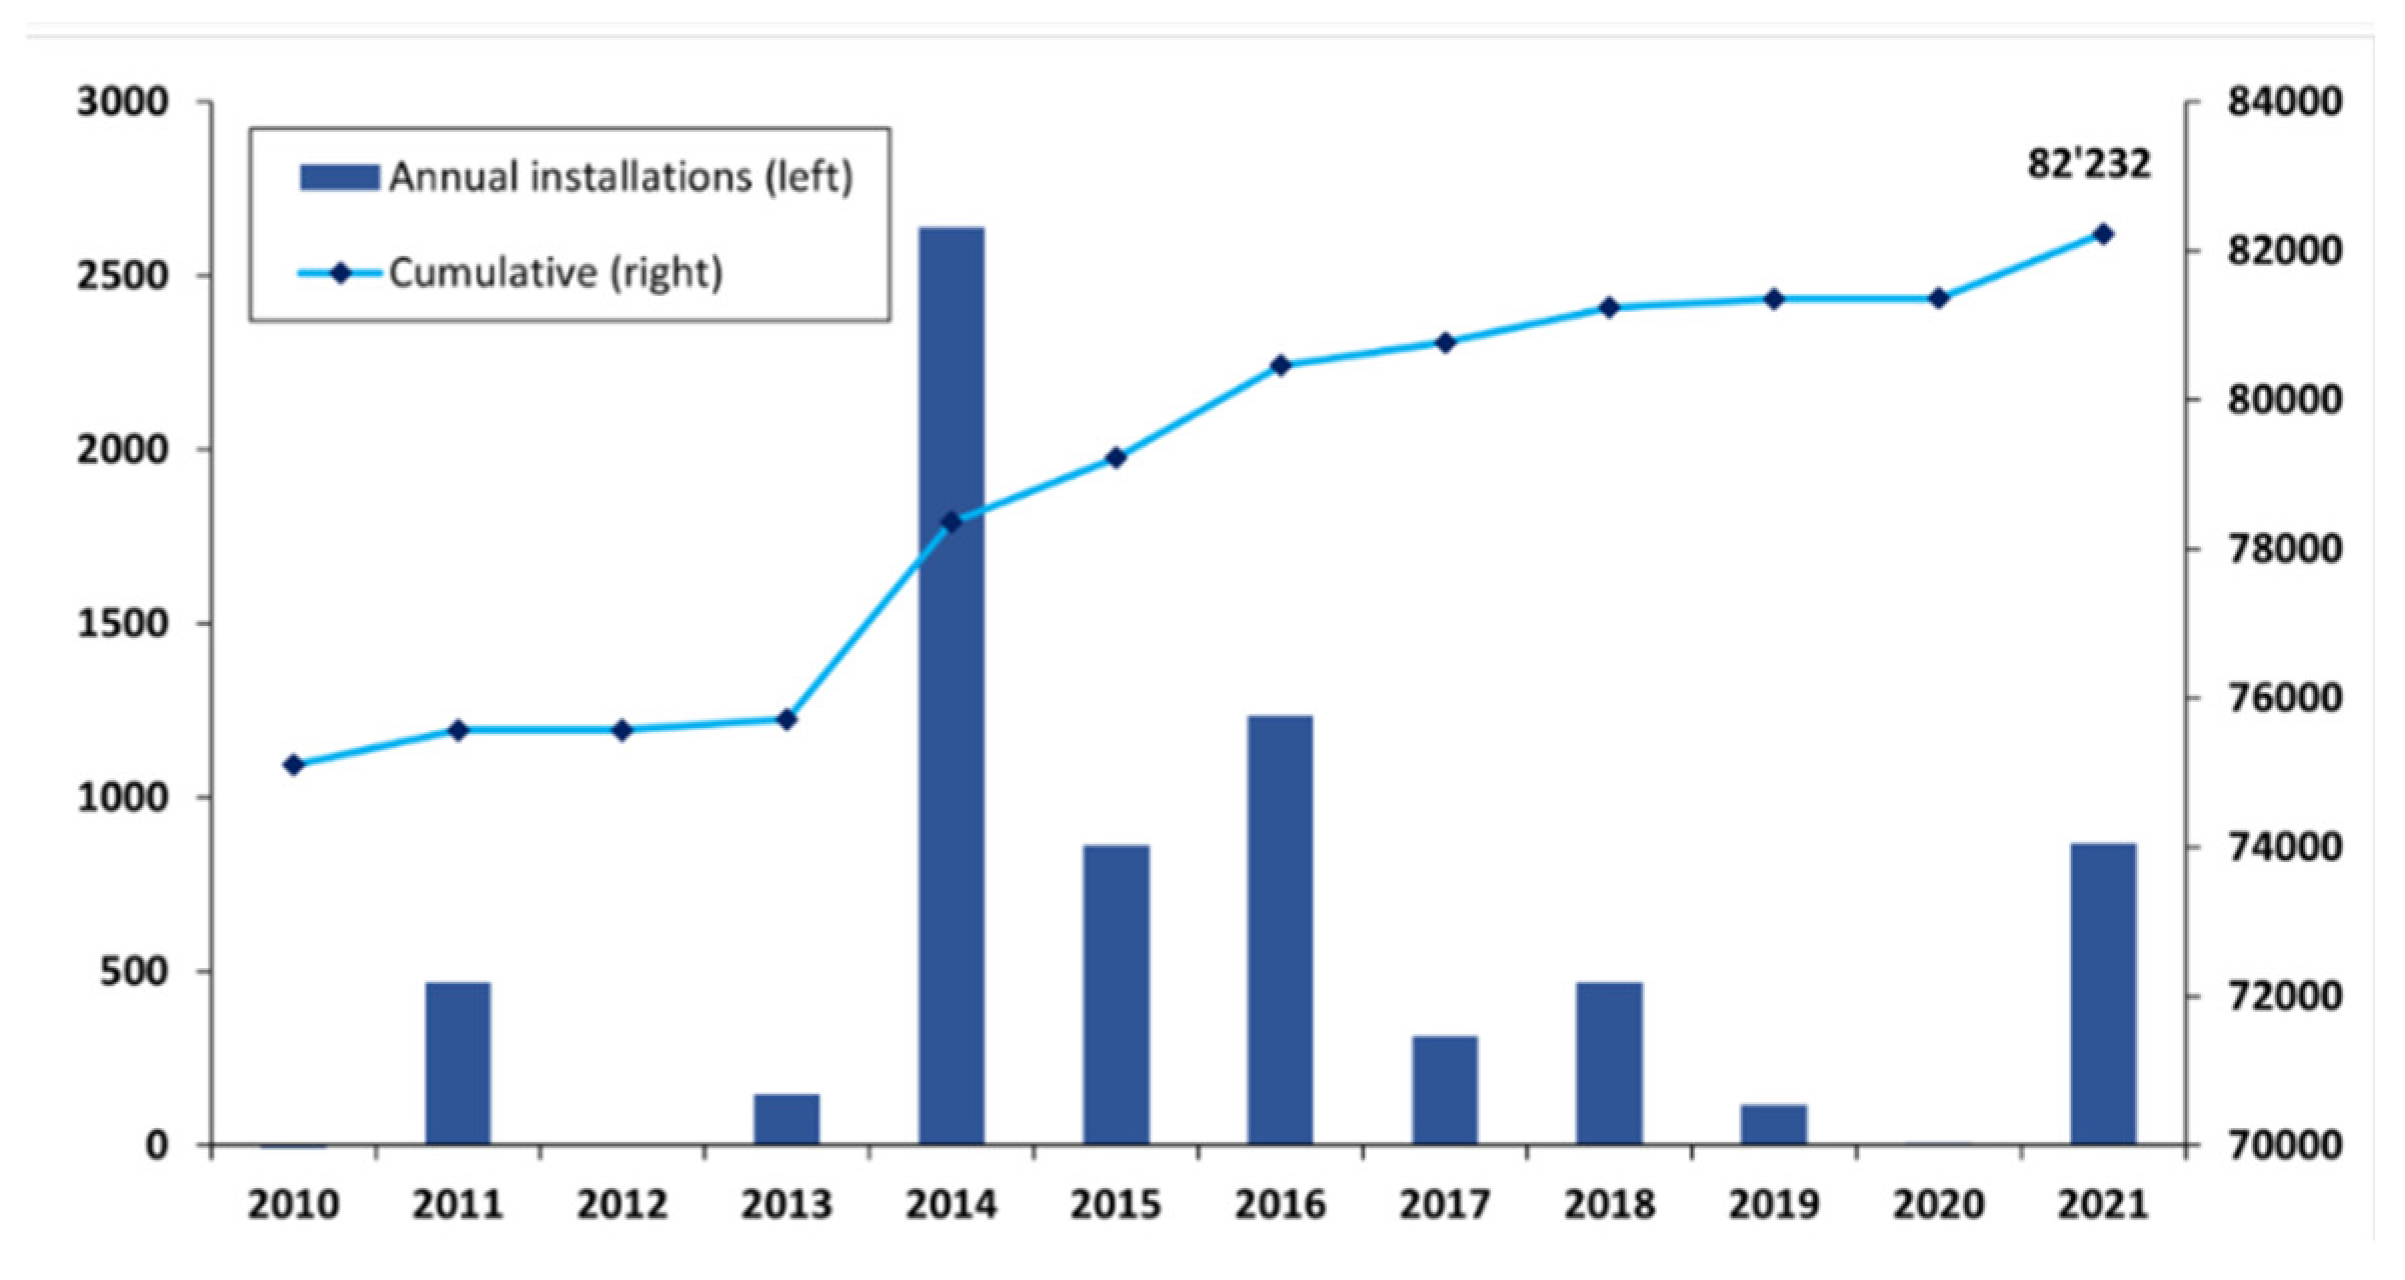
Figure 22.
Distribution of hydroelectricity capacity in Canada by province [Source: National Energy Board, 2017].
Figure 22.
Distribution of hydroelectricity capacity in Canada by province [Source: National Energy Board, 2017].
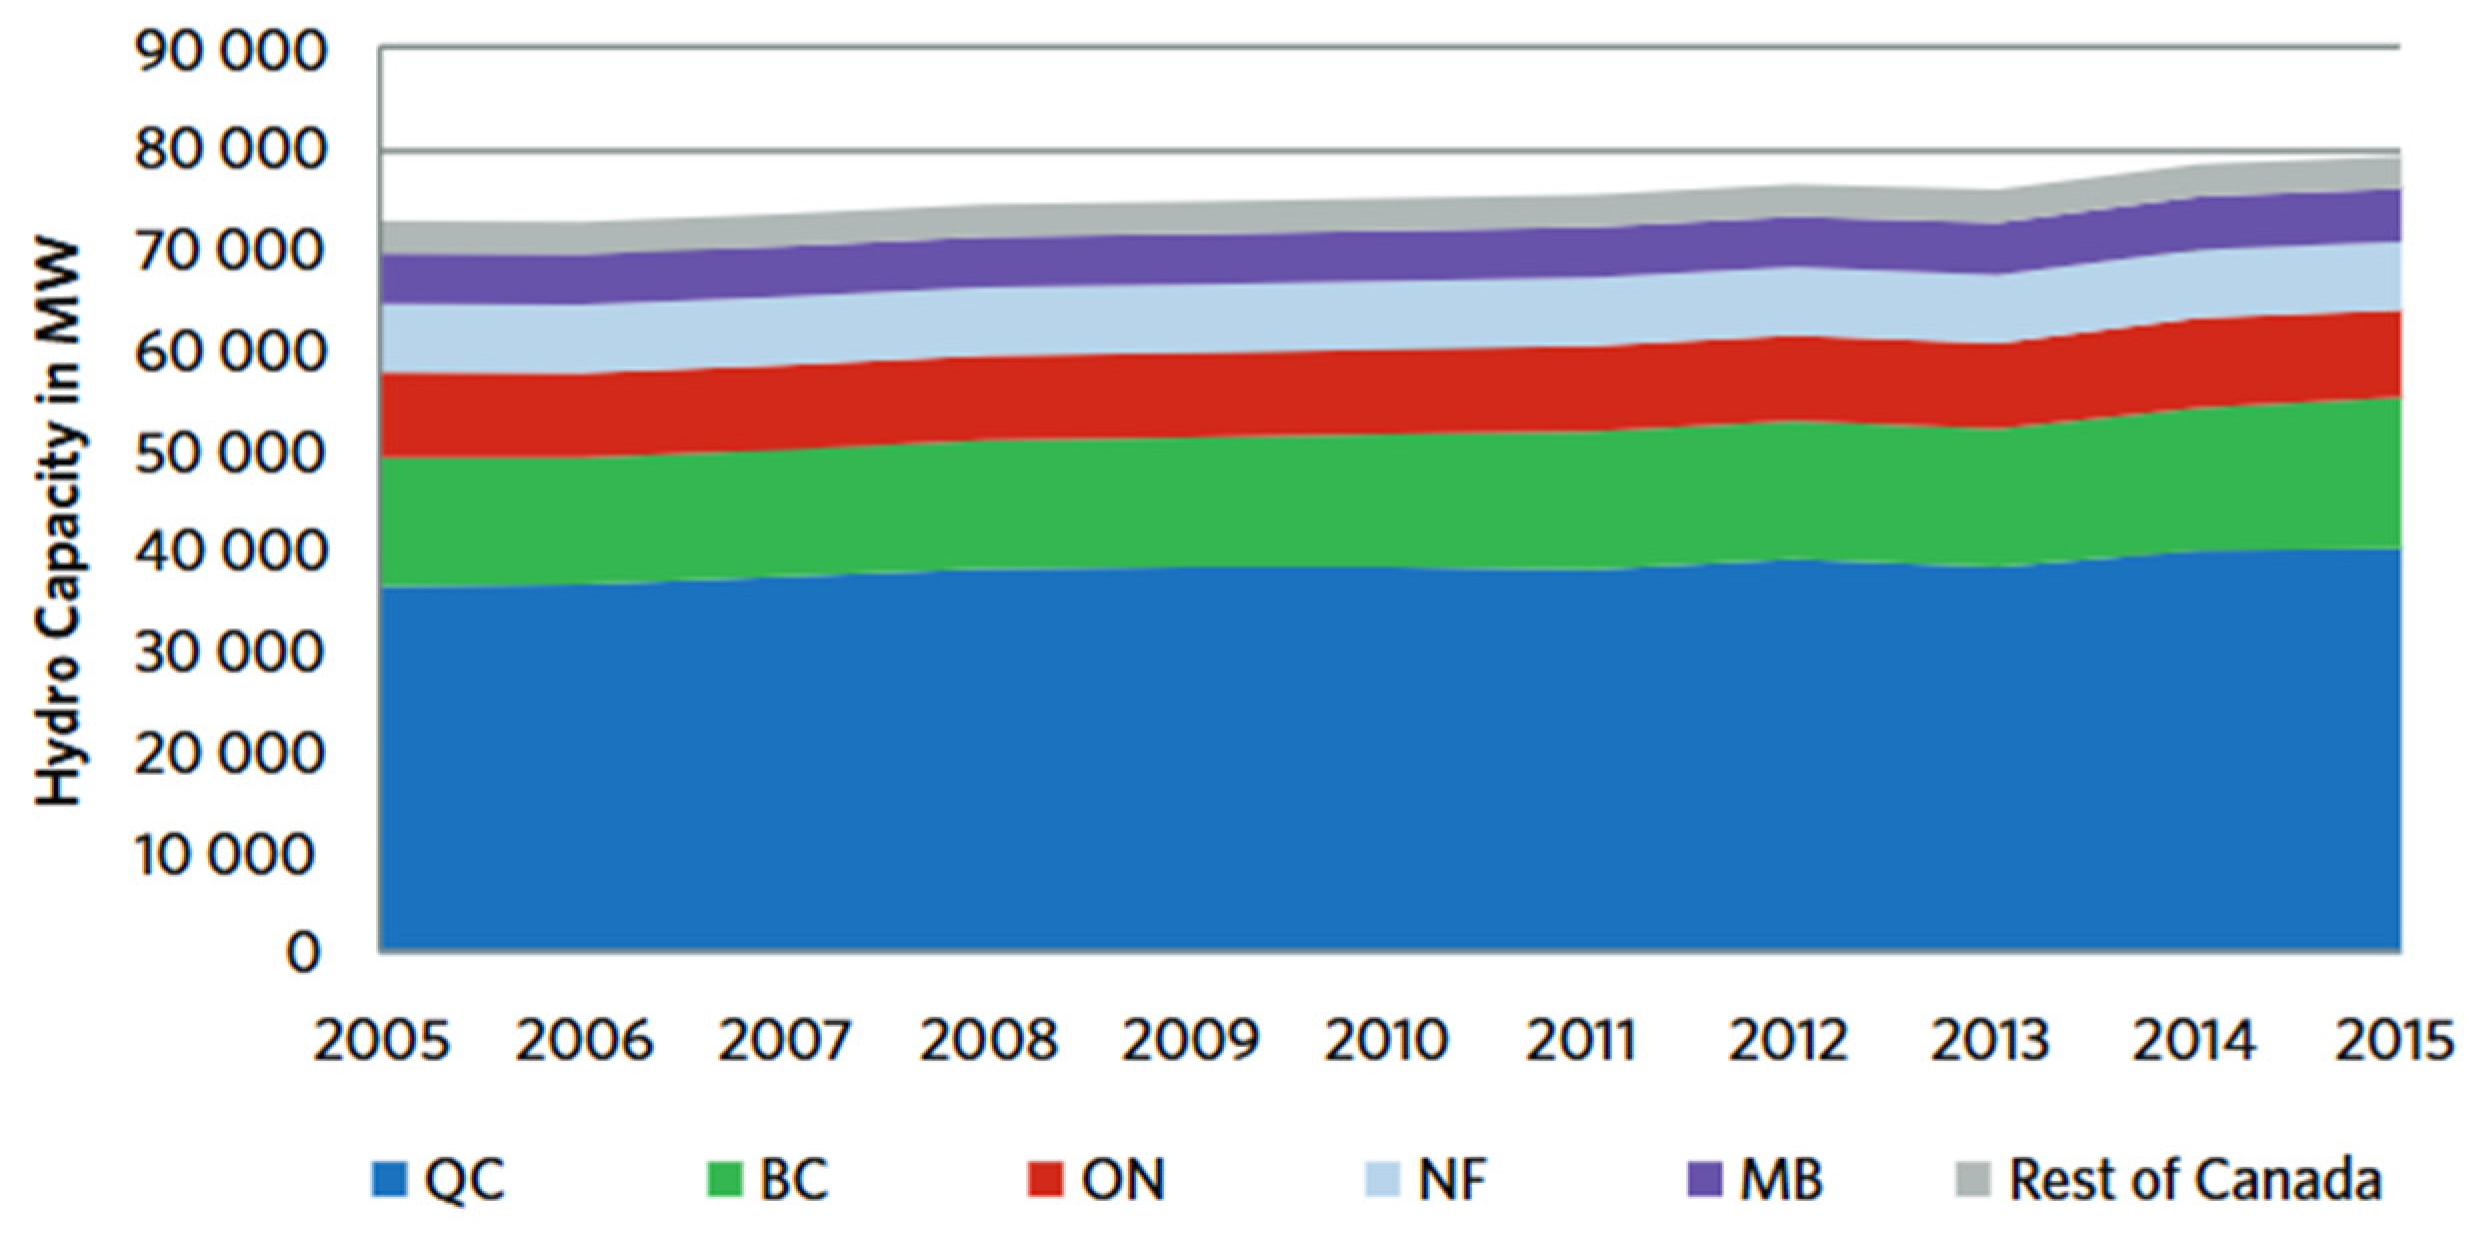
Figure 23.
Leading countries in nuclear energy consumption worldwide in 2024. [Source: Statista, 2025].
Figure 23.
Leading countries in nuclear energy consumption worldwide in 2024. [Source: Statista, 2025].
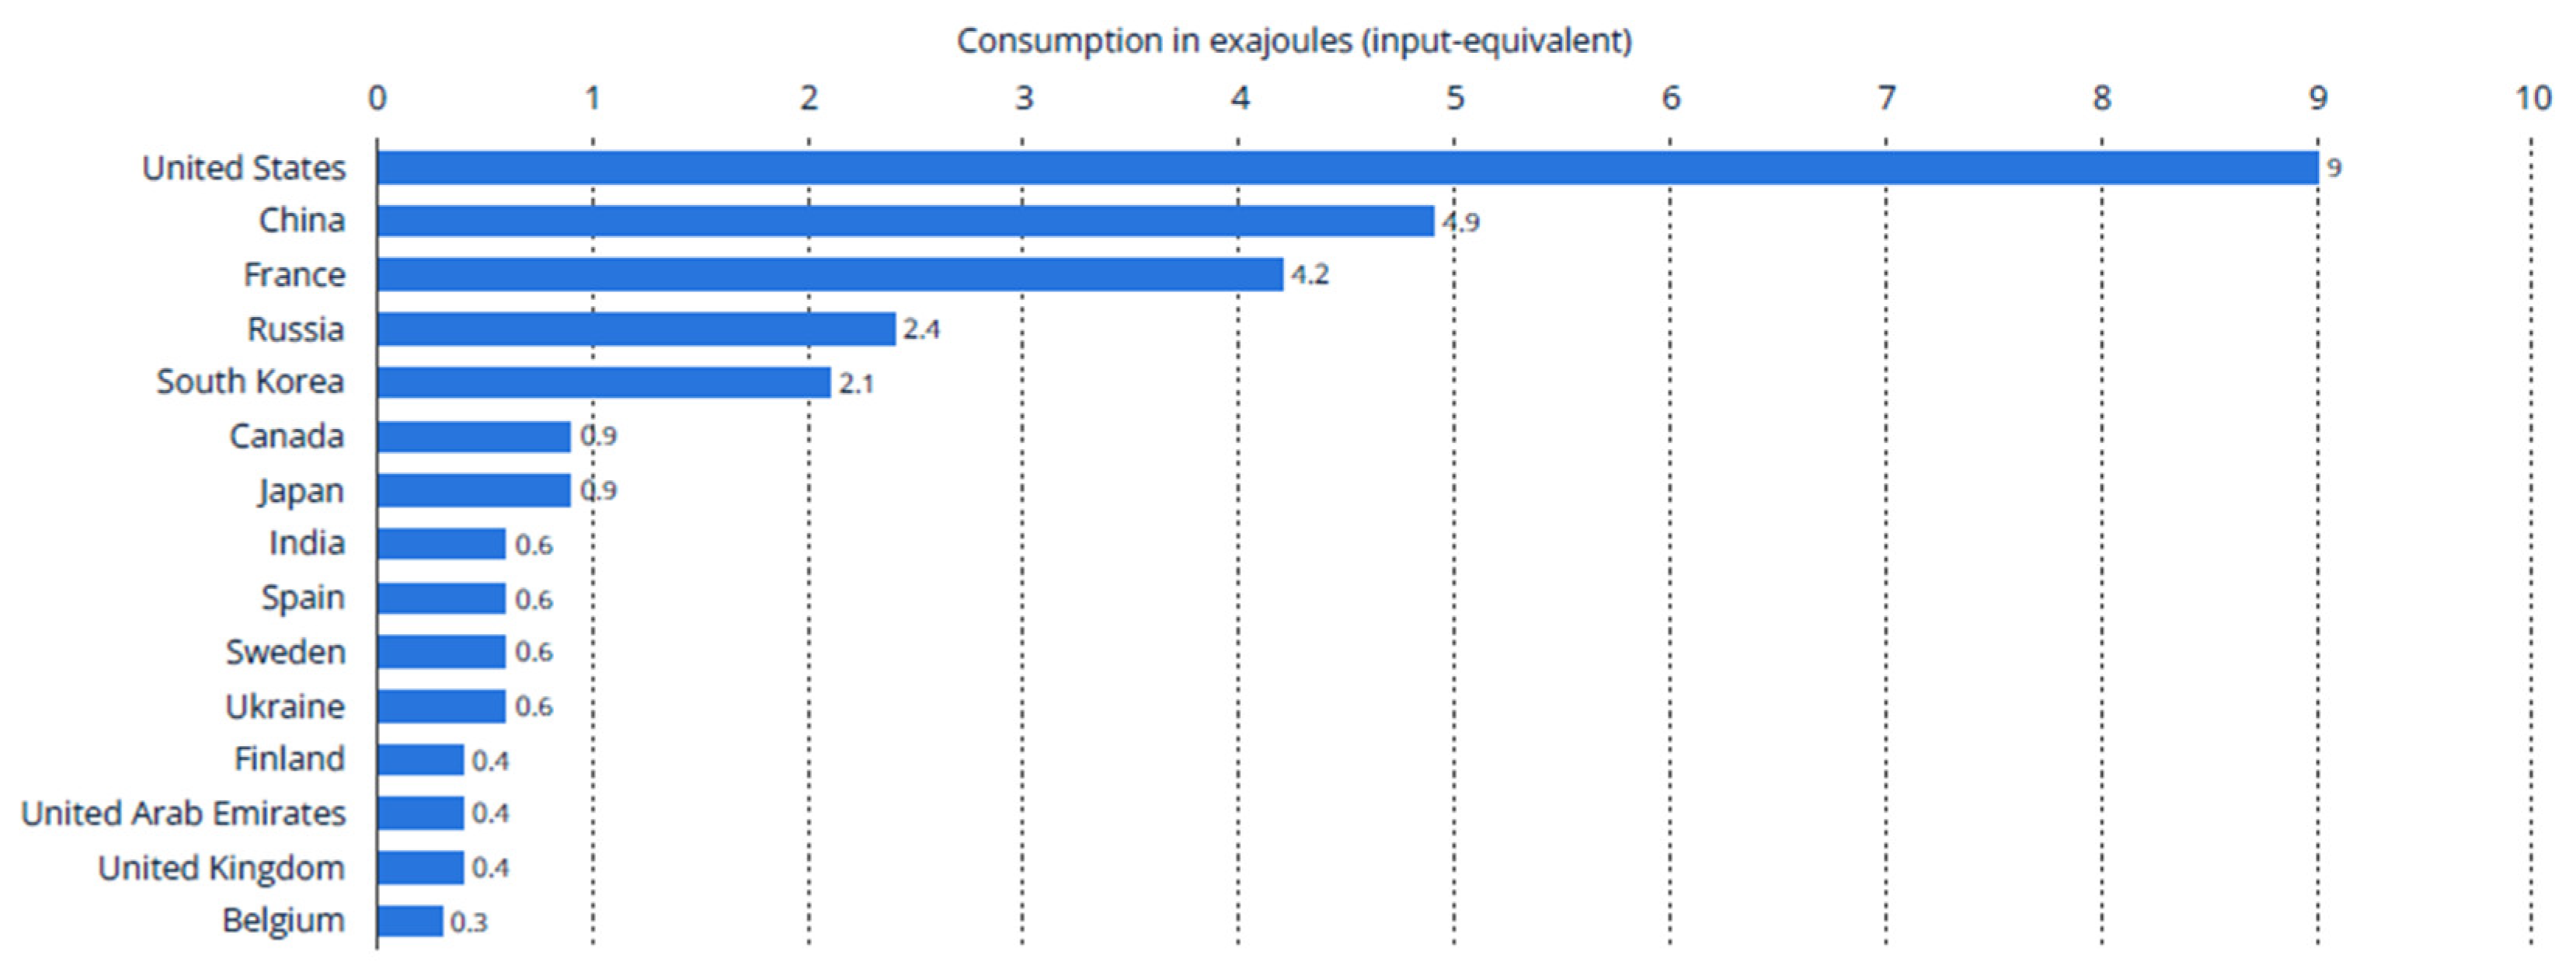
Figure 24.
Operable nuclear power capacity in Canada in selected years from 2000 to 2024 (in megawatts electric) [Source: Statista, 2025].
Figure 24.
Operable nuclear power capacity in Canada in selected years from 2000 to 2024 (in megawatts electric) [Source: Statista, 2025].
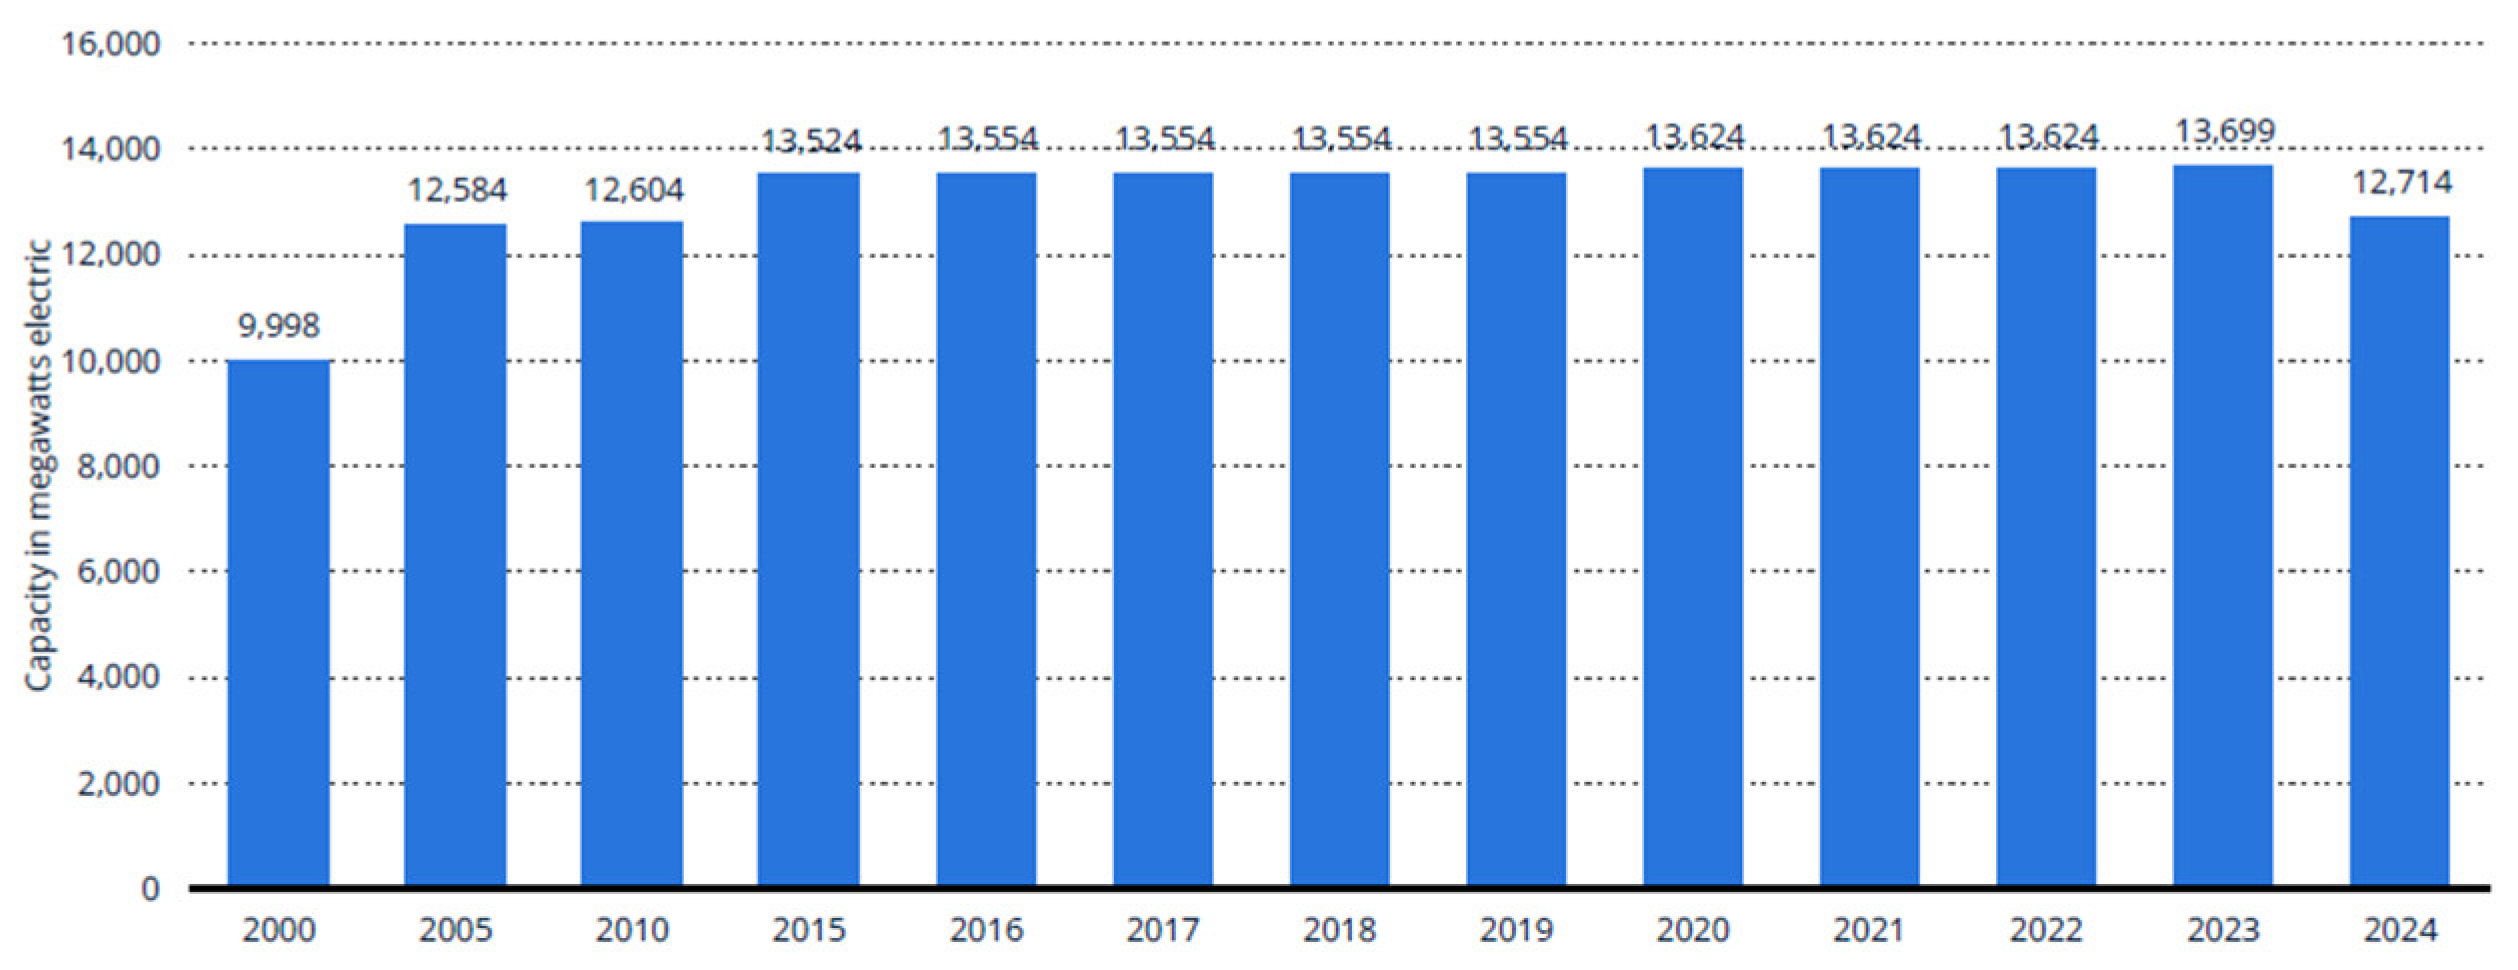
Figure 25.
Coal, natural gas, and oil production and consumption in Bangladesh, historical data and forecast 2025-2035. [Data source, BP, 2023; Energy Institute, 2025].
Figure 25.
Coal, natural gas, and oil production and consumption in Bangladesh, historical data and forecast 2025-2035. [Data source, BP, 2023; Energy Institute, 2025].
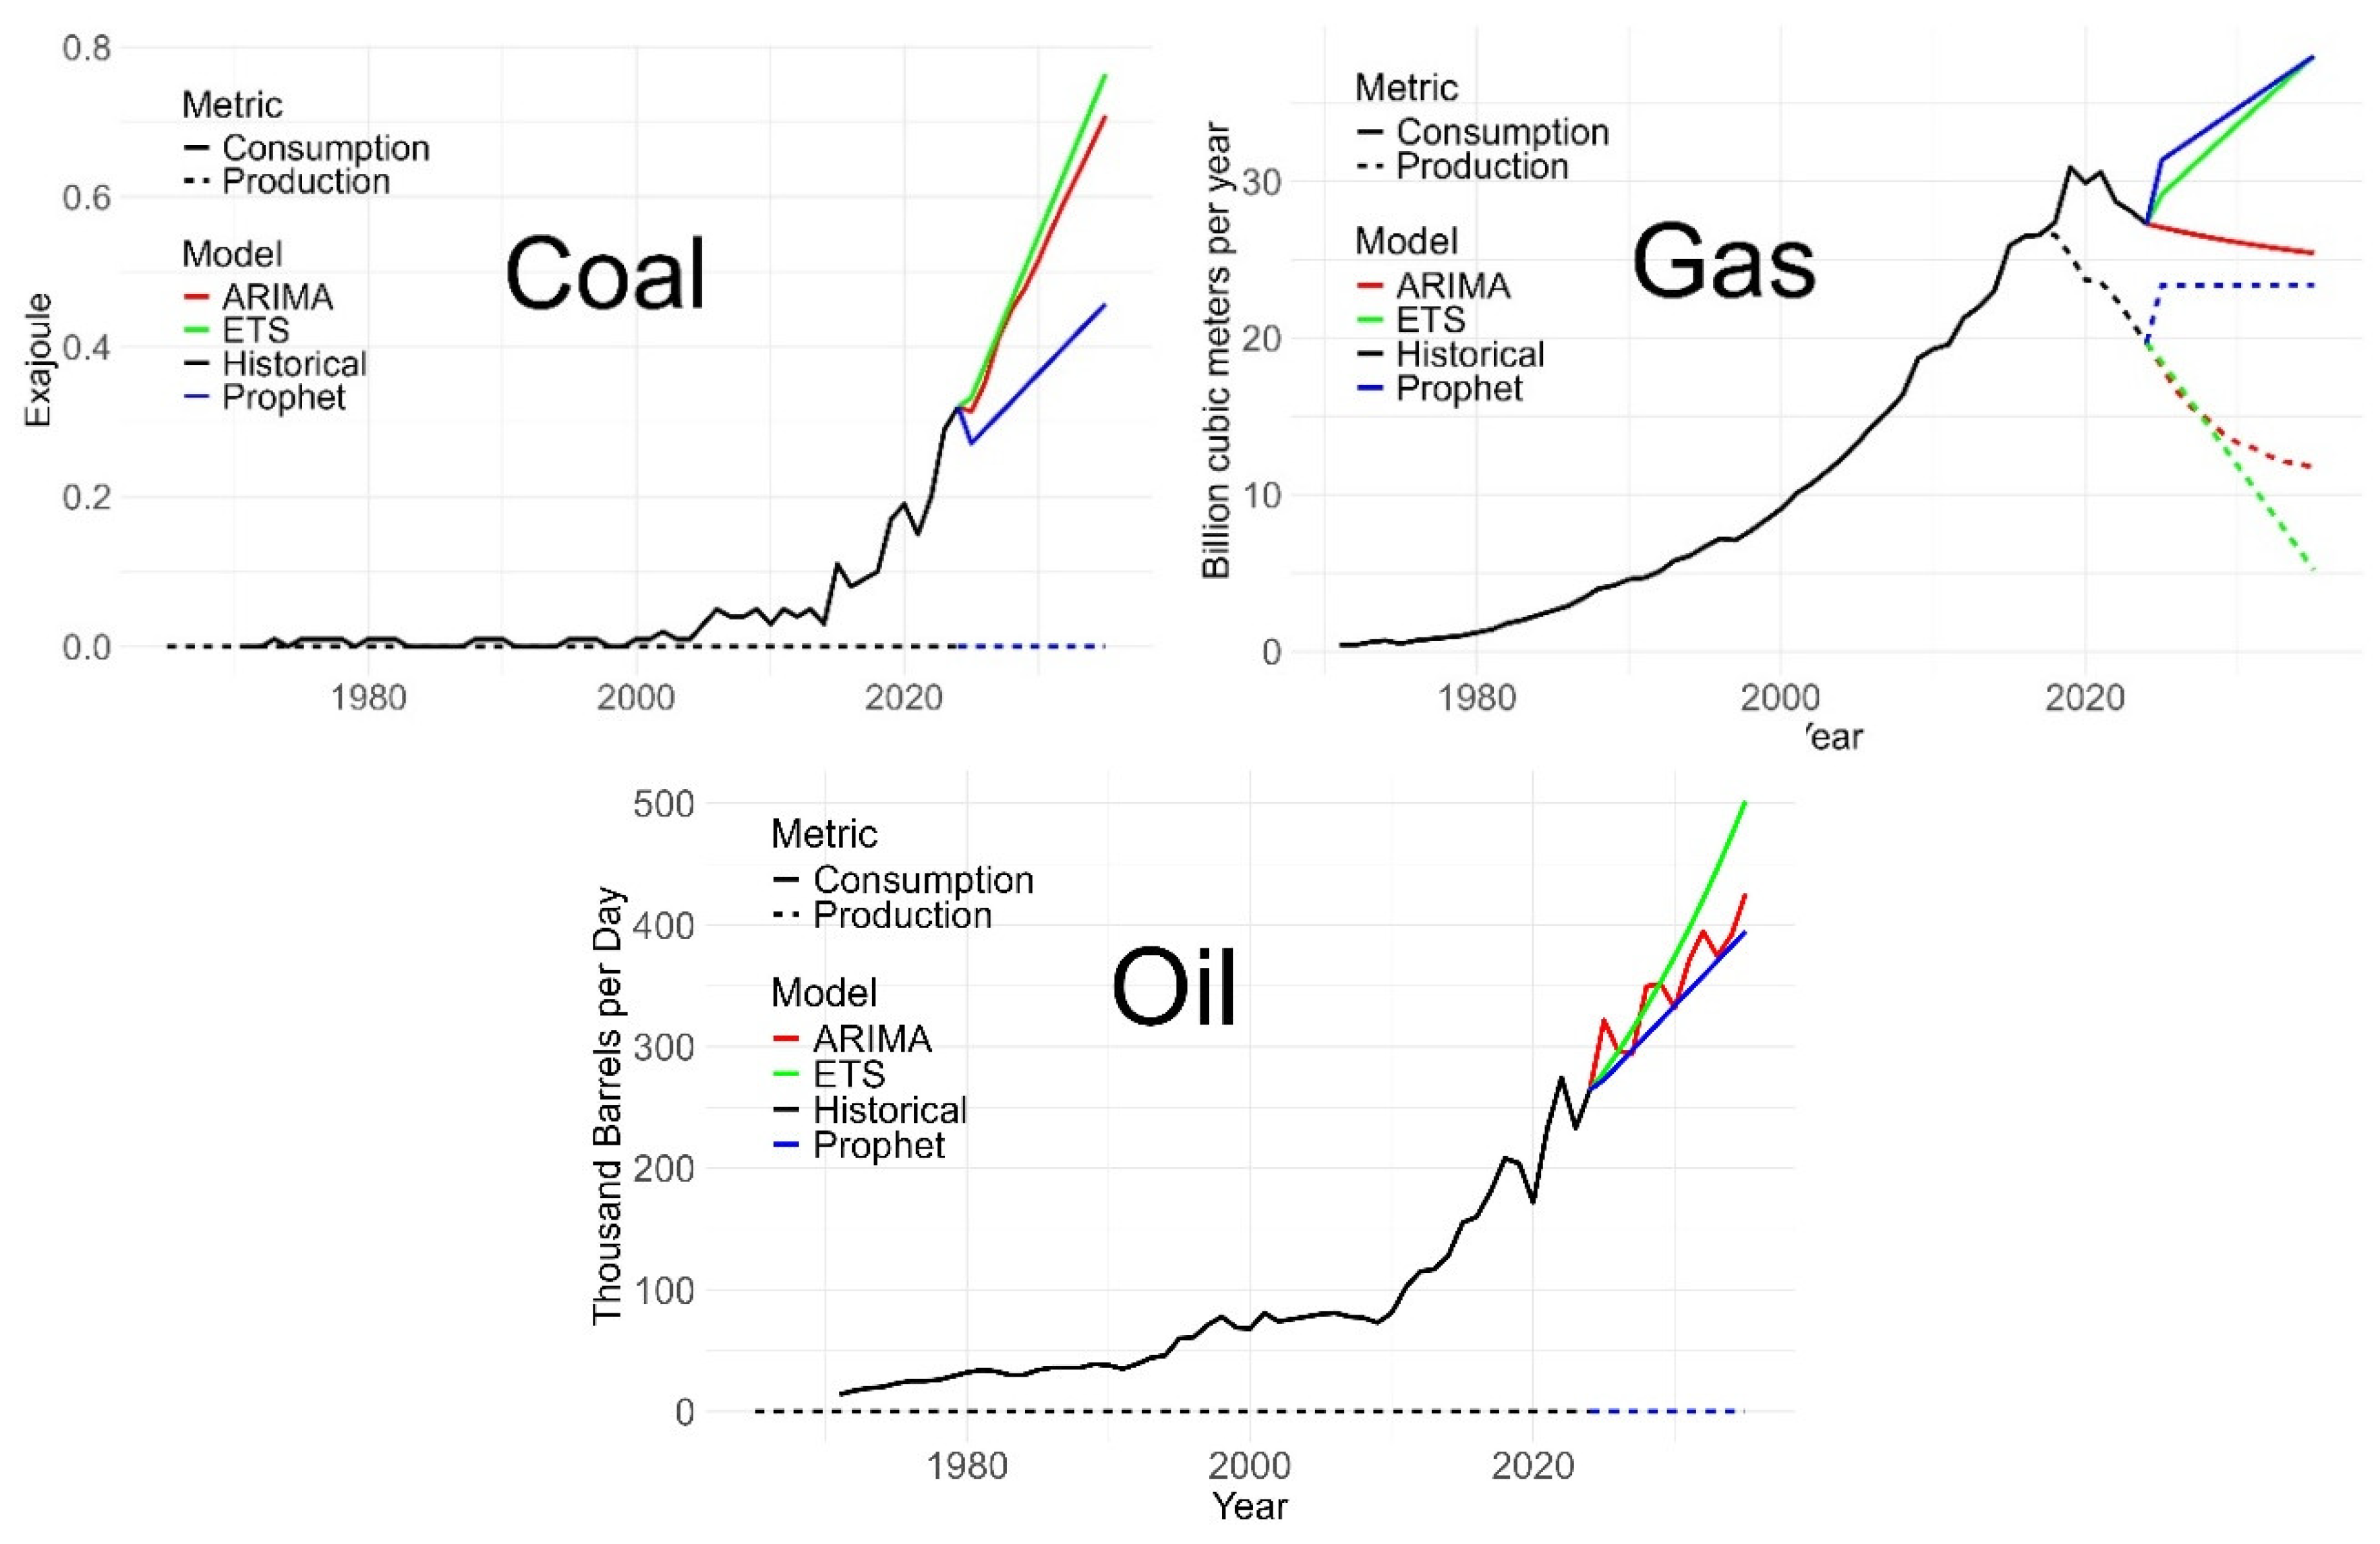
Figure 26.
Renewable energy (hydro, wind, and solar) generation in Bangladesh with forecast 2025-2035. [Data source: Energy Institute, 2025; IRENA, 2024].
Figure 26.
Renewable energy (hydro, wind, and solar) generation in Bangladesh with forecast 2025-2035. [Data source: Energy Institute, 2025; IRENA, 2024].
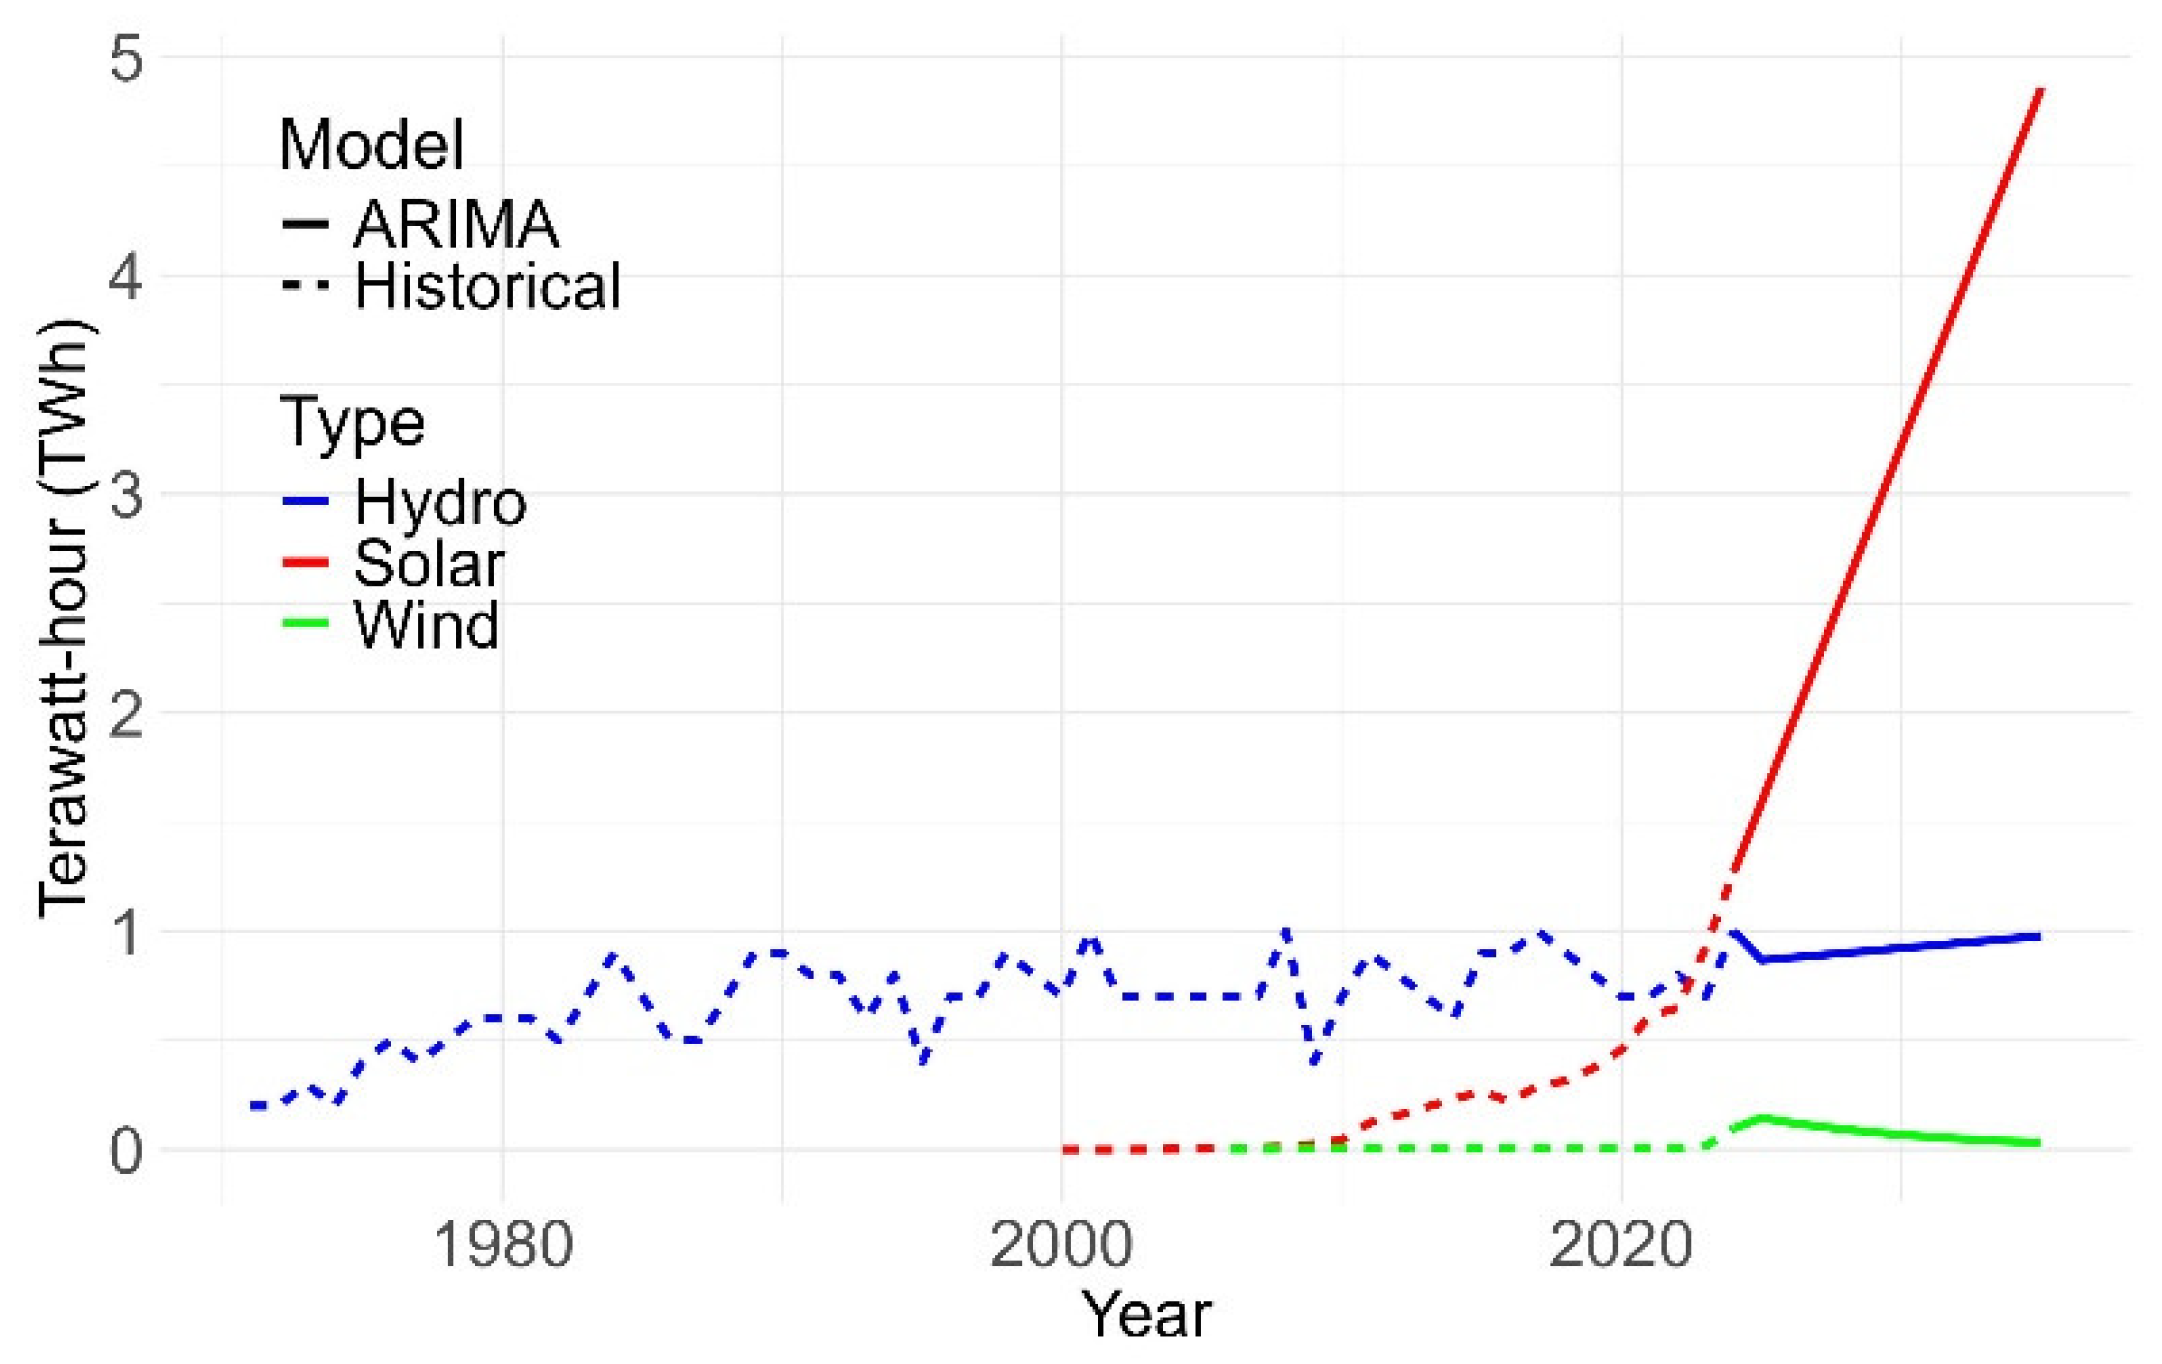
Figure 27.
Coal, natural gas, and oil production and consumption in Canada, historical data and forecast 2025-2035. [Data source, BP, 2023; Energy Institute, 2025].
Figure 27.
Coal, natural gas, and oil production and consumption in Canada, historical data and forecast 2025-2035. [Data source, BP, 2023; Energy Institute, 2025].
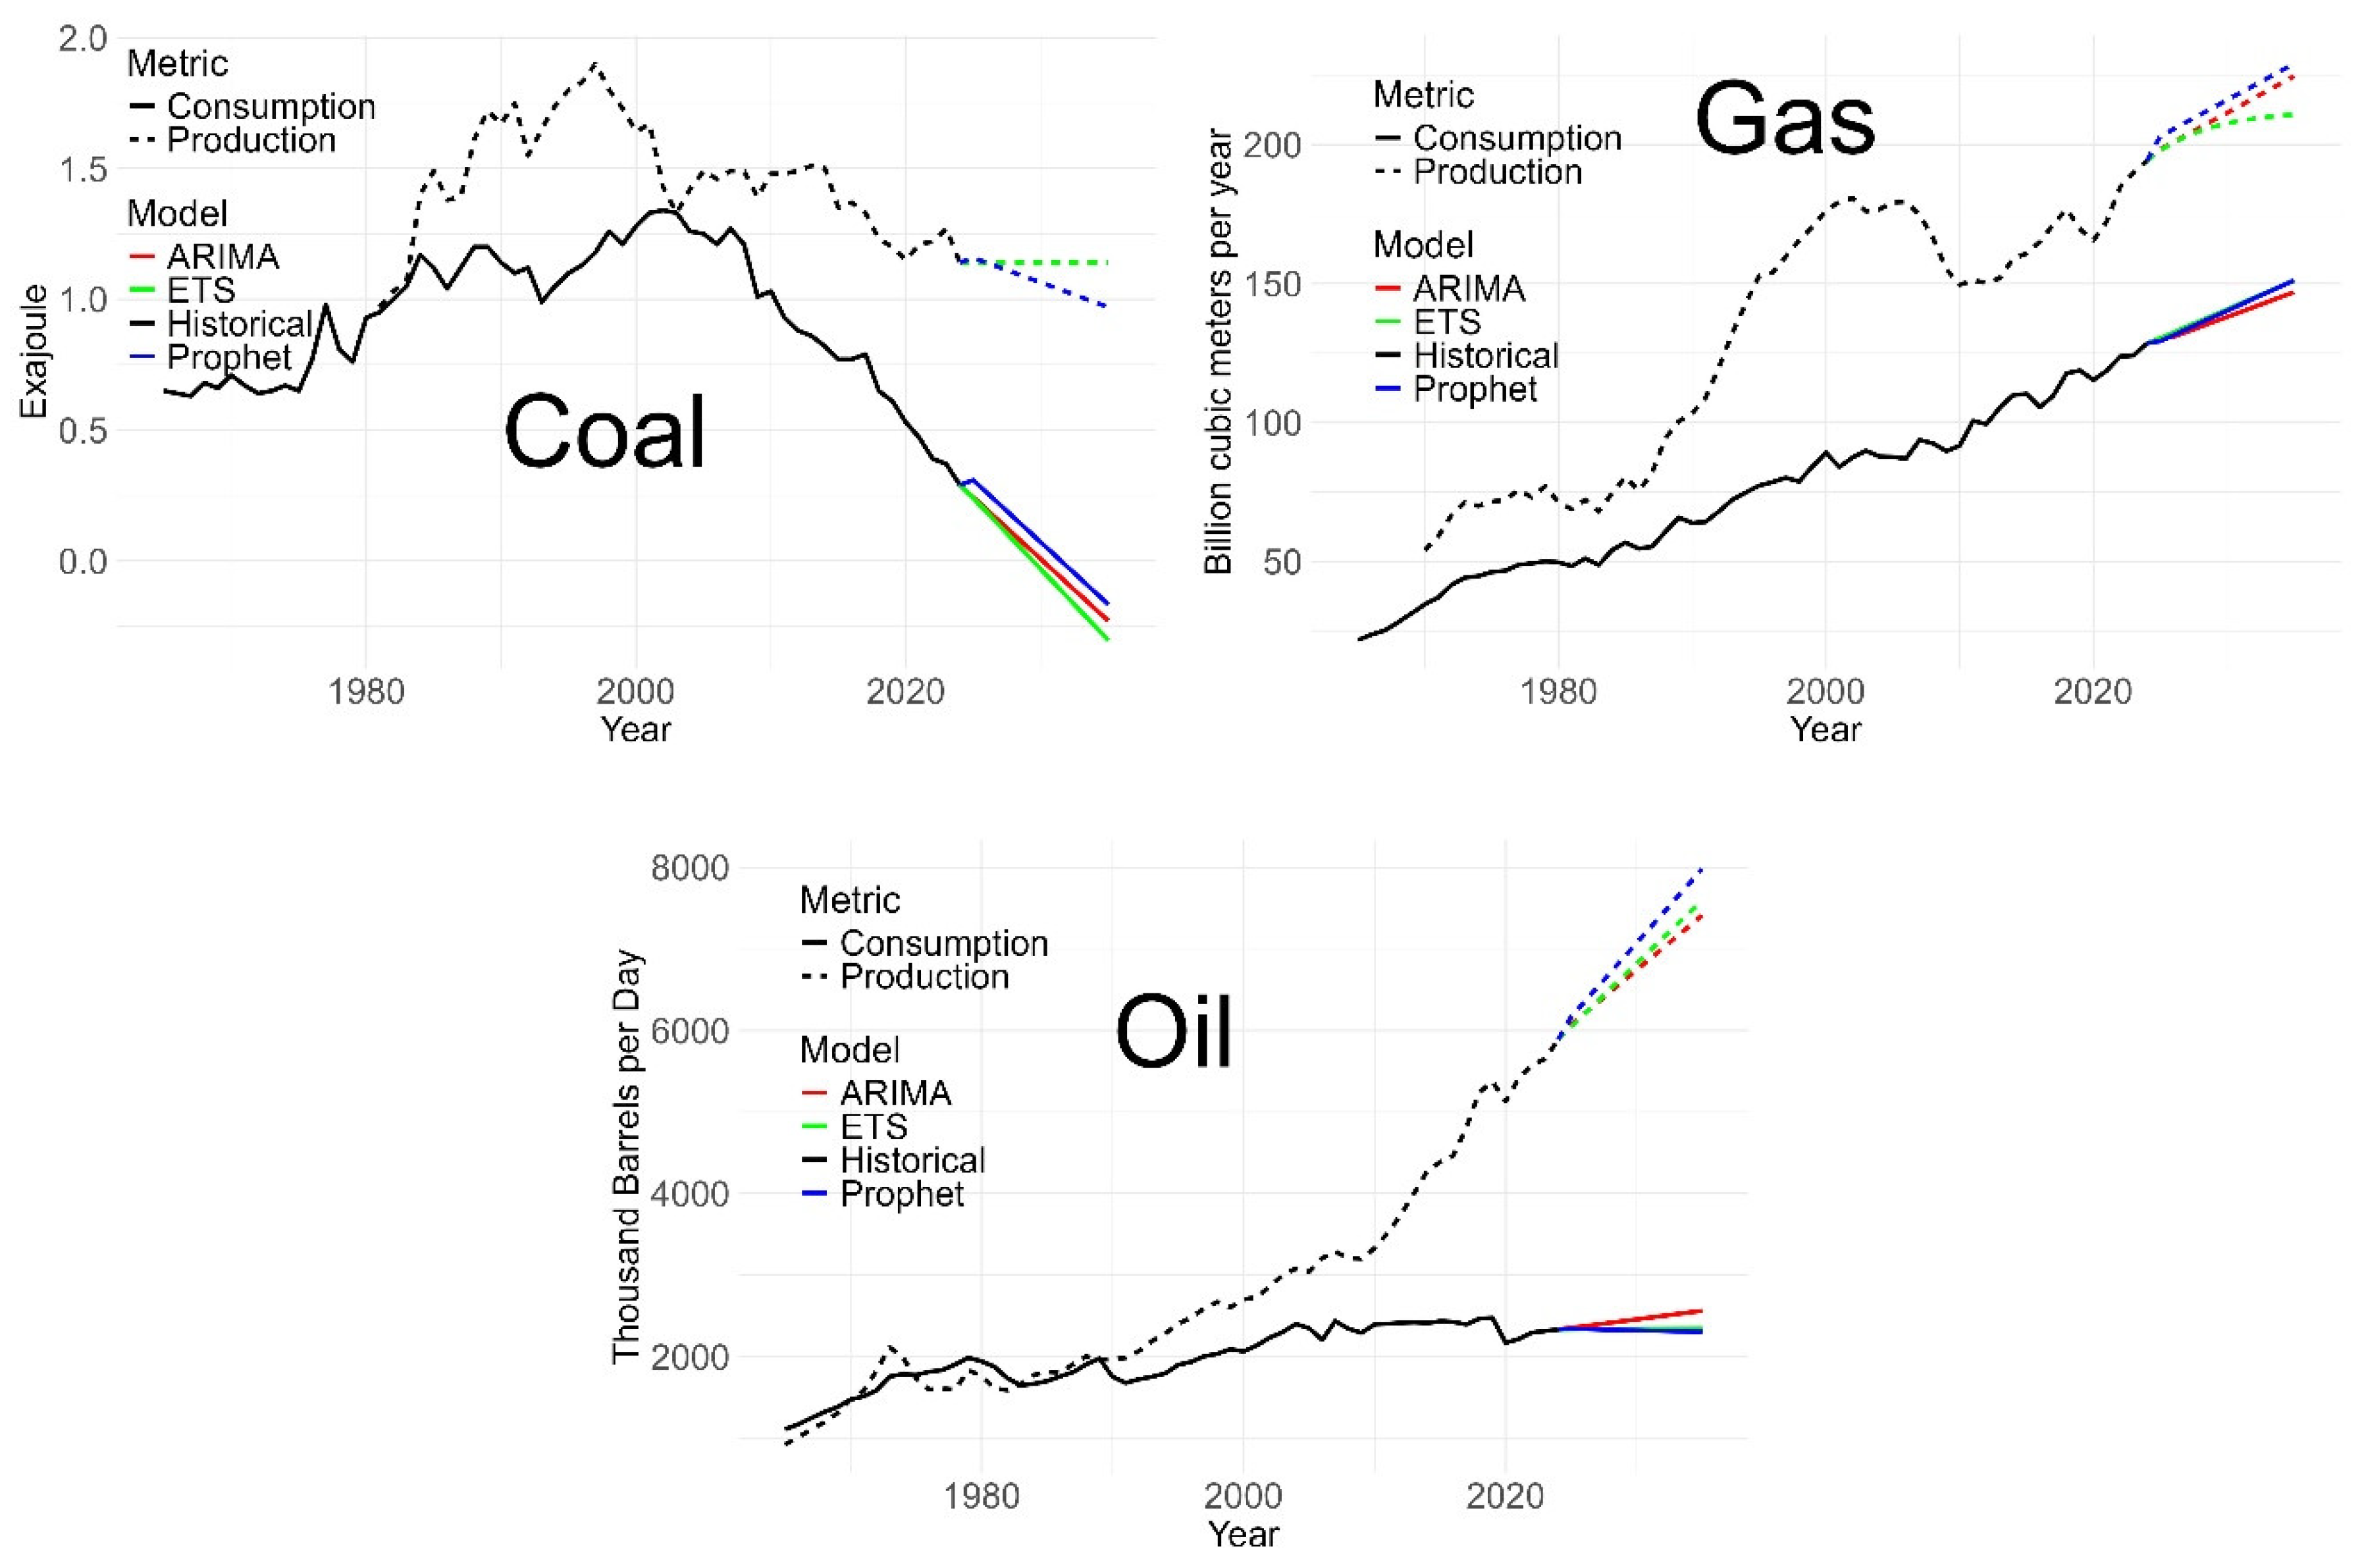
Figure 28.
A century of electricity production in Canada [Source: Canada Electricity Advisory Council, “Figure 1,” Powering Canada: A Blueprint for Success, May 2024.].
Figure 28.
A century of electricity production in Canada [Source: Canada Electricity Advisory Council, “Figure 1,” Powering Canada: A Blueprint for Success, May 2024.].
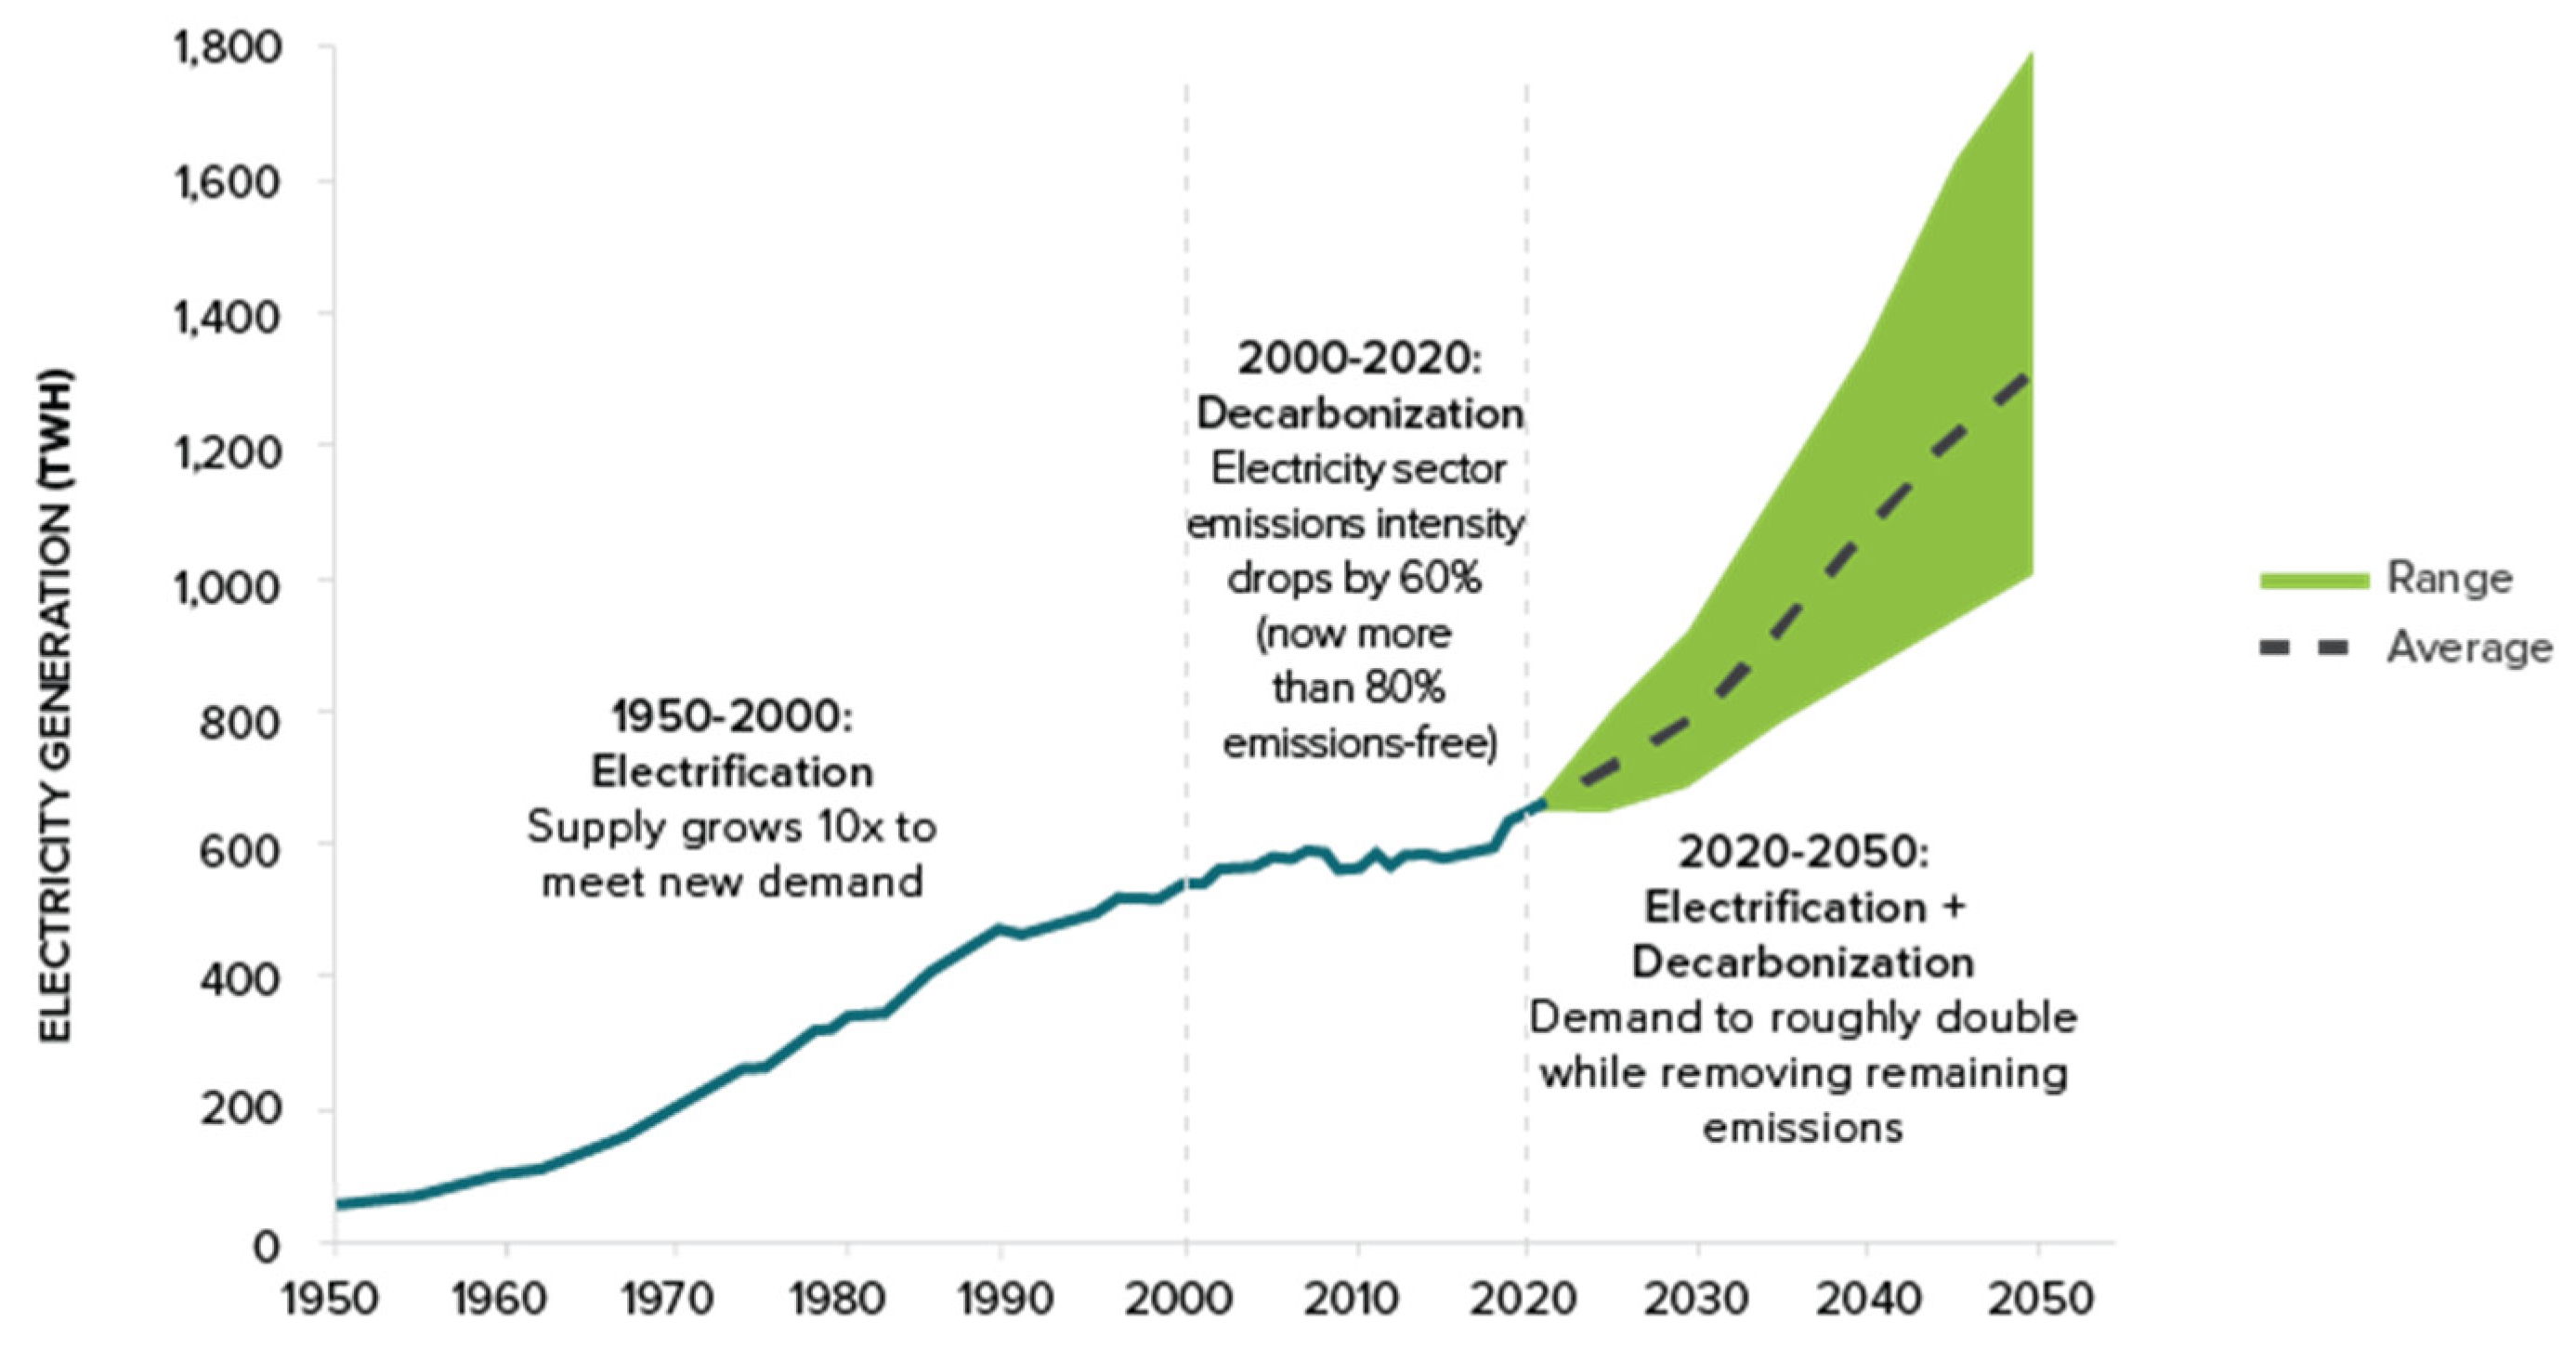
Figure 29.
Renewable energy (hydro, wind and solar) generation in Canada with forecast 2025-2035. [Data source: Energy Institute, 2025; IRENA, 2024].
Figure 29.
Renewable energy (hydro, wind and solar) generation in Canada with forecast 2025-2035. [Data source: Energy Institute, 2025; IRENA, 2024].
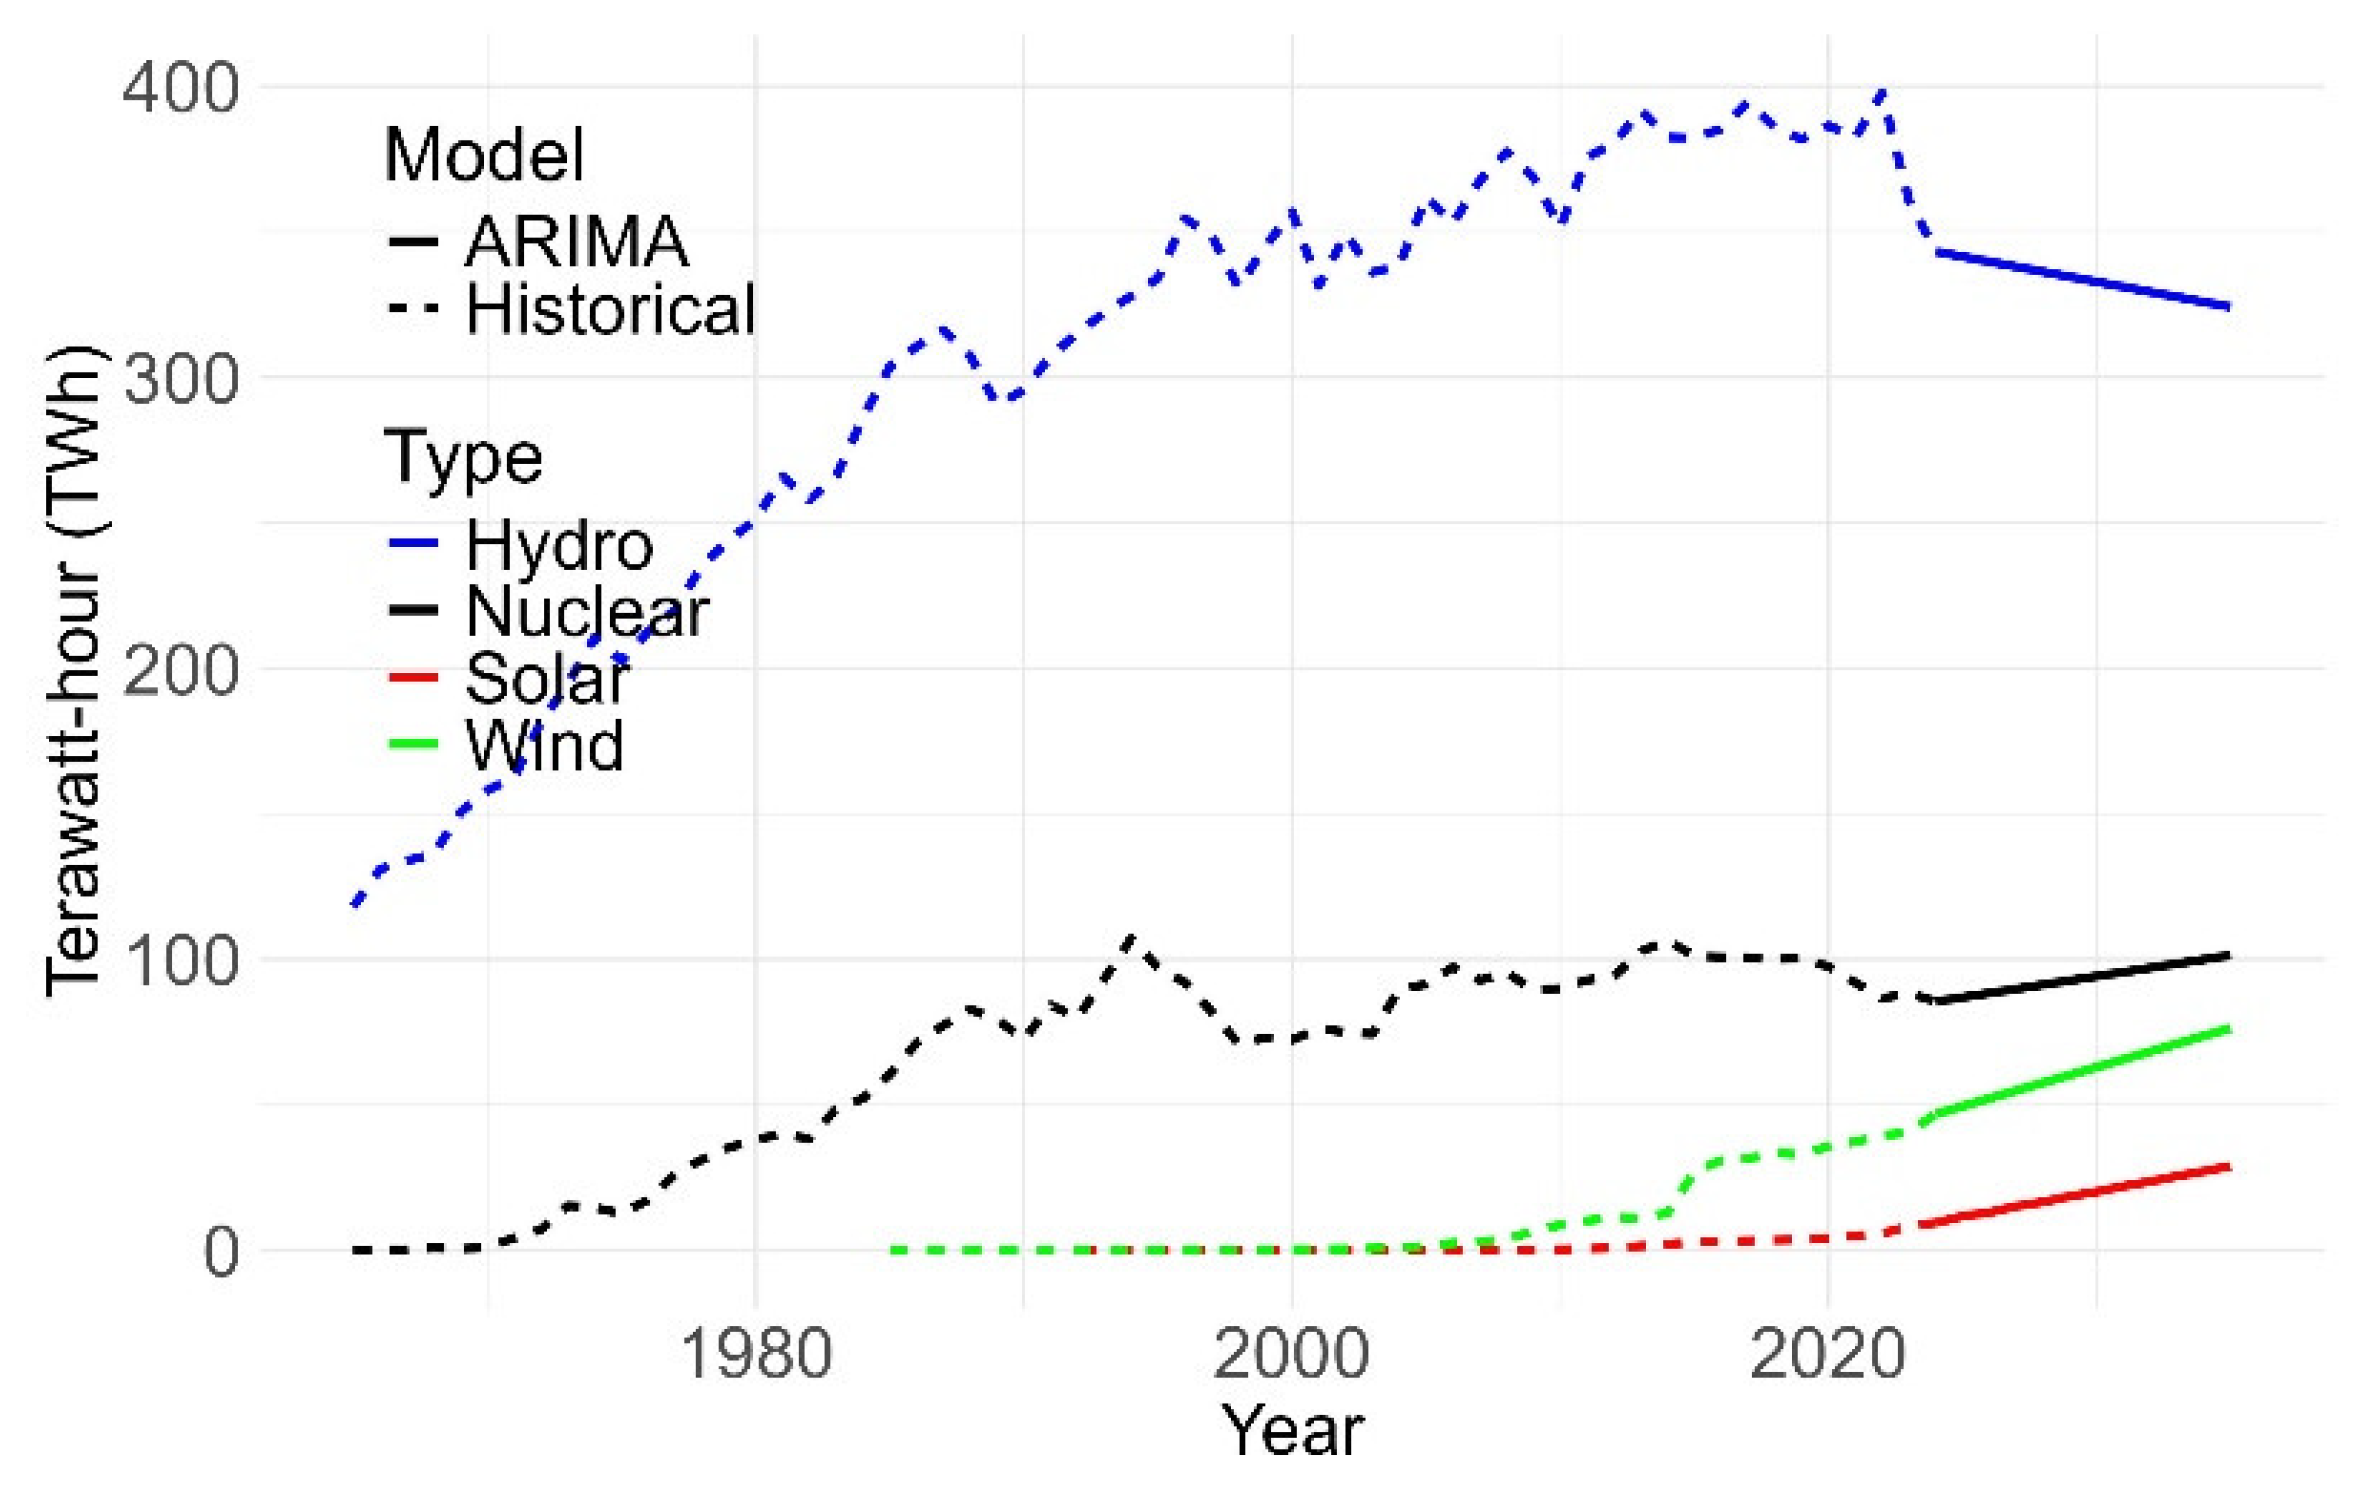
Table 1.
Renewable energy database in Bangladesh as of 2023.
| Technology | Off-grid (MW) | On-grid (MW) | Total (MW) |
| Solar | 377.15 | 909.16 | 1286.31 |
| Wind | 2 | 60.9 | 62.9 |
| Hydro | 0 | 230 | 230 |
| Biogas to electricity | 0.69 | 0 | 0.69 |
| Biomass to electricity | 0.4 | 0 | 0.4 |
| Total | 380.24 | 1200.06 | 1580.3 |
Source: National Database of Renewable Energy, Bangladesh Sustainable and Renewable Energy Association (BSREA) National Database of Renewable Energy - The Bangladesh Sustainable and Renewable Energy Association.
Table 2.
Global energy rankings for Canada.
| Energy | Reserve capacity | Production | Export |
| Crude oil | 4 | 4 | 3 |
| Uranium | 3 | 2 | 2 |
| Hydroelectricity | 4 | 3 | - |
| Electricity | 8 | 7 | 2 |
| Coal | 18 | 15 | 8 |
| Natural gas | 15 | 5 | 6 |
Source: NRC, 2024a.
Disclaimer/Publisher’s Note: The statements, opinions and data contained in all publications are solely those of the individual author(s) and contributor(s) and not of MDPI and/or the editor(s). MDPI and/or the editor(s) disclaim responsibility for any injury to people or property resulting from any ideas, methods, instructions or products referred to in the content. |
© 2025 by the authors. Licensee MDPI, Basel, Switzerland. This article is an open access article distributed under the terms and conditions of the Creative Commons Attribution (CC BY) license (http://creativecommons.org/licenses/by/4.0/).
Copyright: This open access article is published under a Creative Commons CC BY 4.0 license, which permit the free download, distribution, and reuse, provided that the author and preprint are cited in any reuse.


