
Submitted:
04 November 2025
Posted:
04 November 2025
You are already at the latest version
Abstract
This study examines the impact of Environmental, Social, and Governance (ESG) strategies on reducing air pollution in the West Kazakhstan region, a major hub for Kazakhstan's oil and gas industry. A spatial analysis of atmospheric emissions reveals an uneven distribution of emission sources, predominantly concentrated in the northern industrialized part of the region, where the Karachaganak oil and gas condensate field is located. The ESG model of Karachaganak Petroleum Operating b.v. (KPO), implemented as an integrated management system based on Global Reporting Initiative (GRI) standards, is compared with the ESG strategies of leading oil and gas companies in Kazakhstan and globally, aligning with current international research trends. The analysis underscores the interdependence of technological and social aspects in the transition to a low-carbon economy, confirming the importance of integrating the environmental, social, and governance components of ESG into a unified strategic planning framework for sustainable development. Using econometric modeling, the study establishes a relationship between ESG indicators and the reduction of atmospheric pollution and provides a forecast for emission reductions by 2030. The key measures proposed to improve regional air quality are linked to long-term decarbonization strategies within the context of the sustainable development of the entire region. The proposed algorithm for implementing ESG principles helps to identify the concentration of functions and associated risks at different management levels within Highly Polluting Enterprises (HPEs) and optimizes business processes by focusing efforts on air pollution mitigation. The findings are applicable to other countries, as oil and gas producers worldwide face a number of common air pollution challenges.
Keywords:
air pollution
; ESG strategy
; sustainable development
; energy efficiency
; best available techniques
; corporate social responsibility
1. Introduction
Highlights
-This study investigates the impact of ESG principles on air pollution reduction in the West Kazakhstan region. Spatial analysis of atmospheric emissions reveals an uneven distribution of pollution sources, with the highest concentration observed in the northern part of the region.
-The relationships between key ESG indicators and reductions in air pollution were identified using econometric modeling.
-The findings demonstrate that the implementation of ESG strategies effectively reduces atmospheric emissions by promoting the adoption of best available techniques and enhancing corporate environmental responsibility.
Fossil fuel pollution represents a fundamental challenge for the modern economy, with detrimental impacts on the climate, environment, and human health [1]. Intensive oil and gas production is a primary source of carbon dioxide and other greenhouse gas (GHG) emissions, which are major drivers of climate change. The world’s 60 largest oil and gas companies were responsible for over 40% of global cumulative industrial emissions from 1988 to 2015 [2], a trend that continued as global fossil fuel emissions reached a record high in 2023 [3].
The scientific concept of sustainable development is now operationalized through more specific ESG standards, which encompass environmental, social, and governance dimensions. Integrating ESG criteria into decision-making, alongside traditional economic metrics, has emerged as a promising mechanism for advancing the green economy and enabling low-carbon development [4].
As governments worldwide establish net-zero emissions targets, energy companies face increasing pressure to incorporate ESG principles into their business models. Effectively reducing atmospheric emissions within an ESG framework requires an integrated approach and continuous monitoring to achieve set goals and generate a positive environmental impact.
The substantial impact of the oil and gas sector on atmospheric pollution necessitates a shift in strategic management approaches, extending beyond individual companies to encompass the entire industry. Integrating the environmental aspects of the sector’s development into a national socio-economic strategy is a critical tool for addressing ecological challenges and achieving broader socio-economic objectives [5]. Research on strategic management increasingly emphasizes the implementation of sustainable management principles, as traditional strategic management alone is insufficient to meet contemporary demands.
Consequently, these findings underscore the importance of incorporating social and technological dimensions into corporate carbon reduction strategies. They further validate the strategic value of investing in renewable energy and fostering a gender-sensitive corporate environment as integral components of a comprehensive ESG approach.
This study aims to analyze pathways for reducing air pollution in the West Kazakhstan region by applying novel environmental assessment approaches grounded in ESG principles. To achieve this aim, the following objectives are established:
- To assess the impact of ESG adoption on air pollution reduction in the West Kazakhstan region, a key oil and gas producing area in Kazakhstan.
- To perform a spatial analysis of atmospheric emissions in the region to evaluate the environmental impact of the KPO company, which develops the Karachaganak oil and gas condensate field.
- To analyze the effectiveness of ESG strategy implementation at KPO, benchmarking its performance against leading national and international oil and gas companies within a sustainable development framework.
- To develop an ESG algorithm for evaluating recurring functions and identifying operations with concentrated ESG risks. This algorithm will integrate the environmental, social, and governance components of ESG into a unified strategic planning system for sustainable development.
- To perform a correlation-regression analysis examining the relationship between atmospheric emission levels and the E, S, and G factors of the ESG model for the selected oil and gas companies, and to provide a predictive assessment of ESG’s influence on emission reduction.
The research questions and problem statement led to the formulation of the following hypothesis:
H1:
The implementation of ESG principles in corporate operations contributes to a reduction in regional air pollution.
This study posits that integrating ESG principles into the corporate governance of oil and gas companies facilitates the reduction of GHG and pollutant emissions. The effectiveness of these strategies is hypothesized to depend on the level of institutional maturity, the robustness of ESG reporting mechanisms, and specific geographic factors.
In Kazakhstan, the national low-carbon development strategy and the country’s commitments under the Paris Agreement have heightened the focus on regulating greenhouse gas emissions [6]. Given that KPO is a significant source of national GHG emissions, this research examines how the company’s ESG strategy can inform effective management decisions to reduce air pollution and advance decarbonization goals, thereby contributing to the sustainable development of the region.
The novelty of this study lies in the integrated application of econometric modeling and spatial analysis within a comprehensive framework. This approach examines the reduction of air pollution through an ESG strategy in the context of sustainable development for the entire region. While most research assesses the impact of ESG principles either on corporate financial performance—such as profit and market value—through social and governance indicators, or on environmental metrics solely through environmental indicators, this study adopts a distinct perspective. Its methodological significance stems from assessing the sensitivity of atmospheric emissions to the influence of indicators from all three ESG components simultaneously.
Furthermore, the experience of KPO holds practical relevance for other countries, as oil and gas companies worldwide face similar air pollution challenges. This is particularly applicable in regions with significant hydrocarbon reserves, such as Central Asia [7].
2. Materials and Methods
2.1. Object of the Study
This study focuses on companies classified within the HPE category, which are characterized by their industrial operations and significant environmental impact. The analysis specifically centers on KPO, one of the principal sources of air pollution in the West Kazakhstan region.
2.2. Research Methodology
This research employs an interdisciplinary methodology, integrating cartographic and statistical modeling with a comparative analysis of socio-economic, energy, and environmental indicators. It also includes a systematic review of atmospheric impact reduction policies in global and Kazakhstani contexts.
A comprehensive analysis was conducted on representative data from the Scopus database, covering air pollution issues and ESG trends from 2012 to 2024. Consistent with the study’s objectives, particular emphasis is placed on the environmental (E) component of the ESG triad.
Building on an examination of current practices in HPE-type companies, an algorithm was developed for an ESG strategy aimed at reducing air pollution through the implementation of Environmental Impact Assessment (EIA) principles.
Data were collected and selected based on comparability, relevance, and materiality criteria. To ensure systematic and objective analysis, the study benchmarks KPO’s performance against leading global oil and gas companies—Shell, Eni S.p.A., BP, and the Kazakh company KMG—examining their sustainable development goals, key trends, and ESG implementation challenges. The selection of these companies is justified by their participation, along with Chevron, in the KPO production sharing agreement (with BP included as an additional comparator). Chevron was excluded from detailed analysis due to largely unstandardized or unavailable ESG data, particularly for social (S) and governance (G) indicators. The collected data, covering the period 2019–2023, were systematized into panel data for analyzing ESG parameters.
Based on the theory of Lawrence D. Miles [8], “Algorithm of ESG Strategy for Reducing Air Pollution” maps were developed for each ESG component. These maps utilize color coding to facilitate the inventory and optimization of key functions during the implementation of an ESG strategy in oil and gas companies.
The relationships between ESG indicators and air pollution reduction were identified using econometric modeling in R. An element-by-element approach was applied to isolate the key factors driving emission reductions. Initial integration of all factors into a single model revealed the dominant influence of environmental (E) factors. Consequently, following the precedent of similar studies, social (S) and governance (G) factors were integrated for analysis, while environmental factors were evaluated independently. This methodological distinction yielded critical insights that form the basis for the presented practical recommendations.
This research builds upon the authors’ prior work [9], which analyzed the impact of KPO on regional development and the formation of a circular economy between 2012 and 2022. The current study continues this line of inquiry by focusing on the implementation of ESG strategies and enhancements in energy efficiency.
2.3. Data sources
This study utilizes three primary datasets. The key indicators are derived from internationally recognized frameworks, including GRI, ISO 14001:2015, ISO 50001:2018, ISO 26000, ISO 45001:2018, and standards from the International Association of Oil and Gas Producers (IOGP) [10,11,12,13,14,15]. These frameworks were selected for their global recognition, cross-industry applicability, user-friendly templates, and ongoing updates [16]. The first datasets comprise:
- 1.
- Environmental indicators.
- 2.
- Economic and energy indicators.
- 3.
- Social (S) and governance (G) performance indicators for the companies under study.
Data were collected from annual environmental bulletins of Kazakhstan for 2019–2023 [17,18]. The analysis of ESG factors relied on sustainability reports from KPO, Shell, Eni S.p.A., BP, and KMG for the same period [19,20,21,22,23,24], supplemented by GRI reports and Sustainability Reporting Guidelines [10,25].
Spatial analysis of air pollution was conducted using ArcMap 10.8. with data sourced from the Emissions Database for Global Atmospheric Research (EDGAR) [26]. The data processing involved spatial interpolation via spherical kriging, selected for its efficacy in smoothing regional data. A spherical and isotropic variogram model was applied to ensure a uniform and accurate representation of pollution distribution across the region. Map construction employed kriging interpolation, with the specific method—Ordinary Kriging or Universal Kriging—chosen based on data characteristics and spatial distribution.
The second dataset comprises economic and energy indicators for the aforementioned companies from 2019 to 2023, sourced from fact sheets, sustainability reports, and the Emissions Database for Global Atmospheric Research (EDGAR) [26]. Key metrics included the average annual emission growth rate, specific energy intensity (GJ/t), specific CO₂ emissions (t/1000t of extracted raw materials), and the share of renewable energy sources (%) in the energy balance, which characterizes production carbon intensity.
The third dataset encompasses social (S) and governance (G) indicators that reflect corporate performance. This information was extracted from the sustainability reports of KPO, Shell, Eni S.p.A., BP, and KMG for the period 2019–2023 (KPO, 2019-2023; SHELL, 2019-2023; ENI, 2019-2023; BP, 2019-2023; KazMunayGas, 2019-2023) [20,21,22,23,24].
The study faced several limitations in parameter selection:
- Varying reporting timelines: The sustainability reports of the analyzed companies covered different periods. To ensure comparability, the earliest common year for all five companies—2019—was selected as the baseline.
- Evolving reporting standards: Although the Sustainable Development Goals (SDGs) were adopted in 2015, the companies implemented GRI standards in different years. Furthermore, standardized requirements for the circular economy within ESG frameworks remain under development.
- Lack of standardized disclosure: Sustainability reports lack strict formatting requirements, allowing companies significant discretion in data presentation. Established practice shows that environmental (E) criteria are relatively standardized for indicators such as greenhouse gas emissions, net carbon intensity, energy consumption, and waste management. In contrast, no consensus exists regarding social (S) and governance (G) indicators, which complicates their analysis, comparative assessment, and interpretation.
Literature Review
ESG principles are increasingly recognized as a catalyst for technological innovation aimed at mitigating environmental pollution and addressing the drivers of climate change. While a substantial body of research has been dedicated to this field, the present study seeks to contextualize its relevance by systematically reviewing and classifying the existing literature into distinct thematic areas. This classification helps to identify prevailing research trends, gaps, and central debates.

Table 1.
Systematization of the results of the literature review in the direction of “The impact of ESG on reducing air pollution”.
Table 1.
Systematization of the results of the literature review in the direction of “The impact of ESG on reducing air pollution”.
| Direction | Works (authors) | Conclusions | Field of knowledge / application |
|---|---|---|---|
| The relevance of ESG application | [3,4,27,28,29,30,31,32,33,34,35,36,37] | ESG is seen as a tool for implementing the concept of sustainable development, a driving force for technological development that can help reduce environmental pollution and eliminate factors influencing climate change. | Economic research |
| Justification of the relevance of the research topic | |||
| Assessment of global, regional, and national greenhouse gas emissions | [2,38,39,40,41,42,43,44,45,46,47] | Growing global carbon emissions from fossil fuels are becoming one of the fundamental problems of the modern economy and require a comprehensive ESG approach that includes political regulators, technological, organizational, economic and social aspects. | Environmental research |
| Identification of factors, independent variables | |||
| Studying the best global practices of ESG transformation | [48,49,50,51,52,53,54,55] | The study of the best global practices in ESG transformation and sustainable development around the world has shown that ESG strategies are supported at the legislative level | Interdisciplinary research |
| Rationale for recommendations | |||
| Implementing ESG principles into the strategy of oil and gas companies | [56,57,58,59,60] | By integrating ESG principles, oil and gas companies can significantly improve their energy efficiency, which in turn helps reduce air pollution. | Economic research |
| Identification of factors, independent variables | |||
| Development of green technologies, sustainable and responsible investment | [61,62,63,64,65,66,67,68,69,70,71,72,73,74,75,76,77,78,79,80,81] | The applicability of ESG strategies is discussed from a macroeconomic perspective of regulatory policy. Due to the dominance of the climate and environmental components of ESG, insufficient attention is paid to the disclosure of environmental S.G. components. | Economic research |
| Justification of the relevance of the research topic Identification of factors, independent variables |
The preceding analysis identifies critical gaps in the literature on corporate ESG strategy implementation.
First, departing from prior research, this study employs non-financial performance indicators to conduct a pioneering comparative analysis of ESG strategy effectiveness in reducing air pollution. By benchmarking leading global and Kazakhstan’s oil and gas companies within a sustainable development framework, it integrates environmental, social, and governance indicators—constituting its primary novelty. While ESG has gained prominence in corporate sustainability discourse, scholarly focus has remained predominantly on its impact on economic metrics such as productivity, financial costs, risk, and foreign direct investment [54,55,62,64]. Although studies confirm significant indirect benefits from improved profitability and operational efficiency [68], the direct environmental impact of ESG in specific regional contexts remains underexplored.
The relevance of this approach is underscored by the limited research on ESG strategies for improving air quality in Kazakhstan. This study thus complements international scholarship by evaluating ESG efficacy in a context of high energy intensity and hydrocarbon dependency.
Second, a notable scarcity of data exists on how natural resource companies successfully integrate all three ESG components into a unified strategic planning system for sustainable development. The literature frequently addresses ESG from a macroeconomic and regulatory perspective [58,59], yet companies often lack the operational tools for practical implementation.
Third, this paper introduces a novel methodology for assessing ESG initiatives in Kazakhstan’s oil and gas sector through the integration of econometric modeling and spatial analysis. Furthermore, by examining current practices in High Polluting Enterprises (HPE), it develops an algorithm for an ESG air pollution reduction strategy incorporating Environmental Impact Assessment (EIA) principles.
Fourth, investigating the contribution of ESG indicators to emission reduction holds profound practical and strategic importance. Based on a correlation-regression analysis of the relationship between atmospheric emissions and the E, S, G factors for the selected companies, this article provides an emissions forecast up to 2030. The results confirm the positive role of ESG indicators in reducing emissions, demonstrating that by actively fulfilling their environmental, social, and governance responsibilities, companies can enhance their sustainability and significantly contribute to regional and national carbon reduction goals.
KPO was selected as a case study to analyze the applicability of ESG principles in reducing air pollution. The company, located in the West Kazakhstan Region, was among the first in Kazakhstan to formulate a comprehensive environmental policy vision as an initial step in implementing an ESG system and adopting a “green economy” concept.
The West Kazakhstan Region is of particular interest due to its favorable geographical location and substantial resource potential, accounting for 97% of the republic’s gas condensate production and 37% of its gas production. KPO, established at the world’s largest Karachaganak oil and gas condensate field [9], serves as both a supplier and consumer of fuel and energy resources. A distinctive feature of the field is the high hydrogen sulfide content in its natural gas (4–4.3%), which is classified as a Class I hazard [82].
KPO’s mission centers on developing gas condensate fields through principles that balance environmental respect with economic profitability while fostering socio-economic growth [20]. The company has demonstrated a longstanding commitment to sustainability reporting, becoming the first in Kazakhstan in 2009 to issue an independently verified sustainability report meeting international requirements, and adopting GRI guidelines by 2014. This commitment has been recognized in the PwC Kazakhstan rating, where KPO’s reporting is ranked among the best non-financial companies for ESG disclosure [83]. Following assessments of reports for 2022 and 2023 based on completeness, quality, and availability of ESG information, the company secured a position among the top five leaders in Kazakhstan with a B+ rating [83,84]. Notably, GRI standards are actively utilized by leading global oil and gas companies, including Eni S.p.A, Shell, and BP, to enhance the transparency and quality of their sustainability reporting.
3. Results
The study is based on the task of constructing an algorithm for an ESG strategy to reduce air pollution, which includes a number of sequential steps (Figure 1).
The ESG strategy for reducing air pollution is grounded in Environmental Impact Assessment (EIA) principles and a comprehensive analysis of representative literature on air pollution issues and ESG trends from 2012 to 2025. The algorithm was developed considering recommendations for implementing the ESG agenda from various professional associations and international organizations. It constitutes a structured system of functional actions in the areas of environmental, social, and governance responsibility for High Polluting Enterprises (HPE).
3.1. Implementation of the Environmental (E) Component of the ESG Strategy
The proposed algorithm for an ESG strategy to reduce air pollution involves a sequence of steps (Figure 1). At the initial stage of assessing and monitoring the ESG ecosystem, it is prudent to begin with an analysis of the Environmental (E) component by identifying sources of environmental impact, the affected receptors, and the composition and volume of emitted pollutants.
Environmental Impact Assessment of KPO Operations
Hydrocarbon production at KPO affects nearly all components of the biosphere, with the most significant impact on the atmosphere and soil, which subsequently affects flora, fauna, and human populations. Primary sources of environmental impact at KPO include:
- Flares for gas and condensate combustion during well development and testing.
- Open tanks and storage facilities.
- Warehouses and storage areas for reagents.
- Boiler house operations.
- Drilling and cement solutions.
- Solid drilling waste and drilling wastewater.
- Heavy-duty vehicle fleet.
Air pollutants are generated throughout the entire production cycle—extraction, treatment, storage, and transportation of gas and condensate. Twenty-two types of pollutants spanning hazard classes 1-4 are emitted into the atmosphere.
The chemical composition of the atmospheric air at the field is characterized by greenhouse gas emissions (nitrogen oxides, carbon dioxide, and methane), non-greenhouse pollutants (sulfur dioxide), and specific pollutants such as hydrogen sulfide, volatile organic compounds (VOCs), and particulate matter (PM) originating from oil and gas facilities. Leaks in process equipment are a significant source of specific emissions, including hydrogen sulfide and mercaptans.
Sources of hydrocarbon emissions encompass pumping stations, petroleum condensate storage tanks, diesel fuel storage tanks, and equipment leaks. The majority of emissions are generated by gas combustion in flares (37%), waste incinerators (21%), gas turbine units (20%), with boilers, process furnaces, and compressors contributing 12%, and fugitive sources accounting for 10%. The primary combustion products are sulfur dioxide, carbon monoxide, and nitrogen oxides.
Based on the analysis of KPO’s sustainable development reports for 2019–2023, key ESG metrics were selected in accordance with GRI standards and are presented in a comparative analysis with leading global and Kazakhstani oil and gas companies (Figure 2).
KPO’s GHG emissions (in CO₂ equivalent) are significantly lower than those of the other companies analyzed (Figure 2a). Furthermore, a comparative analysis of specific greenhouse gas emission dynamics against International Association of Oil & Gas Producers (IOGP) benchmarks reveals that KPO’s actual specific emissions are 15% lower than European averages and 44% below IOGP figures.
However, a comparison of absolute GHG emissions (Figure 2a) with their annual growth rates (Figure 2b) yields more nuanced insights. While standard practice expects a steady year-on-year decline in emissions, the data reveals a more complex picture. Figure 2a indicates that only Eni S.p.A. exhibited a temporary increase in emissions between 2020–2021, while other companies generally followed a linear decreasing trend. In contrast, the analysis of annual growth rates in Figure 2b shows a cyclical pattern across all companies throughout the study period, deviating from the linear decline observed in absolute terms. Among the companies, only Shell demonstrated a consistent downward trend (with all growth rate values below 1.0), while others displayed periodic increases. Eni S.p.A. has achieved a sustained reduction over the past three years. KPO, despite its low absolute emissions, shows steady growth in the emission rate. This assessment of emission dynamics sustainability reveals that the overall downward trend is often accompanied by periodic deviations, likely attributable to seasonality, fluctuations in production activity, or external economic factors.
Previous studies concluded that the impact on water, soil, and vegetation quality in the Karachaganak field area was negligible [87]. Air pollution studies conducted at the field analyzed four components: hydrogen sulfide, sulfur dioxide, nitrogen dioxide, and carbon monoxide. These studies indicated that while emissions lead to air pollution at the border of the sanitary protection zone, no significant deterioration of ambient air quality was reported [88,89]. Health risk assessments for the nearby population suggested that under normal operating conditions, concentrations of these priority pollutants do not pose a health hazard, though strict emission regulation was emphasized as necessary [90,91,92].
It is important to note that these studies were conducted more than 7–14 years ago and lacked a detailed geographical analysis of the regional impact. Our previous research identified two distinct zonal sectors in the West Kazakhstan region: an industrial north, responsible for the majority of atmospheric emissions, and an agricultural south [9]. To address this gap, we deemed it essential to conduct a contemporary geospatial assessment of emissions in the region.
The spatial maps presented in this study (Figure 3) serve to identify areas with the highest environmental burden, determine spatial pollution patterns, and assess the impact of industrial facilities, particularly KPO. Given that 2022 was identified as a period of increasing GHG emissions for KPO in Figure 2b, the spatial analysis was conducted using data from this specific period to capture the associated environmental footprint.
Thus, the spatial analysis of atmospheric pollutant emission sources (Figure 3a) and emission volumes (Figure 3b) for 2022 revealed an uneven distribution, with sources heavily concentrated in the northern industrial zone of the West Kazakhstan region. Key areas include Borly (the location of KPO), the city of Oral, and Baiterek. In the Borly area, gaseous and liquid marker emissions constitute the majority (86% of the region’s total), while particulate matter (PM) accounts for the remaining 14%. The primary pollution sources in these zones are oil and gas extraction facilities, power generation plants, and main pipeline compressor stations. The interpolation results effectively visualize these pollution hotspots, and the maps (Figure 3) clearly illustrate the spatial disparity between emission sources and concentration levels.
KPO has implemented an integrated management system that incorporates control and monitoring mechanisms for all environmental parameters, aligned with the Global Reporting Initiative (GRI). This system forms the foundation for defining energy policy and establishing goals, objectives, and measures for energy conservation and efficiency improvement. It is noteworthy that KPO has published its Sustainability Development Report (SDR) since 2008, with reports from 2017 onward prepared in accordance with contemporary GRI standards.
An analysis of the company’s sustainability reports from 2019–2023 identified ESG strategies where environmental commitments are focused on the following GRI 3-3 objectives: pollution prevention, GHG emission reduction, biodiversity and ecosystem conservation, protection of natural resources, and the continuous improvement of environmental performance (Figure 4). The inclusion of emission data and reduction progress in KPO’s ESG reporting fosters public transparency regarding the company’s contributions to the objectives of the Paris Agreement.
A comparison of the indicators in Figure 4a,b reveals that, in contrast to overall emissions, KPO demonstrates the most effective performance in reducing the volume of gases flared among the studied companies. The data for the period shows a generally stable downward trend (average value of 0.9). For the other companies, discrepancies between linear and cyclical trends are again observed.
While absolute emission volumes (Figure 4a) show a steady and consistent decline, indicating successful implementation of environmental mitigation plans, the stability of this trend (Figure 4b) reveals fluctuations. Periods of rapid decline alternate with short-term plateaus, suggesting that the overall positive trajectory is influenced by factors such as seasonal patterns, the phased introduction of new technologies, and global economic conditions. Consequently, a robust long-term climate strategy must aim not only for cumulative emission reductions but also for greater stability and predictability in the rate of change.
The heightened focus on the climate and environmental components of ESG has, however, led to an increase in “greenwashing”—the dissemination of misleadingly positive reports about a company’s environmental impact. The flexible selection of ESG criteria can result in the overstatement or understatement of reported metrics, with studies showing that various ESG ratings are consistent in only six out of ten cases [71]. In response, major asset managers (e.g., BlackRock) and key industry players (e.g., Bloomberg) are advocating for mandatory ESG disclosures [16]. Consequently, the European Union is actively developing regulatory frameworks, including new rules to enhance the transparency and reliability of ESG ratings. These stringent regulations compel companies to disclose emissions and implement reduction measures, creating direct incentives for businesses to improve their environmental performance and reduce their carbon footprint [73].
According to external audits, the environmental monitoring system for air quality developed and implemented by KPO complies with international standards ISO 14001:2015, GRI, and the national legislation of the Republic of Kazakhstan [10,11,82].
KPO manages its direct GHG emissions within the framework of the national emissions trading system, adhering to the limits set in its environmental permits. This is achieved through systematic sampling and analysis by an accredited laboratory, supported by 18 stationary automatic monitoring stations. These stations operate continuously around the perimeter of the facility, within sanitary protection zones, and along the export pipeline, and are equipped with an alert system for when pollutant concentrations exceed permissible levels. This integrated approach has enabled the company to achieve a systematic reduction in atmospheric emissions. KPO’s technological targets include ensuring that the residual hydrogen sulfide content in fuel gas does not exceed 0.02 g/m³ and mercaptans do not exceed 0.036 g/m³. During the treatment of stable condensate, the company guarantees a hydrogen sulfide content of no more than 20 ppm and a mercaptan content of no more than 40 ppm in commercial crude oil.
During the study period, KPO achieved a 44.9% reduction in gross atmospheric emissions, with the most significant decreases observed for sulfur dioxide (59.3%), nitrogen dioxide (38.1%), and volatile organic compounds (40.3%). Specific pollutant emissions decreased by 51.3%. This reduction, and the corresponding decrease in ground-level pollutant concentrations, is attributed to a comprehensive set of technological and organizational measures implemented through an energy conservation-focused ESG strategy.
Applying Lawrence D. Miles’ theory [8] as a framework for developing a color-coded ESG algorithm has helped identify recurring functions and pinpoint operations with concentrated ESG risks. The analysis of KPO’s environmental and energy management systems shows that the achieved emission reductions can be attributed to the implementation of a structured algorithm (Table 2).
Thus, in the domain of accountability and transparency, KPO’s reporting is verified by audit firms for data reliability, and its environmental and energy management systems undergo regular audits. Since 2014, with the adoption of GRI standards, ESG strategies have been progressively integrated. Under the areas of “Environmental Management System, Waste Management, and Energy Efficiency,” KPO has deployed continuous monitoring systems for air, surface water, and groundwater. Strategies for water resource management, wastewater reuse, material recycling in production, and waste disposal have been established.
Pollutant concentrations in emissions are monitored in real-time. A Leak Detection and Repair (LDAR) system is utilized to identify and mitigate methane leaks, and international standards ISO 14001:2015 and ISO 50001:2018 are implemented [11,12]. The adoption of ISO 50001:2018 [12], in particular, has facilitated the optimization of energy consumption and enhanced energy efficiency in hydrocarbon production and processing.
As part of its “Innovation and Research: Using the Best Available Technologies” program, atmospheric emissions have been reduced through high-pressure (550 bar) gas re-injection technology. Since 2024, KPO has participated in the UN-led Oil and Gas Methane Partnership 2.0 (OGMP 2.0) under its Carbon Footprint initiative.
3.2. Implementation of the Social (S) and Governance (G) Components of the ESG Strategy.
Karachaganak, as the region’s largest enterprise, plays a pivotal role in its social, economic, and cultural development. An analysis of the company’s socially responsible business strategy reveals a comprehensive set of measures focused on improving working and living conditions, healthcare, collaboration with trade unions, enhancing industrial safety, providing social guarantees, supporting education and internships, fostering university partnerships, maintaining dialogue with local communities, and developing social and infrastructure projects for the region.
Concurrently, an analysis of institutional and legislative differences between Kazakhstan and oil-producing nations with more advanced institutional frameworks (e.g., Norway, the USA, Canada) indicates that the latter manage natural resource revenues more effectively, achieving superior results in economic growth and social development [81]. For instance, unlike Norway, Kazakhstan’s National Fund has not attained a similarly advanced level of sovereign wealth fund management, which has contributed to its depletion, low long-term investment efficiency, and limited signs of sustainable development [93].
A review of global best practices in ESG transformation demonstrates that in the EU, ESG strategies are legislatively supported through initiatives like the European Green Deal, which aims for carbon neutrality by 2050 [48]. Governments of OECD member and partner countries have developed and are implementing numerous specific measures to stimulate the green economy [62].
An assessment of measures supporting KPO’s social responsibility implementation and their impact on sustainable development underscored the need to systematize these actions using the proposed algorithm (Figure 1). This analysis resulted in the development of a structured action algorithm (Table 3).
As part of its commitment to balancing corporate and employee interests through a healthy work environment, KPO has increased the proportion of local hires over the past three years under its “Employee Relations, Diversity, Equity, and Inclusion, Labor Practices, Supply Chain, and Labor Standards” program. Local citizens now constitute 98% of the total workforce and 86% of management personnel.
To advance Sustainable Development Goal (SDG) 16.b, KPO has implemented the “KPO 365” Corporate Strategy, which focuses on preventing major incidents and mitigating risks to personnel, the environment, assets, and corporate reputation. The company’s social responsibility policies, procedures, and standards align with International Financial Reporting Standards (IFRS).
Within the “Human Rights Policies, Health and Safety, Training and Development” framework, KPO has amended internal documents to ensure compliance with labor legislation, Kazakhstan’s Environmental Code, and ISO 26000 guidelines. A Safety Management Center, involving all employees, was established to implement process safety fundamentals, enhance industrial safety protocols, and conduct regular training. The introduction of health, safety, and environmental protection cards facilitated the identification of 125 potentially hazardous incidents. In 2023, the lost-time injury rate for KPO and contractor employees was 0.05. The company allocated over $240 million for local workforce development between 1999 and 2023, including the introduction of the Udemy e-learning platform in 2023. Security systems undergo regular audits, with new technologies continuously integrated for risk monitoring and management [83].
The “Community Engagement, Stakeholder Engagement, Social Impact Investments” program maintains dialogue through advisory council meetings with residents, forums, conferences, public hearings, surveys, and audits. A direct communication channel with the company has been established, and KPO’s social project portfolio is coordinated with regional authorities.
Social investment has increased from $10 million in 2012 to $30 million in 2023. Eighteen social infrastructure projects worth $43.2 million have been completed, including the construction of 13 schools, two sports complexes, a visitor center, and road repairs in the West Kazakhstan region.
KPO actively engages Kazakhstani suppliers and manufacturers in its development process. The local content indicator for procurement of goods, works, and services reached 63.24% ($756.1 million) in 2023. During 2022–2023, 30 contracts totaling $107 million were awarded to domestic companies for locally produced goods.
Since 1998, the company has financed over 250 social and infrastructure facilities. These social responsibility initiatives contribute directly and indirectly to reducing air pollution by fostering sustainable community development and enhancing operational accountability.
An analysis of processes, case studies, and documentation related to KPO’s corporate governance implementation and its impact on sustainable development highlighted the value of structuring these efforts using the proposed algorithm (Figure 1). This analysis resulted in the development of a corresponding action algorithm (Table 4).
Under the “Board Composition and Diversity, Executive Compensation” guidelines, KPO implements ESG best practices, including ensuring board independence and conducting regular performance assessments. The company adheres to principles of equal opportunity and non-discrimination, with all compensation, hiring, evaluation, and promotion decisions based on objective criteria such as merit, qualifications, and performance.
The “Stakeholder Rights, Ethics and Compliance Program” operates within the framework of applicable legislation and internal corporate procedures. By transparently disclosing emissions data and reduction progress in its ESG reporting, KPO enables stakeholders and interested parties to assess the strategy’s effectiveness and its environmental impact.
Furthermore, adherence to business ethics, compliance with GRI standards, and the digital transformation of production and safety operations collectively contribute to reducing the company’s environmental footprint. In accordance with “Risk Management Practices, Internal Control, and Audits,” a systematic approach and continuous assessment are employed to develop optimal business strategies and manage organizational change.
KPO is continuously enhancing its methods for assessing environmental risks and incidents, including those related to oil spills and hazardous substances. The implementation of GRI standards facilitates a more structured approach to risk management. The “Goal Zero” principle underscores the company’s commitment to personnel and environmental safety.
The company has launched an enhanced methane emissions monitoring program for 2024–2029, making transparent reporting a key priority. Internal audits are regularly conducted in high-risk operational areas. The ESG report is approved by the Company’s Board of Directors and, during its preparation, is coordinated with members of the Sustainability Subcommittee representing the partner companies. Prudent resource management within a stable budgetary framework, aligned with strategic management approaches and sustainability targets, has become a cornerstone of corporate governance. An electronic procurement and work permit system was launched in 2024.
In line with “Corporate Policies and Procedures, Sustainability Integration,” KPO is developing and implementing the “KPO-365 Business Strategy.” This strategy integrates sustainable development principles into business operations, investment planning, and decision-making processes, supported by a comprehensive digitalization strategy and production forecasting using advanced analytical tools [20].
4. Modeling
In accordance with the adopted research methodology, the subsequent stage involved econometric modeling to explain variations in GHG emissions and to assess the impact of environmental, social, and governance factors on air pollution levels through a staged approach.
This process yielded three separate models for a single dependent variable—the volume of GHG emissions by enterprises. All generated indicators were consolidated into panel data series for the companies under study. Given the previously noted limitation of non-uniform ESG reporting requirements for the social (S) and governance (G) components, the number of independent variables collected for these dimensions was smaller than for the environmental (E) component (Appendix A).
In the next step, the factors identified through regression analysis were integrated into a single aggregate regression model to assess the collective impact of oil and gas companies’ ESG strategies on emission reductions. The results of the econometric modeling necessitated the evaluation of ESG factor influence using two distinct models: a comprehensive ESG model and a combined S+G model.
4.1. Modeling of GHG Emissions Based on Environmental Factors in the Oil and Gas Industry
A total of 16 factors were collected for the five companies covering the period from 2019 to 2023. This timeframe was selected because comprehensive sustainability reporting has been consistently compiled and published by companies for a relatively short duration, particularly considering the Sustainable Development Goals (SDGs) were adopted in 2015. It should be noted, however, that some companies have published reports in various forms significantly earlier. For example, Shell has formally reported on sustainability-related performance for over 25 years, aiming to maintain transparency regarding activities relevant to investors, governments, and civil society [21]. Nevertheless, disparities in the calculation and measurement methodologies for certain indicators made it feasible to generate systematic and comparable data only from 2019 onward.
During the model construction, explicit linear relationships (aliases) were identified:
- X13 and X14 in KMG: close values - minimal difference → high multicollinearity → alias).
- X1 and X2: In some companies, they move in parallel (correlation ≈ 1).
- X6 and X7: At Shell, BP, and EniS.p.A, the indicators often move in sync (the same trend).
- X9 and X10: The variables are “scaled,” but proportional to each other.
- X11 and X12: Often nearly proportional (all years rise/fall together).
Based on this, in order to obtain a reliable model, the following predictors were excluded from the equation: X2, X6, X10, X12, X14 - they were the ones that caused the alias error when calculating vif ().
Rationale for this choice:
- X2 is a strong duplicate of X1 → makes the X matrix undefined.
- X6 and X7 — in small samples, it’s better to leave only one (X7 is more informative).
- X10 is almost always linearly dependent on X9 (all observations are nearly proportional).
- X12 is very close to X11 (a scale factor, duplicates).
- X14 ≈ X13 (in some rows, the difference is 0 → complete collinearity).
After removing them, alias() will return an empty result, and vif() will be calculated without error.
The following results were obtained as a result of the transformations:
- Coefficients: Estimate Std. Error z-value Pr(>|z|)
- (Intercept) 10.94087567 5.83964695 1.8736 0.0609924 .
- X1 0.85999310 0.47076372 1.8268 0.0677292 .
- X3 -2.11488142 4.04309198 -0.5231 0.6009150
- X4 0.05534474 0.02754940 2.0089 0.0445448 *
- X5 -9.11477183 4.74350876 -1.9215 0.0546655 .
- X7 0.03013069 0.04034971 0.7467 0.4552214
- X8 0.03668248 0.01007773 3.6400 0.0002727 ***
- X9 -2.17414745 1.96847151 -1.1045 0.2693828
- X11 -0.00389659 0.00178096 -2.1879 0.0286754 *
- X13 0.00253414 0.00098908 2.5621 0.0104039 *
- X15 -0.18348608 1.15986542 -0.1582 0.8743023
- X16 0.06956297 0.01750540 3.9738 7.074e-05 ***
Of all the indicators, X8, X11, X13, X16 turned out to be significant, and when testing for fixed and random effects, the Hausman test [94] determined that the model with random effects is more acceptable.
Coefficients:
- Estimate Std. Error z-value Pr(>|z|)
- (Intercept) 5.38069167 3.55208454 1.5148 0.12982
- X8 0.05288441 0.00222165 23.8041 < 2.2e-16 ***
- X11 -0.00636748 0.00152916 -4.1640 3.127e-05 ***
- X13 0.00261056 0.00083545 3.1247 0.00178 **
- X16 0.10166146 0.01319440 7.7049 1.310e-14 ***
ŷ = 5.3807 + 0.05288·X₈ − 0.00637·X₁₁ + 0.00261·X₁₃ + 0.10166·X₁₆
The resulting regression model allows us to identify the influence of key factors X8, X11, X13, and X16 on the performance indicator and understand their uniqueness. To forecast future performance indicators, Holt’s exponential smoothing model and the ARIMA model [95] will be used, as they allow for the trend and seasonality of time series.
In the next step, we apply RW+drift, the addition of which allows us to reflect the average annual decline. ARIMA models over short time periods can be sensitive to recent changes, so for conservative predictions, a random walk model with trend accounting is preferable.
Negative results should be considered a side effect of econometric analysis; to avoid their influence, the parameter “level = 0” is set and special attention is paid to the range of possible values rather than to a specific point.
Thus, using RW+drift with “level = 0” generates a conservative, replicable baseline for gradual reduction of cumulative emissions by 2030, which should be regularly updated as new data becomes available. The RW+drift model is based on recent data, taking into account that a new year may slightly shift the average rate of decline (Appendix B).
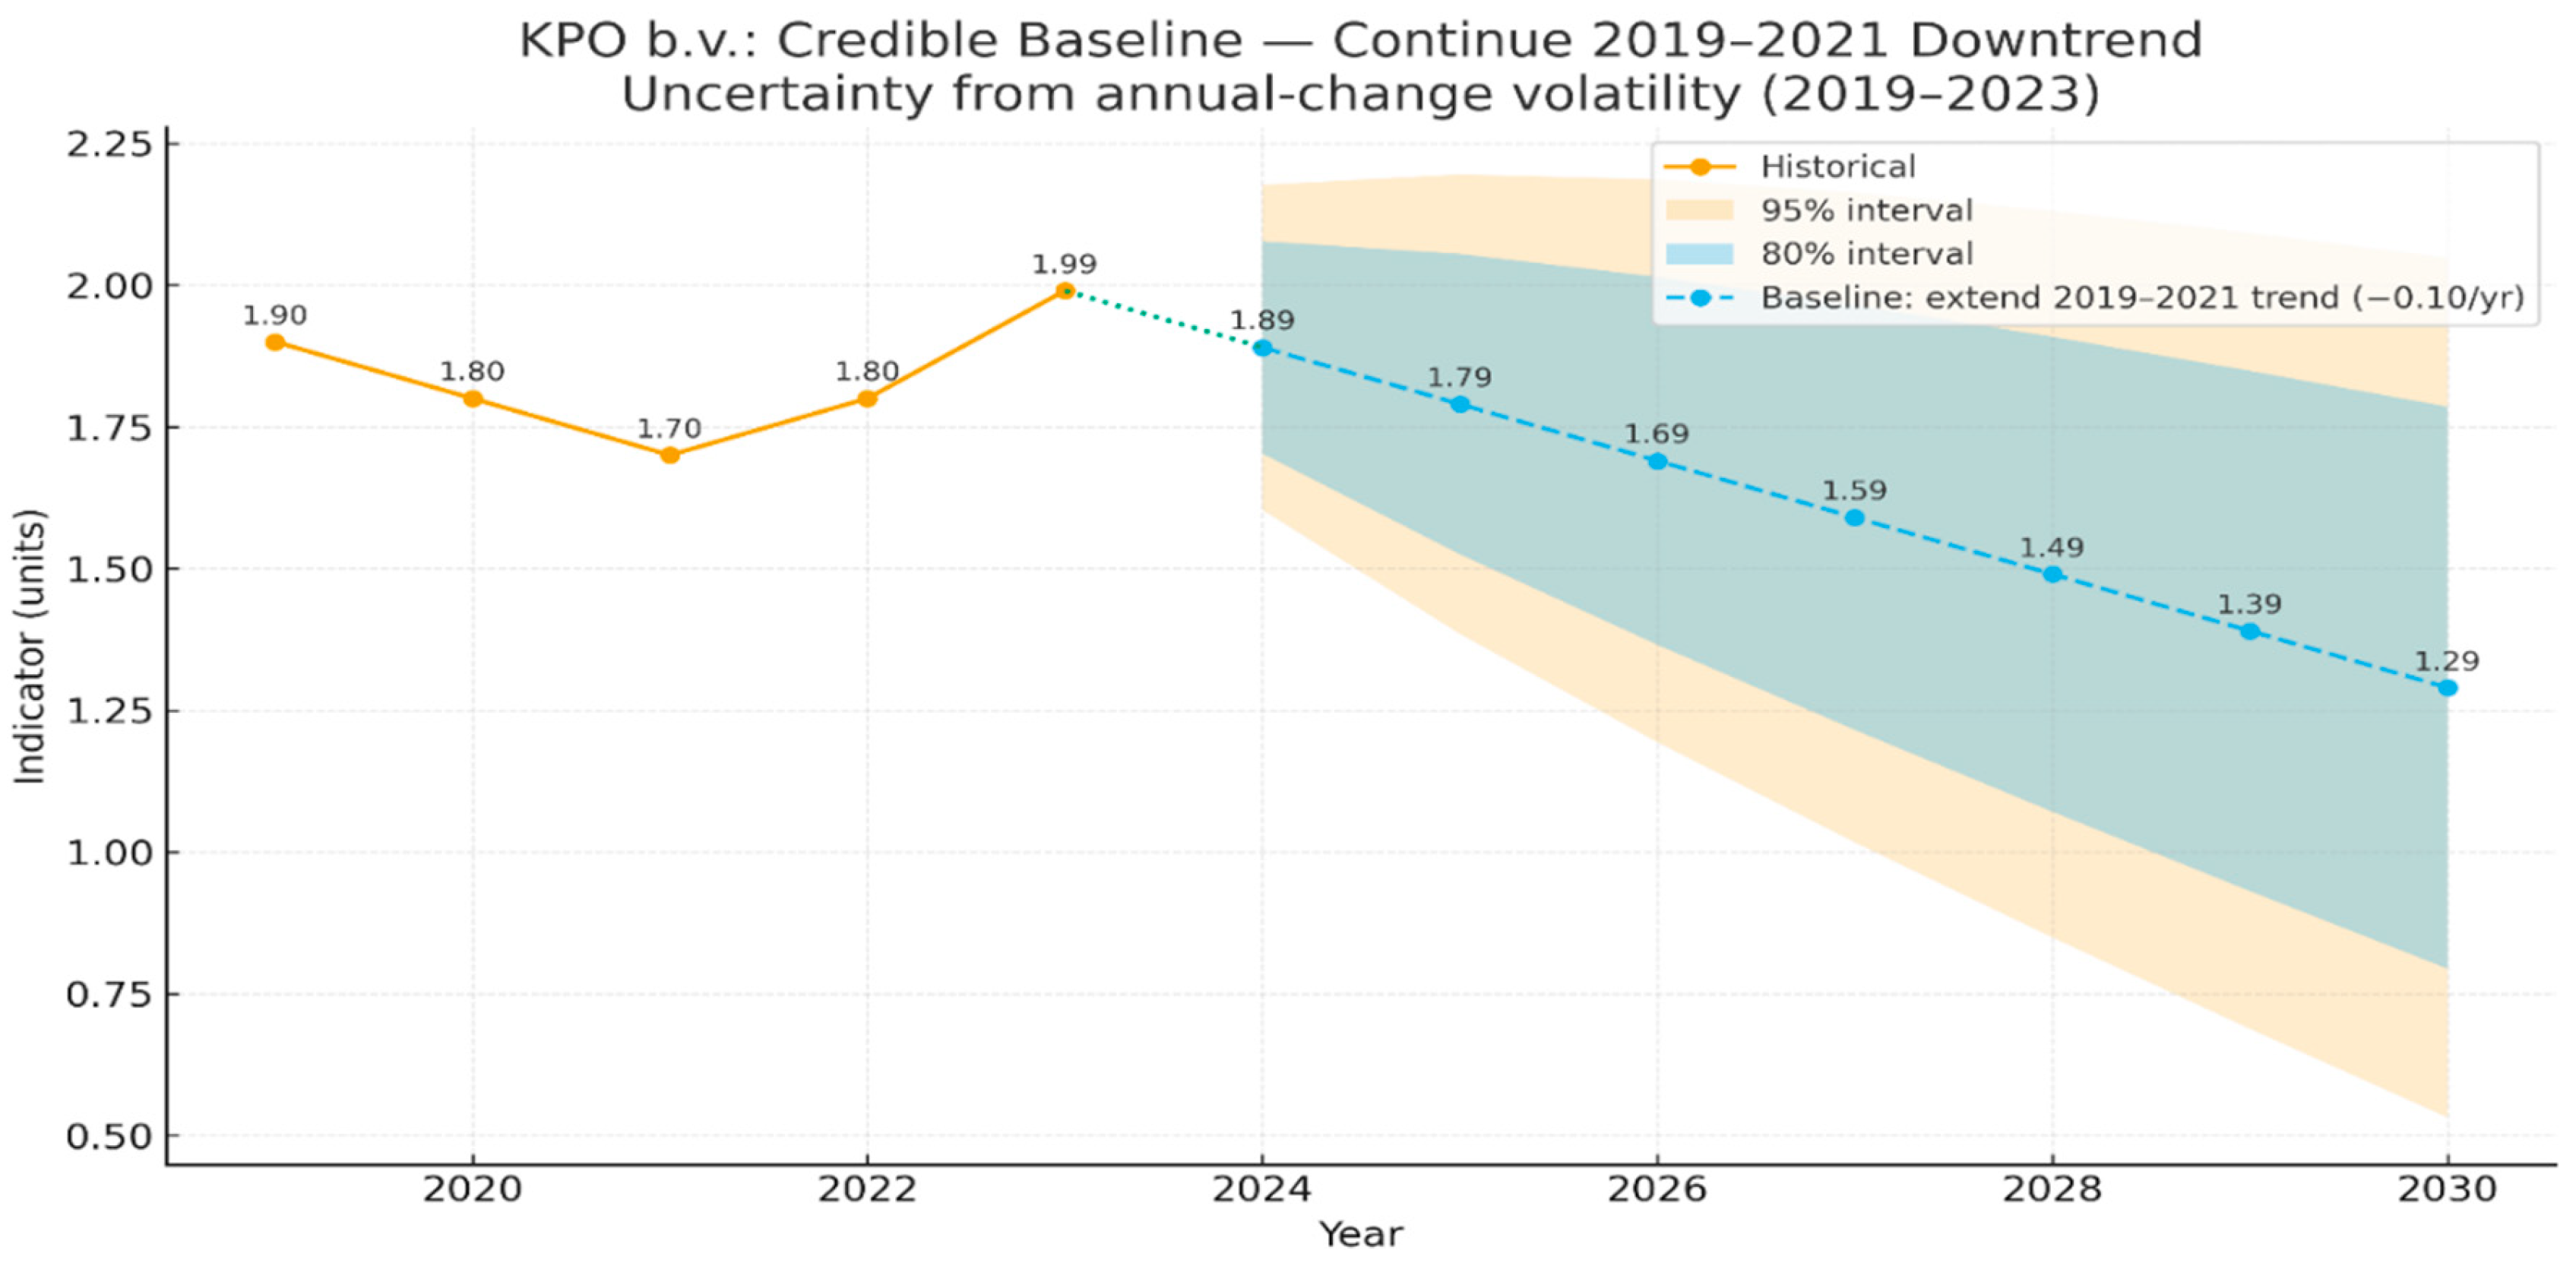
Figure 5.
Forecasting RW+drift of GHG emissions at KPO (mil.t CO2 equivalent) taking into account the impact of factors demonstrating the company’s environmental responsibility.Note: constructed using R.
Figure 5.
Forecasting RW+drift of GHG emissions at KPO (mil.t CO2 equivalent) taking into account the impact of factors demonstrating the company’s environmental responsibility.Note: constructed using R.
As part of the study, an ARIMA (1,1,0) model was constructed for the time series of KPO’s greenhouse gas emissions for 2019–2023. The Ljung–Box test [95] yielded a p-value of 0.5462, which significantly exceeds the critical significance level of 0.05.
This allows us to conclude that the model residuals do not contain statistically significant autocorrelation, and the model itself adequately describes the dynamics of the original time series and can be used for forecasting. Analysis of the resulting forecast values for GHG emissions shows that, all other things being equal, the implementation of the KPO environmental strategy to reduce environmental pollution will lead to a reduction in emissions.
A review of forecasts for Shell, Eni S.p.A., BP, and KMG revealed the following. For Eni S.p.A., maintaining its ESG principles implementation approaches will result in a 13% reduction in pollutant emissions by 2030 (compared to 2023). Similarly, at Shell, we achieved a 70% reduction in emissions, and at BP, we are seeing a complete elimination of emissions and the achievement of complete decarbonization of oil and gas production technologies. For the Kazakh company KMG, the forecast model shows a 22% reduction in emissions. All these findings indicate that environmental management in oil and gas companies demonstrates varying levels of effectiveness, suggesting the value of studying the experiences of leading companies.
4.2. Modeling of GHG Emissions Based on Factors Demonstrating the Social Responsibility of Companies in the Oil and Gas Industry
A total of 11 factors were collected for five companies for the period from 2019 to 2023, demonstrating corporate social responsibility (Appendix A). The results of the panel regression analysis are presented, including the coefficients for the independent factors, their corresponding errors, significance criteria, and probability (p-values).
Coefficients:
- Estimate Std. Error z-value Pr(>|z|)
- (Intercept) 1.0275e+02 3.1881e+01 3.2228 0.001270 **
- Xs1 1.0166e+01 9.9885e+00 1.0178 0.308781
- Xs2 -3.6245e-01 1.3573e+00 -0.2670 0.789440
- Xs3 3.2524e-02 2.0996e-02 1.5491 0.121368
- Xs4 -3.7928e-02 3.2649e-02 -1.1617 0.245362
- Xs5 9.4815e-03 9.5502e-03 0.9928 0.320804
- Xs6 4.8436e-01 4.1010e-01 1.1811 0.237568
- Xs7 -3.2479e-03 1.6184e-03 -2.0069 0.044760 *
- Xs8 -2.3854e+00 7.4694e-01 -3.1936 0.001405 **
- Xs9 -1.6766e-03 5.3711e-03 -0.3122 0.754925
- Xs10 -9.6529e-02 1.4743e-01 -0.6547 0.512644
- Xs11 -1.8208e-05 1.3603e-04 -0.1338 0.893521
According to the results of the analysis of the correlation matrix (Figure 6), the most pronounced positive relationship was recorded with the variables Xs4 (r = 0.81), Xs7 (r = 0.81) and Xs9 (r = 0.86), indicating a close relationship between emissions and these indicators.
A moderately positive correlation can be observed for Xs6 (r = 0.66), Xs8 (r = 0.60), and Xs11 (r = 0.56). In turn, variables Xs2, Xs3, Xs5, and Xs10 showed an insignificant or negative correlation with emission volumes, indicating a minor influence of these factors. It was also established that there are strong relationships between the independent variables themselves, such as Xs4–Xs7 (r = 0.81) and Xs8–Xs9 (r = 0.80), which can create a problem of multicollinearity when constructing regression models. After checking for multicollinearity, Xs7 (Low carbon development, Renewable Energy Investments) and Xs8 (Diversity and Inclusion (women in the company), %) were found to be significant in the model. Furthermore, the Hausman test confirmed the use of the random-effects model.
Coefficients: Estimate Std. Error z-value Pr(>|z|)
(Intercept) 94.3244368 23.3562504 4.0385 5.379e-05 ***
Xs7 -0.0034038 0.0008342 -4.0803 4.498e-05 ***
Xs8 -2.1699157 0.5438818 -3.9897 6.616e-05 ***
Y = 94.3244368 - 0.0034038·Xs7 - 2.1699157·Xs8
The results of the autocorrelation test are presented in Figure 7.
Surface visualization (Y = 94.3244368 - 0.0034038•Xs7 - 2.1699157•Xs8) Y=f(Xs7, Xs8) shows that the slope of the plane clearly indicates a negative influence of both factors. The red dots (real data) fit well on the theoretical surface, confirming the adequacy of the model.
Turquoise projections onto the Xs7–Xs8 plane allow us to see the distribution of factors without taking Y into account. Thus, a regression analysis of the impact of the ESG strategy of oil and gas companies in the context of their social responsibility on the reduction of GHG emissions showed that investments in renewable energy sources as a criterion for low-carbon development (Xs7) and the share of women in the company (Xs8) are significant.
Negative coefficient values for both variables indicate an inverse relationship: increased investment in renewable energy and increased representation of women in the workforce lead to a decrease in GHG emissions. The coefficient Xs7=−0.0034 demonstrates that each additional investment in renewable energy sources is accompanied by an average reduction in GHG emissions by 0.0034 conventional units, which is a manifestation of the transition to production with a smaller carbon footprint.
This is in line with the principles of sustainable development, where the introduction of innovative and environmentally friendly technologies helps to reduce the intensity of carbon use. The coefficient Xs8=−2.1699 indicates that a one percent increase in the share of women leads to a reduction in emissions of approximately 2.17 units, which can be seen as a beneficial effect of gender diversity on environmental management performance.
4.3. Modeling GHG Emissions Based on Factors Demonstrating the Management Responsibility of Companies in the Oil and Gas Industry
As a result of the study, data were generated from ten indicators characterizing the implementation of corporate governance principles of five enterprises in the period from 2019 to 2023 (Appendix A). The results of the analysis conducted using the panel regression method include data on the coefficients of influence of independent variables, as well as estimates of their errors, statistical indicators of reliability and p-values.
Coefficients: Estimate Std. Error z-value Pr(>|z|)
(Intercept) 6.2275986 21.4709182 0.2900 0.7717795
X1G -0.0257988 0.1362364 -0.1894 0.8498044
X2G -0.0039458 0.0165425 -0.2385 0.8114743
X3G 0.1576491 0.0493119 3.1970 0.0013888 **
X4G 0.1908606 0.1126435 1.6944 0.0901935
X5G -0.0127722 0.0097460 -1.3105 0.1900261
X6G -0.5811444 0.1746336 -3.3278 0.0008754 ***
X7G 0.4129630 0.2531780 1.6311 0.1028656
X8G 0.0079756 0.0098253 0.8117 0.4169409
X9G 0.0026412 0.0078205 0.3377 0.7355720
X10G 0.1565727 0.1182101 1.3245 0.185
The indicators X3G (number of violations of corporate ethics) and X6G (amount of taxes paid) were determined as the indicators.
Coefficients:
Estimate Std. Error z-value Pr(>|z|)
(Intercept) 30.162609 15.225108 1.9811 0.047579 *
X3G 0.147488 0.032621 4.5212 6.148e-06 ***
X6G -0.529817 0.163269 -3.2451 0.001174 **
ŷ = 30.1626 + 0.1475·X₃G − 0.5298·X₆G
The presence of coefficients of different signs allows us to identify two opposing influencing factors. First, the positive value of the X3G variable (0.1475) demonstrates that an increase in the number of business ethics violations leads to an increase in GHG emissions.
The presence of coefficients of different signs allows us to identify two opposing influencing factors. First, the positive value of the X3G variable (0.1475) demonstrates that an increase in the number of business ethics violations leads to an increase in greenhouse gas emissions.
This fact points to a link between corporate governance effectiveness and environmental performance. An increase in ethical violations indicates deficiencies in the internal control system, a lack of concern for the environment, and unclear corporate policies.
Thus, the study’s results support the hypothesis that an organization’s honest behavior is an indicator of its commitment to environmentally friendly development. On the other hand, the negative coefficient for X6G (-0.5298) indicates that increasing the amount of taxes paid leads to a reduction in GHG emissions. This can be seen as a sign of financial discipline and corporate social responsibility: companies that meet their tax obligations on time tend to be more mindful of environmental issues and implement carbon footprint reduction technologies. Furthermore, full tax payment may indicate a high level of transparency and stability in company management, which is linked to environmental compliance (Figure 8).
The graph represents the result of a principal component analysis (PCA) for variables X1G–X10G. The PC1 axis (Principal Component 1) explains approximately 29.53% of the total data variance. The PC2 axis (Principal Component 2) explains approximately 26.79% of the variance. Together, the two components explain approximately 56.32% of the total variance—a good result for a multivariate set of factors. The PC1 axis runs from left to right and reflects the main direction of data variation. The X3G and X6G factors highlighted in red contribute the most to it. The analysis demonstrates that corporate governance practices (the G aspect of ESG) directly impact companies’ environmental performance.
Failure to comply with business ethics principles leads to an increase in environmental threats, while honest financial management (including tax issues) helps to reduce these risks. The proposed model indicates that ethical and open governance are important not only from a moral point of view, but also serve as economic and environmental factors for sustainable progress, strengthening the connection between the elements of Environmental and Governance in the context of ESG.
4.4. Modeling GHG Emissions Based on Factors Demonstrating the Integrated Impact of ESG Responsibility of Oil and Gas Companies
At the initial stage of the integration process, indicators identified as significant based on the component-by-component impact assessment were included in the model. A panel regression analysis revealed the overwhelming influence of the Environment group of factors, which largely offset the impact of Social and Governance.
Coefficients: Estimate Std. Error z-value Pr(>|z|)
(Intercept) 12.74279814 9.60857607 1.3262 0.184777
X8 0.04606081 0.00548540 8.3970 < 2.2e-16 *** Nitrogen oxides (NOx), thousand t,
X11 -0.00789834 0.00172348 -4.5828 4.588e-06 *** Production volume, thousand tons
X13 0.00272337 0.00086318 3.1550 0.001605 ** Total waste disposal volume, thousand tons
X16 0.10795273 0.02153480 5.0129 5.360e-07 *** Oil spills and environmental incidents, volume
Xs7 -0.00027363 0.00035034 -0.7810 0.434791 Investments in renewable energy sources, $ million
Xs8 -0.11803320 0.22847358 -0.5166 0.605424 Share of women in the company, %
X3G 0.00977672 0.01048735 0.9322 0.351213 Violations of corporate ethics, number
X6G -0.05641341 0.04350179 -1.2968 0.194698 Taxes, $ million
In addition to the traditional ordinary least squares (OLS) method, new regression analysis approaches were used to ensure the stability of the created model and identify the most determining factors: partial least squares (PLS) and LASSO regression.
The use of these tools helps to increase the reliability of conclusions by reducing the influence of multicollinearity between variables, and also helps to identify those parameters that have the greatest impact on the indicator under study.
According to the results of PLS and LASSO testing, only four main factors continue to have a significant impact on the amount of GHGs emitted.
This allows us to conclude that the analysis of the relationship between eight sustainability indicators – four environmental, two social and two governance-related – and GHG emissions, carried out within a single model, showed a significant impact mainly of environmental aspects.
To study in detail the nature of this influence, an independent model was developed, focusing exclusively on social and managerial factors.
This methodology is consistent with common principles of empirical analysis and is used in particular in the work of [96] to assess the stability of the obtained data (robustness check). Thus, according to experts, comparing the results obtained using full and simplified versions of the model helps determine the stability of the impact of individual parameters and avoid a situation where strong predictors obscure the effect of other variables.
This approach is common in studies addressing multicollinearity and factor dominance. In complex models [97,98] that incorporate ESG factors, environmental parameters often have the most significant and direct impact on emissions, which can obscure or mask the contribution of social and governance indicators.
In fundamental works on the application of the LASSO method, this approach is explained through the application of the principle of model parsimony [99]. In his works, the selection of individual influencing parameters corresponds to sequential regression and regularization approaches, which strive to create the most concise and understandable structure.
According to methods for assessing mediation effects, within the framework of the ESG integration concept, governance and social aspects can influence environmental performance indirectly, but rather through organizational systems or internal company policies. The S+G model makes it possible to measure precisely this indirect effect [100].
Thus, the creation of an isolated model that includes social and governance variables allows us to assess the independent contribution of these factors to reducing greenhouse gas emissions.
At the same time, it provides a detailed explanation of the ways in which they are impacted through management and social instruments. The construction of an S+G model allows for the mitigation of the overwhelming influence of environmental factors during the modeling process.
At the same time, this approach improves understanding of the model and provides greater clarity to scientific conclusions.
Regression analysis results: Coefficients: Estimate Std. Error z-value Pr(>|z|)
(Intercept) 75.28376991 23.77155120 3.1670 0.001540 **
Xs7 -0.00195038 0.00095936 -2.0330 0.042051 *
Xs8 -1.55417944 0.57401770 -2.7075 0.006778 **
X3G 0.08223244 0.03425467 2.4006 0.016367 *
X6G -0.24491608 0.16967034 -1.4435 0.148885
Ŷ = 75,2838 − 0,00195·Xs7 − 1,5542·Xs8 + 0,0822·X3G
At the next stage, the model was tested for heteroscedasticity of residuals and autocorrelation.
bptest(model_re)
studentized Breusch-Pagan test
data: model_re
BP = 3.5702, df = 3, p-value = 0.3118, the p-value confirmed the null hypothesis that there is no heteroscedasticity, and the constancy of variance is confirmed.
pbgtest(model_re)
Breusch-Godfrey/Wooldridge test for serial correlation in panel models
chisq = 4.9697, df = 5, p-value = 0.4196, in the autocorrelation test, the p-value also confirmed the hypothesis of no autocorrelations, which indicates that the model does not suffer from residual autocorrelation, meaning that its estimates are efficient and unbiased.
The next step involved forecasting greenhouse gas emissions, taking into account socio-governance factors. To ensure methodological rigor and consistency in the study, the ARIMAX model was used, accounting for both the internal dynamics of the time series and the impact of controllable ESG factors.Unlike basic autoregressive models, ARIMAX integrates exogenous variables reflecting investments in low-carbon development, gender diversity, and corporate ethics, making the model more managerially realistic (Figure 9, Appendix C).
The forecast presented in Figure 9 (model of the dependence of GHG emissions into the atmosphere on social and management factors of KPO activities) shows that according to the geometric interpretation of the linear trend of emission reduction, the trend slope angle is -10 over a 7-year period (tan(α)=∆Y/∆X; α=arctan(−0.01714) = - 0.9820). From an econometric perspective, this amounts to 7% over a seven-year period, or an estimated 1% per year. Meanwhile, the forecast compiled for the KPO model of GHG emissions dependent on environmental management factors (Figure 5) shows a slope of almost 60 (-5.710), or a sixfold greater effect. From an econometric perspective, the reduction rate is 35% over a seven-year period, or 5% per year—five times higher. A geometric interpretation of the linear trend in emissions reduction is more accurate for management decision-making. This comparison once again confirmed the powerful impact of environmental management on reducing greenhouse gas emissions. However, it also demonstrated that measures to demonstrate ESG commitment within the social and governance component also have an impact.
Forecasts for other companies, compiled using the S+G model, are presented in Appendix C. Thus, the forecasted reduction of GHG emissions into the atmosphere from social and management factors of the activities of BP, Shell, and Eni S.p.A. is more effective than that of KPO Moreover, while Eni S.p.A.’s forecast for component E showed a 13% reduction, the integrated S+G model showed only an 8% reduction. Conversely, KMG’s implementation of ESG principles in the social and governance responsibility components shows a greater impact on reducing atmospheric emissions – 55% versus 22% for component E. The results are consistent with the findings of the IOGP Energy Efficiency Expert Group, which found that leading global companies such as BP, ExxonMobil and Shell are actively implementing various strategies to improve energy efficiency by investing in new technologies and innovations [15,101]. Clearly, KPO faces limitations in funding and access to modern foreign technologies, which may limit flexibility in applying international practices and technologies used in Western companies.
The overall conclusion indicates that the hypothesis put forward in the study has thus been tested and confirmed: the use of ESG principles in companies’ activities contributes to the reduction of air pollution.
5. Suggestions for Improving the ESG Strategy for Reducing Atmospheric Emissions
The econometric analysis identified key ESG factors in the performance of oil and gas companies that contribute to addressing the important issue of maintaining air quality in the context of global climate commitments.
An empirical analysis of environmental, social, and governance (ESG) performance indicators yielded findings relevant to management recommendations. According to the analysis of the Environmental component, the relationship between energy consumption (X₈), the number of environmental deviations (X₁₆), and greenhouse gas emissions is direct, while water use (X₁₁) has an inverse effect: more efficient water use is associated with reduced emissions.
Hazardous waste disposal (X₁₃) shows a small but positive effect, consistent with the growth of industrial production and the need for efficient waste management. Such findings are confirmed by international studies: for example, [102] found that reducing water losses and introducing energy-saving technologies significantly reduce GHG emissions in water supply and sanitation systems. The work [103] highlights the high energy costs of wastewater treatment processes, particularly aeration, and points to a direct link between reduced energy consumption and reduced emissions. Based on the model data and similar international studies, the following management recommendations can be formulated:
Implement programs to improve energy efficiency at enterprises, paying particular attention to areas with the highest consumption (e.g., resource provision, production, waste disposal). An important area is improving the rational use of water resources and improving wastewater treatment methods as part of sustainable development policies, which simultaneously reduce emissions and save resources. Now KPO is taking steps to improve energy efficiency, most notably through an innovative high-pressure gas re-injection system, which not only increases production volumes but also minimizes environmental impacts by achieving 99.94% associated gas utilization. To effectively manage waste at KPO in accordance with GRI standards, it is proposed to integrate AI-based waste monitoring systems with other corporate management systems, such as Enterprise Resource Planning (ERP) and supply chain management systems [104]. This will provide a more comprehensive understanding of the environmental impact of operations and improve reporting according to GRI standards. Furthermore, the use of Artificial Intelligence (AI) to analyze waste data will enable waste volume forecasting and the development of waste minimization strategies.
Continue improving the atmospheric air monitoring systems as part of the region’s ESG strategy. As noted above, the system for industrial environmental monitoring of industrial emissions at KPO facilities is ongoing. Furthermore, it should be noted that the region has currently established a regional geoportal developed within the framework of the national scientific program, which serves as a key platform for integrating real-time environmental data into decision-making processes [105]. In addition, within the framework of the scientific program for Western Kazakhstan, a methodology for comparing Sentinel-5P/TROPOMI data and ground-based measurements was developed [106]. The patterns of formation of atmospheric air pollution at various levels in the region were studied based on an analysis of the features of the formation of the atmospheric mixing layer in the region under consideration, as well as scenarios for changes in atmospheric air quality. In the context of Compliance with Environmental Regulations, conducting further systematic research at the KPO will help identify patterns in the distribution of pollutants in the atmospheric boundary layer and create a modern pollutant database using GIS technologies, allowing for the prediction of atmospheric air quality, taking into account the socio-economic development of the region. The results obtained can serve as a basis for subsequent modeling based on best international practices for the future.
To establish the objective impact of the deposit on biotic communities and agrocenoses, it is necessary to conduct comprehensive in-depth monitoring studies using GIS technologies. Current climate change trends require more frequent biodiversity monitoring in areas where oil and gas operations operate. Unlike the approach used at KPO, where satellite imagery is conducted once every ten years, it is recommended to conduct such surveys more frequently. Although the company has developed regulatory actions for sensitive coastal ecosystems and created a database of flora and fauna species, analysis has shown that the data has not yet been systematized, and the results are unclear. At the same time, there is study, the results of which showed a high level of impact on living organisms [107]. Modern remote sensing technologies, including hyperspectral imaging and machine learning algorithms, allow for more accurate and effective analysis of ecosystem and biodiversity status, further necessitating more frequent surveys.
The data obtained for the assessment of the Social component is in harmonious agreement with global scientific research devoted to issues of social responsibility and sustainable development.
Considering that there is still no practical use of renewable energy sources at KPO and no significant investments in renewable energy sources are planned, it is proposed to increase funding for RES. The negative value of the coefficient for the variable X₇ indicates a genuine impact of the move towards a low-carbon economy, which is noticeable even with a small increase in the volume of “green” investments in total capital investments.
As numerous studies show [34,36,108,109,110], increasing funding for renewable energy sources stimulates the restructuring of production processes, the introduction of resource-saving technologies and the reduction of greenhouse gas emissions by companies. Thus, PwC, among the key trends influencing global oil and gas production, emphasizes the importance of switching to renewable energy sources to reduce atmospheric emissions. Therefore, companies must balance traditional operations with increasing investment in low-carbon technologies. In the context of increasing investment in renewable energy sources, biogas production from agricultural raw materials in the West Kazakhstan region (the total volume of agricultural waste in the West Kazakhstan region was 162,200 tons per year) at KPO appears entirely feasible, given the availability of suitable resources and the growing interest in renewable energy sources. This will provide economic benefits by complementing existing energy sources and reducing the region’s dependence on electricity imports from Russia.
In terms of the Governance component, it is recommended to increase the representation of women among the organization’s employees, since the impact of the social aspect - the representation of women among KPO employees - demonstrates a significant and inverse correlation. An analysis of the application of ESG principles [111,112], according to scientific data [113,114,115], shows that women’s participation in corporate governance and decision-making increases attention to environmental issues, stimulates the creation of an ethical management style and optimizes resource consumption. This indicates that gender diversity can be considered not only as an important social factor, but also as a significant element influencing environmental stability.
Furthermore, the inverse relationship between the size of tax payments and the level of pollution obtained in the study demonstrates that financial honesty and transparency are key indicators of business environmental awareness. The negative value of the coefficient for the tax payments indicator (−0.5298) indicates that further improvement of corporate governance and openness of the information provided is necessary. This finding is consistent with a number of studies that show that financial integrity and transparency have a positive impact on emissions reduction, while non-compliance with business ethics standards is associated with increased environmental threats and deterioration in the performance of internal control systems. This trend is supported by studies [116,117,118,119,120,121] (indicating that ineffective corporate governance and limited information transparency exacerbate carbon footprints and negatively impact organizational image. Emissions and corporate ethics are interrelated in the context of ESG analysis, where compliance with ethical standards and emission reduction are key factors for achieving sustainable development and enhancing a company’s reputation. This is consistent with the principles of good governance, according to which compliance with tax legislation is a sign of maturity of management practices, accountability and a high level of trust in institutions.
Research shows that companies with high levels of emissions often experience downgrades to their ESG scores. This is because pollutant emissions can be perceived as a breach of social and environmental responsibility, negatively impacting the company’s reputation and sustainability scores [122]. Research by the OECD (2023) and the World Economic Forum (2023) [117] highlights the link between tax transparency and sustainable business development, as organizations operating within the legal framework are more likely to invest in emission reduction technologies and publish ESG reports.
Companies that engage in ethical violations typically have little interest in implementing environmental responsibility measures and sustainable development strategies. Violations of corporate ethics, such as insufficient transparency in emissions reporting or disregard for environmental regulations, can lead to legal consequences and fines. This can also impact the company’s perception among investors and consumers, which in turn affects its ESG ratings.
6. Discussion
In summary, this research primarily contributes by articulating how ESG performance impacts emissions reduction and decarbonization in the oil and gas industry. ESG will undoubtedly be a focus for many energy companies’ future strategies. Further research should expand the scope to include various production types and geographic locations. Studying diverse production sectors will provide a holistic understanding of how ESG performance impacts emissions reduction across different operational contexts.
The study presents a systematic analysis of the effectiveness of ESG strategies for reducing emissions and their relationship to the socioeconomic aspects of the region, enabling the proposal of effective solutions tailored to local realities. The hypothesis that implementing ESG principles in company operations contributes to reducing regional air pollution has been confirmed. Using KPO as a case study, this paper analyzes for the first time the impact of ESG initiatives in Kazakhstan’s oil and gas industry within the context of spatial pollution distribution, comparing these indicators with international trends. This choice is justified by KPO being one of the largest emitters in the country and among the first in Kazakhstan to implement ESG principles.
Our study features a comparative analysis of the company’s air emissions with regional data from KazHydromet, enabling assessment of the company’s actual results against its regional impact. A key scientific contribution is the comparative evaluation of KPO’s emissions reduction efforts with those of leading global and Kazakhstani oil and gas companies, alongside recommendations for reducing emissions based on economic and geospatial conditions.
The study highlights the interdependence of technological and social aspects in transitioning to a low-carbon economy, confirming the importance of integrating environmental and social elements of ESG into a unified strategic sustainability planning system. This approach helps mitigate both reputational damage and negative environmental impacts.
Analysis of the obtained results indicates that to reduce their carbon footprint, companies should: increase funding for RES and energy efficiency technologies; improve ESG management by implementing equitable corporate practices and supporting women’s leadership in environmental projects; and incorporate social and environmental criteria into company and regional development plans to achieve emissions reductions and ensure long-term progress.
Unlike leading global oil and gas companies, KPO currently has no practical RES implementation and has announced no immediate plans for significant renewable energy investment. For example, companies like Shell, Eni S.p.A and BP are actively investing in renewable technologies [123,124]. BP has announced intentions to reduce fossil fuel dependence and increase renewable energy investment, resulting in improved environmental performance, operational efficiency, and financial results [67]. The authors [125] emphasize that European governments can enhance green technology innovation through increased investment. China is also actively developing green finance, with green loans reaching approximately $3.94 trillion as of 2023 [77].
Financing constraints may impede implementation of proposed measures. However, governments can play a key role in stimulating ESG adoption through various mechanisms, including taxes, subsidies, and public procurement. Tax incentives for companies actively implementing ESG practices and subsidies can significantly assist ESG initiatives. Additional financial resources include grants from international institutions like the EBRD, which actively supports sustainable development projects [126,127].
Comparative analysis revealed that for training employees in emission-reduction technologies, KPO could adopt Shell’s approach of collaborating with Udacity for digital AI training, which helps optimize processes and reduce carbon footprint [128].
Women’s representation on KPO’s board does not exceed 33-40%. Analysis of successful gender equality practices at international companies and this study’s results demonstrate that gender diversity in management improves carbon disclosure. Women in leadership positions tend to be more open to environmentally friendly practices and more sensitive to sustainability issues [114]. Other studies indicate that having at least three women on boards significantly enhances environmental decision-making and reduces CO2 emissions, attributed to women’s higher moral sensitivity and greater support for environmental initiatives [115].
The Governance component findings are valuable for improving sustainability management strategies in both corporate and government contexts. The identified correlation between ethical standard non-compliance and increased emissions underscores the importance of strengthening compliance measures, establishing internal control functions, and developing corporate social responsibility policies. When assessing ESG indicators and developing government incentive programs, tax compliance should be considered as evidence of responsible business conduct. The study confirms that effective corporate governance directly impacts environmental awareness, necessitating a shift from formal ESG declarations to comprehensive management tools promoting responsibility and transparency.
To improve corporate governance and attract investment, introducing mandatory standardized ESG reporting according to GRI in Kazakhstan will enable companies to better assess and report their environmental, social, and governance impacts. This will contribute to more sustainable business development and enhanced international competitiveness [129,130]. As noted, the absence of unified perspectives on S and G components creates analytical and comparative assessment challenges.
Several approaches to unifying S and G reporting exist, based on current ESG trends and recommendations. One approach involves developing unified standards using international frameworks like GRI and SASB, which already offer disclosure frameworks [131]. Another approach integrates ESG into corporate strategies while leveraging technologies like AI and data analytics [132].
Further research on pollutant emissions and their environmental impact in the region could explore several key areas. In-depth monitoring studies are needed to establish the objective impact of KPO operations on biotic communities and agrocenoses. Comprehensive regional environmental assessment requires not only ground-based methods but also modern geospatial and aerospace technologies enabling dynamic assessment, modeling, and forecasting based on global best practices. In-depth analysis of spatiotemporal CO₂, PM2.5, and SO₂ emission dynamics using high-precision modeling methods that account for spatiotemporal changes and economic factors is essential. Developing models evaluating pollution reduction mechanism effectiveness, such as carbon taxation and renewable energy incentives, is equally important.
The study encountered limitations related to varying time periods in company sustainability reports, resulting in 2019-2023 being the most acceptable uniform period for all five companies. Furthermore, GRI standards were implemented in different years for each company, and integrated reporting requirements within ESG frameworks remain under development. It should be noted that sustainability reports lack rigid structural regulations, allowing companies freedom in data presentation formats.
The models could not account for variables such as production volume changes, oil and gas price fluctuations, government regulations (e.g., emission quotas), and technological changes (e.g., new equipment purchases), as these data were not fully available across all companies. Current ESG business practice generally shows that E criteria requirements are standardized, while no unified perspective exists for S and G indicators, undoubtedly creating difficulties in their analysis, comparative assessment, and interpretation.
7. Conclusions
- This article presents a relevant study on implementing ESG strategies to reduce emissions in an industrial region of Kazakhstan. The study focuses on the Karachaganak oil and gas condensate field, selected because spatial analysis identified it as a primary source of atmospheric pollution in the region. To ensure systematic and objective analysis, KPO’s indicators, along with its plans for achieving sustainable development goals, key trends, and ESG implementation challenges, were benchmarked against leading global oil and gas companies—Shell, Eni S.p.A., BP—and the Kazakh company KMG. This comparative approach aligns with current trends in international research.
- This paper proposes a novel methodology for assessing ESG initiatives in Kazakhstan’s oil and gas industry. Its contribution lies in developing a comprehensive approach to ESG emission analysis that incorporates the spatial distribution of emission sources. The study holds practical significance by examining the oil and gas sector—a cornerstone of the national economy—and evaluating the impact of ESG initiatives on air pollution reduction. Implementing a tailored ESG strategy in the region represents a promising pathway for effective emission reduction, decarbonization, sustainable natural resource management, and the transition to a green economy. The paper provides specific recommendations for oil and gas companies to reduce atmospheric emissions.
- Econometric modeling was employed to identify relationships between ESG indicators and air pollution reduction. A piecewise approach was used to isolate key factors influencing emission reductions. Integrating all factors into a single model revealed the dominant influence of environmental factors. Consequently, following methodologies in similar studies, social and governance factors were integrated into a combined model, while environmental factors were assessed independently. Correlation and regression analysis demonstrated a strong relationship between emission volumes and specific E-factors (Total Energy Consumption, Water Usage, Hazardous Waste Disposal, Compliance with Environmental Regulations), S-factors (Investments in Renewable Energy, Gender Representation), and G-factors (Corporate Ethics as measured by Code of Conduct violations, Tax Compliance).
- Compared to KPO, the other companies studied have a longer history of ESG implementation, which is reflected in the modeling results. In the integrated S+G model for these companies, these factors contribute significantly more to emission reductions than at KPO b.v. This indicates that ESG principles hold substantial potential to help countries meet their commitments under the Paris Agreement. Furthermore, in contexts where environmental factors—despite their dominant role—face limitations (technological, financial, or geographical), robust social and governance criteria can significantly contribute to achieving decarbonization targets.
- A significant finding of our study is the constraint posed by the limited ESG information base. Although oil and gas companies generally demonstrate high transparency and can be considered highly accountable, their sustainability reports vary considerably in content and reported indicators. Established practice in Sustainability Development Reporting (SDR) for oil and gas and other High-Polluting Enterprises (HPE) shows that Environmental (E) criteria are standardized, with data comparable across reporting periods, units of measurement, and calculation methodologies (e.g., greenhouse gas emissions, net carbon intensity, energy intensity, waste disposal). In contrast, no unified framework exists for Social (S) and Governance (G) indicators, creating substantial difficulties in their analysis, comparative assessment, and interpretation.
- The experience of KPO can be extrapolated to other countries, as oil and gas companies globally face similar challenges related to air pollution. The study’s findings provide compelling evidence to support further research into implementing ESG strategies for air pollution reduction, not only in Kazakhstan but also in other oil and gas producing regions worldwide.
Author Contributions
Ainagul Adambekova: methodology, formal analysis, econometric modeling and statistical analysis, writing—review and editing; Saken Kozhagulov: conceptualization, methodology, formal analysis, validation, writing—original draft preparation; Vitaliy Salnikov: conceptualization; Jose Karlos Quadrado: methodology, supervision; Svetlana Polyakova: formal analysis, validation; Rassima Salimbayeva: validation; Aina Rysmagambetova: software; Gulnur Musralinova: data curation; Ainur Tanybayeva: data curation.All authors have read and agreed to the published version of the manuscript.
Acknowledgments
The authors would like to thank the anonymous reviewers and the editorial board of the journal for constructive comments, suggestions, and recommendations on the earlier version of the manuscript.
Conflicts of Interest
The authors declare that they have no known competing financial interests or personal relationships that could have appeared to influence the work reported in this paper.
Appendix A. Environmental, Social and Corporate Responsibility Indicators Derived from Sustainability Reports and Annual Reports of Oil and Gas Companies
| № | Environmental | Social | Governance |
| 1 | Volume of GHGs burned in flares, mil.t CO2 equivalent | Occupational Safety count of accidents (LRIT)per 1 million hours | Board Structure (Proportion of women),% |
| 2 | Carbon Footprint Reduction = net carbon intensity,gCO2e/MJ | Fatal accident rate (FAR), Number per 100 million hours | Transparency and Anti-Corruption Policy (Code of Conduct violations), count |
| 3 | GHG intensities, Tonne CO2e/tonne production | Training and Development, H | Corporate Ethics (Code of Conduct violations), count |
| 4 | Methane emissions, thousands t | Total Social Investments, mil. USD | Share of Economic diversification in Local development investments ,% |
| 5 | Methane intensity,% | Environmental investment, mil USD | Total amount of goods, works and services of local content, mil. USD |
| 6 | Sulphur oxides (SOx), thousand t | Investments in Biodiversity Conservation,mil.USD | Taxes,bil.USD |
| 7 | Nitrogen oxides (NOx), thousand t. | Renewable Energy Investments (Low carbon development), mil.USD | Human Resource Management (employees level of staff turnover),% |
| 8 | Total energy consumption, (millions of GJ) | Diversity and Inclusion (women in the company), % | Supplier engagement (suppliers with criticalities/areas for improvement),count |
| 9 | Energy efficiency, GJ/t | Human Rights -reports to the Global Helpline, count | Stakeholder Management System, grievances, count |
| 10 | Volume of production, thousand t | Employee Satisfaction,% | Sustainability Strategy SDGs (the overall weight of the sustainability goals),% |
| 11 | Water Usage, Million m3 | Number of employees,count | |
| 12 | Total Waste Disposal, thousand t. | ||
| 13 | Hazardous Waste disposal,thousand t. | ||
| 14 | Non-hazardous waste disposal, thousand t | ||
| 15 | Oil Spills and Environmental Incidents, volume,thousand t./count | ||
| 16 | Compliance with Environmental Regulations, count |
Appendix B. RW+Drift Forecasting of GHG Emissions (mil.t CO2 Equivalent) Taking Into Account the Impact of Factors Demonstrating the Environmental Responsibility of Oil and Gas Companies
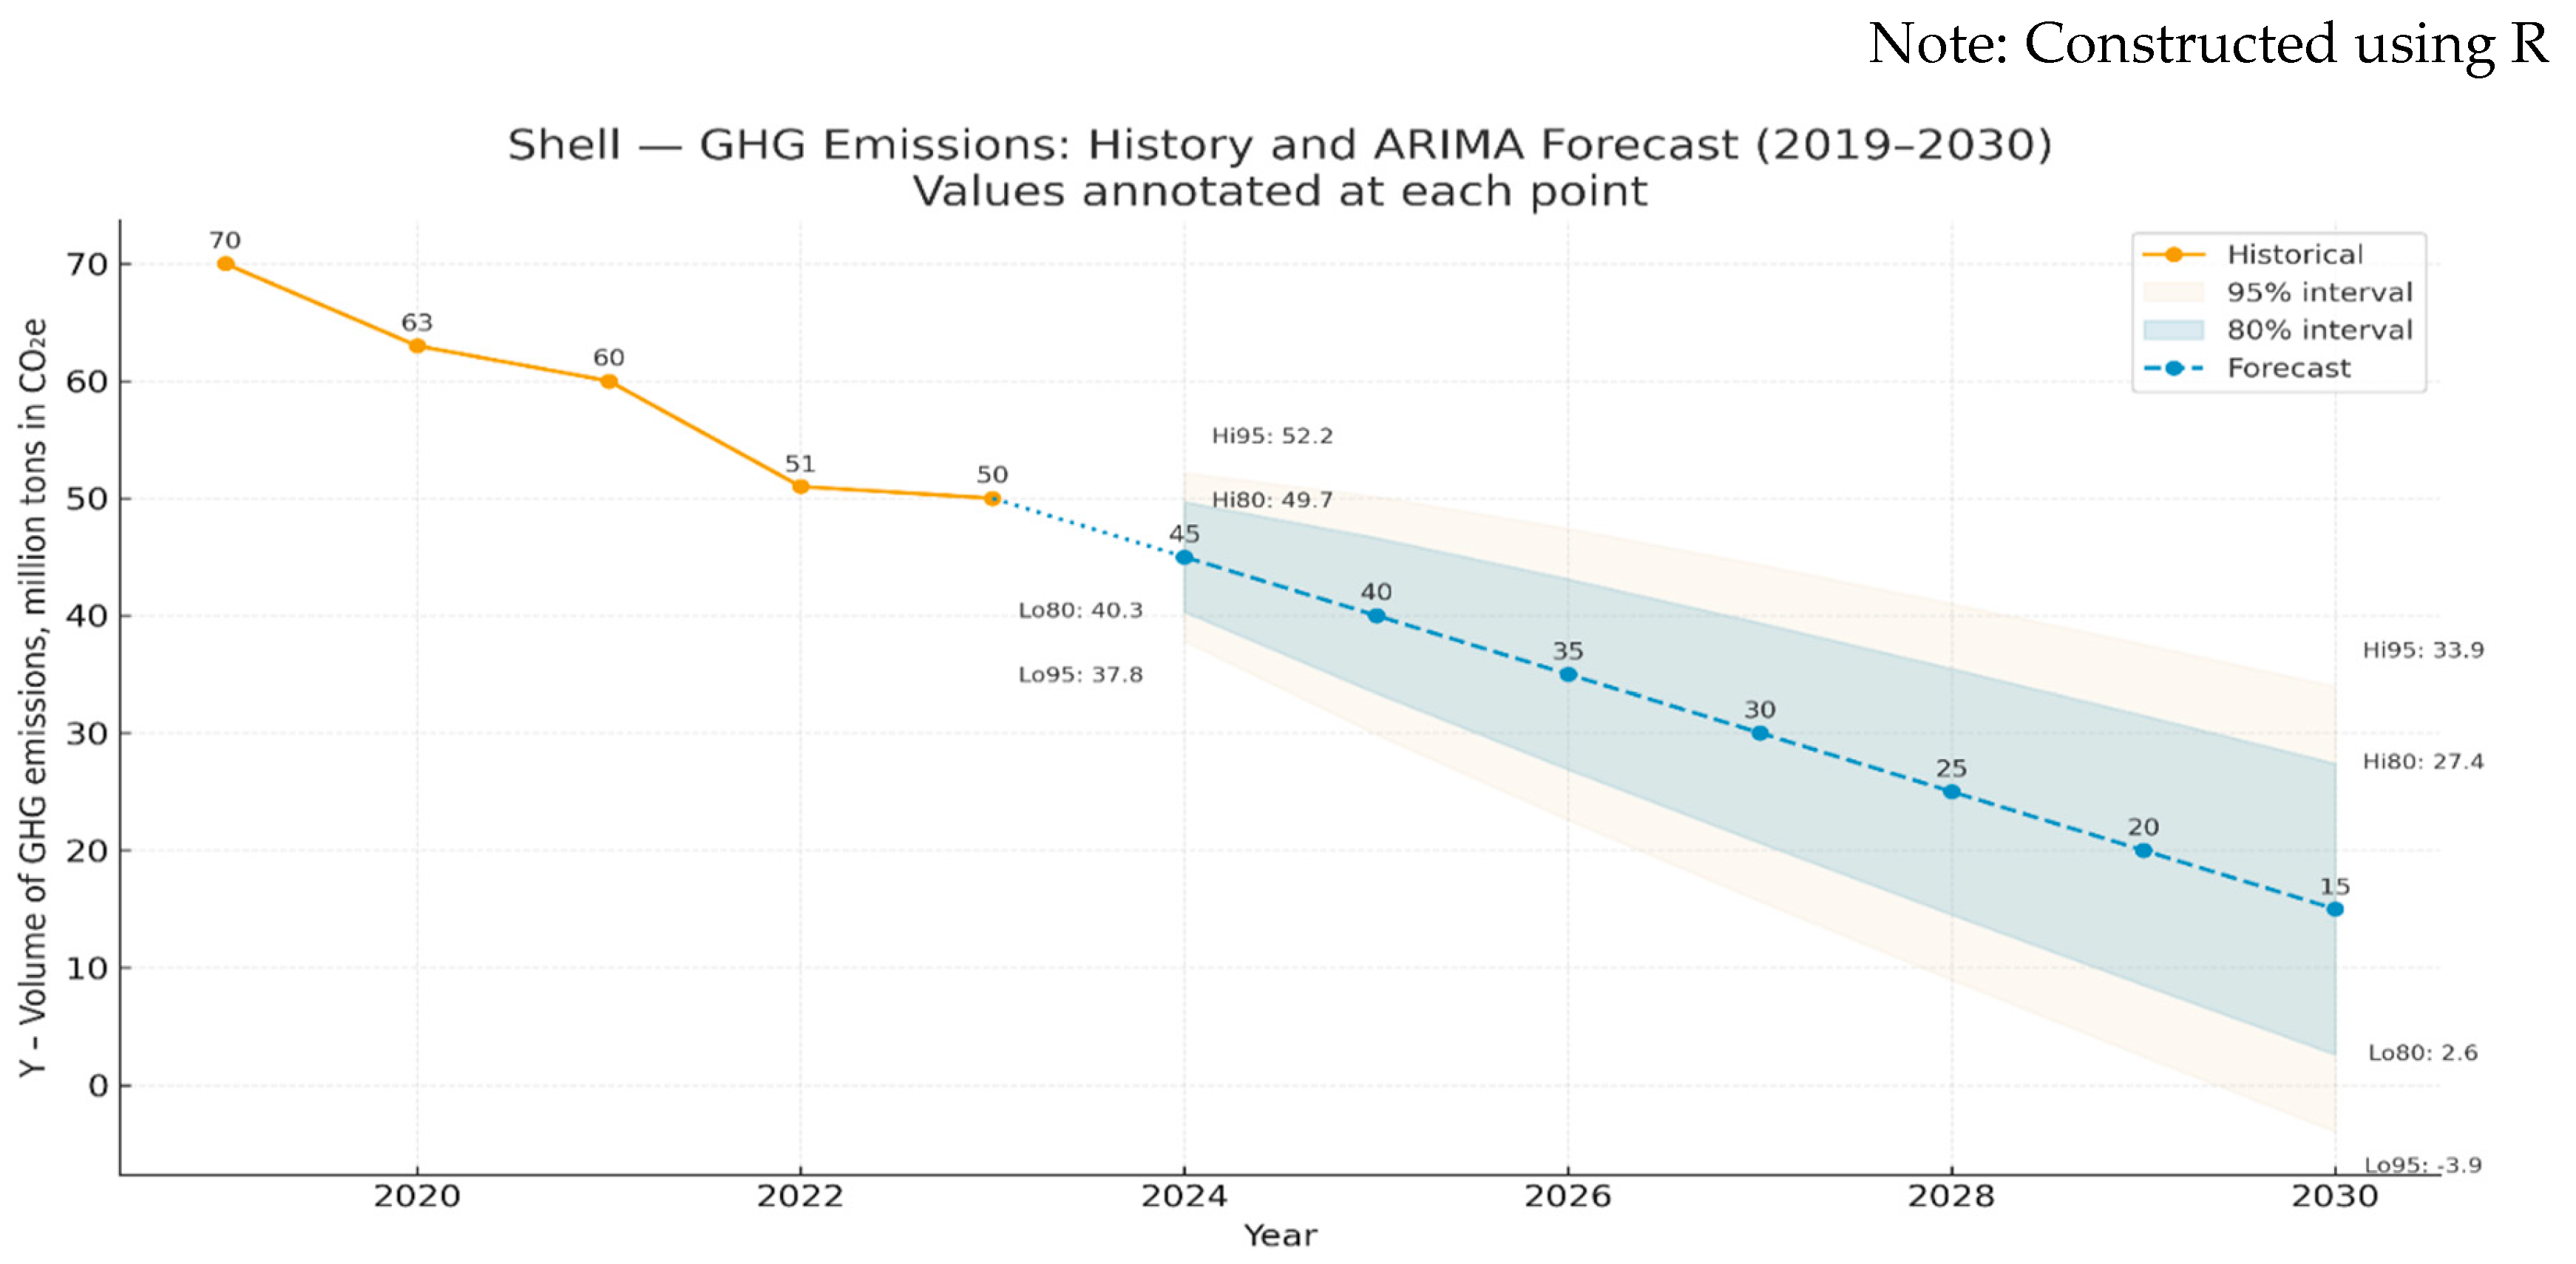
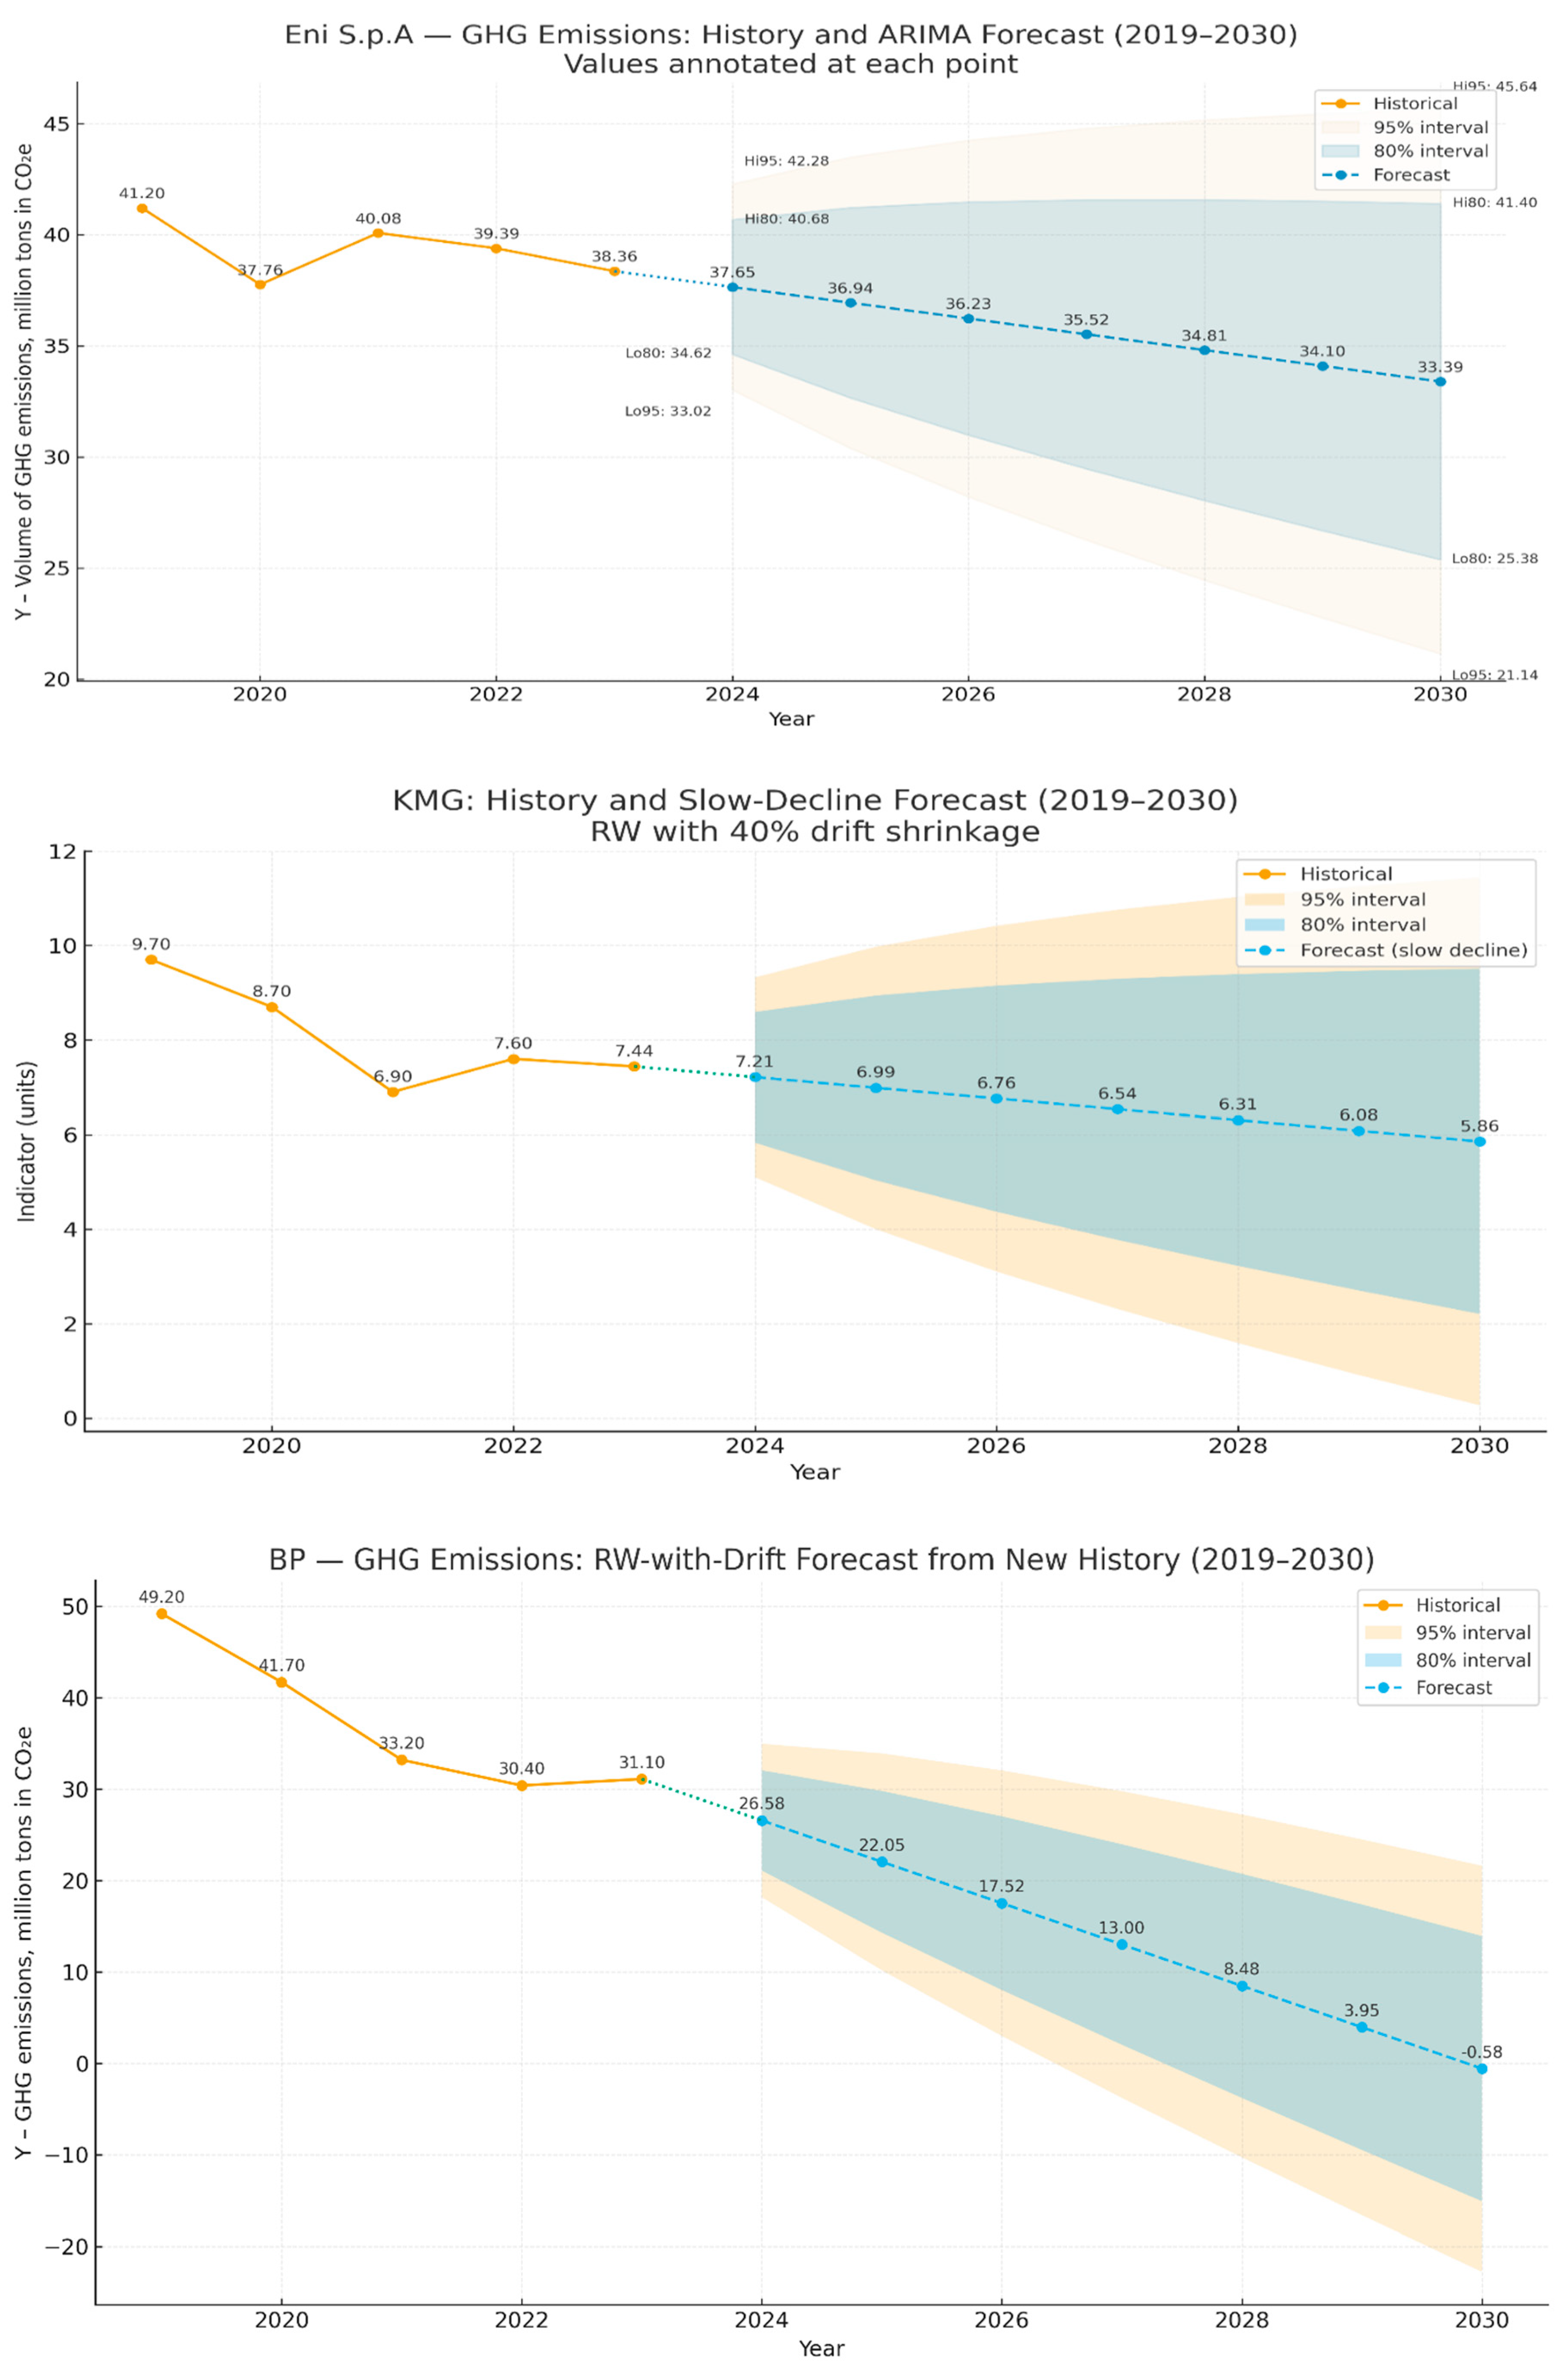
Appendix C. Results of Forecasting GHG Emissions (mil.t CO2 Equivalent) Into the Atmosphere Based on the Integrated S+G Model for: Shell, EniS.p.A, KMG, BP
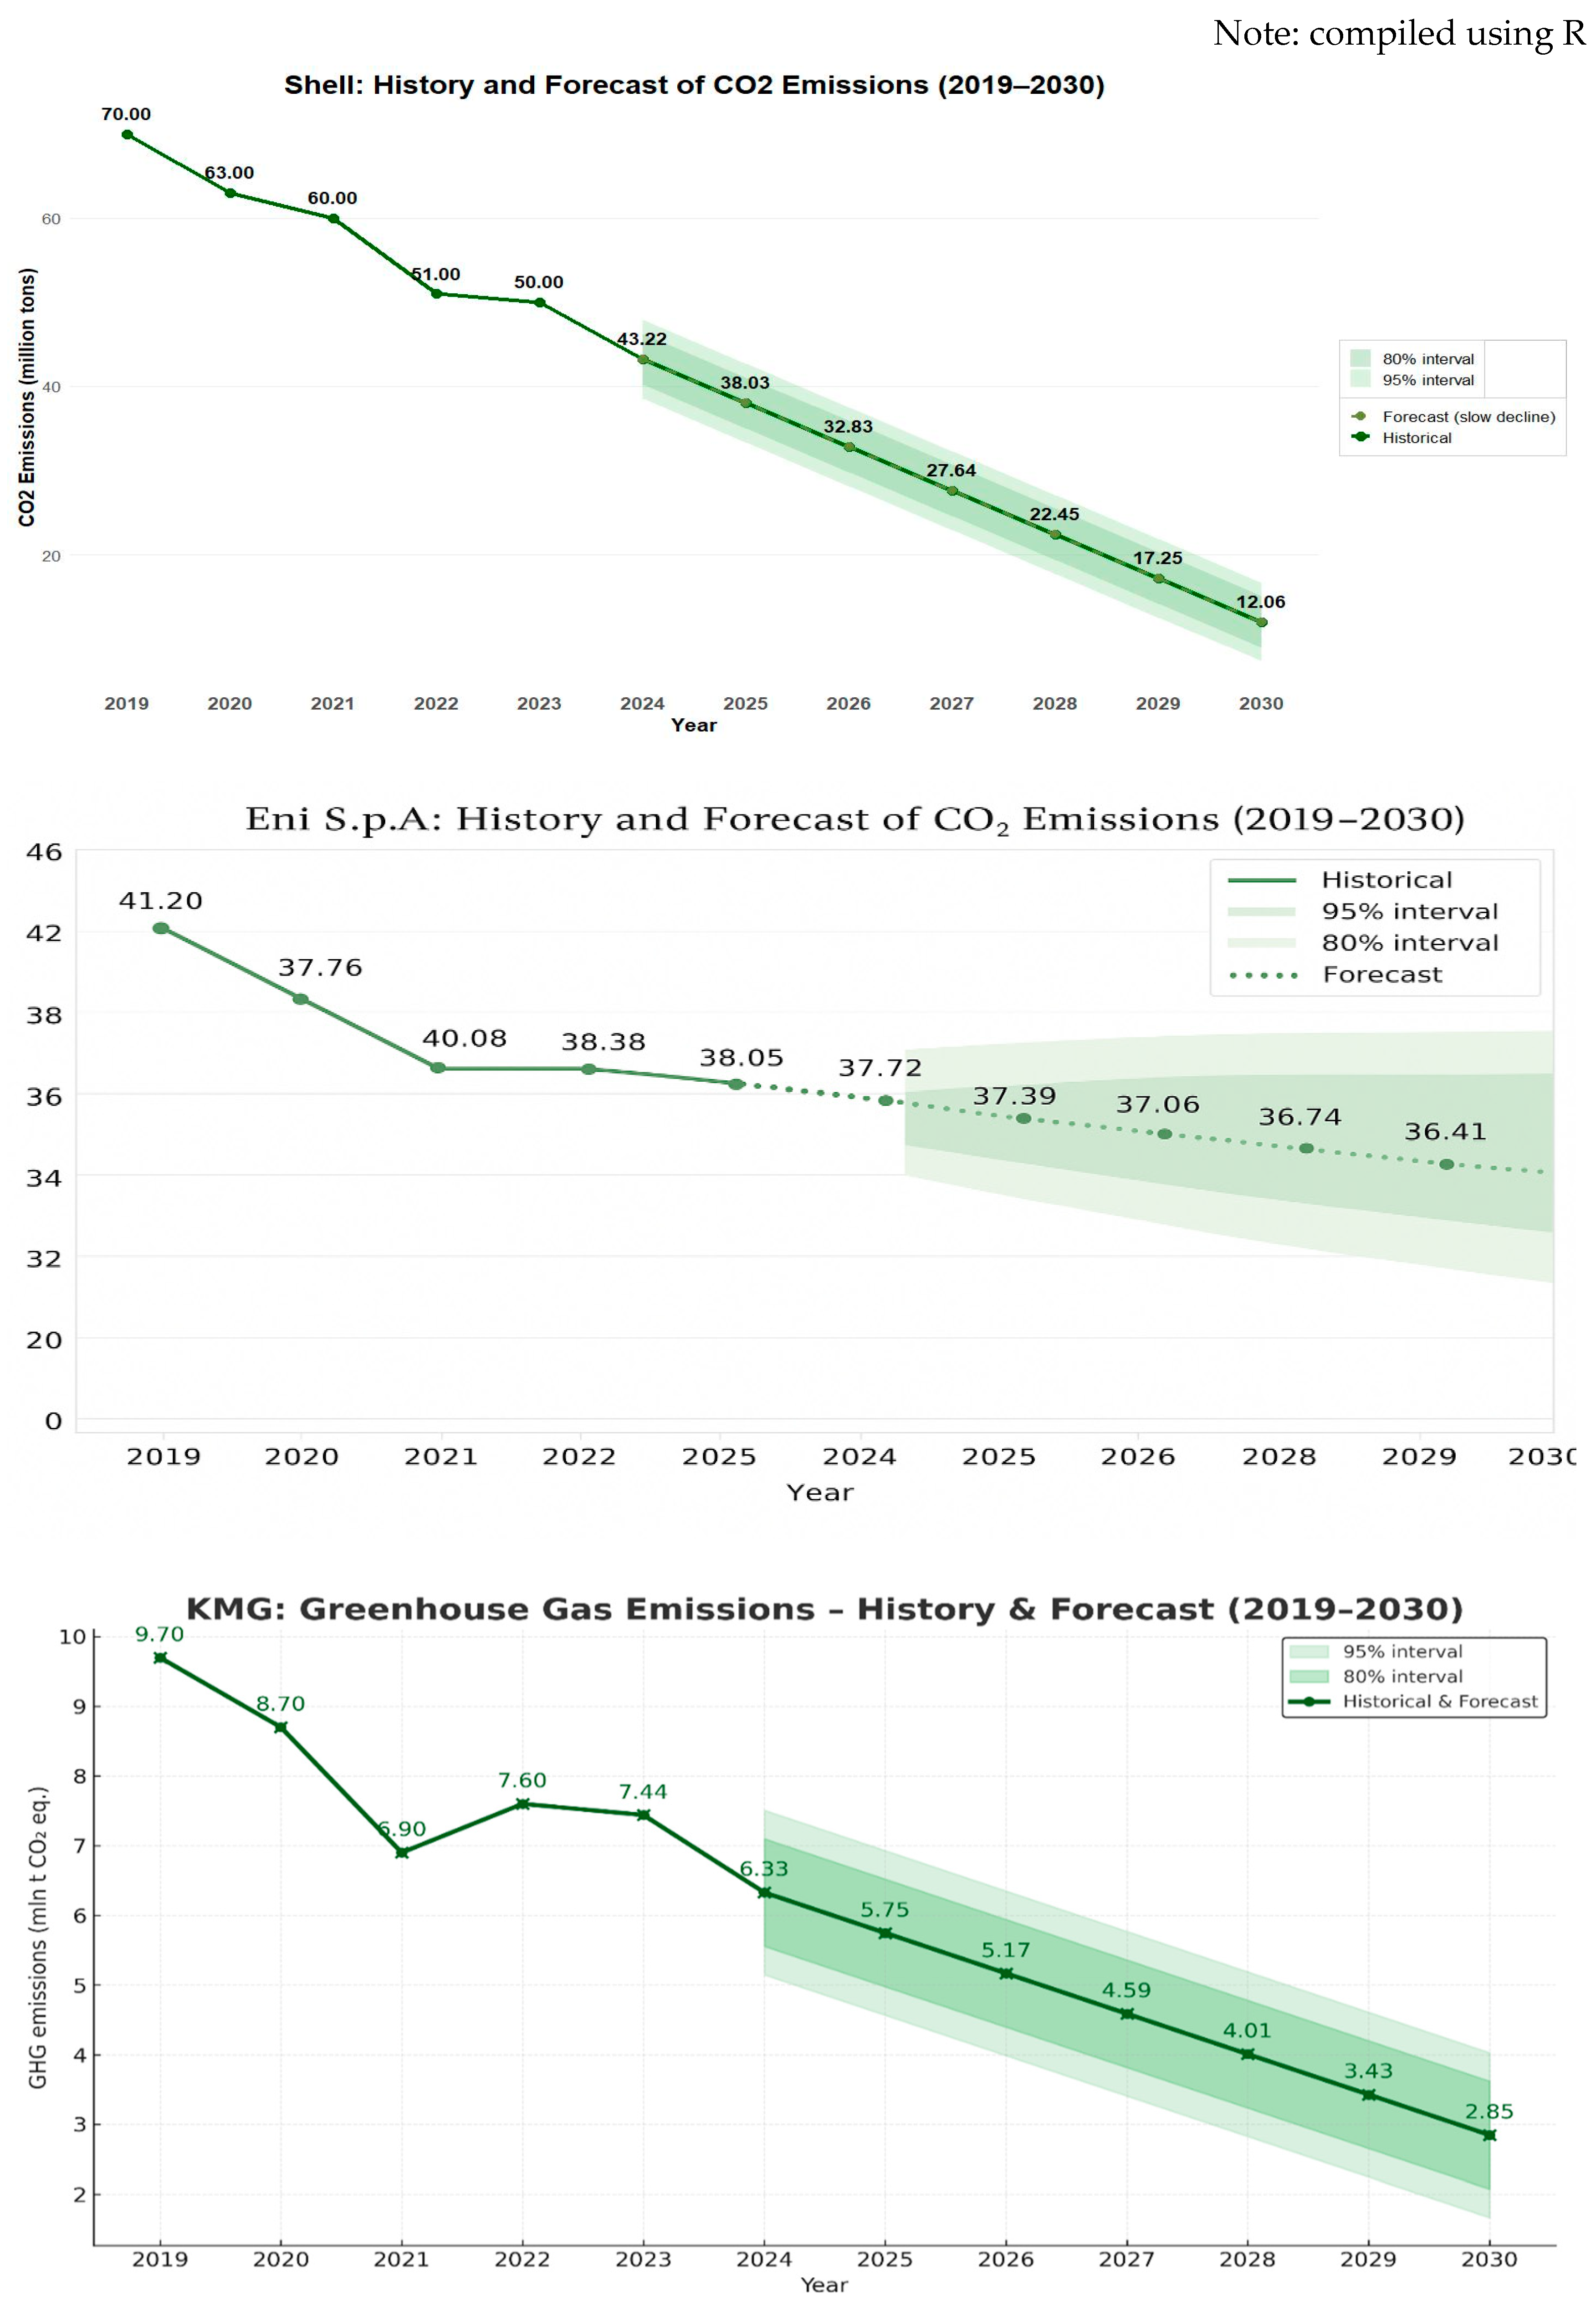
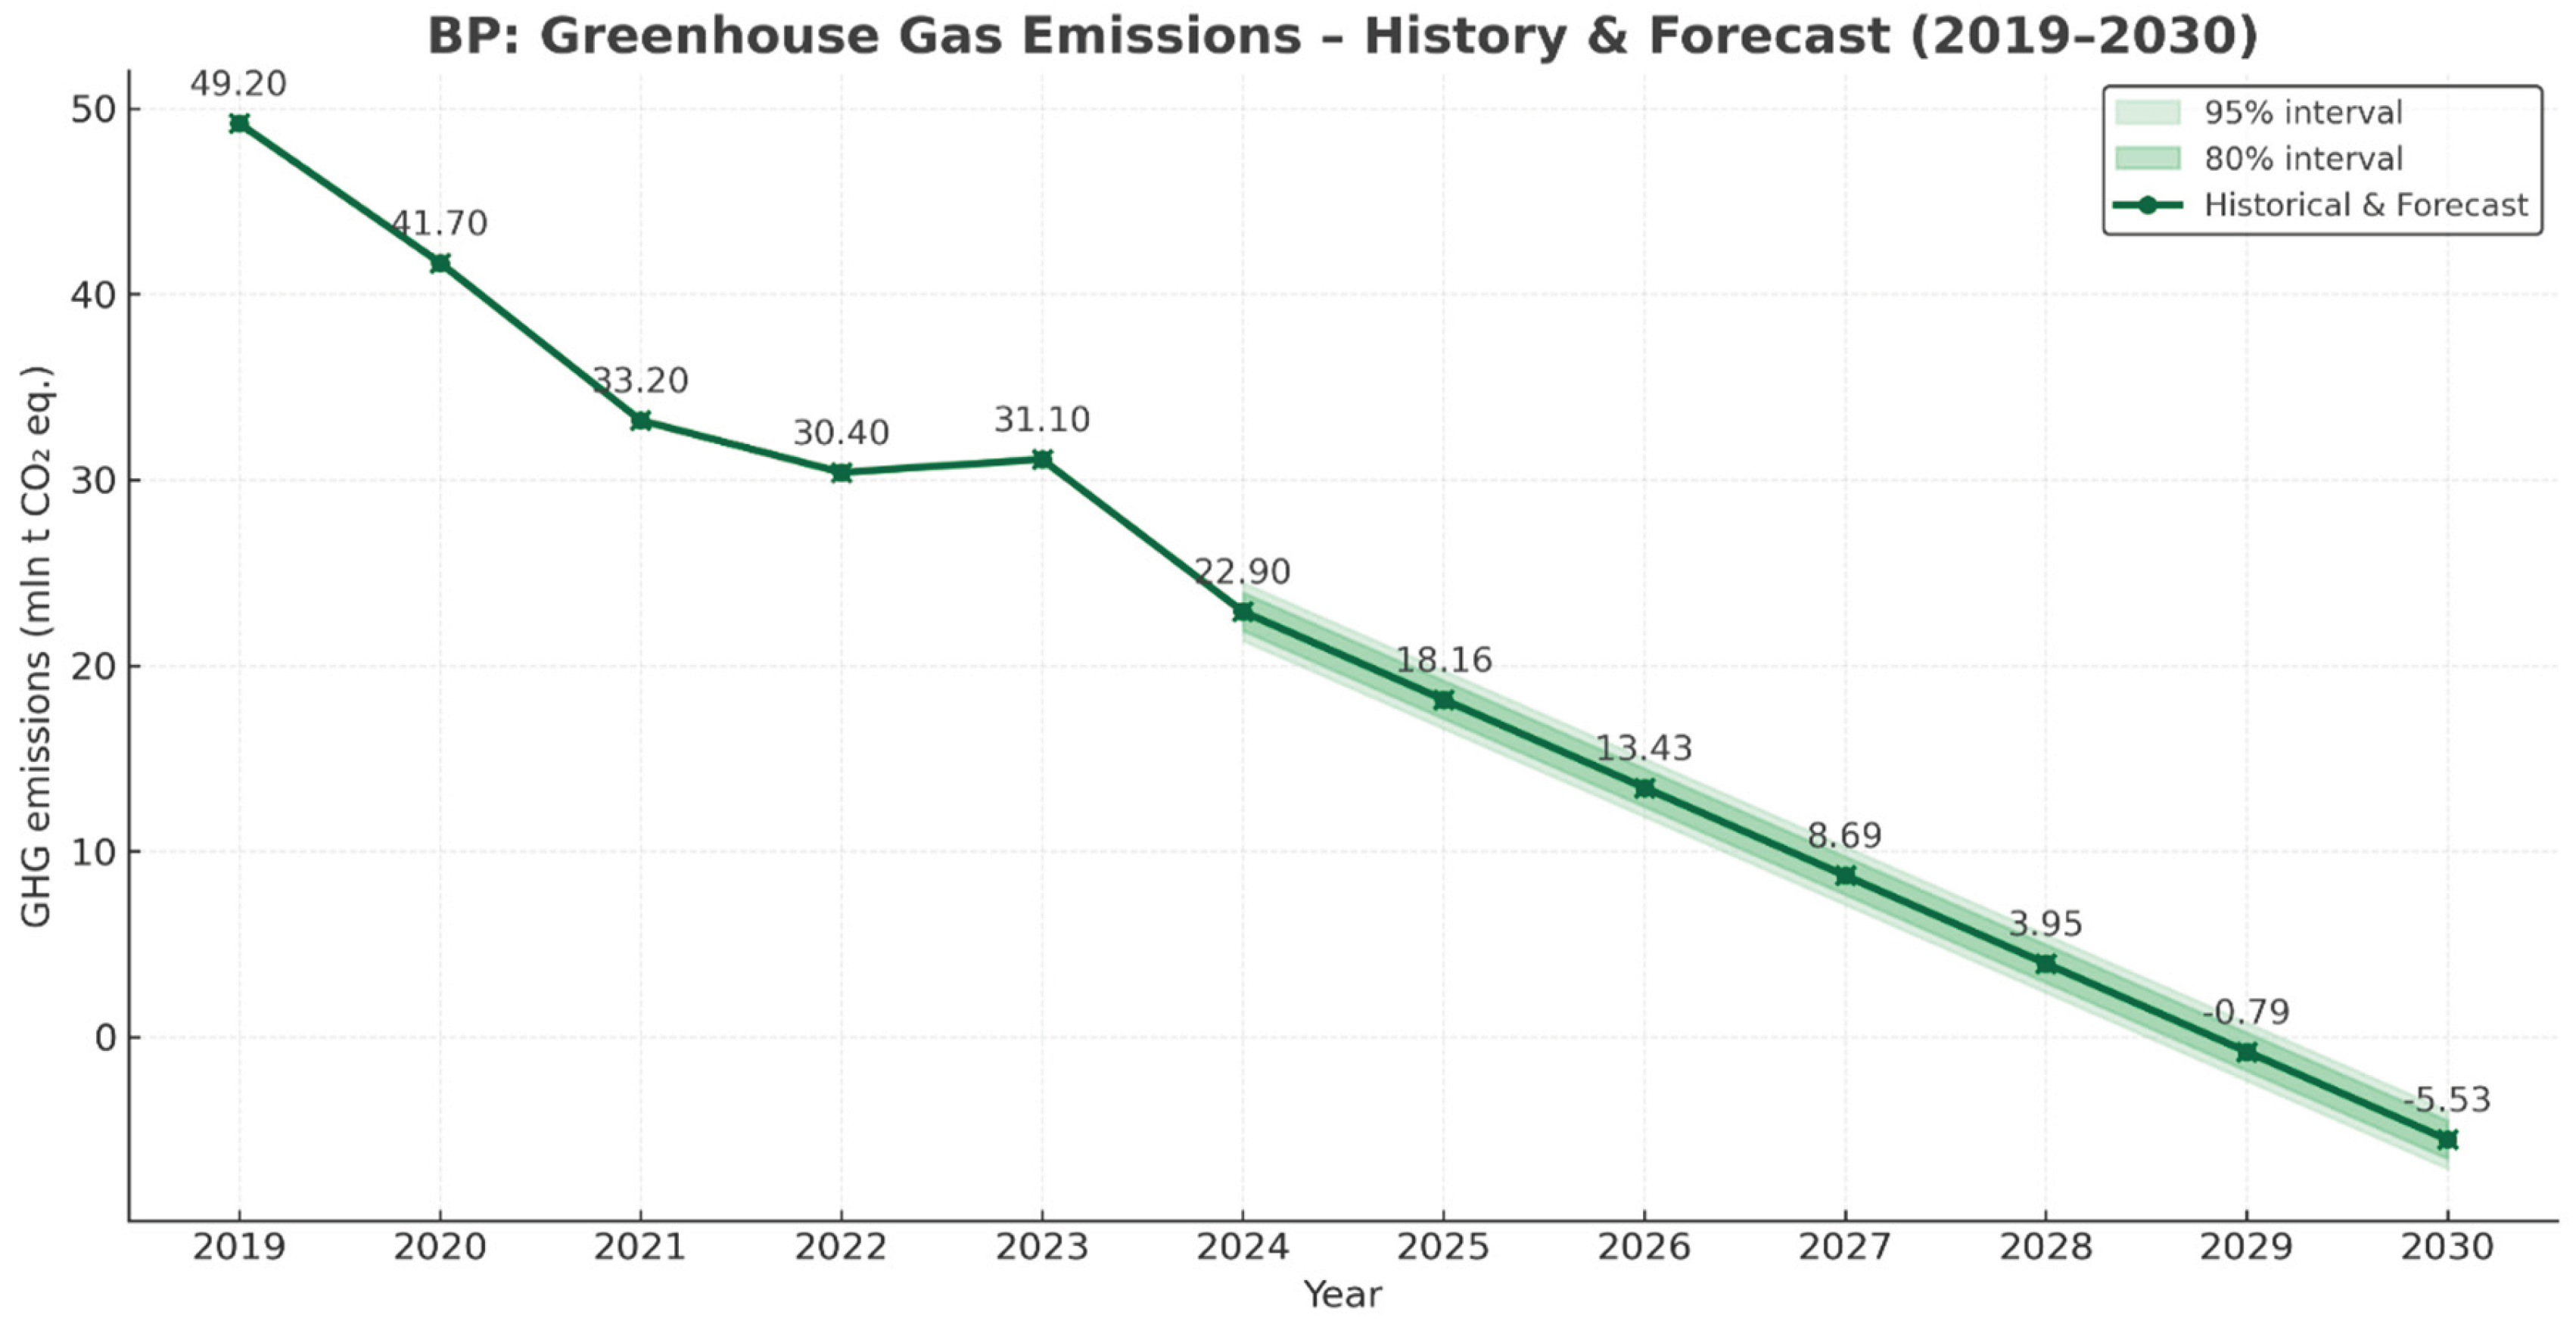
References
- Coccia, M. New directions of technologies pointing the way to a sustainable global society. Sustainable. Futures 2023, 5, 100114. [Google Scholar] [CrossRef]
- Baur, D.G., & Todorova, N. Big oil in the transition or Green Paradox? A capital market approach. Energy Econonomics, 2023, 125, 106837. [CrossRef]
- Jackson, R. (2023). Global carbon emissions from fossil fuels reached record high in 2023. Univ. Exet. Stanford Doerr Sch. Sustain. Available online:https://sustainability.stanford.edu/news/global-carbon-emissions-fossil-fuels-reached-record-high-2023.
- Sala, S., Ciuffo, B., Nijkamp, P.A systemic framework for sustainability assessment. Ecological economics, 2015, 119 (Suppl. C), 314–325. [CrossRef]
- Semenova, T.; Martínez Santoyo, J.Y. Economic Strategy for Developing the Oil Industry in Mexico by Incorporating Environmental Factors. Sustainability, 2024, 16, 36. [Google Scholar] [CrossRef]
- Adilet.zan.kz, 2023. The Strategy on Achieving Carbon Neutrality by 2060. URL: https://adilet.zan.kz/rus/docs/U2300000121 (accessed 13 September 2025).
- About, K.P.O. (n.d.). KPO. Available online: https://www.kpo.kz/en/about-kpo (accessed on 20 October 2025).
- Miles, L.D. (1972). Techniques of value analysis and engineering (2nd ed.). McGraw-Hill. ISBN 9780318165547, 0318165546.
- Adambekova, A.; Kozhagulov, S.; Quadrado JC, Salnikov V, Polyakova S, Tazhibayeva T, Ulman, A. Reduction of Atmosphere Pollution as the Basis of a Regional Circular Economy: Evidence from Kazakhstan. Sustainability 2025, 17, 2249. [CrossRef]
- Global Reporting Initiative Standards. Official Website. 2023. Available online: https://www.globalreporting.org/ (accessed on 20 October 2025).
- ISO 14001:2018; Environmental Management System. International Organization for Standardization: Geneva, Switzerland, 2018. Available online: https://www.greenwgroup.com/iso-140012018-environmental-management-system/ (accessed on 20 October 2025).
- ISO 50001:2018; Energy Management Systems. International Organization for Standardization: Geneva, Switzerland, 2018. Available online: https://www.bsigroup.com/ (accessed on 13.September.2025).
- ISO 26000: 7 Core subjects of Corporate Social Responsibility. Borealis. (2024,July2). Available online: https://www.boreal-is.com/blog/iso-26000-social- responsibility/ (accessed on 13 September2025).
- ISO 45001-2018; Occupational Health and Safety Management Systems—Requirements with Guidance for Use. International Organization for Standardization: Geneva, Switzerland, 2018. Available online: https://www.iso.org/ru/standard/63787.html/ (accessed on 13 September2025).
- IOGP (2024) International Association of Oil &Gas Producers Efficient use of energy in oil and gas upstream facilities. Available online: https://www.iogp.org/bookstore/product/efficient-use-of-energy-in-oil-and-gas-upstream-facilities/ (accessed on 13 September2025).
- Turbina, K.E.; Yurgens, I.Y. (Eds.) (2022). ESG-Transformatsiya kak Vektor Ustoychivogo Razvitiya; V treh tomah. [ESG transformation as a vector of sustainable development: in three volumes]Tom 2/Podobsh. Red; Izdatel’stvo Aspect Press: Moscow, Russia, 650p, ISBN 978-5-7567-1219-3. https://mgimo.ru/up load/2022/10/ (accessed on 23 October 2025). (In Russian).
- Bureau of National Statistics of the Republic of Kazakhstan. Available online: https://stat.gov.kz/ (accessed on 13 September 2025).
- Information bulletins on the state of the environment of the Republic of Kazakhstan. Available online: https://www.kazhydromet.kz/ru/ecology/ezhemesyachnyy-informacionnyy-byulleten-o-sostoyanii-okruzhayuschey-sredy (accessed on 13 September 2025).
- Air emissions - sustainability report, –.; KPO. Available online: https://www.kpo.kz/docs/sustainability_report_2023/024-vybrosy_v_atmosferu.php (accessed on 20 October 2025).
- Karachaganak Petroleum Operating, B.V. (2023). KPO ESG Report 2023. Available online: https://www.kpo.kz/en/sustainability (accessed on 20 October 2025).
- Shell. (2023). Sustainability report 2023. Available online: https://www.shell.com/sustainability/reporting-centre/reporting-centre-archive/ (accessed on day month year).
- Eni (n.d.). Eni for 2023 Sustainability Performance. Available online: https://www.eni.com/static/en-IT/infographics/eni-for-2023/home/ (accessed on 20 October 2025).
- KazMunayGas (2023). Оtchet po ustojchivomu razvitiyu 2023.(Sustainability Report 2023) Available online:. Available online: https://www.kmg.kz/ (accessed on 20 October 2025).
- BP (2023). Sustainability report 2023. Available online: https://www.bp.com/en/global/corporate/sustainability/sustainability-reporting.html (accessed on 20 October 2025).
- SoPact (n.d.). Sustainability Reporting Guidelines. Available online: https://www.sopact.com/guides/sdg-reporting (accessed on 20 October 2025).
- Emissions Database for Global Atmospheric Research, (.n.d.).; EDGAR Available online:. Available online: https://edgar.jrc.ec.europa.eu/ (accessed on 20 October 2025).
- UN News (2021). Air pollution is one of the main threats to humans and the planet. Available online: https://news.un.org/en/story/2021/09/1102467 (accessed on 23 October 2025).
- Howes, S.; Wyrwoll, P. (2012). Asia’s environmental problems: Common features, and possible solutions.
- In Zheng, L.; Chen, Z. (2023). Economic policy uncertainty and corporate ESG performance. Available at SSRN: https://doi.org/10.2139/ssrn.4552630.
- Allen, M.; Dube OP, Solecki W, Aragón-Durand F, Cramer W, Humphreys S,Kainuma, M. Special report: Global warming of 1.5 C. Intergovernmental Panel on Climate Change (IPCC), 2018, 677, 393. Cambridge University Press, Cambridge, UK and New York, NY, USA, pp. 49–92, Available online: https://www.ipcc.ch/site/assets/uploads/sites/2/2019/06/SR15_Full_Report_Low_Res.pdf.
- Pörtner, H.-O.; Roberts, D.C.; Tignor, M.; et al. (2022). Summary for policymakers. In Pörtner, H.-O., Roberts, D.C., Poloczanska, E.S., Mintenbeck, K., Alegría, A., Craig, M., Langsdorf, S., Löschke, S., Möller, V. & Okem A. (Eds.), Climate Change 2022: Impacts, Adaptation, and Vulnerability. Contribution of Working Group II to the Sixth Assessment Report of the Intergovernmental Panel on Climate Change (pp. 3–33). Cambridge University Press. Available online: https://doi.org/10.1017/9781009325844.001.
- Zickfeld, K.; MacIsaac, A.J.; Canadell, J.G.; et al. Net-zero approaches must consider Earth system impacts to achieve climate goals. Nat. Clim. Chang. 2023, 13, 1298–1305. [Google Scholar] [CrossRef]
- Tignor, M.; et al. (Eds.), Climate Change 2022: Impacts, Adaptation and Vulnerability. Contribution of Working Group II to the Sixth Assessment Report of the Intergovernmental Panel on Climate Change (pp. 3–3310). Cambridge University Press. https://doi.org/10.10179781009325844.001.
- United Nations Development Programme. (2022).The 8th National Communication and the 5th Biennial Report of the Republic of Kazakhstan to the UN Framework Convention on Climate Change. Available online: https://www.undp.org/kazakhstan/publications/8th-national-communication-and-5th-biennial-report-republic-kazakhstan-un-framework-convention-climate-change (accessed on 23 October 2025).
- Unated Nations. (2020). Antonio Guterres. Carbon neutrality by 2050: the world’s most urgent mission. Available online: https://www.un.org/sg/ru/content/sg/articles/2020-12-11/carbon-neutrality-2050-the-world’s-most-urgent-mission (accessed on 23 October 2025).
- World Bank. (2024). Achieving carbon neutrality by 2060: A sustainable energy future for countries in Europe and Central Asia. Available online: https://www.worldbank.org/en/region/eca/publication/net-zero-energy-by-2060-charting-europe-and-central-asia-s-journey-toward-sustainable-energy-futures (accessed on 23 October 2025).
- Qian, Y.; Liu, Y. Improve carbon emission efficiency: What role does the ESG initiatives play? Journal of Environmental Management 2024, 367, 122016. [Google Scholar] [CrossRef]
- Emission Index. (2024) Greenhouse Gas Emissions in Kazakhstan. Available online: https://www.emissionindex.com/countries/kazakhstan (accessed on 20 October 2025).
- European Commission. (2021).European Climate Law URL: https://climate.ec.europa.eu/eu-action/european-climate-law_en(accessed 20 October 2025).
- European Commission. (2022). European Union: About the European Union and its activities. URL: https://op.europa.eu/webpub/com/eu-what-it-is/en(accessed 23 October 2025).
- Vinokurov,E,Ahunbaev,A,Usmanov,N,Sarsembekov,T.(2022). Regulirovanie vodno-energeticheskogo kompleksa Tsentral’noj Azii [Regulation of the water energy complex of Central Asia]. Doklady i rabochie dokumenty.22/4.Almaty, Moscow: Eurasian Development Bank.2022,117s. Available online: https://eabr.org/analytics/special-reports/regulirovanie-vodno-energeticheskogo-kompleksa-tsentralnoy-azii (in Russian).
- Awe, Y.A.; Larsen, B.K.; Sanchez-Triana, E. (2022). The Global Health Cost of PM2. 5 Air Pollution: A Case for Action Beyond 2021(English), World Bank Group. United States of America. Available online: https://coilink.org/20.500.12592/vbj8qx on 02Mar2025, COI: 20.500.12592/vbj8qx, ISBN 978-1-4648-1816-5.
- Alamar, N.; Murali; van Scheers, J. (Eds.). (2008). Globalization and sustainable growth. In Environmental Management, Sustainable Development and Human Health (pp.13-19). [CrossRef]
- Lee, L.J.-W.; Tai, S.W. (2009). Environmental management and sustainable development in the oil and gas industry: A case study from Kazakhstan. In Environmental Management, Sustainable Development and Human Health (pp. 201–214). CRC Press. eBook, ISBN9780429206979.
- Ness, J.E.; Garvin, H.; Ravi, V. (2022). An Overview of Policies Influencing Air Pollution from the Electricity Sector in Central Asia. Golden, CO: National Renewable Energy Laboratory. NREL/TP-7A40-81861. Available online: https://www.nrel.gov/docs/fy23osti/81861.pdf.
- Nguyen ATThe relationship between economic growth energy consumption carbon dioxide emissions: evidence from Central Asia Eur, J. Bus. Econ. 2019, 12, 1–15. [CrossRef]
- Esekina А,, S.; Tokpaev; ZR; Cherednichenko, A.V., Kasenov, A.A., Ermahanova, E.M., Kasenova, D.A., ... & Shorman, A.T.(2023). Analiz dinamiki natsional’nyh vybrosov i pogloshenij parnikovyh gazov v Kazakhstane za 2012-2021gg. [Analysis of the dynamics of national emissions and absorption of greenhouse gases in Kazakhstan for 2012-2021] Hydrometeorologiya i ecologiya.3, 6–23. https://doi.org/10.54668/2789-6323-2023-110-3-6-23 (in Russian).
- Adambekova,A., Adambekov,N., Amankeldy,N., Salimbayeva,R.Scientific justification for the specific application of ESG principles. Journal of Economic Research & Business Administration 2023, 4. [CrossRef]
- Baratta, A.; Cimino, A.; Longo, F.; Solina, V.; Verteramo, S. The impact of ESG practices in industry with a focus on carbon emissions: Insights and future perspectives. Sustainability 2023, 15, 6685. [Google Scholar] [CrossRef]
- Rojo-Suárez, J.; Alonso-Conde AB,Gonzalez-Ruiz, J.D. Does sustainability improve financial performance? An analysis of Latin American oil and gas firms. Resources Policy 2024, 88, 104484. [CrossRef]
- Martto, J.; Diaz, S.; Hassan, B.; Mannan, S.; Singh, P.; Villasuso, F.; Baobaid, O. (2023, October). ESG strategies in the oil and gas industry from the maritime & logistics perspective-opportunities & risks. In Abu Dhabi International Petroleum Exhibition and Conference (p. D041S129R004). SPE. [CrossRef]
- Quayson, M.; Bai, C.; Mahmoudi, A.; Hu, W.; Chen, W.; Omoruyi, O. Designing a decision support tool for integrating ESG into the natural resource extraction industry for sustainable development using the ordinal priority approach. Resources Policy 2023, 85, 103988. [Google Scholar] [CrossRef]
- Ye, J.; Xu, W. Carbon reduction effect of ESG: empirical evidence from listed manufacturing companies in China. Frontiers in Ecology and Evolution 2023, 11, 1311777. [Google Scholar] [CrossRef]
- Cong, Y.; Zhu, C.; Hou, Y.; Tian, S.; Cai, X. Does ESG investment reduce carbon emissions in China? Front. Environ. Sci 2022, 10. [Google Scholar] [CrossRef]
- Li, C.; Ba, S.; Ma, K.; Xu, Y.; Huang, W.; Huang, N. ESG rating events, financial investment behavior and corporate innovation. Econ. Anal. Policy 2023, 77, 372–387. [Google Scholar] [CrossRef]
- Bandeira, G.L.; Trindade, D.N.P.; Gardi, L.H.; Sodario, M.; Simioni, C.G. (2023, April). Developing an ESG strategy and roadmap: An integrated perspective in an O&G company. In Offshore technology conference (p. D021S027R002). OTC. [CrossRef]
- WBCSD; Brekelmans, H. (2020, September 4). Shell: Aiming to become a net-zero energy business by 2050. Available online: https://www.wbcsd.org/news/shell-net-zero-energy-business-2050/.
- Mooneeapen, O.; Abhayawansa, S.; Mamode Khan, N. The influence of the country governance environment on corporate environmental, social and governance (ESG) performance. Sustainability Accounting, Management and Policy Journal 2022, 13, 953–985. [Google Scholar] [CrossRef]
- Babaeva Zh, R.; Semenov KK,Semenova, A.S. (2024). Traktovka ESG: sistemanicheskij obzor literatury. Rossijskij zhurnal menedzhmenta, [Interpretation of the Unified State Register: A Systematic Literature Review. Russian Journal of Management] (2), 253-288. https://doi.org/10.21638/spbu18.2024.205 (in Russian).
- EniSpA (n.d.). Reducing emissions linked to Oil&Gas production, contributing to the Net Zero target. Available online: https://www.eni.com/en-IT/sustainability/decarbonization/oil-gas.html (accessed on 23 October 2025).
- Chia, S.Y., Hong, S., Howes, S., Wyrwoll, P., Minh, V.H., Xuegong, S., ... & Clough, P. (2012). Moving Toward A New Development Model For East Asia-The Role of Domestic Policy and Regional Cooperation. Books. Economic Research Institute for ASEAN and East Asia (ERIA). (Zhang Yunling, Fukunari Kimura, & Sothea Oum, Eds.). Available online: http://www.eria.org/RPR-FY2011-10.pdf.
- Wang, Y. , Sun, X., & Guo, X. Environmental regulation and green productivity growth: Empirical evidence on the Porter Hypothesis from OECD industrial sectors. Energy Policy, 2019, 132, 611–619. [Google Scholar] [CrossRef]
- Szczepańczyk, M.; Nowodziński, P.; Sikorski, A. ESG Strategy and Financial Aspects Using the Example of an Oil and Gas Midstream Company: The UNIMOT Group. Sustainability 2023, 15, 13396. [Google Scholar] [CrossRef]
- Cheng, X.; Chen, K.; Su, Y. Green innovation in oil and gas exploration and production for meeting the sustainability goals. Resources Policy 2023, 87, 104315. [Google Scholar] [CrossRef]
- Wang, J.; Ma, M.; Dong, T.; Zhang, Z. Do ESG ratings promote corporative green innovation? A quasi-natural experiment based on Syn Tao Green Finance’s ESG Ratings. Int. Rev. Financ. Anal. 2023, 87, 102623. [Google Scholar] [CrossRef]
- Chipalkatti, N.; Le, Q.V. , & Rishi, M. Sustainability and society: do environmental, social, and governance factors matter for foreign direct investment? Energies 2021, 14, 6039. [Google Scholar] [CrossRef]
- Wang, W. (2024). The study of ESG strategies on the development and financial performance of traditional energy enterprises using System Dynamics-A case study on one oil and gas company. Doctoral dissertation, Massachusetts Institute of Technology. Available online: https://hdl.handle.net/1721.1/155984.
- Dsouza, S.; Krishnamoorthy, K. Boosting Corporate Value through ESG Excellence in Oil and Gas Sector. International Journal of Energy Economics and Policy, 2024, 14, 335–346. [Google Scholar] [CrossRef]
- Adilet.zan.kz, 2013 Concept on Transition towards Green Economy by 2050. Available online: https://adilet.zan.kz/rus/docs/T1300000577 (accessed on day month year).
- Hupart, J.H.; Adams, D.G.; McKitterick, W.G.; Kelsch, T. (2024, May 20). Understanding ESG ratings: Legal insights & perspectives. Mintz. Available online: https://www.mintz.com/insights-center/viewpoints/2151/2024-05-20-understanding-esg-ratings-legal-insights-perspectives.
- Berg, F.; Koelbel, J.F.; Rigobon, R. Aggregate confusion: The divergence of ESG ratings. Review of Finance, 2019, 26, 1315–1344. [Google Scholar] [CrossRef]
- Kong, X.; Li, Z.; Lei, X. Research on the impact of ESG performance on carbon emissions from the perspective of green credit. Sci Rep 2024, 14, 10478. [Google Scholar] [CrossRef]
- Meynier, T.; Mishkin, S.H., & Triggs, M. (2023, January 30). EU finalizes ESG reporting rules with international impacts. Harvard Law School Forum on Corporate Governance. Available online: https://corpgov.law.harvard.edu/2023/01/30/eu-finalizes-esg-reporting-rules-with-international-impacts/.
- National Law Review. (2021, March 10). EU Adopts ESG Ratings Regulation: Strengthening Transparency and Reliability. Available online: https://natlawreview.com/article/eu-seeks-improve-esg-ratings (accessed on 23 October 2025).
- Iris Carbon. (n.d.). A Beginner’s Guide to ESG Rating Agencies and Methodologies. Available online: https://www.iriscarbon.com/a-beginners-guide-to-esg-rating-agencies-and-methodologies/ (accessed on 23 October 2025).
- European Cluster Collaboration Platform.(2025).Green transition support. Retrieved Febrary 2, 2025 from Available online: https://www.clustercollaboration.eu/.(accessed on 23 October 2025).
- Kitaj stal mirovym liderom po «zelenomu» kreditovaniyu.(2023, 18 noyabrya). Bol’shaya Aziya. [China Becomes World Leader in Green Lending (2023, November 18)]. Greater Asia. (in Russian). Available online: https://bigasia.ru/kitaj-stal-mirovym-liderom-po-zelyonomu-kreditovaniyu/.
- UK Government. (2021, June 30). UK half way to net zero. Available online: https://www.gov.uk/government/news/uk-half-way-to-net-zero (accessed on 23 October 2025).
- Smart Energy Decisions. (2020, May 8). FedEx cuts emissions intensity 40% with fuel saving strategies. Available online: https://www.smartenergydecisions.com/energy-management/2020/05/08/fedex-cuts-emissions-intensity-40-with-fuel-saving-strategies (accessed on 23 October 2025).
- Synesgy. (2024, 4 June). ESG Indicators: how to evaluate sustainability performance. Synesgy. Available online: https://www.synesgy.com/en/esg-guide/esg-indicators-how-to-evaluate-sustainability-performance/ (accessed on 10 October 2025).
- Grinets, I.A.; Kaznacheev, P.F. (2015). Ekonomicheskiy rost i institutsionalnoe razvitie v neftegazovyh stranah. [Economic growth and institutional development in oil and gas countries] Vserossiyskiy ekonomicheskiy zhurnal ECO, (4 (490)), 105-115. (in Russian). Available online: https://cyberleninka.ru/article/n/ekonomicheskiy-rost-i-institutsionalnoe-razvitie-v-neftegazovyh-stranah.
- Adilet.zan.kz, 2021. Environmental Code of the Republic of Kazakhstan. Available online: https://adilet.zan.kz/rus/docs/K2100000400 (accessed on 10 October, 2025).
- Complaince &Business Ethics Association. (2023). Lim, Yu. PWC Kazakhstan opublikoval 4 izdanie Rejtinga 50-ti luchshyh kompanij, operiruyushih v Kazakhstane, po urovnyu raskrytiya ESG informatsii. [PWC Kazakhstan has published the 4th edition of the Rating of the 50 best companies operating in Kazakhstan, according to the level of ESG information disclosure. (in Russian). Available online: https://compliance.org.kz/.
- Tengrinews. (2025, 6 March). KASE nagradila KPO za luchshiy ESG-otchet. (KASE awarded KPO for the best ESG report).Tengrinews. (in Russian). Available online: https://tengrinews.kz/kazakhstan_news/kpo-nagradili-za-luchshiy-otchet-ob-ustoychivom-razvitii-564145/amp.
- Simply Sustainable (nd) The importance of governance within, E.S.G. Simply Sustainable. Available online: https://simplysustainable.com/insights/the-importance-of-governance-of-g-in-esg (accessed on 20 October 2025).
- The Report. (n.d.). What is the social S in ESG? ESG | The Report. Available online: https://esgthereport.com/what-is-esg/the-s-in-esg/ (accessed on 20 October 2025).
- Imashev EZhProstranstvennyj analiz izmeneniya ecologicheskogo sostoyaniya okruzhayushej sredjy Zapadno-Kazahstanskoy oblasti [Spatial analysis of changes in the ecological state of the environment in the West Kazakhstan region] Vestnik, K.a.z.N.U. Seriya geograficheskaya, 2011, 1, 13–20. Available online: https://bulletin-geography.kaznu.kz/index.php/1-geo/article/download/617/503 (in Russian).
- Kalieva, H.; Fadeeva; L; Erubaeva; G(2014)Ecologicheskij analiz sostoyaniya atmosphernogo vozduha Burlinskogo rajona Zapadno-Kazahstanskoy oblasti [Ecological analysis of the state of atmospheric air in the Burlinsky district of the West Kazakhstan region] Vestnik, K.a.z.N.U. Seriya ecologicheskaya,41,97-102. (in Russian). Available online: https://bulletin-ecology.kaznu.kz/.
- Sukhanberdina, L.H., Khon, V.N., & Khon, L.V. (2017). Air pollution control on Karachaganak field. Available online: http://hdl.handle.net/123456789/793.
- KenesaryD.,(2015). Nauchno-metodologicheskie osnovy upravleniya riskami zdorovyu naseleniya na primere regiona Karachaganaksrogo neftegazokondensatnogo mestorozhdeniya. Dissertacia na soiskanie uchenoj stepeni doctora philosophii (PhD) [Scientific and methodological foundations for managing public health risks using the example of the Karachaganak oil and gas condensate field. Doctoral Dissertation. Kazakh National Medical University]. (in Russian). Available online: https://kaznmu.kz/rus/ wpcontent/uploads/2015/.
- KenesaryA.,(2017). Nauchno-metodicheskie podhody razrabotki sanytarno-zashitnyh zon s primeneniem novyh tehnologij, snizhayushih zagryaznenie okruzhayushej sredy. Dissertacia na soiskanie uchenoj stepeni doctora philosophii (PhD) [Scientific and methodological approaches to the development of sanitary protection zones using new technologies that reduce environmental pollution. Doctoral Dissertation. Kazakh National Medical University]. (in Russian). Available online: https://kaznmu.edu.kz/rus/wpcontent/uploads/2017/.
- Kenessary, D.; Kenessary, A.; Kenessariyev, U.; Juszkiewicz, K.; Amrin, M.; Erzhanova, A. Human health cost of hydrogen sulfide air pollution from an oil and gas Field. Annals of Agricultural and Environmental Medicine 2017, 24. [Google Scholar] [CrossRef] [PubMed]
- Kemme, David M., Sovereign Wealth Fund Issues and the National Fund(s) of Kazakhstan (December 15, 2011). Available at SSRN: https://ssrn.com/abstract=3622312 or. https://doi.org/10.2139/ssrn.3622312.
- Bell, A.; Jones, K. Explaining Fixed Effects: Random Effects Modeling of Time-Series Cross-Sectional and Panel Data. Political Sci. Res. Methods, 2015, 3, 133–153. [CrossRef]
- Box, G.E.P.; Jenkins, G.M.; Reinsel, G.C. (1994) The Boxing and Jenkins Method—ARIMAX. In Time Series Analysis, Forecasting and Control, 3rd ed.; Prentice Hall: Englewood Cliff, NJ, USA.
- Kong, X.; Li, Z.; Lei, X. Research on the impact of ESG performance on carbon emissions from the perspective of green credit. Scientific reports, 2024, 14, 10478. [Google Scholar] [CrossRef]
- Khan, S.A. R. , Tabish, M., & Zhang, Y. Embracement of industry 4.0 and sustainable supply chain practices under the shadow of practice-based view theory: Ensuring environmental sustainability in corporate sector. Journal of Cleaner Production, 2023, 398, 136609. [Google Scholar] [CrossRef]
- Li, J.; Zhang, Z. The impact of ESG performance and enterprise value under the dual-carbon goals–based on A-share listed manufacturing enterprises. Applied Economics 2025, 1–19. [Google Scholar] [CrossRef]
- Tibshirani, R. Regression shrinkage and selection via the lasso. Journal of the Royal Statistical Society Series B: Statistical Methodology, 1996, 58, 267–288. [Google Scholar] [CrossRef]
- Grewal, J.; Hauptmann, C.; Serafeim, G. Material sustainability information and stock price informativeness. Journal of Business Ethics 2021, 513–544. [Google Scholar] [CrossRef]
- Korolev, N.; Kozyaruk, A.; Morenov, V. Efficiency increase of energy systems in oil and gas industry by evaluation of electric drive lifecycle. Energies, 2021, 14, 6074. [Google Scholar] [CrossRef]
- Muhammetoglu, A.; Al-Omari, A.; Al-Houri, Z.; Topkaya, B.; Tumbul, T.; Muhammetoglu, H. Assessment of energy performance and GHG emissions for the urban water cycle toward sustainability. Journal of Water and Climate Change, 2023, 14, 223–238. [Google Scholar] [CrossRef]
- Li, L.; Lee, G.; Kang, D. Energy Consumption and Greenhouse Gas (GHG) Emissions in Urban Wastewater Treatment Facilities: A Case Study of Seoul Metropolitan City (SMC). Water 2025, 17, 464. [Google Scholar] [CrossRef]
- Safitri, N.K. , Ridwan, A.Y., Hediyanto, U.Y.K.S., & Ma’ali el Hadi, R. Developing Waste Management System based on Open-Source ERP. JATISI (Jurnal Teknik Informatika dan Sistem Informasi) 2021, 8, 848–858. [Google Scholar] [CrossRef]
- Kazhydromet. (n.d.). https://www.iqair.com/ru/kazakhstan/batys-qazaqstan (accessed on 10 October 2025). (accessed on null).
- Ulman, A., Salnikov, V., Musralinova, G., Tuimebayev, Z., Polyakova, S., Tazhibayeva, T., ... & Raimbekova, Z. Air pollution in the West Kazakhstan region: A multi-source analysis. Atmospheric Research, 2025, 108560. [CrossRef]
- Masenov, K.B. , Ashibekov, S., & Bakytbek, A. The influence of gas processing facility on plants. The Way of Science, 2016, 12, 14–17. [Google Scholar]
- PwC.(2023, 25 января) Global M&A Trends in Energy, Utilities and Resources: 2023 Outlook. https://www.pwc.com/gx/en/services/deals/trends/2023/energy-utilities-resources.html (accessed 23 October 2025).
- PwC.(2025), Oil and gas. PwC. https://www.pwc.com/gx/en/industries/energy-utilities-resources/oil-gas-energy.html(accessed 23 October 2025).
- Vakulchuk, R.; Overland, I.; Suryadi, B. ASEAN’s energy transition: How to attract more investment in renewable energy. Energy, Ecology and Environment 2023, 8, 1–16. [Google Scholar] [CrossRef]
- World Bank. (2022). Impactful women: Examining opportunities and constraints for women in mining organizations worldwide. World Bank. https://www.worldbank.org/en/events/2022/03/09/impactful-women-examining-opportunities-and-constraints-for-women-in-mining-organizations-worldwide(accessed on 23 October 2025).
- Catalyst. (2023). Women’s workplace representation trends & solutions. Catalyst. https://www.catalyst.org/research/womens-workplace-representation-trends-solutions/.
- Shakil, M.H. Environmental, social and governance performance and financial risk: Moderating role of ESG controversies and board gender diversity. Resources Policy 2021, 72, 102144. [Google Scholar] [CrossRef]
- Caby, J. , Coron, C., & Ziane, Y. How does gender diversity in top management teams affect carbon disclosure and its quality: Evidence from the technological industry. Technological Forecasting and Social Change 2024, 199, 123077. [Google Scholar] [CrossRef]
- Peng, X.; Li, J.; Liu, Y.; Tang, Q.; Lan, Y.C. Corporate gender diversity and carbon reduction: the moderating effect of national culture. Applied Economics 2025, 1–24. [Google Scholar] [CrossRef]
- OECD. (2022). Climate change and corporate governance. OECD Publishing. [CrossRef]
- OECD. (2023).Pioneering global progress in tax transparency: A journey of transformation and development – 2023 Global Forum annual report. Global Forum on Transparency and Exchange of Information for Tax Purposes. https://www.oecd.org/content/dam/oecd/en/networks/global-forum-tax-transparency/global-forum-annual-report-2023.pdf.
- World Bank Group. (2024). Annual report 2024: A better bank for a better world. https://documents1.worldbank.org/curated/en/099101824180532047/pdf/BOSIB-3bdde89d-72a5-4a7f-b371-dd8e86adb477.pdf (accessed 23 October 2025).
- Coutts & Company. (2023). Public transparency report 2023. https://www.coutts.com/content/dam/rbs-coutts/coutts-com/Files/responsible-investing/pri-report/pri-transparency-report-2023.pdf (accessed on 23 October 2025).
- PwC. (2023). Tax transparency and sustainability reporting in 2023. https://www.pwc.com/gx/en/services/governance-risk-compliance/tax-transparency-and-sustainability-reporting-in-2023.html (accessed 23 October 2025).
- Iram, R. , Zhang, J., Erdogan, S., Abbas, Q., & Mohsin, M. Economics of energy and environmental efficiency: evidence from OECD countries. Environmental Science and Pollution Research, 2020, 27, 3858–3870. [Google Scholar] [CrossRef] [PubMed]
- Zhao, Y. , Dong, L., Sun, Y., Ma, Y., & Zhang, N. Is air pollution the original sin of firms? The impact of air pollution on firms’ ESG scores. Energy Economics, 2024, 136, 107704. [Google Scholar] [CrossRef]
- Shell (2023) Shell publishes reports on Sustainability, Climate & Energy Transition Lobbying and Payments to Governments https://royaldutchshellplc.com/2023/03/29/shell-publishes-reports-on-sustainability-climate-energy-transition-lobbying-and-payments-to-governments/(accessed on 23 October 2025).
- Mazzantini, N., & Risucci, V. (2024). Sustainability in the Energy Sector: A Study of Proactive and Reactive Approaches. The Case of Enel and Eni. BA in International Business Capstone, John Cabot University, Rome, Italy. https://hdl.handle.net/20.500.14490/832.
- Aghion, P., Boneva, L., Breckenfelder, J., Laeven, L., Olovsson, C., Popov, A., & Rancoita, E. (2022). Financial markets and green innovation (No. 2686). ECB working paper, ISBN: 978-92-899-5270-5. [CrossRef]
- European Bank for Reconstruction and Development. (n.d.). Home. https://www.ebrd.com/home.html (accessed on 10 October 2025).
- Amović, G. , Maksimović, R., & Bunčić, S. Critical success factors for sustainable public-private partnership (PPP) in transition conditions: An empirical study in Bosnia and Herzegovina. Sustainability 2020, 12, 7121. [Google Scholar] [CrossRef]
- Karthikeyan, C. (2025). Transforming the Modern Workplace With AI (Artificial Intelligence) With Special References From India: Transformational Dynamics for Better Organizational Behavior. In Navigating Organizational Behavior in the Digital Age With AI (pp. 337–360). IGI Global Scientific Publishing. [CrossRef]
- Mukhiyayeva, D., Sembiyeva, L., & Zhagyparova, А. (2024). Evaluating ESG frameworks: A comparative analysis of global standards and their application in Kazakhstan. ECONOMIC Series of the Bulletin of the LN Gumilyov ENU, 245-261. [CrossRef]
- Kuura, O.V. , Varavina, Y.V., & Kozlovaa, M.V. ESG Transformation Factors of Kazakhstan’s Economy in the Context of Sustainable Development. Economy: strategy and practice, 2024, 19, 20–40. [Google Scholar] [CrossRef]
- Wielechowski, M., & Krasuski, P. ESG concepts in business practice. Characteristics and assessment of common ESG frameworks. MAZOWSZE Studia Regionalne, 2024, (Special Edition 2024), 9-26. [CrossRef]
- Arvidsson, S. , & Dumay, J. Corporate ESG reporting quantity, quality and performance: Where to now for environmental policy and practice? Business strategy and the environment, 2022, 31, 1091–1110. [Google Scholar] [CrossRef]
Figure 1.
Algorithm of ESG strategy for reducing air pollution. Sources: compiled by the authors based on [80,85,86].
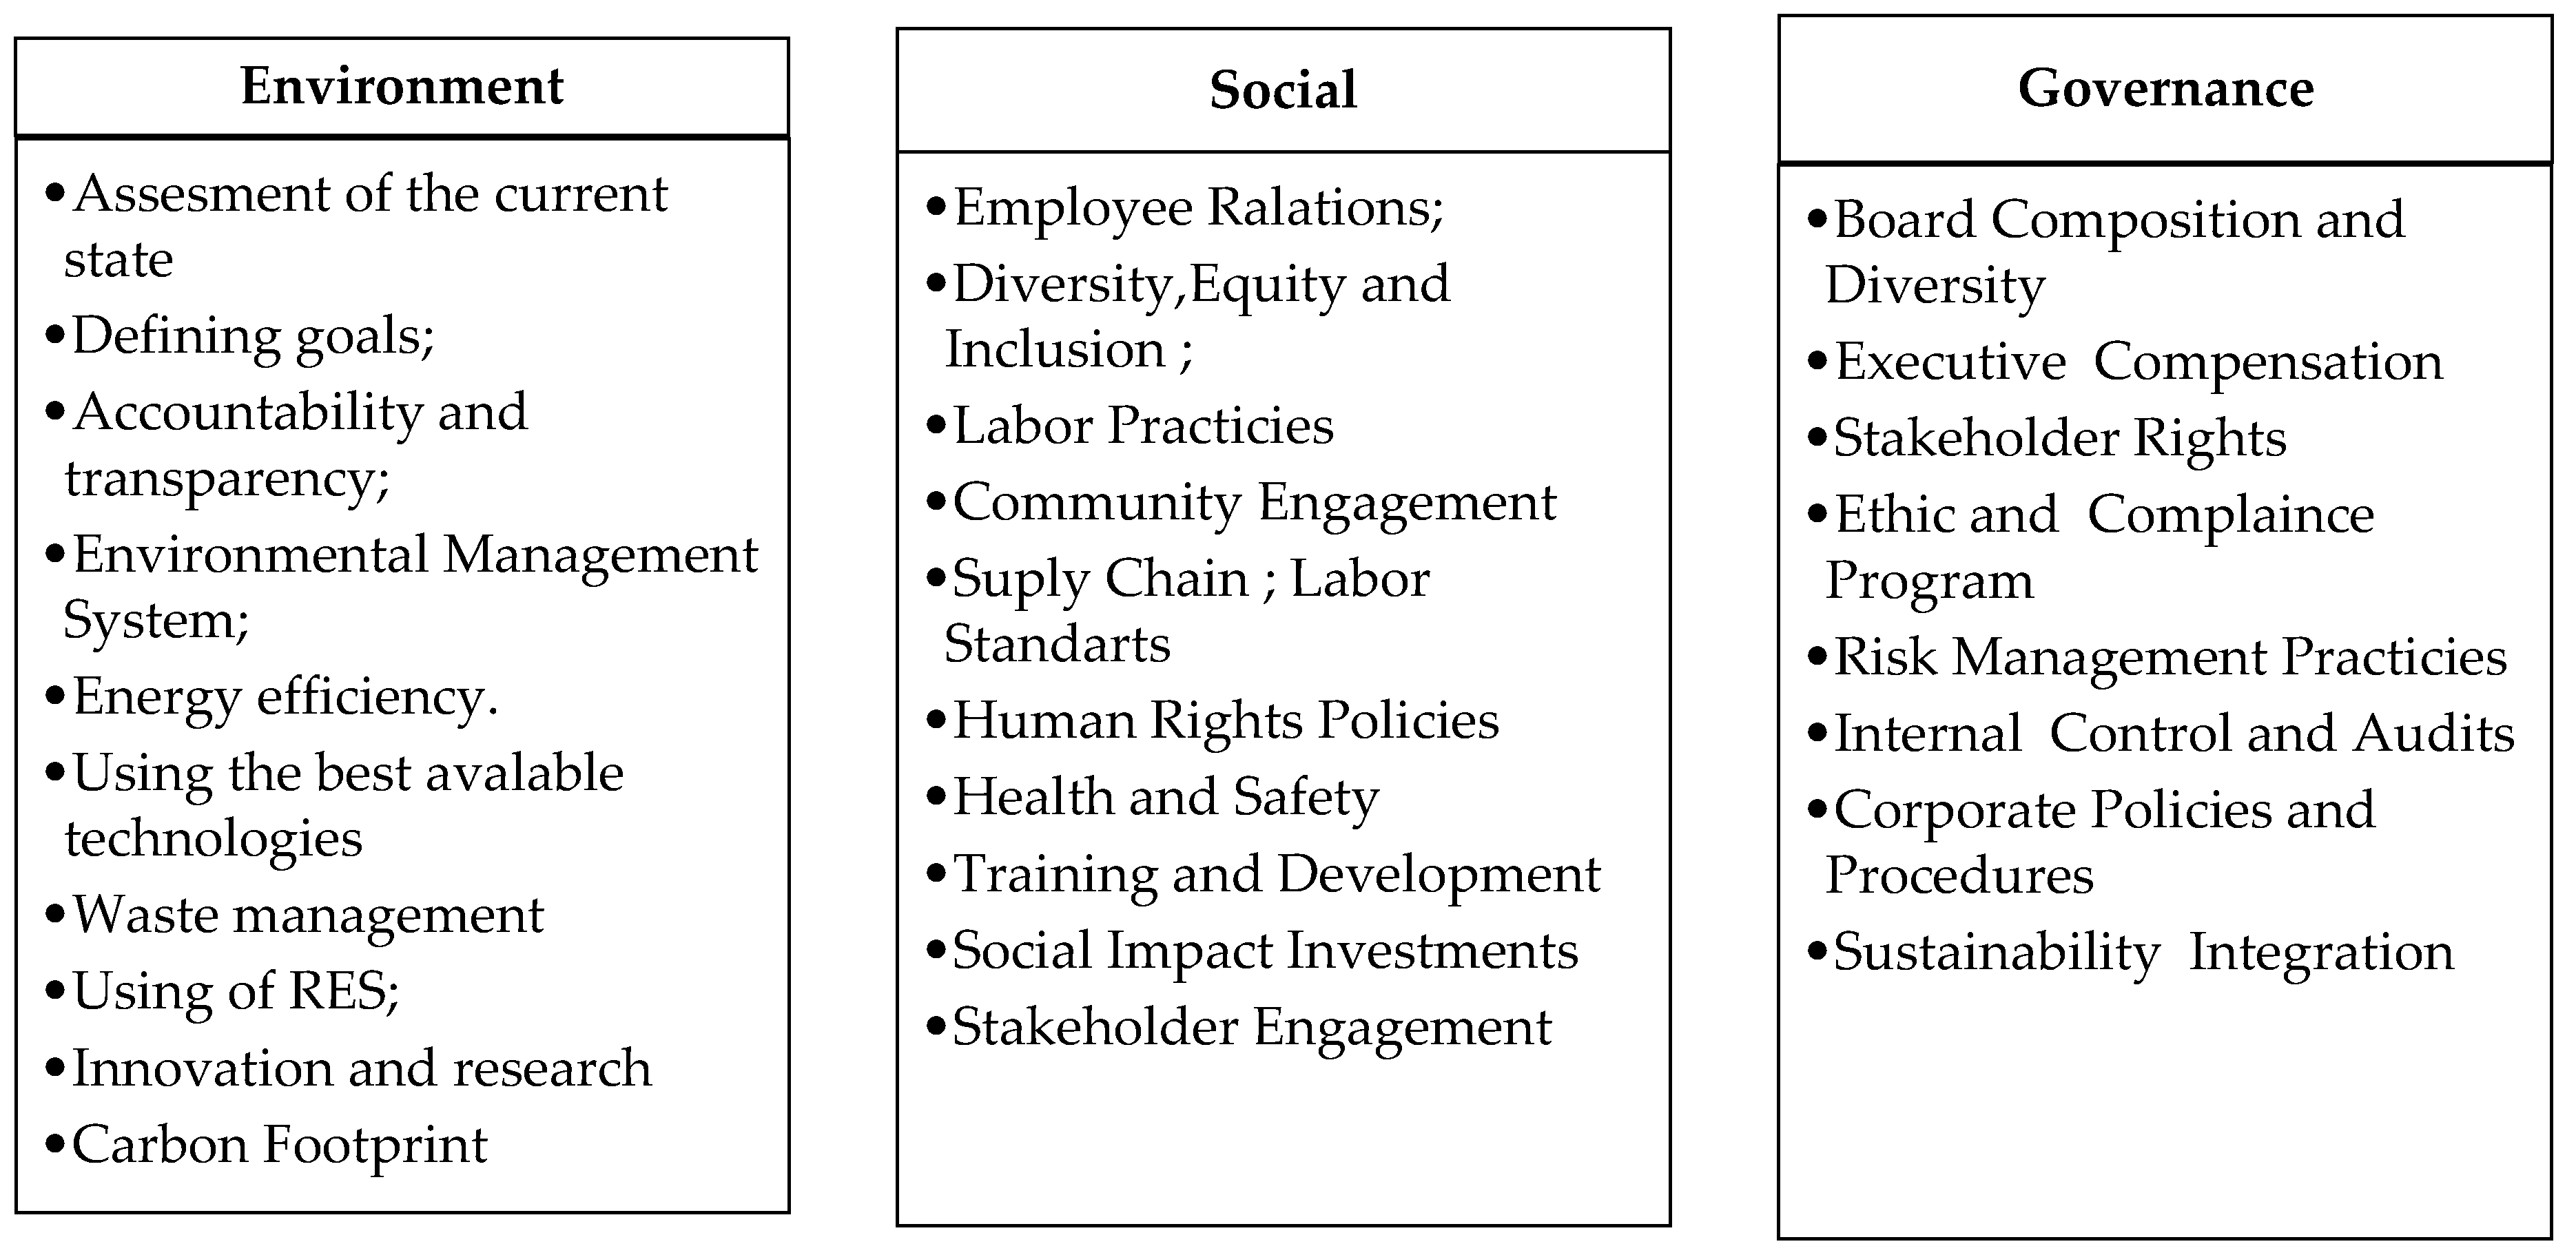
Figure 2.
Volume of GHG emissions by enterprises, million tons in CO2 equivalent (a). Rate of change in volume of GHG emissions by enterprises. count, (b). Source: compiled by the authors based on [19,20,21,22,23,24].
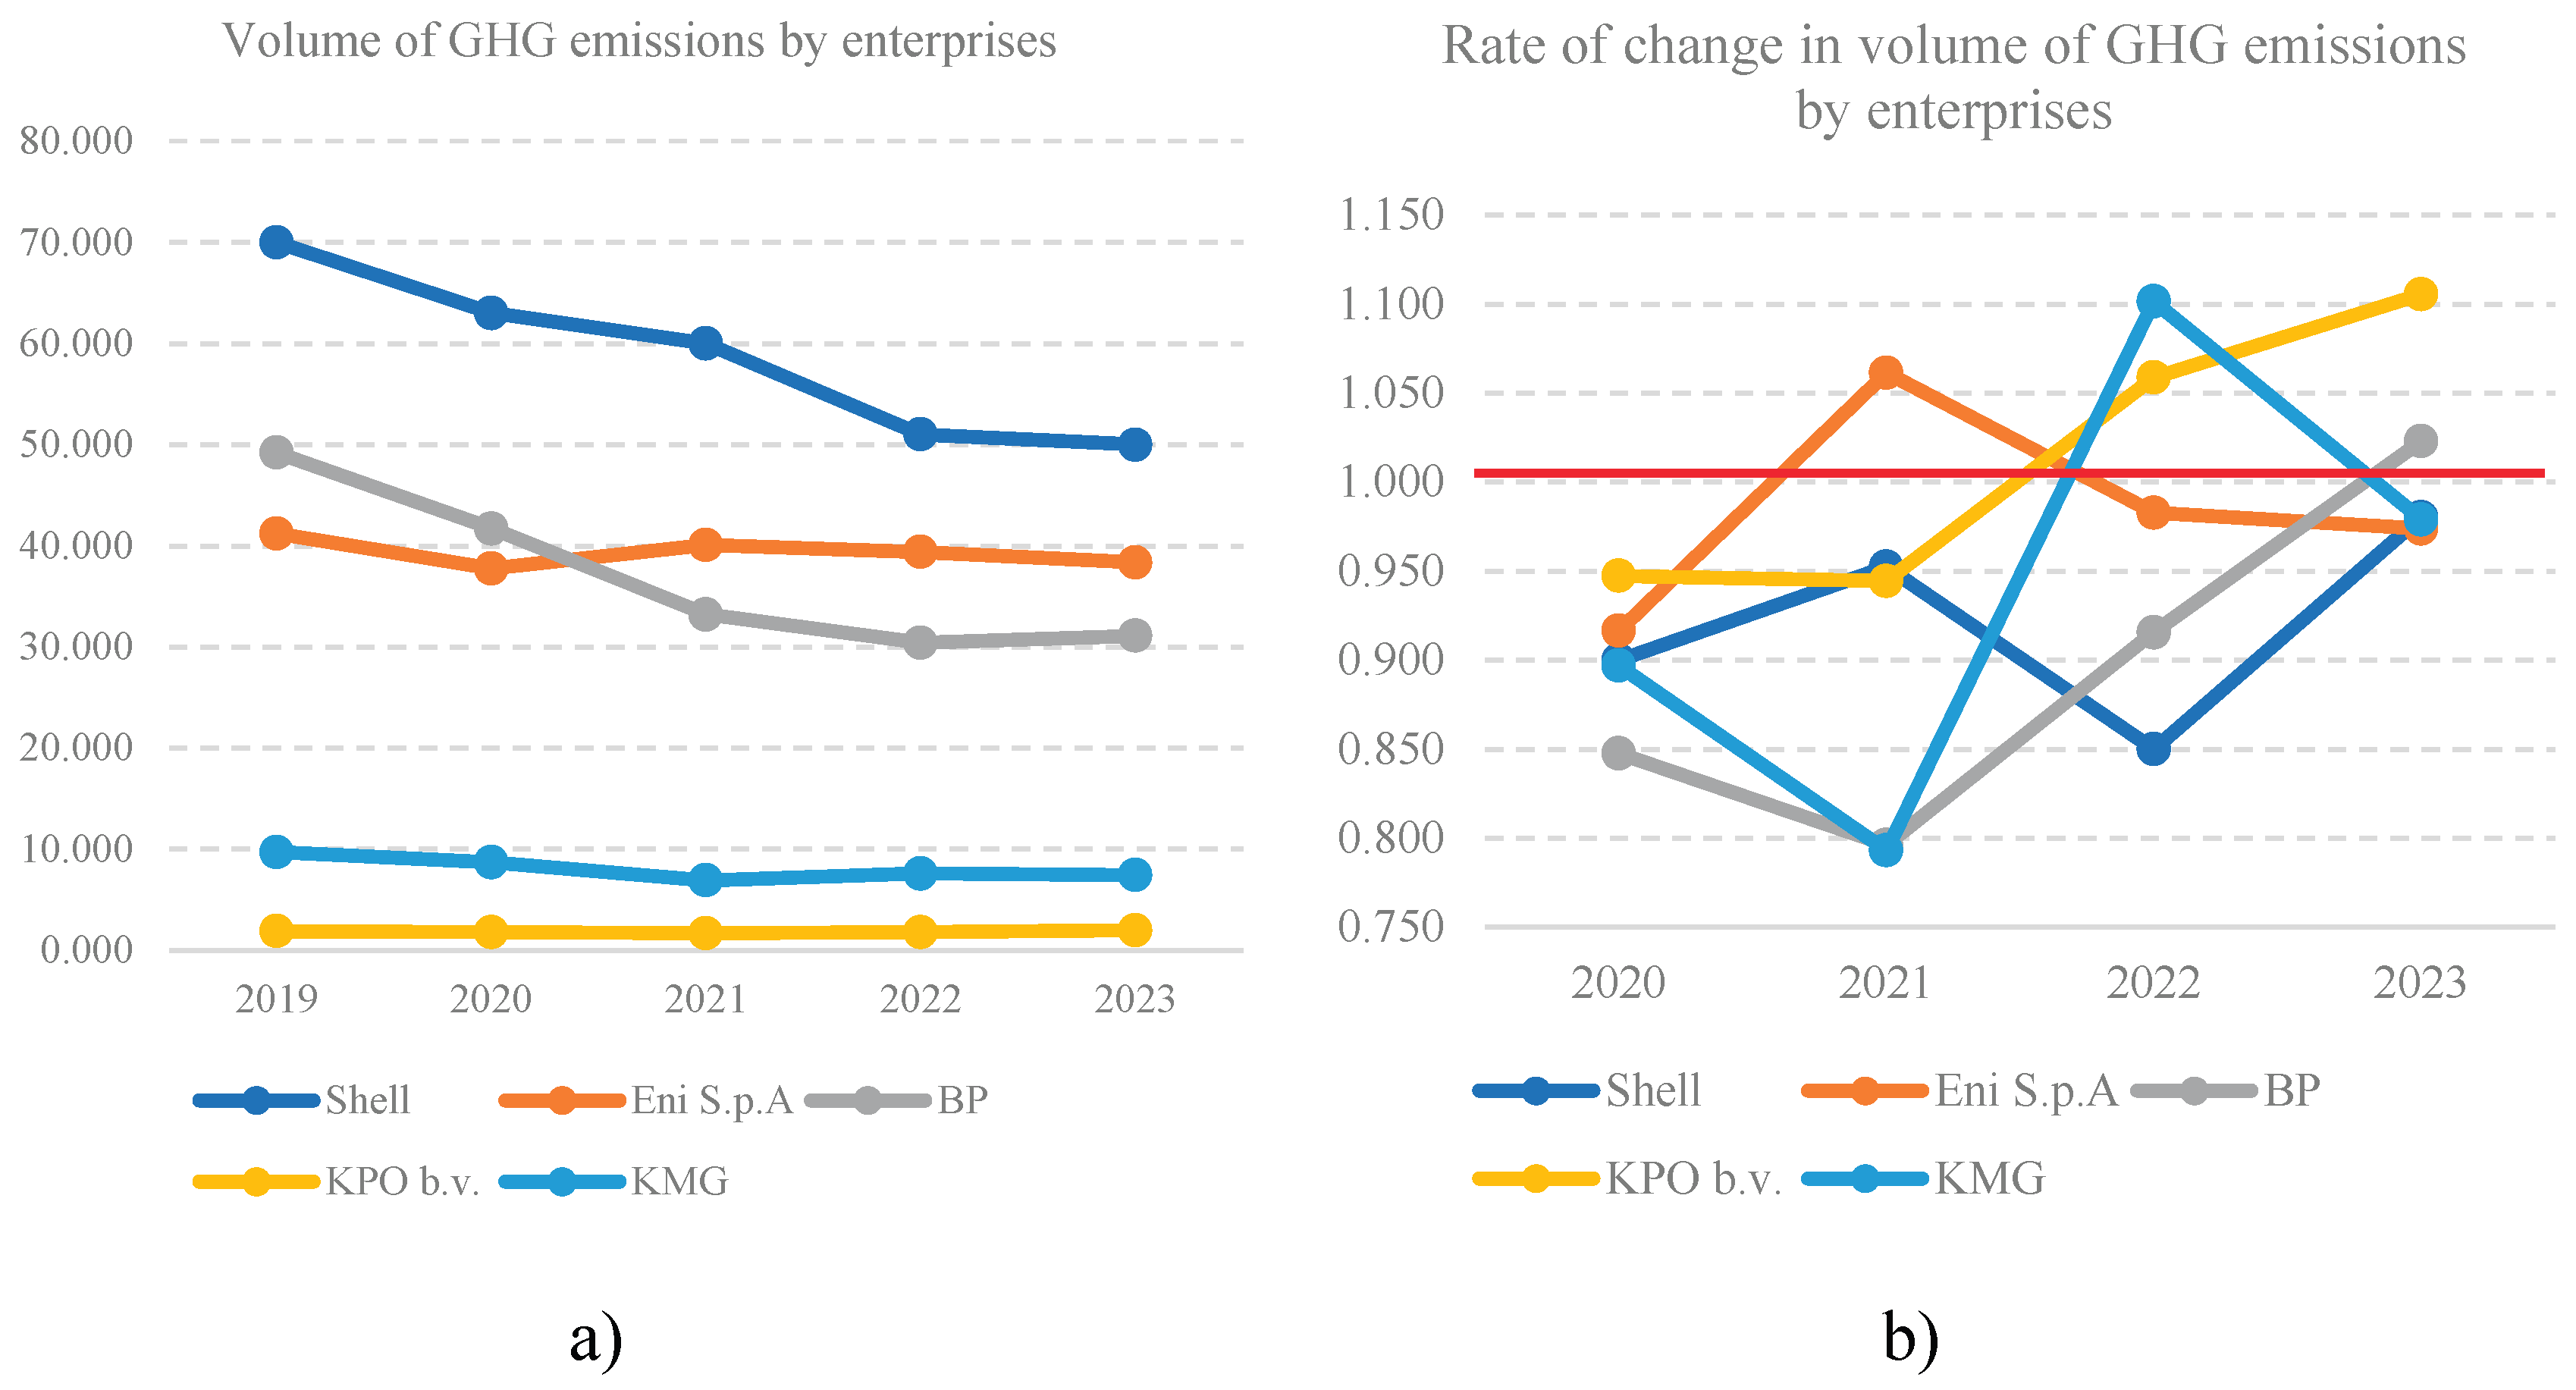
Figure 3.
Interpolated spatial distribution maps. (a) Spatial distribution of air emission sources in West Kazakhstan Oblast, 2022, (count). (b) Spatial distribution of air emissions in West Kazakhstan Oblast, 2022, (tones).Sources: compiled by the authors based on: [17,18]. Built in the program based on ArcMap 10.8 software.

Figure 4.
(a) Volume of GHGs burned in flares by enterprises, mil.t CO2 equivalent. (b) Rate of change in Volume of GHGs burned in flares by enterprises. Sources: compiled by the authors based on: [19,20,21,22,23,24].
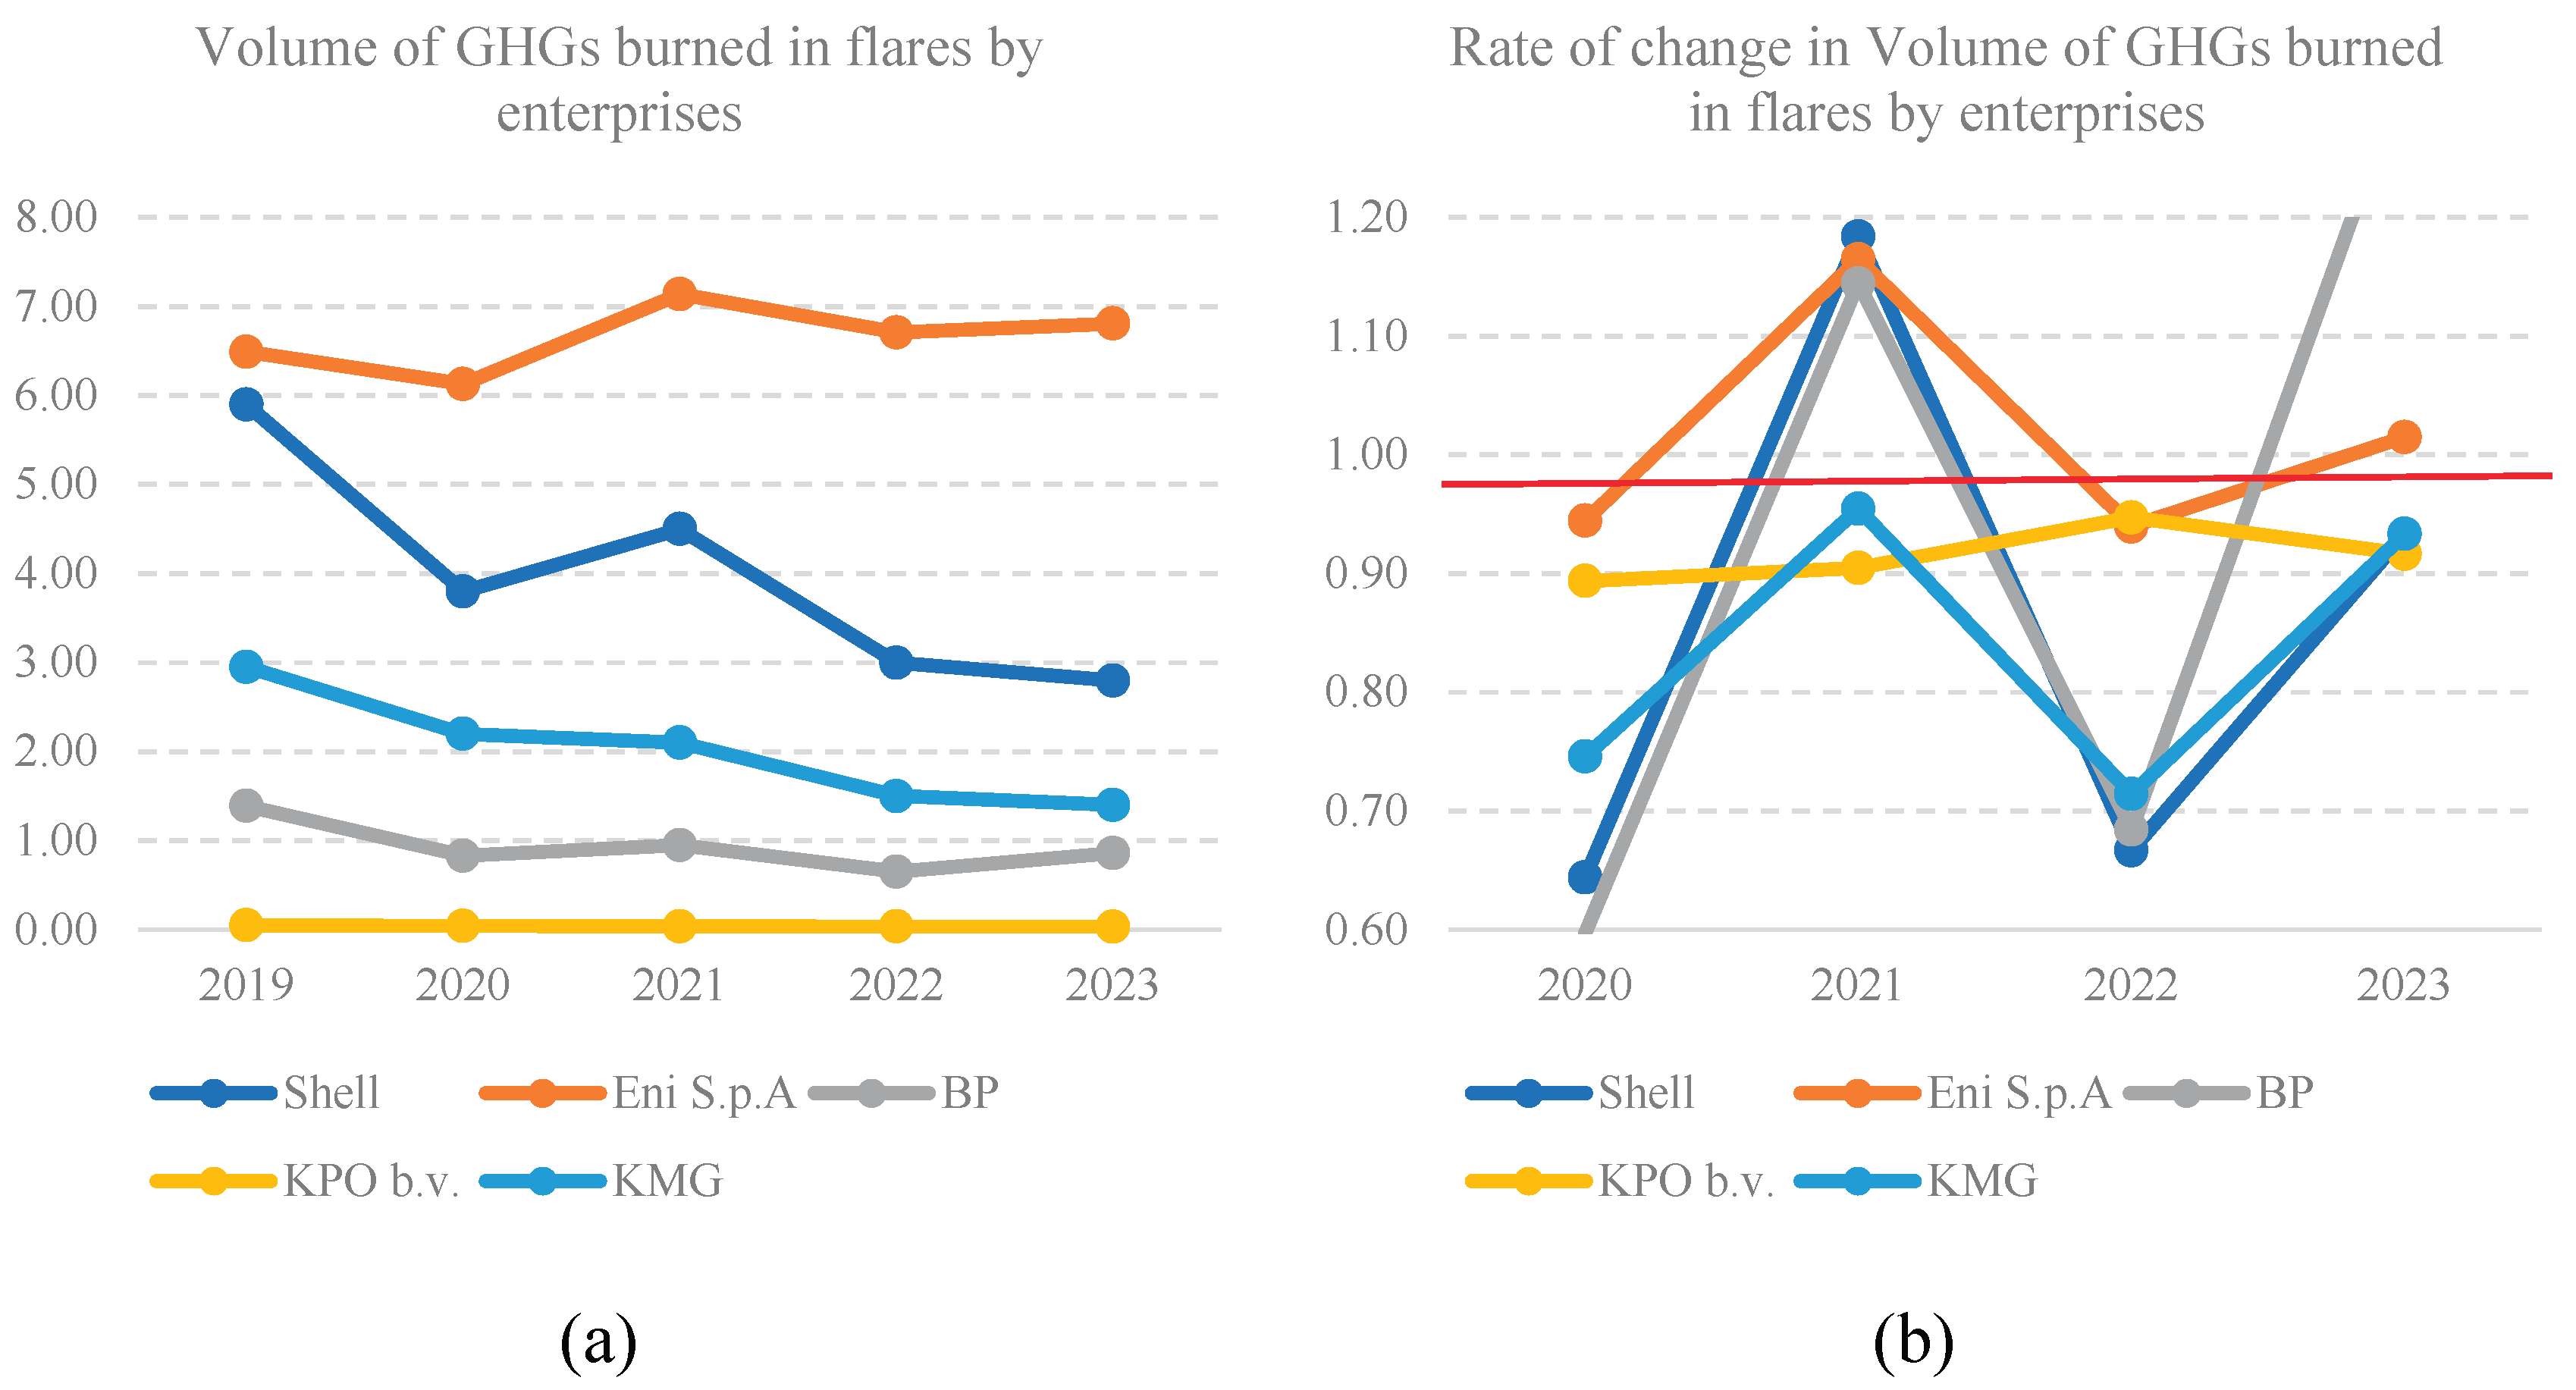
Figure 6.
Pearson correlation matrix of pairwise coefficients between GHG emissions and social responsibility indicators of oil and gas companies.Note: constructed using R.
Figure 6.
Pearson correlation matrix of pairwise coefficients between GHG emissions and social responsibility indicators of oil and gas companies.Note: constructed using R.
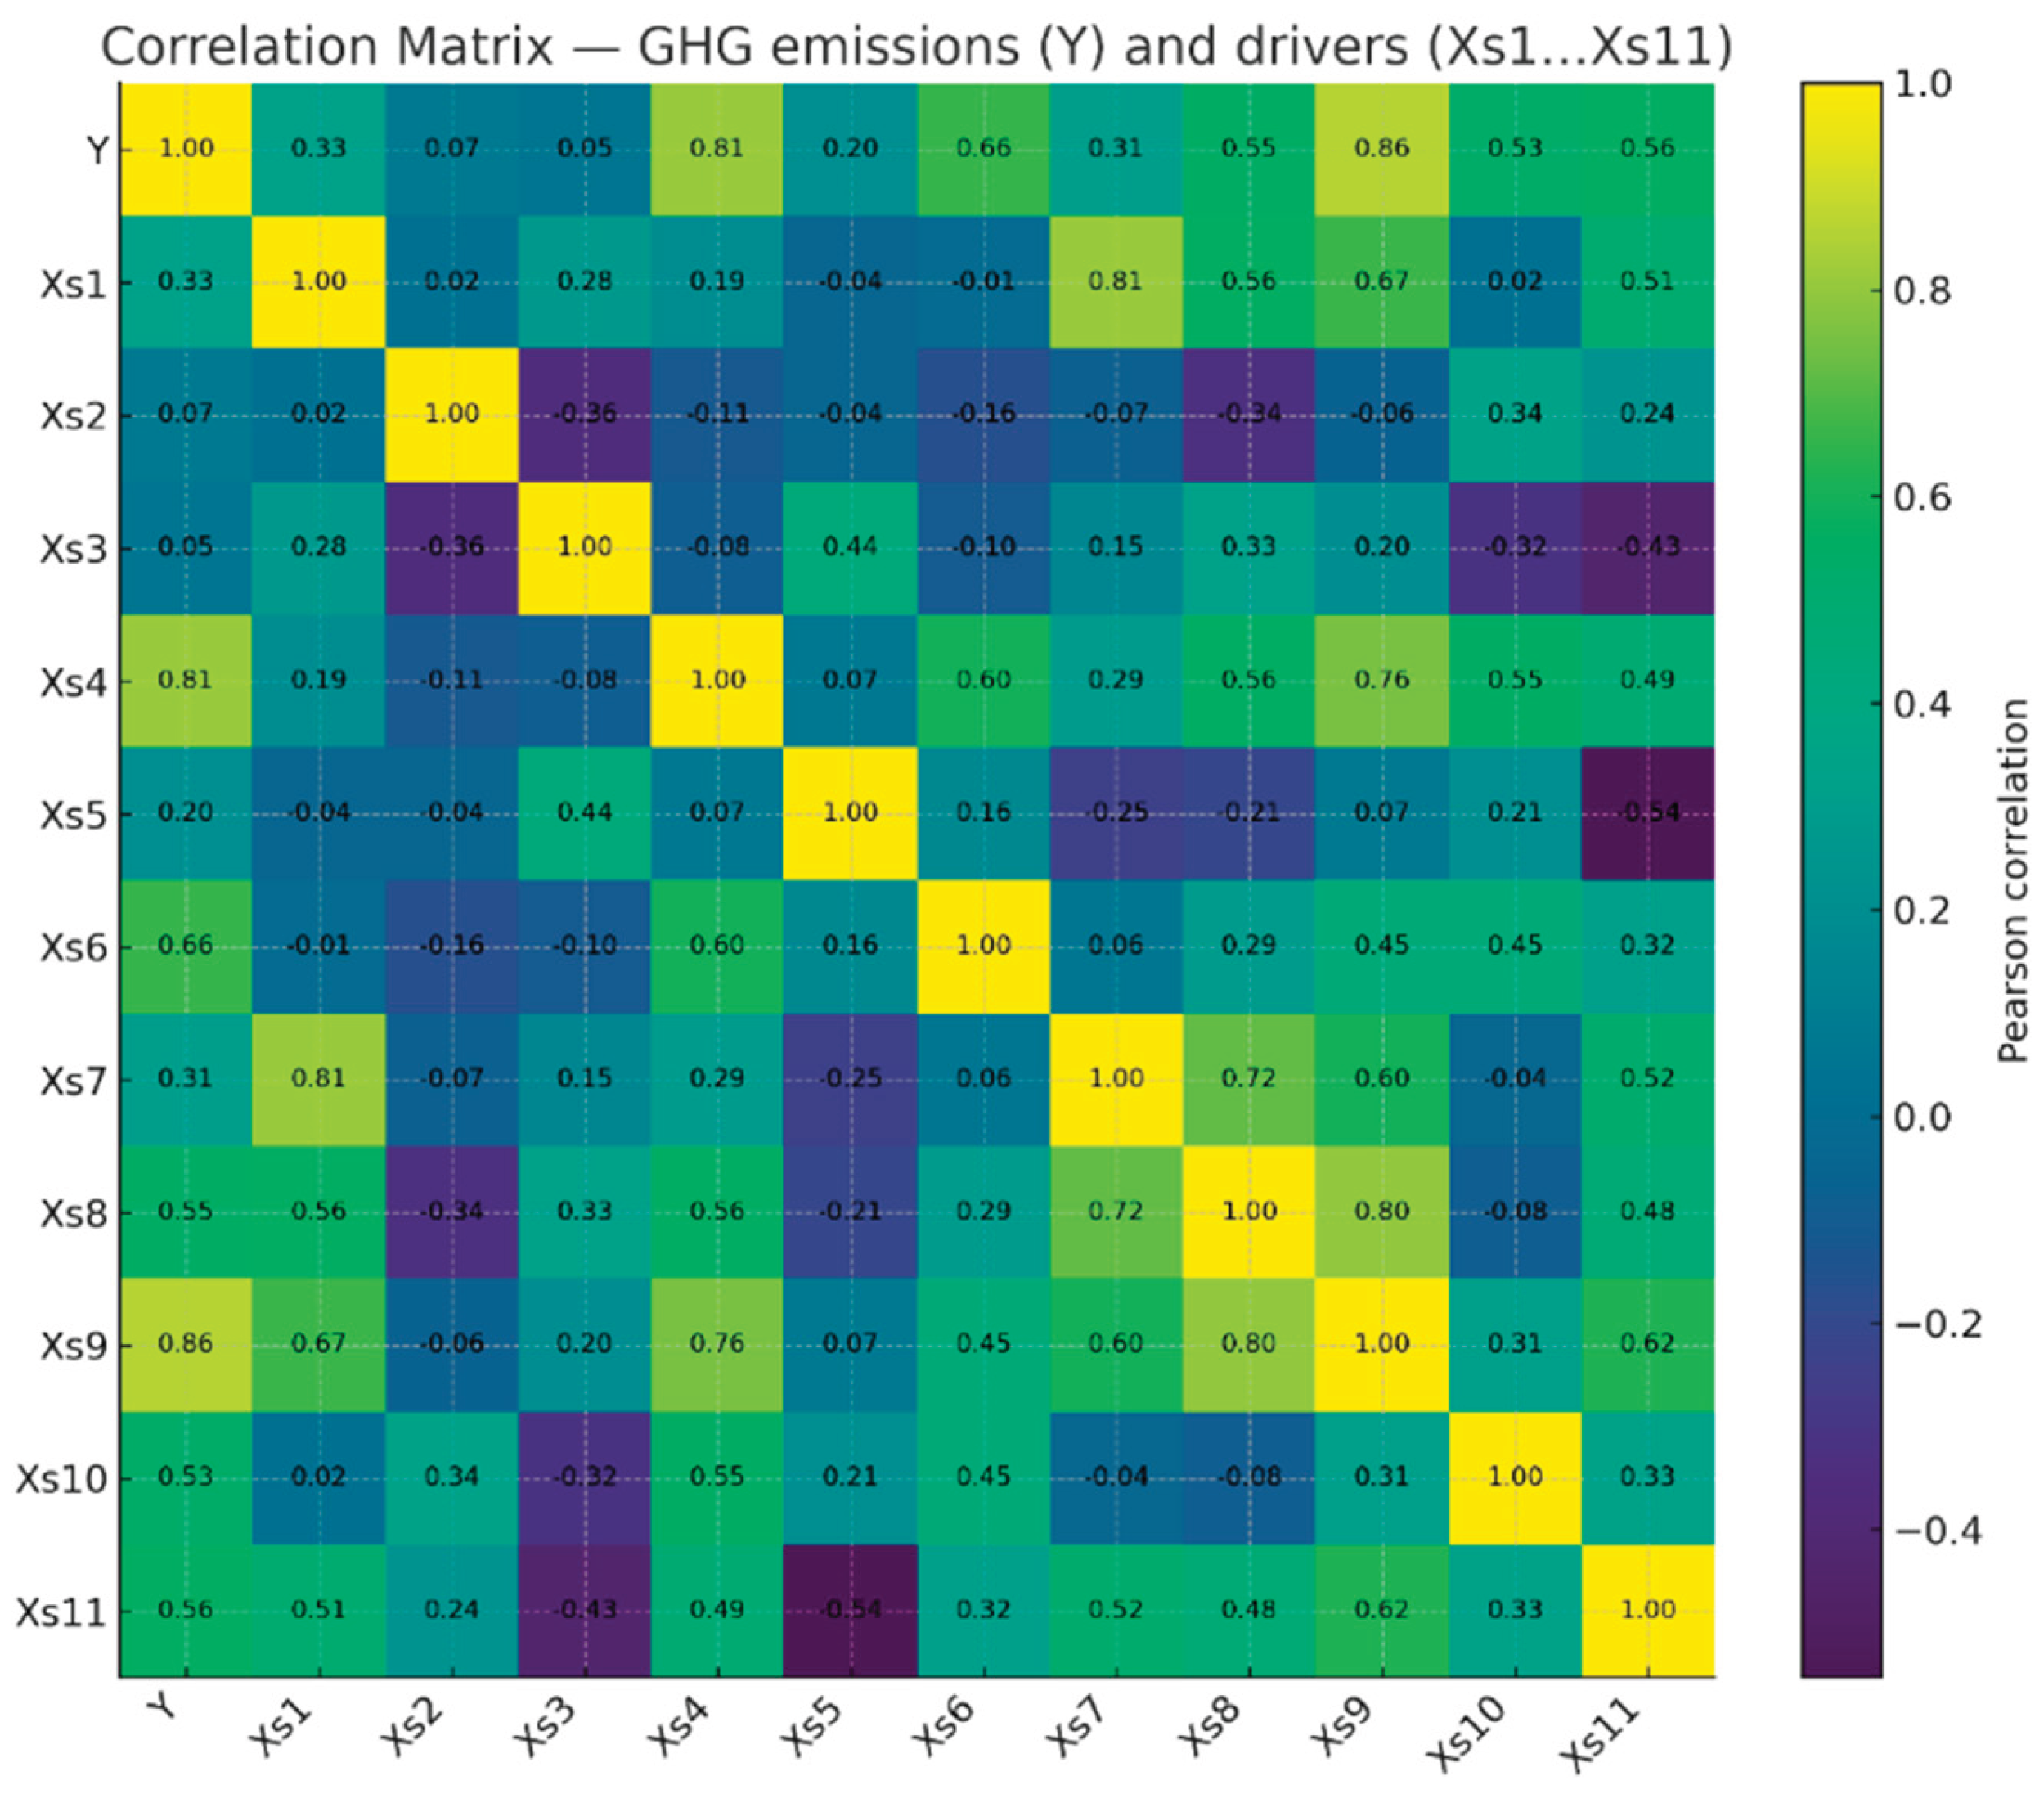
Figure 7.
Results of autocorrelation testing of social responsibility indicators for oil and gas companies.Note: constructed using R.
Figure 7.
Results of autocorrelation testing of social responsibility indicators for oil and gas companies.Note: constructed using R.
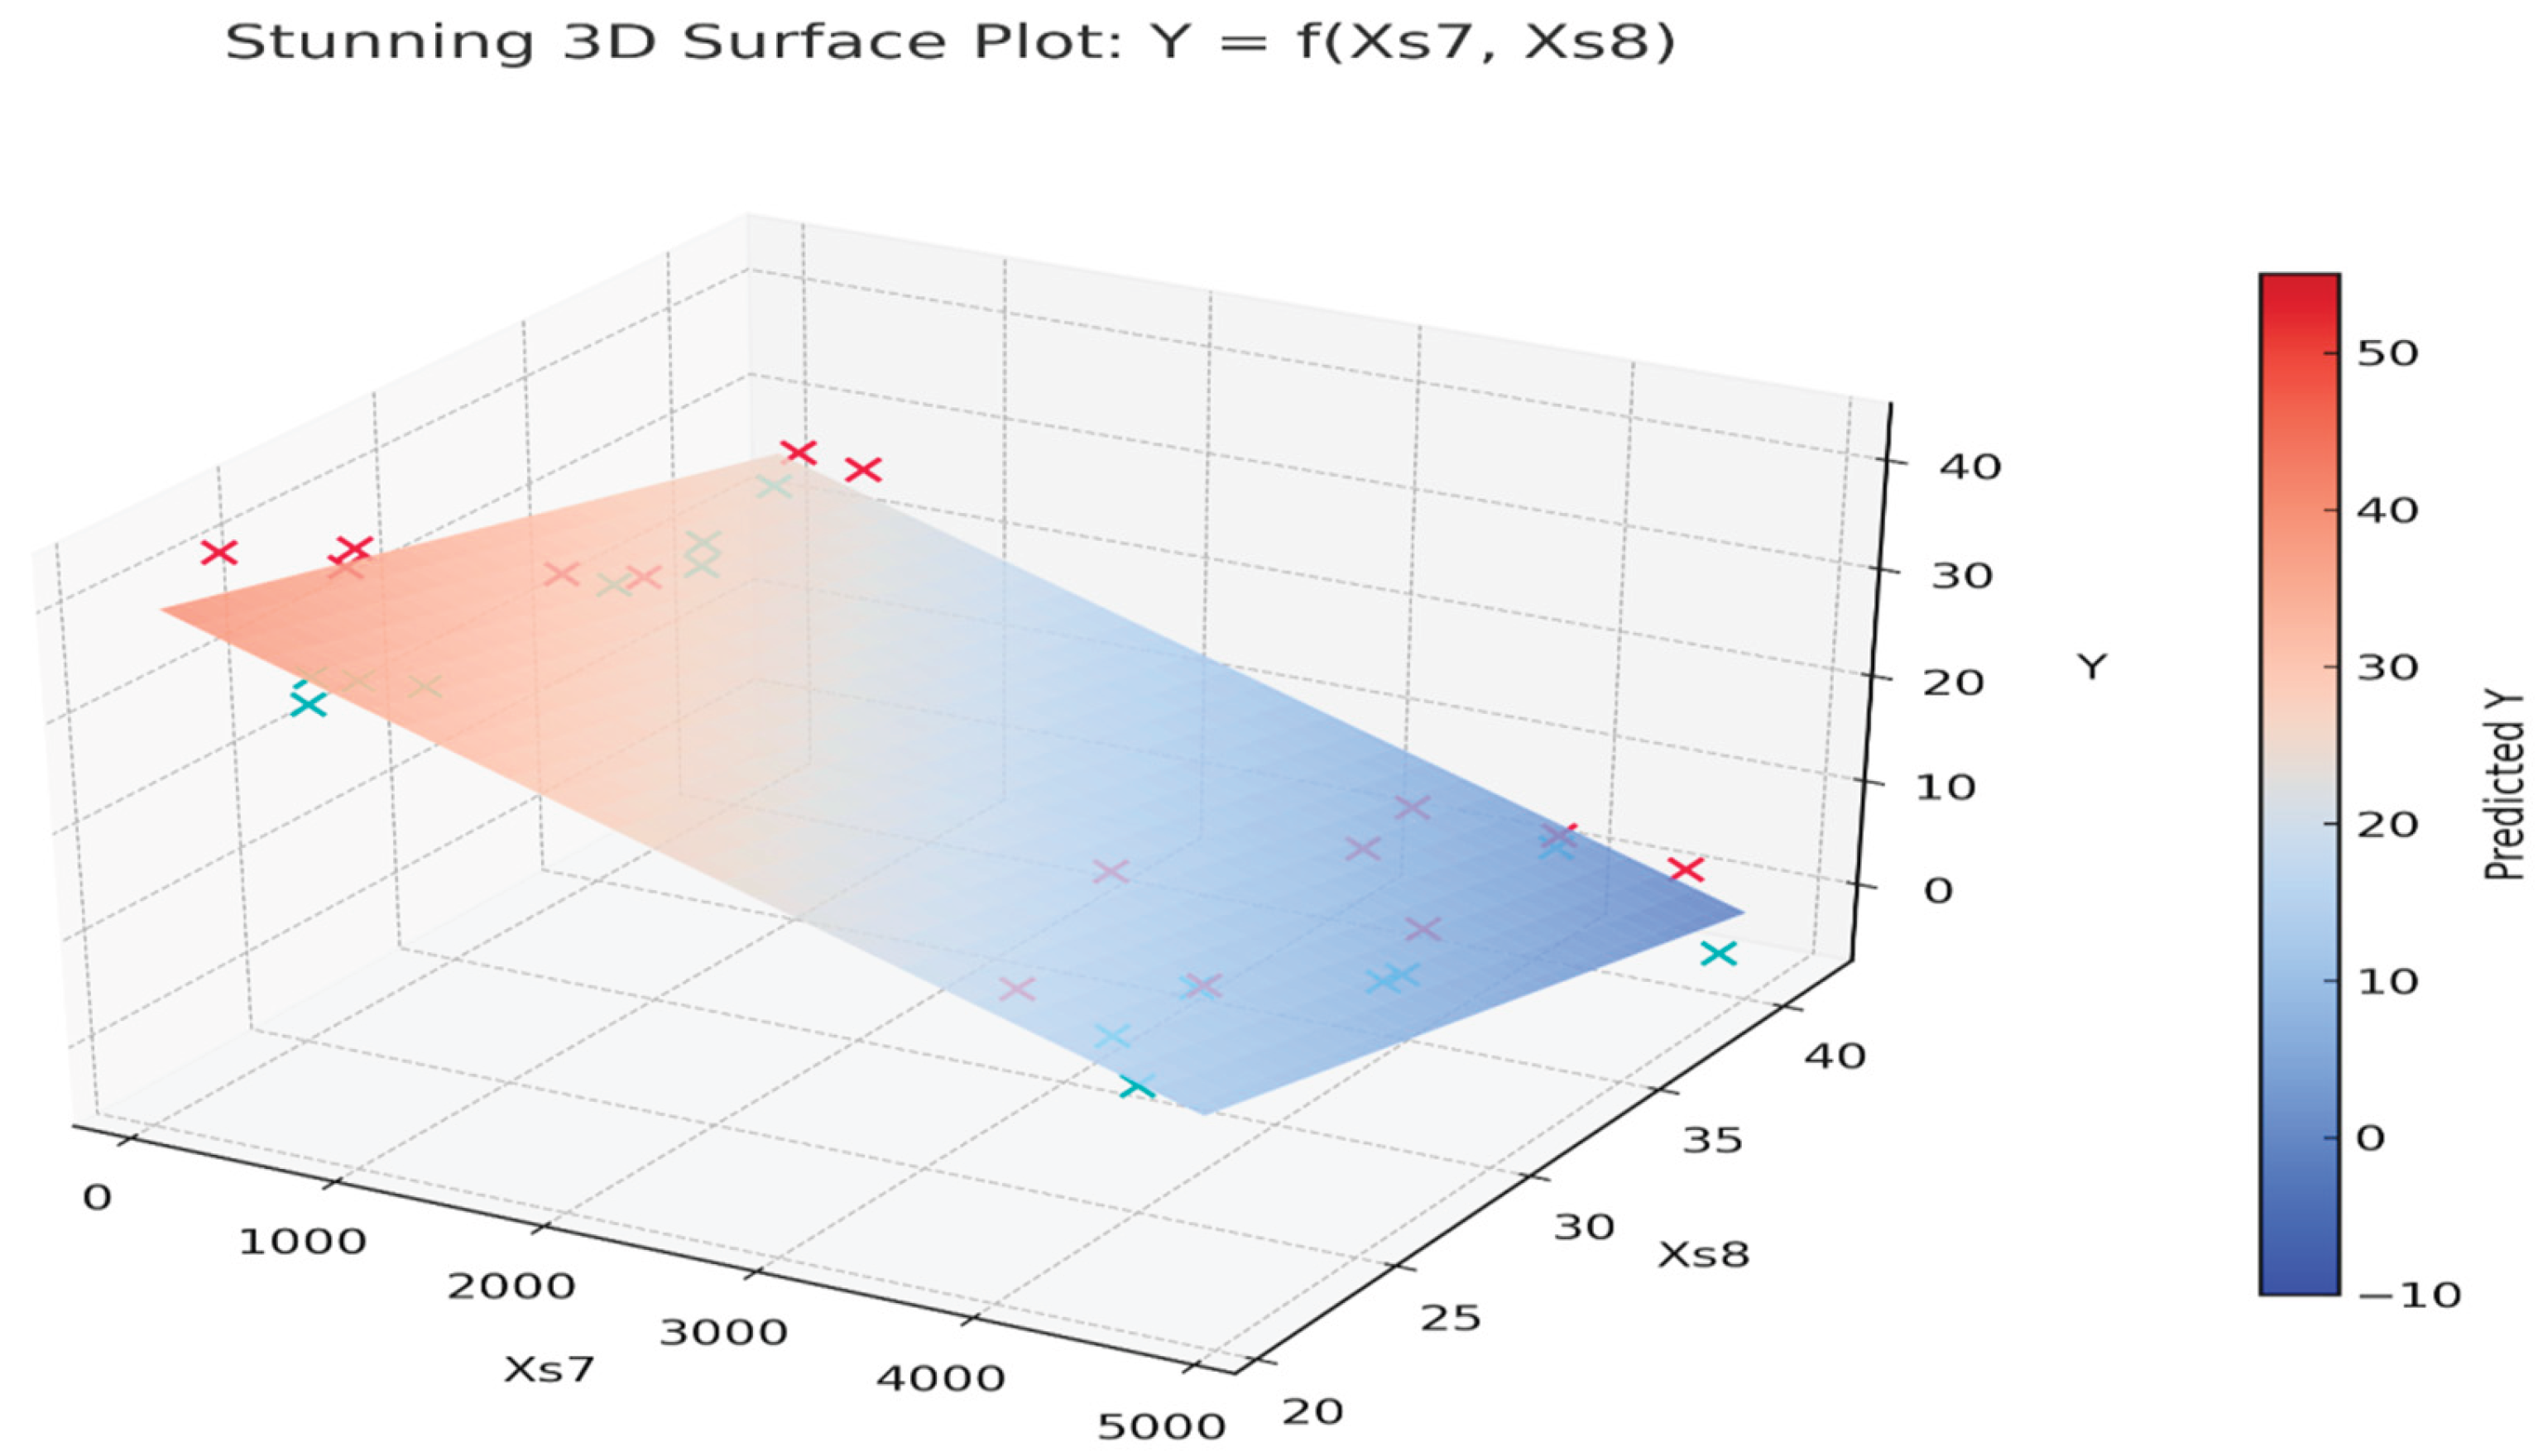
Figure 8.
PCA Biplot for variables X1G–X10G, demonstrating management responsibility of companies in the oil and gas sector. Note: constructed using R.
Figure 8.
PCA Biplot for variables X1G–X10G, demonstrating management responsibility of companies in the oil and gas sector. Note: constructed using R.
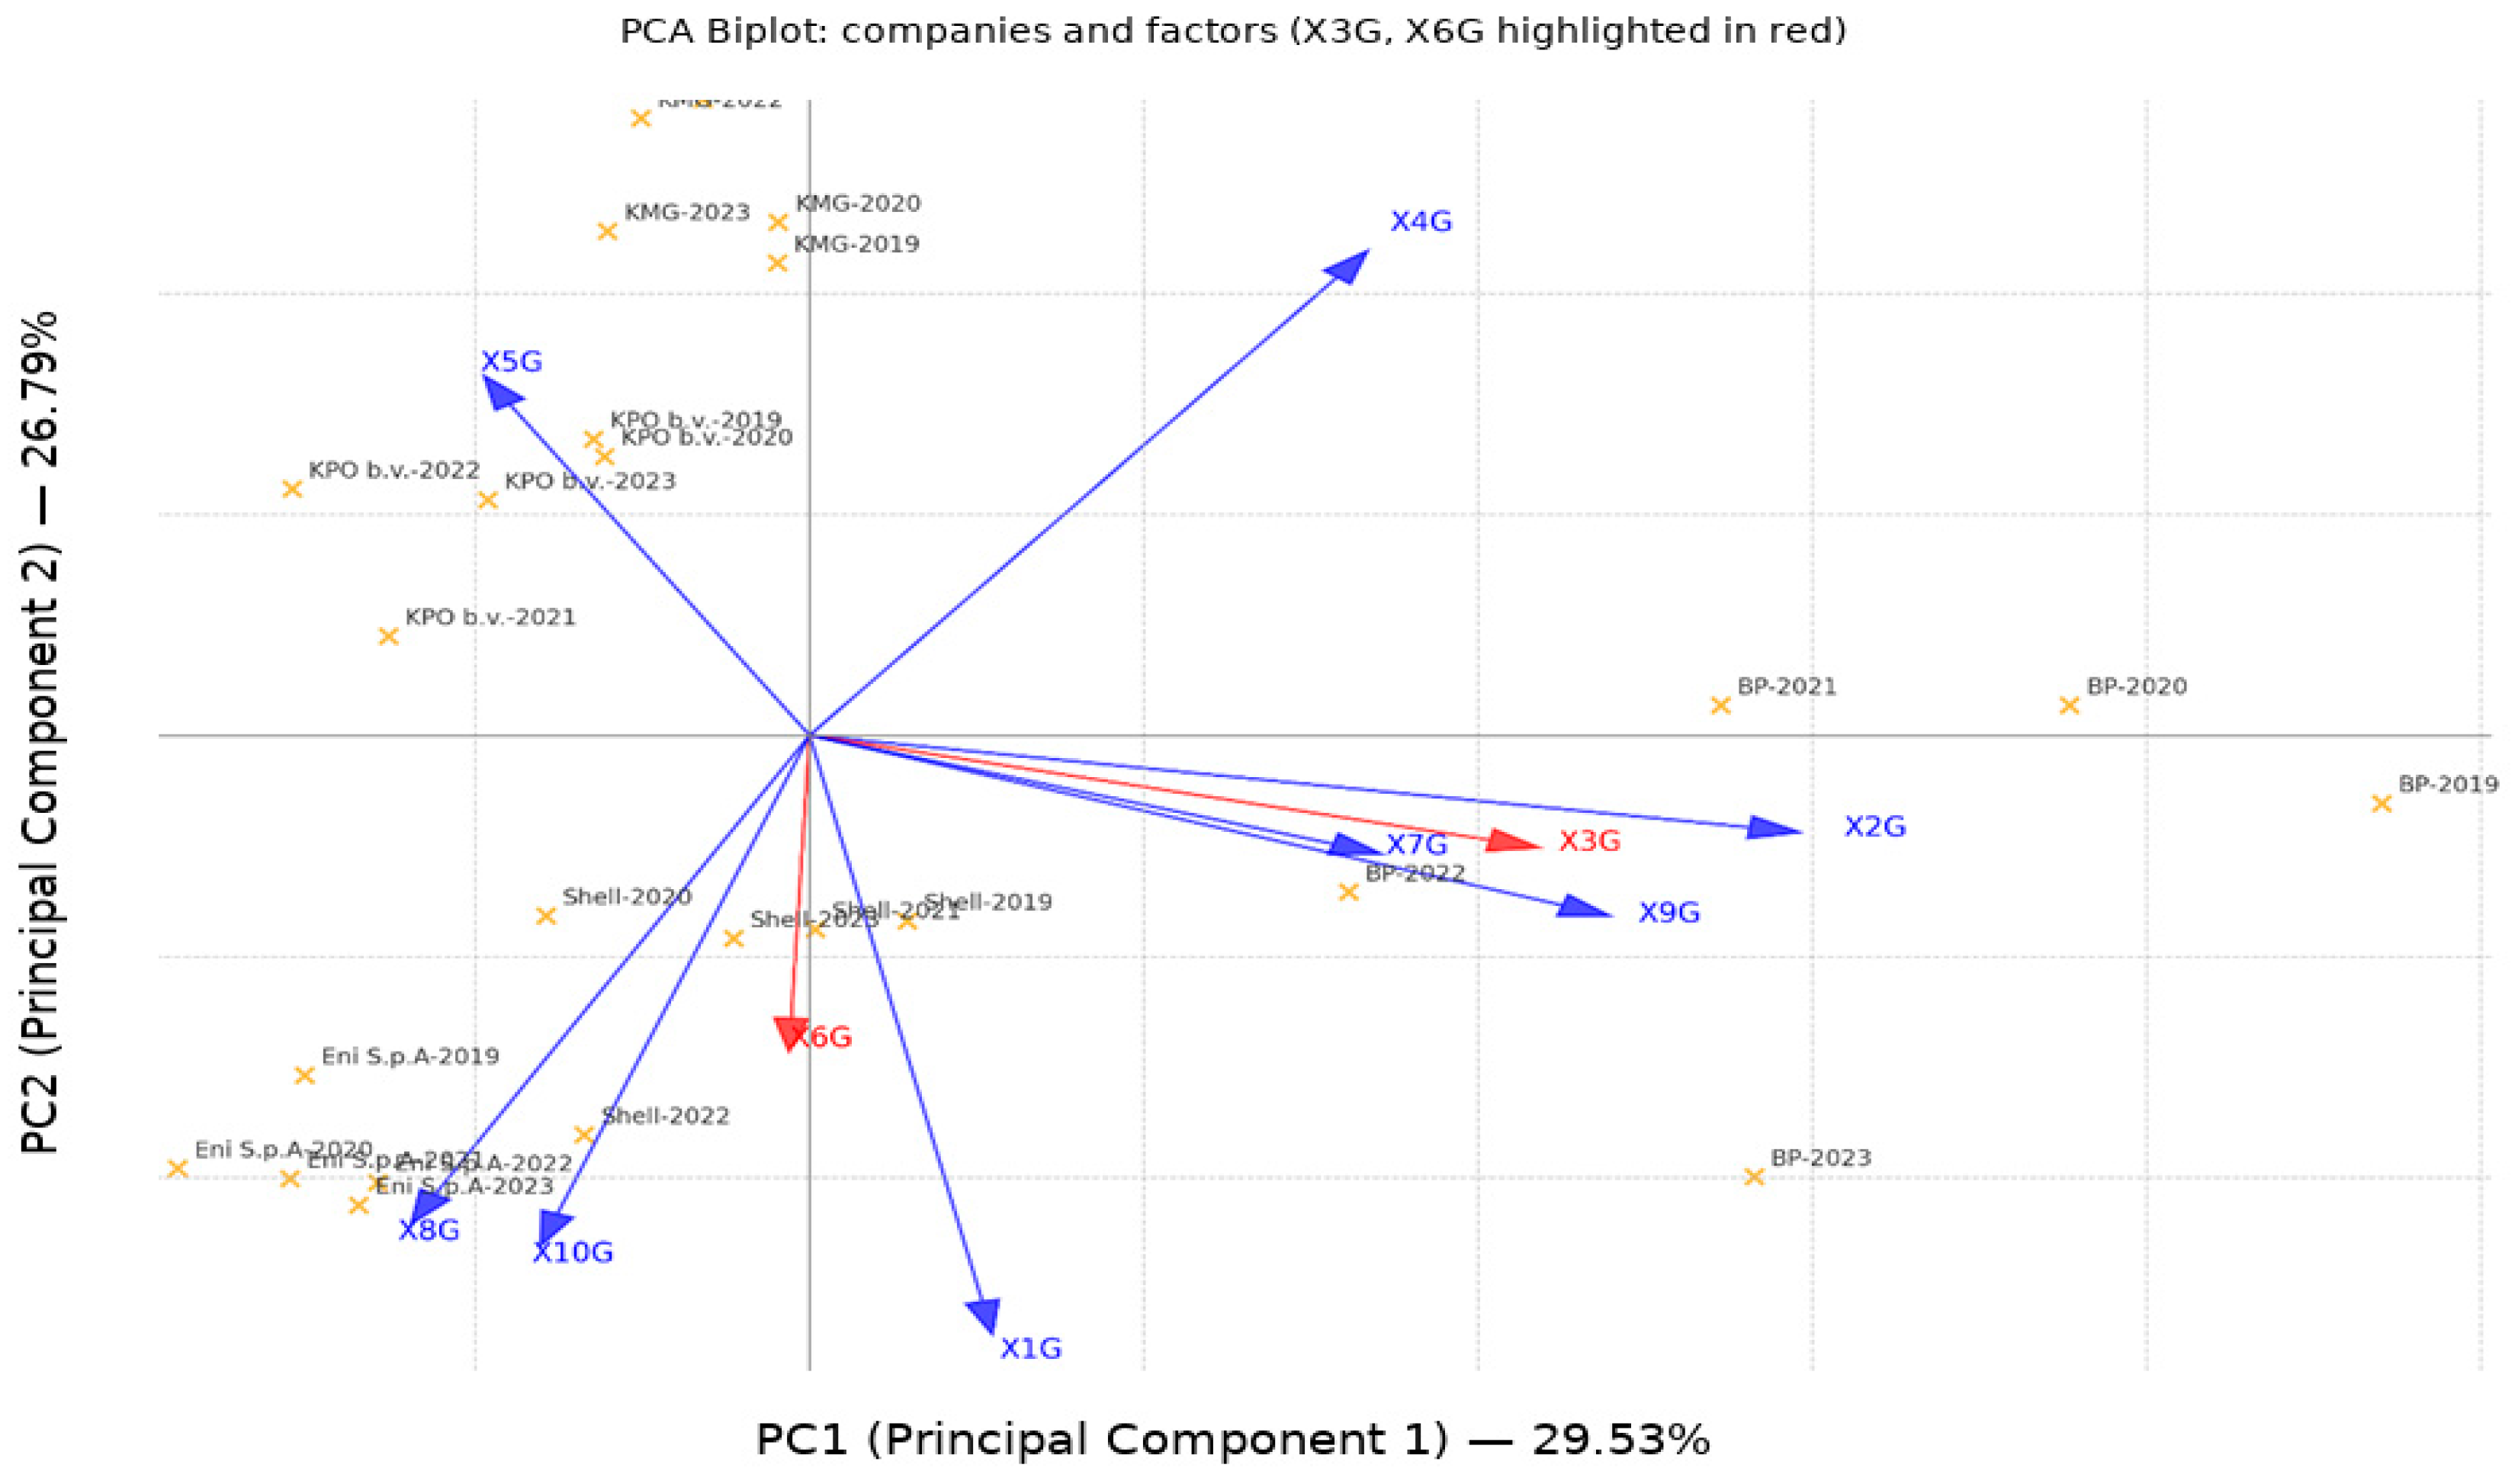
Figure 9.
Results of forecasting GHG emissions (mil.t CO2 equivalent) into the atmosphere based on the integrated S+G model for KPO. Note: compiled using R.
Figure 9.
Results of forecasting GHG emissions (mil.t CO2 equivalent) into the atmosphere based on the integrated S+G model for KPO. Note: compiled using R.
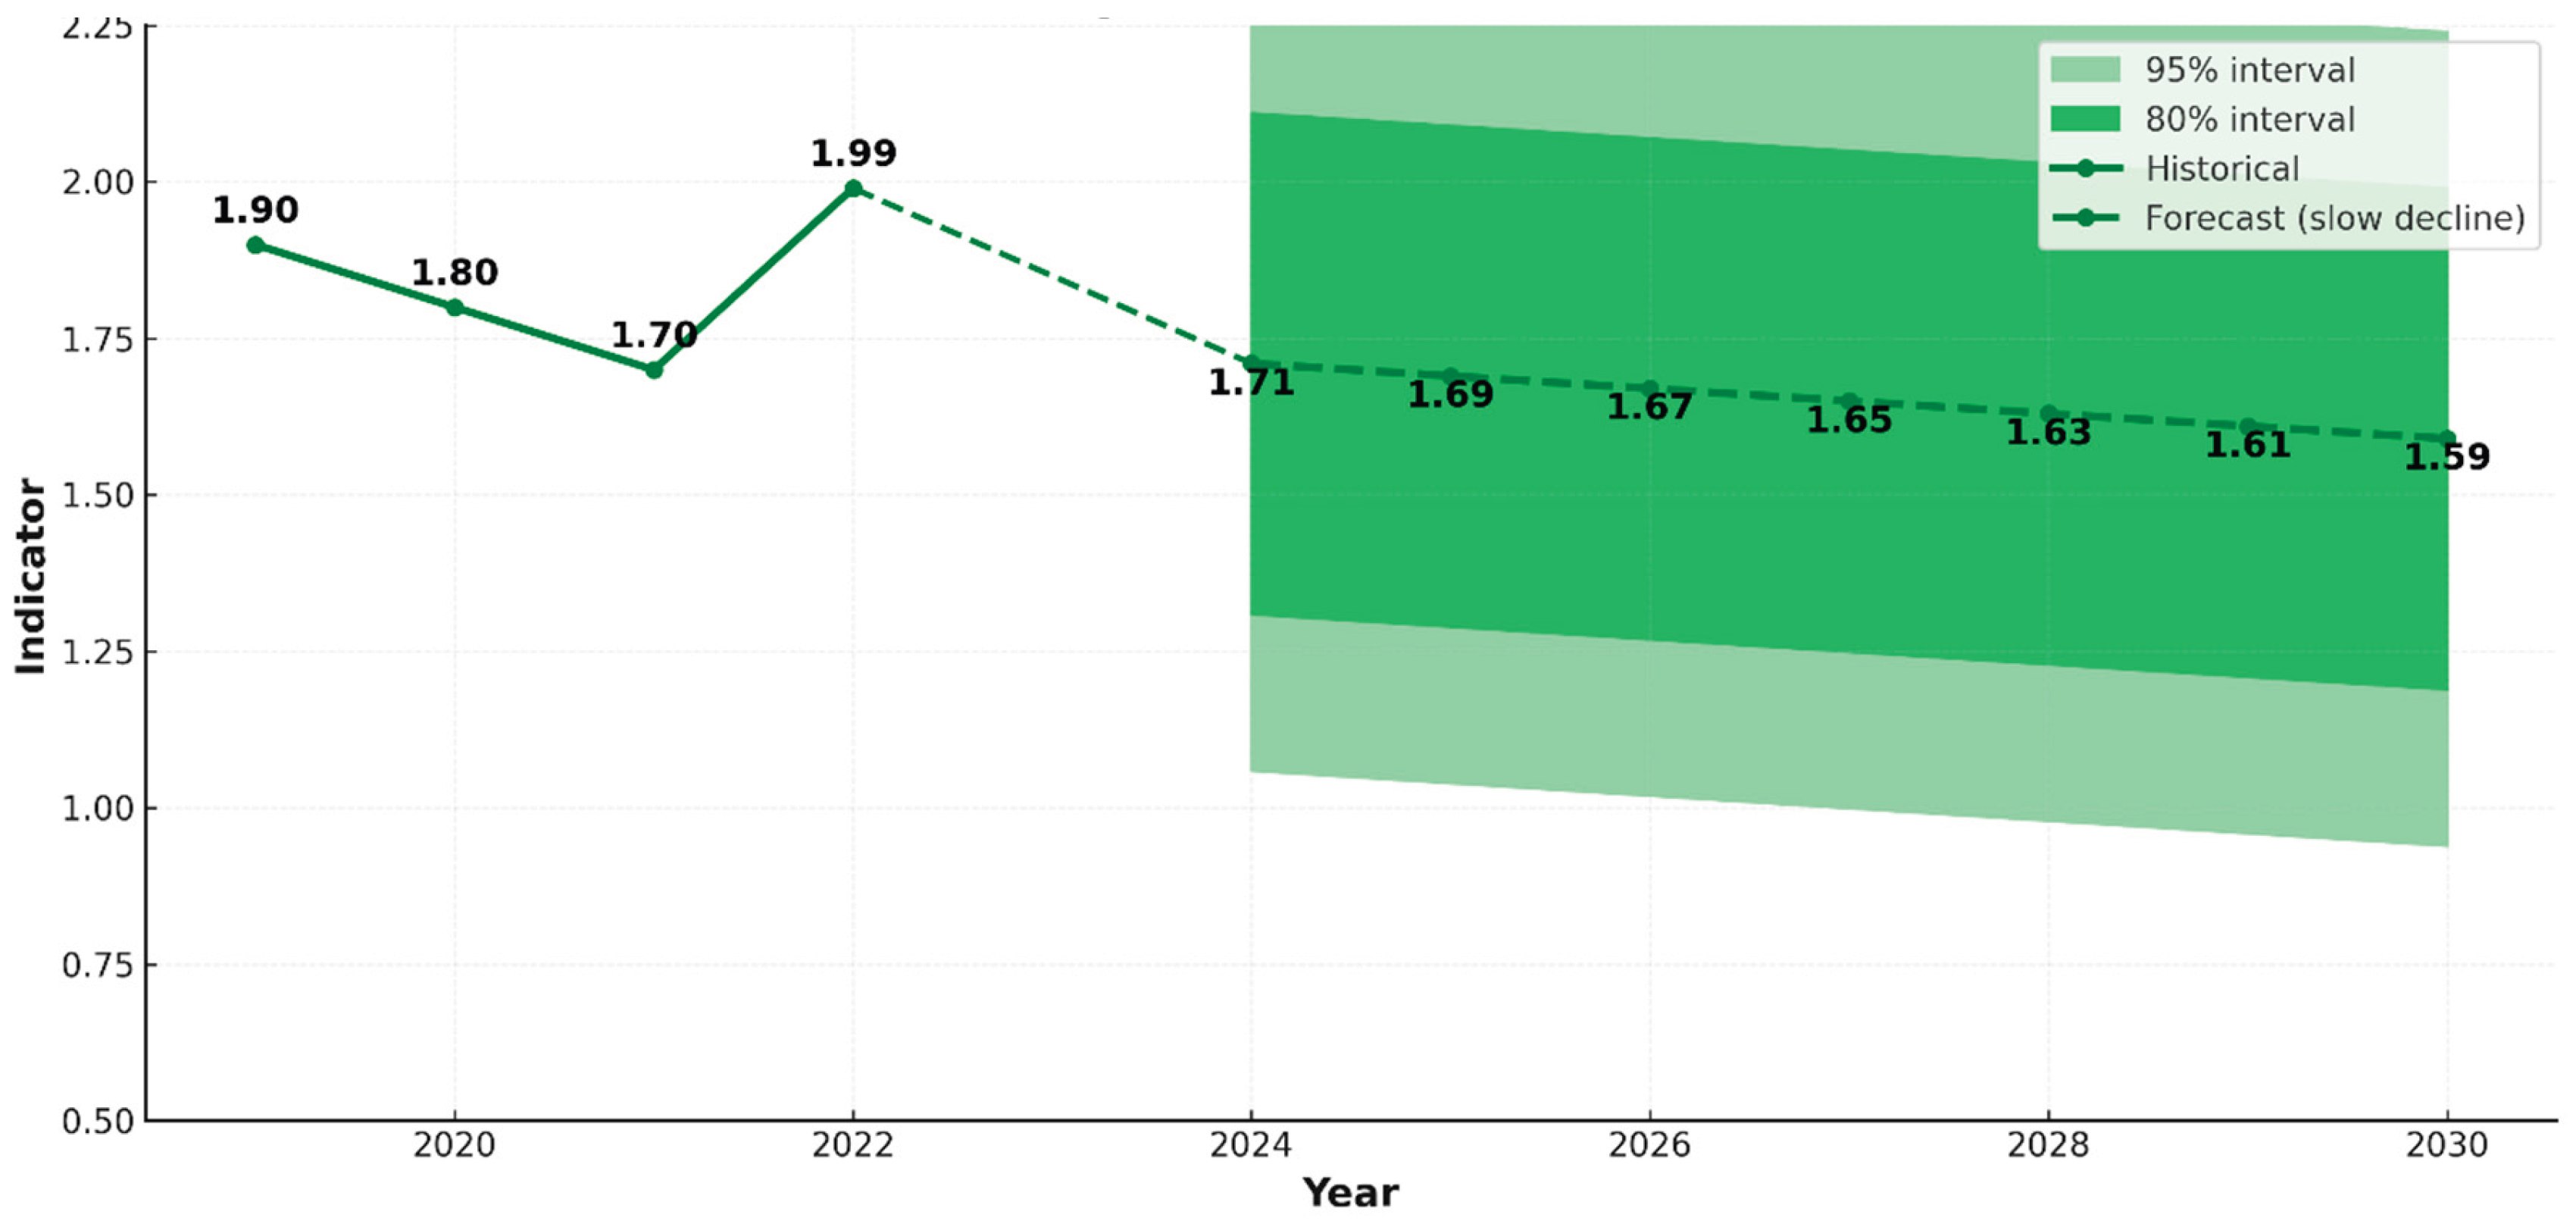
Table 2.
Algorithm for implementing the Environment component of KPO’s ESG strategy to reduce air pollution.
Table 2.
Algorithm for implementing the Environment component of KPO’s ESG strategy to reduce air pollution.
| Essence/meaning | Interaction | Frequency of implementation | Management level, responsible person | Management risks | |
|---|---|---|---|---|---|
| Assesment of the current state |
Assessing achievements and gaps in reducing air pollution and implementing sustainable practices | Annually, according to the terms of preparation of the SDR | KPO Environmental Department; Responsible person - Senior Management - Managing Director for Strategy/Deputy General Director |
Failure to comply with international and national standards and regulations can lead to fines, legal consequences, and damage to a company’s reputation. Failure to take current trends into account will lead to additional costs. | |
| Defining goals | Defining the SDGs of both the company itself and its role in the sustainable development of the region and ways to achieve them | according to GRI - annual review and updating of objectives (KPO, Eni) | Middle and senior management (heads of departments responsible for implementing the relevant ESG principle). For KPO, the team responsible for developing the “Green Strategy” and ESG goals is approved by the KPO Board of Directors. | The unattainability of the set goals from the standpoint of resource inadequacy (time, financial, technological, human) can reduce the effectiveness of the measures being implemented | |
| Accountability and transparency | Creation of mechanisms and tools to ensure transparency of ESG implementation processes | Annually, according to the ERM compilation deadlines. Ongoing coverage of ESG events/incidents | KPO Environmental Department, which is responsible for the implementation of sustainable development principles, the responsible person is senior management - Managing Director for Strategy / Deputy General Director | Risks of insufficient resources and investment, insufficient transparency and reporting, and risks of greenwashing | |
| Environmental Management System | Planning environmental activities and monitoring their implementation | Implementation and review of environmental management systems on an annual basis (KPO, Eni) | Special committees and working groups implement an integrated management system that covers occupational health, safety, and environmental protection. The responsible person is the Director of Health, Safety, Environment, and Integrity. | Risks associated with non-compliance with national and international environmental standards, insufficient transparency and reporting | |
| Energy efficiency | Rational use of energy resources, reduction of energy costs | In accordance with GRI 302, the frequency of implementation of energy efficiency measures within the framework of the ESG strategy of KPO includes both annual and long-term plans, for example from 2022-2026. | KPO implements an energy management system in accordance with ISO 50001:2018. Special committees and working groups are in place. The responsible person is senior management – Managing Director for Strategy/Deputy General Director. | Environmental, technological and reputational risks | |
| Using the best avalable technologies (BAT) |
Implementation of projects to introduce the best technologies for both reducing environmental pollution and business management | BAT implementation should be ongoing, with an annual review | The Committee is responsible for the implementation of sustainable development principles and environmental management, including the introduction of BAT. The responsible person is senior management - Managing Director for Strategy / Deputy General Director | Technological risks, lack of resources and investment, non-compliance with regulatory requirements | |
| Waste management |
Implementation of measures for the collection, accumulation, transportation, processing, disposal or rendering harmless of waste, supervision of these processes | constantly | KPO Environmental Department, which is responsible for the implementation of programs to reduce waste generation and minimize their negative impact on the environment. Responsible person - senior management - Managing Director for Strategy / Deputy General Director | Non-compliance with regulations, lack of transparency and reporting; changing public opinion and pressure from environmental organizations | |
| Using of RES | Reduction of pollutant emissions; Compliance with environmental standards, Economic efficiency | Every year, according to GRI | The committee is responsible for sustainable development and environmental management. The person responsible is senior management - Managing Director for Strategy/Deputy CEO. | Non-compliance with regulatory requirements, technological risks, lack of resources and investment | |
| Innovation and research |
EIA; Development of new technologies; economic efficiency |
Annual reports on achieved results and future plans, which comply with GRI requirements for transparency and reporting | Project team responsible for innovation and research aimed at reducing air pollution; Person in charge - Senior Management - Managing Director for Strategy / Deputy CEO | Lack of resources and investment; insufficient personnel qualifications; non-compliance with regulatory requirements | |
| Carbon Footprint |
Reducing the negative impact on the environment, assessing the level of pollution | constantly | KPO Environmental Department, which is responsible for the implementation of programs to reduce waste generation and minimize their negative impact on the environment. Responsible person - senior management - Managing Director for Strategy / Deputy General Director | Non-compliance with regulations, lack of transparency and reporting; changing public opinion and pressure from environmental organizations | |
Table 3.
Algorithm for implementing the “Social” component of KPO’s ESG strategy to reduce air pollution Management risks.
Table 3.
Algorithm for implementing the “Social” component of KPO’s ESG strategy to reduce air pollution Management risks.
| Essence/meaning | Interaction | Frequency of implementation | Management level, responsible person | Management risks | |
|---|---|---|---|---|---|
| Employee Ralations | creating a sustainable and responsible company | Constantly, annually within the framework of the SDR | The contractor’s committee, which develops the company’s sustainable development strategy, is responsible for senior management - the Managing Director of Human Resources. | Violation of workers’ rights, lack of transparency leading to social conflicts | |
| Diversity, Equity and Inclusion |
Creating equal opportunities, social responsibility | Constantly, annually within the framework of the SDR | A contractor committee that develops measures for the company’s development, including aspects of diversity and inclusion; the person in charge is senior management - the Managing Director of Human Resources. | Lack of employee engagement, reputational, financial, and legal risks | |
| Labor Practicies | Working conditions and workers’ rights, Social responsibility | Constantly, annually within the framework of the SDR | Occupational Health and Safety and Environment Working Groups, responsible person - HR Director, senior management - HR Managing Director | Violation of labor rights, unsafe working conditions leading to social conflicts | |
| Community Engagement | Community engagement strengthens social ties and contributes to a better quality of life in the region | Constantly, annually within the framework of the SDR | Stakeholder Engagement Committee, responsible person - senior management - Managing Director for Strategy | Ineffective communication and violation of regulatory requirements can lead to social conflicts and reputational risks | |
| Suply Chain ; Labor Standarts | Sustainable supply chain practices help minimize negative environmental impacts | Constantly, annually within the framework of the SDR | A special subcommittee responsible for the implementation of ESG strategies, including supply chain management and compliance with labor standards; the person in charge is senior management - the Director of Sustainability | Lack of personnel qualifications, economic, reputational, social risks | |
| Human Rights Policies | compliance with legal regulations, creating a sustainable and responsible business model | Constantly, annually within the framework of the SDR | Sustainable Development Subcommittee (Senior Management: Director of Sustainable Development) | Violations of workers’ rights and a lack of transparency can lead to reputational damage. | |
| Health and Safety | preventing accidents and ensuring safe working conditions | Constantly, annually within the framework of the SDR | Occupational Health and Safety and Environment Working Groups, responsible person - HR Director, senior management - HR Managing Director | Risks of industrial injuries, insufficient personnel training, non-compliance with standards, emergency situations, reputational | |
| Training and Development | improving the skills of employees and implementing broad sustainable development goals | Constantly, annually within the framework of the SDR | The Sustainable Development Committee is responsible for the development and implementation of strategies, including employee training, and the person in charge is senior management - the HR Director. | insufficient staff qualifications, low employee engagement, and lack of clear goals and metrics can lead to reputational risks. | |
| Social Impact Investments | creating a sustainable and socially responsible business | Constantly, annually within the framework of the SDR | The Social Affairs Committee is responsible for the development and implementation of social programs aimed at improving the living conditions of local communities and employees. The person responsible is senior management - Managing Director for Strategy / Deputy CEO. | Risks of failure to meet stakeholder expectations, lack of transparency, changes in legislation, financial and reputational risks | |
| Stakeholder Engagement | contributes to improving relations with key groups, helps the company effectively achieve its goals | Constantly, annually within the framework of the SDR | committee responsible for interaction with interested organizations; responsible person - senior management - Managing Director for Strategy | Incomplete understanding of stakeholder needs, insufficient transparency, and lack of resources can lead to conflicts of interest and reputational risks. | |
Table 4.
Algorithm for implementing the “Governance” component of KPO’s ESG strategy to reduce air pollution.
Table 4.
Algorithm for implementing the “Governance” component of KPO’s ESG strategy to reduce air pollution.
| Essence/meaning | Interaction | Frequency of implementation | Management level, responsible person | Management risks | |
|---|---|---|---|---|---|
| Board Composition and Diversity | contributes to the improvement of corporate governance, increasing the sustainability and reputation of the company, compliance with modern requirements and expectations of stakeholders. | annually or as part of strategic planning | The Board of Directors of the company, responsible person - senior management - Director of Sustainable Development | Lack of diversity in the boardroom, conflicts of interest, lack of transparency, and poor risk management can lead to ignoring different perspectives, which will negatively impact the company’s strategy. | |
| Executive Compensation | contributes to the improvement of corporate governance and the overall development of the company | annually or as part of strategic planning | The Remuneration Committee is responsible for developing and implementing policies that link executive compensation to the achievement of ESG objectives; responsible person - senior management - Chief Sustainability Officer | Insufficient effectiveness of strategic and operational management may lead to non-compliance with established ESG goals and objectives, conflicts of interest, and reputational risks | |
| Stakeholder Rights | Involvement of all stakeholders, including investors, employees, customers and local communities, in the process of developing and implementing an ESG strategy | constantly | The Board of Directors ensures interaction with stakeholders, including investors, employees and local communities; the person responsible is the senior management of the company. | Lack of transparency can lead to mistrust from stakeholders, conflicts of interest, reputational and regulatory risks. | |
| Ethic and Complaince Program | developing a corporate culture based on honesty and responsibility, ensuring the integration of ethical standards into business processes and contributing to the achievement of the company’s environmental goals. | annually or as part of strategic planning | The Board of Directors is responsible for the strategic direction and oversight of the Ethics and Compliance Program; the responsible person is the Chief Ethics and Compliance Officer. | Lack of clear and transparent reporting on compliance with regulations and standards can lead to a lack of trust from stakeholders, including investors and the public. | |
| Risk Management Practicies | Systematic identification and analysis of risks associated with environmental, social, and governance aspects. | annually or as part of strategic planning | The Board of Directors and specialized committees responsible for strategic direction and oversight of ESG initiatives | Environmental, social, corporate, regulatory risks | |
| Entegral control and audit | the company’s compliance with environmental regulations and standards, which is important for reducing air pollution and minimizing the negative impact on the environment | annually within the framework of the SDR | The Sustainable Development Committee includes representatives from various departments to ensure a cross-functional approach to management; the responsible person is middle management (ESG managers), senior management (the Director of Internal Audit). | A lack of open data on a company’s activities can make it difficult to prove its sustainability to investors and regulators, which can lead to greenwashing, loss of trust, and reputational risks | |
| Corporate Policies and Procedures | form the basis for managing a company’s ESG aspects, creating clear goals and standards that guide the company’s actions in the area of sustainable development and air pollution reduction | Constantly | The Company’s Board of Directors is responsible for strategic direction and oversight of ESG initiatives, including the development and implementation of corporate policies and procedures. Responsible person: Senior Management - Chief Sustainability Officer | Insufficient integration of ESG into business processes can lead to a discrepancy between the stated goals and the actual actions of the company, reputational and regulatory risks | |
| Sustainability Integration | Integrating sustainability into a company’s business strategy allows for environmental, social, and governance considerations to be taken into account when making decisions. | annually within the framework of the SDR | The Board of Directors of the company, responsible person - senior management - Director of Sustainable Development | Reputational, financial, regulatory, operational risks | |
Disclaimer/Publisher’s Note: The statements, opinions and data contained in all publications are solely those of the individual author(s) and contributor(s) and not of MDPI and/or the editor(s). MDPI and/or the editor(s) disclaim responsibility for any injury to people or property resulting from any ideas, methods, instructions or products referred to in the content. |
© 2025 by the authors. Licensee MDPI, Basel, Switzerland. This article is an open access article distributed under the terms and conditions of the Creative Commons Attribution (CC BY) license (http://creativecommons.org/licenses/by/4.0/).
Copyright: This open access article is published under a Creative Commons CC BY 4.0 license, which permit the free download, distribution, and reuse, provided that the author and preprint are cited in any reuse.


