Submitted:
04 November 2025
Posted:
05 November 2025
You are already at the latest version
Abstract
Background/Objectives: Falls among elderly people pose a serious threat to their quality of life (QOL). However, overly restrictive preventive measures can inadvertently reduce activity levels and accelerate both cognitive and physical decline. Then, for effective fall prevention that respects residents’ autonomy, it is essential to understand the behavioral intentions and environmental circumstances leading to falls. However, in elderly care facilities, such information is often recorded only as free text in accident reports and remains insufficiently analyzed. This study aims to propose a method for visualizing patterns of behavioral intentions and accident contexts frequently observed in elderly care facilities. Methods: Fall-related accident reports collected from three Japanese care facilities were analyzed using an after-coding approach. Each report was labeled with three elements: (1) failed actions, (2) underlying behavioral intentions, and (3) staff involvement. A Sankey diagram was used to visualize the flow from residents’ intentions to actions and staff responses, enabling the identification of common accident pathways. Additionally, time-series graphs and interview insights were integrated to explore the characteristics of falls and potential intervention strategies. Results: Analysis identified 18 codes for failed actions, 20 for behavioral intentions, and 8 for staff involvement. The Sankey diagram revealed frequent cases where residents with cognitive and physical decline attempted to walk to the toilet without staff assistance, resulting in falls later discovered by staff. Facility-specific accident trends and situational differences were also visualized. Conclusions: This study identified hazardous daily behavior patterns unique to each facility. By focusing on behavioral intentions during accidents, the proposed approach may contribute to fall prevention strategies that respect residents’ voluntary actions and promote safer behavior without limiting independence.
Keywords:
elderly
; falls
; accident report analysis
; visualization
; behavioral intention
; staff involvement
; Sankey diagram
1. Introduction
Falls are the most frequently occurring accidents in elderly care facilities [1]. Fall accidents pose a significant risk of irreversibly lowering the quality of life (QOL) for elderly people, potentially leading to increased care dependency or even death [2,3]. Data indicates that one in three elderly people who have suffered a spinal or femoral fracture will experience another fracture within a year [4]. Once an elderly person sustains a fracture, their range of movement and level of activity are significantly reduced, and even with rehabilitation, full recovery of walking function is often difficult [5,6].
Interventions for fall prevention must balance two critical factors: minimizing accident risk and maintaining independent activity [7,8]. According to the World Health Organization (WHO), health is not merely the absence of disease or disability but includes physical, mental, and social well-being [9,10]. While falls themselves present a substantial physical risk, fear of falling may also lead elderly people to restrict their activities, which paradoxically increases the risk of cognitive and physical decline as well as social isolation [11,12,13]. Therefore, the goal is not merely to prevent accidents but to ensure that elderly people can safely achieve what they intend to do while minimizing unnecessary restrictions on their autonomy [14].
To achieve this, it is crucial to gain a detailed understanding of what elderly people were trying to do when they fell and how the accident occurred. However, most previous studies on falls in elderly people have focused on identifying individual risk factors rather than analyzing the specific circumstances of each accident. These risk factors include a wide range of elements, such as muscle weakness, medical conditions, sleep and activity patterns, medication use, fall history, cognitive status, physical activity levels, dietary habits, depression, living arrangements, and place of origin [15,16,17,18,19,20,21,22]. Based on these findings, numerous studies have been conducted on fall risk assessment [23,24,25]. Although there are fewer studies focusing on the circumstances of fall accidents, some research has utilized interviews with healthcare professionals [26], post-accident surveys [27], and analysis of accident reports [28,29]. However, these studies primarily examine aspects such as the location and time of the accident and the severity of injuries. To the best of our knowledge, no previous research has thoroughly investigated a detailed analysis of the behavioral intentions that led to the accident.
Detailed records of fall circumstances, including behavioral intentions, are typically documented in free-text format within accident reports. In Japan, both publicly operated and privately managed elderly care facilities are required to record accident reports in accordance with the guidelines of the Ministry of Health, Labor and Welfare (MHLW) under the long-term care insurance system [30]. However, these reports lack predetermined labels, making direct statistical analysis challenging. Although text mining techniques [31] can be used to visualize overall trends in accident reports, they are insufficient for analyzing specific accident patterns that link individual behavioral intentions with unique accident circumstances.
The objective of this study is to propose a method for visualizing patterns of behavioral intentions and accident circumstances that frequently occur in elderly care facilities. This approach enables a deep understanding of facility-specific accident patterns and the intentions behind actions at the time of incidents. Instead of merely restricting activities for accident prevention, it supports the consideration of interventions such as sensor placement and fall prevention mats to safely facilitate the behaviors user’s desire. This study shifts the focus toward enabling users to live independently while minimizing risks, aiming to provide insights into more comprehensive and user-centered intervention strategies.
2. Materials and Methods
2.1. Target Data
This study analyzed fall-related accident reports collected from three elderly care facilities in Japan. Accident reports are composed of the user’s age and gender, the date and time of occurrence, the location of the incident, the type of accident, the extent of any injuries, and a free-text description of the accident circumstances, which will be discussed later.
The primary facility selected for analysis was Facility X, a public temporally care facility that provides temporary rehabilitation care for a period of three to six months. Since users in this facility live actively in shared spaces rather than private rooms, the risk of fall accidents is relatively high. To evaluate the applicability of the developed analytical method and compare accident patterns across different facilities, we also included two privately operated fee-based residential homes, referred to as Facility Y and Facility Z. These facilities primarily accommodate long-term users, and most individuals spend their time quietly in private rooms, which contrasts with the environment of Facility X. The fall-related accident reports analyzed in this study were limited to those involving elderly individuals aged 65 years and older and occurring either in private rooms or in shared spaces within the care facilities. Table 1 presents the sample size for each facility. Differences in sample size reflect variations in facility scale and residential settings. Due to privacy and ethical restrictions, the original accident reports cannot be publicly shared. However, all processed and aggregated data utilized in this study are included in the article and its Appendix.
The free-text sections of the fall-related accident reports analyzed in this study contained narrative descriptions written by care staff. Each report was structured into the following three main sections:
- “Details and Causes of the Accident”
- “User’s Condition and Response After the Accident”
- “Preventive Measures and Improvements”
2.2. Analysis Method: After-Coding Approach
To extract and systematize patterns of behavioral intentions and accident circumstances from accident reports, we adopted the after-coding method [32]. This approach involves classifying free-text descriptions based on coding rules that were developed after data collection. Since comprehensiveness and reproducibility are essential, the coding rules were iteratively refined to improve their accuracy and consistency [32]. The specific procedures followed in this study are outlined below.
2.2.1. Establishment of Preliminary Coding Rules
The primary author reviewed all accident reports from Facility X and developed preliminary coding rules based on the following three categories to classify observed patterns:
Category 1: Failed Action
This category classifies the type of movement that the user attempted before falling. It includes seated, standing, lying down, and transitional movements between these positions.
Category 2: The Intention Underlying the Total Behavior
A total behavior” is defined as the sequence of behaviors starting from the moment one intends to do something, continuing through the achievement of that goal, and ending when one returns to a safe posture (such as sitting or lying down). For example, when someone intends to go to the toilet, there exists a nested relationship among various intentions—such as the intention to move toward the toilet, the intention to put on shoes to move, and the intention to retrieve one’s shoes for that purpose. Therefore, in this category, we decided to classify based on the intention of the ultimate goal achieved throughout the total behavior—in this case, going to the toilet.
Category 3: Staff Involvement During the Accident
This category classifies the level of staff involvement at the time of the accident, including directly assisting the user, witnessing the accident from a distance, and discovering the accident after it occurred
2.2.2. Initial Coding
The primary author classified each accident in Facility X based on the preliminary coding rules. During this process, if any ambiguities arose in code selection, the coding rules were refined. Additionally, if multiple uncategorized cases shared a common concept, a new code was introduced. For cases where the accident report lacked relevant descriptions for a given category, the following labels were assigned:
“N/A”: When the report did not contain any relevant description.
“Unclear”: When the report explicitly stated that the information was unknown.
“Other”: When the category was mentioned fewer than three times across all reports.
2.2.3. Revised Coding
After refining the coding rules, all accidents in Facility X were coded again using the finalized rules. To validate the reliability of the coding process, a co-author independently classified 10% of the accident reports following the same rules. Cohen’s kappa coefficient (κ) was then calculated to measure intercoder agreement [33].
2.2.4. Application to Other Facilities
The finalized coding rules were then applied to the accident reports of Facility Y and Facility Z. Cohen’s kappa coefficient (κ) was again calculated to evaluate intercoder agreement across the different facilities.
2.3. Visualization Methods
Two visualization techniques were used to analyze labeled report patterns.
2.3.1. Sankey Diagram
The flow of behavioral intentions, failed actions, and staff involvement was visualized using a Sankey diagram. The Sankey diagrams were generated using the Python library Plotly [34]. Originally designed for visualizing energy and material flows [35], Sankey diagrams are widely used in economics, logistics, and environmental studies to map complex interactions and pathways [36,37]. This method enables the representation of frequently occurring patterns in the sequence from intention to action to staff response. To avoid excessive complexity in the diagrams, only the top seven behavioral intentions leading to accidents in Facility X were labeled.
2.3.2. Time-Series Graph
To identify the time periods during which different behavioral intentions led to accidents, a bar graph was created to show the frequency of accident-related behavioral intentions by time of the day. This visualization aids in planning enhanced monitoring and proactive staff interventions at critical time periods. Since sample sizes were insufficient for Facility Y and Facility Z, the time-series graph was created only for Facility X. To improve readability, only the top seven behavioral intentions leading to accidents in Facility X were labeled.
2.4. Validation Through Semi-Structured Interview
To supplement the quantitative analysis, a semi-structured interview was conducted with the facility office director of Facility X. The director has many years of experience at the facility and possesses a deep understanding of users’ behavioral patterns and accident trends. A one-hour online interview was conducted to verify whether the patterns identified from accident reports aligned with actual conditions at the facility. Additionally, contextual factors underlying frequently occurring accidents are discussed from the perspective of on-site staff in this interview.
2.5. Ethical Considerations
The research protocol was reviewed and approved by the Ethics Review Board of the Institute of Science, Tokyo (Ethics Approval Number: A2022269, A23398). All accident reports were anonymized to protect users’ privacy. Before conducting the semi-structured interview, both verbal and written informed consent was obtained from the facility director of Facility X.
3. Results
3.1. Coding Results
Analysis of the accident reports identified 18 codes in Category 1: Types of Failed Actions (Table A3), 20 codes in Category 2: The Intention Underlying the Total Behavior (Table A4), and 8 codes in Category 3: Staff Involvement During the Accident (Table A5). To validate intercoder reliability, Cohen’s kappa coefficient (κ) was calculated for each category (Table 2). The κ values ranged from 0.7 to 0.9 across all dimensions, indicating substantial to almost perfect agreement. According to previous studies, κ values between 0.61 and 0.80 indicate substantial agreement, while values between 0.81 and 1.00 indicate almost perfect or perfect agreement.
3.2. Visualization of Accident Patterns
Figure 1, 3(left) and 3(right) present Sankey diagrams illustrating the patterns of behavioral intentions, failed actions, and staff involvement in fall accidents across Facilities X, Y, and Z. These diagrams visualize frequently occurring accident sequences, such as users attempting to stand up or walk to the toilet, falling, and then being discovered by staff afterward.
Figure 2 displays a bar graph showing the top seven behavioral intentions leading to accidents in Facility X, categorized by time of the day. For example, the results reveal that fall accidents related to toilet use or movement between seats and locations occur most frequently between 11:00 PM and 4:00 AM (nighttime) and between 10:00 AM and 2:00 PM (midday). This visualization highlights temporal patterns of fall incidents.
3.3. Insights from the Interview
The semi-structured interview with the facility director of Facility X provided qualitative insights that validated the quantitative findings and supplemented the contextual understanding of accidents. The director emphasized that standing-related movements pose a significant fall risk, stating:
“Any action involving standing up independently generally carries a risk of falling. Ideally, staff should assist users before they stand up. However, in reality, many accidents occur after users have already started walking or after they have fallen.”
Regarding the high frequency of toilet-related accidents, the director noted:
“The toilet is recognized as one of the most dangerous locations from the staff’s perspective.”
These statements suggest that the Sankey diagram in Figure 1 accurately reflects real-world accident conditions at the facility. Additionally, the director provided further context on users’ behaviors and psychological tendencies, explaining:
“Users often fail to accurately perceive changes in their physical abilities and assume they can perform actions independently, which frequently leads to accidents. Even when staff instruct them to call for assistance, cognitive decline may cause them to forget, or they may feel reluctant to bother busy staff members, leading them to act alone.”
These insights highlight the behavioral and psychological factors contributing to fall incidents.
4. Discussion
4.1. Frequent Patterns of Fall Accidents
The most prominent pattern observed in Figure 1 (Sankey diagram of Facility X) which has largest node was: “A user attempts to go to the toilet, stands up or starts walking, falls, and is then discovered by staff after the accident.” This pattern was also identified in Figure 3 (left: Facility Y), indicating a consistent trend across multiple facilities. These findings align with previous studies that highlight the high fall risk associated with toilet-related activities [38]. Toileting is often urgent for users, and individuals who typically use wheelchairs or walkers may attempt to stand up quickly and move without staff noticing, leading to a loss of balance and a fall due to lack of support. Additionally, Figure 2 (time-series graph) shows that toilet-related accidents occur most frequently at night and around midday. As for nighttime incidents, since most falls during this period are toilet-related, placing bedside motion sensors could help alert staff when a user begins to stand, allowing them to provide timely assistance. As for daytime incidents, since users engage in various activities during the day, monitoring their individual toileting routines and implementing proactive verbal reminders from staff may be effective in reducing falls. However, ensuring that staff are always present before users stand up is challenging within severe shortage of human resources. Therefore, additional alert systems that notify staff when high-risk movements begin and encourage users to wait for assistance will be necessary (further discussed in Future Work).
Another frequently observed pattern was that users attempted to stand up and move between their seat and room or attempted to walk or transfer between positions, fell, and were later discovered by staff. According to Figure 2 (time-series graph), these incidents peaked at 10:00 AM and 4:00 PM, which corresponds to the times when users in Facility X typically move between their private rooms and shared spaces. Since these accidents exhibit clear time-related patterns, preventive strategies such as proactive verbal reminders for high-risk users may be effective.
Another prominent accident pattern involved users failing to maintain seated posture and later being found after falling. The behavioral intentions behind these incidents varied and included actions such as reaching for an object, throwing something away, or cleaning up. These falls often occurred when users attempted to complete minor tasks independently, leading to unstable postures in wheelchairs or chairs and resulting in falls. As shown in Figure 2, accidents related to reaching for objects were distributed throughout the daytime hours. To prevent such incidents, it may be needed to identify users’ specific needs and implement systems to detect hazardous postures and provide real-time feedback to prevent falls before they occur.
4.2. Patterns of Staff Involvement
The Sankey diagram also revealed differences in staff involvement at various phases of users’ movements. A large number of accidents occurred outside direct staff supervision, which is consistent with previous studies [39]. In Figure 1, focusing on Q2 (Types of Movements), the results show that accidents involving standing up and walking or maintaining a standing position were more frequent, whereas accidents involving sitting down were less common. Additionally, calculating the transitions ratio from Q2 (Types of Movements) to Q3 (Staff Involvement) in coded data, the proportion of accidents where staff were directly involved was only 2% for standing up, 9% for maintaining a standing position or walking, and 21% for sitting down. These findings reflect the difficulty staff face in responding quickly to users’ spontaneous activities. Since staff are often not present when users stand up, accidents frequently occur in this phase, while staff involvement remains low. On the other hand, sitting down typically occurs at the end of a sequence of movements, where staff are more likely to be assisting users, resulting in a lower accident frequency but a higher rate of staff involvement. The interview results further support this finding, indicating that many users believe they can act independently and engage in high-risk behaviors without staff support, leading to accidents before staff can intervene. In response to such incidents, accident reports often recommend strengthening monitoring systems, but considering staff shortages in elderly care facilities, these measures are often not feasible. Instead, it is necessary to implement tools that alert both users and staff before high-risk movements begin, allowing for preventive interventions.
4.3. Facility-Specific Characteristics
Figure 3 (right: Sankey diagram of Facility Z) showed a high frequency of toilet-related accidents and post-accident discoveries, which closely resembled the pattern observed in Figure 1 (Facility X). However, in Facility Z, accidents were more frequently associated with walking rather than standing up. This difference may be due to the lower number of wheelchair users in Facility Z, suggesting a greater need for fall-prevention interventions tailored to walking-related activities.
Figure 3 (left: Sankey diagram of Facility Y) also indicated that standing up and walking-related accidents were common, and that many accidents were discovered after they had already occurred, similar to Facility X. However, Facility Y exhibited some distinct characteristics, including a higher frequency of accidents related to maintaining a seated posture and a lower occurrence of toilet-related accidents. This pattern may reflect the fact that in Facility Z, users spend more time in their rooms with seating or lying posture, and that bed sensors have been implemented, allowing staff to detect when users attempt to stand up. On the other hand, accidents related to sink usage in private rooms were relatively common, indicating that a more detailed understanding of users’ daily routines and tailored support measures are necessary for effective fall prevention interventions.
4.4. Implications for Methodology
This study demonstrated that analyzing free-text descriptions in fall-related accident reports enables the visualization of frequently underlying behavioral intentions and accident patterns in elderly care facilities, providing insights for individualized fall prevention interventions. Compared to previous studies that relied on predetermined labels such as accident location and time [29,39], this approach allows for a more detailed understanding of the contextual factors surrounding accidents. Additionally, in contrast to post-accident questionnaires and interviews [26,27], this method of analyzing existing accident reports places less burden on both users and staff and allows the same coding rules to be applied across multiple facilities, which provides material for identifying facility-specific accident patterns and devising countermeasures. By focusing on behavioral intentions, this study shifts the perspective from “How can falls be reduced?” to “How can users safely engage in specific activities?”. This approach offers valuable insights into fall prevention strategies that support users’ autonomy, helping to develop interventions that allow elderly people to maintain independent and safe movement rather than merely restricting activities.
5. Conclusions
This study utilized free-text data from fall accident reports in elderly care facilities to effectively visualize recurring patterns of users’ behavioral intentions, actions, and staff involvement. This approach has not been extensively explored in previous research. The findings revealed a frequent and specific pattern in which users with declining cognitive and physical functions attempted to stand up and walk independently to the toilet without seeking staff assistance, resulting in a fall, followed by staff intervention after the accident.
Furthermore, the coding rules developed in this study were found to be broadly applicable to the analysis of fall-related accident reports in other elderly care facilities, allowing for the identification of facility-specific fall patterns. This analytical and visualization approach provides insights into identifying hazardous routines unique to each facility and suggests intervention strategies such as sensor placement, which support users in safely carrying out their intended behaviors, rather than simply restricting their autonomy.
6. Limitation and Future Work
6.1. Limitations of the Analysis
This study primarily focuses on fall accidents occurring in rooms, which may have overlooked other types of accidents, such as those occurring in shared spaces or outdoor areas. Expanding the scope of analysis to include a broader range of locations would contribute to a more comprehensive understanding of fall risks in elderly care facilities.
6.2. Influence of Individual Factors
While this study emphasized situational factors, the impact of individual factors, such as cognitive and physical function, is also crucial. Future research should integrate both individual and situational factors to enable more detailed and precise analyses.
6.3. Improving the Efficiency of the Coding Process
A key challenge in this study was the time and resources required for the coding process. However, by leveraging the established coding rules and the accumulated labeled data, there is potential to automate the coding process using machine learning and natural language processing (NLP) technologies in the future. Advancements in these technologies are expected to significantly enhance the efficiency and consistency of analysis.
6.4. Enhancing Data Visualization
The current data visualization methods have limitations in clarity when dealing with more detailed diagrams. Developing an interactive application that allows users to zoom in on specific flows and explore patterns could improve the practicality and usability of visualization.
6.5. Development of a Multimodal Alert System
This study highlighted the need for a system that alerts both staff and users at the onset of high-risk behaviors. In response, our research team is currently developing a fall prevention support system that detects increased accident risk and provides multimodal alerts to both staff and users, encouraging users to wait for assistance. For example, when a user identified as high-risk begins a potentially hazardous routine, such as opening the bathroom door, sensors detect this action and immediately send a notification to staff’s mobile devices. Simultaneously, visual and auditory alerts notify the user to wait for assistance. This system aims to support users in achieving their intended activities safely, allowing timely interventions only when fall risk is high, while minimizing unnecessary restrictions on daily actions.
Author Contributions
Conceptualization, Nao Takizawa and Miki Saijo; methodology, Nao Takizawa and Miki Saijo; formal analysis, Nao Takizawa, Sota Takagi, and Yuki Tano; investigation, Nao Takizawa; visualization, Nao Takizawa; writing—original draft preparation, Nao Takizawa; writing—review and editing, all authors; supervision, Miki Saijo. All authors have read and agreed to the published version of the manuscript.
Funding
This research was funded by Kingrun Co., Ltd. (the operating entity of Facility Y and Facility Z) through a joint research grant, and by the Japan Science and Technology Agency (JST) SPRING program (Grant Numbers JPMJSP2106 and JPMJSP2180). Nao Takizawa was supported by JST SPRING (JPMJSP2106 and JPMJSP2180). The funders had no role in the design of the study; in the collection, analyses, or interpretation of data; in the writing of the manuscript; or in the decision to publish the results.
Institutional Review Board Statement
The research protocol was reviewed and approved by the Ethics Review Board of the Institute of Science, Tokyo (Ethics Approval Numbers: A2022269 and A23398). All accident reports were anonymized to protect users’ privacy. Before conducting the semi-structured interview, both verbal and written informed consent was obtained from the director of Facility X.
Informed Consent Statement
Informed consent was obtained from the director of Facility X prior to data collection and interview procedures.
Data Availability Statement
The original accident report data are not publicly available due to privacy and ethical restrictions. However, all aggregated and analyzed data used in this study are included within the article and its Appendix. No additional datasets were generated or analyzed beyond those presented in the main text and Appendix.
Acknowledgments
The authors would like to express their gratitude to Facility X, Facility Y, and Facility Z, as well as Kingrun Co., Ltd., the operating entity of Facilities Y and Z, for providing the accident reports used in this study. We also appreciate the cooperation of Kingrun Co., Ltd. in anonymizing the accident reports.
Conflicts of Interest
The authors declare no conflict of interest. The funders had no role in the design of the study; in the collection, analyses, or interpretation of data; in the writing of the manuscript; or in the decision to publish the results.
Appendix

Table A3.
Final Coding Rules and Classification Results (Category 1: Type of Failed Action) .
| Category | Coding Rule | Facility X | Facility Y | Facility Z | |
| Sitting down | Accident during the action of sitting down on a wheelchair, chair, or bed. This includes transfers from a walker to a wheelchair or chair. | 14 | 1 | 0 | |
| Standing up | Wheelchair | Accident during the action of standing up from a wheelchair, chair, or bed. This includes cases where a person attempted to stand up and slid down. This also includes expressions such as “getting off the bed.” | 31 | 2 | 2 |
| ☐ | Chair | 6 | 0 | 0 | |
| ☐ | Bed | 50 | 7 | 4 | |
| ☐ | Others / Unknown | 9 | 0 | 0 | |
| Staying seated | Wheelchair | Accident during sliding or falling from a wheelchair or chair. This includes falls while self-propelling a wheelchair. | 29 | 2 | 1 |
| ☐ | Chair | 3 | 2 | 1 | |
| ☐ | Bed | 7 | 0 | 0 | |
| ☐ | Others / Unknown | 1 | 1 | 0 | |
| Standing or walking | Without Device | Accident while walking or losing balance while standing. This includes expressions such as “stood up and tried to do XXX.” | 81 | 11 | 17 |
| ☐ | Cane | 3 | 0 | 0 | |
| ☐ | Rollator / Walker | 12 | 2 | 1 | |
| Transferring | Wheelchair→Chair | Accident when transferring from a wheelchair to another seated posture, such as another chair or wheelchair. | 10 | 0 | 1 |
| ☐ | Chair→Wheelchair | 17 | 1 | 1 | |
| ☐ | Wheelchair→Wheelchair | 2 | 0 | 0 | |
| Staying lying | Accident while lying down on a bed. This includes cases where a person attempted to do something from a lying position and subsequently fell. | 8 | 0 | 3 | |
| Other motion | Cases that cannot be classified into the above categories. | 4 | 0 | 1 | |
| N/A (Q1) | Cases where the situation cannot be understood from the accident record. If the caregiver also recorded it as “unknown.” | 23 | 4 | 3 | |
Table A4.
Final Coding Rules and Classification Results (Category 2: Intention Underlying the Total Behavior).
Table A4.
Final Coding Rules and Classification Results (Category 2: Intention Underlying the Total Behavior).
| Category | Coding Rule | Facility X | Facility Y | Facility Z |
| Go to the toilet | When the action intended to achieve is going to the toilet. | 76 | 5 | 8 |
| Use the sink | When the action intended to achieve is washing hands, face, or brushing teeth at the sink. | 9 | 6 | 0 |
| Change clothes | When the action intended to achieve is putting on or taking off clothes, or adjusting the clothing the person is wearing. | 6 | 0 | 0 |
| Move seat/place | When the action intended to achieve is moving to another seat or room. Includes movement to the toilet, but in this case, the goal is not movement itself but to use the toilet, so it does not apply to this level. If there is a destination, like “I want to go back,” and the action is completed upon arrival, it applies to this level. |
30 | 5 | 3 |
| Get something | When the action intended to achieve is retrieving something. Includes cases where a person notices something and picks it up to check it. This includes expressions such as “trying to pick up a tray.” |
18 | 0 | 0 |
| Clean up | When the action intended to achieve is tidying items or organizing a place. Includes expressions such as “trying to pick up garbage.” |
3 | 2 | 1 |
| Throw away trash | When the action intended to achieve is going to throw away garbage or unnecessary items. | 3 | 0 | 1 |
| Get a drink | When the action intended to achieve is drinking something. | 3 | 0 | 0 |
| Watch TV | When the action intended to achieve is watching television. | 1 | 0 | 0 |
| Open/close curtains | When the action intended to achieve is opening or closing curtains. Includes expressions such as “because it’s too bright.” |
5 | 1 | 1 |
| Go home | When the action intended to achieve is returning to a familiar place. This anticipates dementia-related wandering. | 1 | 0 | 0 |
| Move around | When the action intended to achieve is simply moving the body. Includes expressions like “wanting to change posture.” |
4 | 0 | 0 |
| Check something interesting | When the action intended to achieve is checking something located away from the individual. | 5 | 0 | 0 |
| Follow staff’s instructions | In cases of accidents during caregiver-assisted activities, excluding cases where the individual strongly resists the caregiver’s guidance. Includes accidents during rehabilitation or recreational activities. |
17 | 0 | 1 |
| Go to sleep | When the action intended to achieve is lying down. Includes expressions like “wanting to sleep.” |
9 | 0 | 0 |
| Under sleeping | In cases of accidents while sleeping or when consciousness is diminished. | 2 | 0 | 0 |
| Other intention | Cases where the action intention cannot be classified into any of the above categories. | 7 | 2 | 1 |
| Unclear | When the caregiver asked but could not understand the intention of the action. | 10 | 1 | 0 |
| N/A(Q2) | When the action intention cannot be inferred from the accident reports. | 101 | 11 | 19 |
Table A5.
Final Coding Rules and Classification Results (Category 3: Staff Involvement During the Accident).
Table A5.
Final Coding Rules and Classification Results (Category 3: Staff Involvement During the Accident).
| Category | Coding Rule | Facility X | Facility Y | Facility Z |
| Assisting the person | When an accident occurs while the staff member is assisting the facility user. | 19 | 0 | 1 |
| Momentarily stepped away | When the staff member was assisting the facility user just before the accident, but an accident occurred in the moment when they briefly stepped away for another task. | 1 | 1 | 1 |
| Witnessed the accident | When the staff member was not assisting anyone at the time of the accident and witnessed the accident from a distance. This also applies if the staff observed the accident, even partially. | 37 | 2 | 2 |
| Found the scene after | When the staff could not witness the scene of the accident but arrived afterward and discovered the accident. This applies when the situation is described with speculative expressions like “it appears that…” | 230 | 28 | 26 |
| Found the injury after | When the staff did not notice the accident but later discovered an injury, confirming that an accident had occurred. If, among accidents where an injury was later discovered on the facility user, there is no suspicion of a fall, it is classified under “Injury/Wound,” and is outside the scope of this incident analysis. | 2 | 1 | 2 |
| Reported by the person | When the staff did not notice the accident and received a report of the accident directly from the facility user. | 9 | 0 | 1 |
| Other situation | Accidents that cannot be classified under any of the above categories. | 0 | 0 | 1 |
| N/A(Q3) | Cases where the situation of the staff cannot be determined from the accident record. | 12 | 1 | 1 |
References
- Rubenstein, K.J.A.R.L. Falls in the Nursing Home. Ann. Intern. Med. 1994, 121, 442–451. [Google Scholar] [CrossRef]
- Spinks, A.B.; Wasiak, J. Maintaining Independence after a Fall. Int. J. Clin. Pract. 2009. [CrossRef]
- Laurence, B.D.; Michel, L. The Fall in Elderly People: Physical and Cognitive Problems. Curr. Aging Sci. 2016. [CrossRef]
- Cwikel, J. Falls among Elderly People Living at Home: Medical and Social Factors in a National Sample. Isr. J. Med. Sci. 1992, 28(7), 446–453. [Google Scholar] [PubMed]
- Ozcan, A.; Donat, H.; Gelecek, N.; Ozdirenc, M.; Karadibak, D. The Relationship between Risk Factors for Falling and the Quality of Life in Elderly People. BMC Public Health 2005, 5, 90. [Google Scholar] [CrossRef]
- Tsai, Y.-J.; Sun, W.-J.; Yang, Y.-C.; Chou, P.; Wang, J.-D. Associations of Falls with Quality of Life and Correlated Factors in Community-Dwelling Elderly People: A Two-Wave Cohort Study. 2021. [CrossRef]
- Rubenstein, L.Z. Falls in Older People: Epidemiology, Risk Factors and Strategies for Prevention. Age Ageing 2006, 35, ii37–ii41. [Google Scholar] [CrossRef]
- Lundebjerg, N. Guideline for the Prevention of Falls in Older Persons. J. Am. Geriatric. Soc. 2001, 49, 664–672. [Google Scholar] [CrossRef]
- World Health Organization. Decade of Healthy Ageing (2020–2030): Update, May 2019; WHO: Geneva, Switzerland, 2019; ISBN 978-92-4-151607-0. [Google Scholar]
- World Health Organization. Achieving Well-Being: A Global Framework for Integrating Well-Being into Public Health Utilizing a Health Promotion Approach; WHO: Geneva, Switzerland, 2023. [Google Scholar]
- Fucahori, F.S.; Lopes, A.R.; Correia, J.J.A.; da Silva, C.K.; Trelha, C.S. Fear of Falling and Activity Restriction in Elderly People from the Urban Community of Londrina: A Cross-Sectional Study. Fisioter. Mov. 2014, 27(3), 379–387. [Google Scholar] [CrossRef]
- Bertera, E.M.; Bertera, R.L. Fear of Falling and Activity Avoidance in a National Sample of Older Adults in the United States. Health Soc. Work 2008, 33(1), 54–62. [Google Scholar] [CrossRef]
- Fletcher, P.C.; Hirdes, J.P. Restriction in Activity Associated with Fear of Falling among Community-Based Seniors Using Home Care Services. Age Ageing 2004, 33(3), 273–279. [Google Scholar] [CrossRef]
- Boltz, M.; Resnick, B.; Capezuti, E.; Shuluk, J. Activity Restriction vs. Self-Direction: Hospitalised Elderly People’s Response to Fear of Falling. Int. J. Older People Nurs. 2014; 9, 44–53. [Google Scholar] [CrossRef]
- Li, I.F.; Hsiung, Y.; Hsing, H.F.; Lee, M.Y.; Chang, T.H.; Huang, M.Y. Elderly Taiwanese’s Intrinsic Risk Factors for Fall-Related Injuries. Int. J. Gerontol. 2016, 10(3), 137–141. [Google Scholar] [CrossRef]
- Robertson, L.; et al. Hip Fracture Incidence and Mortality in Chronic Kidney Disease: The GLOMMS-II Record Linkage Cohort Study. BMJ Open 2018, 8(4), e020312. [Google Scholar] [CrossRef]
- Rogers, T.S.; et al. Rest-Activity Patterns and Falls and Fractures in Older Men. Osteoporos. Int. 2017, 28(4), 1313–1322. [Google Scholar] [CrossRef] [PubMed]
- Torii, H.; Ando, M.; Tomita, H.; Kobaru, T.; Tanaka, M.; Fujimoto, K.; Shimizu, R.; Ikesue, H.; Okusada, S.; Hashida, T.; Kume, N. Association of Hypnotic Drug Use with Fall Incidents in Hospitalized Elderly Patients: A Case-Crossover Study. Biol. Pharm. Bull. 2020, 43(6), 925–931. [Google Scholar] [CrossRef]
- Lee, Y.Y.; Chen, C.L.; Lee, I.C.; Lee, I.C.; Chen, N.C. History of Falls, Dementia, Lower Education Levels, Mobility Limitations, and Aging as Risk Factors for Falls among the Community-Dwelling Elderly: A Cohort Study. Int. J. Environ. Res. Public Health 2021, 18(17), 9356. [Google Scholar] [CrossRef]
- Monma, Y.; Niu, K.; Iwasaki, K.; Tomita, N.; Nakaya, N.; Hozawa, A.; Kuriyama, S.; Takayama, S.; Seki, T.; Takeda, T.; Yaegashi, N.; Ebihara, S.; Arai, H.; Nagatomi, R.; Tsuji, I. Dietary Patterns Associated with Fall-Related Fracture in Elderly Japanese: A Population-Based Prospective Study. BMC Geriatrics. 2010, 10, 31. [Google Scholar] [CrossRef]
- Ekbrand, H.; Ekman, R.; Thodelius, C.; Möller, M. Fall-Related Injuries for Three Age Groups: Analysis of Swedish Registry Data 1999–2013. J. Saf. Res. 2020, 73, 143–152. [Google Scholar] [CrossRef] [PubMed]
- Huang, G.; Wabe, N.; Raban, M.Z.; Seaman, K.L.; Silva, S.M.; Westbrook, J.I. The Relationship between Fall Incidents and Place of Birth in Residential Aged Care Facilities: A Retrospective Longitudinal Cohort Study. BMC Geriatrics. 2023, 23(1), 3954. [Google Scholar] [CrossRef]
- Moran, R. Patient-Stimulated Fall Prevention Screening in Primary Care: Analysis of Provider Coding Changes. BMC Prim. Care 2023, 24(1), 2154. [Google Scholar] [CrossRef] [PubMed]
- Petitpierre, N.J.; Trombetti, A.; Carroll, I.; Michel, J.P.; Herrmann, F.R. The FIM® Instrument to Identify Patients at Risk of Falling in Geriatric Wards: A 10-Year Retrospective Study. Age Ageing 2010, 39(3), 326–331. [Google Scholar] [CrossRef]
- Ye, C.; et al. Identification of Elders at Higher Risk for Fall with Statewide Electronic Health Records and a Machine Learning Algorithm. Int. J. Med. Inform. 2020, 137, 104105. [Google Scholar] [CrossRef] [PubMed]
- Molés Julio, M.P.; Lavedán Santamaría, A.; Botigué Satorra, T.; Masot Ariño, O.; Esteve Clavero, A.; Maciá Soler, M.L. Characteristics and Circumstances of Falls in the Community-Dwelling Older Adult Population. J. Prim. Care Community Health 2020, 11, 2150132720940508. [Google Scholar] [CrossRef]
- Bleijlevens, M.H.; Diederiks, J.P.; Hendriks, M.R.; van Haastregt, J.C.M.; Crebolder, H.F.J.M.; van Eijk, J.Th.M. Relationship between Location and Activity in Injurious Falls: An Exploratory Study. BMC Geriatrics. 2010, 10, 40. [Google Scholar] [CrossRef]
- de Smet, L.; Carpels, A.; Creten, L.; De Pauw, L.; Van Eldere, L.; Desplenter, F.; De Hert, M. Prevalence and Characteristics of Registered Falls in a Belgian University Psychiatric Hospital. Front. Public Health 2022, 10, 1020975. [Google Scholar] [CrossRef] [PubMed]
- Kosse, N.M.; De Groot, M.H.; Vuillerme, N.; Hortobágyi, T.; Lamoth, C.J.C. Factors Related to the High Fall Rate in Long-Term Care Residents with Dementia. Int. Psychogeriatr. 2015, 27(5), 803–814. [Google Scholar] [CrossRef]
- Ministry of Health, Labour and Welfare. Latest Information on Long-Term Care Insurance: Reporting Forms for Accidents at Long-Term Care Insurance Facilities; Ministry of Health, Labour and Welfare: Tokyo, Japan, March 2021; Available online: https://www.mhlw.go.jp/content/000763797.pdf (accessed on 20 October 2025).
- Kitagawa, C.W.; et al. Analysis of Occupational Injury Reports Related to Patient Care Activities Using Text Mining Technique. IFMBE Proc. 2021, 82, 100–105. [Google Scholar]
- Krippendorff, K. Content Analysis: An Introduction to Its Methodology, 2nd ed.; Sage Publications: Thousand Oaks, CA, USA, 2004. [Google Scholar]
- Cohen, J. A Coefficient of Agreement for Nominal Scales. Educ. Psychol. Meas. 1960, 20, 37–46. [Google Scholar] [CrossRef]
- Plotly Technologies Inc. Plotly: Create Interactive Plots with Python, R, & JavaScript. Available online: https://plotly.com (accessed on 20 October 2025).
- Sankey, M.H. Minutes of Proceedings of The Institution of Civil Engineers; The Institution of Civil Engineers: London, UK, 1898. [Google Scholar]
- Schmidt, M. The Sankey Diagram in Energy and Material Flow Management: Part I: History. J. Ind. Ecol. 2008, 12(1), 82–94. [Google Scholar] [CrossRef]
- Chong, C.; et al. A Visualization Method of the Economic Input–Output Table: Mapping Monetary Flows in the Form of Sankey Diagrams. Sustainability 2021, 13(21), 12239. [Google Scholar] [CrossRef]
- Zou, M.; et al. Association between Toileting and Falls in Elderly People Admitted to the Emergency Department and Hospitalised: A Cross-Sectional Study. BMJ Open 2023, 13(6), e065544. [Google Scholar] [CrossRef] [PubMed]
- Mitaji, Y.; Akazawa, K. Analysis of Incidents Occurring in Long-Term Care Insurance Facilities. Bull. Soc. Med. 2013, 30(2), 123–134. [Google Scholar]
Figure 1.
Sankey diagrams for Facility X.
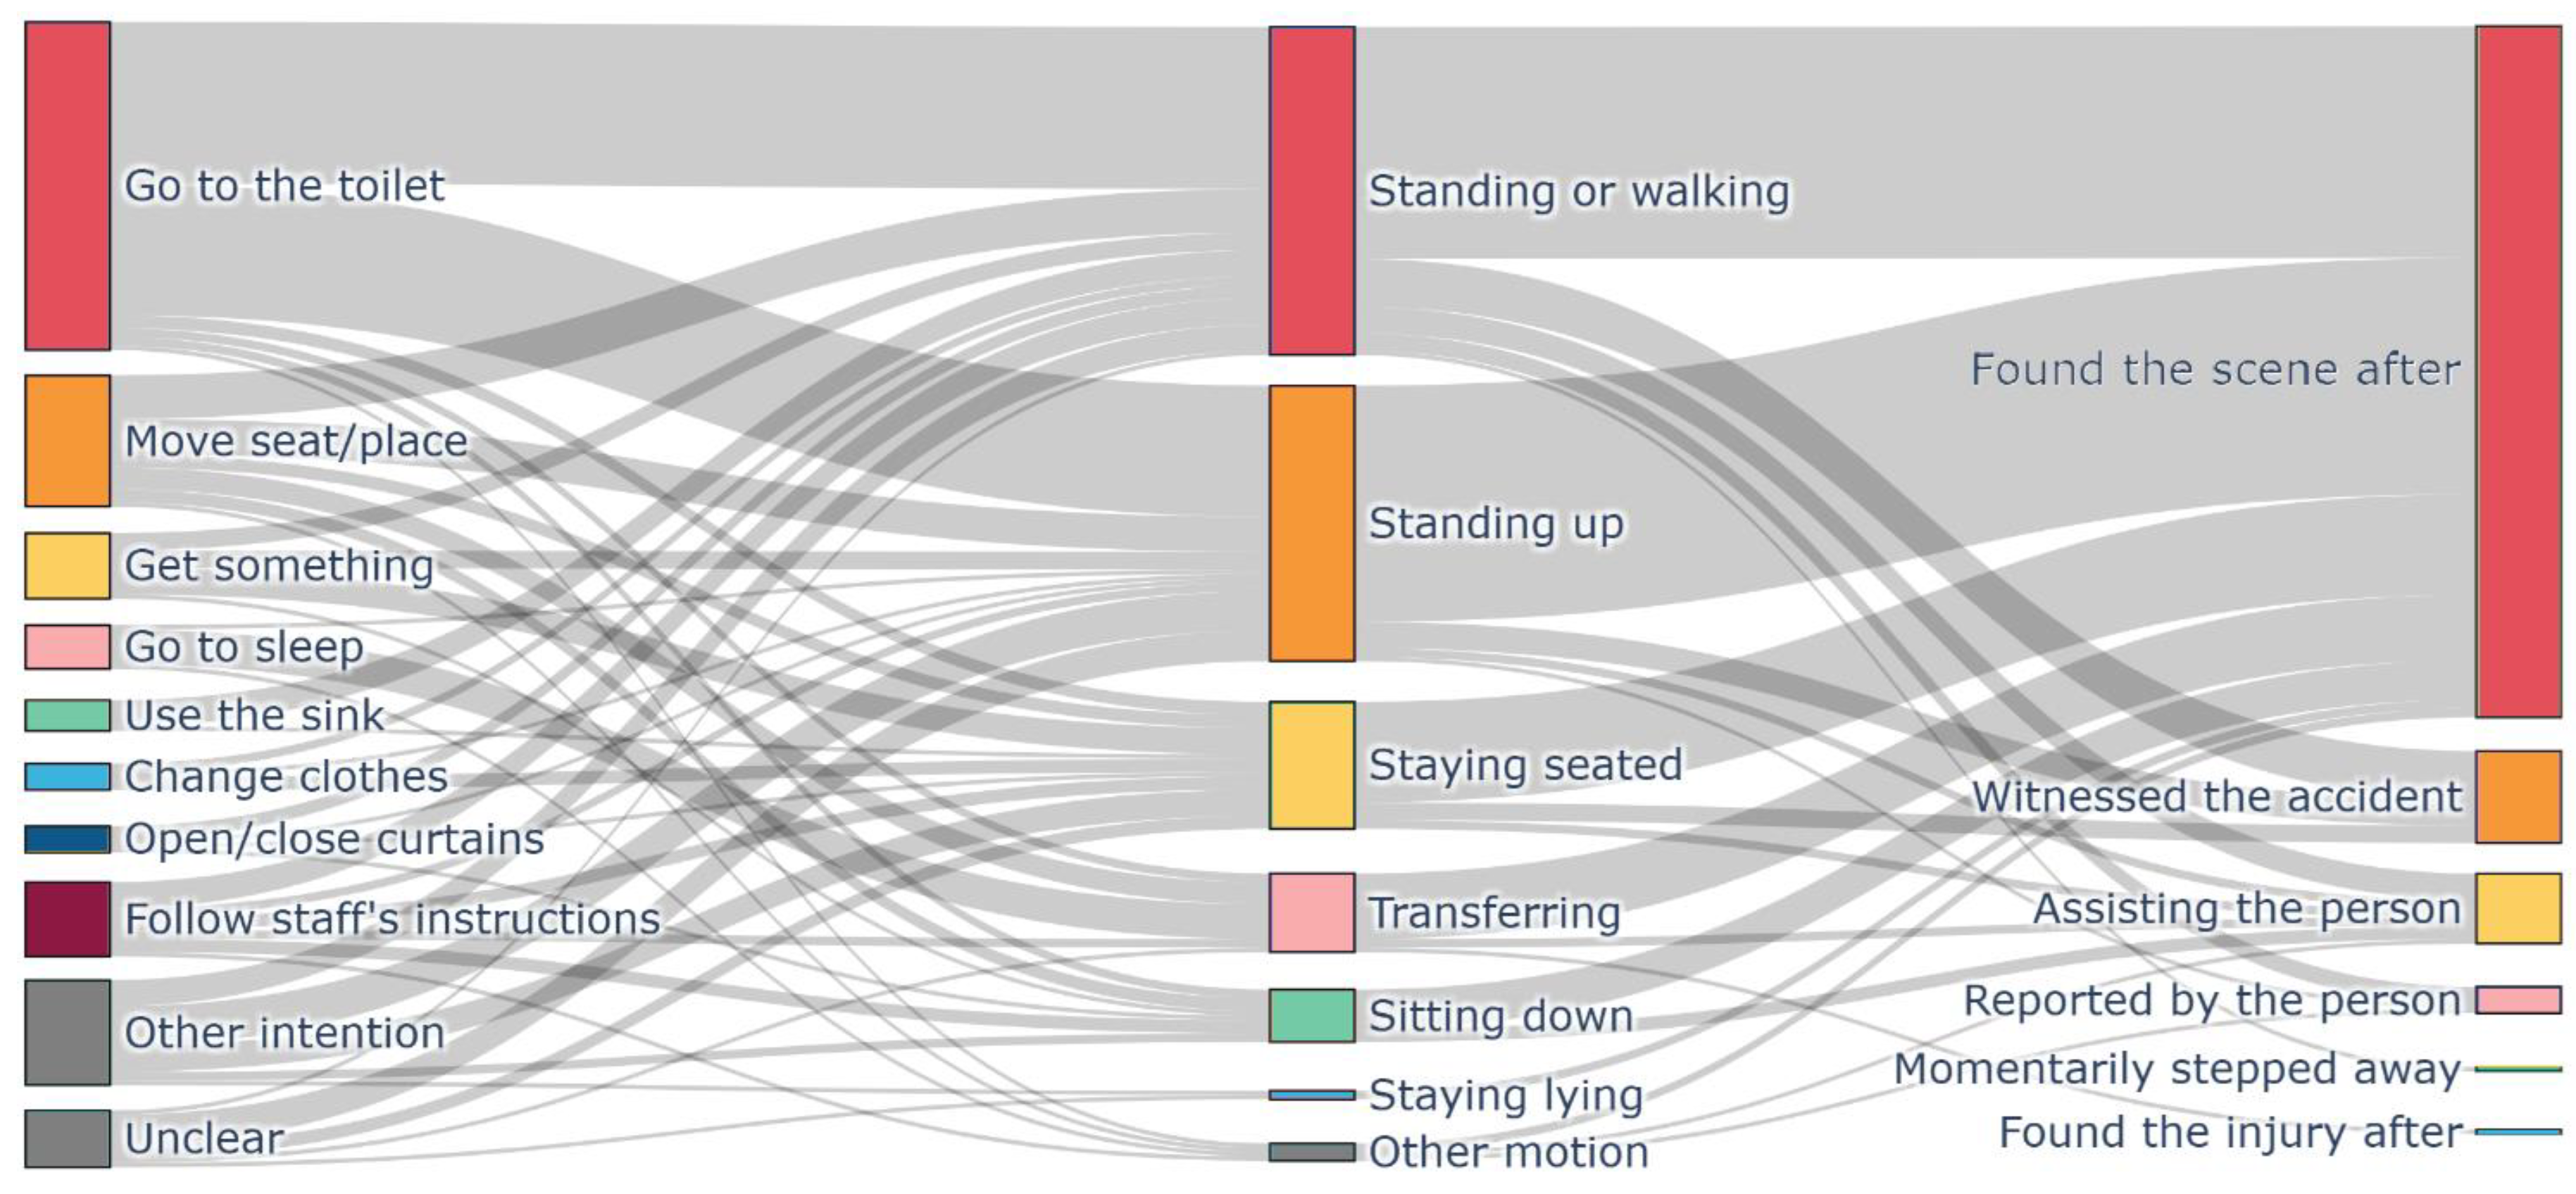
Figure 2.
Time-series distribution of accidents in Facility X.
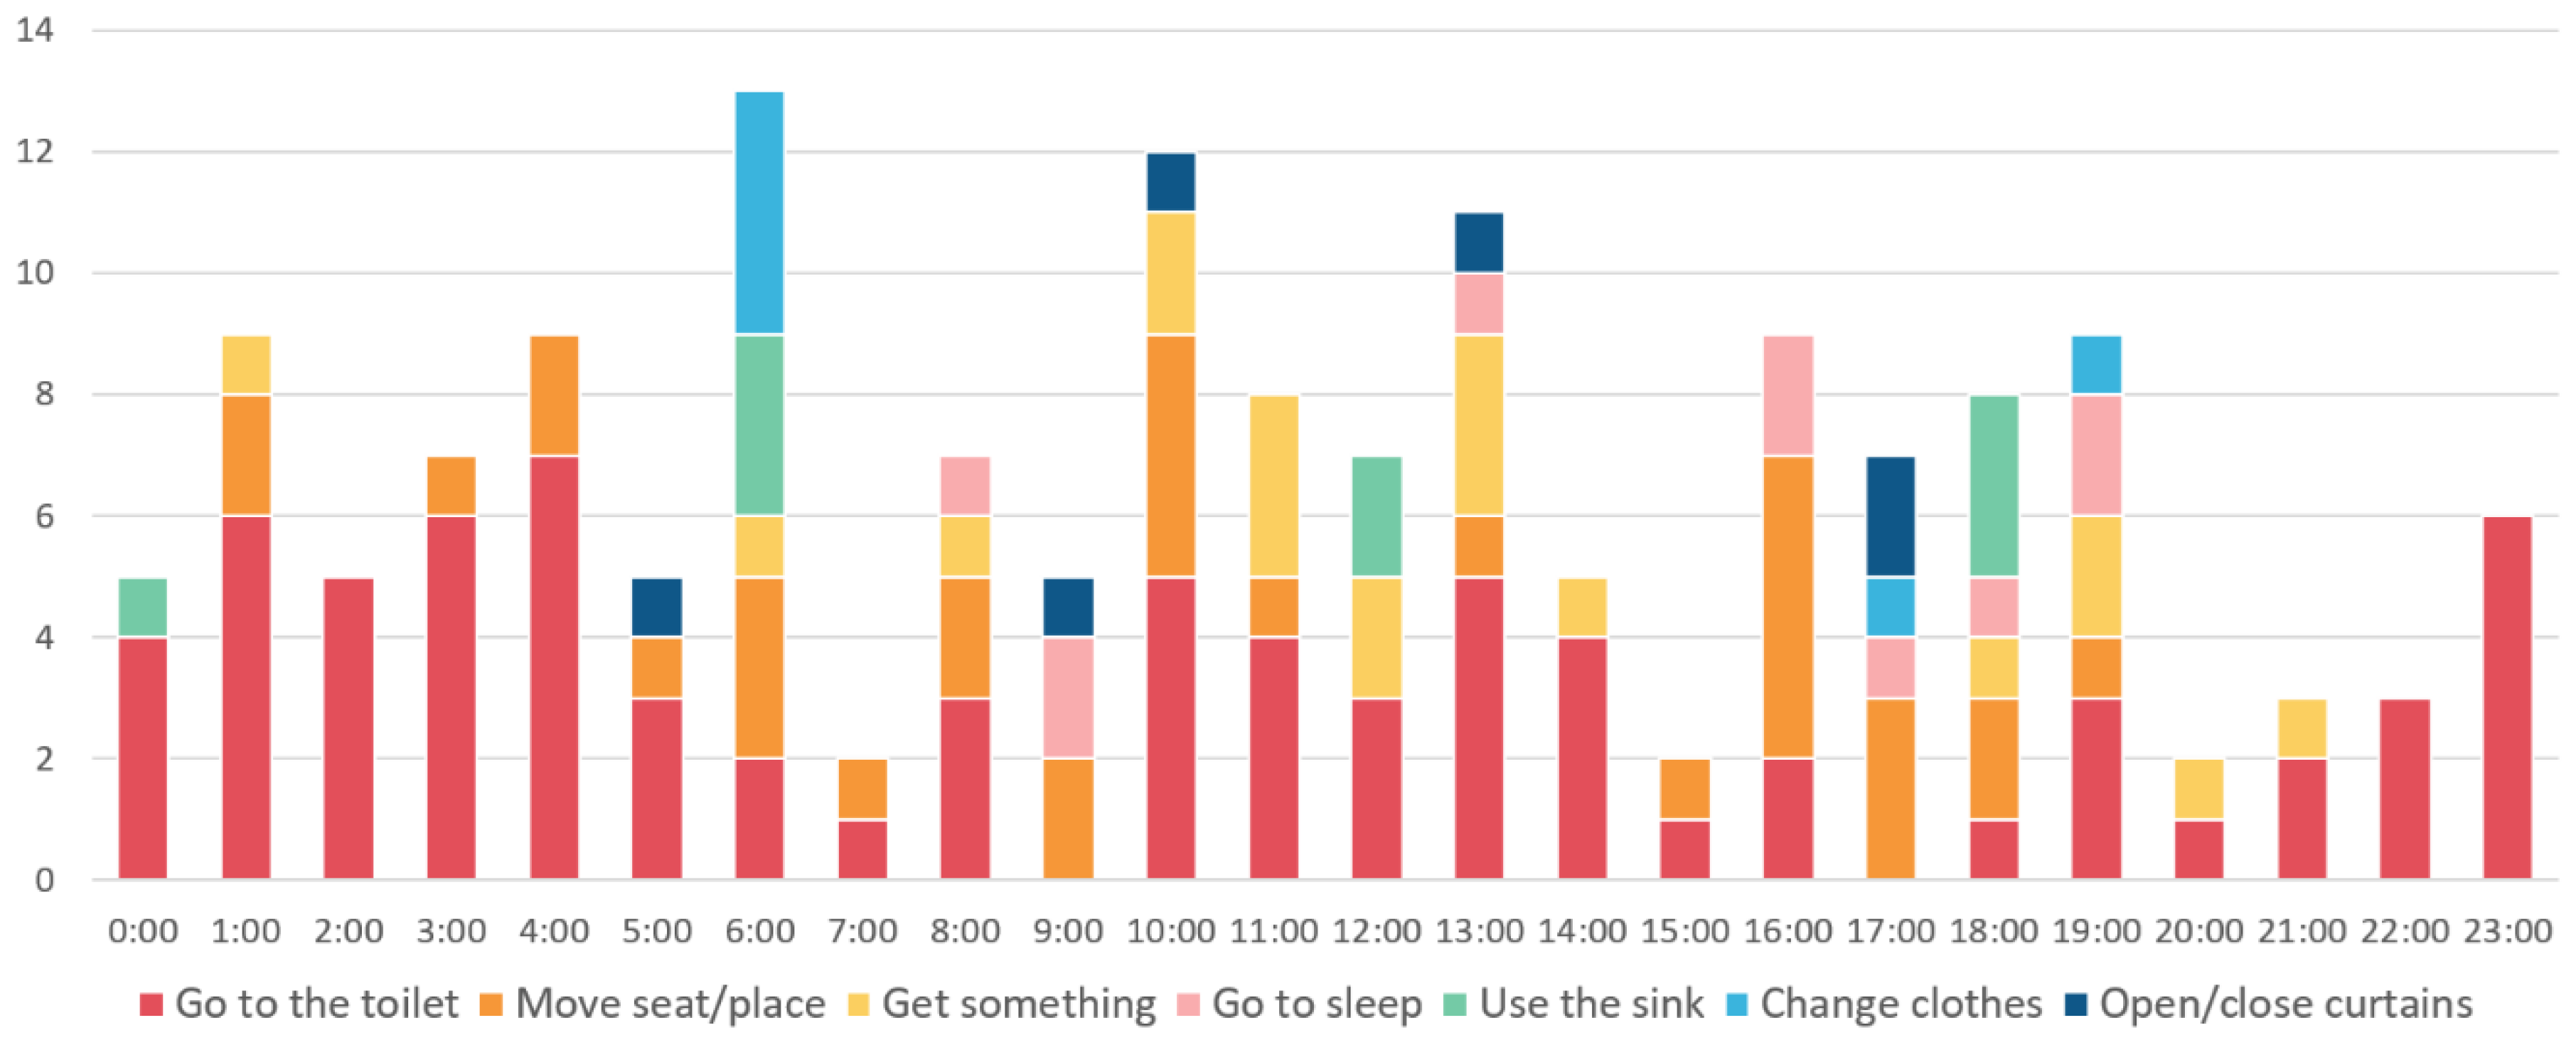
Figure 3.
(left) Sankey diagrams for Facility Y, (right) Sankey diagrams for Facility Z.
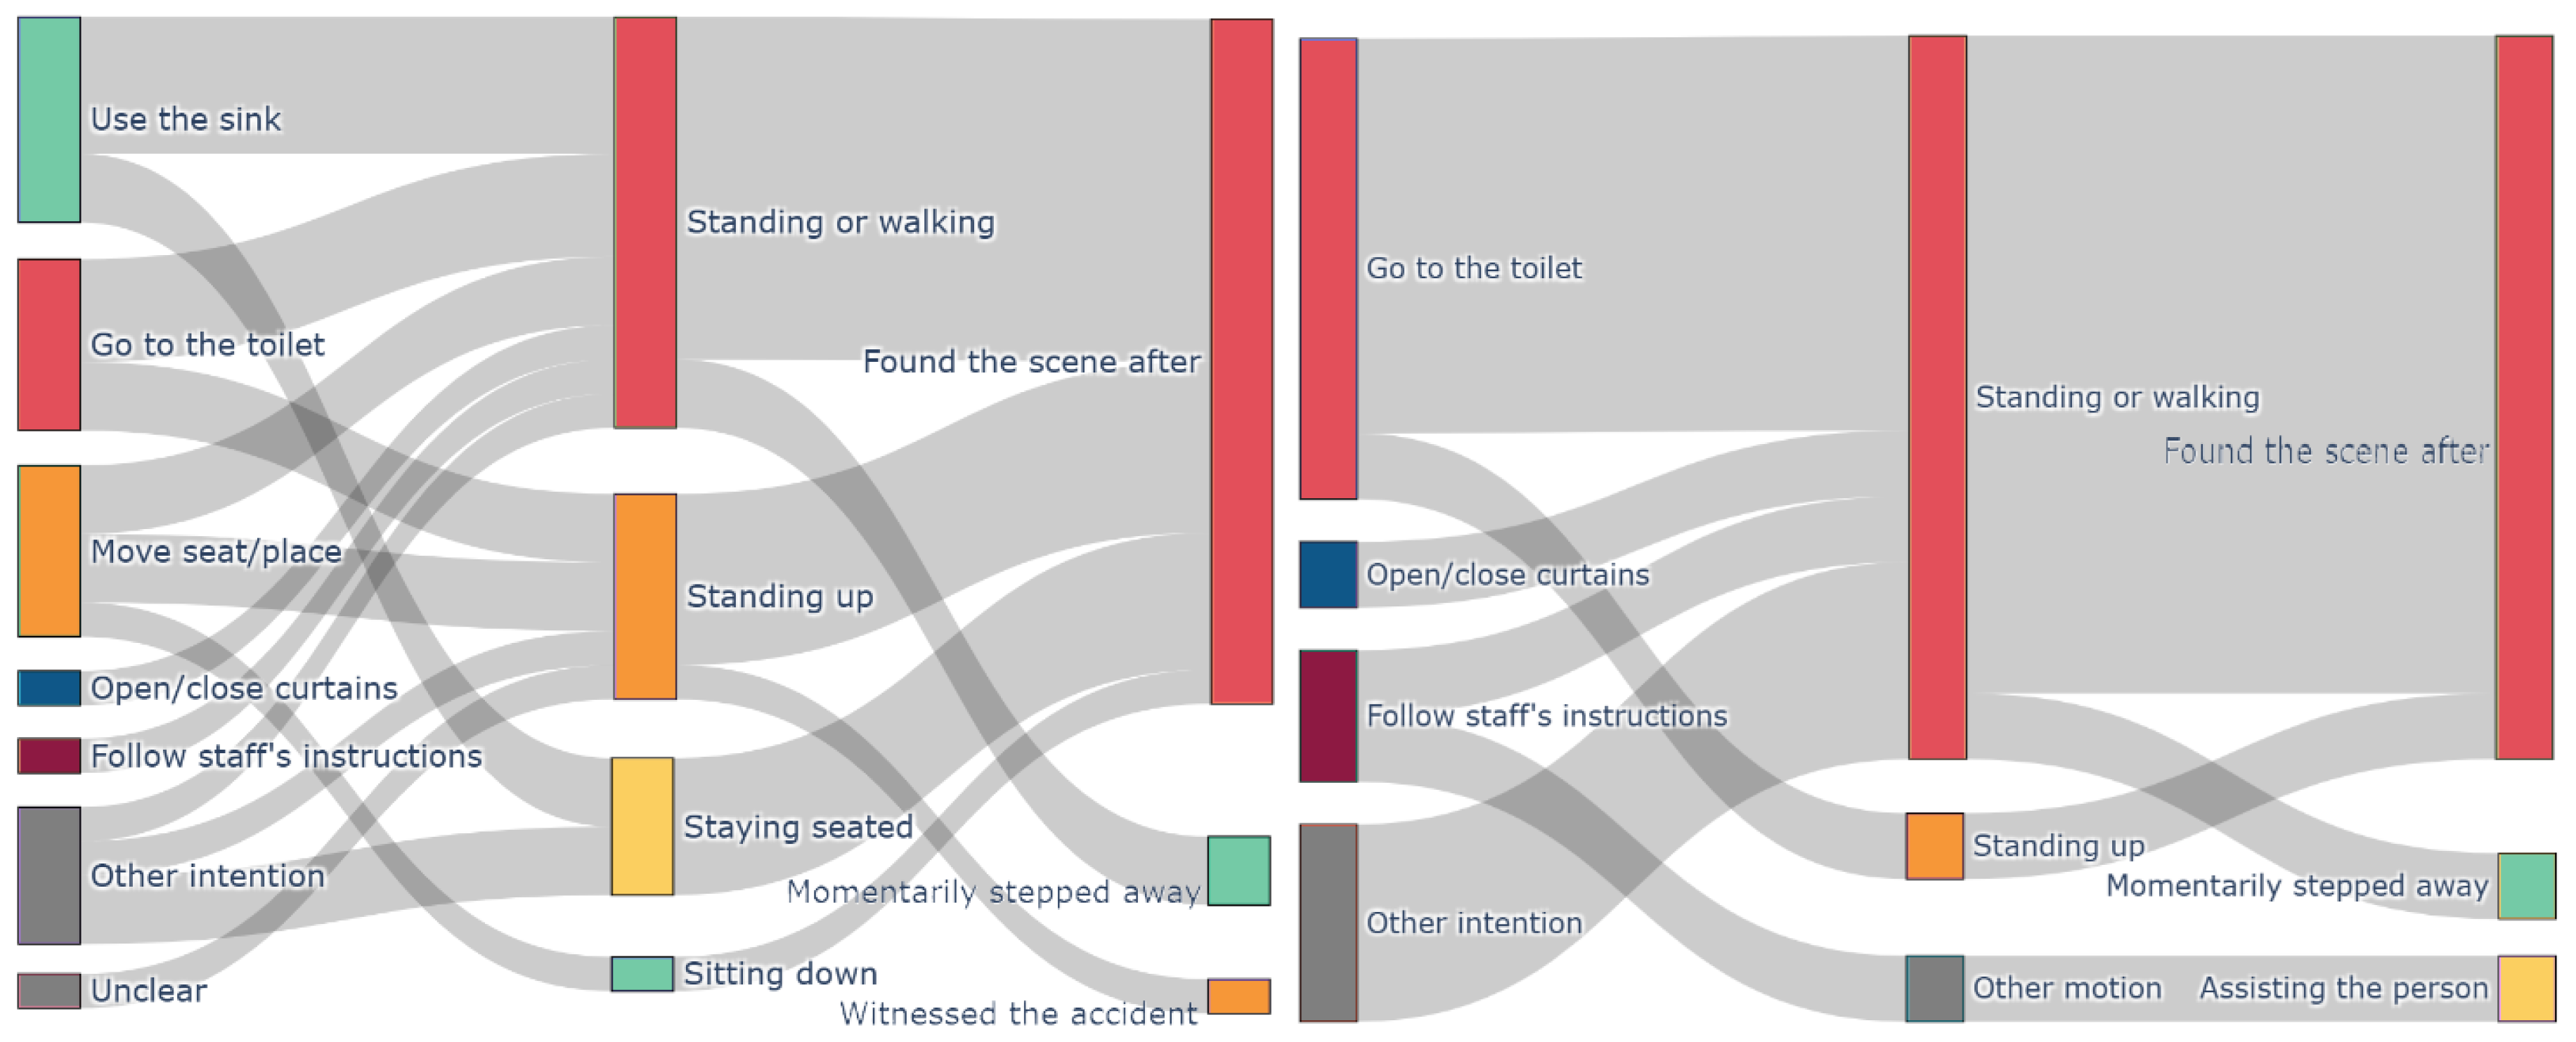
Table 1.
Accident Reports Used for Analysis.
| Name | Feature | Period | Reports |
|---|---|---|---|
| Facility X | public/ short stay | Jan. 16, 2018, to Mar. 30, 2020 | 310 |
| Facility Y | private / long stay | Feb. 1, 2022, to Feb. 15, 2024 | 33 |
| Facility Z | private / long stay | Feb. 1, 2022, to Feb. 15, 2024 | 35 |
Table 2.
Cohen’s kappa (κ) value results.
| Facility X | Facility Y | Facility Z | |
| Category 1 | 0.76 | 1 | 0.74 |
| Category 2 | 0.78 | 0.75 | 0.64 |
| Category 3 | 0.93 | 1 | 0.64 |
Disclaimer/Publisher’s Note: The statements, opinions and data contained in all publications are solely those of the individual author(s) and contributor(s) and not of MDPI and/or the editor(s). MDPI and/or the editor(s) disclaim responsibility for any injury to people or property resulting from any ideas, methods, instructions or products referred to in the content. |
© 2025 by the authors. Licensee MDPI, Basel, Switzerland. This article is an open access article distributed under the terms and conditions of the Creative Commons Attribution (CC BY) license (http://creativecommons.org/licenses/by/4.0/).
Copyright: This open access article is published under a Creative Commons CC BY 4.0 license, which permit the free download, distribution, and reuse, provided that the author and preprint are cited in any reuse.


