
Submitted:
03 November 2025
Posted:
04 November 2025
You are already at the latest version
Preprints on COVID-19 and SARS-CoV-2
Abstract
Evaluation of vaccine effectiveness (VE) was essential to implement strategies of prevention, and our objective was estimated the VE of SARS-CoV-2 messenger RNA (mRNA) vaccines to prevent SARS-CoV-2 infection. We performed a population-based prospective cohort study in the Borriana COVID-19 cohort (Valencia Community, Spain) during the period 2021-2023, with two approaches, considering firstly, all cases occurred after SARS-CoV-2 vaccine campaign started in January 2021, and then secondly, only symptomatic cases. Multivariable robust Poisson regression models were employed. Results: In first approach, of 301 participants, 285 were vaccinated, 228 with only SARS-CoV-2 mRNA vaccines, and 57 with mRNA vaccine and other vaccines. A total of 226 cases occurred with 75 non-cases. Adjusted VE for 3 doses of vaccine received was 37% (95% Confidence interval [CI] 22%-49%). The second approach, with 153 symptomatic cases, excluding 73 asymptomatic cases, adjusted VE for 3 doses of vaccine received was 50% (95% CI 33%-63%). While one or two doses of vaccines presented a low VE with insufficient to protect against infection, 3 doses of vaccine reached modest and significant protection. Exclusion of asymptomatic cases improved the VE estimation. Conclusion: Development of new vaccines is needed to improve control and prevention strategies against SARS-CoV-2.
Keywords:
COVID-19
; SARS-CoV-2 infection
; SARS-CoV-2 mRNA vaccines
; vaccine effectiveness
; prospective cohort
; population-based
1. Introduction
Evaluations of SARS-CoV-2 vaccines have been performed extensively, studying their effects on COVID-19 severity, hospitalizations, deaths, and long COVID incidence, highlighting its protective results [1,2,3,4,5]. However, an evaluation regarding the SARS-CoV-2 infection is less studied, considering the new virus variants and the waning immunity [6,7].
Information about the effectiveness of the SARS-CoV-2 vaccines is essential from a public health perspective, to tangle with epidemic situations [8]. However, an estimation of SARS-CoV-2 vaccine effectiveness presents some difficulties associated with the follow-up of the vaccinated, presence of symptomatic and asymptomatic infections, and high prevalence of infected population before vaccination. In addition, different methods of effectiveness estimation have been employed [9,10].
The aim of this study was to estimate the effectiveness of the SARS-CoV-2 mRNA vaccines in the Borriana COVID-19 cohort during the period 2021-2023.
2. Materials and Methods
2.1. Study Design
We performed a prospective population-based cohort study of the Borriana COVID-19 Fallas festival in March 2020 in Borriana, a city of the Castellon province in the Valencia Community (Spain), where a large outbreak of COVID-19 took place, with an attack rate of 46% [11]. Several studies of this cohort follow-up have been published from 2021 to 2025, considering persistence of SARS-CoV-2 antibodies, complications, risk factors, long COVID, and cellular immunity [12,13].
In June 2022, the third study of this cohort was performed including the participants with confirmatory laboratory tests of COVID-19 status, and 722 of the 1132 (63.8%) participated in the study. This study included serologic and questionnaire surveys to determine the SARS-CoV-2 infection and vaccination status. In addition, a follow-up of the cohort through healthcare records was implemented from June 2020 to August 2023. To be included in the study, participants needed not to have suffered from the COVID-19 disease before the start of the SARS-CoV-2 vaccination campaign in the first approach. In the second approach, participants with asymptomatic SARS-CoV-2 infection detected after the vaccination campaign were excluded from the analysis, and only symptomatic cases were analyzed. Although detection of asymptomatic participants took place after vaccinations, there is no complete certainty to establish when the participant was infected.
Considering the initial date of the vaccination campaign in January 2021 and the final date of study in August 2023, the follow-up time of this cohort was 36 months. In this period, the predominant SARS-CoV-2 variants in our area were Alpha from January 2021 to July 2021, Delta from August 2021 to December 2021, and finally Omicron from January 2021 to August 2023 [14].
2.2. SARS-CoV-2 Vaccination
The onset of the SARS-CoV-2 vaccination began in January 2021, and the last vaccinations took place in February 2022. From 14 days after receiving one or two doses of vaccine, the participant was considered vaccinated and 14 days after receiving the three doses [15]. To determine the unvaccinated participants, medical and vaccination records were consulted.
Most of the SARS-CoV-2 vaccines the cohort received were mRNA vaccines, including Pfizer-BioNTech (BNT162b2) (Comirnarty®) for first and second dose, and Moderna (mRNA-1273) (Spikevax®) for third dose, to 228 participants. In addition, the AstraZeneca (AZD1222) (Vaxzevria® Covishiel®) vaccine was administered to 54 participants for first and second doses. A first dose of the Janssen® SARS-CoV-2 vaccine (Ad26.CoV2.S) (Jcovden®) was administered only to 3 participants. The third dose of the SARS-CoV-2 mRNA vaccine was administered to all participants. Information about vaccine brand and vaccination dates was obtained by consulting the population-based Valencia Region Vaccine Information System.
2.3. Laboratory Confirmation Tests
For determination of SARS-CoV-2 infections, laboratory confirmatory tests, including detection of anti–SARS-CoV-2 spike IgG antibodies and IgG and IgM anti-nucleocapsid antibodies measured by chemiluminescence microparticle immunoassay (CMIA AlinityI serie, Abbot, Chicago, IL, USA) [16] and antibodies against SARS-CoV-2 nucleocapsid protein N were studied by electrochemiluminescence immunoassay [17]. For the detection of the SARS-CoV-2 virus, reverse transcription polymerase chain reaction (RT-PCR) from different trademarks and platforms were employed: Genexpert, Roche Diagnostics, Simplexa, Barcelona, Spain), and rapid antigen tests (RATs). The RT-PCR was performed by the Laboratory of Microbiology Service of the University Hospital de la Plana (Vila-real, Spain), and the second at home, by the participants.
2.4. Research Surveys
Three surveys were performed for all participants from June 2020 to June 2022 [18] through specific questionnaires in order to obtain information on socio-demographic characteristics, cohabitants at home, chronic disease, body mass index (BMI) (kg/m2), lifestyles, including smoking habit, alcohol consumption, physical exercise, history of SARS-CoV-2 infections, date of onset, risk factors for SARS-CoV-2 exposure, including family COVID-19 cases, exposure to the public at work, attendance to restaurants/bars, and face masks wearing. Face-to-face interviews and telephone surveys were conducted by health staff from Primary Care Health Center of Borriana and Vila-real, the Emergency Service of University Hospital de la Plana, and the Public Health Center of Castellon.
In addition, a revision of the primary healthcare record of each participant was carried out, and the computer application outpatient care of the Valencia Health Agency (ABUCASIS) was queried from January 2020 to August 2023 with the aim of detecting new COVID-19 cases, reinfections, and disease evolution.
2.5. Statistical Methods
Statistical methods for the two approaches were similar. Means, standard deviations, and percentages were used to describe the characteristics of the studied population. Cumulative incidence rate was estimated by dividing the SARS-CoV-2 cases by the total of participants, and relative risk (RR) was defined as the ratio between the incidence rate of SARS-CoV-2 infection in exposed participants and the incidence rate of SAR-CoV-2 in unexposed participants, considering the different variables.
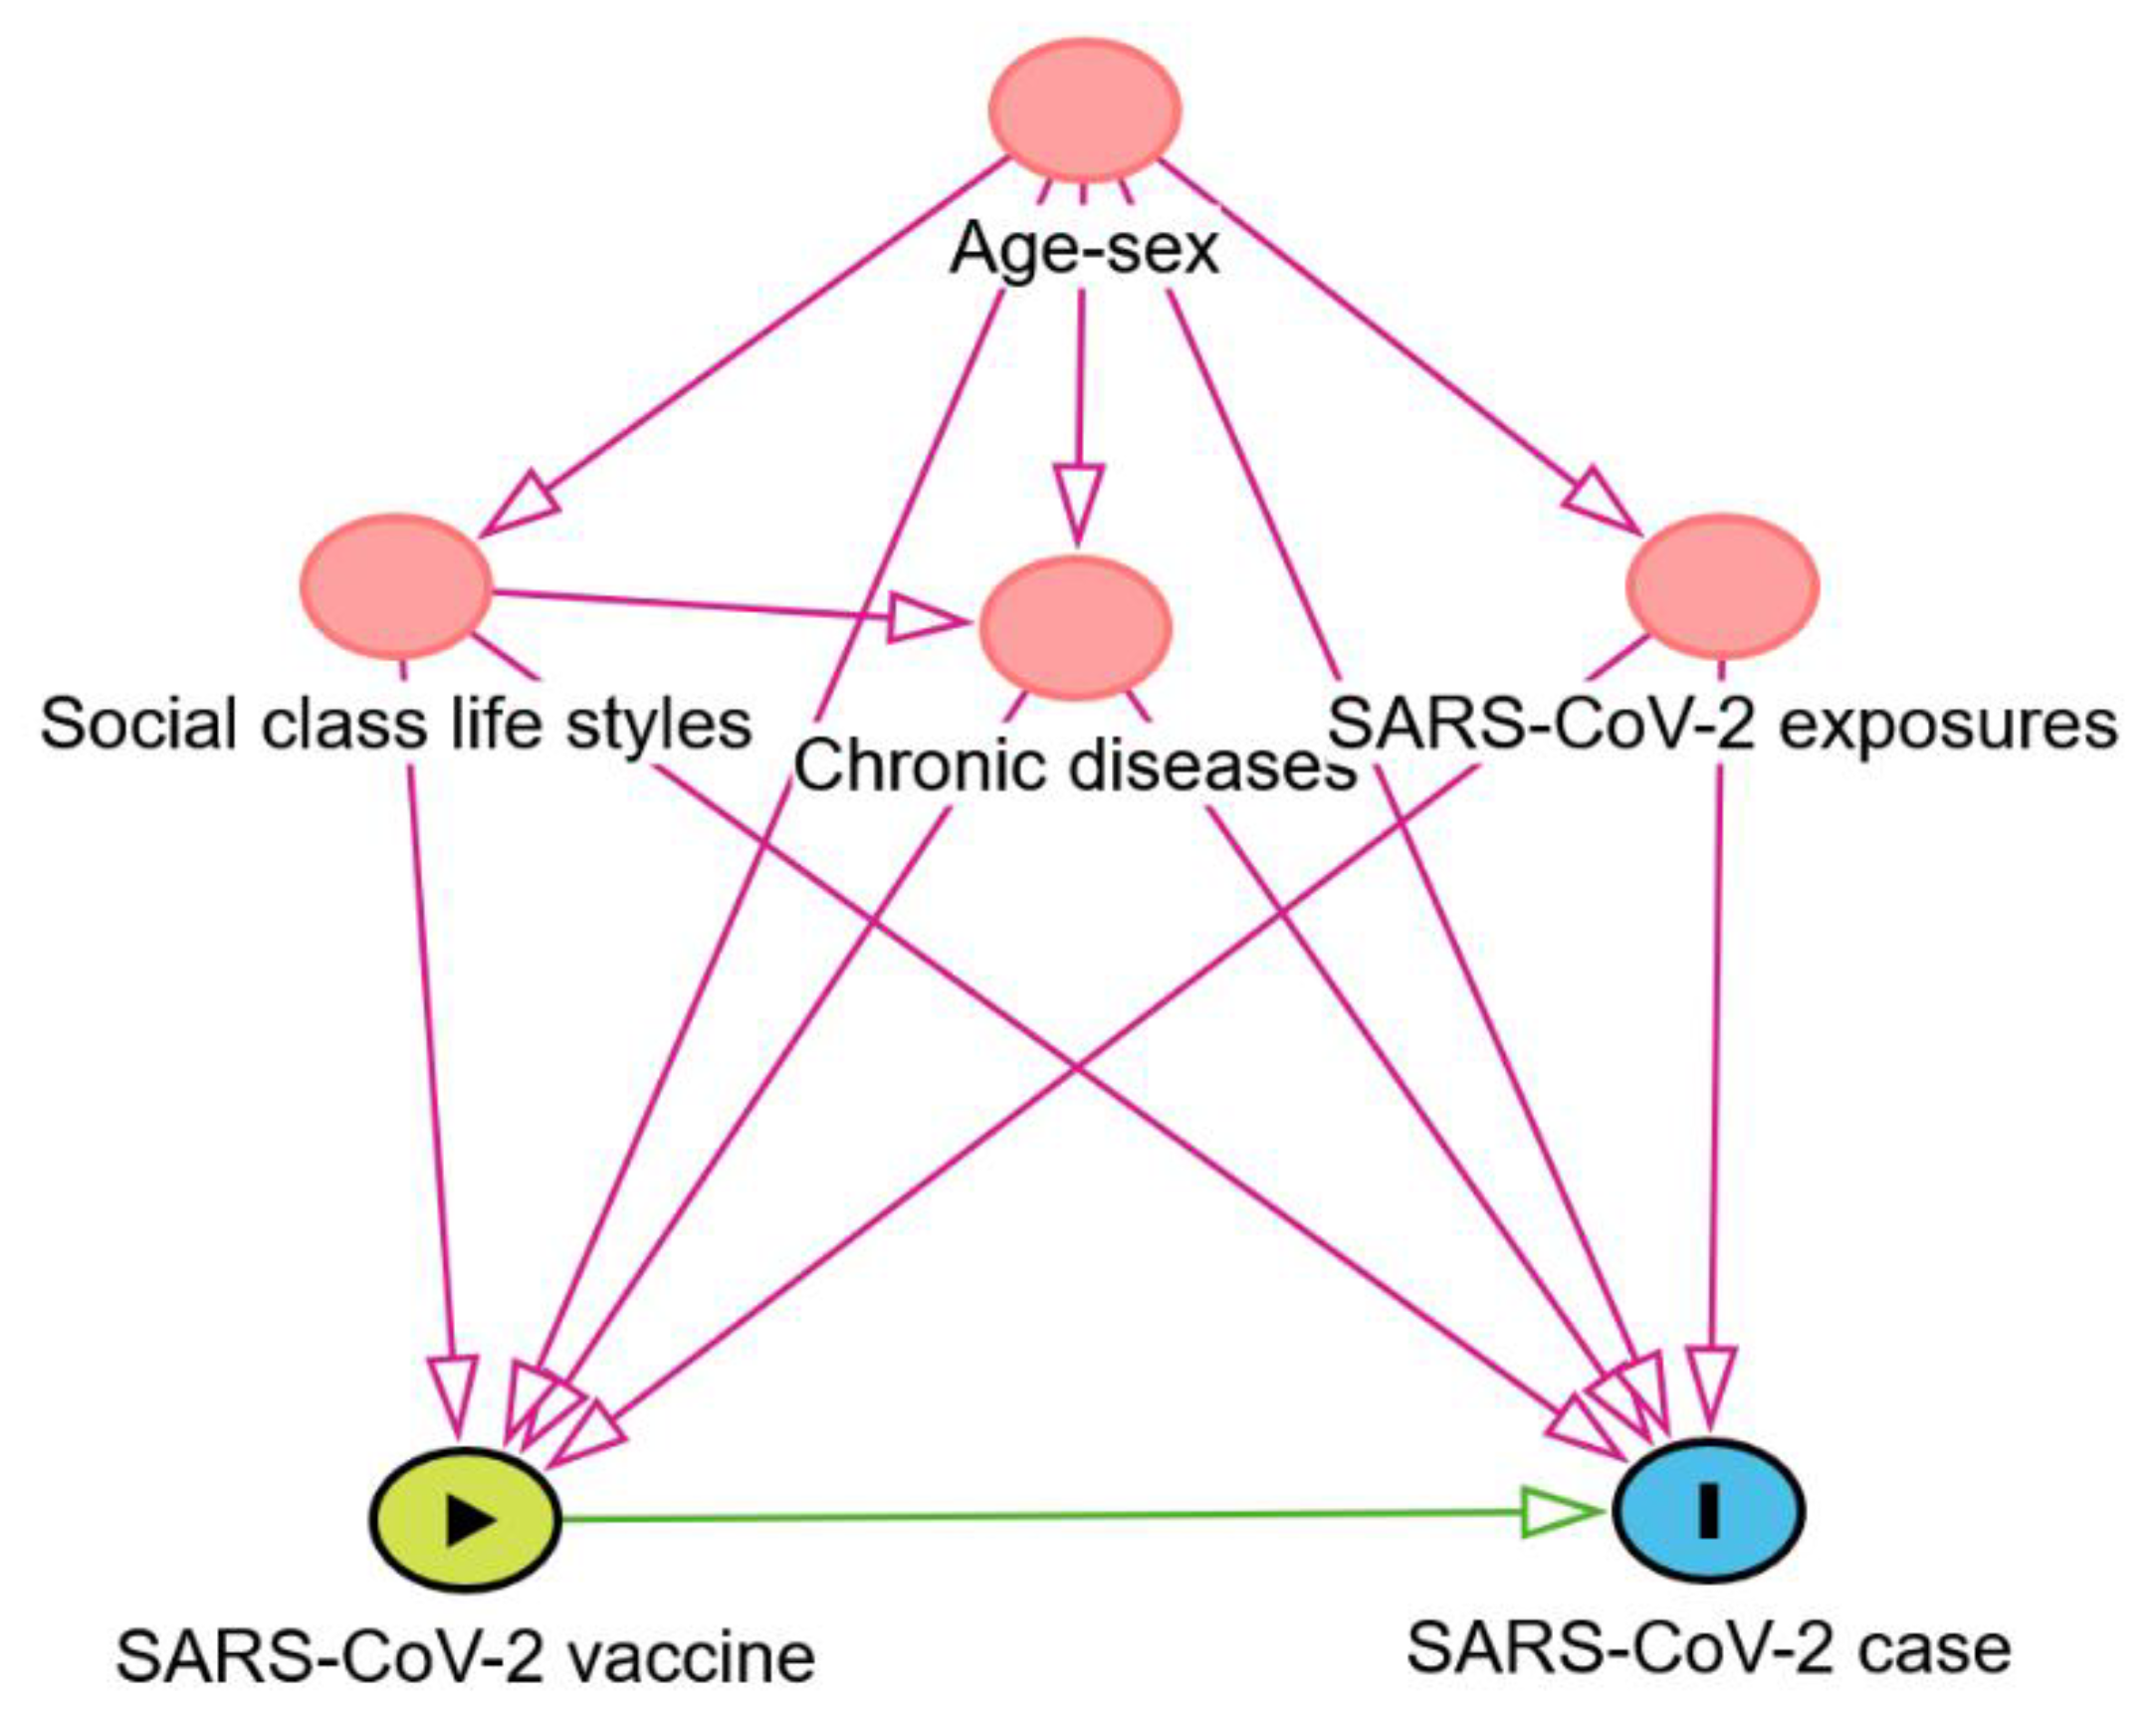
SARS-CoV-2 infection was the dependent variable and SARS-CoV-2 vaccine the predictor variable. Robust Poisson regression models were employed to obtain crude relative risk (RR) and adjusted relative risk (aRR) respectively, with 95% confidence intervals (CI). Vaccine effectiveness (VE) was calculated as (1-RR) x 100 [19]. For the control of potential confounding factors, Directed Acyclic Graphics (DAGs) methodology was used [20,21], and the DAGitty version 3.1 program was used [22].Risk factors include age, sex, cohabitants at home, social class considering upper and middle class (I-II) versus lower class (III-VI), lifestyles (smoking, obesity as BMI≥ 30 kg/m2, alcohol consumption, physical exercise), chronic diseases, and SARS-CoV-2 exposures (family COVID-19 case, exposure to the public at work, visiting restaurants/bars, face mask wearing) [23]. Stata ® version 14 program was used for all calculations.
Figure 1.
Directed Acyclic Graph (DAG) of SARS-CoV-2 vaccine (exposure) and SARS-CoV-2 case (outcome). Ancestor of exposure and outcome (in red). Based on DAGitty version 3.1 program. Potential confounding factors: age, sex, cohabitants at home, social class, chronic diseases, lifestyles (smoking, obesity, alcohol consumption, physical exercise), and SARS-CoV-2 exposures (family COVID-19 case, exposure to the public at work, visiting restaurants/bars, and face mask wearing).
2.6. Ethical Issue
This study was submitted and approved by the Ethics Committee of University Hospital de la Plana (October 14, 2021, registry number 2961). All participants, or their parents in the case of minors, provided informed written consent to be included in the study.
3. Results
3.1. First Approach Considering Participants Vaccinated Before SARS-CoV-2 Infection
From the initial Borriana COVID-19 cohort, members of the cohort with confirmation by laboratory tests of COVID-19 status (n=1132), were invited to participate in the survey, and 722 were enrolled with a participation rate of 63.8% (722/1132). From March 2020 to August 2023, 644 participants suffered a SARS-Cov-2 infection with a confirmatory laboratory test. Three participants suspected the infection but without any laboratory confirmation, and 75 participants did not suffer the infection, with a cumulative incidence rate of 89.2% (644/722).
Participants who suffered a SARS-CoV-2 infection before the onset of the SARS-CoV-2 vaccinations (n=418) or without infection confirmation (n=3) were excluded from this study. Asymptomatic SARS-CoV-2 participants were included in the study if the laboratory confirmation of SARS-CoV-2 infection was performed after the vaccination. In the first approach, the study included 301 participants, 226 SARS-CoV-2 cases and 75 SARS-CoV-2 non-cases. Among the cases, 73 were asymptomatic and 153 were symptomatic.
Clinical characteristics of the symptomatic cases included fever (59.4%), coryza (46.2%), cough (45.8%), headache (43.4%), myalgiae (38.5%), sore throat (34.3%), weakness (33.6%), loss of smell and/or taste (14.2%), dyspnea (11.9%), diarrohea (9.2%), and vomiting (6.3%). The average disease duration was 5.7 ± 4.2 days, with a median of 5.0 days (rank 1–30). Long COVID sequelae were reported in 28 cases (12.4%). A total of 102 cases sought medical assistance (66.7%) and 6 cases were hospitalized due to COVID-19 (3.9%). In the study period, one 72-year-old woman died after two months of the onset of SARS-CoV-2 infection, and it was due to a cause not associated with the disease.
Temporal distribution by onset of symptoms in 153 symptomatic cases is shown in Figure 2. The onset of the first COVID-19 case happened in May 2021, with an increase of cases from July to December 2021 (18.2%), an accumulation of cases in January 2022 (39.6%), after a slow decline up to August 2022 (37.7%), and ending in August 2023 with the last case. Certainly, most cases were produced by Omicron variants.
Characteristics and comparisons of SARS-CoV-2 cases and non-cases are presented in Table 1. Crude relative risks were estimated for comparison. Cases were younger than non-cases with a lower proportion of people older than 50 years and above. Males presented a low risk compared with females (RR=0.87 0.95% CI 0.75-0.84). Social class, obesity, and chronic disease were not risk factors for SARS-CoV-2 incidence. Alcohol consumption and physical exercise have not affected SARS-CoV-2 incidence. In contrast, smokers had a protective effect (RR=0.76 95% CI 0.60-0.97). High numbers of cohabitants at home were a risk factor (RR=1.08 95% CI 1.02-1.16). Variables of SARS-CoV-2 exposures, such as exposure to the public at work was a risk factor for infection (RR=1.20 95% CI 1.00-1.43). Even though family members with COVID-19 case and visiting restaurants and bars presented more risk of SARS-CoV-2 infection, it was not significant. Face mask wearing was a protective factor without signification.
In the Borriana COVID-19 cohort, SARS-CoV-2 vaccinations began in January 2021, and 57.9% (418/722) of the cohort had already suffered from COVID-19 disease. Table 2 presents the results of the SARS-CoV-2 vaccination in cases and non-cases. From a total of 301 participants, 285 (94.7%) were vaccinated against COVID-19 disease with at least one dose, 275 (91.4%) with 2 or 3 doses, and 165 (54.8%) with three doses. Only 16 participants were not vaccinated. SARS-CoV-2 mRNA vaccines were exclusively administered to 228 participants (80%), and 57 participants (19%) received mRNA vaccines and other SARS-CoV-2 vaccines (AstraZeneca and Janssen). It highlights the high proportion of vaccinated (92.9%) among SARS-CoV-2 cases. However, vaccination was a significant protective against SARS-CoV-2 infection, specifically with at least one dose (RR=0.74 95% CI 0.69-0.79), with a complete vaccination (2-3 doses) (RR=0.72 95% CI 0.68-0.78), and with a booster vaccination (3 doses) (RR=0.68 95% CI 0.59-0.77). Comparing the number of vaccine doses administered, 2 and 3 doses of vaccines were protective of SARS-CoV-2 infection (RR=0.89 95% CI 0.83-0.95) and (RR=0.62 95% CI 0.55-0.70), respectively. Comparing the types of vaccine, no significant differences were found.
Adjusted relative risks (aRR) of SARS-CoV-2 vaccine doses and effectiveness are presented in Table 3. ARRs were significantly protective against SARS-CoV-2 infections, considering vaccinated versus unvaccinated (aRR =0.78 95% CI 0.63-0.96), vaccinated 2-3 doses versus 0-1 doses (RR=0.82 95% CI 0.70-0.95), and vaccinated with 3 doses versus 0-1-2 doses (RR=0.71 95% CI 0.61-0.82). Considering the number of vaccine doses, 3 doses were significantly protective (RR=0.63 95% CI 0.61-0.82), whereas 2 doses were not significantly protective. VE in vaccinated versus unvaccinated was 22% (95% CI 4-37), vaccinated with 2-3 doses 18% (95% CI 5-30), and vaccinated with 3 doses 29% (95% CI 18-39). By the number of vaccine doses, three doses had an VE of 37% (95% CI 22-49).
SARS-CoV-2 vaccine stratifications for sex, chronic disease and age of 50 years and over are presented in Table 4. Males had a lower aRR to suffer SARS-CoV-2 infection than women (0.62 versus 0.74) and VE was higher, 38% versus 26%. Participants with a chronic disease had a lower aRR than participants without a chronic disease (0.60 versus 0.74), and VE was higher 40% versus 26%. Participants aged 50 years old and over had a lower aRR than participants aged less than 50 years (0.51 versus 0.77) and a higher VE of 49% versus 23%.
3.2. Second Approach Considering Participants Vaccinated Before a Symptomatic SARS-CoV-2 Infection Excluding of Participants with Asymptomatic SARS-CoV-2 Infections
From the 226 SARS-CoV-2 cases in the first approach, 153 participants suffered from a symptomatic SARS-CoV-2 infection, and 73 participants were asymptomatic SARS-CoV-2 cases, thus were excluded from this analysis. Asymptomatic cases represent 32.3% of cases (73/226) and 66 participants were vaccinated (90.4%). In the second approach, there were 229 participants, 153 cases and 75 non-cases.
Non-cases were significantly older than the cases, and males had a lower risk of SARS-CoV-2 infections (Table 5). Social class, chronic disease, alcohol intake, obesity and physical exercise were not risk factors for infection. However, current smoking was a significant protective factor (RR=0.76 95% CI 0.60-0.97). The number of cohabitants at home (RR=1.14 95% 1.04-1.25) was a risk factor, and working exposed to the public at work (RR=1.30 95% CI 1.01-1.68). Family with a COVID-19 case and visiting restaurants/bars increased risk of infection without significance, and a face mask wearing was not a significant protective factor.
From 228 participants, 219 were vaccinated, 153 cases and 75 non-cases (Table 6). Only 9 cases were unvaccinated. Vaccination was significantly protective against SARS-CoV-2 infection, specifically with at least one dose (RR=0.66 95% CI 0.60-0.72), with 2 or 3 doses (RR=0.64 95% CI 0.58-0.71) and with 3 doses (RR=0.51 95% CI 0.42-0.64). Considering the numbers of doses, 3 doses produced a higher protection (RR=0.46 95% CI 0.38-0.56) than 2 doses (RR=0.87 95% CI 0.81-0.94). No differences between mRNA vaccine alone versus mRNA and other vaccines were found.
Adjusted RR and VE of SARS-CoV-2 vaccines for the symptomatic cases are presented in Table 7. The SARS-CoV-2 vaccine with at least one dose did not protect against SARS-CoV-2 infection (aRR=0.81 95% CI 0.53-1.22), as well as vaccinations schedules with 2 and 3 doses (aRR=0.82 95% CI 0.67-1.01), even though 3 doses vaccination was a significantly protective factor (aRR=0.54 95% CI 0.44-0.68), with VE of 46% (95% CI 32-56). Considering the numbers of doses, 3 doses were significantly protective against SARS-COV-2 infection (aRR=0.50 95% CI 0.37-0.67) with a VE of 50% (95% CI 33-63). Two doses of vaccine were not significantly protective against SARS-CoV-2 infection.
SARS-CoV-2 vaccine stratifications for sex, chronic disease, and age 50 years and over are presented in Table 7. Males had a lower aRR than women (0.38 versus 0.61) and a higher VE of 62% versus 39%. Participants with chronic disease had a lower aRR and VE than participants without chronic disease (0.48 versus 0.55) with higher VE (52% versus 45%). Participants aged 50 years and over had lower aRR than participants under 50 years old (0.40 versus 0.61), and VE was higher (60% versus 39%).

Table 8.
Crude (RR) and adjusted relative risk (aRR), and effectiveness of SARS-CoV-2 vaccines, stratification for sex, chronic disease, and age with symptomatic SARS-CoV-2 particiants Comparisons between vaccinated with 3 doses versus 0-1-2 doses. Robust Poisson regression. 95% Confidence interval (CI).
| Variable | Crude RR 95%CI | Adjusted RR 95% CI | Effectiveness 95% CI | p-value |
| Female | 0.59 (0.46-0.74) | 0.61(0.49-0.78) | 39% (22-51) | 0.000 |
| Male | 0.42 (0.28-0.63) | 0.38(0.23-0.63) | 62% (37-77) | 0.000 |
| Chronic disease Yes | 0.60(0.44-0.81) | 0.48(0.32-0.73) | 52% (27-68) | 0.001 |
| No | 0.47(0.35-0.63) | 0.55(0.41-0.73) | 45% (27 -59) | 0.001 |
| Age 50 years and over | 0.46(0.31-0.69) | 0.40(0.24-0.64) | 60% (36-76) | 0.000 |
| Age under 50 years | 0.61(0.48-0.78) | 0.61(0.48-0.77) | 39% (23-52) | 0.000 |
Adjusted for age, sex, chronic disease, obesity, smoking, alcohol consumption, physical exercise, social class, cohabitants, exposure to the public at work, face mask wearing, visiting restaurants/bars, and COVID-19 family case.
3.3. Comparisons First and Second Approaches
Comparisons between the first and second approaches are presented in Table 9. The two approaches found no consistent results for SARS-CoV-2 vaccines. In the first approach, vaccination produced a significant protection at least one dose, 2 or 3 doses and 3 doses. Only those with 2 doses received showed no protection. In contrast, the second approach, at least one dose, and 2 or 3 of vaccine was not protective. Vaccination with 3 doses was protective in both approaches, though the aRR decreased from 0.71 to 0.54, with VE increased from 29% to 46%. Considering the number of vaccines received, 3 doses decreased the aRR from 0.63 to 0.50, and increased VE from 37% to 50%. Two doses were not protective in both approaches. Regarding stratification, the second approach decreased aRR compared with the first approach, especially in male participants and participants aged 50 years old and over. VE increased in the second approach.
4. Discussion
A high proportion of participants were vaccinated in this cohort, whose effects may be largely attributed to mRNA vaccines. Considering these two approaches, vaccination with 3 doses gave significant protection against SARS-CoV-2 infection. Although this protection is modest, its VE only reached 50% when three doses of vaccine were administered. Vaccinations with 1 or 2 doses were significantly protective in the first approach, but they were not significant in the second approach. When the number of vaccine doses was analyzed, three doses significantly decreased the risk of infection, but two doses were not sufficient to reduce this risk, in line with a review by Gou and co-authors [24]. Stratification found a higher VE in males than females, in participants with chronic diseases, and in participants 50 years old and over. In the second approach, the VE increased above all for three doses of vaccination and for stratification. This could suggest that including asymptomatic participants could underestimate VE [25,26].
When explaining our results, it is important to consider the long duration of the follow-up and the SARS-CoV-2 variants in the period, with the Omicron variant as predominant for most of the study period. Two variables, time from vaccination and virus variants, are crucial for SARS-CoV-2 risk infection quantification and VE. In initial clinical trials of SARS-CoV-2, the VE during the first 6 months was very high, reaching 96%, and declining progressively. The protection against infection declined 20-30 percentage points [2,27] 6 months after vaccination. In addition, new variants of SARS-CoV-2 resulted in an increase of breakthrough infections in vaccinated populations [28,29]. Other factors could contribute, including a decrease in non-pharmacological measures against infections after 2 years of the COVID-19 pandemic and certain reluctance for vaccination. [30]. Then, very high SARS-CoV-2 vaccination rates may be necessary to stop SARS-CoV-2 transmission, considering reproductive numbers between 5.8 and 6.1 [31]. In addition, vaccine breakthrough infections have allowed continuing transmission given that these vaccinated cases had viral loads like unvaccinated cases [32], although the duration of infections could be shorter in vaccinated subjects [33].
In this context, comparing our results with other studies, the effectiveness of mRNA vaccines to preventing SARS-CoV-2 infection after the first epidemic period from 2020 to 2021, decreases against Omicron variant in cohort studies, considering symptomatic SARS-CoV-2 cases with VE of 47.9% (95% CI 41.85-53.75) in a review study [34]. Among healthcare workers in a clinic in Cleveland, the decline was from 49% to 19% according to the periods [35]. In Spain, Monge and co-authors found a VE of 52·5% (95% CI 51.3%-53.7%) for an mRNA-1273 booster and a VE of 46.2% (95% CI 43.5%-48.7%) for a BNT162b2 booster in a national cohort [36]. In Hong Kong, the BNT162b2 vaccine was protective against asymptomatic and symptomatic SARS-CoV-2 Omicron infection with a VE of 41·4% (95% CI 23.2%- 55.2%); the VE of BNT162b2 boosters was 50.9% (95% CI 31%·65%) for symptomatic Omicron infections [37]. In Japan, a cohort study of the general population from 16 to 64 years old found that the mRNA vaccine had an VE for a third dose against symptomatic infection of 71.8% (95% CI: 60.1-80.1%) during the Omicron period [38]. In Canada, a cohort study of healthcare workers found a VE of 43% (95% CI 29%-54%) for 3 doses and 56% (95% CI 42%-67%) for 4 doses, adjusting for previous infection and other covariates. [39].
In our study, we performed a control of potential risk factors, including demographics, lifestyles, virus exposure and measures of prevention as have been recommended for VE studies [40,41]. Although for some authors, the exposure information had little effect on VE [15]. Regarding related factors of SARS-CoV-2 infections, our study found that older and male participants had a lower risk of infection. On the contrary, the number of cohabitants at home, and exposure to the public at work increased the risk for infection. Current smoking was a protective factor. Other lifestyle factors and preventive measures against virus transmission had no effect on the infection. Some of these factors have been found in studies of SARS-CoV-2 epidemiology, such as a higher risk of infection, including female sex and household size [42], young age [43] and exposure to the public at work as a proxy for working outside home [44] or education and social care occupations [45]. Current smoking was a protective factor as in other studies [46]. Wearing a face mark was not protective in line with a prospective cohort study in Germany [47], but it was protective in other studies [48], and obesity was not a risk factor contrary to what was found in England [49].
Some studies have proposed to explain the mechanism of SARS-CoV-2 vaccine protection [50], considering the limitation of effectiveness over time in the prevention of infection, including low IgG antibody levels in the upper respiratory tract, with high neutralizing antibodies in the circulation. It may be derived from intramuscular injection of SARS-CoV-2 vaccines. Other factors were the high frequency of SARS-CoV-2 variants, including the Omicron variant with a predilection for the upper respiratory tract.
The study of VE is critical for the implementation of strategies to control and prevent COVID-19 epidemics, and it is subject to a high likelihood of bias, considering the design, performer, and the results. Several reviews have mentioned these issues, including case-control, test-negative, and cohort studies [51,52,53]. In addition, the estimation of the VE duration needs an accurate analysis [26]. Our study has strengths and limitations. As a strength highlight, a prospective cohort design with population-based, long follow-up, laboratory confirmed cases, use of an official vaccine register, control of potential confounding factors and two approaches measuring the VE of SARS-CoV-2 vaccines with the total of incident cases and only symptomatic cases. Limitations of this study included the decrease in the number of participants in the cohort, impossibility of detection for SARS-CoV-2 variants, measures of exposure were obtained through a questionnaire retrospectively in a part of infected cases, and two different vaccines were used, mRNA vaccine and viral vector vaccine. Some other residual confounding factors could remain, and COVID-19 is a new disease and some issues may not have been considered in this study.
5. Conclusions
The results of this study suggest modest protection SARS-CoV-2 mRNA vaccines against SARS-CoV-2 infections with 3 doses of vaccine. One or two doses were insufficient to protect against the infection. An increase in VE, including only symptomatic cases, was found. New vaccines against SARS-CoV-2 need to be developed.
Author Contributions
Conceptualization, S.D.-M., Ó.P.-O., L.L.-D., A.A.-P., M.R.P.-S., and M.A.R.-G.; methodology, S.D.-M., Ó.P.-O., A.A.-P., and M.R.P.-S.; software, M.R.P.-S. and A.A.-P.; validation, A.D.R.-G., M.S.-U., P.S.-M., R.R.-P., and M.A.R.-G.; formal analysis, Ó.P.-O., M.R.P.-S. and A.A.-P.; investigation, S.D.-M., I.A.-G., D.S.-T., A.D.R.-G., M.S.-U., P.S.-M., M.A.R.-G., J.C.-S., C.N.-R., , G.B.-M., L.A.-E., and C.D.-L.; resources, S.D.-M., Ó.P.-O.,L.L.-D., J.C-S., and C.N.-R.; data curation, D.S.-T., R.R.-P., and M.S.-U.; writing—original draft preparation, A.A.-P., Ó.P.-O., D.S.-T., and I.A.-G.; writing—review and editing, A.A.-P., S.D.-M., D.S.-T., and Ó.P.-O.; visualization, G.B.-M., L.A.-E., P.S.-M., J.C.-S., and C.D.-L.; supervision, L.L.-D., C.N.-R., and J.C.-S.; project administration, S.D.-M., Ó.P.-O., and L.L.-D.; funding acquisition, S.D.-M., Ó.P.-O., and L.L.-D. All authors have read and agreed to the published version of the manuscript.
Funding
This research received no external funding.
Institutional Review Board Statement
This study (BO-CO-COVID-2 FALLAS DE BORRIANA) has been approved by the Ethics Committee of the University Hospital de la Plana, Vila-real. Date: 14 October 2021 (IRB number 2961).
Informed Consent Statement
All participants or the parents of minors provided informed written consent to be included in the study.
Data Availability Statement
The data of the study can be consulted if the authors are requested.
Acknowledgments
We thank the participants of the Borriana COVID-19 cohort and we appreciate the Borriana’s Falles organization for the support and help to implement this study.
Conflicts of Interest
The authors declare no conflicts of interest.
References
- Evans, S.J.W.; Jewell, N.P. Vaccine effectiveness studies in the field. N Engl J Med 2021, 385, 650–651. [Google Scholar] [CrossRef]
- Feikin, D.R.; Higdon, M.M.; Abu-Raddad, L.J.; Andrews, N.; Araos, R.; Goldberg, Y.; Groome, M.J.; Huppert, A.; O'Brien, K.L.; Smith, P.G.; et al. Duration of effectiveness of vaccines against SARS-CoV-2 infection and COVID-19 disease: results of a systematic review and meta-regression. Lancet 2022, 399, 924–944. [Google Scholar] [CrossRef]
- Yang, X.H.; Bao, W.J.; Zhang, H.; Fu, S.K.; Jin, H.M. The efficacy of SARS-CoV-2 vaccination in the Elderly: A systemic review and meta-analysis. J Gen Intern Med, 2023, Jun 2:1–9.
- Arrospide, A.; Sagardui, M.G.; Larizgoitia, I.; Iturralde, A.; Moreda, A.; Mar, J. Effectiveness of the booster dose of COVID-19 vaccine in the Basque Country during the sixth wave: A nationwide cohort study. Vaccine, 2023, 41, 4274–4279. [Google Scholar] [CrossRef]
- Domènech-Montoliu, S.; Puig-Barberà, J.; Badenes-Marques, G.; Gil-Fortuño, M.; Orrico-Sánchez, A.; Pac-Sa, M.R.; Perez-Olaso, O.; Sala-Trull, D.; Sánchez-Urbano, M.; Arnedo-Pena, A. Long COVID prevalence and the impact of the third SARS-CoV-2 vaccine dose: A cross-sectional analysis from the third follow-up of the Borriana Cohort, Valencia, Spain (2020-2022). Vaccines (Basel), 2023, 11, 1590. [Google Scholar] [CrossRef]
- Arashiro, T.; Arima, Y.; Muraoka, H.; Sato, A.; Oba, K.; Uehara, Y.; Arioka, H.; Yanai, H.; Kuramochi, J.; Ihara, G.; et al. Coronavirus disease 19 (COVID-19) vaccine effectiveness against symptomatic severe acute respiratory syndrome coronavirus 2 (SARS-CoV-2) infection during Delta-dominant and Omicron-dominant periods in Japan: A multicenter prospective case-control Study (factors associated with SARS-CoV-2 infection and the effectiveness of COVID-19 vaccines study). Clin Infect Dis, 2023, 76, e108-e115.
- Di Fusco, M.; Lin, J.; Vaghela, S.; Lingohr-Smith, M.; Nguyen, J.L.; Scassellati Sforzolini, T.; Judy, J.; Cane, A.; Moran, M.M. COVID-19 vaccine effectiveness among immunocompromised populations: a targeted literature review of real-world studies. Expert Rev Vaccines, 2022, 21, 435–451. [Google Scholar] [CrossRef] [PubMed]
- Ssentongo, P.; Ssentongo, A.E.; Voleti, N.; Groff, D.; Sun, A.; Ba, D.M.; Nunez, J.; Parent, L.J.; Chinchilli, V.M.; Paules, C.I. SARS-CoV-2 vaccine effectiveness against infection, symptomatic and severe COVID-19: a systematic review and meta-analysis. BMC Infect Dis, 2022, 22, 439.
- Wiegand, R.E.; Fireman, B.; Najdowski, M.; Tenforde, M.W.; Link-Gelles, R.; Ferdinands, J.M. Bias and negative values of COVID-19 vaccine effectiveness estimates from a test-negative design without controlling for prior SARS-CoV-2 infection. Nat Commun 2024, 15, 10062. [Google Scholar] [CrossRef]
- Huiberts., A.J.; Hoeve, C.E.; Kooijman, M.N.; de Melker, H.E.; Hahné, S.J.; Grobbee, D.E.; van Binnendijk, R.; den Hartog, G.; van de Wijgert, J.H.; van den Hof, S.; et al. Cohort profile: an observational population-based cohort study on COVID-19 vaccine effectiveness in the Netherlands - the Vaccine Study COVID-19 (VASCO). BMJ Open 2024, 14, e085388. [Google Scholar] [CrossRef] [PubMed]
- Domènech-Montoliu, S.; Pac-Sa, M.R.; Vidal-Utrillas, P.; Latorre-Poveda, M.; Del Rio-González, A.; Ferrando-Rubert, S.; Ferrer-Abad, G.; Sánchez-Urbano, M.; Aparisi-Esteve, L.; Badenes-Marques, G.; et al. "Mass gathering events and COVID-19 transmission in Borriana (Spain): A retrospective cohort study". PLoS One, 2021, 16, e0256747. [Google Scholar] [CrossRef]
- Domènech-Montoliu, S.; Puig-Barberà, J.; Pac-Sa, M.R.; Vidal-Utrillas, P.; Latorre-Poveda, M.; Del Rio-González, A.; Ferrando-Rubert, S.; Ferrer-Abad, G.; Sánchez-Urbano, M.; Aparisi-Esteve, L.; et al. Complications post-COVID-19 and risk factors among patients after six months of a SARS-CoV-2 infection: A population-based prospective cohort study. Epidemiologia (Basel) 2022, 3, 49–67. [Google Scholar] [CrossRef]
- Domènech-Montoliu, S.; Puig-Barberà, J.; Pac-Sa, M.R.; Orrico-Sanchéz, A.; Gómez-Lanas, L.; Sala-Trull, D.; Domènech-Leon, C.; Del Rio-González, A.; Sánchez-Urbano, M.; Satorres-Martinez, P.; et al. Cellular immunity of SARS-CoV-2 in the Borriana COVID-19 Cohort: A nested case-control study. Epidemiologia (Basel), 2024, 5, 167–186. [Google Scholar] [CrossRef] [PubMed]
- Hodcroft, E.; CoVariants. Overview of Variants in Countries. Covariants.org. Available online: https://covariants.org/per-country?country=Spain (accessed on 1 August 2025).
- van Ewijk, C.E.; Kooijman, M.N.; Fanoy, E.; Raven, S.F.; Middeldorp, M.; Shah, A.; de Gier, B.; de Melker, H.E.; Hahné, S.J.; Knol, M.J. COVID-19 vaccine effectiveness against SARS-CoV-2 infection during the Delta period, a nationwide study adjusting for chance of exposure, the Netherlands, July to December 2021. Euro Surveill 2022, 27, 2200217. [Google Scholar] [CrossRef] [PubMed]
- Narasimhan, M.; Mahimainathan, L.; Araj, E.; Clark, A.E.; Markantonis, J.; Green, A.; Xu, J.; SoRelle, J.A.; Alexis, C.; Fankhauser, K.; et al. Clinical evaluation of the Abbott Alinity SARS-CoV-2 Spike-Specific Quantitative IgG and IgM Assays among infected, recovered, and vaccinated groups. J Clin Microbiol 2021, 59, e0038821. [Google Scholar] [CrossRef] [PubMed]
- Egger, M.; Bundschuh, C.; Wiesinger, K.; Gabriel, C.; Clodi, M.; Mueller, T.; Dieplinger, B. Comparison of the Elecsys® Anti-SARS-CoV-2 immunoassay with the EDI™ enzyme linked immunosorbent assays for the detection of SARS-CoV-2 antibodies in human plasma. Clin Chim Acta, 2020, 509, 18–21. [Google Scholar] [CrossRef] [PubMed]
- Domènech-Montoliu, S.; López-Diago, L.; Aleixandre-Gorriz, I.; Pérez-Olaso, Ó.; Sala-Trull, D.; Del Rio-González, A.D.; Pac-Sa, M.R.; Sánchez-Urbano, M.; Satorres-Martinez, P.; Casanova-Suarez, J.; et al. Vitamin D Status and incidence of SARS-CoV-2 reinfections in the Borriana COVID-19 Cohort: A population-based prospective cohort study. Trop Med Infect Dis 2025, 10, 98. [Google Scholar] [CrossRef]
- Meijerink, H.; Veneti, L.; Kristoffersen, A.B.; Danielsen, A.S.; Stecher, M.; Starrfelt, J. Estimating vaccine effectiveness against COVID-19 using cause-specific sick leave as an indicator: a nationwide population-based cohort study, Norway, July 2021 - December 2022. BMC Public Health, 2024, 24, 1861. [Google Scholar] [CrossRef]
- Greenland, S.; Pearl, J.; Robins, J.M. Causal diagrams for epidemiologic research. Epidemiology, 1999, 10, 37–48. [Google Scholar] [CrossRef]
- Poppe, L.; Steen, J.; Loh, W.W.; Crombez, G.; De Block, F.; Jacobs, N.; Tennant, P.W.G.; Cauwenberg, J.V.; Paepe, A.L. How to develop causal directed acyclic graphs for observational health research: a scoping review. Health Psychol Rev, 2025, 19, 45–65. [Google Scholar] [CrossRef]
- Textor, J.; van der Zander, B.; Gilthorpe, M.S.; Liskiewicz, M.; Ellison, G.T. Robust causal inference using directed acyclic graphs: the R package 'dagitty'. Int J Epidemiol 2016, 45, 1887–1894. [Google Scholar] [CrossRef]
- Arashiro, T.; Arima, Y.; Muraoka, H.; Sato, A.; Oba, K.; Uehara, Y.; Arioka, H.; Yanai, H.; Yanagisawa, N.; Nagura, Y.; et al. Behavioral factors associated with SARS-CoV-2 infection in Japan. Influenza Other Respir Viruses 2022, 16, 952–961. [Google Scholar] [CrossRef]
- Guo, K.; Ni, P.; Chang, S.; Jin, Y.; Duan, G.; Zhang, R. Effectiveness of mRNA vaccine against Omicron-related infections in the real world: A systematic review and meta-analysis. Am J Infect Control, 2023, 51, 1049–1055. [Google Scholar] [CrossRef]
- Williams, L.R.; Ferguson, N.M.; Donnelly, C.A.; Grassly, N.C. Measuring vaccine efficacy against infection and disease in clinical trials: Sources and magnitude of bias in coronavirus disease 2019 (COVID-19) vaccine efficacy estimates. Clin Infect Dis, 2022, 75, e764–e773. [Google Scholar] [CrossRef]
- Ortiz-Brizuela, E.; Carabali, M.; Jiang, C.; Merckx, J.; Talbot, D.; Schnitzer, ME. Potential biases in test-negative design studies of COVID-19 vaccine effectiveness arising from the inclusion of asymptomatic individuals. Am J Epidemiol 2025, 194, 844–856. [Google Scholar] [CrossRef]
- Zhou, G.; Dael, N.; Verweij, S.; Balafas, S.; Mubarik, S.; Oude Rengerink, K.; Pasmooij, A.M.G.; van Baarle, D.; Mol, P.G.M.; de Bock, G.H.; et al. Effectiveness of COVID-19 vaccines against SARS-CoV-2 infection and severe outcomes in adults: a systematic review and meta-analysis of European studies published up to 22 January 2024. Eur Respir Rev, 2025, 34, 240222. [Google Scholar] [CrossRef]
- Andrews, N.; Stowe, J.; Kirsebom, F.; Toffa, S.; Rickeard, T.; Gallagher, E.; Gower, C.; Kall, M.; Groves, N.; O'Connell., A.M. Covid-19 vaccine effectiveness against the Omicron (B.1.1.529) variant. N Engl J Med 2022, 386, 1532–1546. [Google Scholar] [CrossRef]
- López-Muñoz, I.; Torrella, A.; Pérez-Quílez, O.; Castillo-Zuza, A.; Martró, E.; Bordoy, A.E.; Saludes, V.; Blanco, I.; Soldevila, L.; Estrada, O.; et al. SARS-CoV-2 Secondary attack rates in vaccinated and unvaccinated household contacts during replacement of Delta with Omicron variant, Spain. Emerg Infect Dis, 2022, 28, 1999–2008. [Google Scholar] [CrossRef]
- Martínez-Baz, I.; Miqueleiz, A.; Egüés, N.; Casado, I.; Burgui, C.; Echeverría, A.; Navascués, A.; Fernández-Huerta, M.; García Cenoz, M.; Trobajo-Sanmartín, C.; et al. Effect of COVID-19 vaccination on the SARS-CoV-2 transmission among social and household close contacts: A cohort study. J Infect Public Health, 2023, 16, 410–417. [Google Scholar] [CrossRef]
- Ke, R.; Romero-Severson, E.; Sanche, S.; Hengartner, N. Estimating the reproductive number R0 of SARS-CoV-2 in the United States and eight European countries and implications for vaccination. J Theor Biol, 2021, 517, 110621. [Google Scholar] [CrossRef] [PubMed]
- Singanayagam, A.; Hakki, S.; Dunning, J.; Madon, K.J.; Crone, M.A.; Koycheva, A.; Derqui-Fernandez, N.; Barnett, J.L.; Whitfield, M.G.; Varro, R.; et al. Community transmission and viral load kinetics of the SARS-CoV-2 delta (B.1.617.2) variant in vaccinated and unvaccinated individuals in the UK: a prospective, longitudinal, cohort study. Lancet Infect Dis, 2022, 22, 183–195. [Google Scholar] [CrossRef] [PubMed]
- Jung, J.; Kim, J.Y.; Park, H.; Park, S.; Lim, J.S.; Lim, S.Y.; Bae, S.; Lim, Y.J.; Kim, E.O.; Kim, J.; et al. Transmission and infectious SARS-CoV-2 shedding kinetics in vaccinated and unvaccinated Individuals. JAMA Netw Open, 2022, 5, e2213606. [Google Scholar] [CrossRef] [PubMed]
- He, X.; Su, J.; Ma, Y.; Zhang, W.; Tang, S. A comprehensive analysis of the efficacy and effectiveness of COVID-19 vaccines. Front Immunol 2022, 13, 945930. [Google Scholar] [CrossRef] [PubMed]
- Shrestha, N.K.; Burke, P.C.; Nowacki, A.S.; Gordon, S. M Effectiveness of the 2023-2024 Formulation of the COVID-19 Messenger RNA Vaccine. Clin Infect Dis, 2024, 79, 405–411. [Google Scholar] [CrossRef] [PubMed]
- Monge, S.; Rojas-Benedicto, A.; Olmedo, C.; Mazagatos, C.; José Sierra, M.; Limia, A.; Martín-Merino, E.; Larrauri, A.; Hernán, M.A.; IBERCovid. Effectiveness of mRNA vaccine boosters against infection with the SARS-CoV-2 omicron (B.1.1.529) variant in Spain: a nationwide cohort study. Lancet Infect Dis, 2022, 22, 1313–1320. [Google Scholar] [CrossRef]
- Tsang, N.N.Y.; So, H.C.; Cowling, B.J.; Leung, G.M.; Ip, D.K.M. Effectiveness of BNT162b2 and CoronaVac COVID-19 vaccination against asymptomatic and symptomatic infection of SARS-CoV-2 omicron BA.2 in Hong Kong: a prospective cohort study. Lancet Infect Dis, 2023, 23, 421-434.
- Mimura, W.; Ishiguro, C.; Maeda, M.; Murata, F.; Fukuda, H. Effectiveness of messenger RNA vaccines against infection with SARS-CoV-2 during the periods of Delta and Omicron variant predominance in Japan: the Vaccine Effectiveness, Networking, and Universal Safety (VENUS) study. Int J Infect Dis, 2022, 125, 58–60. [Google Scholar] [CrossRef] [PubMed]
- Coleman, B.L.; Robertson, N.M.; Harrison, R.A.; Valiquette, L.; Langley, J.M.; Muller, M.P.; Cooper, C.L.; Nadarajah, J.; Powis, J.; Arnoldo, S.; et al. Risk factors for infection with SARS-CoV-2 in a cohort of Canadian healthcare workers: 2020-2023. Epidemiol Infect, 2025, 153, e72. [Google Scholar] [CrossRef]
- Arashiro, T.; Arima, Y.; Kuramochi, J.; Muraoka, H.; Sato, A.; Chubachi, K.; Oba, K.; Yanai, A.; Arioka, H.; Uehara, Y.; et al. Letter to the editor: Importance of considering high-risk behaviours in COVID-19 vaccine effectiveness estimates with observational studies. Euro Surveill, 2023, 28, 2300034. [Google Scholar] [CrossRef]
- Tsang, T.K.; Sullivan, S.G.; Huang, X.; Wang, C.; Peng, L.; Yang, B.; Cowling, B.J. Intensity of public health and social measures are associated with effectiveness of SARS-CoV-2 vaccine in test-negative study. medRxiv [Preprint]. 2025, 2025.05.08.25327221.
- Soriano López, J.; Gómez Gómez, J.H.; Ballesta-Ruiz, M.; Garcia-Pina, R.; Sánchez-Rodríguez, I.; Bonilla-Escobar, B.A.; Salmerón, D.; Rodríguez, B.S.; Chirlaque, M.D. COVID-19, social determinants of transmission in the home. A population-based study. Eur J Public Health, 2024, 34, 427-434.
- Novelli, S.; Opatowski, L.; Manto, C.; Rahib, D.; de Lamballerie, X.; Warszawski, J.; Meyer, L.; EpiCoV Study Group OBOT. Risk factors for community and intrahousehold transmission of SARS-CoV-2: Modeling in a nationwide French population-based cohort study, the EpiCoV Study. Am J Epidemiol, 2024, 193, 134-148.
- Judson, T.J.; Zhang, S.; Lindan, C.P.; Boothroyd, D.; Grumbach, K.; Bollyky, J.B.; Sample, H.A.; Huang, B.; Desai, M.; Gonzales, R.; et al. Association of protective behaviors with SARS-CoV-2 infection: results from a longitudinal cohort study of adults in the San Francisco Bay Area. Ann Epidemiol, 2023, 86, 1–7. [Google Scholar] [CrossRef]
- Beale, S.; Hoskins, S.; Byrne, T.; Fong, W.L.E.; Fragaszy, E.; Geismar, C.; Kovar, J.; Navaratnam, A.M.D.; Nguyen, V.; Patel, P.; et al. Differential Risk of SARS-CoV-2 Infection by Occupation: Evidence from the Virus Watch prospective cohort study in England and Wales. J Occup Med Toxicol 2023, 18, 5. [Google Scholar] [CrossRef]
- Leong, D.P.; Loeb, M.; Mony, P.K.; Rangarajan, S.; Mushtaha, M.; Miller, M.S.; Dias, M.; Yegorov, S.; Mamatha, V.; Telci Caklili, O.; et al. Risk factors for recognized and unrecognized SARS-CoV-2 infection: a seroepidemiologic analysis of the Prospective Urban Rural Epidemiology (PURE) study. Microbiol Spectr, 2024, 12, e0149223. [Google Scholar] [CrossRef]
- Baumkötter, R.; Yilmaz, S.; Zahn, D.; Fenzl, K.; Prochaska, J.H.; Rossmann, H.; Schmidtmann, I.; Schuster, A.K.; Beutel, M.E.; Lackner, K.J.; et al. Protective behavior and SARS-CoV-2 infection risk in the population - Results from the Gutenberg COVID-19 study. BMC Public Health, 2022, 22, 1993. [Google Scholar] [CrossRef]
- Sun, K.; Loria, V.; Aparicio, A.; Porras, C.; Vanegas, J.C.; Zúñiga, M.; Morera, M.; Avila, C.; Abdelnour, A.; Gail, M.H.; et al. Behavioral factors and SARS-CoV-2 transmission heterogeneity within a household cohort in Costa Rica. Commun Med (Lond) 2023, 3, 102. [Google Scholar] [CrossRef] [PubMed]
- Piernas, C.; Patone, M.; Astbury, N.M.; Gao, M.; Sheikh, A.; Khunti, K.; Shankar-Hari, M.; Dixon, S.; Coupland, C.; Aveyard, P.; et al. Associations of BMI with COVID-19 vaccine uptake, vaccine effectiveness, and risk of severe COVID-19 outcomes after vaccination in England: a population-based cohort study. Lancet Diabetes Endocrinol, 2022, 10, 571–580. [Google Scholar] [CrossRef] [PubMed]
- Yang, H.; Xie, Y.; Li, C. Understanding the mechanisms for COVID-19 vaccine's protection against infection and severe disease. Expert Rev Vaccines 2023, 22, 186–192. [Google Scholar] [CrossRef]
- Lewnard, J.A.; Patel, M.M.; Jewell, N.P.; Verani, J.R.; Kobayashi, M.; Tenforde, M.W.; Dean, N.E.; Cowling, B.J.; Lopman, B.A. Theoretical framework for retrospective studies of the effectiveness of SARS-CoV-2 vaccines. Epidemiology 2021, 32, 508–517. [Google Scholar] [CrossRef] [PubMed]
- Brookmeyer, R.; Morrison, D.E. Estimating vaccine effectiveness by linking population-based health registries: Some sources of bias. Am J Epidemiol 2022, 191, 1975–1980. [Google Scholar] [CrossRef]
- Agampodi, S.; Tadesse, B.T.; Sahastrabuddhe, S.; Excler, J.L.; Kim, J.H. Biases in COVID-19 vaccine effectiveness studies using cohort design. Front Med (Lausanne) 2024, 11, 1474045. [Google Scholar] [CrossRef]
- Angius, F.; Puxeddu, S.; Zaimi, S.; Canton, S.; Nematollahzadeh, S.; Pibiri, A.; Delogu, I.; Alvisi, G.; Moi, M.L.; Manzin, A. SARS-CoV-2 evolution: Implications for diagnosis, treatment, vaccine effectiveness and development. Vaccines (Basel) 2024, 13, 17. [Google Scholar] [CrossRef]
- Mambelli, F.; de Araujo, A.C.V.S.C.; Farias, J.P.; de Andrade, K.Q.; Ferreira, L.C.S.; Minoprio, P.; Leite, L.C.C.; Oliveira, S.C. An update on anti-COVID-19 vaccines and the challenges to protect against new SARS-CoV-2 variants. Pathogens. 2025, 14, 23. [Google Scholar] [CrossRef] [PubMed]
Figure 2.
Temporal distribution of COVID-19 cases by onset of symptoms.
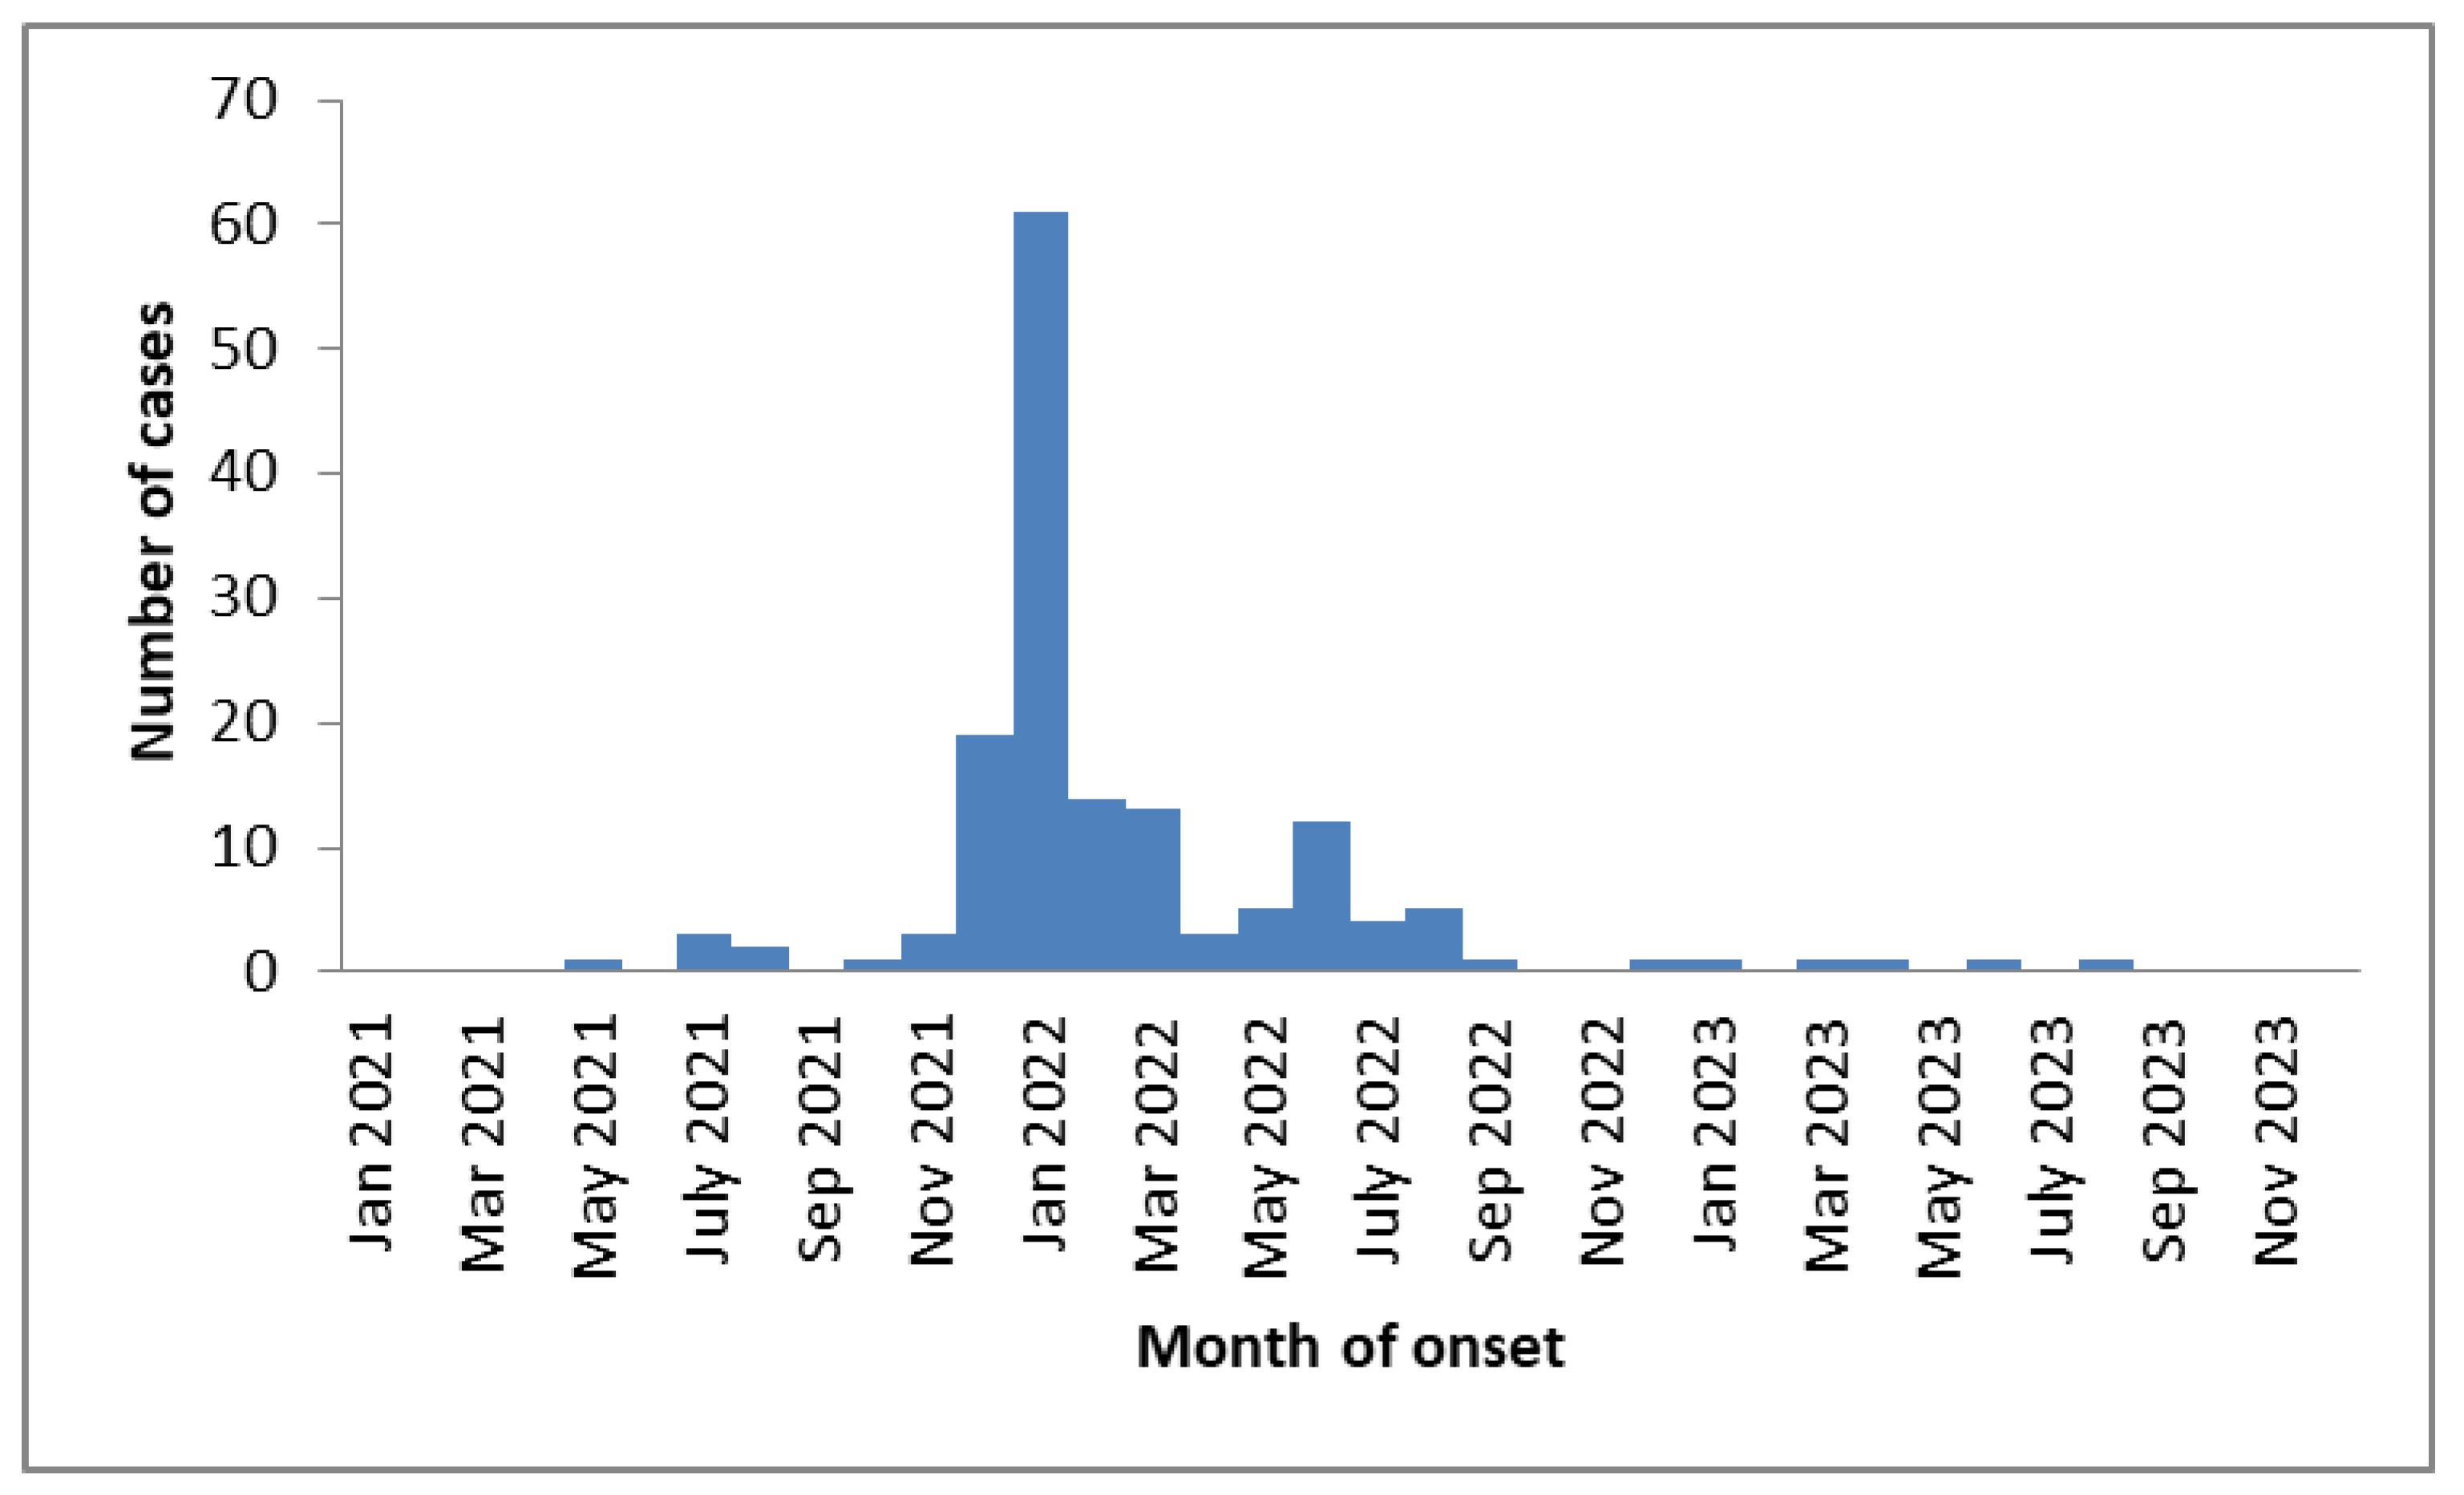
Table 1.
Characteristics and comparisons of SARS-CoV-2 cases and non-cases participants in the Borriana COVID-19 cohort. Crude relative risk (RR) and 95% Confidence interval (CI).
Table 1.
Characteristics and comparisons of SARS-CoV-2 cases and non-cases participants in the Borriana COVID-19 cohort. Crude relative risk (RR) and 95% Confidence interval (CI).
| Variables | Cases N=226 |
Non-cases N=75 |
Total | RR | 95 CI | p-value |
|---|---|---|---|---|---|---|
| Age (years)±SD1 | 37.8±17.3 | 44.8±17.6 | 0.99 | (0.98-0.99) | 0.004 | |
| Age≥50 years Yes | 57 (22.2) | 41 (54.7) | 98 | 0.70 | (0.59-0.84) | 0.000 |
| No | 169 (74.8) | 34 (45.3) | 204 | 1.00 | ||
| Male | 81 (35.7) | 37(49.3) | 118 | 0.87 | (0.75-0.99) | 0.049 |
| Female | 145 (64.3) | 38 (50.7) | 183 | 1.00 | ||
| Social class2 I-II | 50 (22.1) | 19(25.3) | 69 | 0.96 | (0.81-1.12) | 0.581 |
| Social class III-VI | 176 (77.9) | 56 (74.7) | 232 | 1.00 | ||
| Chronic disease Yes | 74(32.7) | 30 (40.0) | 104 | 0.92 | (0.80-1.07) | 0.271 |
| No | 152 (67.3) | 45 (60.0) | 197 | 1.00 | ||
| Obesity3,4 Yes | 30 (13.6) | 11 (14.9) | 41 | 0.97 | (0.80-1.19) | 0.798 |
| No | 190 (86.4) | 63 (85.1) | 253 | |||
| Current smoking5 | 60 (27.1) | 31(41.9) | 91 | 0.76 | (0.60-0.97) | 0.024 |
| Ex-smoking | 38 (17.2) | 13 (17.6) | 51 | 0.93 | (0.74-1.18) | 0.565 |
| Never smoking | 123 (55.0) | 30 (40.5) | 153 | 1.00 | ||
| Alcohol6 intake Yes | 40 (18.0) | 15 (21.7) | 55 | 0.96 | (0.81-1.15) | 0.677 |
| No | 182 (82.0) | 59 (78.3) | 241 | 1.00 | ||
| Physicalexercise7 Yes | 135 (60.0) | 34 (47.2) | 169 | 1.13 | (0.99-1.30) | 0.076 |
| 90 (40.0) | 38 (52.8) | 128 | 1.00 | |||
| Numbers of cohabitants at home8± SD1 | 3.3±1.0 | 2.9±1.1 | 1.08 | (1.02-1.16) | 0.011 | |
| Family COVID-19 case9 Yes | 196 (89.5) | 57 (40.5) | 253 | 1.25 | (0.96-1.62) | 0.098 |
| No | 23 (10.5) | 14 (59.5) | 37 | 1.00 | ||
| Exposure to the public at work 10 Yes | 167 (77.7) | 45 (64.3) | 212 | 1.20 | (1.00-1.43) | 0.049 |
| No | 48 (22.3) | 25 (35.7) | 73 | 1.00 | ||
| Visiting restaurants /bars11 Yes | 158 (72.5) | 42 (60.9) | 200 | 1.15 | (0.98-1.34) | 0.093 |
| No | 60 (27.5) | 27 (39.1) | 87 | 1.00 | ||
| Face mask wearing12 Yes | 69 (32.1) | 28 (40.6) | 97 | 0.91 | (0.79-1.06) | 0.218 |
| No | 146 (67.9) | 41 (59.4) | 187 | 1.00 |
1SD=Standard Deviation.2Social class I-II (upper and middle class) Social III-VI (lower class).3 Obesity =Body Mass Index≥30.4 Missing information 7 participants.5 Missing information 6 participants.6 Missing information 5 participants. 7 Missing information 4 participants. 8 Missing information 6 participants. 9 Missing information 11 participants. 10 Missing information 16 participants.11 Missing information 14 participants.12 Missing information 17 participants. .
Table 2.
Distributions and comparisons of SARS-CoV-2 vaccines between SARS-CoV-2 cases and non- cases. Robust Poisson regression. Crude relative risk (RR) and 95% confidence interval (CI).
Table 2.
Distributions and comparisons of SARS-CoV-2 vaccines between SARS-CoV-2 cases and non- cases. Robust Poisson regression. Crude relative risk (RR) and 95% confidence interval (CI).
| Variables |
Cases
N=226 |
No cases
N=75 |
Total | RR | 95% CI | p-value |
| N (%) | N (%) | N | ||||
| Vaccinated with at least one dose Yes | 210 (92.9) | 75 (100) | 285 | 0.74 | (0.69-0.79) | 0.000 |
| No | 16 (7.1) | 0 (0) | 16 | 1.00 | ||
| Completed vaccination | ||||||
| Vaccinated with 2-3 doses | 200 (88.5) | 75 (100) | 275 | 0.72 | (0.68-0.78) | 0.000 |
| Vaccinated with 0-1 doses | 26 (11.5) | 0 (0) | 26 | 1.00 | ||
| Booster vaccination | ||||||
| Vaccinated with 3 doses | 102 (45.1) | 63 (84.0) | 165 | 0.68 | (0.59-0.77) | 0.000 |
| Vaccinated with 0-2 doses | 124 (55.9) | 12 (16.0) | 136 | 1.00 | ||
| Number of vaccines doses received | ||||||
| 0-1 doses | 26 (11.5) | 0 (0) | 26 | 1.00 | ||
| 2 doses | 98 (43.4) | 12 (16.0) | 110 | 0.89 | (0.83-0.95) | 0.001 |
| 3 doses | 102 (45.1) | 63 (84.0) | 165 | 0.62 | (0.55-0.70) | 0.000 |
| Type of vaccine | ||||||
| mRNA1 alone | 172 (82.0) | 56 (74.7) | 228 | 1.13 | (0.93-1.38) | 0.222 |
| mRNA1 and other vaccines | 38 (18.0) | 19 (25.3) | 57 | 1.00 |
1 SRARS-CoV-2 messenger RNA vaccine.
Table 3.
Adjusted relative risk (RR) of SARS-CoV-2 and effectiveness of SARS-CoV-2 vacc ines. Robust Poisson regression, 95% Confidence interval (CI).
Table 3.
Adjusted relative risk (RR) of SARS-CoV-2 and effectiveness of SARS-CoV-2 vacc ines. Robust Poisson regression, 95% Confidence interval (CI).
| Variables | Adjusted RR 95% CI | Effectiveness 95% CI | p-value |
| Vaccinated with a least one dose | 0.78(0.63-0.96) | 22% (4-37) | 0.020 |
| Non-vaccinated | 1.00 | ||
| Completed vaccinated | |||
| Vaccinated with 2-3 doses | 0.82(0.70-0.95) | 18% (5-30) | 0.011 |
| Vaccinated with 0-1 doses | 1.00 | ||
| Booster vaccination | |||
| Vaccinated with 3 doses | 0.71 (0.61-0.82) | 29% (18-39) | 0.000 |
| Vaccinated with 0-1-2 doses | 1.00 | ||
| Number of vaccines doses received | |||
| 3 doses | 0.63 (0.51-0.78) | 37% (22-49) | 0.000 |
| 2 doses | 0.89 (0.76-1.03) | 11% (-3 - 24) | 0.149 |
| 0-1 doses | 1.00 |
Adjusted for age, sex, chronic disease, obesity, smoking, alcohol consumption, physical exercise, social class, cohabitants, exposed to the public at work, face masks wearing, visiting restaurants/bars, and COVID-19 family case.
Table 4.
Crude and adjusted relative risk (RR), and effectiveness of SARS-CoV-2 vaccines, stratification for sex, chronic disease, and age. Comparisons vaccinated 3 doses versus 0-1-2 doses. Robust Poisson regression. 95% Confidence interval (CI).
Table 4.
Crude and adjusted relative risk (RR), and effectiveness of SARS-CoV-2 vaccines, stratification for sex, chronic disease, and age. Comparisons vaccinated 3 doses versus 0-1-2 doses. Robust Poisson regression. 95% Confidence interval (CI).
| Variables | Crude RR 95%CI | Adjusted RR 95% CI | Effectiveness 95% CI | p-value |
| Female | 0.72 (0.62-0.84) | 0.74(0.63-0.87) | 26% (13-37) | 0.000 |
| Male | 0.60 (0.48-0.78) | 0.62(0.46-0.83) | 38% (17-54) | 0.001 |
| Chronic disease Yes | 0.70(0.56-0.87) | 0.60(0.44-0.81) | 40% (19-56) | 0.006 |
| No | 0.67(0.56-0.79) | 0.74(0.62-0.89) | 26% (11-38) | 0.001 |
| Age 50 years and over | 0.60(0.45-0.80) | 0.51(0.36-0.75) | 49% (25-64) | 0.000 |
| Age under 50 years | 0.77(0.67-0.89) | 0.77(0.67-0.88) | 23% (12-33) | 0.000 |
Adjusted for age, sex, chronic disease, obesity, smoking, alcohol consumption, physical exercise, social class, cohabitants, exposure to the public at work, face masks wearing, visiting restaurants/bars, and COVID-19 family case. .
Table 5.
Characteristics and comparisons of SARS-CoV-2 cases and non-cases participants including symptomatic cases in the Borriana COVID-19 cohort. Relative risk (RR) and 95% Confidence interval (CI).
Table 5.
Characteristics and comparisons of SARS-CoV-2 cases and non-cases participants including symptomatic cases in the Borriana COVID-19 cohort. Relative risk (RR) and 95% Confidence interval (CI).
| Variables |
Cases
N=153 |
Non-cases
N=75 |
Total | RR | 95 CI | p-value |
| N (%) | N(%) | |||||
| Age (years) ± SD1 | 37.1 ± 16.8 | 44.8 ± 17.6 | 0.99 | (0.98-0.99) | 0.002 | |
| Age ≥ 50 years Yes | 36 (23.5) | 41 (54.7) | 77 | 0.60 | (0.47-0.78) | 0.000 |
| No | 117 (76.5) | 34 (45.3) | 151 | 1.00 | ||
| Male | 51 (33.3) | 37(49.3) | 88 | 0.80 | (0.65-0.98) | 0.029 |
| Female | 102 (66.7) | 38 (50.7) | 140 | 1.00 | ||
| Social class2 I-II | 36 (23.5) | 19(25.3) | 55 | 0.97 | (0.78-1.20) | 0.769 |
| Social class III-VI | 117 (76.5) | 56 (74.7) | 173 | 1.00 | ||
| Chronic disease Yes | 50(32.7) | 30 (40.0) | 80 | 0.90 | (0.73-1.10) | 0.294 |
| No | 103 (67.3) | 45 (60.0) | 148 | 1.00 | ||
| Obesity3,4 Yes | 20 (13.5) | 11 (14.9) | 31 | 0.96 | (0.73-1.27) | 0.790 |
| No | 128 (86.5) | 63 (85.1) | 191 | |||
| Current smoking 5 | 39 (26.4) | 31(41.9) | 70 | 0.76 | (0.60-0.97) | 0.024 |
| Ex-smoking | 27 (18.2) | 13 (17.6) | 40 | 0.92 | (0.72-1.18) | 0.512 |
| Never smoking | 82 (55.4) | 30 (40.5) | 112 | 1.00 | ||
| Alcohol intake 6 Yes | 27 (18.1) | 15 (21.7) | 42 | 0.95 | (0.74-1.22) | 0.708 |
| No | 122 (81.9) | 59 (78.3) | 181 | 1.00 | ||
| Physical exercise7 Yes | 88 (57.9) | 34 (47.2) | 122 | 1.15 | (0.95-1.38) | 0.142 |
| No | 64 (42.1) | 38 (52.8) | 102 | 1.00 | ||
| Numbers of cohabitants at home8 ± SD1 | 3.3 ± 1.0 | 2.9 ± 1.1 | 1.14 | (1.04-1.25) | 0.007 | |
| Family COVID-19 case9 Yes | 137 (90.7) | 57 (40.5) | 194 | 1.41 | (0.96-2.07) | 0.077 |
| No | 14 (9.3) | 14 (59.5) | 28 | 1.00 | ||
| Exposure to the public at work 10 Yes | 117 (79.1) | 45 (64.3) | 162 | 1.30 | (1.01-1.68) | 0.041 |
| No | 31 (20.9) | 25 (35.7) | 56 | 1.00 | ||
| Visiting restaurants /bars11 Yes | 111 (74.5) | 42 (60.9) | 153 | 1.24 | (0.99-1.56) | 0.063 |
| No | 38 (25.5) | 27 (39.1) | 65 | 1.00 | ||
| Face mask wearing 12 Yes | 42 (28.6) | 28 (40.6) | 70 | 0.83 | (0.67-1.04) | 0.102 |
| No | 105 (71.4) | 41 (59.4) | 146 | 1.00 |
1SD=Standard Deviation.2Social class I-II ( upper and middle class ) Social III-VI ( lower class ).3 Obesity =Body Mass Index≥30.4 Missing information 6 participants.5 Missing information 6 participants.6 Missing information 5 participants. 7 Missing information 4 participants. 8 Missing information 6 participants. 9 Missing information 6 participants. 10 Missing information 10 participants.11 Missing information 10 participants.12 Missing information 12 participants. .
Table 6.
Distributions and comparisons of SARS-CoV-2 vaccines between SARS-CoV-2 cases and non-cases with symptomatic SARS-CoV-2 participants. Robust Poisson regression. Crude relative risk (RR) and 95% confidence interval (CI).
Table 6.
Distributions and comparisons of SARS-CoV-2 vaccines between SARS-CoV-2 cases and non-cases with symptomatic SARS-CoV-2 participants. Robust Poisson regression. Crude relative risk (RR) and 95% confidence interval (CI).
| Variables |
Cases
N=153 |
No cases
N=75 |
Total | RR | 95% CI | p-value |
| N (%) | N(%) | N | ||||
| Vaccinated with at least one dose Yes | 144 (94.1) | 75 (100) | 119 | 0.66 | (0.60-0.72) | 0.011 |
| No | 9 (5.9) | 0 (0) | 9 | 1.00 | ||
| Completed vaccination | ||||||
| Vaccinated with 2-3 doses | 135 (88.2) | 75 (100) | 210 | 0.64 | (0.58-0.71) | 0.000 |
| Vaccinated with 0-1 doses | 18 (11.8) | 0 (0) | 18 | 1.00 | ||
| Booster vaccination | ||||||
| Vaccinated with 3 doses | 54 (35.3) | 63 (84.0) | 117 | 0.51 | (0.42-0.64) | 0.000 |
| Vaccinated with 0-1-2 doses | 99 (64.7) | 12 (16.0) | 111 | 1.00 | ||
| Number of vaccines doses received | ||||||
| 0-1 doses | 18 (11.8) | 0 (0) | 18 | 1.00 | ||
| 2 dose s | 81 (52.9) | 12 (16.0) | 93 | 0.87 | (0.81-0.94) | 0.001 |
| 3 doses | 54 (35.3) | 63 (84.0) | 117 | 0.46 | (0.38-0.56) | 0.000 |
| Type of vaccine | ||||||
| mRNA1 alone | 119 (82.8) | 56 (74.7) | 175 | 1.20 | (0.91-1.58) | 0.205 |
| mRNA1 and other vaccines | 25 (20.8) | 19 (25.3) | 44 | 1.00 |
1 SRARS-CoV-2 messenger RNA vaccine.
Table 7.
Adjusted relative risk (RR), and effectiveness of SARS-CoV-2 vaccines. Comparisons vaccinations and doses. Robust Poisson regression. 95% Confidence interval (CI).
Table 7.
Adjusted relative risk (RR), and effectiveness of SARS-CoV-2 vaccines. Comparisons vaccinations and doses. Robust Poisson regression. 95% Confidence interval (CI).
| Variable | Adjusted RR 95% CI | Effectiveness 95% CI | p-value |
| Vaccinated with at least one dose | 0.81(0.53-1.22) | 19% (-22 - 47) | 0.308 |
| Non-vaccinated | 1.00 | ||
| Completed vaccinated | |||
| Vaccinated with 2-3 doses | 0.82(0.67-1.01) | 18%(-1- 33 ) | 0.066 |
| Vaccinated with 0-1 doses | 1.00 | ||
| Booster vaccination | |||
| Vaccinated with 3 doses | 0.54 (0.44-0.68) | 46% (32-56) | 0.000 |
| Vaccinated with 0-1-2 doses | 1.00 | ||
| Number of vaccines doses received | |||
| 3 doses | 0.50 (0.37-0.67) | 50% (33-63) | 0.000 |
| 2 doses | 0.92 (0.75-1.12) | 8% (-12 - 25) | 0.376 |
| 0-1 doses | 1.00 |
Adjusted for age, sex, chronic disease, obesity, smoking, alcohol consumption, physical exercise, social class, cohabitants, exposure to the public at work, face mask wearing, visiting restaurants/bars, and COVID-19 family case. .
Table 9.
Comparisons between first approach (all SARS-COV-2 cases) and second approach (symptomatic SARS-CoV-2 cases). Adjusted relative risk (aRR), stratification and effectiveness 95% Confidence interval (CI).
Table 9.
Comparisons between first approach (all SARS-COV-2 cases) and second approach (symptomatic SARS-CoV-2 cases). Adjusted relative risk (aRR), stratification and effectiveness 95% Confidence interval (CI).
| Measures | First approach | Second approach |
| All SARS-CoV-2 cases | Symptomatic SARS-CoV-2 cases | |
| Variables | aRR (95% CI) | aRR (95% CI) |
| Vaccinated with at least one dose | 0.78(0.63-0.96) | 0.81(0.53-1.22) |
| Vaccinated with 2-3 doses | 0.82(0.70-0.95) | 0.82(0.67-1.01) |
| Vaccinated with 3 doses | 0.71 (0.61-0.82) | 0.54 (0.44-0.68) |
| Number of vaccine doses | ||
| 3 doses | 0.63 (0.51-0.78) | 0.50 (0.37-0.67) |
| 2 doses | 0.89 (0.76-1.03) | 0.92 (0.75-1.12) |
| Effectiveness | aRR (95% CI) | aRR (95% CI) |
| Vaccinated with at least one dose | 22% (4-37) | 19% (-22 - 47) |
| Vaccinated with 2-3 doses | 18% (5-30) | 18% (-1 -33) |
| Vaccinated with 3 doses | 29% (18-39) | 46% (32-56) |
| Number of vaccines received | ||
| 3 doses | 37% (22-49) | 50% (33-63) |
| 2 doses | 11% (-3- 24) | 8% (-12 - 25) |
| Stratification | aRR (95% CI) | aRR (95% CI) |
| Female | 0.74(0.63-0.87) | 0.62(0.49-0.78) |
| Male | 0.62(0.46-0.83) | 0.38(0.23-0.63) |
| Chronic disease Yes | 0.60(0.44-0.81) | 0.48(0.32-0.72) |
| No | 0.74(0.62-0.89) | 0.55(0.42-0.74) |
| Age 50 years and above | 0.51(0.36-0.75) | 0.41(0.26-0.66) |
| Age low 50 years | 0.77(0.67-0.88) | 0.61(0.47-0.77) |
| Effectiveness | ||
| Female | 26% (13-37) | 39% (22-51) |
| Male | 38% (13-54) | 62% (37-77) |
| Chronic disease Yes | 40% (19-56) | 52% (27-68) |
| No | 26% (11-38) | 45% (27-59) |
| Age 50 years and over | 49% (25-64) | 60% (36-76) |
| Age under 50 years | 23% (12-33) | 39% (23-53) |
Disclaimer/Publisher’s Note: The statements, opinions and data contained in all publications are solely those of the individual author(s) and contributor(s) and not of MDPI and/or the editor(s). MDPI and/or the editor(s) disclaim responsibility for any injury to people or property resulting from any ideas, methods, instructions or products referred to in the content. |
© 2025 by the authors. Licensee MDPI, Basel, Switzerland. This article is an open access article distributed under the terms and conditions of the Creative Commons Attribution (CC BY) license (http://creativecommons.org/licenses/by/4.0/).
Copyright: This open access article is published under a Creative Commons CC BY 4.0 license, which permit the free download, distribution, and reuse, provided that the author and preprint are cited in any reuse.


