Submitted:
01 November 2025
Posted:
03 November 2025
You are already at the latest version
Preprints on COVID-19 and SARS-CoV-2
Abstract
Background/PurposeCOVID-19 mRNA vaccines have been reported to prevent severe disease in high-risk populations. In Japan, booster doses of up to the seventh dose are publicly funded; however, the safety and benefits of frequent vaccinations in younger adults remain unclear. This study analyzed all-cause mortality by age group and number of vaccine doses, focusing on associations between frequent boosters (≥5 doses) and mortality.MethodsThe resident registry and vaccination records from Hamamatsu City (2021–2024) and Matsudo City (2021–2025) were linked to analyze all-cause mortality by age and number of vaccine doses. Three age groups were examined: 20–49, 50–64, and 65–89 years. Mortality rates were calculated using person-years, and each death was attributed to the most recent vaccine dose received.ResultsOlder adults (65–89 years) receiving ≥5 doses had lower all-cause mortality, although this may partly reflect healthy vaccinee bias, as healthier individuals were more likely to continue vaccination. In contrast, younger adults (20–49 years) showed a marked increase in mortality with ≥5 doses, and those aged 50–64 exhibited elevated mortality with six doses. These patterns suggest that selective vaccination of high-risk individuals does not fully account for the observed trends. While frequent vaccination was associated with reduced mortality in older adults but increased mortality in younger adults.ConclusionsObservational data indicated age- and dose-dependent differences in all-cause mortality after COVID-19 vaccination. Although additional doses may reduce mortality in older adults, frequent boosters in younger adults may pose potential risks. The causality cannot be established, and the underlying mechanisms remain unclear. These findings emphasize the need for careful risk–benefit assessments in younger populations and underscore the importance of nationwide confounder-adjusted analyses to inform optimized booster strategies, including vaccine type, dosing intervals, and immunological factors.
Keywords:
COVID-19 mRNA vaccine
; booster doses
; all-cause mortality
; age-dependent effects
; risk–benefit assessment
Introduction
Over four years have passed since COVID-19 mRNA vaccines were widely introduced in Japan, with their effectiveness and safety evaluated from various perspectives. Large-scale clinical trials have purportedly confirmed that these vaccines are highly effective in preventing severe disease and carry a low risk of serious adverse reactions. Initially, these were expected to serve as key tools for control [1].
Evidence from overseas studies has shown that a fourth booster dose reduced severe disease and hospitalization among high-risk groups such as older adults and immunocompromised individuals [2]. Consequently, additional booster vaccinations are recommended at intervals of six months to one year. However, reports in Japan and abroad have described the risks of adverse events, including thrombosis, autoimmune disorders, and myocarditis [3].
In Japan, despite the relatively low number of COVID-19 cases and deaths in early 2020 compared with Western countries, the government pursued a nationwide vaccination campaign to achieve herd immunity. This has resulted in one of the highest per-capita vaccination rates worldwide [4]. Booster doses were publicly funded for all residents, with recommendations extended to the seventh dose during the 2023–2024 winter season.
Nevertheless, since the emergence of the Omicron variant, both cases and deaths have increased in Japan. Reports indicate a sharp increase in excess mortality in 2022 and 2023, with approximately 100,000 excess deaths continuing into 2024. The explanations include population aging, healthcare strain, pandemic-related psychological stress, suicide among young to middle-aged individuals due to economic hardship, and reduced healthcare use among older adults. However, because excess mortality increased notably after vaccinations started in 2021, some commentators have argued that vaccination itself may have contributed, although causality remains unproven [5,6].
In June 2025, Shigeru Omi, who led Japan’s COVID-19 policy and strongly promoted vaccination, publicly stated that vaccines prevent severe disease but offer limited protection against infection and that the benefits for younger individuals were minimal. He noted that from the early stages of the vaccination campaign, it was recognized that younger individuals were unlikely to develop severe disease even if infected. In addition, younger individuals tend to experience relatively stronger adverse reactions to vaccines; therefore, the decision to vaccinate should be left to individual choice [7]. However, evidence shows that, until autumn 2022, he advised the Prime Minister to recommend additional doses even for younger populations [8]. This statement sparked public debate. Supporting this perspective, the Vaccine Effectiveness Real-time Surveillance for SARS-CoV-2 (VERSUS) study by Nagasaki University found that additional doses greatly reduced severe illness but did not clearly prevent symptomatic infections [9]. However, because the participants were limited to those seeking care, the study may be affected by care-seeking bias: vaccinated individuals are more likely to seek care for mild symptoms, whereas unvaccinated individuals may delay care until the illness is severe [10,11]. Such differences can distort comparisons, so test-negative designs like VERSUS should be interpreted with caution [12].
Currently, the benefits of the COVID-19 vaccination for younger adults are limited. Questions remain regarding the value of frequent boosters in this group, considering waning effectiveness, cost-effectiveness, and the risk of adverse events [13]. In Japan, annual boosters of more than four doses are recommended for older adults and individuals with comorbidities; however, younger adults and healthcare workers also receive boosters upon request. As younger adults are at a low risk of severe outcomes, evaluating potential risks, including adverse events and mortality linked to frequent boosters, is especially important.
Despite widespread vaccination, no domestic study has assessed the safety and mortality impacts of receiving frequent additional doses, stratified by age and the number of vaccinations. To address this gap, we obtained resident registries and vaccination records from Hamamatsu City and Matsudo City in Japan through public information requests and linked these datasets. We analyzed three age groups—20–49, 50–64, and 65–89 years—focusing on the impact of frequent vaccination (≥5 doses) on all-cause mortality. This study aimed to clarify the association between the number of vaccine doses and the mortality risk across age groups.
Methods
This study analyzed resident data from Hamamatsu City in Shizuoka Prefecture (population of approximately 780,000) and Matsudo City in Chiba Prefecture (population of approximately 500,000). The datasets were obtained through public information requests submitted by NHK Fukuoka Broadcasting Station’s “The Life” program. The data was provided to two authors on May 12, 2025, and then made available to the public on August 29. To minimize the administrative burden, Hamamatsu provided data in the same format as in previous disclosures, and Matsudo supplied data in a comparable format. Both datasets link Basic Resident Register information (including birth, death, and relocation) with COVID-19 vaccination records (including date, manufacturer, lot number, and number of doses). No information that that could identify individuals was included, as the data used in this study had been anonymized by the cities of Hamamatsu and Matsudo, and no linkage tables were created.
The Hamamatsu dataset covers the period between February 1, 2021, and June 30, 2024, and includes the following variables: age group (in 5-year intervals as of June 30, 2024), sex, vaccination history (dates, manufacturers, lot numbers), date of death, age at death (in 5-year intervals), date of becoming a resident, and date of leaving residency (due to death, relocation, etc.). If a resident moved in and out multiple times, only their first residency period was analyzed.
The Matsudo dataset includes residents as of February 1, 2021, with follow-up through March 31, 2025, and contains the following variables: year of birth (in 5-year intervals), sex, date of relocation (if applicable), date of death (if applicable), and vaccination information (dates, manufacturers, and lot numbers). To align with Hamamatsu’s classification, Matsudo residents born between years N and N+4 were classified as aged (2021–N) through (2025–N), resulting in an approximately 1.5-year discrepancy compared to Hamamatsu’s definition.
Death was attributed to the most recent administered vaccination dose. For example, a death after the fourth dose was assigned to the “four-dose” group. The populations were stratified by the number of doses at observation, and mortality rates were calculated using the person-years method. Patients with optional or temporary vaccinations were excluded from the study. The main observation period spanned from February 1, 2021, to March 31, 2024. The analyses covered: Vaccination dose distribution by age group; Mortality rates (per 100,000 person-years) by age and dose (10-year intervals), aggregated into 20–49, 50–64, and 65–89 age brackets; Death counts by days since the last vaccination (in 10-day intervals), and monthly mortality rates by dose for each age group (to June 30, 2024); Half-yearly death counts (July 2021 to June 2024) categorized by vaccination status (unvaccinated, 1–4 doses, 5–7 doses).
All analyses were performed using R (v4.5.1) with the IncidencePrevalence (v1.2.1), popEpi (v0.4.13), readxl (v1.4.5), and tidyverse (v2.0.0) packages. Half-yearly aggregations were also performed in Python (v3.12), and the results were summarized in Microsoft Excel.
Results
Figure 1 shows the vaccination dose distribution by age, and Figure 2 shows the mortality rates by age and dose. Among individuals aged ≥60 years, mortality decreased with increasing doses. In the 20–49-year age group, mortality declined slightly with up to four doses but increased sharply among those who received five or more doses, although the standard deviation was wide in the younger age groups.
Aggregated analyses (20–49, 50–64, and 65–89 years; Figure 3) confirmed these trends. Poisson’s test results are presented in Supplementary Table S1. Among those aged 20–49, receiving ≥5 doses was associated with increased mortality, whereas in the 65–89 age group, it was associated with reduced mortality. In the 50–64 age group, receiving six doses was associated with increased mortality compared to receiving 1–4 doses.
Figure 4 illustrates the interval between vaccination and death. In the 65–89 age group, deaths immediately after vaccination were rare, and mortality increased gradually before declining. For recipients of the six- and seven-dose vaccines, deaths immediately after vaccination were particularly low compared to the later peaks.
Figure 5 illustrates all-cause mortality rates among individuals aged 65–89 years, while Supplementary Figure S1 presents the rates for the 20–49 and 50–64 age groups. At each new vaccination round, mortality was low among newly vaccinated individuals but rose sharply among those who had received one fewer dose. No new rounds were initiated after the seventh dose, and no prior patterns were observed.
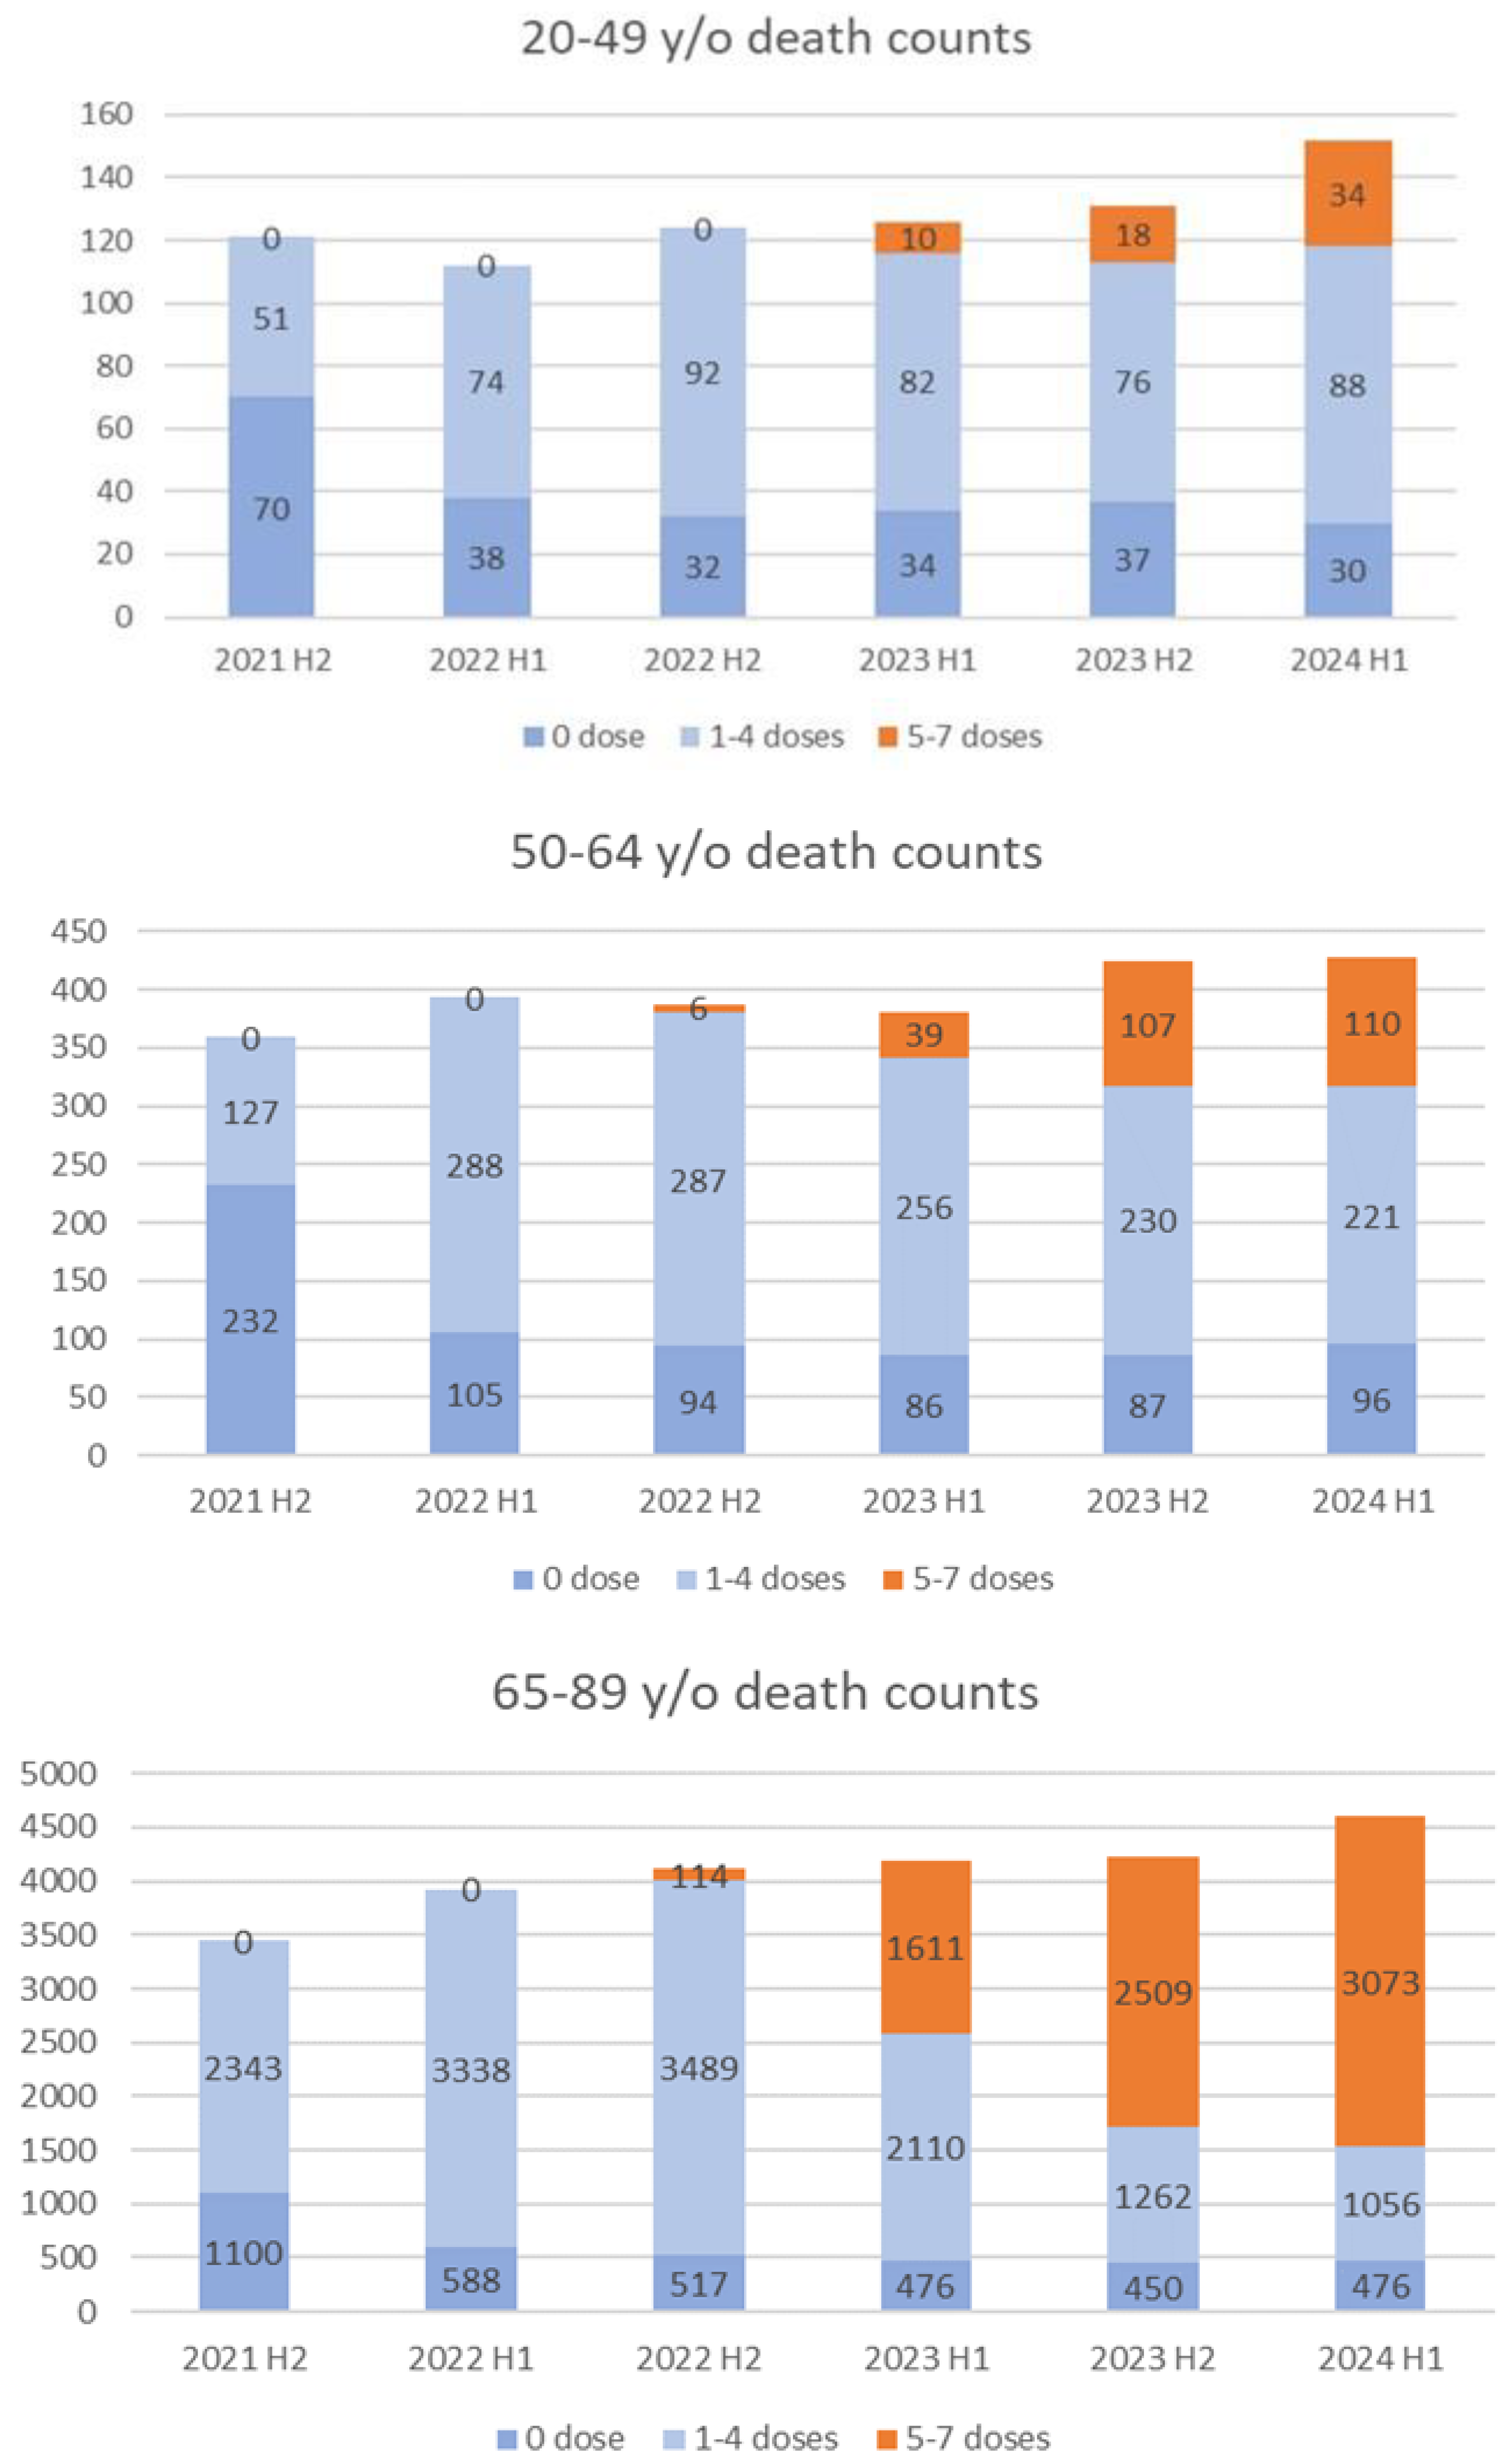
Figure 6 presents the half-yearly death counts (July 2021–June 2024). In the 50–64 group, mortality declined in those with 1–4-doses following the fifth dose, while mortality increased among those with ≥5-doses, particularly in late 2023. Similar trends were observed in the 65–89 group, with deaths among the ≥5-dose group rising in early 2024. Conversely, in the 20–49 group, mortality in the 1–4-dose group remained steady, while deaths in the ≥5-dose group surged sharply, contributing to overall increases.
Discussion
Potential Overestimation of Vaccine Effectiveness in Older Adults
Observational studies of COVID-19 vaccine effectiveness must account for multiple sources of bias [14,15]. The high-risk-for-death effect, healthy vaccinee effect, and healthy user bias may lower mortality in the vaccinated group by preferentially including healthier individuals, thereby leading to an overestimation of vaccine effectiveness [16].
Conversely, confounding by indication arises because vaccination is recommended for older adults and those with comorbidities who inherently have higher mortality risks, which may lead to an underestimation of vaccine effectiveness. Differential depletion of susceptibility bias can also occur, whereby high-risk individuals in the unvaccinated group die early, leaving behind healthier survivors. Over time, this can reduce the differences between groups and may even produce adverse vaccine effects. In the specific case of COVID-19, frailty is a major determinant of severe outcomes. Frailty bias is also expected to underestimate vaccine effectiveness, because frail individuals are often prioritized for vaccination.
Hamamatsu City, which accounted for half the data used in this analysis, provided publicly available demographic information. The historical mortality rate for individuals aged 65–89 years in Hamamatsu City in 2019, prior to the COVID-19 pandemic, was 2,456.2 per 100,000 [16,17], which is generally consistent with the mortality rate observed in the unvaccinated group during the early 2021 period, as shown in Figure 5. Substantial differences in all-cause mortality were observed between the unvaccinated and the two-dose groups in early 2021 (Figure 5). However, in that year, the number of deaths due to COVD-19 was only 52 (0.6% of the total 8,823 deaths) in Hamamatsu City [18], making it unlikely to explain this difference. As shown in Figure 5, a sharp increase in the mortality rate was repeatedly observed in the N-1 dose group after the initiation of the Nth vaccination round in individuals aged 65-89 years. Additionally, fewer deaths immediately following the sixth and seventh doses were observed (Figure 4), suggesting that individuals at higher risk of imminent death due to poor health or prior adverse reactions were less likely to continue vaccination. Consequently, relatively healthy individuals remained in the group that received frequent vaccinations. These results strongly suggest the presence of a healthy vaccinee bias, indicating that the observed reduction in mortality may not be solely due to biological protection, but also influenced by the tendency of healthier individuals to continue vaccination. More accurate estimates would require adjustment for baseline health status and comorbidities using multivariate regression or propensity score methods. Furthermore, attributing deaths to the last dose group complicates comparisons between dose groups. Overall, these factors underscore the need for caution in interpreting dose–mortality associations, and causality cannot be established from these observational data.
This observation aligns with findings from a cohort study in Qatar, which demonstrated a pronounced healthy vaccinee effect during the first six months following COVID-19 vaccination, particularly among older and clinically vulnerable populations [19]. These results underscore the importance of accounting for baseline health differences when interpreting mortality outcomes in the vaccinated groups.
Increased Mortality with Frequent Vaccination in Younger Adults
The healthy vaccinee bias described above was also observed among younger adults, but it appeared to be limited to the early stages of the vaccination program, with its impact diminishing in younger age groups: up to three doses for the 20-49 age group and up to four doses for the 50-64 age group (Supplementary Figure 1). This could be partly attributed to the lower proportion of individuals in the younger age groups who had received at least one dose, as well as the marked decline in the proportion of individuals receiving four or more doses in the 20–49 age group and five or more doses in the 50–64 age group.
A notable feature in the study population, particularly among individuals aged 20-49, was the elevated mortality rate among those who received five or more doses, with a similar trend observed in the 50– 64 age group, especially with six doses (Figure 3). Given Hamamatsu City's historical mortality rates in 2019—67.0 per 100,000 population for those aged 29–49 and 320.0 for those aged 50–64 [17,18], the elevated mortality observed in this study warrants further investigation. One possible explanation is indication bias—the selective vaccination of high-risk individuals—which could concentrate mortality among those receiving frequent doses. In fact, under Japan’s vaccination policy, the fourth dose or higher is recommended only for younger to middle-aged adults with comorbidities and healthcare workers. Within the 20–49 year age group, the ratio of those who received five or more doses was significantly lower than that in the older age groups. Therefore, it is highly likely that the relatively high proportion of high-risk individuals among those vaccinated was reflected in the increased mortality rate observed in the group receiving frequent vaccinations. This may also explain the increasing trend observed in the 50–64 age group within the 5–6 dose group shown in Figure 3. In this age group, however, while the proportion of deaths in the 5–7 dose group gradually increased during the study period, no significant change was observed in the total number of deaths (Figure 6). In contrast, the total number of deaths in the 20–49 age group appears to have increased due to the rise in deaths within the 5–7 dose group (Figure 6). This suggests that selective vaccination of high-risk individuals alone cannot fully account for the rising mortality rates among those who received five to seven doses.
Although frequent vaccinations may plausibly contribute to higher mortality in younger adults, the observational nature of this study precludes a causal inference. Supporting evidence includes reports linking fifth dose coverage to increased infection rates, and sixth dose uptake to excess mortality and a decline in male life expectancy [20]. Additionally, potential mechanisms have been proposed, including elevated IgG4 levels [21,22] and an increased risk of autoimmune disease [23].
Furthermore, a large-scale cohort study in South Korea suggested that mRNA vaccines were associated with an increased risk of thyroid, colorectal, lung, and breast cancers [24]. These observations represent main hypotheses that require further investigation.
In a September 2024 interview, Dr. Shigeru Omi noted that Japan currently lacks a system for obtaining detailed data on vaccine-related adverse events and deaths [3]. There is a pressing need to establish large-scale studies in Japan, similar to those conducted in South Korea [24], to comprehensively evaluate the health effects of the COVID-19 vaccination. While retrospective studies may face limitations in proving causality, conducting well-designed, large-scale research would provide critical evidence on the true benefits and risks of COVID-19 vaccines, which would be highly valuable not only to the general public but also to healthcare professionals, medical and life science researchers, and the pharmaceutical industry.
Safety Signals and Implications for Vaccination Strategy
A recently published paper reported that in Japan, the number of deaths recognized under the Ministry of Health, Labour and Welfare’s Vaccine Adverse Reaction Relief System is disproportionately higher for COVID-19 vaccines than for conventional vaccines. The paper raised concerns that these vaccines were authorized without adequate non-clinical testing or long-term safety evaluation and that administration continued without sufficient disclosure of adverse events. It further highlights scientific shortcomings in the regulatory review process, inadequacies in post-marketing risk management, and concerns regarding serious adverse reactions, and the potential for DNA contamination. Notably, the study went so far as to call for the revocation of the approval and withdrawal of COVID-19 vaccines from the market [25].
During the pandemic, vaccines targeting Omicron variants BA.1, BA.4/5, XBB.1.5, and JN.1 were approved as modifications to the ancestral vaccines after no significant safety concerns were identified. These approvals did not require new non-clinical pharmacology or large-scale clinical trials. The parent vaccines were evaluated under conventional frameworks, without the toxicological or pharmacokinetic studies typically conducted for novel modalities. Some variant vaccines are derived from parent vaccines that lack extensive real-world usage data, and the safety of repeated boosters remains incompletely studied.
Recent data show that, in U.S. veterans, the 2024–2025 COVID-19 vaccine reduced risks of COVID-related ER visits, hospitalizations, and deaths over six months. Its protective effect persisted across age groups, comorbidity status, and immune competence [26].
As of October 2025, vaccination is primarily recommended for adults aged 65 and older, or those under 65 with comorbidities, though others may choose to opt in. The Japanese Association for Infectious Diseases, the Japanese Respiratory Society, and the Japanese Society for Vaccinology jointly maintain that, since older adults remain at high risk of severe disease and death from COVID-19, and because SARS-CoV-2 continues to evolve escape mutations, they strongly recommend that the new routine COVID-19 vaccination program beginning in October 2025 be implemented as planned [27]. Moreover, five academic societies including the Japanese Association for Infectious Diseases have requested a reconsideration of the Ministry of Health, Labour and Welfare’s plan to reduce public subsidy support for routine COVID-19 vaccines in fiscal 2025 [28].
However, considering the observed mortality patterns, the permissibility of unrestricted repeat vaccinations in younger adults warrants further evaluation. In this study, frequent vaccination was associated with reduced mortality in older adults but increased mortality in younger adults; however, these associations cannot establish causality, and the underlying mechanisms, as well as the effects of vaccine type, dosing interval, and lot variation, remain uncertain. These observations may constitute potential safety signals in a pharmacovigilance sense, indicating the need for careful monitoring and further analysis.
Limitations
This observational study identified associations between vaccination frequency and mortality, without establishing causal relationships. Potential confounders such as comorbidities, lifestyle, and healthcare utilization were not fully adjusted for. The study population was limited to Hamamatsu and Matsudo, limiting its generalizability, and regional differences were not assessed. The effects of the vaccine type and dosing interval have also not been adequately evaluated. Therefore, definitive conclusions regarding vaccine safety and effectiveness cannot be drawn, and nationwide studies with proper confounder adjustments are needed.
Conclusion
Analysis of resident data from Hamamatsu and Matsudo showed reduced mortality among older adults (65–89 years) who received ≥5 doses, which may reflect healthy vaccinee bias rather than a true vaccine effect. In contrast, mortality increased among younger adults (20–49 years) who received ≥5 doses, and among those 50–64 with six doses, suggesting a potential mortality risk associated with frequent vaccination. These findings indicate that the safety and effectiveness of repeated vaccinations in non-elderly populations remain uncertain, warranting a reevaluation of booster policies. In particular, strategies for younger adults should be guided by careful risk–benefit assessments. Although causality cannot be established, the observed age- and dose-dependent mortality differences strongly support the need for further nationwide confounder-adjusted research, including analyses of vaccine types, dosing intervals, and underlying immunological mechanisms, to develop optimized vaccination strategies by age group.
Author Contributions
Yasushi Iwamoto: Analysis of primary results (Figure 1, Figure 2, Figure 3 and Figure 4) and drafting of the Methods section. Hiroshi Kusunoki: Drafting of the Abstract, Introduction, Discussion, and Conclusion sections. Yukari Kamijima: Supervision of analysis and manuscript from a pharmacoepidemiological perspective. Ryota Sakai: Medical oversight of the manuscript. Yumi Watanabe: Medical oversight of the manuscript. Hideki Kakeya: Analysis of Figure 5 and Figure 6, and drafting of Methods, Results, and Discussion sections. All authors contributed to the manuscript writing, provided critical feedback, and approved the final version of the manuscript.
Funding
No specific funding was received from any public, commercial, or not-for-profit organization for the work described in this article.
Ethical Considerations
The study was conducted in accordance with the principles of the Declaration of Helsinki and the Act on the Protection of Personal Information. The authors used anonymized data provided by the NHK, which contained no personally identifiable information and lacked linkage tables, thereby preventing re-identification. Therefore, this research is outside the scope of the application in “Ethical Guidelines for Medical and Health Research Involving Human Subjects” in the Japanese guidelines.
Data Availability Statement
Acknowledgments
The data used in this analysis were provided by the NHK Fukuoka Broadcasting Station “The Life” production team. The authors also thank the Visiting Researcher Masayuki Ikeda of the Medical Information Department, Kagawa University Hospital, for providing valuable advice regarding the manuscript. The authors also thank Tetsuya Toyoda of the Choju Medical Institute and Koji Takamiya of the Faculty of Economics, Niigata University, for fruitful discussions regarding the data and manuscript.
Conflicts of Interest
None.
References
- Polack FP, Thomas SJ, Kitchin N, Absalon J, Gurtman A, Lockhart S, et al. (2020) Safety and efficacy of the BNT162b2 mRNA COVID-19 vaccine. New England Journal of Medicine 383(27): 2603–2615. [CrossRef]
- Magen O, Waxman JG, Makov-Assif M, Vered R, Dicker D, Hernán MA, et al. (2022) Fourth dose of BNT162b2 mRNA COVID-19 vaccine in a nationwide setting. New England Journal of Medicine 386(17): 1603–1614. [CrossRef]
- Kusunoki H (2024) Current status and significance of additional vaccination with COVID-19 vaccine in Japan: Considerations from antibody levels from hybrid immunity and public perceptions. Vaccines 12: 1413. [CrossRef]
- Kakeya H, Nitta T, Kamijima Y, Miyazawa T (2025) Significant increase in excess deaths after repeated COVID-19 vaccination in Japan. JMA Journal 8: 584–586. [CrossRef]
- Kusunoki H (2025) Unraveling rising mortality: Statistical insights from Japan and international comparisons. Healthcare 13(11): 1305. [CrossRef]
- Nagai T (2023) How did the trend in mortality risk in Japan change from 2022 to 2023, towards the end of the COVID-19 pandemic? Available: https://nagaitakashi.net/blog/risk-comparison/mortality2023/ (Accessed 12 Sep 2025).
- Mainichi Shimbun (2025) [Japanese]. Available: https://mainichi.jp/articles/20250624/k00/00m/040/161000c (Accessed 26 Oct 2025).
- Asahi Shimbun (2022) [Japanese]. Available:https://www.asahi.com/articles/ASQCB6T7SQCBULFA02J.html (Accessed 26 Oct 2025).
- Maeda H, Saito N, Igarashi A, Ishida M, Terada M, Masuda S, et al. (2024) Effectiveness of primary series, first, and second booster vaccination of monovalent mRNA COVID-19 vaccines during the SARS-CoV-2 omicron BA.5 epidemic in Japan: VERSUS. Expert Review of Vaccines 23(1): 213–225. [CrossRef]
- Glasziou P, McCaffery K, Cvejic E, et al. (2022) Testing behaviour may bias observational studies of vaccine effectiveness. Journal of the Association of Medical Microbiology and Infectious Disease Canada 7(3): 242–246. [CrossRef]
- Zhang HT, McGrath LJ, Wyss R, Ellis AR, Stürmer T (2017) Controlling confounding by frailty when estimating influenza vaccine effectiveness. Pharmacoepidemiology and Drug Safety 26: 1500–1506.
- Chua H, Feng S, Lewnard AJ, et al. (2020) Use of test-negative controls to monitor vaccine effectiveness: A systematic review of methodology. Epidemiology 31(1): 43–64. [CrossRef]
- Park HJ, Gonsalves GS, Tan ST, et al. (2024) Comparing frequency of booster vaccination to prevent severe COVID-19 by risk group in the United States. Nature Communications 15: 1883. [CrossRef]
- Agampodi S, Tadesse BT, Sahastrabuddhe S, Excler JL, Kim JH (2024) Biases in COVID-19 vaccine effectiveness studies using cohort design. Frontiers in Medicine 11: 1474045. [CrossRef]
- Remschmidt C, Wichmann O, Harder T (2015) Frequency and impact of confounding by indication and healthy vaccinee bias in influenza vaccine effectiveness studies: A systematic review. BMC Infectious Diseases 15: 429. [CrossRef]
- Jedlička P (2024) Failure to address crucial biases other than the healthy vaccinee effect. International Journal of Infectious Diseases 146: 107143. [CrossRef]
- e-Stat: Portal Site of Official Statistics of Japan. Available: https://www.e-stat.go.jp (Accessed 26 Oct 2025).
- Hamamatsu City Statistics [Japanese]. Available: https://www.city.hamamatsu.shizuoka.jp/gyousei/library/1_jinkou-setai/007_nenreibetsu.html (Accessed 26 Oct 2025).
- Chemaitelly H, Ayoub HH, Coyle P, et al. (2025) Assessing healthy vaccinee effect in COVID-19 vaccine effectiveness studies: A national cohort study in Qatar. eLife 14: e103690. [CrossRef]
- Takahashi A (2025) Factors contributing to the sharp rise in excess mortality in Japan since 2021. Research Square. [CrossRef]
- Irrgang P, Gerling J, Kocher K, et al. (2023) Class switch toward noninflammatory, spike-specific IgG4 antibodies after repeated SARS-CoV-2 mRNA vaccination. Science Immunology 8(79): eade2798. [CrossRef]
- Franco A, Song J, Chambers C, et al. (2023) SARS-CoV-2 spike-specific regulatory T cells expand and develop memory in vaccine recipients. Autoimmunity 56(1): 2259133. [CrossRef]
- Rodríguez Y, Rojas M, Beltrán S, et al. (2022) Autoimmune and autoinflammatory conditions after COVID-19 vaccination: New case reports and updated literature review. Journal of Autoimmunity 132: 102898. [CrossRef]
- Kim HJ, Kim MH, Choi MG, Chun EM (2025) 1-year risks of cancers associated with COVID-19 vaccination: A large population-based cohort study in South Korea. Biomarker Research 13(1): 114. [CrossRef]
- Ueda J, Gibo M, Kikuchi T, Hirai Y, Miyokawa M, Shima I, et al. (2025) Science, Public Health Policy, and the Law. 8: 2019–2025.
- Cai M, Xie Y, Al-Aly Z (2025) Association of 2024–2025 COVID-19 vaccine with COVID-19 outcomes in U.S. veterans. New England Journal of Medicine. [CrossRef]
- Japanese Association for Infectious Diseases (2025) [Japanese]. Available:https://www.kansensho.or.jp/modules/news/index.php?content_id=797(Accessed 26 Oct 2025).
- Japanese Association for Infectious Diseases (2025) [Japanese]. Available:https://www.kansensho.or.jp/modules/news/index.php?content_id=793(Accessed 26 Oct 2025).
Figure 1.
Distribution of the number of vaccine doses across age groups (expressed as proportions).
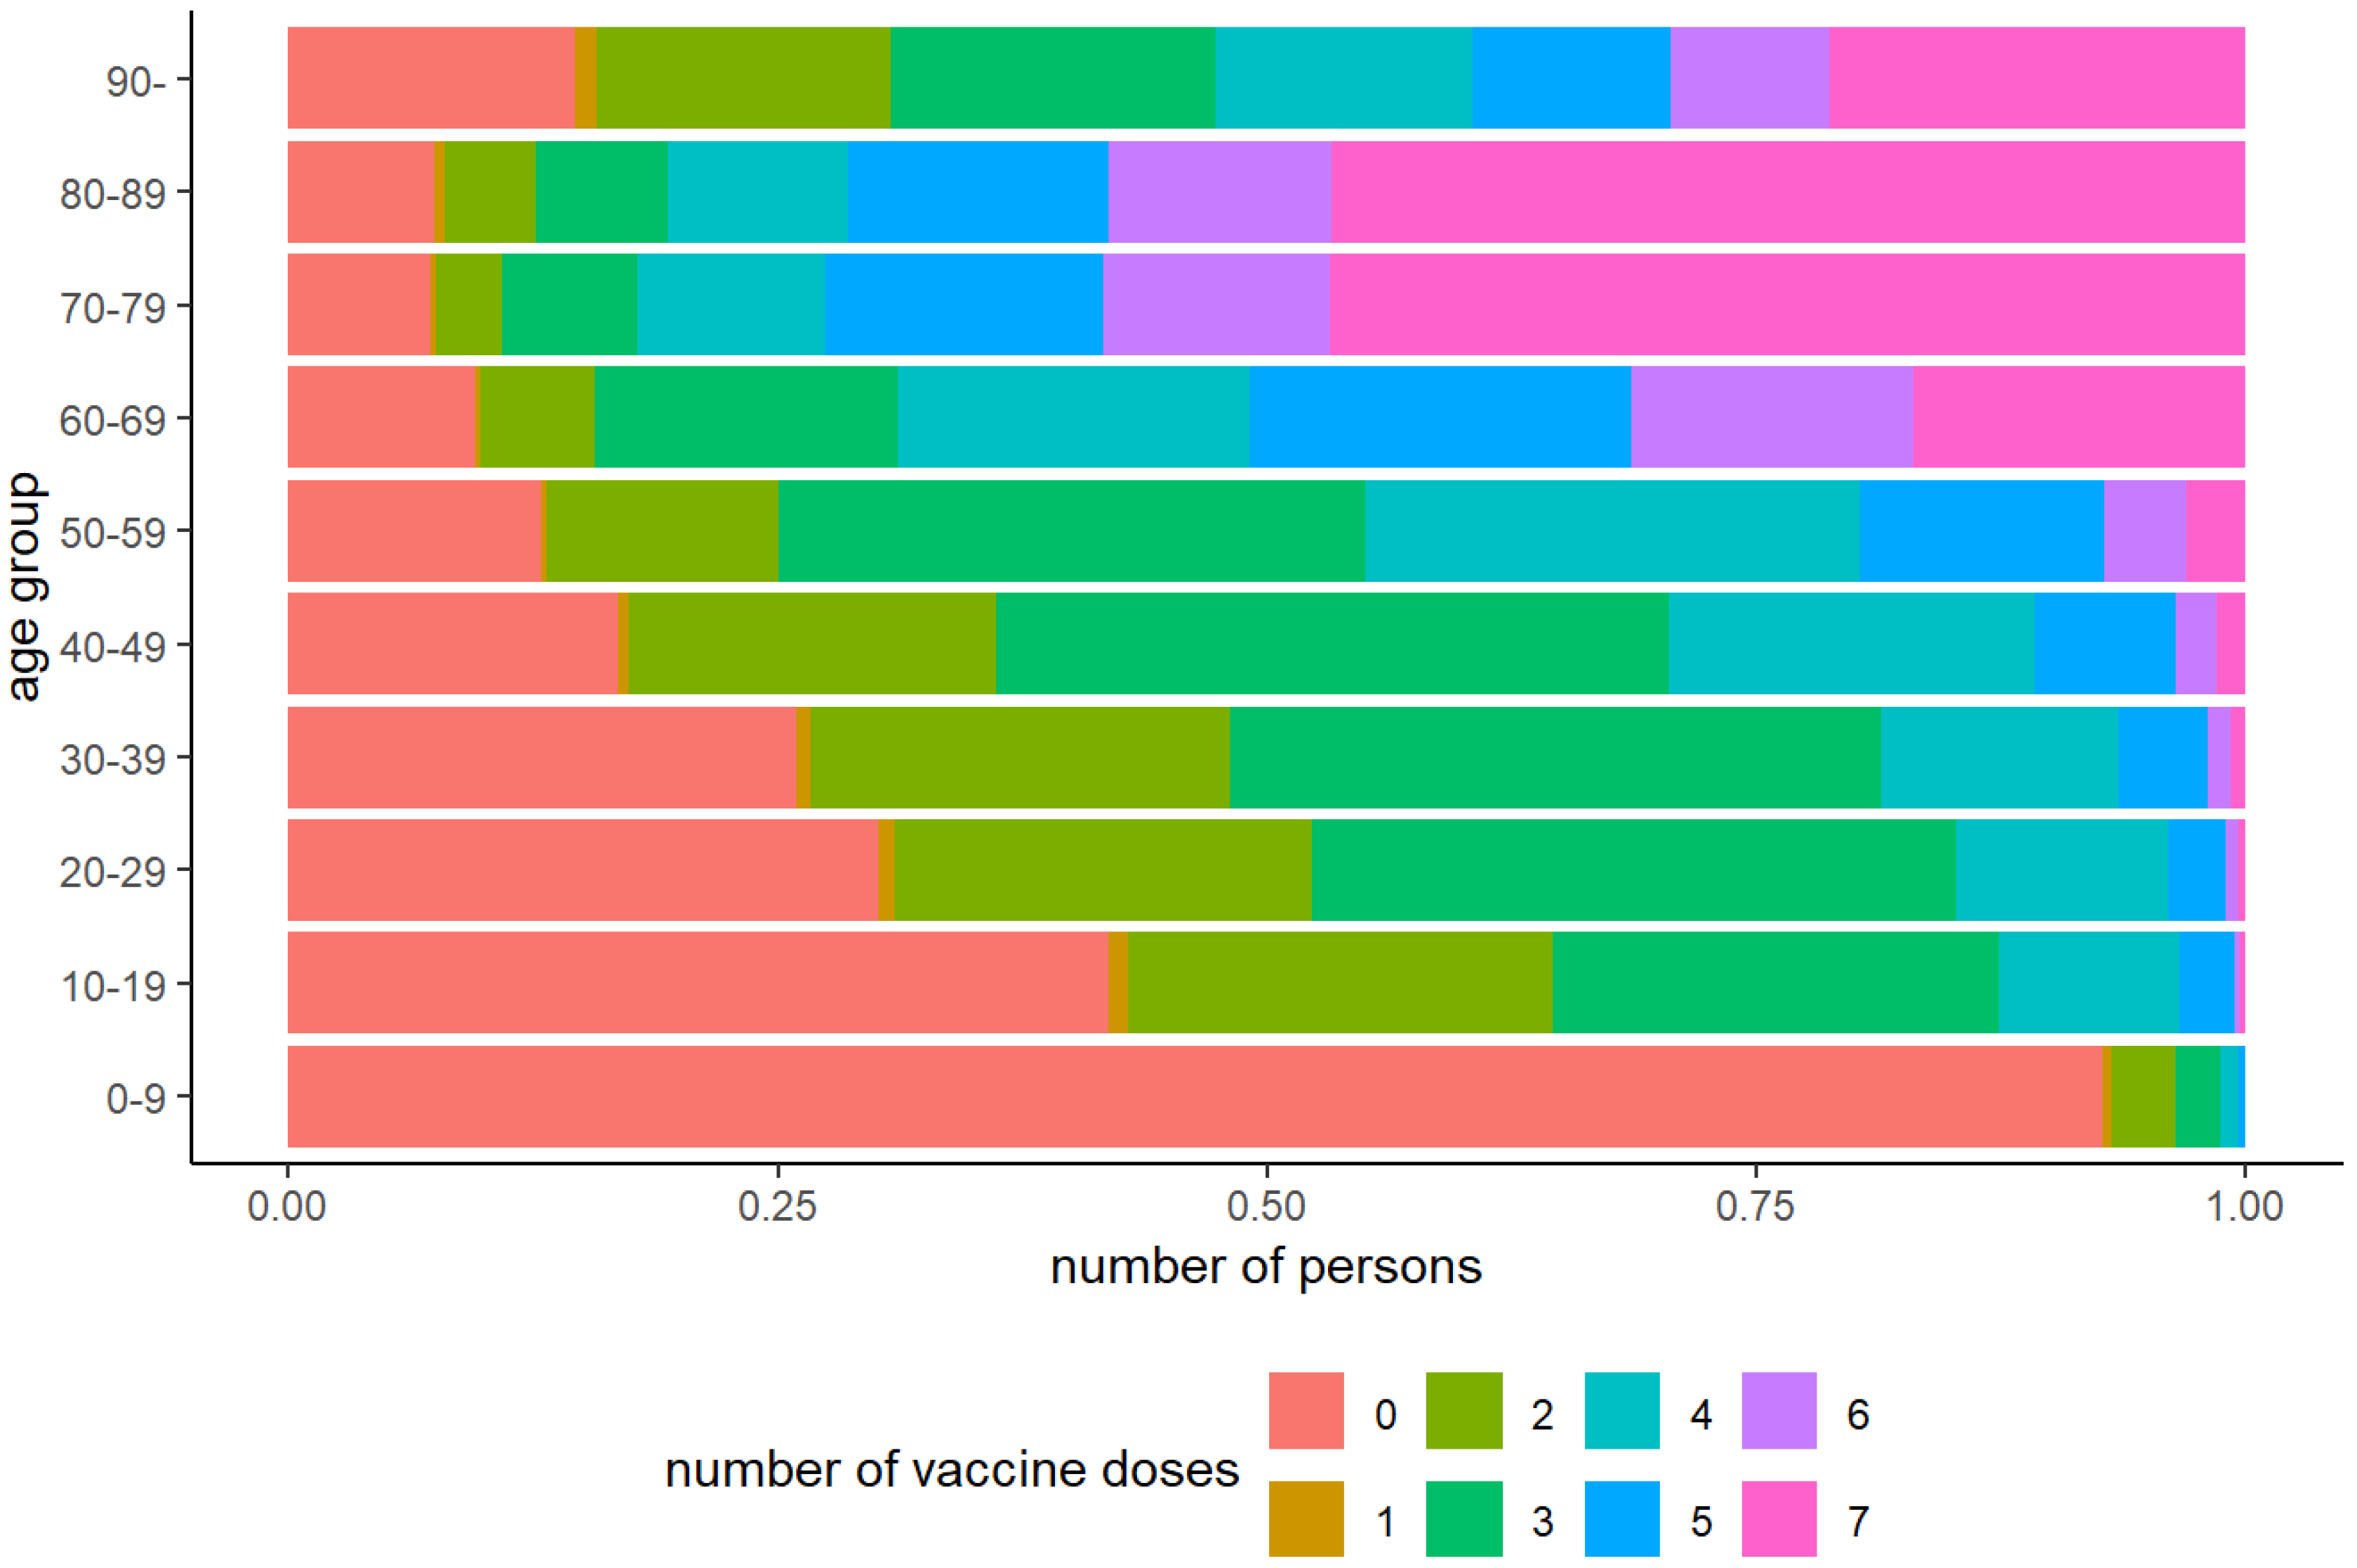
Figure 2.
All-cause mortality by age group and number of vaccine doses (error bars represent 95% confidence intervals).
Figure 2.
All-cause mortality by age group and number of vaccine doses (error bars represent 95% confidence intervals).
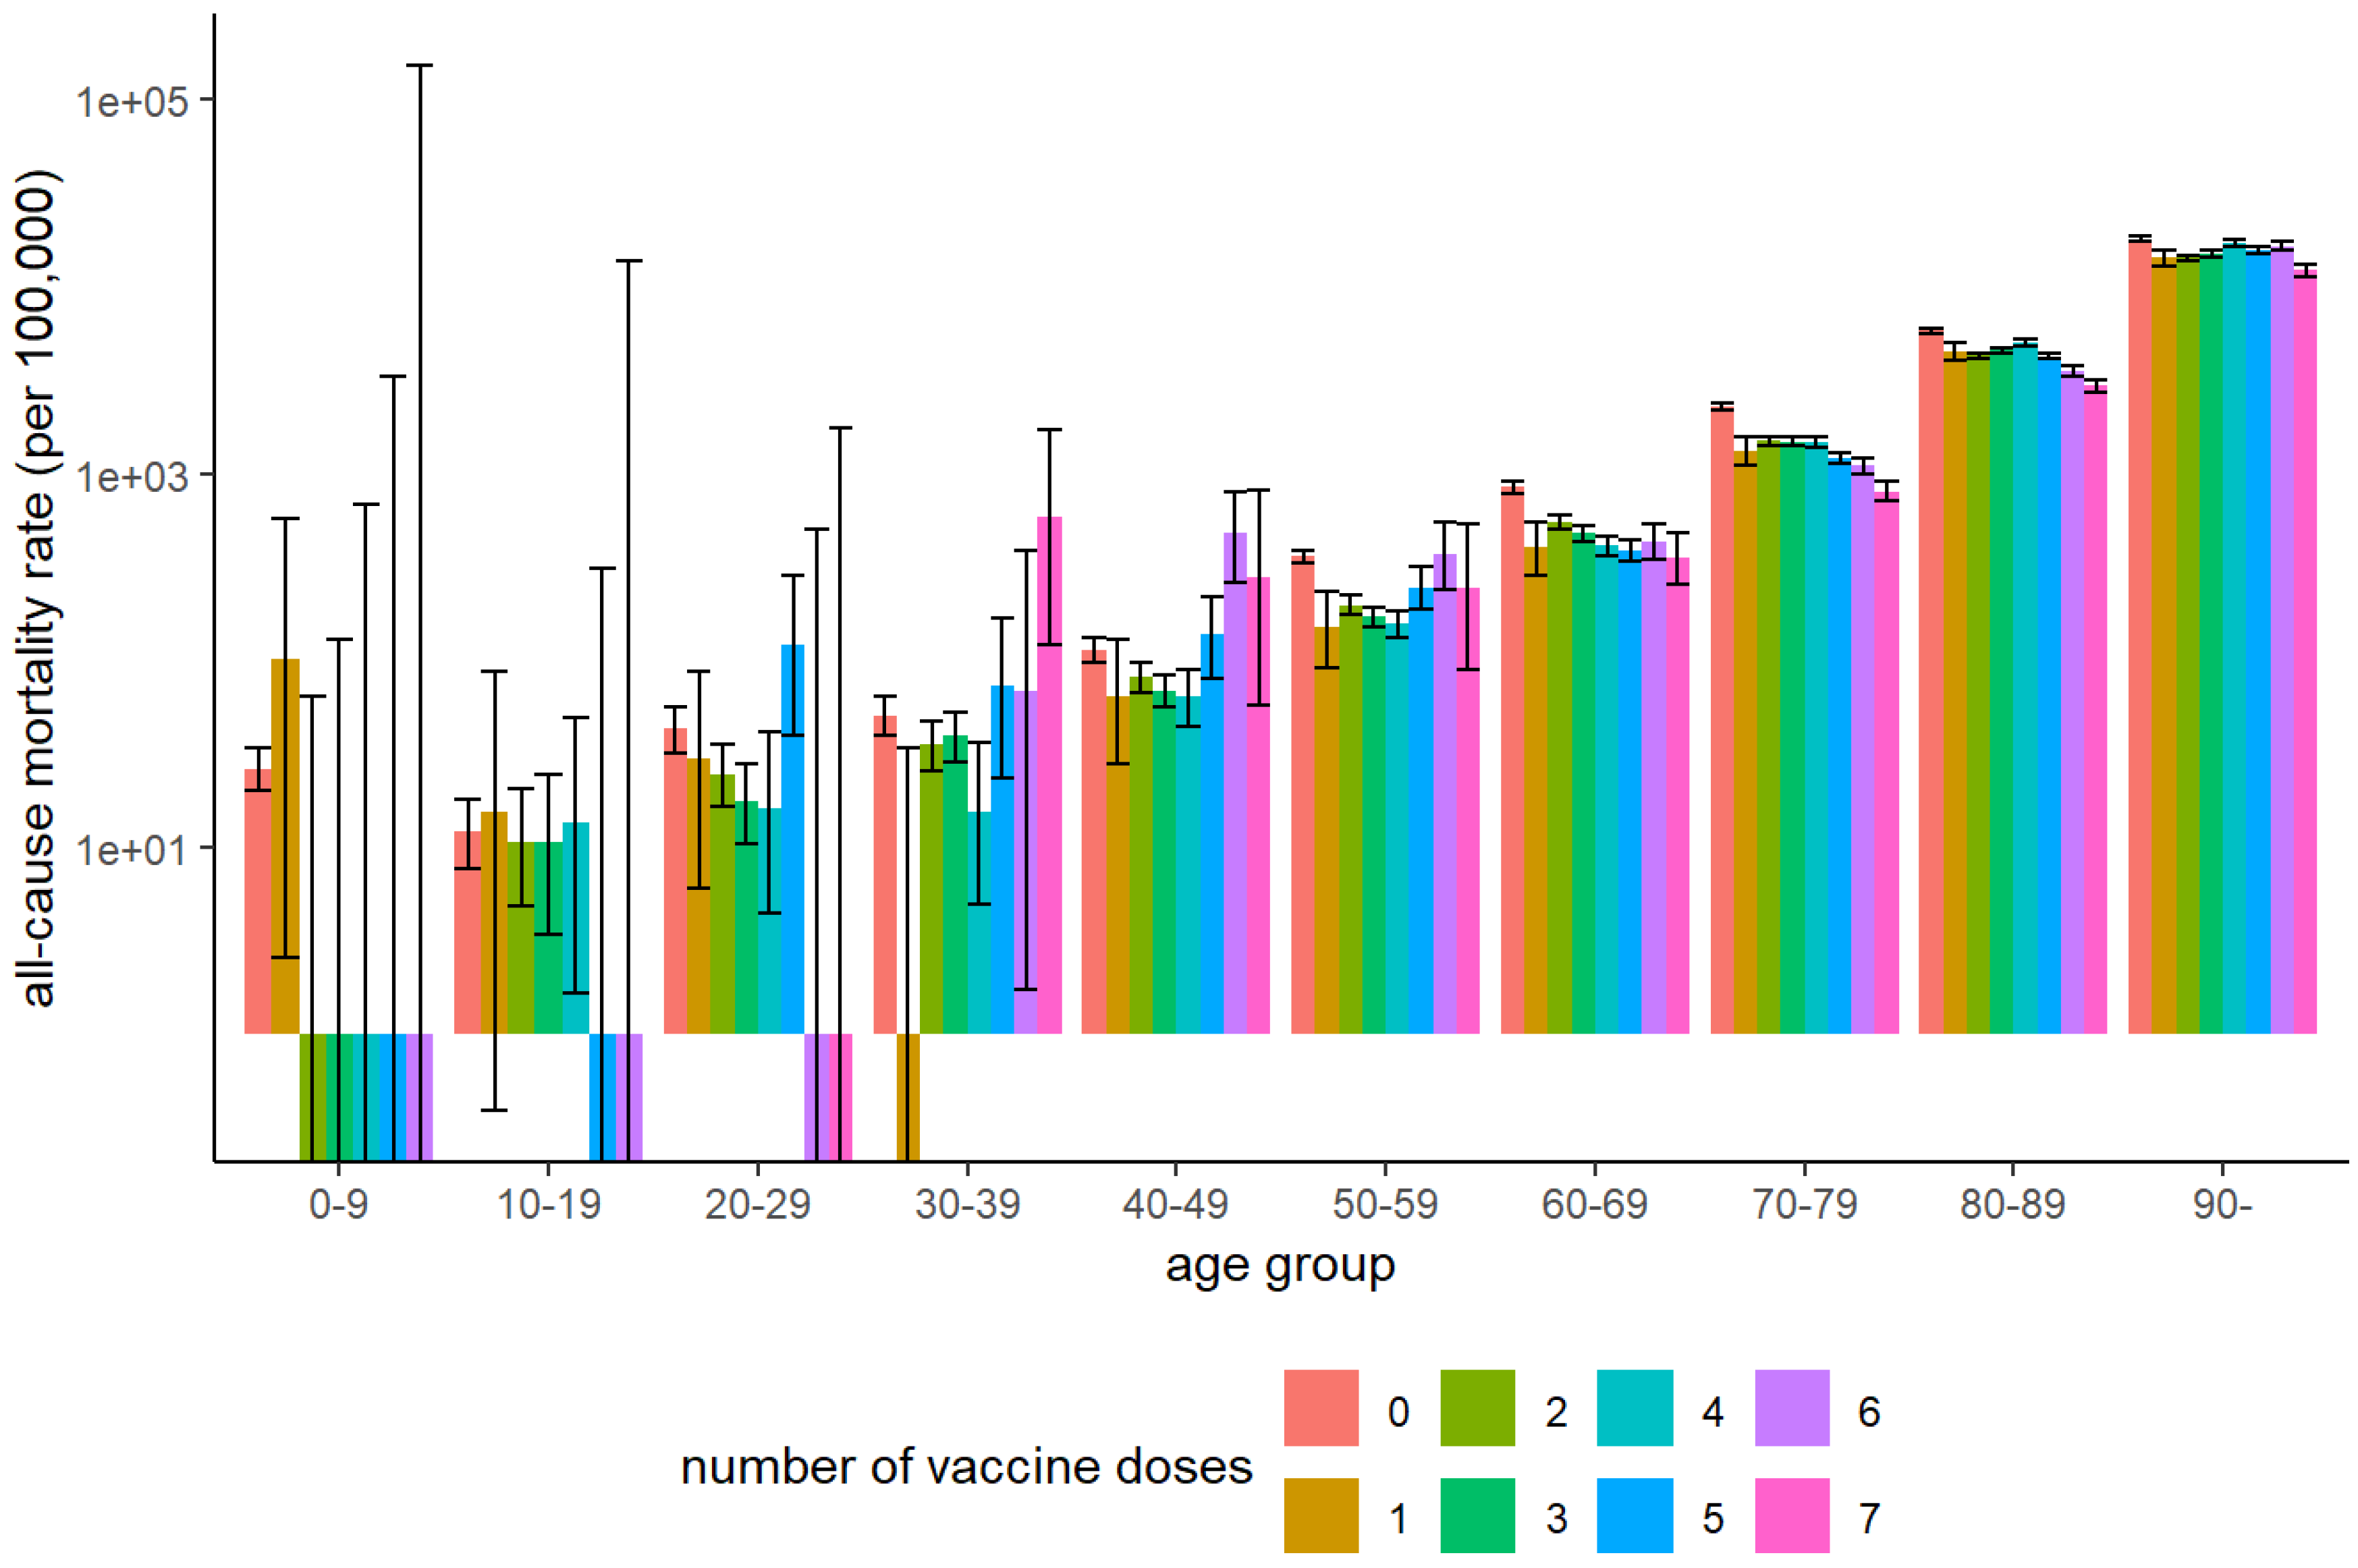
Figure 3.
All-cause mortality by number of vaccine doses for ages 20–49 (A), 50–64 (B), and 65–89 (C), generated using IncidencePrevalence. Error bars indicate 95% confidence intervals.
Figure 3.
All-cause mortality by number of vaccine doses for ages 20–49 (A), 50–64 (B), and 65–89 (C), generated using IncidencePrevalence. Error bars indicate 95% confidence intervals.
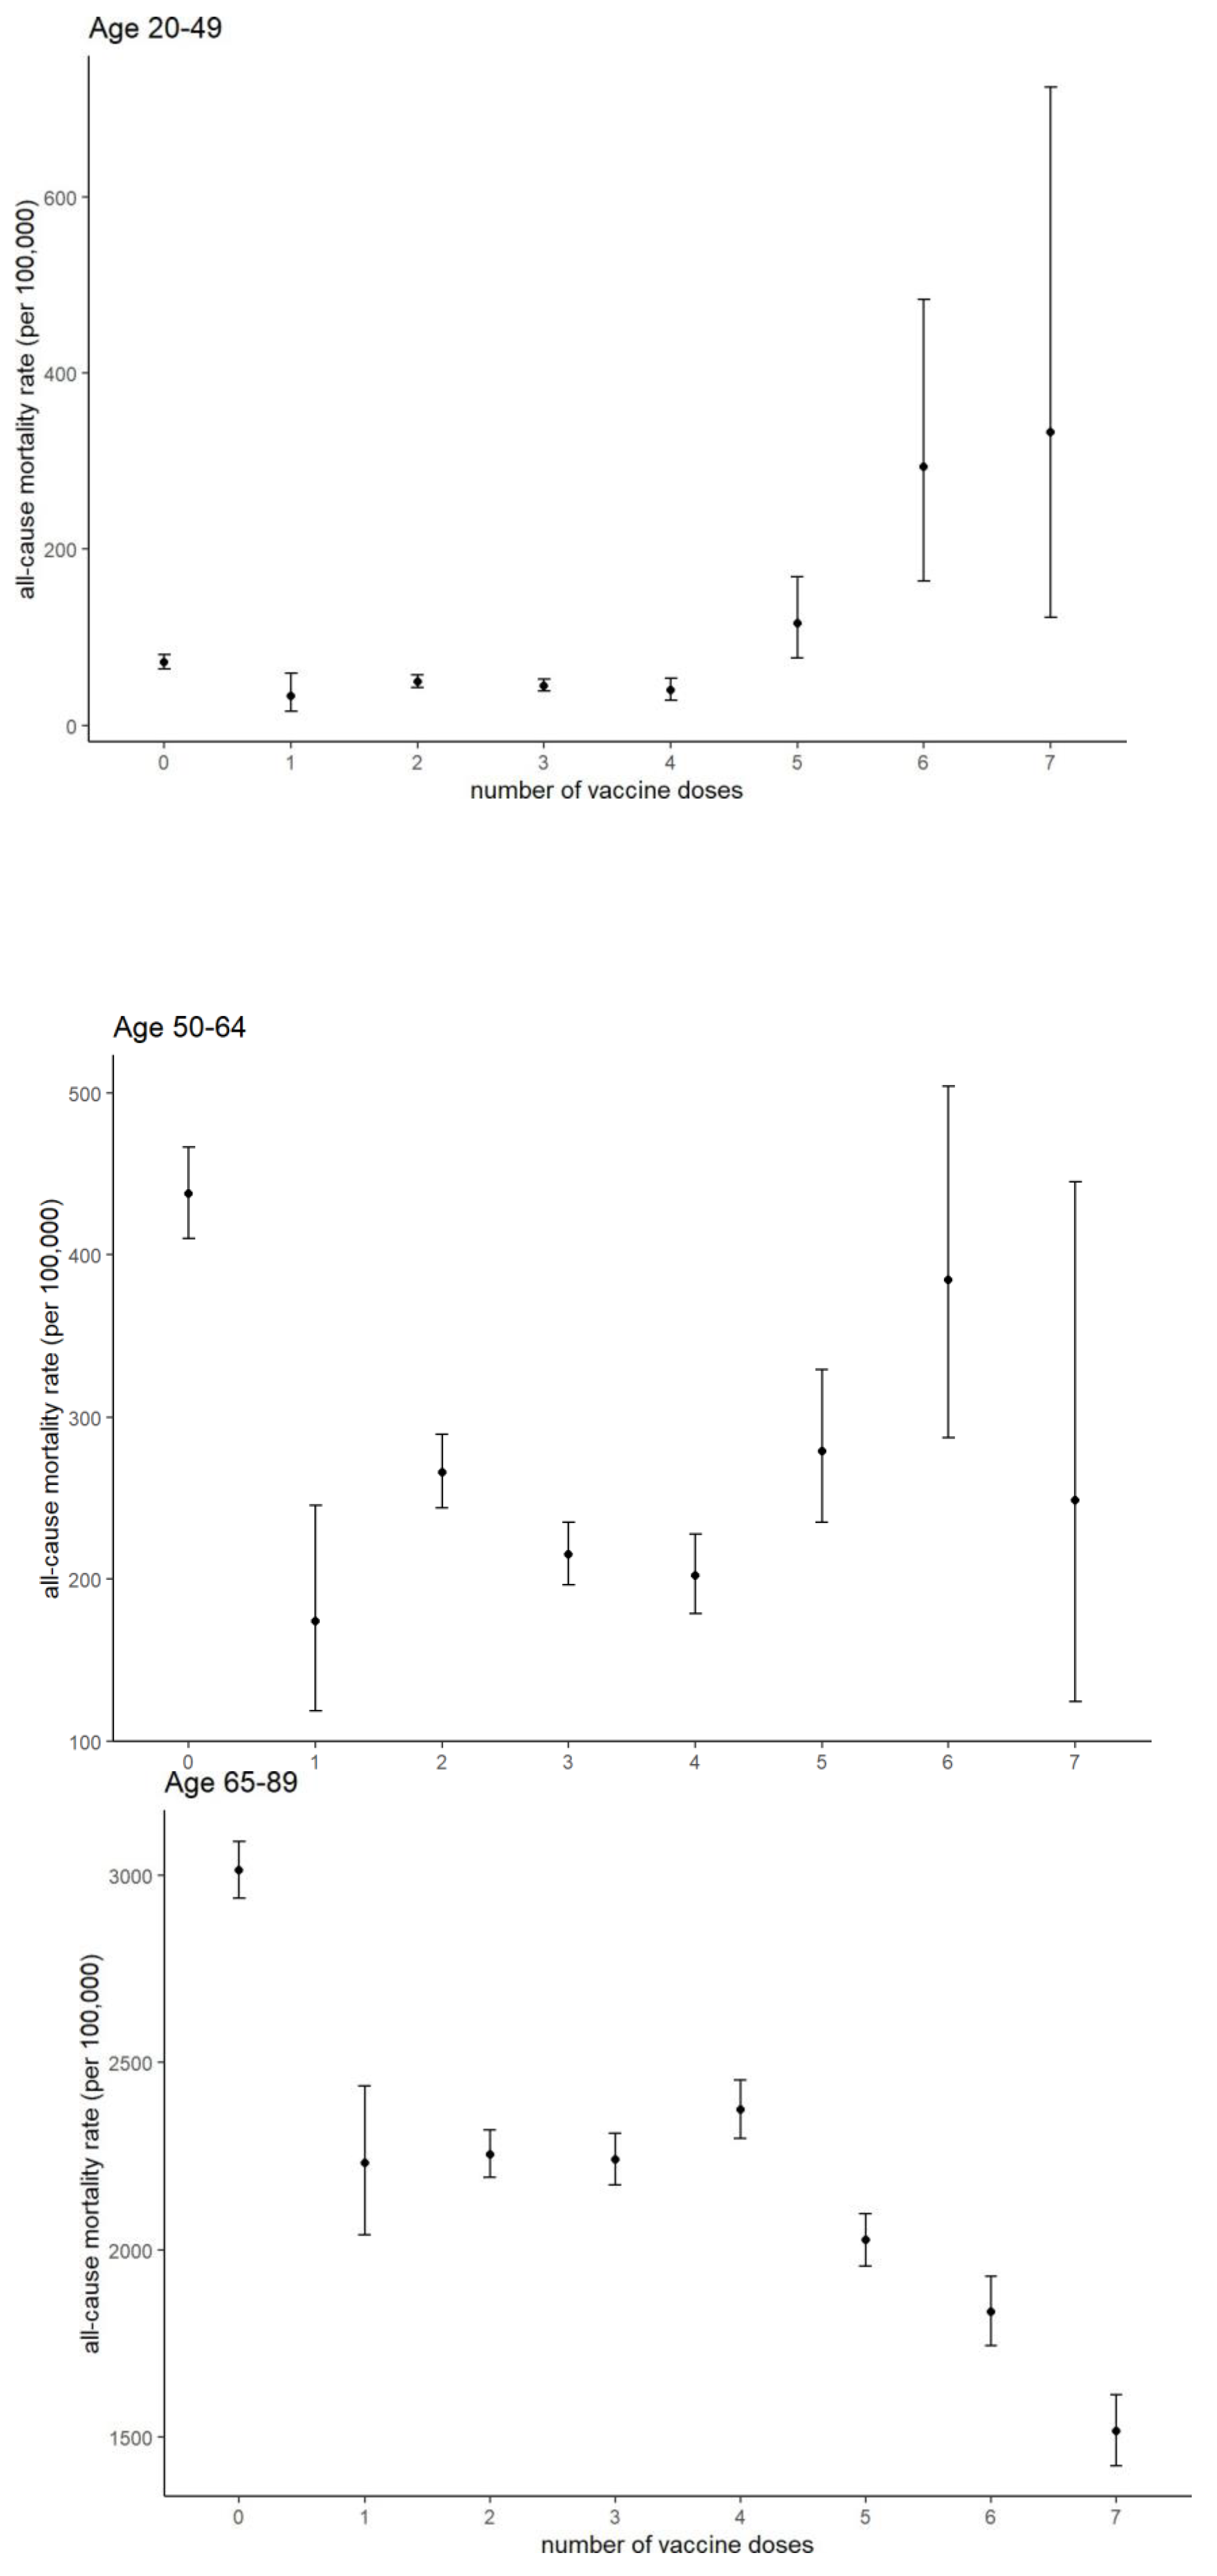
Figure 4.
Distribution of days from vaccination to death for ages 20–49 (A), 50–64 (B), and 65–89 (C). The left axis displays the number of deaths in each 10-day interval, and the numbers on the right indicate the number of vaccine doses administered.
Figure 4.
Distribution of days from vaccination to death for ages 20–49 (A), 50–64 (B), and 65–89 (C). The left axis displays the number of deaths in each 10-day interval, and the numbers on the right indicate the number of vaccine doses administered.
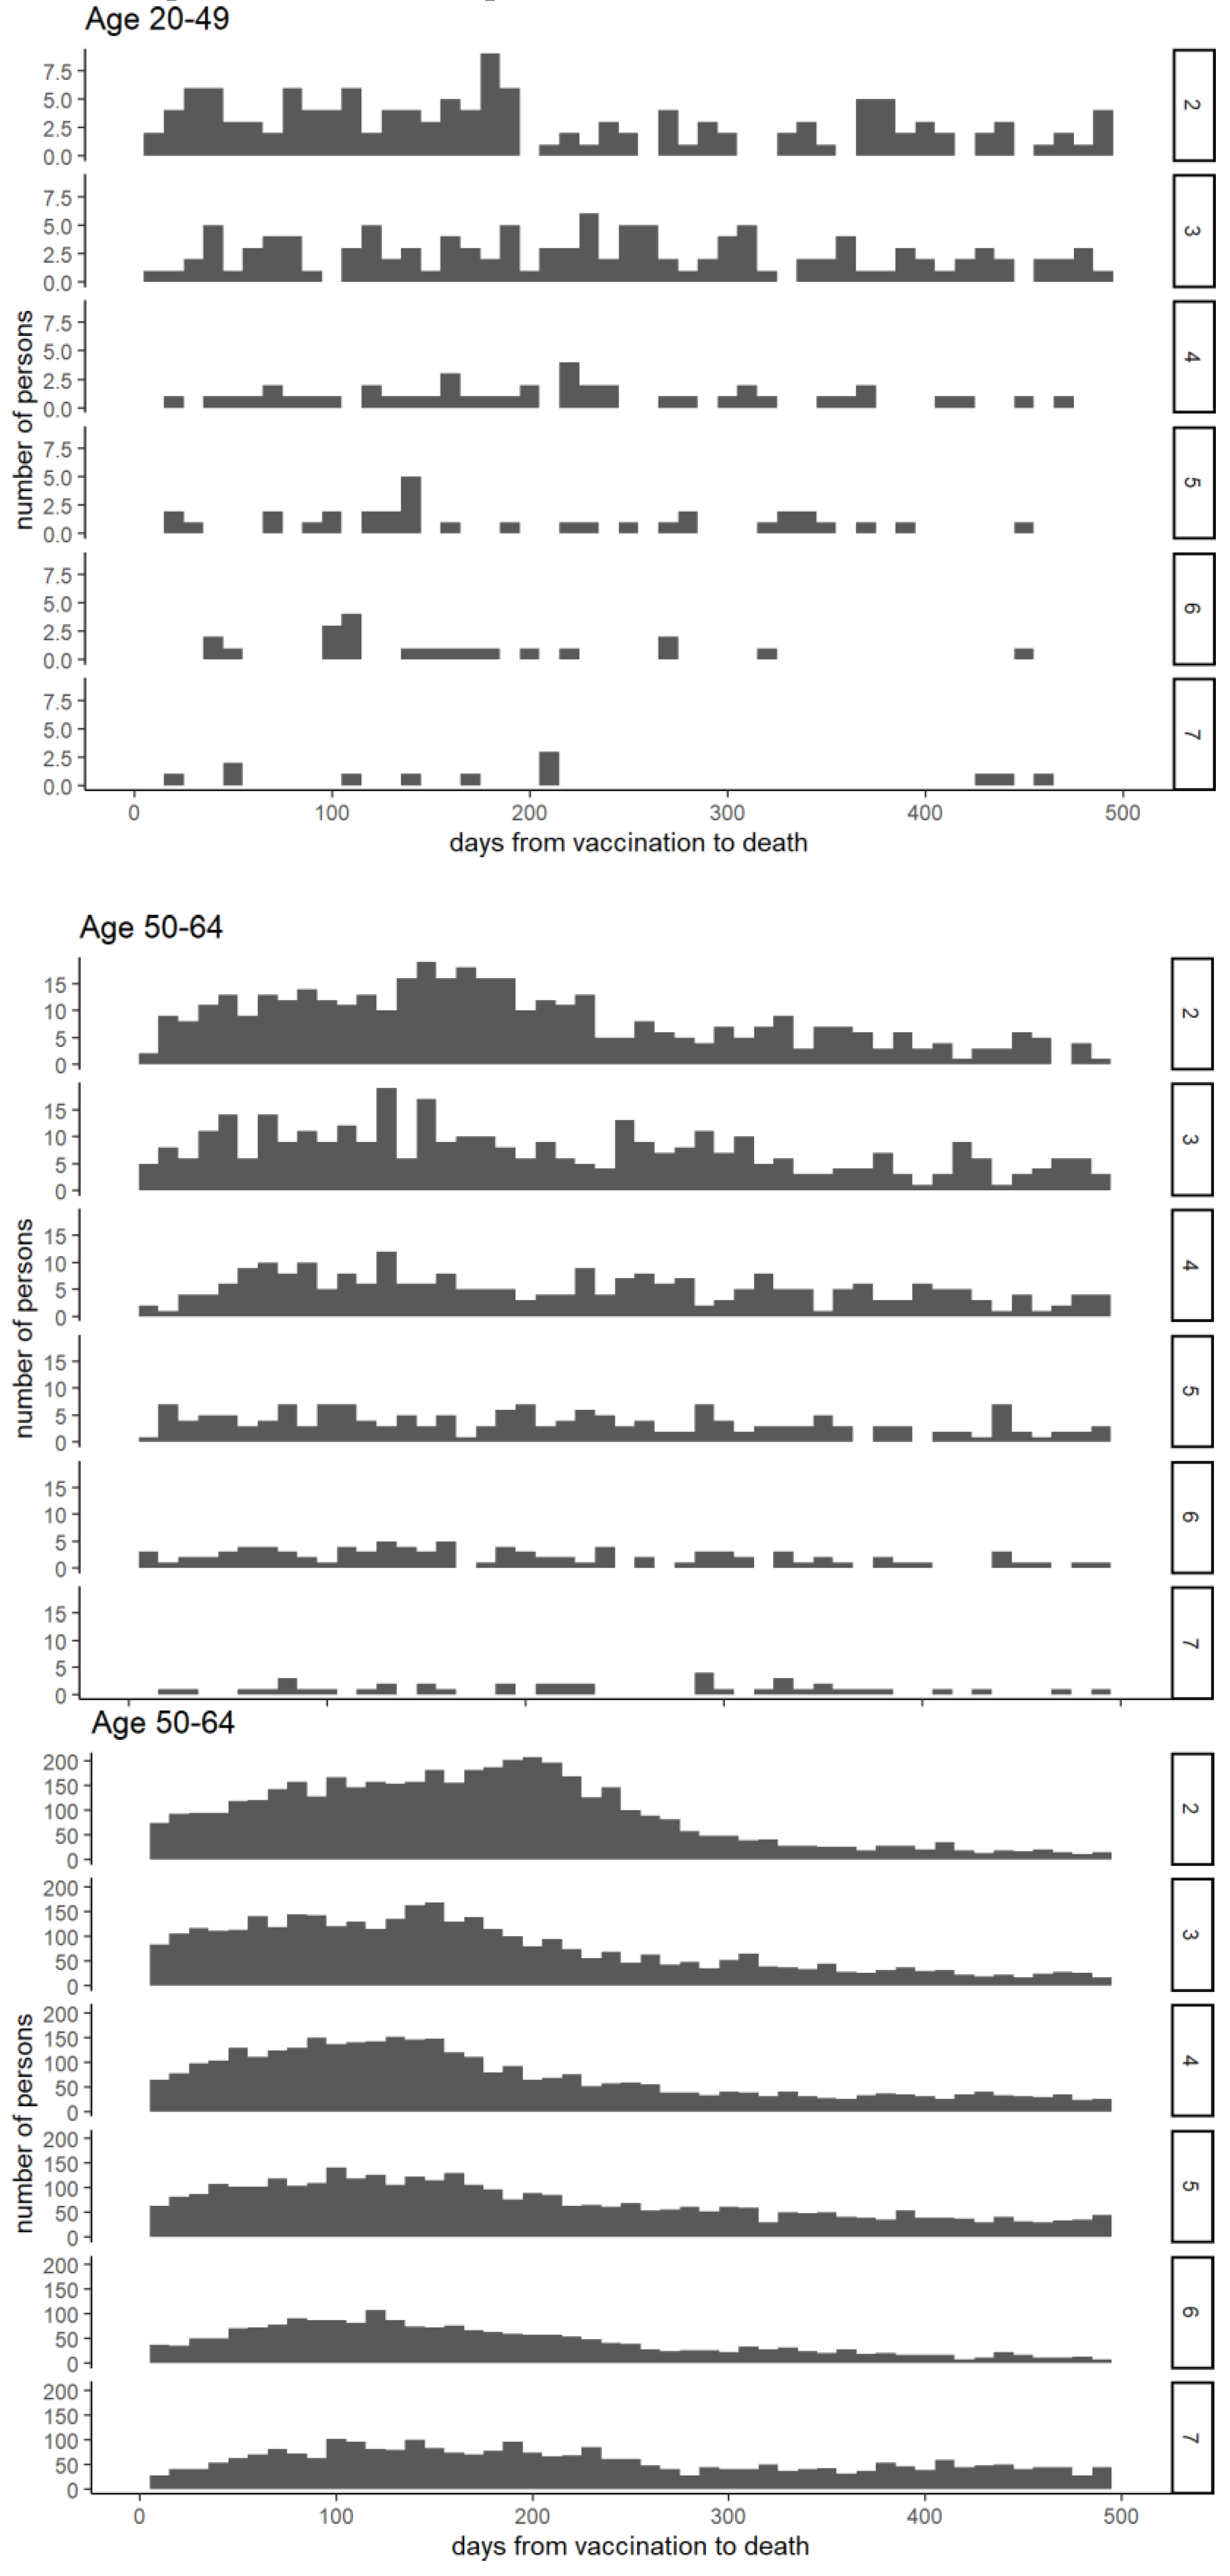
Figure 5.
Monthly all-cause mortality by number of vaccine doses for ages 65–89. Individuals who received only one dose are excluded due to their small number and the resulting large fluctuations in monthly mortality rates.
Figure 5.
Monthly all-cause mortality by number of vaccine doses for ages 65–89. Individuals who received only one dose are excluded due to their small number and the resulting large fluctuations in monthly mortality rates.
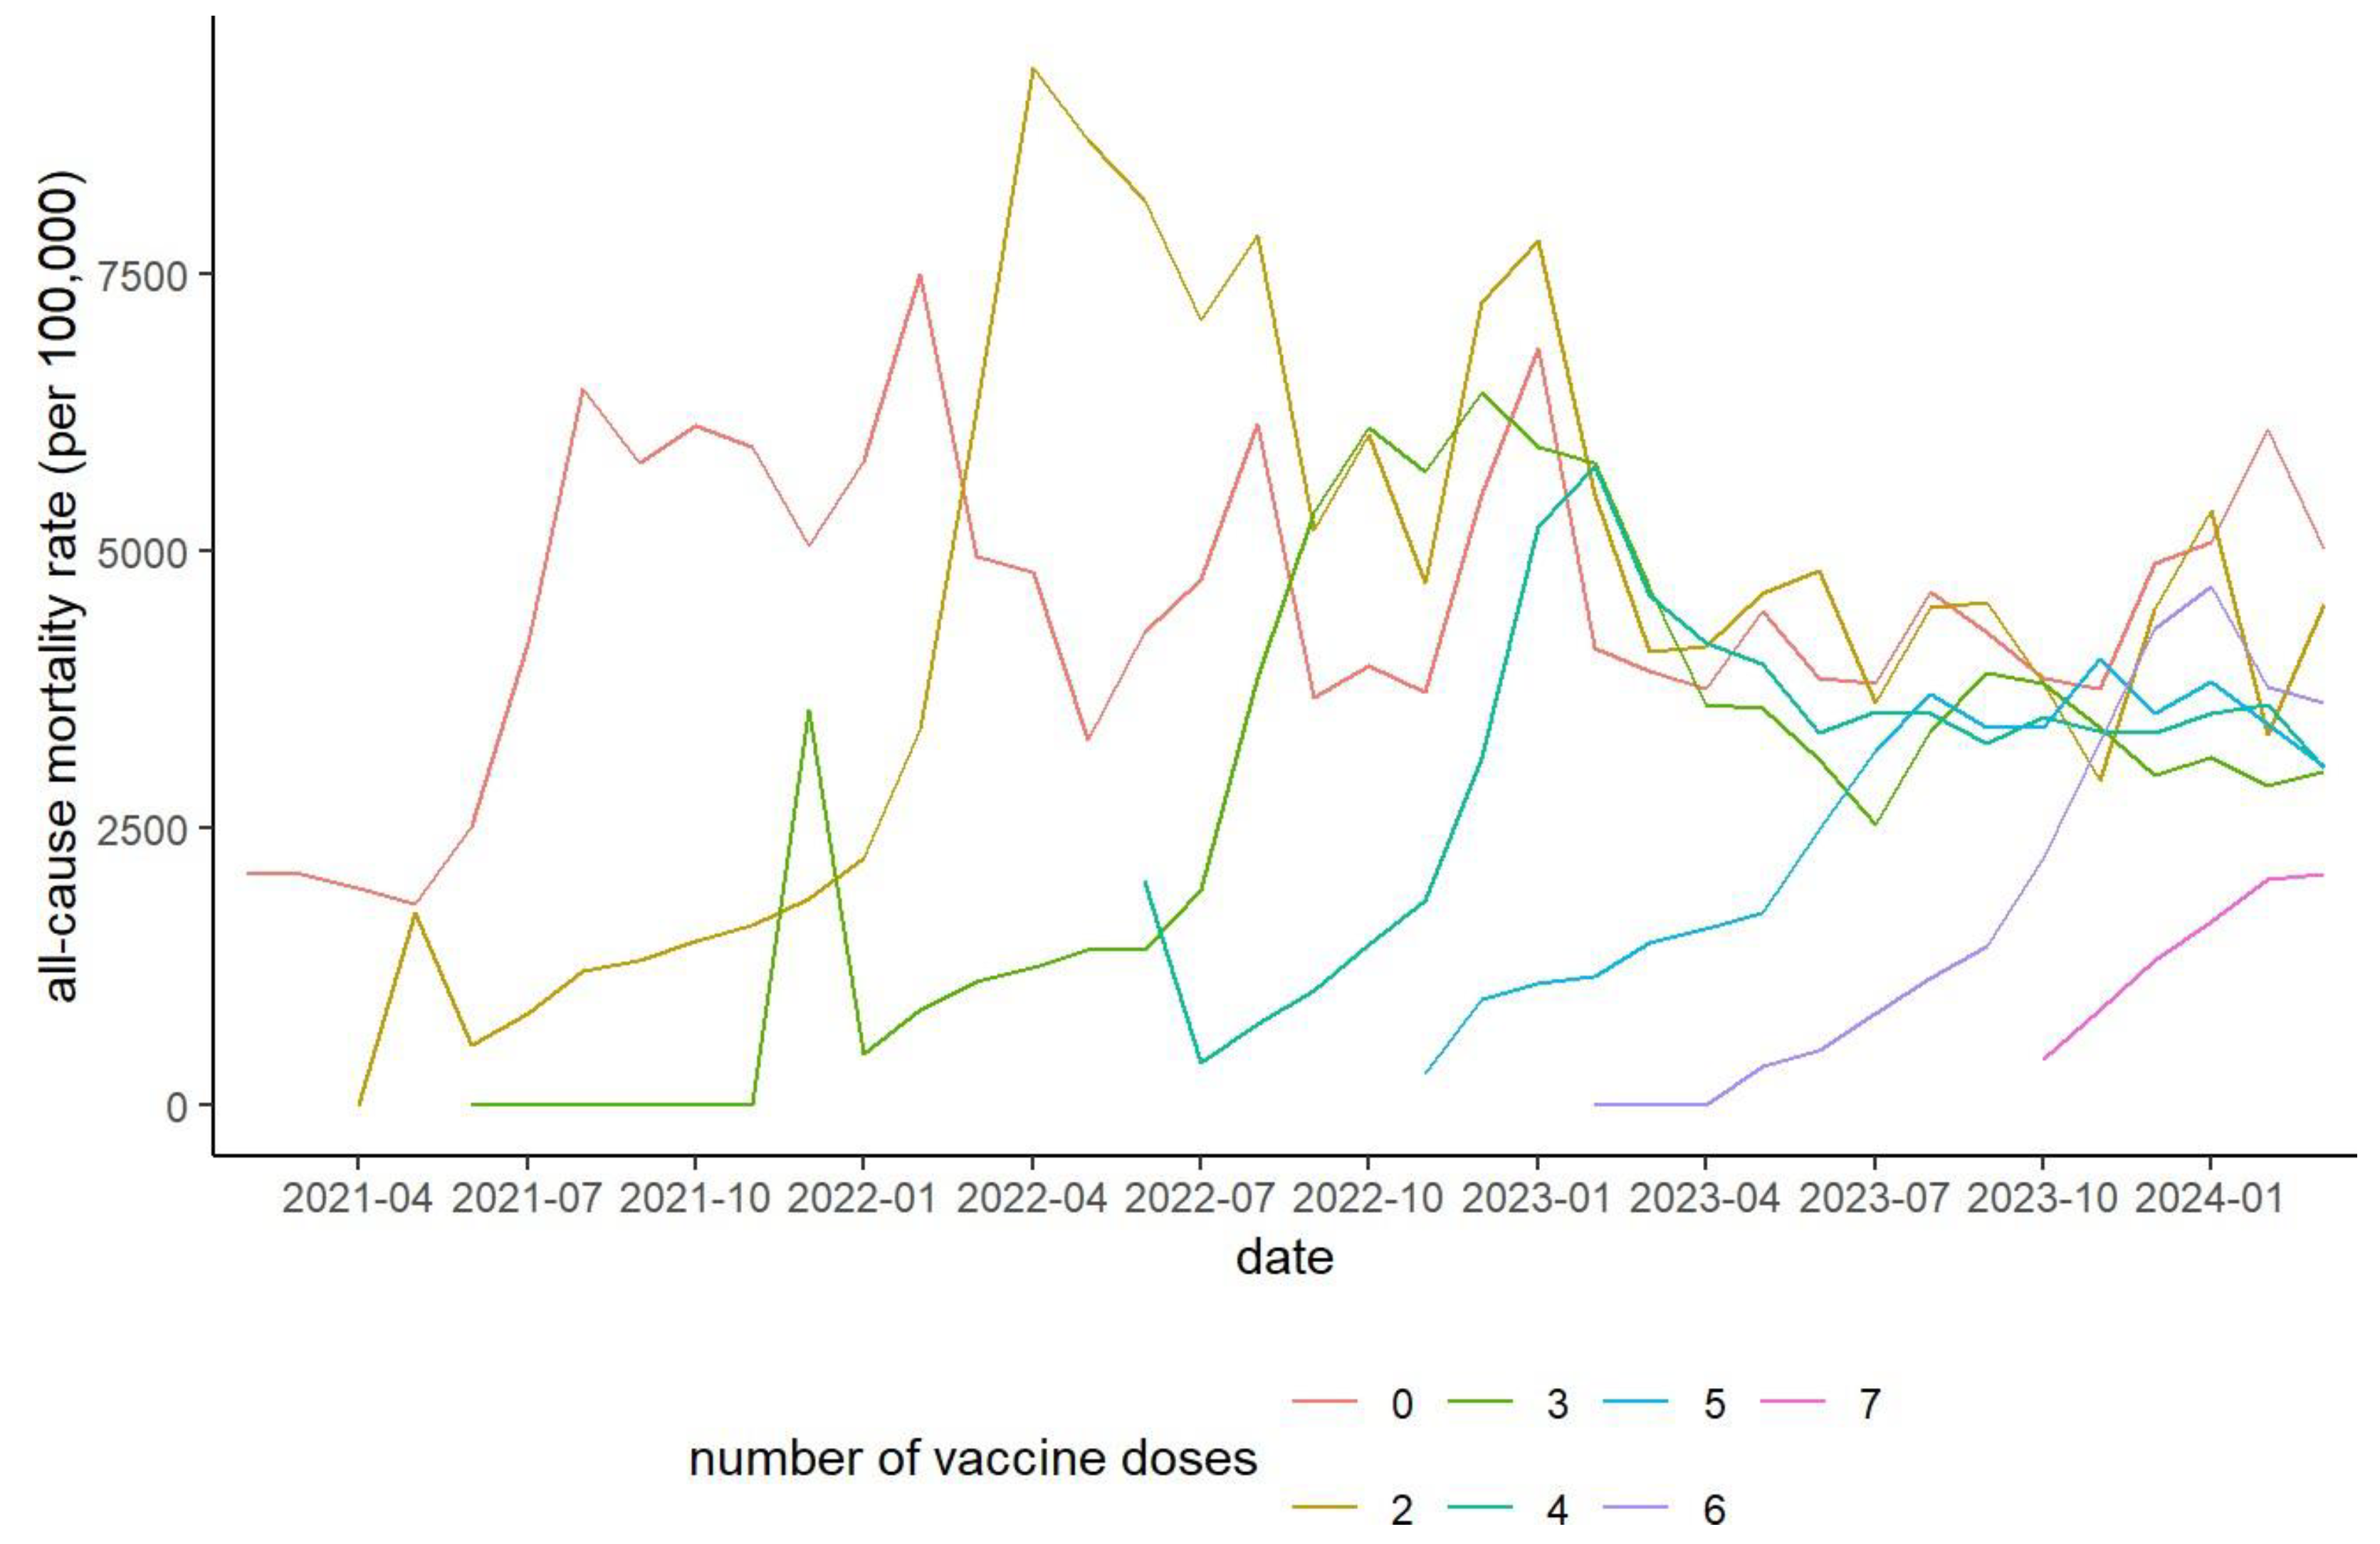
Figure 6.
Time series of all-cause deaths among individuals with 0, 1–4, and 5–7 vaccine doses. 20–49 (A), 50–64 (B), and 65–89 (C).
Figure 6.
Time series of all-cause deaths among individuals with 0, 1–4, and 5–7 vaccine doses. 20–49 (A), 50–64 (B), and 65–89 (C).
Disclaimer/Publisher’s Note: The statements, opinions and data contained in all publications are solely those of the individual author(s) and contributor(s) and not of MDPI and/or the editor(s). MDPI and/or the editor(s) disclaim responsibility for any injury to people or property resulting from any ideas, methods, instructions or products referred to in the content. |
© 2025 by the authors. Licensee MDPI, Basel, Switzerland. This article is an open access article distributed under the terms and conditions of the Creative Commons Attribution (CC BY) license (http://creativecommons.org/licenses/by/4.0/).
Copyright: This open access article is published under a Creative Commons CC BY 4.0 license, which permit the free download, distribution, and reuse, provided that the author and preprint are cited in any reuse.


