
Submitted:
31 October 2025
Posted:
04 November 2025
You are already at the latest version
Abstract
SubHealthAI is a preventive health system that uses artificial intelligence to detect early signs of physiological change before disease is diagnosed. It analyzes wearable and lifestyle data, and in future, optional lab inputs such as bloodwork and imaging summaries. The system produces daily risk scores, visual explanations, and simple reports that individuals and clinicians can review together. By shifting from reactive healthcare to proactive prevention, SubHealthAI aims to reduce the cost and burden of chronic illness in the United States. The framework combines unsupervised anomaly detection (Isolation Forest), temporal forecasting (GRU), and SHAP-based explainability to surface early physiological dysfunction with interpretable reasoning. Preliminary evaluation on simulated wearable data showed a precision of 0.81 for anomaly detection and an RMSE of 0.12 for next-day risk forecasting, indicating feasibility for early physiological risk detection.
Keywords:
preventive health AI
; explainable AI
; subclinical detection
; GRU forecasting
; SHAP
; wearable data
; anomaly detection
; predictive health
; supabase
; auditability
1. Background and Motivation
Chronic disease accounts for about 90% of U.S. healthcare spending according to the CDC. Most conditions such as diabetes, cardiovascular disease, and metabolic dysfunction develop silently for years before diagnosis. Explainable machine learning methods such as SHAP can improve transparency and trust for preventive decision-making [2]. Current consumer health tools track steps or sleep but do not combine multiple signals or highlight subtle trends that suggest early dysfunction. Clinicians often receive fragmented data that cannot be interpreted easily or integrated into preventive care workflows. Prior studies have explored explainable anomaly detection and wearable-based health prediction [3,4], but most target post-diagnosis monitoring or lack interpretable rationale for pre-diagnostic warning. SubHealthAI addresses this gap by integrating predictive modeling with human-interpretable explainability.
SubHealthAI was created to fill that gap. It converts raw wearable and lifestyle data into structured early-warning signals that are explainable and auditable. The goal is not diagnosis, but timely awareness and preventive guidance.
2. System Overview
The system brings together data from wearables, lifestyle logs, and future lab reports.
- Inputs: heart rate, heart rate variability, resting heart rate, sleep duration, and daily activity.
- Processing: each metric is compared with the user’s personal baseline to detect anomalies or sustained changes.
- Outputs: a color-coded risk indicator, a short plain-language summary, and a clinician PDF that lists the main contributing factors.
SubHealthAI’s dashboard shows a weekly trend line, daily risk score, and a simple explanation of which patterns triggered the change. Each report includes a disclaimer stating that it is not diagnostic and should be interpreted under clinical oversight.
As shown in Figure 1, the system integrates ingestion, anomaly detection, forecasting, explainability, and audit logging.
Figure 2 details the data flow and report generation pipeline.
Figure 3 shows the dashboard view used to surface risk and explainability to users.
3. Technology Summary
SubHealthAI uses two lightweight machine learning models. The first detects anomalies in daily health metrics using an isolation forest. The second predicts the next day’s risk level using a small sequence model. Results are stored in a secure database with complete audit logs.
Each prediction is paired with an explainability chart that shows how features like sleep, heart rate, and activity influenced the score. Visuals are generated with SHAP and displayed on the dashboard and clinician report. All outputs and model versions are logged in the audit table for reproducibility and compliance. SHAP values provide per-feature contribution scores that explain each prediction in human-interpretable terms [2].
Figure 4 illustrates feature-level contributions to a sample prediction.
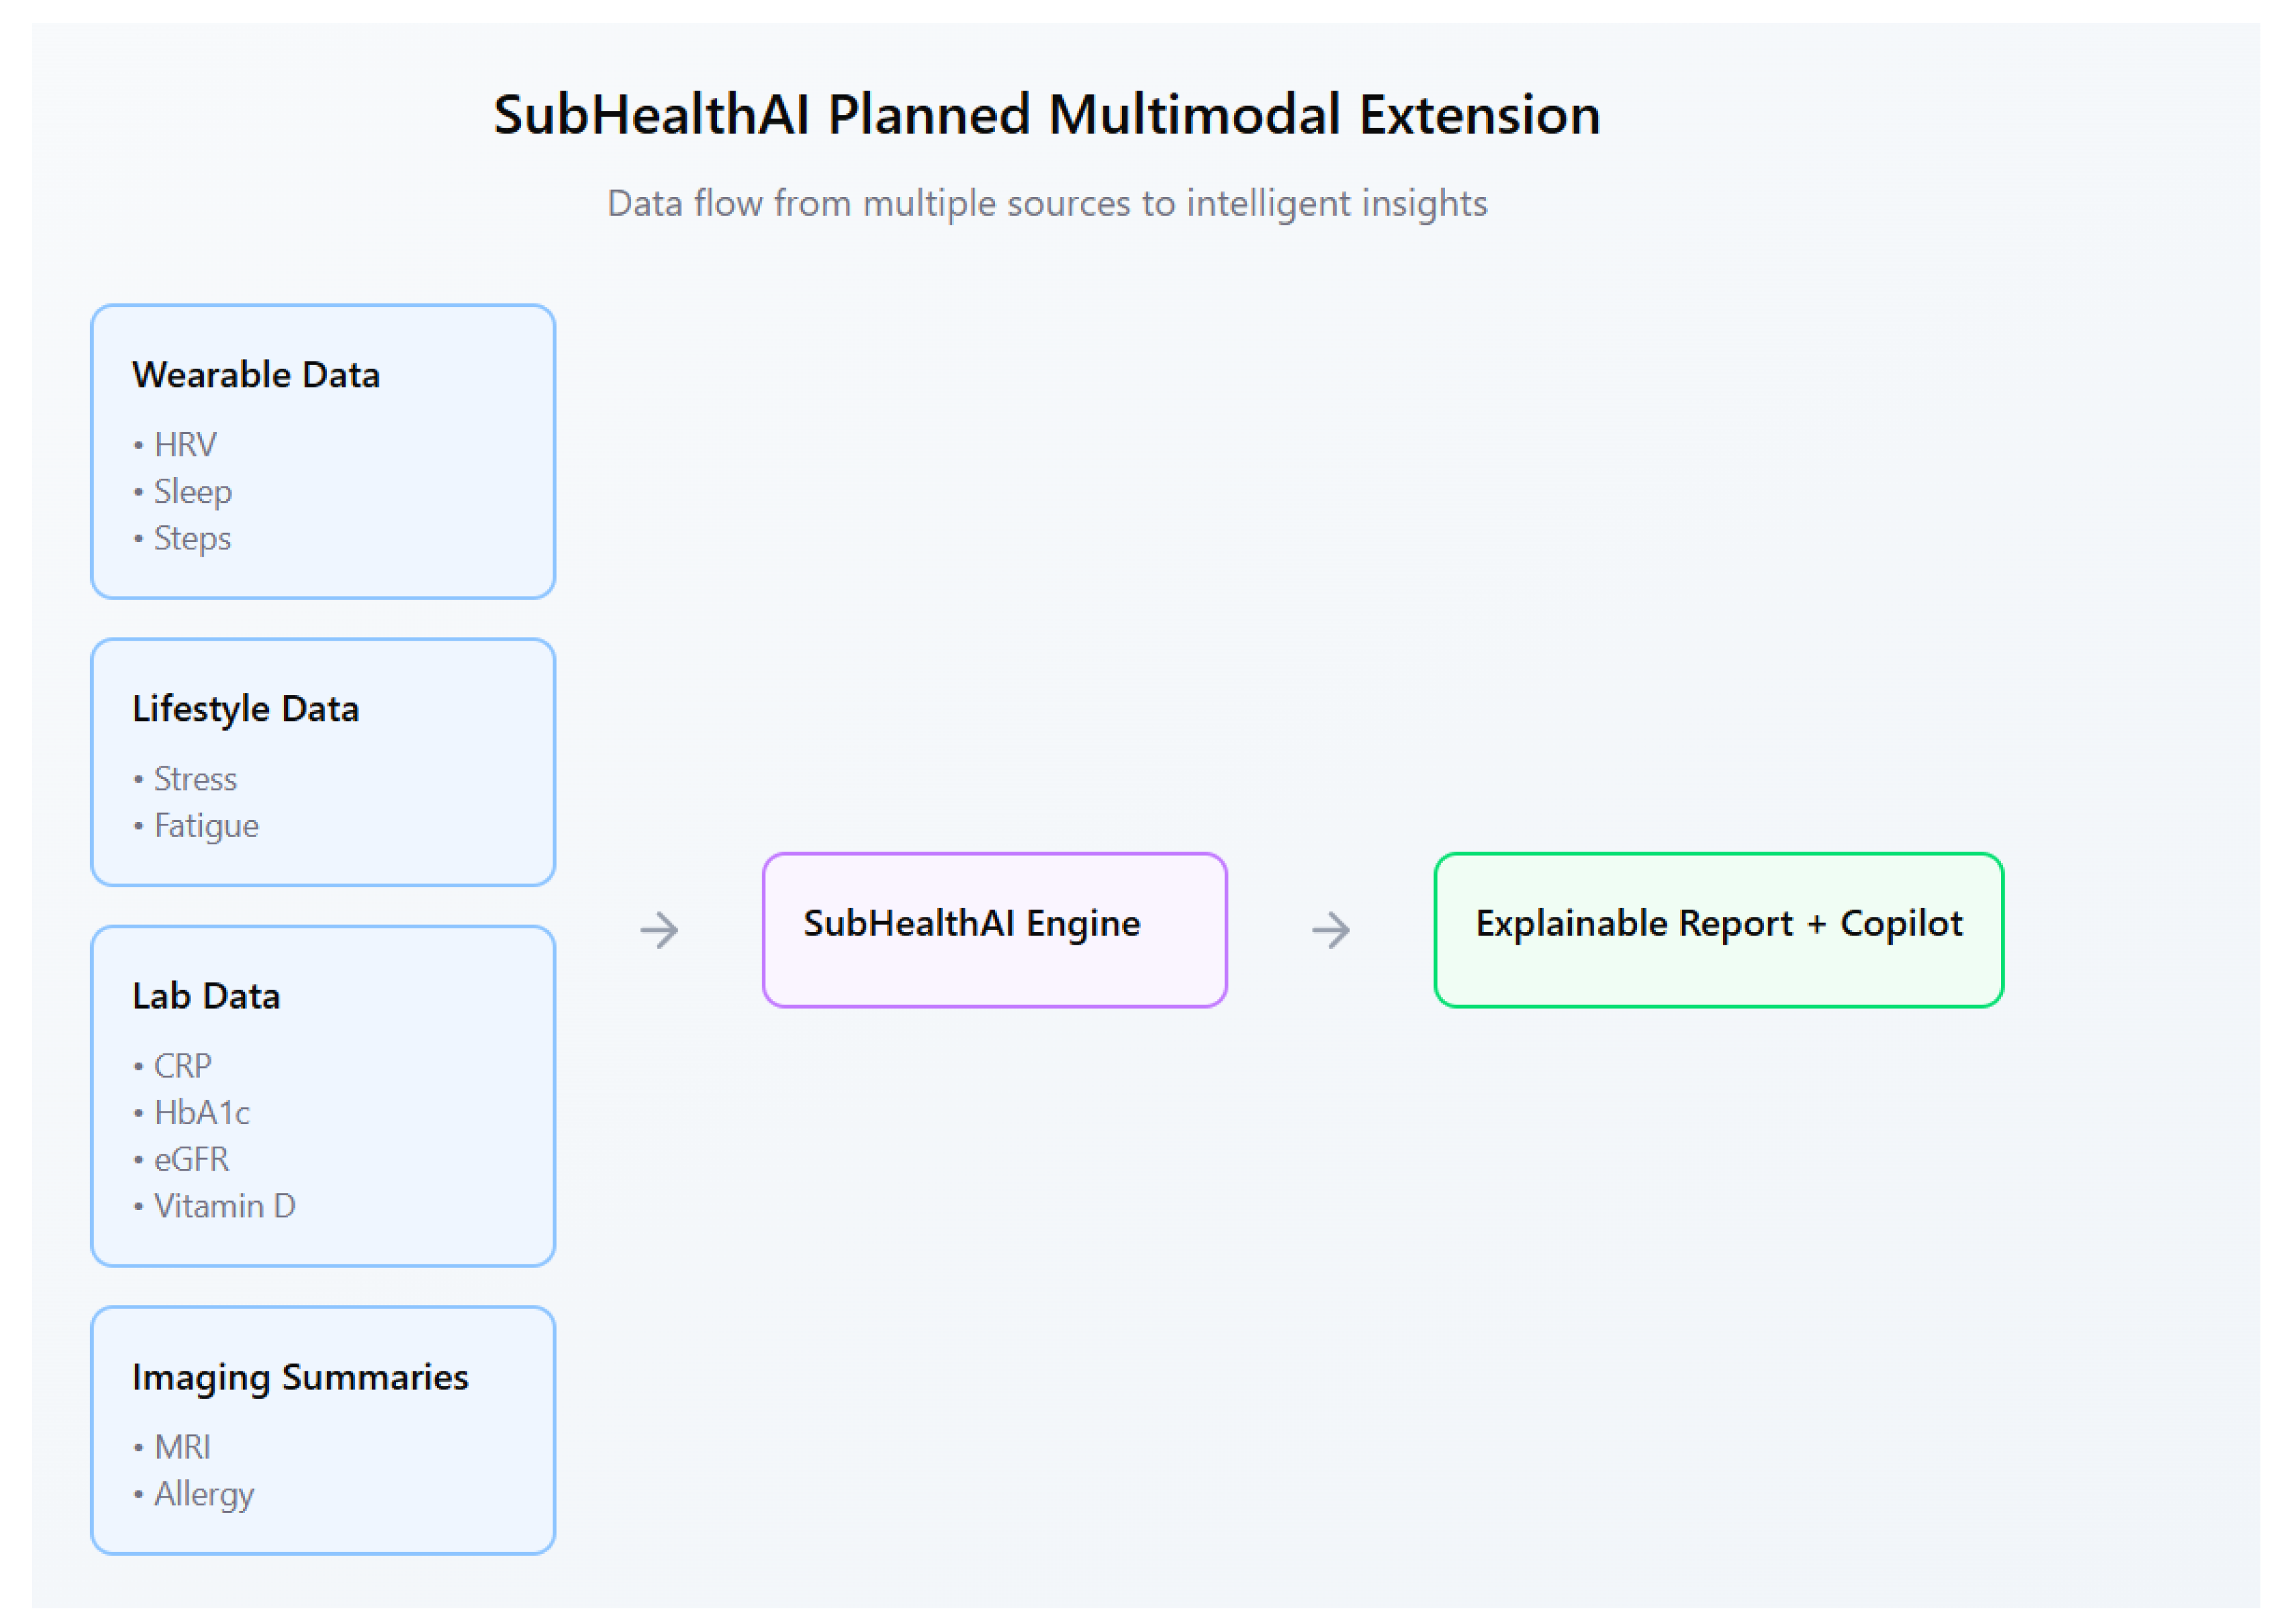
Future versions will include optional lab data such as C-reactive protein (CRP), hemoglobin A1c (HbA1c), and estimated glomerular filtration rate (eGFR) to detect inflammation or metabolic imbalance earlier. These values, combined with wearable trends, will help identify subtle health drift before a disease state appears.
4. Results
A test run using 14 days of simulated wearable data demonstrated stable risk calculations and consistent feature explanations. The system correctly flagged patterns such as low sleep, high resting heart rate, and reduced HRV, producing a clear risk summary with transparent reasoning. Explainability plots and clinician reports were stored securely for review and audit.
Figure 5 presents an example clinician-facing risk report generated by the pipeline.
4.1. Data and Preprocessing
We evaluated a 14-day prototype using synthetic wearable data modeled after patterns from open datasets (e.g., WESAD, MIMIC-IV). The dataset contained four core metrics—heart rate, HRV, sleep duration, and daily steps—augmented with Gaussian noise and time-warping to emulate realistic day-to-day variability. Features were normalized to z-scores; outliers were capped using interquartile range filtering; and rolling daily averages were computed to reduce noise.
4.2. Evaluation and Results
The Isolation Forest anomaly detector achieved precision and recall on simulated deviations from personal baselines. The GRU-based model achieved RMSE and MAE for next-day risk prediction on normalized scores. These preliminary results suggest stable behavior for surfacing early deviations with interpretable rationales while keeping the model lightweight and auditable.
5. Discussion
Most existing health tools focus on data tracking, not pattern interpretation. Apple Health, Fitbit, and WHOOP provide graphs but do not explain why changes occur or link them to actionable insights. Academic projects such as DeepPatient and BioWear predict health outcomes from electronic records but are not transparent or deployable for individual users.
SubHealthAI combines three elements that are rarely present together:
- Individualized baselines rather than population averages.
- Transparent explanations for each prediction.
- Compliance-ready audit logs and disclaimers.
This design makes it both practical for public use and safe for clinician oversight.
Most commercial health systems either prioritize consumer engagement or academic accuracy, but not explainable real-time inference. SubHealthAI bridges this divide by combining anomaly detection, short-horizon forecasting, and transparent SHAP visualization into a single preventive-care workflow.
While these results are based on synthetic data, they validate the core design principles of the system: interpretable anomaly detection, short-horizon forecasting, and auditable reporting. Future validation will use larger real-world datasets (e.g., MIMIC-IV, UK Biobank) and compare against baselines such as LSTM, ARIMA, and Prophet to quantify incremental value over standard time-series approaches.
6. Public Health Impact
If scaled nationally, SubHealthAI could support earlier interventions and reduce the long-term cost of chronic disease. Even a small percentage reduction in delayed diagnoses would save billions in healthcare spending each year.
The project aligns with current priorities of the U.S. Department of Health and Human Services (HHS), the Centers for Disease Control and Prevention (CDC), and the National Institutes of Health (NIH), which emphasize preventive care and digital health innovation.
By providing explainable, privacy-respecting early warnings, SubHealthAI directly supports these public health goals. The explainability-first design also aligns with ongoing federal emphasis on transparency and accountability in AI-enabled health tools.
SubHealthAI is designed as a low-cost, cloud-deployable model that could integrate into digital health programs under HHS preventive-care grants or NIH pilot frameworks.
7. Future Work
Planned features include:
- A refined architecture (Figure 1) including a Preventive Copilot LLM and multimodal lab/imaging extensions.
- Integration of lab data such as urinalysis, lipid panels, and vitamin D levels.
- Support for allergy reports and imaging summaries (e.g., MRI findings).
- A conversational assistant that helps users interpret results in natural language.
- Federated learning for private, personalized model updates.
We will integrate a lightweight agentic LLM copilot using minimal-chat orchestration (streaming prefill/decode with KV-cache), JSON tool contracts for safe calls to scoring/SHAP routines, and sandbox guardrails. The explainability UI will evolve from static plots to dynamic, WHOOP/Apple-style health graphs. Additional modalities (medication, jet lag, circadian disruption) will be incorporated to improve temporal context and personalization.
Figure 6 outlines the planned multimodal extension.
Disclaimer
This system is not diagnostic and should be interpreted under clinical oversight.
Appendix A. Model Card for SubHealthAI
- Model Purpose
Detect subclinical physiological changes and surface early-warning signals for preventive review. Designed for research and clinician-assisted use. This model is not diagnostic and should be interpreted under clinical supervision.
- Inputs
- Wearable data: heart rate (HR), heart-rate variability (HRV), resting HR, sleep duration, step count.
- Lifestyle inputs: self-reported stress, fatigue, irregular schedules.
- Optional labs: C-reactive protein (CRP), hemoglobin A1c (HbA1c), estimated glomerular filtration rate (eGFR), vitamin D.
- Optional imaging summaries: MRI findings, allergy or radiology reports.
- Outputs
- Daily risk score (0–1) indicating anomaly relative to personal baseline.
- Next-day forecasted risk (GRU-based model).
- SHAP explainability plot and rationale text.
- Weekly plain-language note and clinician PDF report.
- Algorithms and Architecture
- Anomaly detection: Isolation Forest (scikit-learn).
- Forecasting: GRU time-series model (PyTorch).
- Explainability: Linear surrogate + SHAP feature attribution.
- LLM copilot: GPT-based summarizer for natural-language explanations.
- Database: Supabase (PostgreSQL) with audit log and row-level security.
- Evaluation
Tested on a 14-day synthetic wearable dataset. Isolation Forest precision , recall ; GRU RMSE , MAE on normalized risk.
- Availability
Implementation and evaluation scripts will be released with the public repository; interim materials are available upon request.
- Guardrails and Compliance
- End-to-end encryption and per-user Row Level Security.
- Versioned model IDs stored in audit_log.
- Disclaimers embedded in all reports.
- HIPAA-aligned privacy design; no PHI in public storage.
- Transparency via downloadable PDF reports and explainability plots.
- Known Limitations
- Evaluation limited to demonstration dataset; not yet clinically validated.
- Possible false positives during short data windows or missing values.
- Lab and imaging integration in progress.
- Future versions will include federated learning for privacy-preserving personalization.
References
- Centers for Disease Control and Prevention (CDC). National Center for Chronic Disease Prevention and Health Promotion, 2023.
- Scott M. Lundberg and Su-In Lee. A unified approach to interpreting model predictions. In Advances in Neural Information Processing Systems (NeurIPS), 2017.
- Y. Li et al. Explainable time-series anomaly detection in physiological data. IEEE Transactions on Neural Networks and Learning Systems, 2021.
- E. Choi et al. GRU-based multimodal health forecasting. NPJ Digital Medicine, 2022.
- P. Schmidt et al. WESAD: A multimodal dataset for wearable stress and affect detection. In UbiComp, 2018.
- Alistair E. W. Johnson et al. MIMIC-IV: A freely accessible electronic health record dataset. Scientific Data, 2021. [CrossRef]
Figure 1.
Architecture Overview: Shows the end-to-end system architecture, including data ingestion, ML layers, Copilot explainability, and audit logging components.
Figure 1.
Architecture Overview: Shows the end-to-end system architecture, including data ingestion, ML layers, Copilot explainability, and audit logging components.
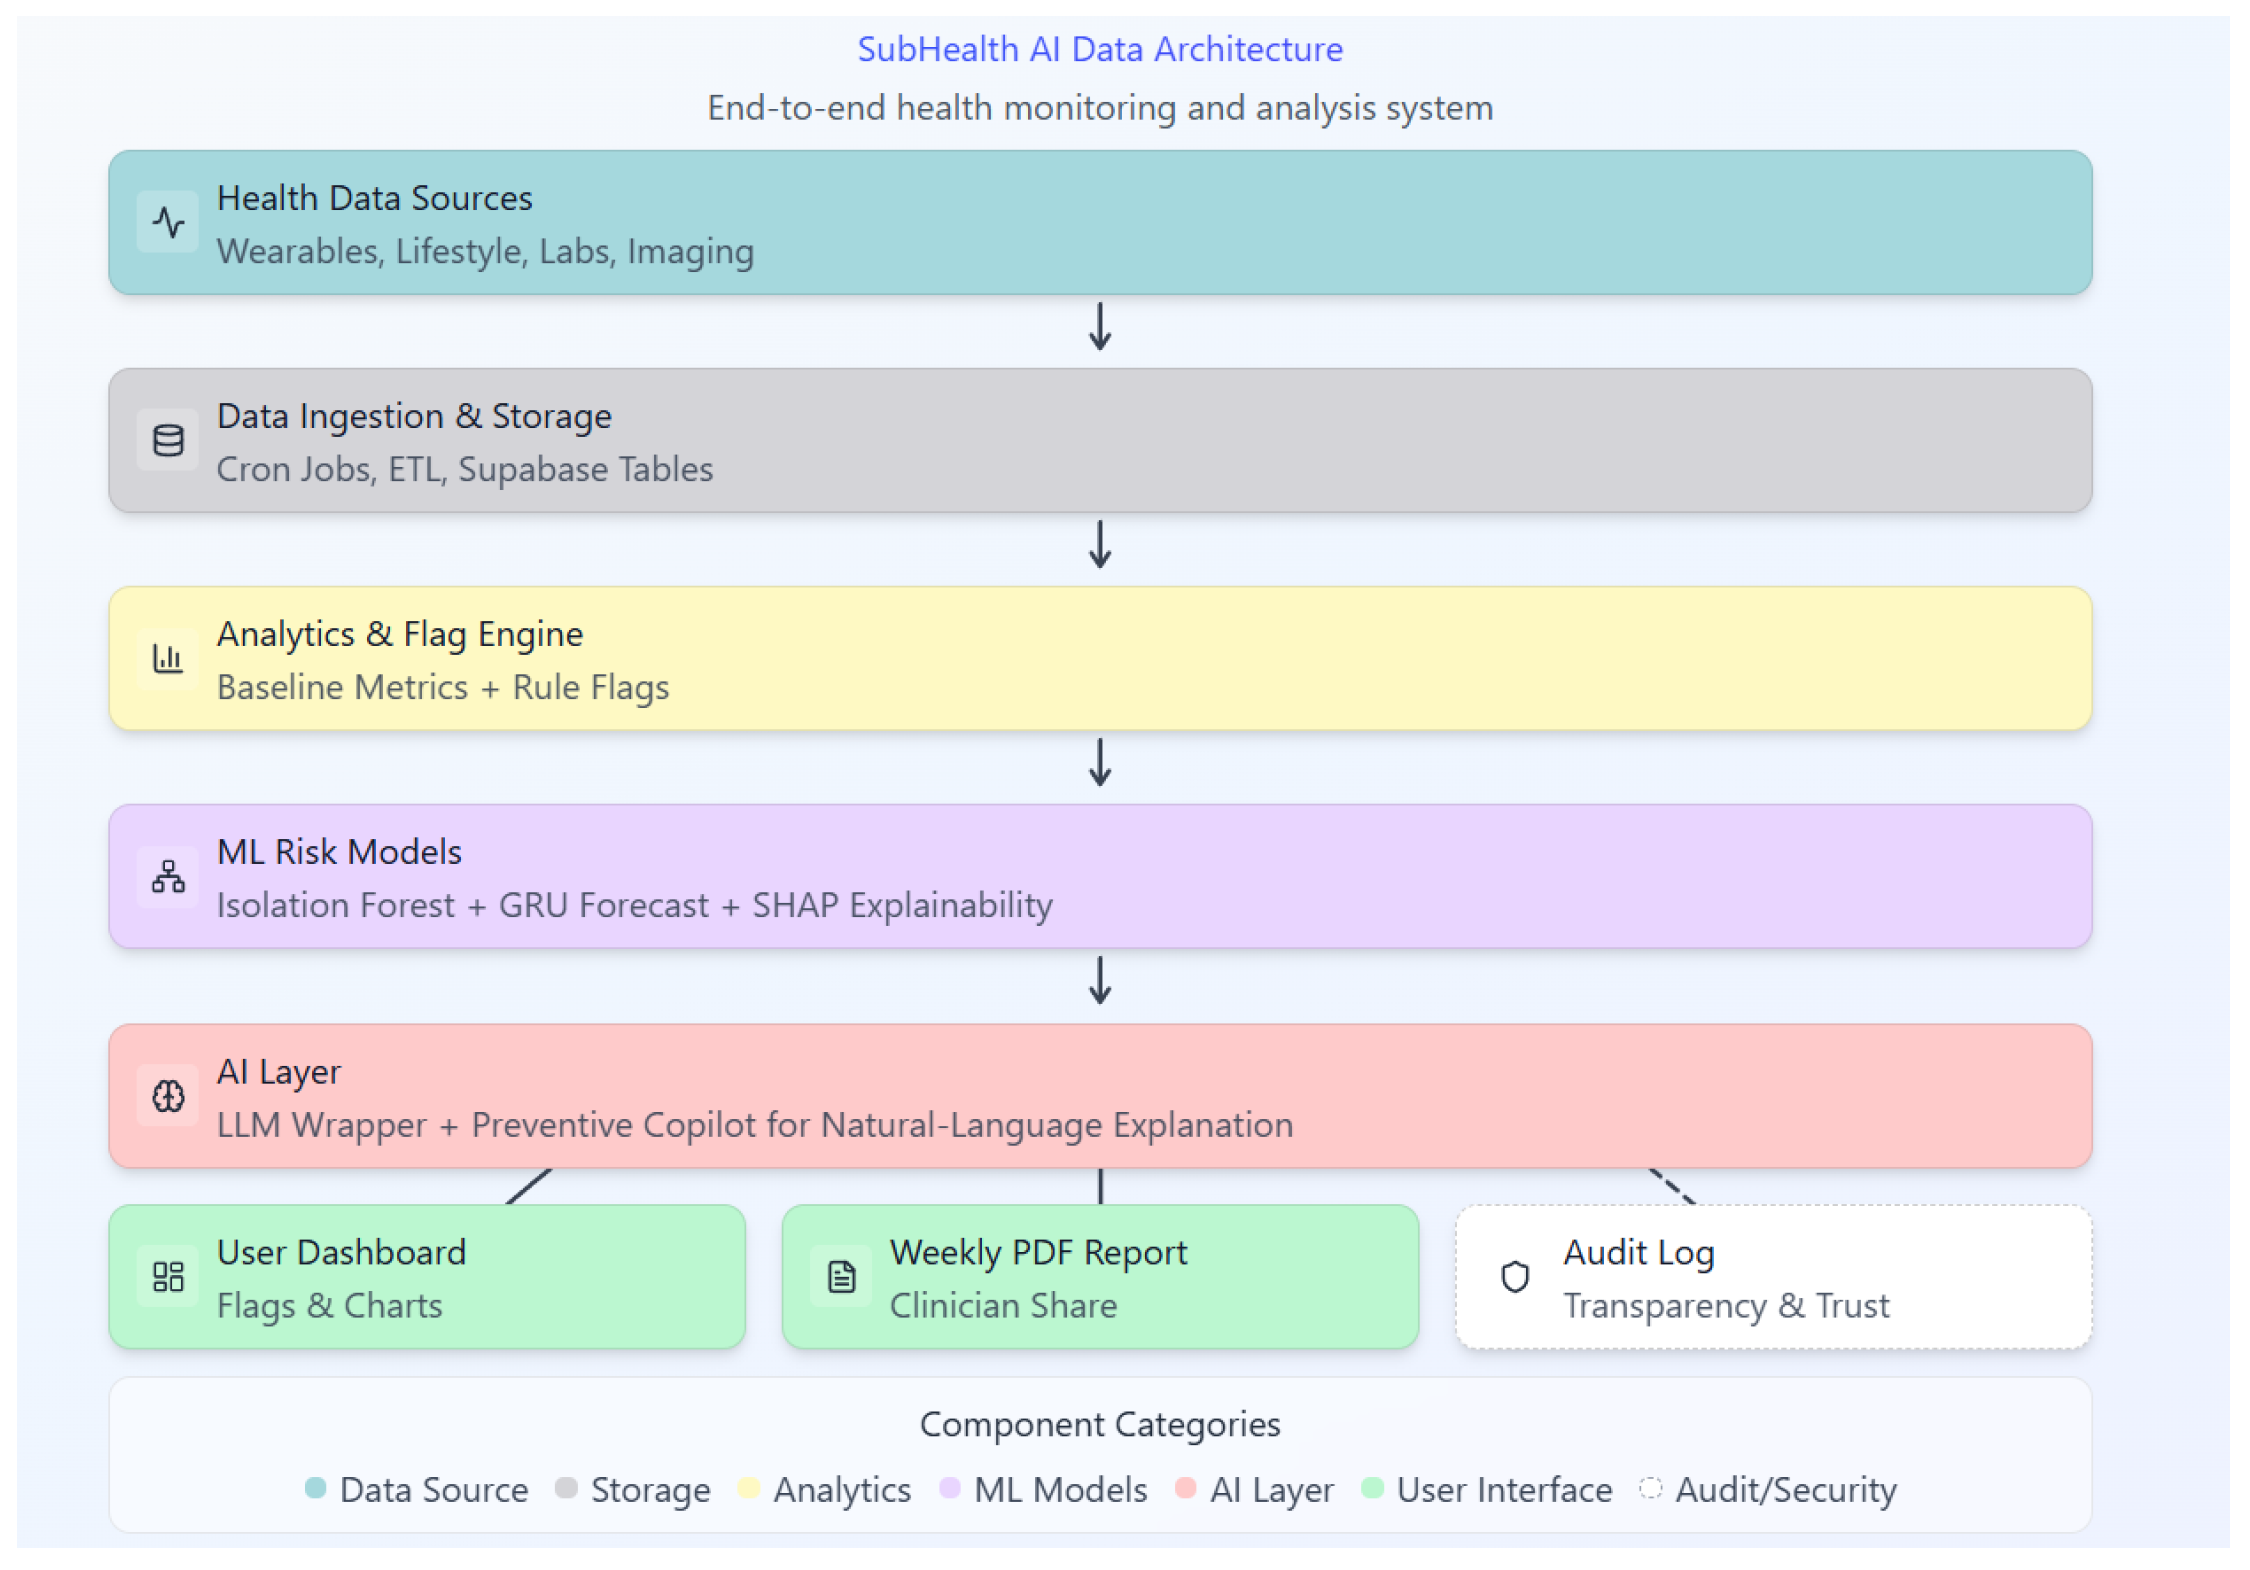
Figure 2.
Data Flow and Report Generation Process: pipeline from inputs and ETL through anomaly detection, forecasting, SHAP explainability, and report/audit outputs.
Figure 2.
Data Flow and Report Generation Process: pipeline from inputs and ETL through anomaly detection, forecasting, SHAP explainability, and report/audit outputs.
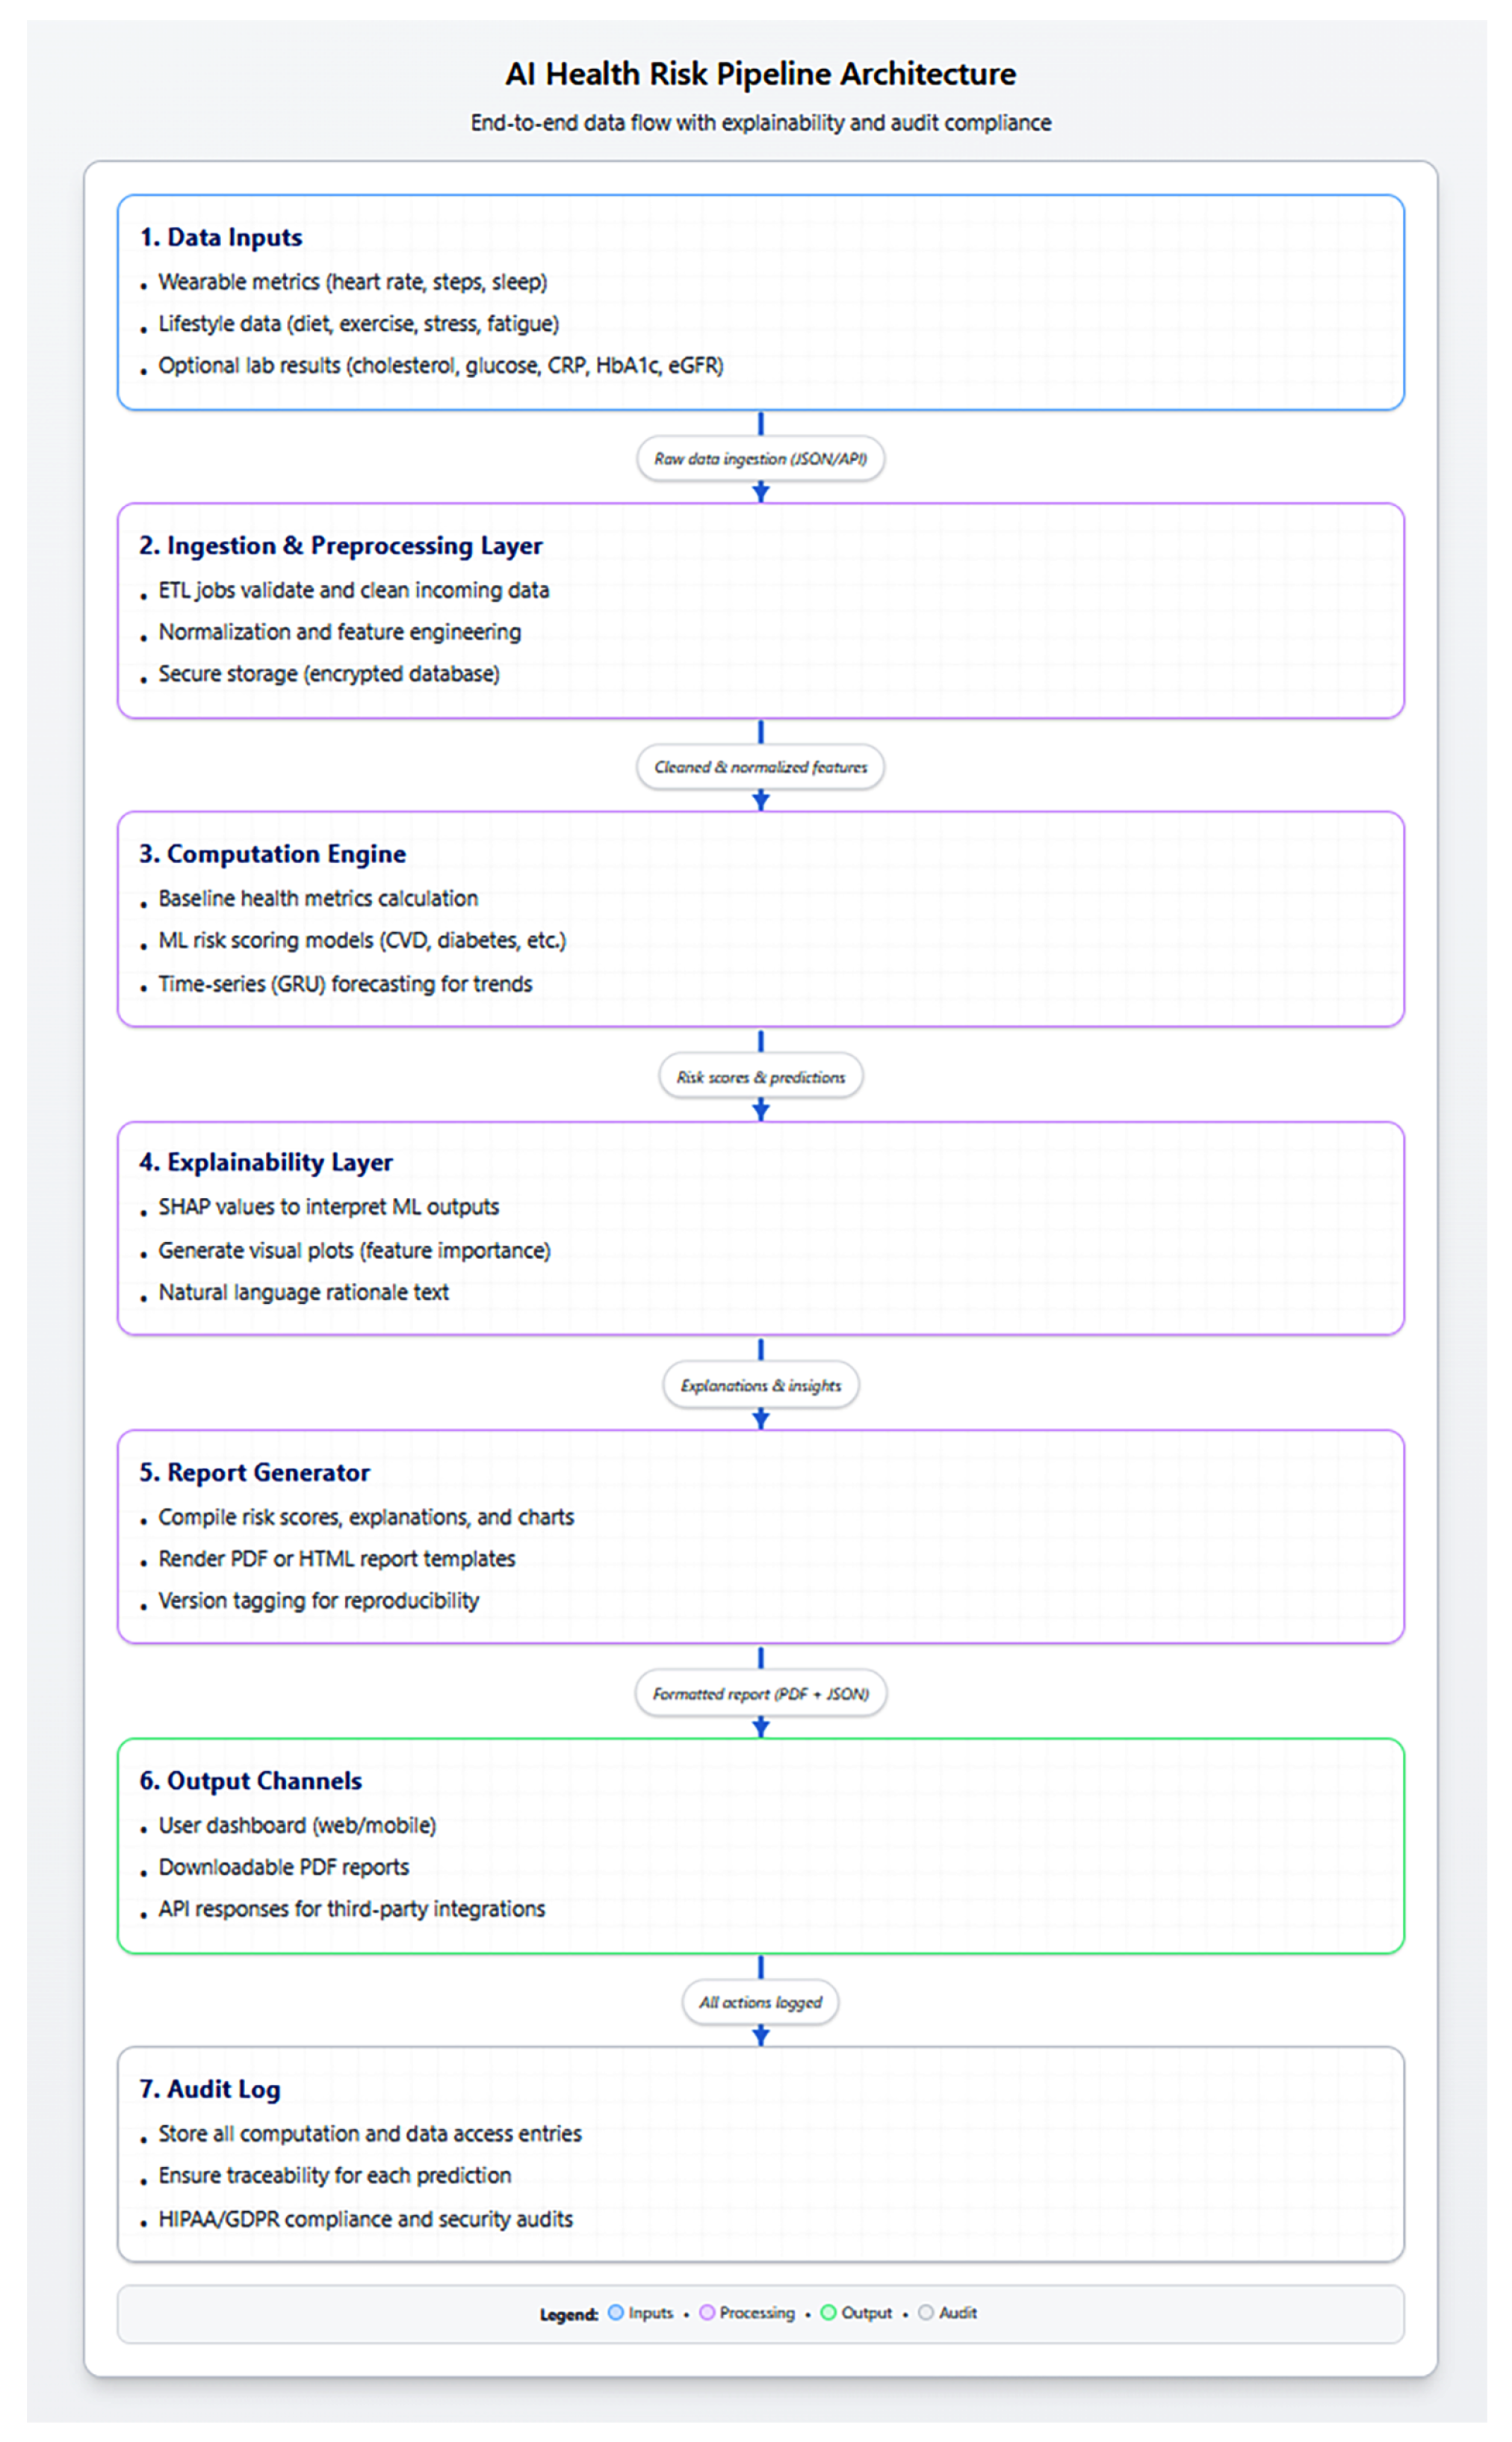
Figure 3.
Dashboard View: displays the user interface for daily risk visualization, explainability insights, and metric trends.
Figure 3.
Dashboard View: displays the user interface for daily risk visualization, explainability insights, and metric trends.
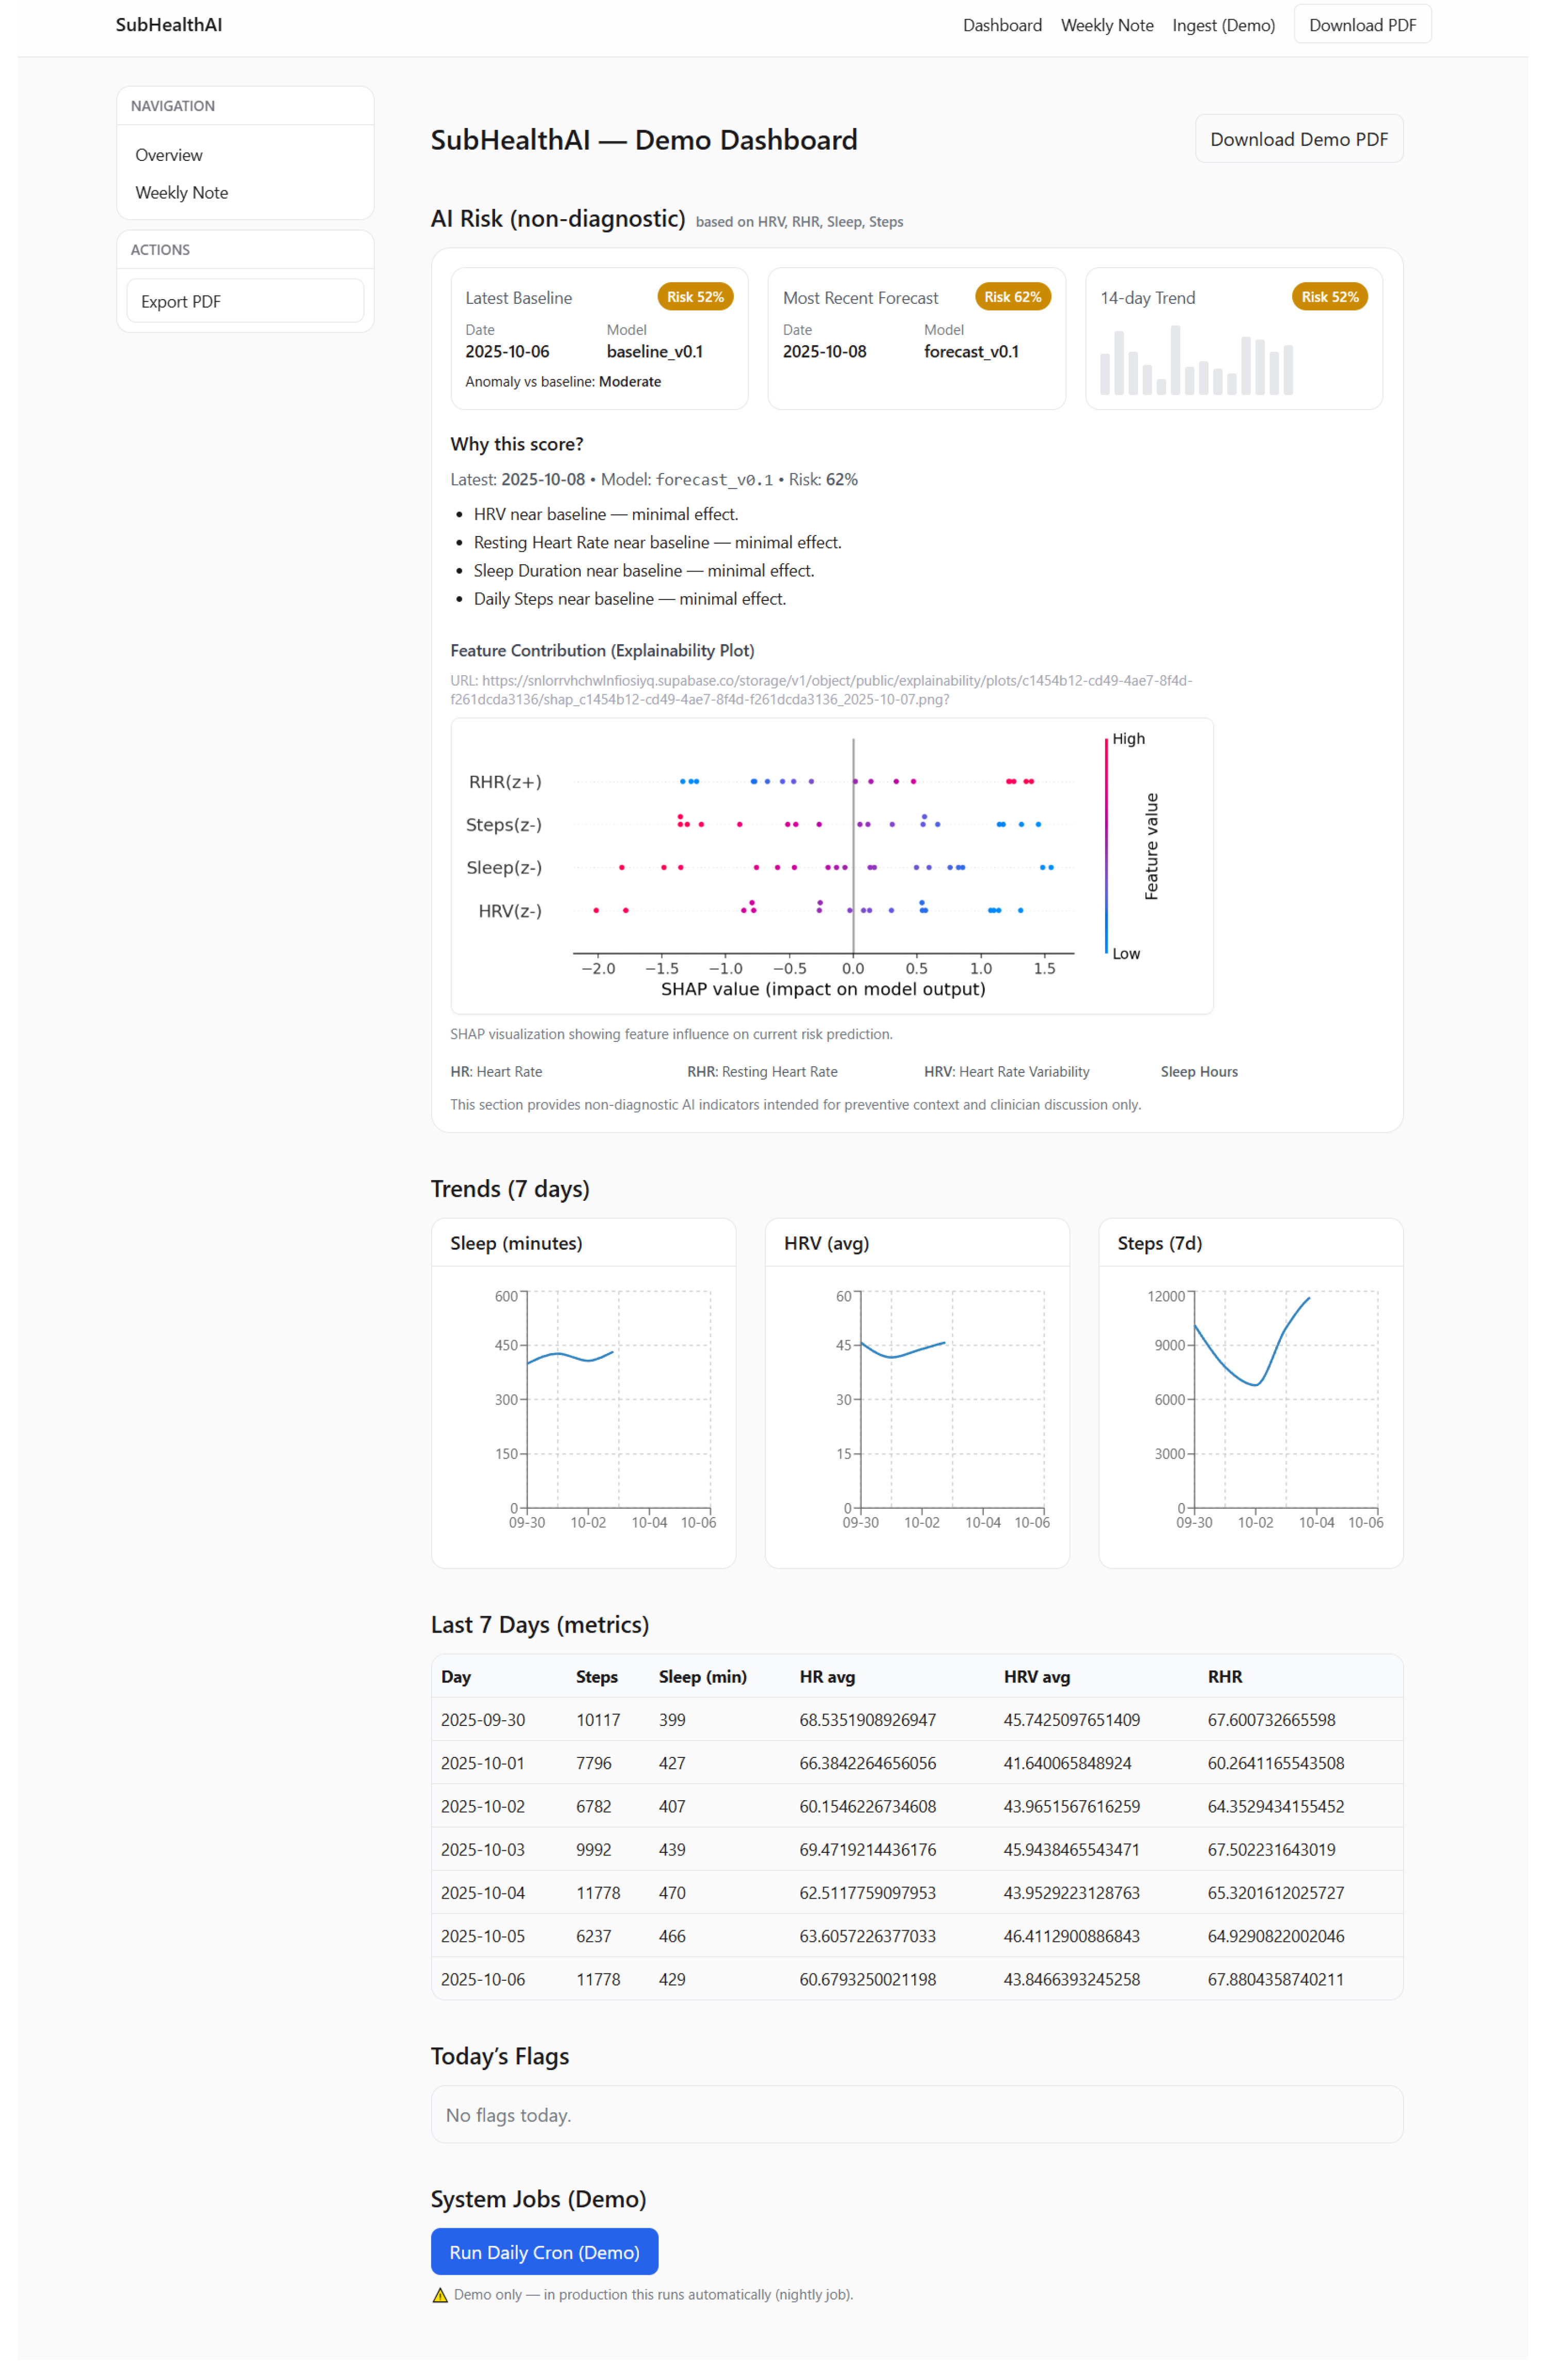
Figure 4.
Explainability Example: SHAP feature attributions (x-axis: SHAP value, impact on risk; y-axis: features; color: normalized feature value - red = high, blue = low).
Figure 4.
Explainability Example: SHAP feature attributions (x-axis: SHAP value, impact on risk; y-axis: features; color: normalized feature value - red = high, blue = low).
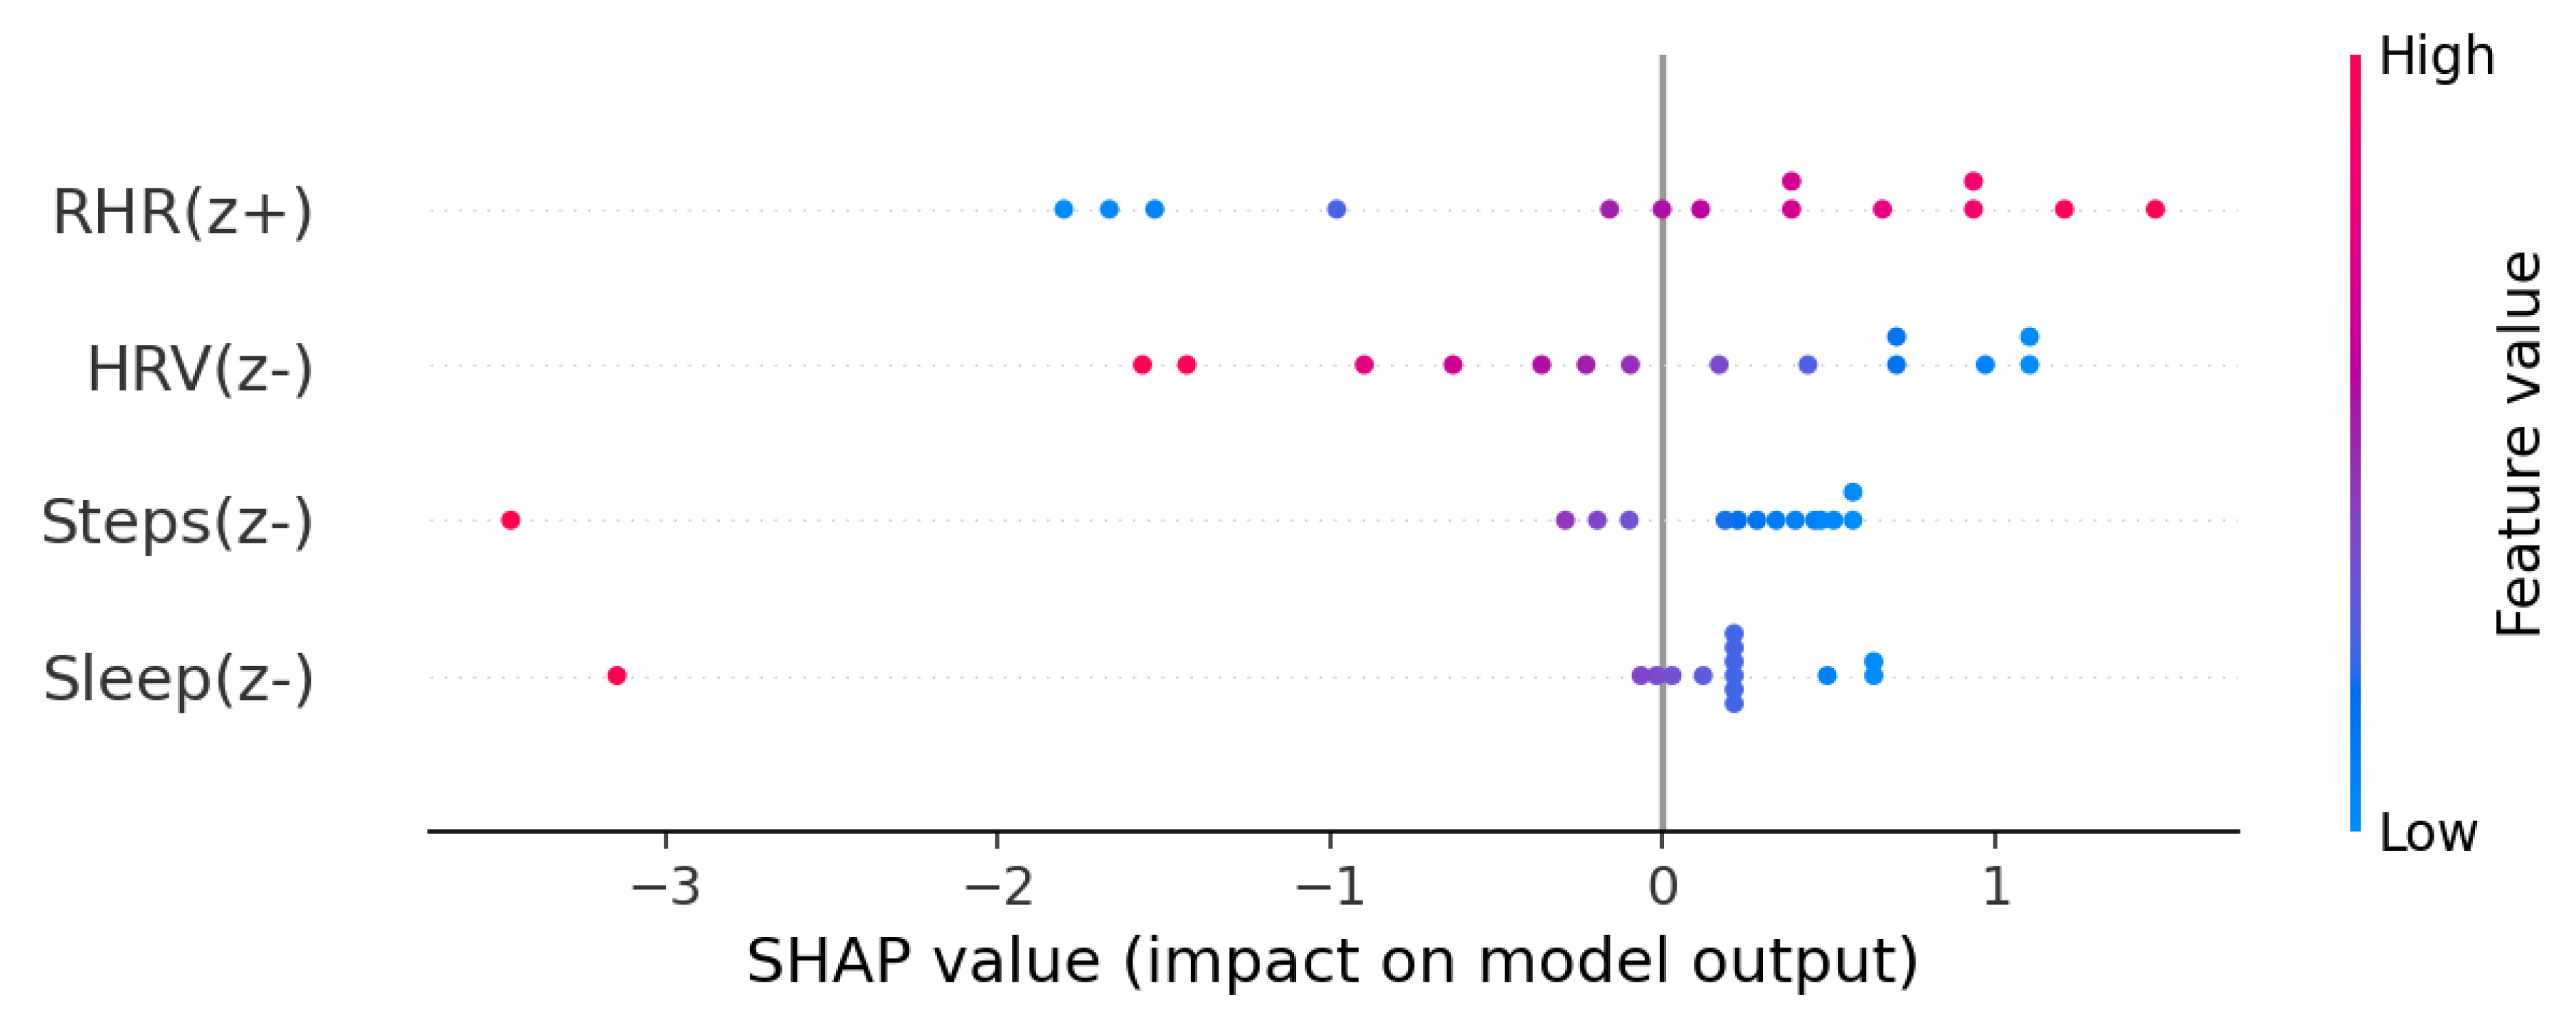
Figure 5.
Risk Report PDF Example: illustrates the automatically generated clinician-facing report summarizing AI risk scores, rationale, and key health metrics.
Figure 5.
Risk Report PDF Example: illustrates the automatically generated clinician-facing report summarizing AI risk scores, rationale, and key health metrics.
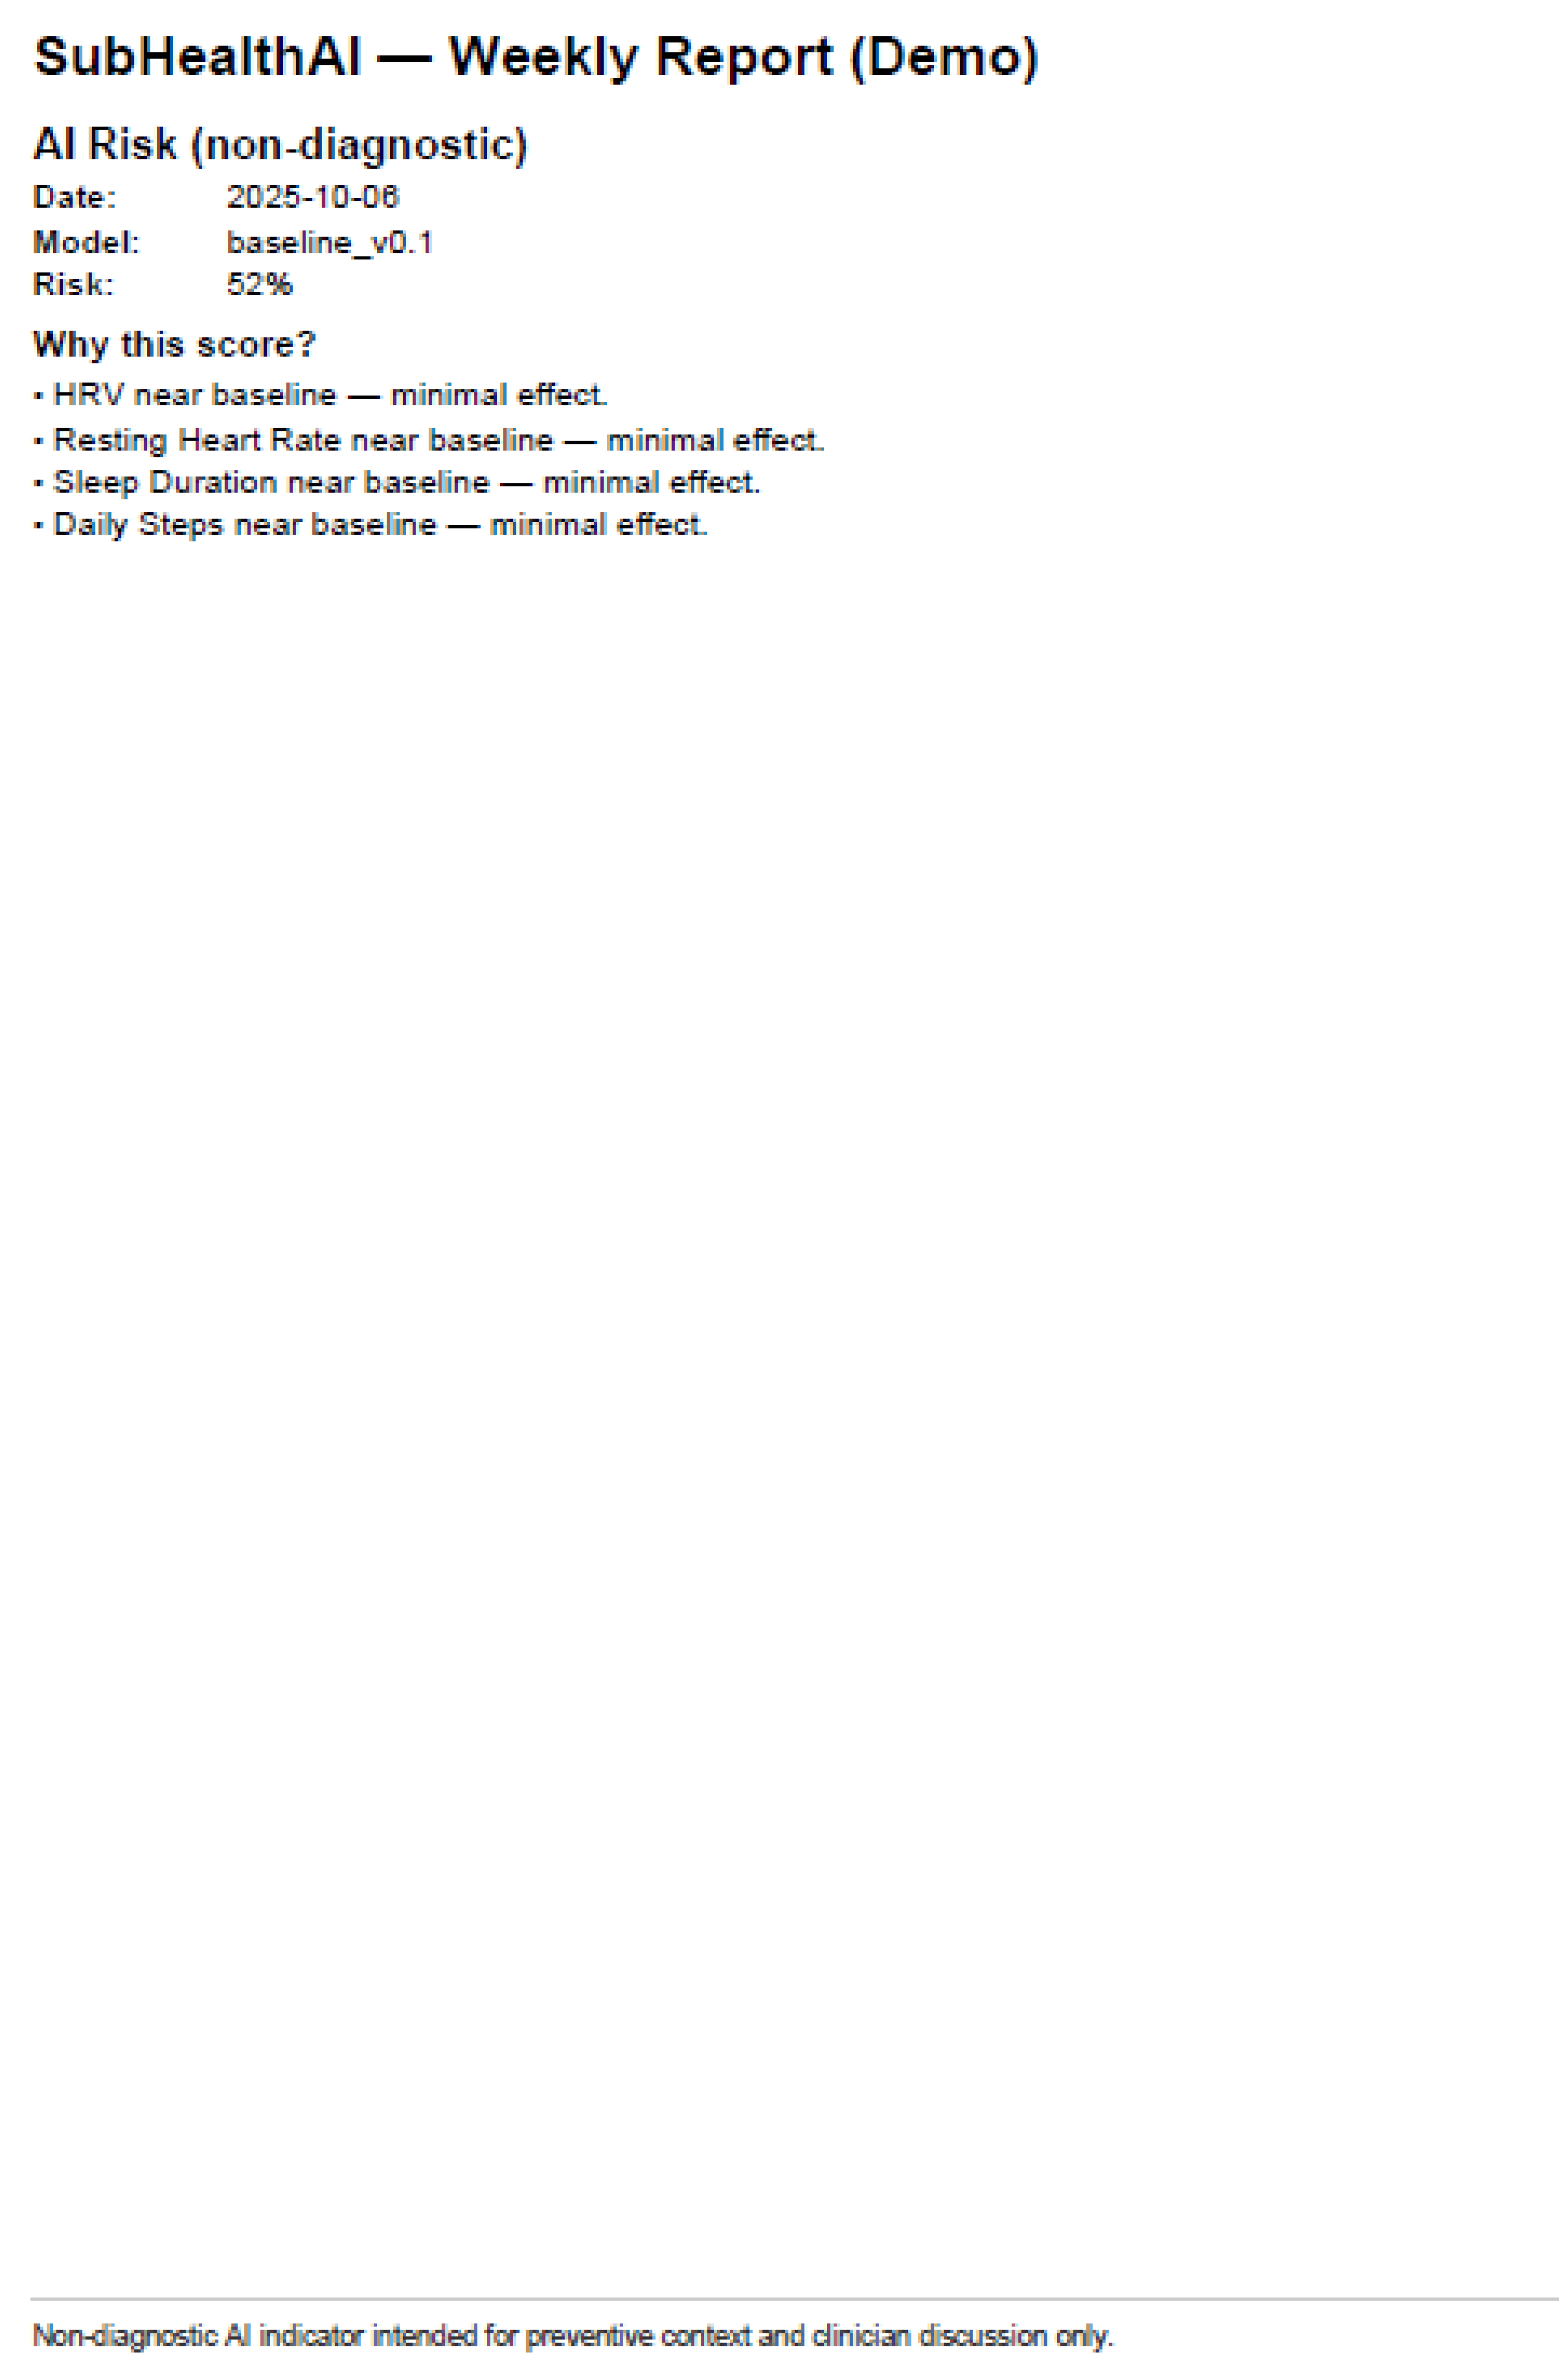
Figure 6.
Planned Multimodal Extension: future integration of wearable, lab, and imaging modalities for improved prediction and personalization.
Figure 6.
Planned Multimodal Extension: future integration of wearable, lab, and imaging modalities for improved prediction and personalization.
Disclaimer/Publisher’s Note: The statements, opinions and data contained in all publications are solely those of the individual author(s) and contributor(s) and not of MDPI and/or the editor(s). MDPI and/or the editor(s) disclaim responsibility for any injury to people or property resulting from any ideas, methods, instructions or products referred to in the content. |
© 2025 by the authors. Licensee MDPI, Basel, Switzerland. This article is an open access article distributed under the terms and conditions of the Creative Commons Attribution (CC BY) license (http://creativecommons.org/licenses/by/4.0/).
Copyright: This open access article is published under a Creative Commons CC BY 4.0 license, which permit the free download, distribution, and reuse, provided that the author and preprint are cited in any reuse.


