Submitted:
03 November 2025
Posted:
04 November 2025
You are already at the latest version
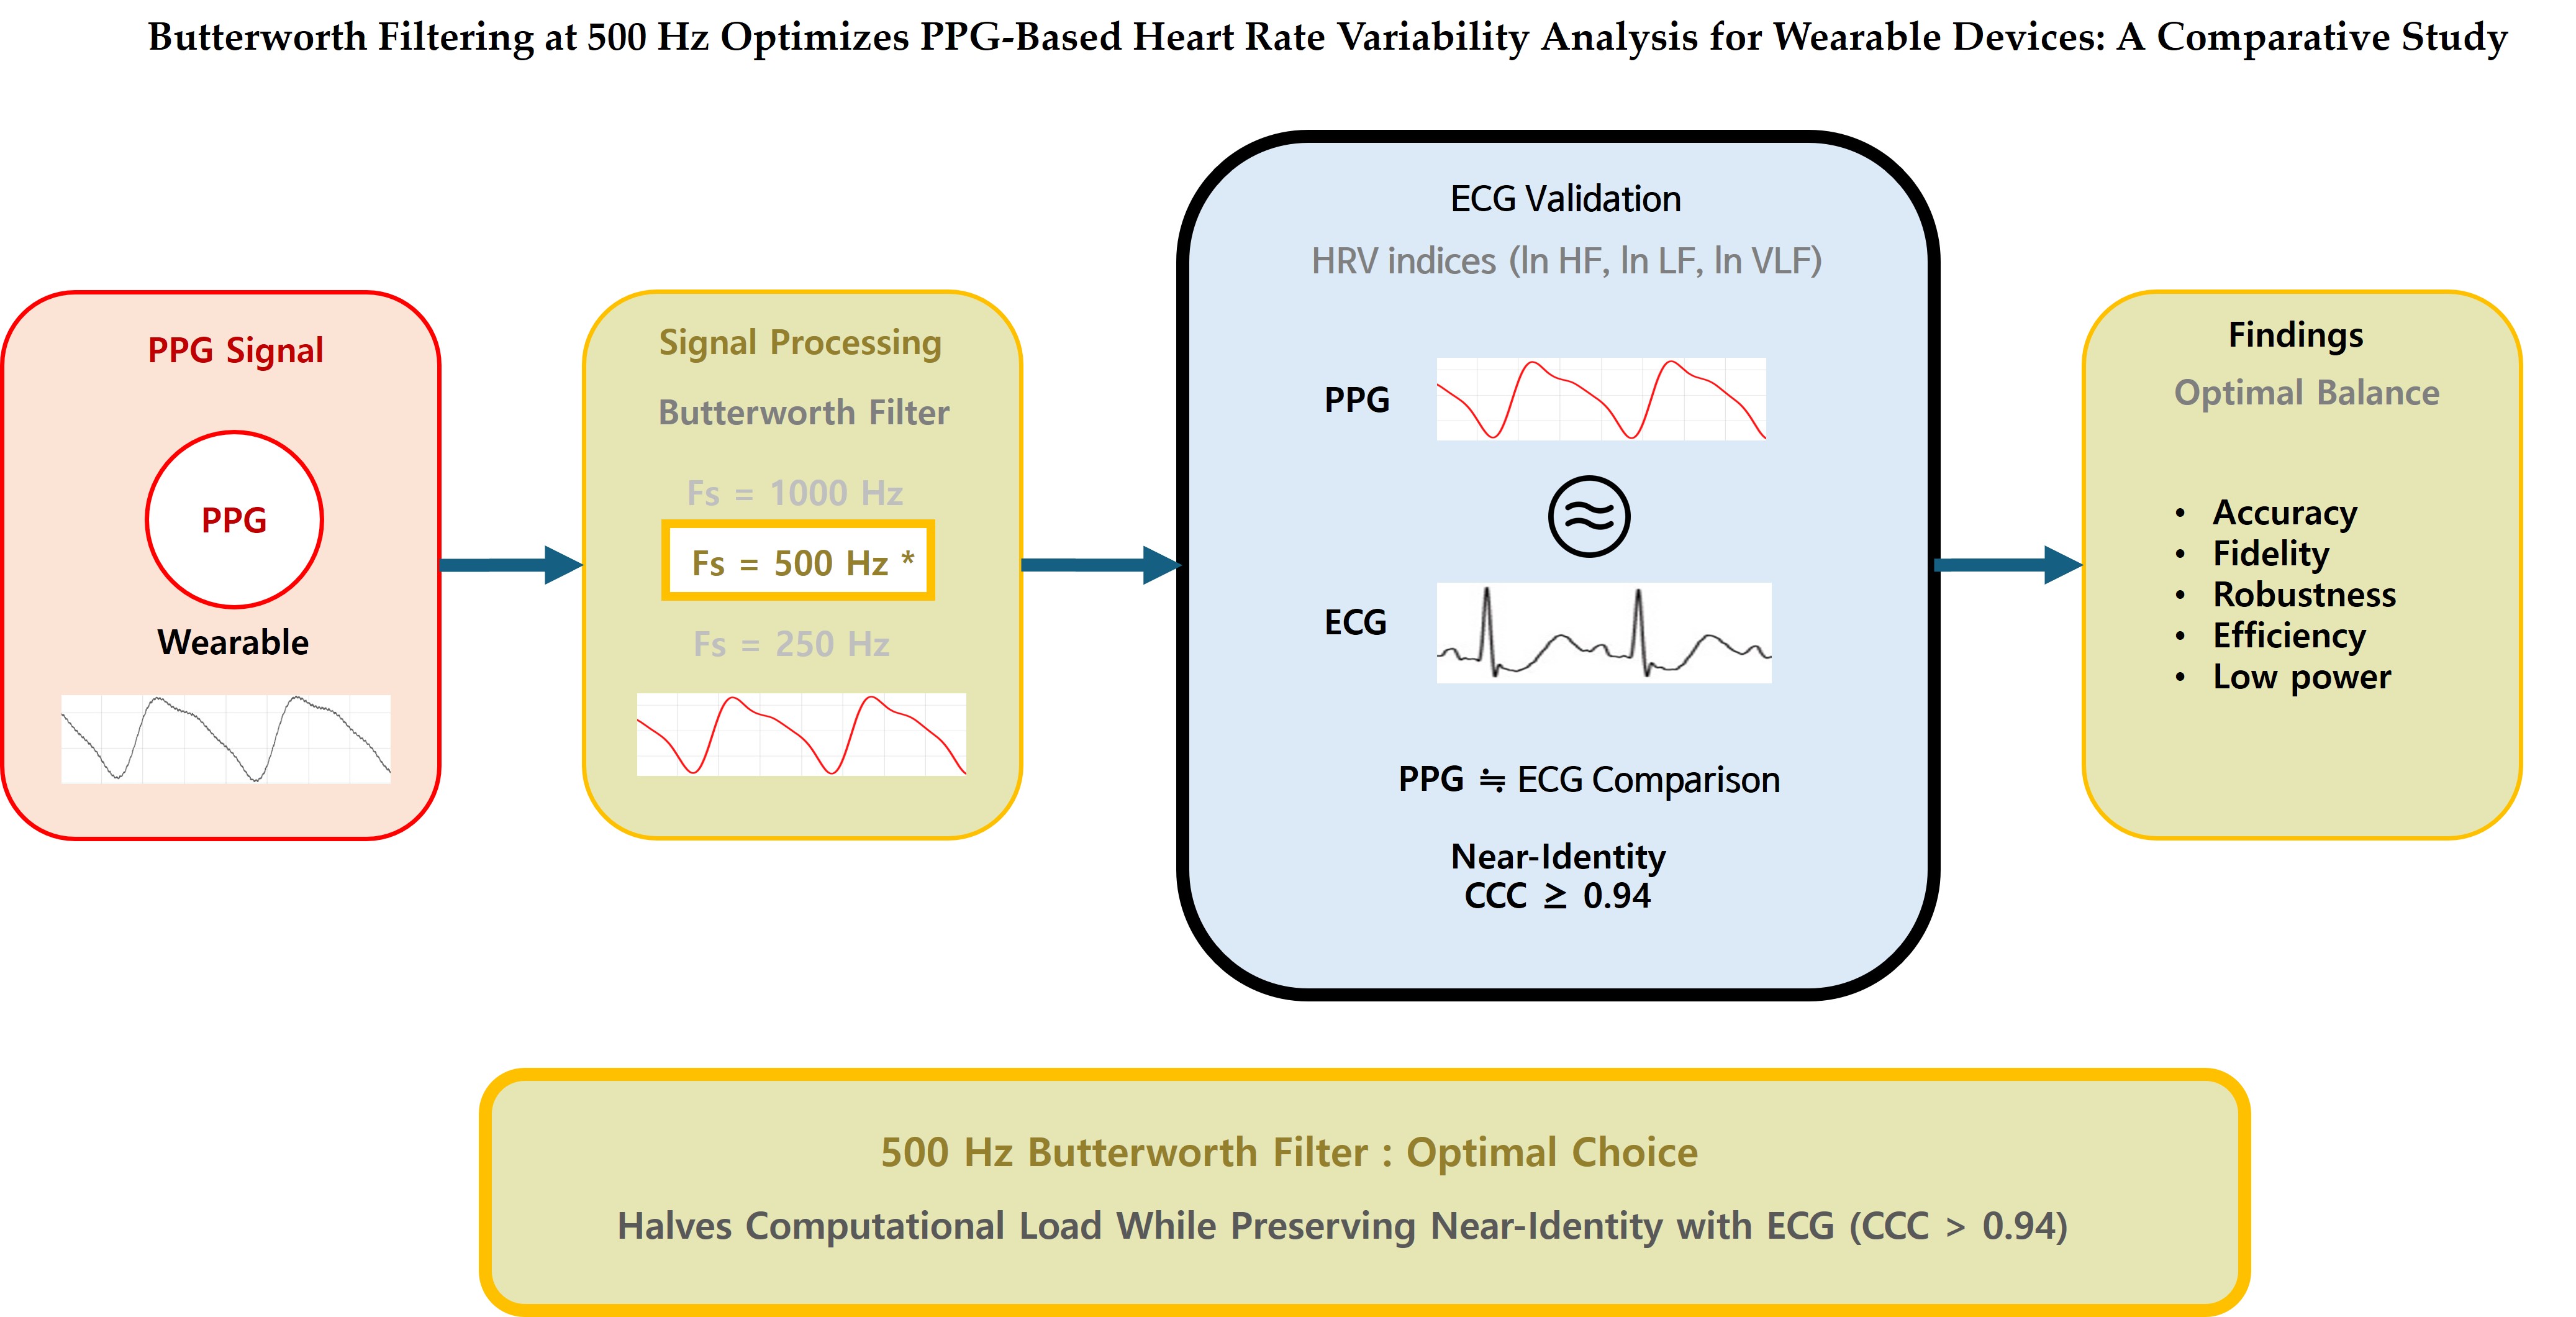
Abstract
Photoplethysmography (PPG)-based heart rate variability (HRV) offers a cost-effective al-ternative to electrocardiography (ECG) for autonomic monitoring in wearable devices. We optimized signal processing on a 16-bit microcontroller by comparing 4th-order equiva-lent Butterworth and Elliptic IIR bandpass filters (0.8–20 Hz, zero-phase) at 1000, 500, and 250 Hz. Paired PPG–ECG recordings from 10 healthy adults were analyzed for ln HF, ln LF, and ln VLF using Lin’s concordance correlation coefficient (CCC), ±5% equivalence testing (TOST), and Passing–Bablok regression (PBR). Butterworth at 500 Hz preserved near-identity with ECG standard (CCC ≥ 0.94; TOST met equivalence; PBR slopes/intercepts: ln HF = 0.97x + 0.10, ln LF = 1.02x − 0.07, ln VLF = 1.01x − 0.03), while halving computational load. In contrast, Elliptic at 250 Hz degraded concordance (CCC ≈ 0.64) and failed equivalence, with greater bias from nonlinear phase and ripple-induced distortion. Elliptic performance improved at higher sampling but offered no benefit over Butterworth. These results support zero-phase Butterworth filtering at ≥500 Hz as the op-timal balance of fidelity, robustness, and efficiency, enabling reliable PPG-HRV monitor-ing on low-power devices. As a pilot investigation (n=10), this study establishes prelimi-nary design parameters and optimal configurations to guide subsequent large-scale clin-ical validation.
Keywords:
heart rate variability
; photoplethysmography
; IIR filters
; Butterworth filter
; Elliptic filter
; signal processing
1. Introduction
Heart rate variability (HRV) constitutes a recognized non-invasive metric of autonomic nervous system (ANS) function, widely adopted to assess cardiovascular health, stress, and disease progression in both clinical and ambulatory settings [1,2]. While electrocardiography (ECG) remains the traditional reference for HRV analysis, photoplethysmography (PPG) has emerged as an attractive alternative due to its integration into wearable devices, cost-effectiveness, and convenience [3,4]. By detecting pulsatile blood volume changes through optical sensors, PPG enables continuous monitoring without electrodes [5]. However, PPG signals exhibit high susceptibility to motion-induced artifacts, baseline drift, and waveform variability, which complicate peak detection and frequency-domain analysis [6,7].
Robust signal preprocessing is essential to ensure reliable PPG-derived HRV. Bandpass filtering is particularly critical, as the filter design directly influences spectral fidelity, artifact resistance, and computational feasibility in embedded systems. Butterworth filters provide a maximally flat passband (<0.1 dB ripple), preserving waveform integrity, whereas Elliptic filters achieve sharper transitions at the expense of nonlinear phase response and up to 1 dB ripple, which may distort HRV indices [8,9,10]. Furthermore, although ECG guidelines suggest 250–500 Hz sampling for accurate R-peak detection, PPG often requires higher sampling frequencies to avoid aliasing and preserve high-frequency (HF) spectral components [11,12].
Recent studies have investigated optimal sampling frequencies for PPG-based HRV analysis. Béres et al. [13] demonstrated that sampling frequencies as low as 20-50 Hz can be sufficient for time-domain HRV parameters (SDNN, RMSSD) when combined with interpolation techniques. However, their study did not systematically evaluate the effects of filter characteristics or focus on frequency-domain parameters, which are critical for autonomic function assessment. Furthermore, real-time wearable applications often require processing without post-hoc interpolation to minimize computational overhead. The present study extends this line of research by comparing filter types (Butterworth vs Elliptic) across multiple sampling frequencies (1000, 500, 250 Hz) with direct ECG validation, focusing on frequency-domain HRV indices.
Our previous work [14,15] compared Butterworth and Elliptic filters for PPG-based HRV analysis, demonstrating that Butterworth filters yielded more stable NN interval extraction. However, that study did not systematically evaluate the effects of sampling frequency on filter performance, nor did it employ direct PPG-ECG comparison with multiple statistical validation methods. These results highlighted the need for a comprehensive comparison of filtering strategies across multiple sampling rates (1000, 500, 250 Hz), incorporating frequency-response and pole–zero analyses, together with rigorous statistical validation against simultaneously recorded ECG-derived references.
Despite the growing adoption of PPG-based wearables, there remains a lack of evidence-based guidelines for optimal filter-sampling configurations that balance measurement accuracy with computational efficiency. While higher sampling rates (≥1000 Hz) ensure signal fidelity, they impose significant computational burden on battery-constrained devices. Conversely, aggressive downsampling may compromise high-frequency HRV components. Establishing the minimum sampling frequency that preserves clinical-grade accuracy is therefore critical for next-generation wearable HRV monitors.
The present study aims to identify the optimal filter–sampling configuration for PPG-based HRV analysis in resource-constrained wearable platforms. Specifically, we compare zero-phase Butterworth and Elliptic infinite impulse response (IIR) bandpass filters (0.8–20 Hz) at 1000, 500, and 250 Hz, and evaluate their interchangeability with ECG-derived HRV indices using concordance correlation coefficient (CCC), two one-sided equivalence testing (TOST), Passing–Bablok regression, and Bland–Altman analysis [16,17,18,19]. By jointly addressing accuracy and computational feasibility, this work provides design guidance for low-power wearable devices and establishes a robust foundation for future machine learning–based artifact suppression and broader clinical validation [20].
This pilot investigation with 10 healthy participants represents a critical first step in establishing evidence-based design parameters for next-generation wearable HRV monitors. While the modest sample size limits generalizability, our systematic approach—combining rigorous statistical validation, computational efficiency analysis, and direct PPG-ECG comparison—provides essential preliminary guidance for optimizing filter-sampling configurations before undertaking large-scale clinical trials or commercial product development. The findings presented here are intended to inform the design of subsequent multicenter validation studies involving diverse patient populations and real-world ambulatory conditions.
2. Materials and Methods
2.1. IIR Filter Design and Implementation
The IIR filter design followed standard procedures detailed in [8,14] Briefly, the recursive IIR filter can be expressed as:
where the notations x[n] and y[n] represent the input and output sequences, respectively, and ak, bk are the filter coefficients of the Nth-order and Mth-order filter. For complete derivation, see our previous work [14].
To avoid phase distortion, zero-phase forward–backward filtering was applied, effectively doubling the filter order and yielding a fourth-order equivalent response [9]. The Butterworth design provides a maximally flat passband (<0.1 dB ripple), whereas the Elliptic filter achieves sharper transitions and stronger stopband attenuation, but introduces nonlinear phase and passband ripple of up to 1 dB [21]. These properties directly influence temporal accuracy in HRV analysis, since group delay variability can bias beat-to-beat interval detection and spectral power estimation [20]. Recent studies have confirmed that filtering strategies significantly impact PPG-derived HRV. In particular, Mejía-Mejía et al. demonstrated that filter selection alters concordance between PRV and ECG-HRV, highlighting the importance of minimizing timing distortion and phase irregularities in preprocessing [22]. Based on these considerations, both Butterworth and Elliptic designs were evaluated at sampling frequencies of 1000, 500, and 250 Hz, with coefficients computed in Python using the scipy.signal package. The final coefficients are summarized in Table 1.
2.2. Frequency Response Analysis
Frequency-domain characterization was conducted to compare the Butterworth and Elliptic bandpass filters (0.8–20 Hz) at sampling frequencies of 1000, 500, and 250 Hz. Both filters exhibited a low-frequency transition width of approximately 0.65 Hz, while the Elliptic design achieved narrower high-frequency transitions due to the presence of transmission zeros. The group delay, which quantifies the time-domain latency introduced by the filter, was defined as:
where denotes the filter’s phase response. Group delay analysis is critical in biomedical signal processing because latency variations in the passband can distort beat-to-beat interval estimation, thereby affecting HRV accuracy [23,24]. Ideally, a filter should exhibit constant group delay across the passband to ensure uniform time-domain behavior for all frequency components within the signal of interest. Butterworth filters are known for their relatively flat group delay characteristics, which contribute to minimal waveform distortion and predictable peak timing in PPG signals. In contrast, Elliptic filters—despite their superior frequency selectivity—exhibit frequency-dependent group delay variations, particularly near passband edges, which can lead to temporal inconsistencies in peak detection and inter-beat interval (IBI) measurement [8,21].
Amplitude responses for each sampling condition are shown in Figure 1. Single-pass causal filtering (solid lines) was contrasted with zero-phase forward–backward filtering (dashed lines). The latter squared the magnitude response (|H|2), effectively doubling the filter order (from 2nd to 4th) and yielding steeper attenuation (~24 dB/octave) without phase distortion [9]. At 1000 Hz, the Butterworth filter maintained a flat passband (ripple ≈ 0 dB) with transition widths of 0.65 Hz (low) and 84.35 Hz (high), whereas the Elliptic filter demonstrated 1 dB ripple and sharper roll-off (82.80 Hz). At 500 Hz, both filters preserved spectral fidelity, though Elliptic again displayed stronger selectivity with ±80° phase variation and group delay spread ranging from 6 to 145 samples. At 250 Hz, Butterworth transition widths were 0.65 Hz (low) and 55.34 Hz (high), while Elliptic achieved 54.74 Hz (high) but introduced variability in group delay (3–72 samples, mean 37.5 ± 11.0), which may exacerbate artifact sensitivity in noisy environments. Table 2 summarizes the main frequency-response parameters, including transition widths, passband ripple, group-delay spread, and phase variation.
In addition to magnitude analysis, pole–zero (PZ) plots (Figure 2) were generated to verify filter stability and interpret spectral behavior. All poles remained inside the unit circle (∣z∣<1), ensuring stability. Butterworth filters showed zeros at z=±1, yielding DC and Nyquist suppression with smooth pole distributions, resulting in a flat passband and temporal stability. In contrast, Elliptic filters introduced additional transmission zeros near the stopbands, enabling sharper transitions and stronger attenuation at the cost of ripple and nonlinear phase [21]. As the sampling frequency decreased, normalized pole and zero positions shifted toward the Nyquist limit, extending impulse response durations, particularly for Elliptic filters. This geometric interpretation highlights Butterworth’s suitability for maintaining beat-to-beat timing precision, while Elliptic prioritizes frequency selectivity and baseline wander suppression. This PZ analysis is critical for PPG-HRV and ECG-HRV concordance, as it addresses two key factors: (1) temporal precision of beat intervals which is crucial for HRV analysis, enhanced by Butterworth’s flat passband and linear phase, reducing peak-picking bias relative to elliptic ripple, particularly at low ; and (2) artifact rejection, improved by Elliptic’s deeper stopband zeros for suppressing baseline wander and motion noise [23]. Optimal filter configurations—stable poles with moderate radii, balanced stopband zeros, and zero-phase application—were identified via PZ geometry. Consequently, the geometrical difference in pole and zero locations demonstrates the Butterworth filter’s emphasis on temporal stability, while the Elliptic filter prioritizes frequency selectivity.
2.3. Filter Pole-Zero Geometry Optimization for PPG-Based HRV Processing
The influence of pole geometry on the bandpass characteristics was investigated using a 2-pole Butterworth prototype, mapped into the digital domain through the bilinear transform [10]:
where is the sampling period, and cutoff frequencies were set to 0.8 Hz and 20 Hz. At sampling rates of 1000, 500, and 250 Hz, the corresponding discrete pole angles were approximately 5°, 10°, and 26°, with pole radius r≈0.95, ensuring passband flatness and system stability. Lower sampling frequencies shortened the step-response settling time under zero-phase implementation (from ~90 ms to ~35 ms) and improved rejection of 60 Hz interference (attenuation from –19.9 dB to –23.2 dB in single-pass mode). The 500 Hz condition (θ ≈ 10°) provided the best balance between transient duration, stopband suppression, and numerical stability, and was therefore selected for subsequent experiments, supplemented by an adaptive 60 Hz IIR notch filter [25].
2.4. Zero-Phase Forward-Backward Filtering
To remove phase distortion, zero-phase filtering was achieved using forward–backward processing. Applying this method to 2nd-order Butterworth and Elliptic bandpass filters effectively yielded 4th-order characteristics. The transfer function is expressed as [26]:
with the resulting magnitude and phase given by:
This method preserved Butterworth’s maximally flat passband (ripple <0.1 dB) while doubling the number of poles, thus enhancing stopband attenuation without introducing latency. Forward–backward filtering has been widely used in biomedical signal processing for HRV and ECG analysis, as it combines high-order attenuation with phase preservation [9,27].
2.5. Participants and Data Collection Protocol
This study adhered to the principles of the Declaration of Helsinki and obtained ethical approval from the Institutional Review Board of Hallym University. Written informed consent was obtained from all participants prior to their enrollment in the study. The required number of participants was determined through a priori power analysis based on a target concordance correlation coefficient (CCC) of 0.90, with α = 0.05, power = 0.80, and effect size = 0.8, as recommended in previous studies [28].
As this study focused on validating signal processing algorithms rather than physiological characteristics, ten healthy young adults (age range: 20-25 years) with normal blood pressure and no known history of cardiovascular disease or autonomic dysfunction were included in this study. Exclusion criteria included current medication use, smoking, and caffeine consumption within one hour prior to the measurement. The study was carried out in a controlled laboratory environment with standardized conditions.
The PPG sensor was positioned on the index finger of either hand, and ECG electrodes were positioned in a standard Lead II configuration after skin preparation with alcohol. PPG signals were acquired using a custom-built system featuring a 16-bit microcontroller (MSP430F6638, Texas Instruments, Dallas, TX, USA), a 940 nm infrared LED driven at 20 mA, and a silicon PIN photodiode. The signals were digitized by a 12-bit ADC at sampling rates of 1000, 500, and 250 Hz. This device implemented both the Butterworth and Elliptic filters under each sampling condition.
Simultaneous ECG and PPG recordings were acquired in 2.5-minute segments under each of the six digital filter-sampling configurations, comprising a combination of two IIR filter types (Butterworth and Elliptic) and three sampling frequencies (1000, 500, and 250 Hz). All six configurations were applied sequentially within a single experimental session. This full sequence was then repeated two additional times, resulting in three independent 2.5-minute HRV segments per configuration for each participant. Accordingly, a total of 30 HRV index measurements were obtained per configuration across all 10 participants (3 segmentsⅹ10 participants), enabling statistically reliable inter-configuration comparisons.
2.6. HRV Metrics and Statistical Analysis
HRV frequency-domain indices were derived from the 2.5-minute tachograms via a discrete Fourier transform (DFT). The analysis covered the very-low-frequency VLF (0.0033 to 0.04 Hz), low-frequency LF (0.04 to 0.15 Hz), and high-frequency HF (0.15 to 0.40 Hz) bands. To ensure comparability with established ECG-based HRV standards [1], all spectral metrics were log-transformed (ln VLF, ln LF, ln HF), and the sympathetic–parasympathetic balance was calculated as the ratio R = ln(LF/HF). Detailed definitions of all frequency-domain HRV parameters are provided in Table A1 (Appendix A).
Agreement between PPG-derived and ECG-derived HRV indices was evaluated using three statistical methods. Lin’s concordance correlation coefficient (CCC) was used to investigate both precision and accuracy [16,29]. The two one-sided test (TOST) procedure was performed to formally evaluate statistical equivalence within predefined equivalence margins [17]. Finally, Passing–Bablok regression (PBR) was employed to identify any systematic proportional or constant bias [17]. All statistical analyses were carried out using Python (SciPy, statsmodels), with α = 0.05 (significance level).
3. Results
3.1. Agreement and Statistical Equivalence Analysis of HRV Indices (CCC + TOST)
Paired PPG–ECG recordings were analyzed across six filter–sampling configurations (Butterworth or Elliptic at 1000, 500, and 250 Hz). Agreement for log-transformed HRV indices (ln HF, ln LF, ln VLF) was evaluated using Lin’s concordance correlation coefficient (CCC), which jointly assesses both accuracy and precision [16], and statistically validated using two one-sided equivalence testing (TOST) with ±5% log-scale bounds [17].
Butterworth filters at 1000 Hz and 500 Hz consistently demonstrated excellent concordance (CCC ≥ 0.95) and successfully met the equivalence criterion, with TOST-adjusted p-values below the Holm-corrected significance threshold. In contrast, down-sampling to 250 Hz—particularly with Elliptic filters—resulted in noticeably reduced CCC values and a failure to establish statistical equivalence. Among all configurations, Butterworth at 1000 Hz showed the highest overall agreement and equivalence, followed closely by the 500 Hz configuration, whereas Elliptic filters achieved acceptable CCC-based agreement only at 1000 Hz but did not retain equivalence at lower sampling rates.
These findings were consistent across ln HF, ln LF, and ln VLF, confirming that Butterworth filters at ≥500 Hz preserved the highest fidelity to ECG reference measurements, while Elliptic designs became increasingly unstable under spectral compression. Table 3 presents the integrated CCC and TOST results, clearly highlighting the best-performing equivalence-passing condition for each HRV frequency band.
), Pearson’s correlation (r), mean difference with 90% CI, and Holm-adjusted TOST results (±5% log-scale bounds) are jointly presented based on paired data (n=30 per filter-sampling condition).
3.2. Agreement Statistics by Filter Types and Sampling Frequencies
Consistent with the integrated CCC and TOST analysis, visual inspection of the agreement plots further underscores the superiority of Butterworth filters at higher sampling rates. As shown in Figure 3, agreement trends were evaluated across three HRV bands (ln HF, ln LF, ln VLF), each reported using CCC with 95% confidence intervals (left panels) and mean differences with 90% confidence intervals relative to the ±0.05 equivalence bounds (right panels). The horizontal red line in the CCC panels marks the 0.90 threshold for excellent agreement, while the blue dashed lines in the TOST panels denote the equivalence margins adopted in this study.
3.2. Agreement Analysis of PPG and ECG for HRV Frequency Bands Using Bland–Altman Plots
Bland–Altman plots [30] were utilized to evaluate the agreement between PPG- and ECG-derived HRV indices (ln HF, ln LF, ln VLF) across six filter–sampling configurations (Butterworth or Elliptic at 1000, 500, and 250 Hz). Each plot displays 95% limits of agreement (LoA) and the mean difference, enabling visualization of systematic deviation and random variability between PPG and ECG measurements.
For ln HF (Figure 4a), Butterworth at 500 Hz and 1000 Hz showed minimal bias and narrow LoA, indicating strong interchangeability with ECG. Elliptic at 1000 Hz also performed acceptably, although with slightly wider dispersion. At 250 Hz, both filters exhibited markedly larger variability, with Elliptic showing the poorest agreement, likely due to ripple-induced phase distortion and aliasing effects.
For ln LF (Figure 4b), Butterworth again outperformed Elliptic, maintaining low bias and tight LoA at 500 Hz and 1000 Hz. In contrast, Elliptic filters — particularly at 250 Hz — displayed greater dispersion and a clear upward bias (PPG > ECG), suggesting susceptibility to low-frequency drift and external noise contamination.
For ln VLF (Figure 4c), variability was inherently higher across all conditions. Butterworth at 1000 Hz showed the smallest bias and narrowest LoA, with 500 Hz remaining acceptable. Elliptic filters — especially at 250 Hz — demonstrated wide LoA and systematic overestimation, indicating poor robustness in very-low-frequency analysis.
Overall, Bland–Altman analysis supports the previous CCC and TOST findings: Butterworth filtering at ≥500 Hz consistently provides the most reliable agreement with ECG, whereas Elliptic filters — most notably at 250 Hz — exhibit reduced stability and increased bias.
3.3. Agreement Analysis Using Passing-Bablok Regression
Passing–Bablok regression (PBR) [17] was applied to evaluate proportional and constant bias between PPG- and ECG-derived HRV indices across the six filter–sampling conditions. Slopes approaching unity and intercepts near zero were interpreted as evidence of minimal systematic error. For ln HF (Figure 5a), Butterworth filters at 500 Hz and 1000 Hz produced regression lines close to identity (slopes ≈ 0.97 with small intercepts of +0.10 and +0.14, respectively). At 250 Hz, Butterworth performance deteriorated (slope 0.67, intercept +1.20), reflecting marked proportional error and positive bias. Elliptic filtering at 1000 Hz (0.97x + 0.07) yielded acceptable results, but deviations became evident at 500 Hz (1.12x – 0.37) and 250 Hz (0.87x + 0.41), where systematic errors increased with lower sampling rates. For ln LF (Figure 5b), Butterworth again demonstrated reliable agreement at 500 Hz (1.02x – 0.07) and 1000 Hz (1.00x + 0.03). At 250 Hz, however, the slope dropped to 0.90 with an intercept of +0.53, indicating proportional underestimation and bias. Elliptic at 1000 Hz (0.99x + 0.07) was comparable to Butterworth, but 500 Hz (0.81x + 1.08) and 250 Hz (0.69x + 1.77) showed pronounced bias and poor reproducibility. For ln VLF (Figure 5c), variability was more pronounced across all conditions. Butterworth at 500 Hz (1.01x – 0.03) and 1000 Hz (0.98x + 0.13) maintained slopes close to unity with negligible intercepts, whereas at 250 Hz (0.97x + 0.20) a constant bias emerged. Elliptic filters showed stronger deviations, particularly at 250 Hz (0.68x + 2.09) and 500 Hz (0.78x + 1.37), with the 1000 Hz condition (1.09x - 0.53) also showing notable deviation. In these cases, the regression fits diverged substantially from the line of identity.
Taken together, the regression analysis confirmed that Butterworth filtering at ≥500 Hz minimized both proportional and constant bias, consistent with the outcomes from CCC and Bland–Altman analyses. Conversely, Elliptic filters—especially at 250 Hz—demonstrated significant systematic error, limiting their interchangeability with ECG-derived indices.
3.4. Spectral Fidelity Analysis
Spectral fidelity was assessed by calculating the similarity between the frequency response and an ideal bandpass filter for each filter condition. The spectral fidelity metric quantifies how closely the implemented filter approximates the ideal bandpass characteristics across the frequency range of interest. Since zero-phase forward-backward filtering was applied in this study, the filter is applied twice. This results in the magnitude response being squared, effectively doubling the filter order from 2nd-order to 4th-order equivalent. The spectral fidelity (SF) was computed using the following equation [8]:
(7)
where represents the amplitude response of an ideal bandpass filter at frequency , is the magnitude spectrum of the implemented filter at the same frequency, and K is the total number of frequency points evaluated across the spectrum. The ideal bandpass filter is defined as having unity gain (0 dB) within the passband (0.8–20 Hz) and complete attenuation outside this range. This metric provides a comprehensive measure of filter performance by accounting for deviations in both the passband and stopband regions.
The results showed that the Butterworth filter generally exhibited superior fidelity compared to the Elliptic filter (Table 4, Figure 6). Notably, the BW 500Hz filter achieved a high spectral fidelity of 98.2%, offering approximately 50% reduction in computational load with only a 1.8% performance degradation compared to the BW 1000Hz (100.0%). The 500 Hz Butterworth filter provides an optimal balance between accuracy and efficiency, making it the most practical choice for wearable devices where both battery life and measurement accuracy are important.
4. Discussion
This pilot study systematically compared Butterworth and Elliptic IIR filters at three sampling frequencies (1000, 500, 250 Hz) to identify the optimal preprocessing configuration for PPG-based HRV analysis in wearable devices. The controlled laboratory setting with homogeneous participants (n=10 healthy young adults) was deliberately chosen to isolate the effects of filter type and sampling frequency while minimizing confounding variables. Although this design limits immediate clinical generalizability, it provides a methodologically rigorous foundation for identifying optimal configurations worthy of large-scale validation.
Our principal finding is that Butterworth filtering at 500 Hz emerged as the optimal configuration. It achieved excellent concordance with ECG-derived HRV, as evidenced by a Concordance Correlation Coefficient (CCC) of ≥ 0.94, successful TOST equivalence testing within a ±5% margin, and Passing-Bablok regression slopes between 0.97-1.02. This configuration also preserved 98.2% of the signal's spectral fidelity while halving the computational load compared to 1000 Hz. While the 1000 Hz Butterworth filter offered marginally stronger agreement (CCC ≈ 0.96-0.99), the minimal accuracy gain does not justify the doubled computational cost for battery-constrained wearables. In contrast, Elliptic filters consistently underperformed due to passband ripple and nonlinear phase response, which introduced systematic bias, particularly at 250 Hz (CCC ≈ 0.64). The poor performance at 250 Hz for Butterworth filter (CCC ≈ 0.71) underscores the risks of excessive downsampling and provides quantitative evidence against the common industry practice of using this frequency in low-cost wearables.
These results extend our previous work [14], which found Butterworth filters superior for NN interval extraction but lacked systematic frequency evaluation and direct ECG validation. The present study makes three key advances: (1) simultaneous PPG-ECG recordings for validation against the clinical gold standard, (2) a systematic comparison of sampling frequencies, and (3) comprehensive statistical validation using four complementary methods. Our recommendation of a ≥500 Hz sampling rate appears higher than the 20-50 Hz suggested by Béres et al. [13], a difference attributable to our focus on frequency-domain parameters (ln HF, ln LF, ln VLF) without interpolation, where spectral fidelity is paramount. Filter-induced distortions at lower sampling rates and our stricter accuracy criteria (CCC ≥ 0.94, TOST equivalence) further justify the need for higher sampling rates to maintain clinical-grade accuracy in real-time, frequency-domain HRV analysis.
From a clinical perspective, the demonstrated statistical equivalence between HRV parameters derived from PPG with a 500 Hz Butterworth filter and those from the reference ECG is highly significant. This high degree of agreement suggests that wearable devices implementing this configuration could serve as a reliable tool for applications such as detecting autonomic dysfunction, tracking stress recovery, and remotely monitoring cardiovascular patients, yielding results that are statistically comparable to traditional ECG-based assessments under specified conditions [1]. Validation is essential for integrating wearable-generated data more broadly into electronic health records and for informing clinical decision support systems (CDSS), addressing key challenges in system interoperability and data privacy [31]. Furthermore, by demonstrating equivalence with established reference methods through fit-for-purpose validation, these findings may help streamline the regulatory approval process for PPG-based medical devices [32].
From an engineering standpoint, the 50% reduction in computational load achieved by decreasing the sampling frequency from 1000 Hz to 500 Hz yields significant advantages in resource efficiency. This reduction can extend device battery life by an estimated 15-20%—equivalent to an additional 8-12 hours for a typical 200 mAh battery—under specific operating conditions [33]. Moreover, it enables the selection of lower-power analog-to-digital converters (ADCs), such as a 12-bit SAR ADC instead of a more power-intensive 16-bit delta-sigma variant, and simplifies the design of the prerequisite anti-aliasing filter [34,35]. The corresponding halving of memory requirements, from 300,000 to 150,000 samples for a standard five-minute analysis window, further alleviates hardware constraints. These factors define a clear engineering trade-off, allowing developers of microcontroller-based wearables to balance signal fidelity against hardware limitations, thereby accelerating the development and deployment of next-generation, clinical-grade HRV monitoring solutions.
Finally, these findings have important implications for machine learning (ML) applications in wearable health. Robust preprocessing is essential, as inaccuracies can introduce systematic biases that propagate through AI pipelines and degrade model performance in areas like stress detection, sleep staging, and cardiovascular risk assessment [36,37]. By providing reproducible benchmarks for accuracy and spectral fidelity, this study offers reference criteria for validating preprocessing pipelines before ML integration. Adopting a standardized preprocessing approach, such as the 500 Hz Butterworth filter, also facilitates direct comparison of ML model performance across studies and minimizes distribution shift when models trained on ECG-derived HRV are deployed on PPG-based devices.
4.1. Study Limitations
This work should be viewed as a preliminary feasibility study rather than definitive clinical evidence, as the sample was limited to 10 healthy young adults (25.3 ± 3.2 years), limiting statistical power and generalizability. Filter performance may differ in elderly individuals and patients with arrhythmias, heart failure, or autonomic neuropathy, where PPG signal quality is often degraded; thus, future studies should include larger and stratified cohorts by age, sex, ethnicity, and cardiovascular disease status. All measurements were conducted under controlled laboratory resting conditions, whereas real-world wearable environments involve motion artifacts, variable skin contact, ambient light interference, and diverse physiological states (e.g., exercise, sleep, stress), requiring multi-center ambulatory validation over days to weeks to confirm the robustness of the Butterworth 500 Hz configuration. The analysis focused on HRV frequency-domain metrics (ln HF, ln LF, ln VLF), which are most sensitive to filter characteristics, but HRV time-domain indices (SDNN, RMSSD, pNN50) and nonlinear metrics (sample entropy, DFA) may exhibit different responses and warrant comprehensive future evaluation. Given the exploratory nature of this work, we reported uncorrected p-values across 18 comparisons (3 bands × 6 configurations) to avoid excessive Type II error, consistent with recommendations for hypothesis-generating studies [38]. Nevertheless, this pilot makes a meaningful contribution by providing the first systematic comparison of filter types across sampling frequencies using simultaneous PPG-ECG recordings and four statistical validation methods, delivering immediately actionable engineering insights (98.2% spectral fidelity and ~50% computational load reduction), reproducible statistical benchmarks (CCC ≥ 0.94 and slopes 0.97–1.02), and evidence-based guidelines that address a critical gap in the literature regarding filter–sampling interaction effects for optimized PPG-based HRV preprocessing.
4.2. Future Work
Future research should prioritize large-scale multicenter validation across diverse populations, clinical conditions, and real-world monitoring scenarios to establish generalizability and clinical utility. Future work should also expand beyond frequency-domain HRV outcomes to establish filter impact profiles across time-domain, nonlinear, and ultra–short-term HRV indices, enabling application-specific optimization (e.g., mental stress detection vs. cardiac risk pre-screening). Building upon the present static-filter baseline, adaptive signal processing frameworks that dynamically adjust bandwidth or sampling rate in response to evolving signal quality may offer a pathway toward intelligent energy–accuracy tradeoff management in resource-constrained wearables. Finally, integrating validated preprocessing pipelines with predictive machine learning models and multi-sensor fusion architecture (e.g., combining PPG-HRV with electrodermal activity, skin temperature, or motion context) is expected to advance personalized digital biomarkers and proactive intervention systems.
5. Conclusions
This study systematically evaluated filter types and sampling frequencies for PPG-based HRV analysis, establishing Butterworth filtering at ≥500 Hz as the optimal preprocessing configuration. This approach achieved statistical equivalence with ECG-derived HRV parameters while reducing computational load by 50% compared to 1000 Hz sampling, demonstrating that clinical-grade accuracy and engineering feasibility are not mutually exclusive.
The validated preprocessing standard provides three key contributions: (1) evidence-based guidelines for wearable device developers to balance signal fidelity with hardware constraints, (2) a robust foundation for machine learning applications where accurate preprocessing prevents systematic bias, and (3) reproducible benchmarks that facilitate direct comparison across studies and accelerate regulatory approval pathways.
By bridging clinical accuracy and engineering feasibility, these findings support the translation of PPG-based HRV monitoring into clinically adopted, consumer-accessible wearable health technologies. Future validation in diverse populations and real-world conditions will be essential to confirm generalizability and support widespread clinical adoption.
Author Contributions
J.M.A. contributed to conceptualization, methodology, writing (review and editing), supervision, and project administration. N.A. contributed to validation, data collection, and writing (original draft). M.A. contributed to control of lab environment, data collection, and writing (review and editing). M.J.K. contributed to validation and data collection. All authors reviewed and approved the manuscript for publication.
Institutional Review Board Statement
The study was performed in accordance with the Declaration of Helsinki and received approval from the Institutional Review Board of Hallym University (ethical approval: HIRB-2025-102).
Informed Consent Statement
All participants provided informed consent to participate in the study and for publication of the results.
Data Availability Statement
Data supporting the findings of this study are available from the corresponding author upon request. Public availability is restricted due to privacy concerns.
Acknowledgments
This research was supported by the Regional Innovation System & Education (RISE) program through the Gangwon RISE Center, funded by the Ministry of Education (MOE) and the Gangwon State (G.S.), Republic of Korea. (2025-RISE-10-009).
Conflicts of Interest
The authors declare no conflict of interest.
Abbreviations
The following abbreviations are used in this manuscript:
| BW | Butterworth filter |
| EL | Elliptic filter |
| LoA | Limits of agreement |
| HRV | Heart rate variability |
| TP | Total power |
| VLF | Very low frequency |
| LF | Low frequency |
| HF | High frequency |
| PPG | Photoplethysmography |
| fs IIR |
Sampling frequency Infinite impulse response |
| SF | Spectral fidelity |
Appendix A
Appendix A.1
Table A1 summarizes the spectral HRV indices employed in this study. The parameter ln TP (total power) represents the power spectral density (PSD) integrated over the entire frequency range, whereas ln VLF corresponds to the PSD in the very low-frequency band (0.0033 to 0.04 Hz). The parameter ln LF denotes the PSD in the low-frequency band (0.03 to 0.15 Hz), and ln HF indicates the PSD in the high-frequency band (0.15 to 0.40 Hz). Finally, the R ratio is defined as the logarithmic ratio of low-frequency to high-frequency power (ln LF / ln HF).

Table A1.
Table A1. Frequency-domain HRV Parameters.
| Parameter | Unit | Description |
|---|---|---|
| ln TP (total power) ln VLF |
ms2 ms2 |
PSD in all the frequency bands PSD in very low-frequency band (0.0033 to 0.04Hz) |
| ln LF | ms2 | PSD in low-frequency band (0.03 to 0.15Hz) |
| ln HF | ms2 | PSD in high-frequency band (0.15 to 0.4Hz) |
| R ratio | - | ln LF / ln HF |
References
- Task Force of the European Society of Cardiology and the North American Society of Pacing and Electrophysiology. Heart rate variability: Standards of measurement, physiological interpretation, and clinical use. Circulation 1996, 93, 1043–1065. [Google Scholar] [CrossRef]
- Shaffer, F.; Ginsberg, J.P. An overview of heart rate variability metrics and norms. Front. Public Health 2017, 5, 258. [Google Scholar] [CrossRef]
- Allen, J. Photoplethysmography and its application in clinical physiological measurement. Physiol. Meas. 2007, 28, R1–R39. [Google Scholar] [CrossRef]
- Castaneda, D.; Esparza, A.; Ghamari, M.; Soltanpur, C.; Nazeran, H. A review on wearable photoplethysmography sensors and their potential future applications in health care. Int. J. Biosens. Bioelectron. 2018, 4(4), 195–202. [Google Scholar] [CrossRef] [PubMed]
- Tamura, T.; Maeda, Y.; Sekine, M.; Yoshida, M. Wearable photoplethysmographic sensors—past and present. Electronics 2014, 3, 282–302. [Google Scholar] [CrossRef]
- Bent, B.; Goldstein, B.A.; Kibbe, W.A.; Dunn, J.P. Investigating sources of inaccuracy in wearable optical heart rate sensors. NPJ Digit. Med. 2020, 3, 18. [Google Scholar] [CrossRef]
- Han, H.; Kim, J. Artifacts in wearable photoplethysmographs during daily life motions and their reduction with least mean square based active noise cancellation method. Comput. Biol. Med. 2012, 42, 387–393. [Google Scholar] [CrossRef]
- Oppenheim, A.V.; Schafer, R.W. Discrete-Time Signal Processing, 3rd ed.; Pearson: Upper Saddle River, NJ, USA, 2010. [Google Scholar]
- Gustafsson, F. Determining the initial states in forward-backward filtering. IEEE Trans. Signal Process. 1996, 44, 988–992. [Google Scholar] [CrossRef]
- Proakis, J.G.; Manolakis, D.G. Digital Signal Processing: Principles, Algorithms, and Applications, 4th ed.; Pearson: Upper Saddle River, NJ, USA, 2007. [Google Scholar]
- Pinheiro, N.; Couceiro, R.; Henriques, J.; Muehlsteff, J.; Quintal, I.; Goncalves, L.; Carvalho, P. Can PPG be used for HRV analysis? In Proceedings of the 38th Annual International Conference of the IEEE Engineering in Medicine and Biology Society (EMBC), Orlando, FL, USA, 16–20 August 2016; pp. 2945–2949. [Google Scholar] [CrossRef]
- Schäfer, A.; Vagedes, J. How accurate is pulse rate variability as an estimate of heart rate variability? A review on studies comparing photoplethysmographic technology with an electrocardiogram. Int. J. Cardiol. 2013, 166, 15–29. [Google Scholar] [CrossRef] [PubMed]
- Béres, S.; Hejjel, L. The minimal sampling frequency of the photoplethysmogram for accurate pulse rate variability parameters in healthy volunteers. Biomed. Signal Process. Control 2021, 68, 102375. [Google Scholar] [CrossRef]
- Kim, J.K.; Ahn, J.M. Digital IIR Filters For Heart Rate Variability; A Comparison Between Butterworth And Elliptic Filters. International J. of Scientific & Technology Research, 3509. [Google Scholar]
- Ahn, J.M. Heart rate variability (HRV) analysis using simultaneous handgrip electrocardiogram and fingertip photoplethysmogram. Adv. Inf. Sci. Serv. Sci. 2013, 5, 164–170. [Google Scholar]
- Lin, L.I. A concordance correlation coefficient to evaluate reproducibility. Biometrics 1989, 45, 255–268. [Google Scholar] [CrossRef]
- Passing, H.; Bablok, W. A new biometrical procedure for testing the equality of measurements from two different analytical methods. J. Clin. Chem. Clin. Biochem. 1983, 21, 709–720. [Google Scholar] [CrossRef]
- Charlton, P.H.; Bonnici, T.; Tarassenko, L.; Clifton, D.A.; Beale, R.; Watkinson, P.J. An assessment of algorithms to estimate respiratory rate from the electrocardiogram and photoplethysmogram. Physiol. Meas. 2016, 37, 610–626. [Google Scholar] [CrossRef] [PubMed]
- Paradiso, R.; Loriga, G.; Taccini, N.; Gemignani, A.; Ghelarducci, B. WEALTHY—A wearable healthcare system: New frontier on e-textile. J. Telecommun. Inf. Technol. 2005, 4, 105–113. [Google Scholar] [CrossRef]
- Vicente-Samper, J.M.; Tamantini, C.; Ávila-Navarro, E.; De La Casa-Lillo, M.Á.; Zollo, L.; Sabater-Navarro, J.M.; Cordella, F. An ML-based approach to reconstruct heart rate from PPG in presence of motion artifacts. Biosensors 2023, 13. [Google Scholar] [CrossRef] [PubMed]
- Antoniou, A. Digital Filters: Analysis, Design, and Applications; McGraw-Hill: New York, NY, USA, 2005. [Google Scholar]
- Mejía-Mejía, E.; May, J.M.; Kyriacou, P.A. Effect of filtering of photoplethysmography signals in pulse rate variability analysis. In Proceedings of the Annual International Conference of the IEEE Engineering in Medicine and Biology Society (EMBC), Guadalajara, Mexico, 1–5 November 2021; pp. 5500–5503. [Google Scholar] [CrossRef]
- Ifeachor, E.C.; Jervis, B.W. Digital Signal Processing: A Practical Approach, 2nd ed.; Prentice Hall: Harlow, UK, 2002. [Google Scholar]
- Rabiner, L.R.; Gold, B. Theory and Application of Digital Signal Processing; Prentice-Hall: Englewood Cliffs, NJ, USA, 1975. [Google Scholar]
- Mitra, S.K. Digital Signal Processing: A Computer-Based Approach, 4소 ed.; McGraw-Hill: New York, NY, USA, 2010. [Google Scholar]
- Hayes, M.H. Statistical Digital Signal Processing and Modeling; Wiley: New York, NY, USA, 1996. [Google Scholar]
- Clifford, G.D.; Tarassenko, L. Quantifying errors in spectral estimates of HRV due to beat replacement and resampling. IEEE Trans. Biomed. Eng. 2005, 52, 630–638. [Google Scholar] [CrossRef] [PubMed]
- Bonett, D.G. Sample size requirements for estimating intraclass correlations with desired precision. Statistics in Medicine, 1331. [Google Scholar] [CrossRef]
- Bland, J.M.; Altman, D.G. Statistical methods for assessing agreement between two methods of clinical measurement. Lancet 1986, 327, 307–310. [Google Scholar] [CrossRef]
- Giavarina, D. Understanding Bland–Altman analysis. Biochem. Medica 2015, 25, 141–151. [Google Scholar] [CrossRef]
- Dinh-Le, C.; Chuang, R.; Chokshi, S.; Mann, D. Wearable Health Technology and Electronic Health Record Integration: Scoping Review and Future Directions. JMIR Mhealth Uhealth 2019, 7, e12861. [Google Scholar] [CrossRef]
- Izmailova, E.S.; Wagner, J.A.; Perakslis, E.D. Wearable Devices in Clinical Trials: Hype and Hypothesis. Clin. Pharmacol. Ther. 2018, 104, 42–52. [Google Scholar] [CrossRef] [PubMed]
- Analog Devices. Analog Devices. How to Save Power in High-Precision Measurements; Design Note; Analog Devices: Wilmington, MA, USA. How to Save Power in High-Precision Measurements; Design Note; Analog Devices: Wilmington, MA. Available online: https://www.analog.com/en/resources/design-notes/how-to-save-power-in-highprecision-measurements.html (accessed on 20 October 2025).
- Hu, Y.; Huang, Q.; Tang, B.; Chen, C.; Hu, L.; Yu, E.; Li, B.; Wu, Z. A Low-Power SAR ADC with Capacitor-Splitting Energy-Efficient Switching Scheme for Wearable Biosensor Applications. Micromachines 2023, 14, 2244. [Google Scholar] [CrossRef] [PubMed]
- Baker, B.C. Designing an Anti-Aliasing Filter for ADCs in the Frequency Domain; Texas Instruments Application Note SLYT626; Texas Instruments: Dallas, TX, USA, 2011; Available online: https://www.ti.com/lit/pdf/slyt626 (accessed on 26 October, 2025).
- Faust, O.; Hagiwara, Y.; Hong, T.J.; Lih, O.S.; Acharya, U.R. Deep learning for healthcare applications based on physiological signals: A review. Comput. Methods Programs Biomed. 2018, 161, 1–13. [Google Scholar] [CrossRef] [PubMed]
- Haque, Y.; Zawad, R.S.; Ahmed Rony, C.S.; Al Banna, H.; Ghosh, T.; Kaiser, M.S.; Mahmud, M. State-of-the-art of stress prediction from heart rate variability using artificial intelligence. Cogn. Comput. 2023, 15, 2154–2179. [Google Scholar] [CrossRef]
- Streiner, D.L. Best (but oft-forgotten) practices: the multiple problems of multiplicity—whether and how to correct for many statistical tests. Am. J. Clin. Nutr. 2015, 102, 721–728. [Google Scholar] [CrossRef]
Figure 1.
Amplitude response of Butterworth and Elliptic bandpass filters (0.8–20 Hz, 2nd-order) under single-pass (solid lines) and zero-phase forward-backward (dashed lines) implementations, with the passband shaded. (a) At 1000 Hz, Butterworth shows a flat passband (transition widths: 0.65 Hz low, 84.35 Hz high), while Elliptic has 1 dB ripple and sharper roll-off (82.80 Hz high). (b) At 500 Hz, Butterworth (0.65 Hz low, 75.36 Hz high) and Elliptic (74.18 Hz high) maintain spectral fidelity. (c) At 250 Hz, Butterworth (0.65 Hz low, 55.34 Hz high) and Elliptic (54.74 Hz high) show reduced high-frequency transitions due to lower Nyquist frequency.
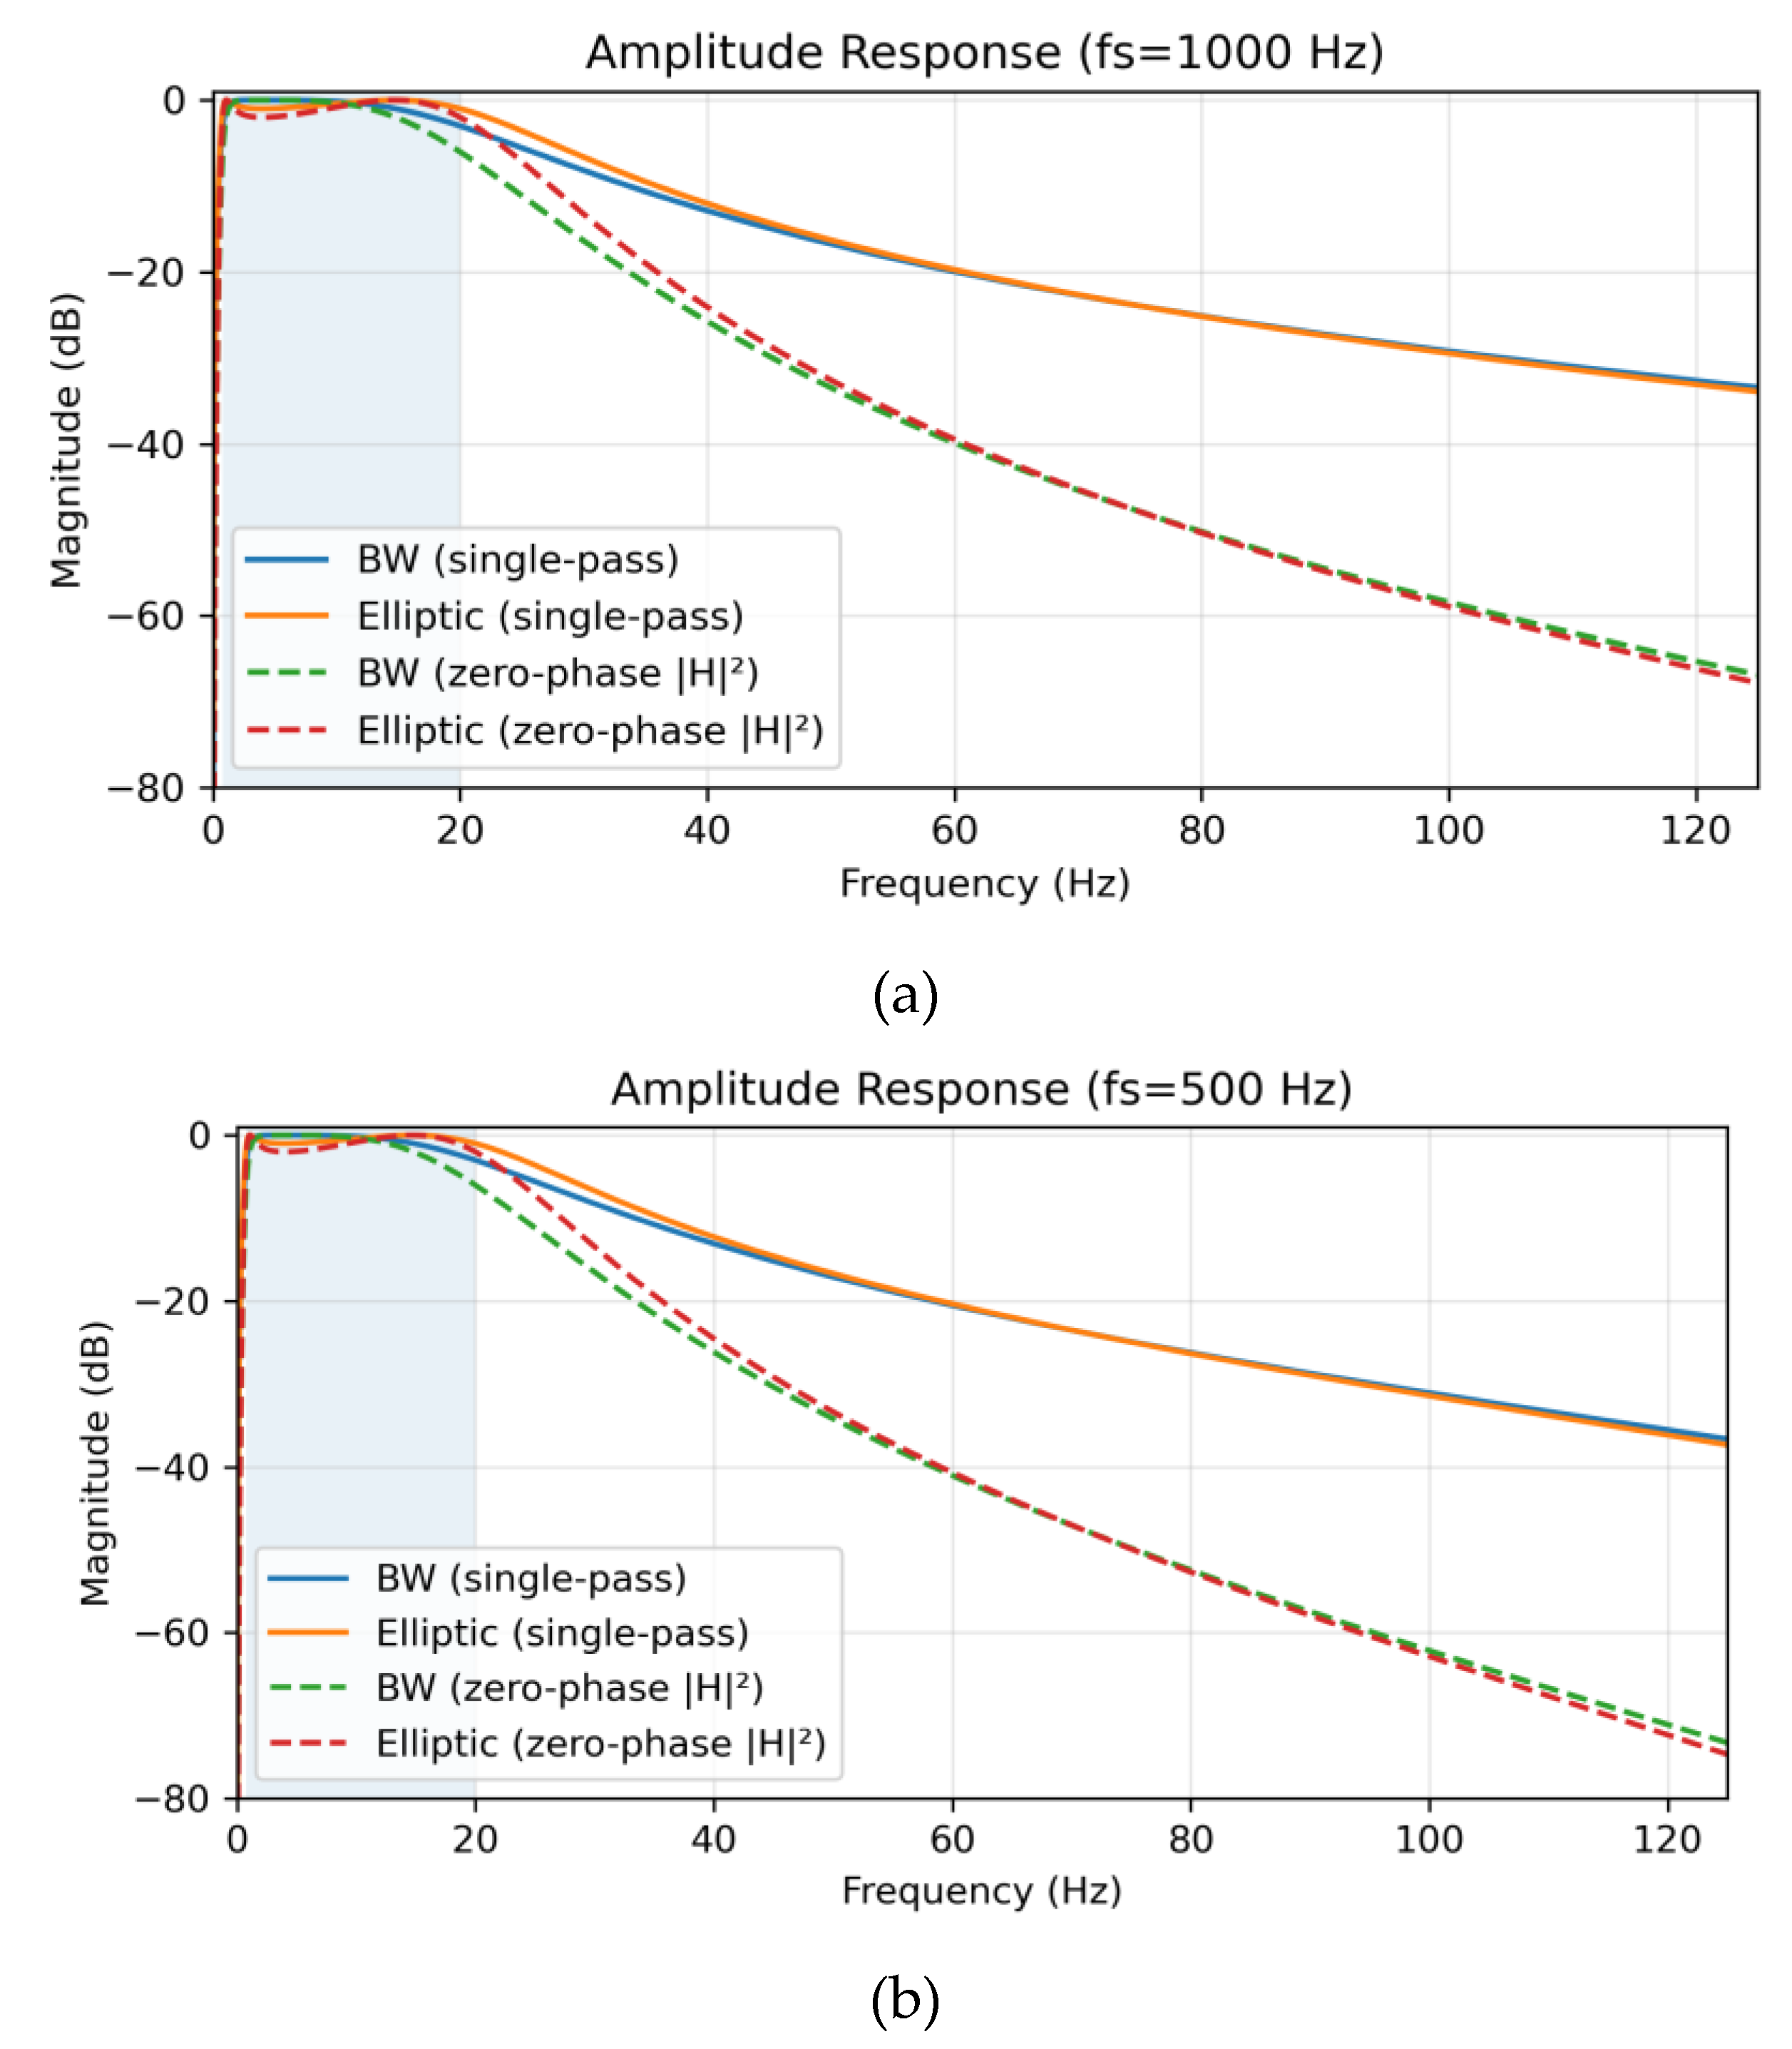
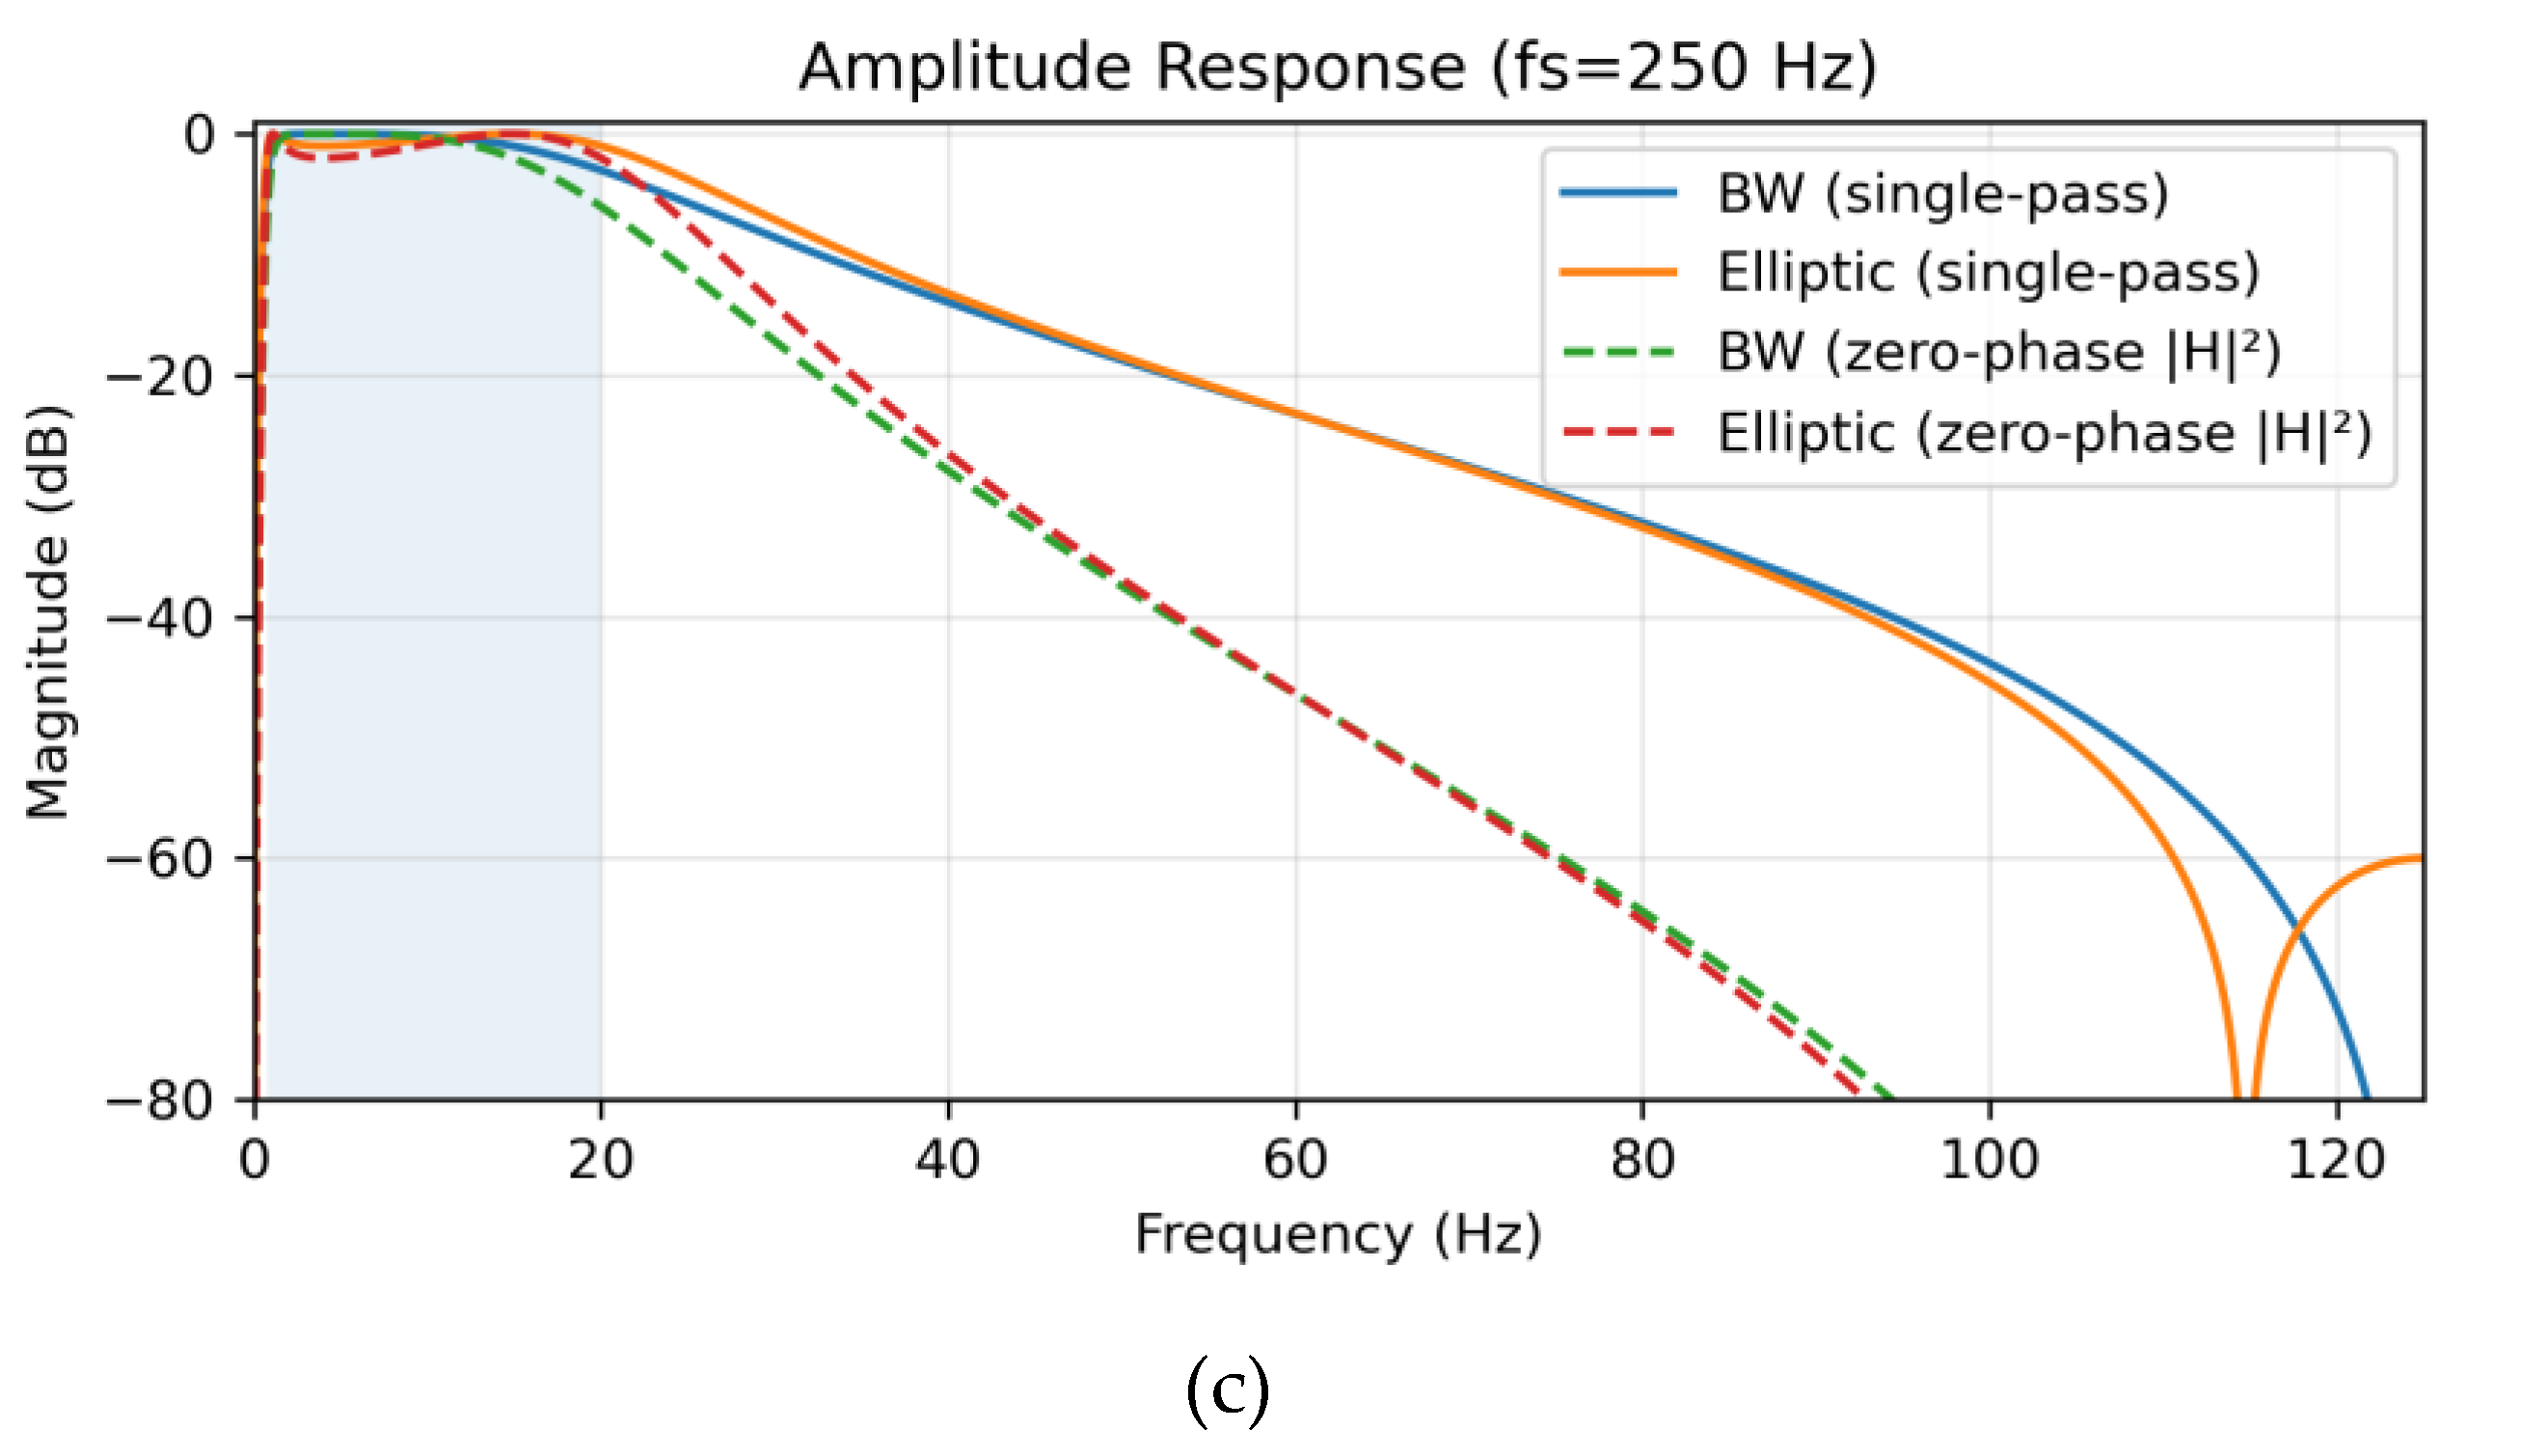
Figure 2.
Pole–zero diagrams of the 2nd-order digital Butterworth (BW, blue) and elliptic (EL, red) bandpass filters (0.8–20 Hz) at three sampling rates: (a) =1000 Hz, (b) =500 Hz, (c) =250 Hz. The poles are marked with × and transmission zeros with ○, enclosed by a dashed unit circle. Both designs place zeros at z=+1 and z=−1 (suppressing DC and Nyquist), while the elliptic filter additionally introduces two transmission zeros positioned on the unit circle in the left half-plane, producing sharper transition bands. All poles lie inside the unit circle (stable); pole radii decrease slightly as decreases because with the 0.8–20 Hz passband fixed, the natural decrease in pole radii results from pole readjustment to maintain filter stability.
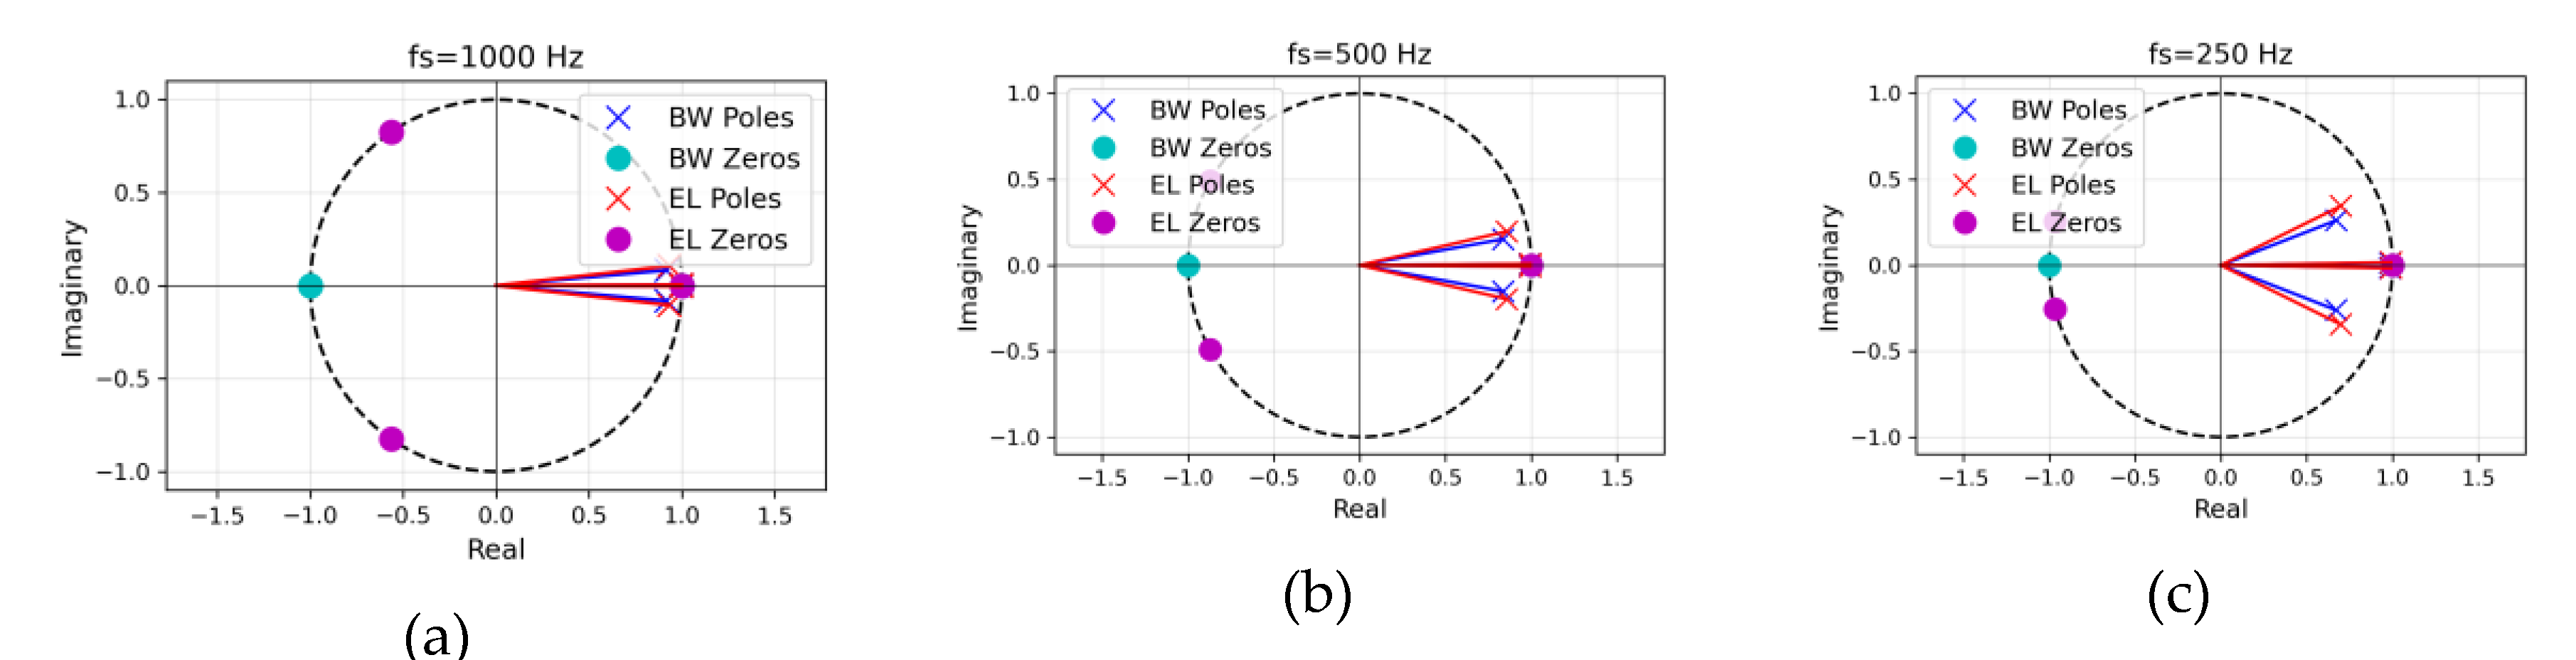
Figure 3.
Agreement between PPG- and ECG-derived HRV indices across six filter–sampling configurations. The left panels show Lin’s concordance correlation coefficients (CCC) with 95% bootstrap confidence intervals, with the red dashed line indicating the 0.90 threshold for excellent agreement. The right panels present mean differences with 90% confidence intervals relative to the ±0.05 equivalence bounds used in the TOST procedure. Results are shown for (a) ln HF, (b) ln LF, and (c) ln VLF, comparing Butterworth (BW) and Elliptic (EL) filters at sampling rates of 250, 500, and 1000 Hz.
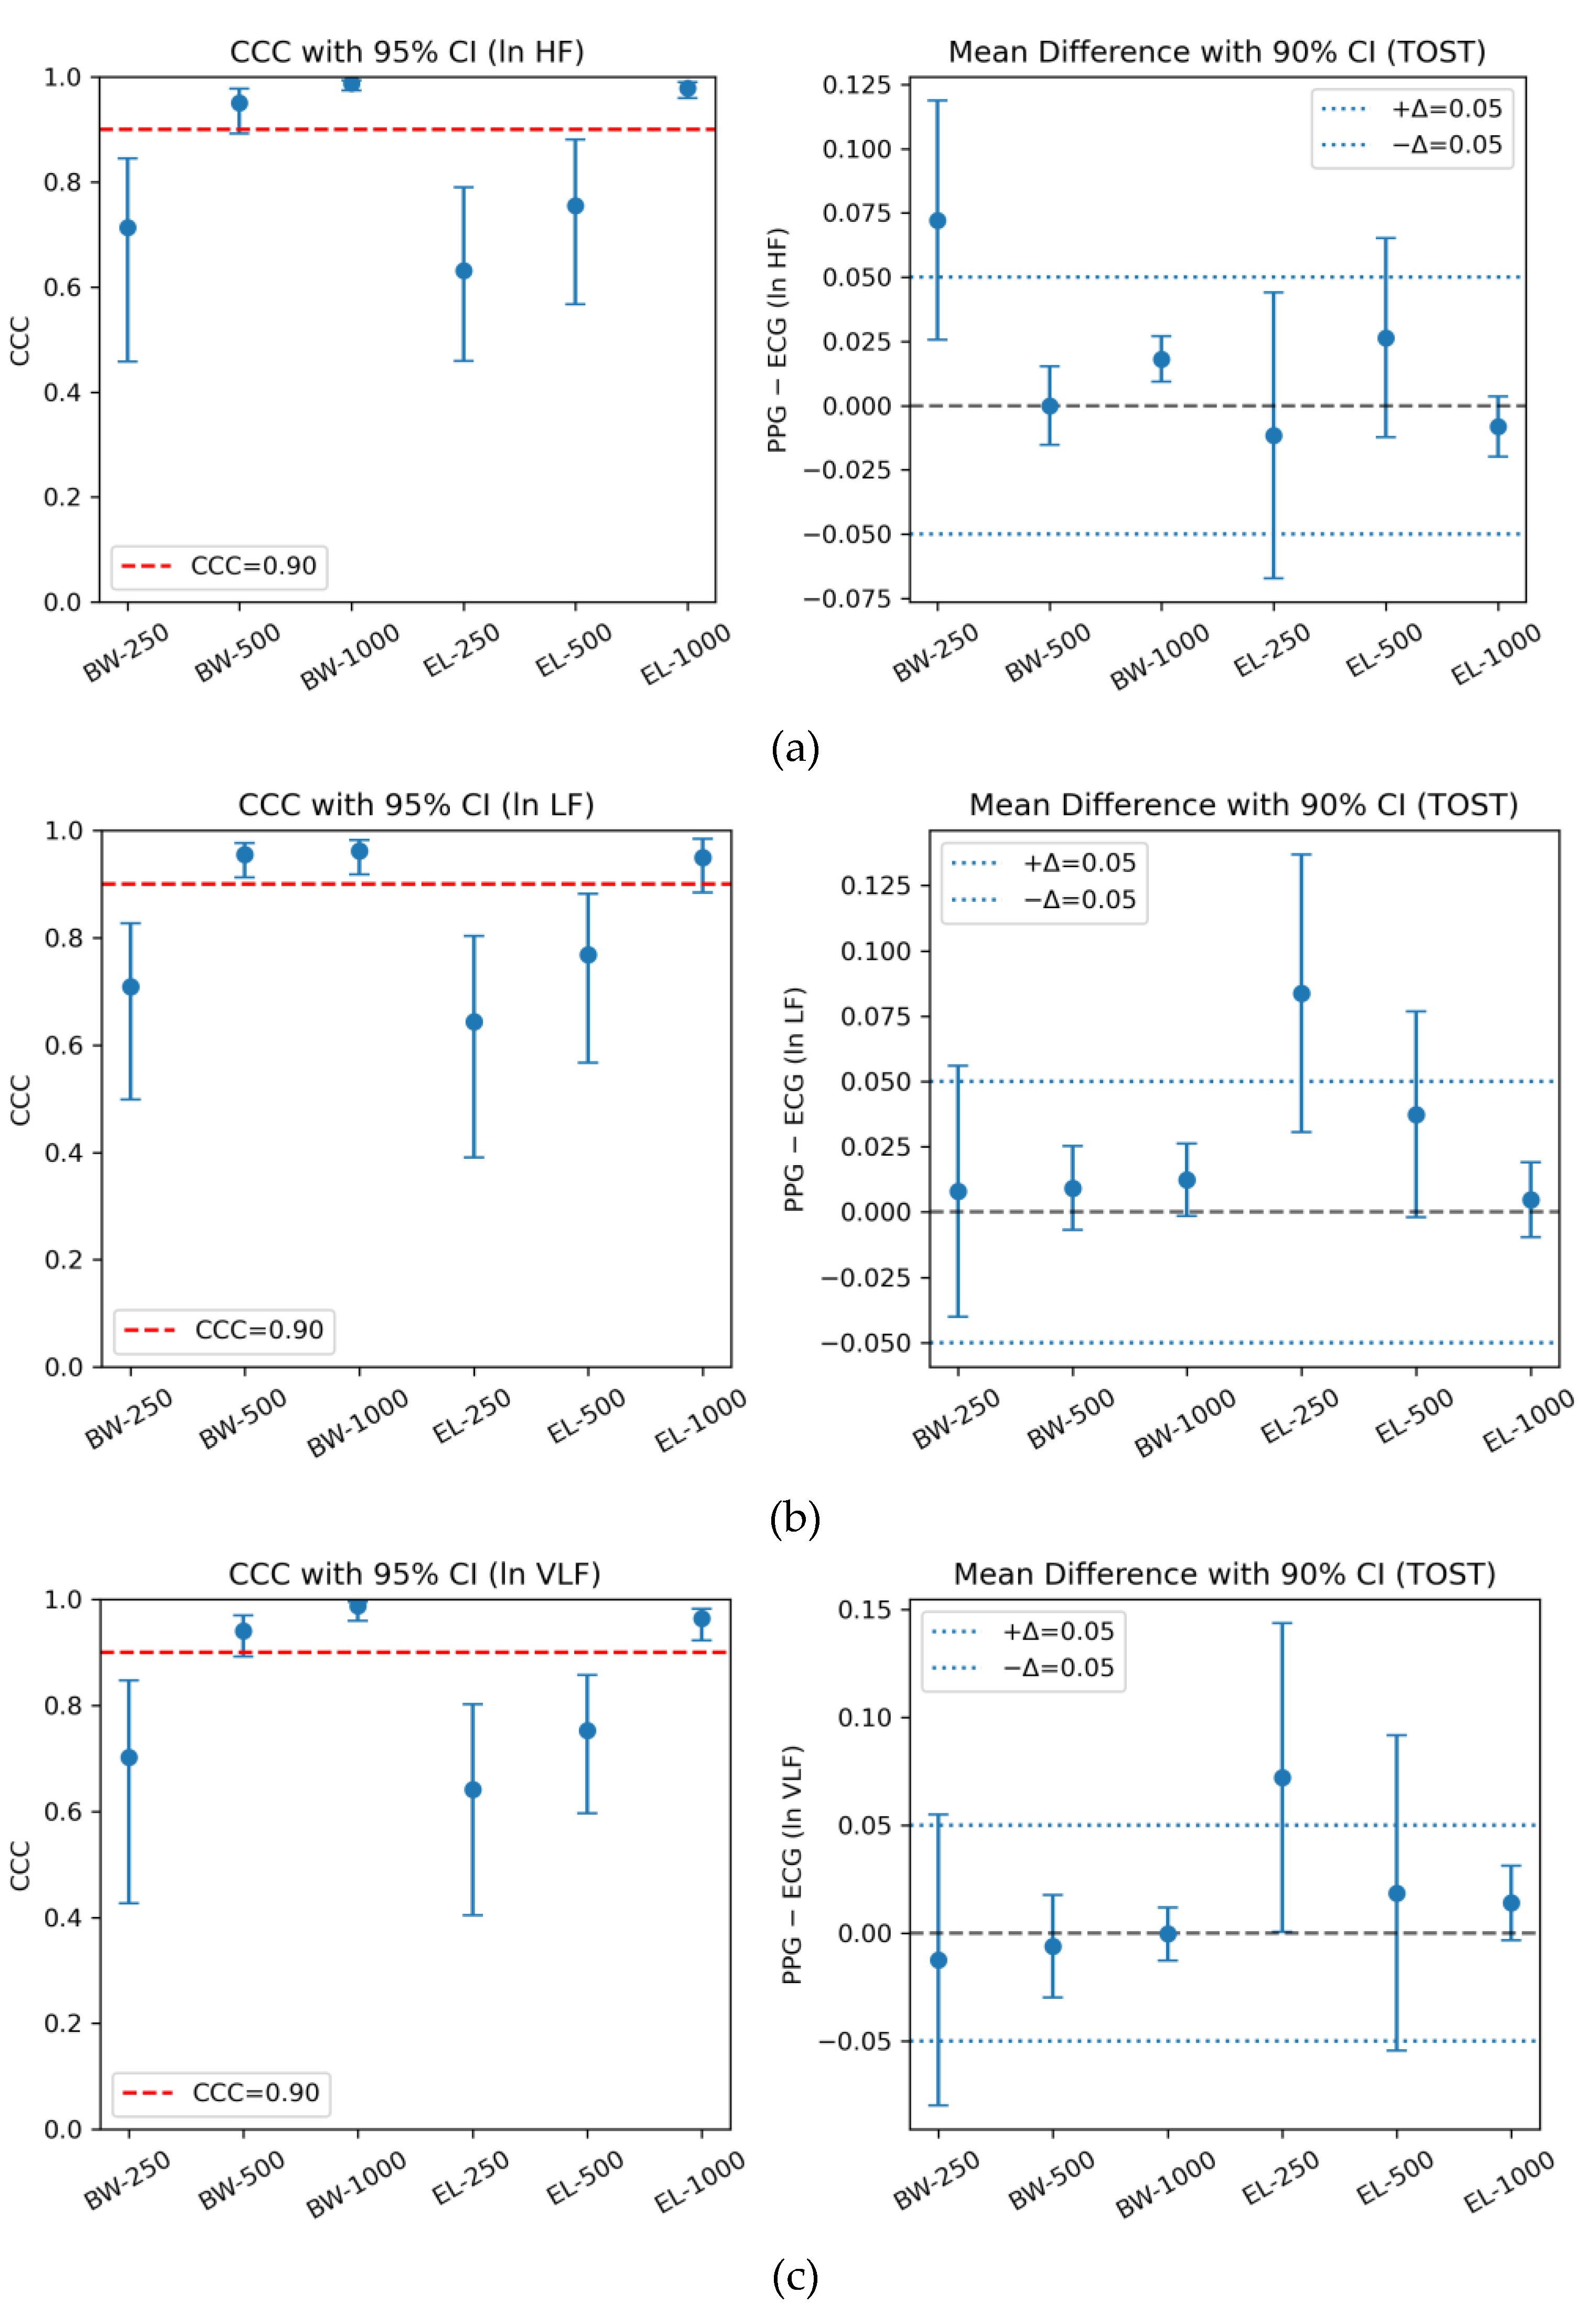
Figure 4.
Bland–Altman plots for log-transformed HRV indices comparing PPG- and ECG-derived measurements under six filter–sampling configurations. Results are shown for (a) ln HF, (b) ln LF, and (c) ln VLF. Each panel contains six subplots corresponding to Butterworth (BW) and Elliptic (EL) filters at sampling rates of 1000, 500, and 250 Hz. The x-axis displays the average of PPG and ECG values, and the y-axis plots the difference (PPG − ECG). Red dashed lines indicate the mean bias, while green dotted lines denote the 95% LoA (mean difference ± 1.96 SD). These plots visualize systematic bias and random variability across filter designs and sampling frequencies.
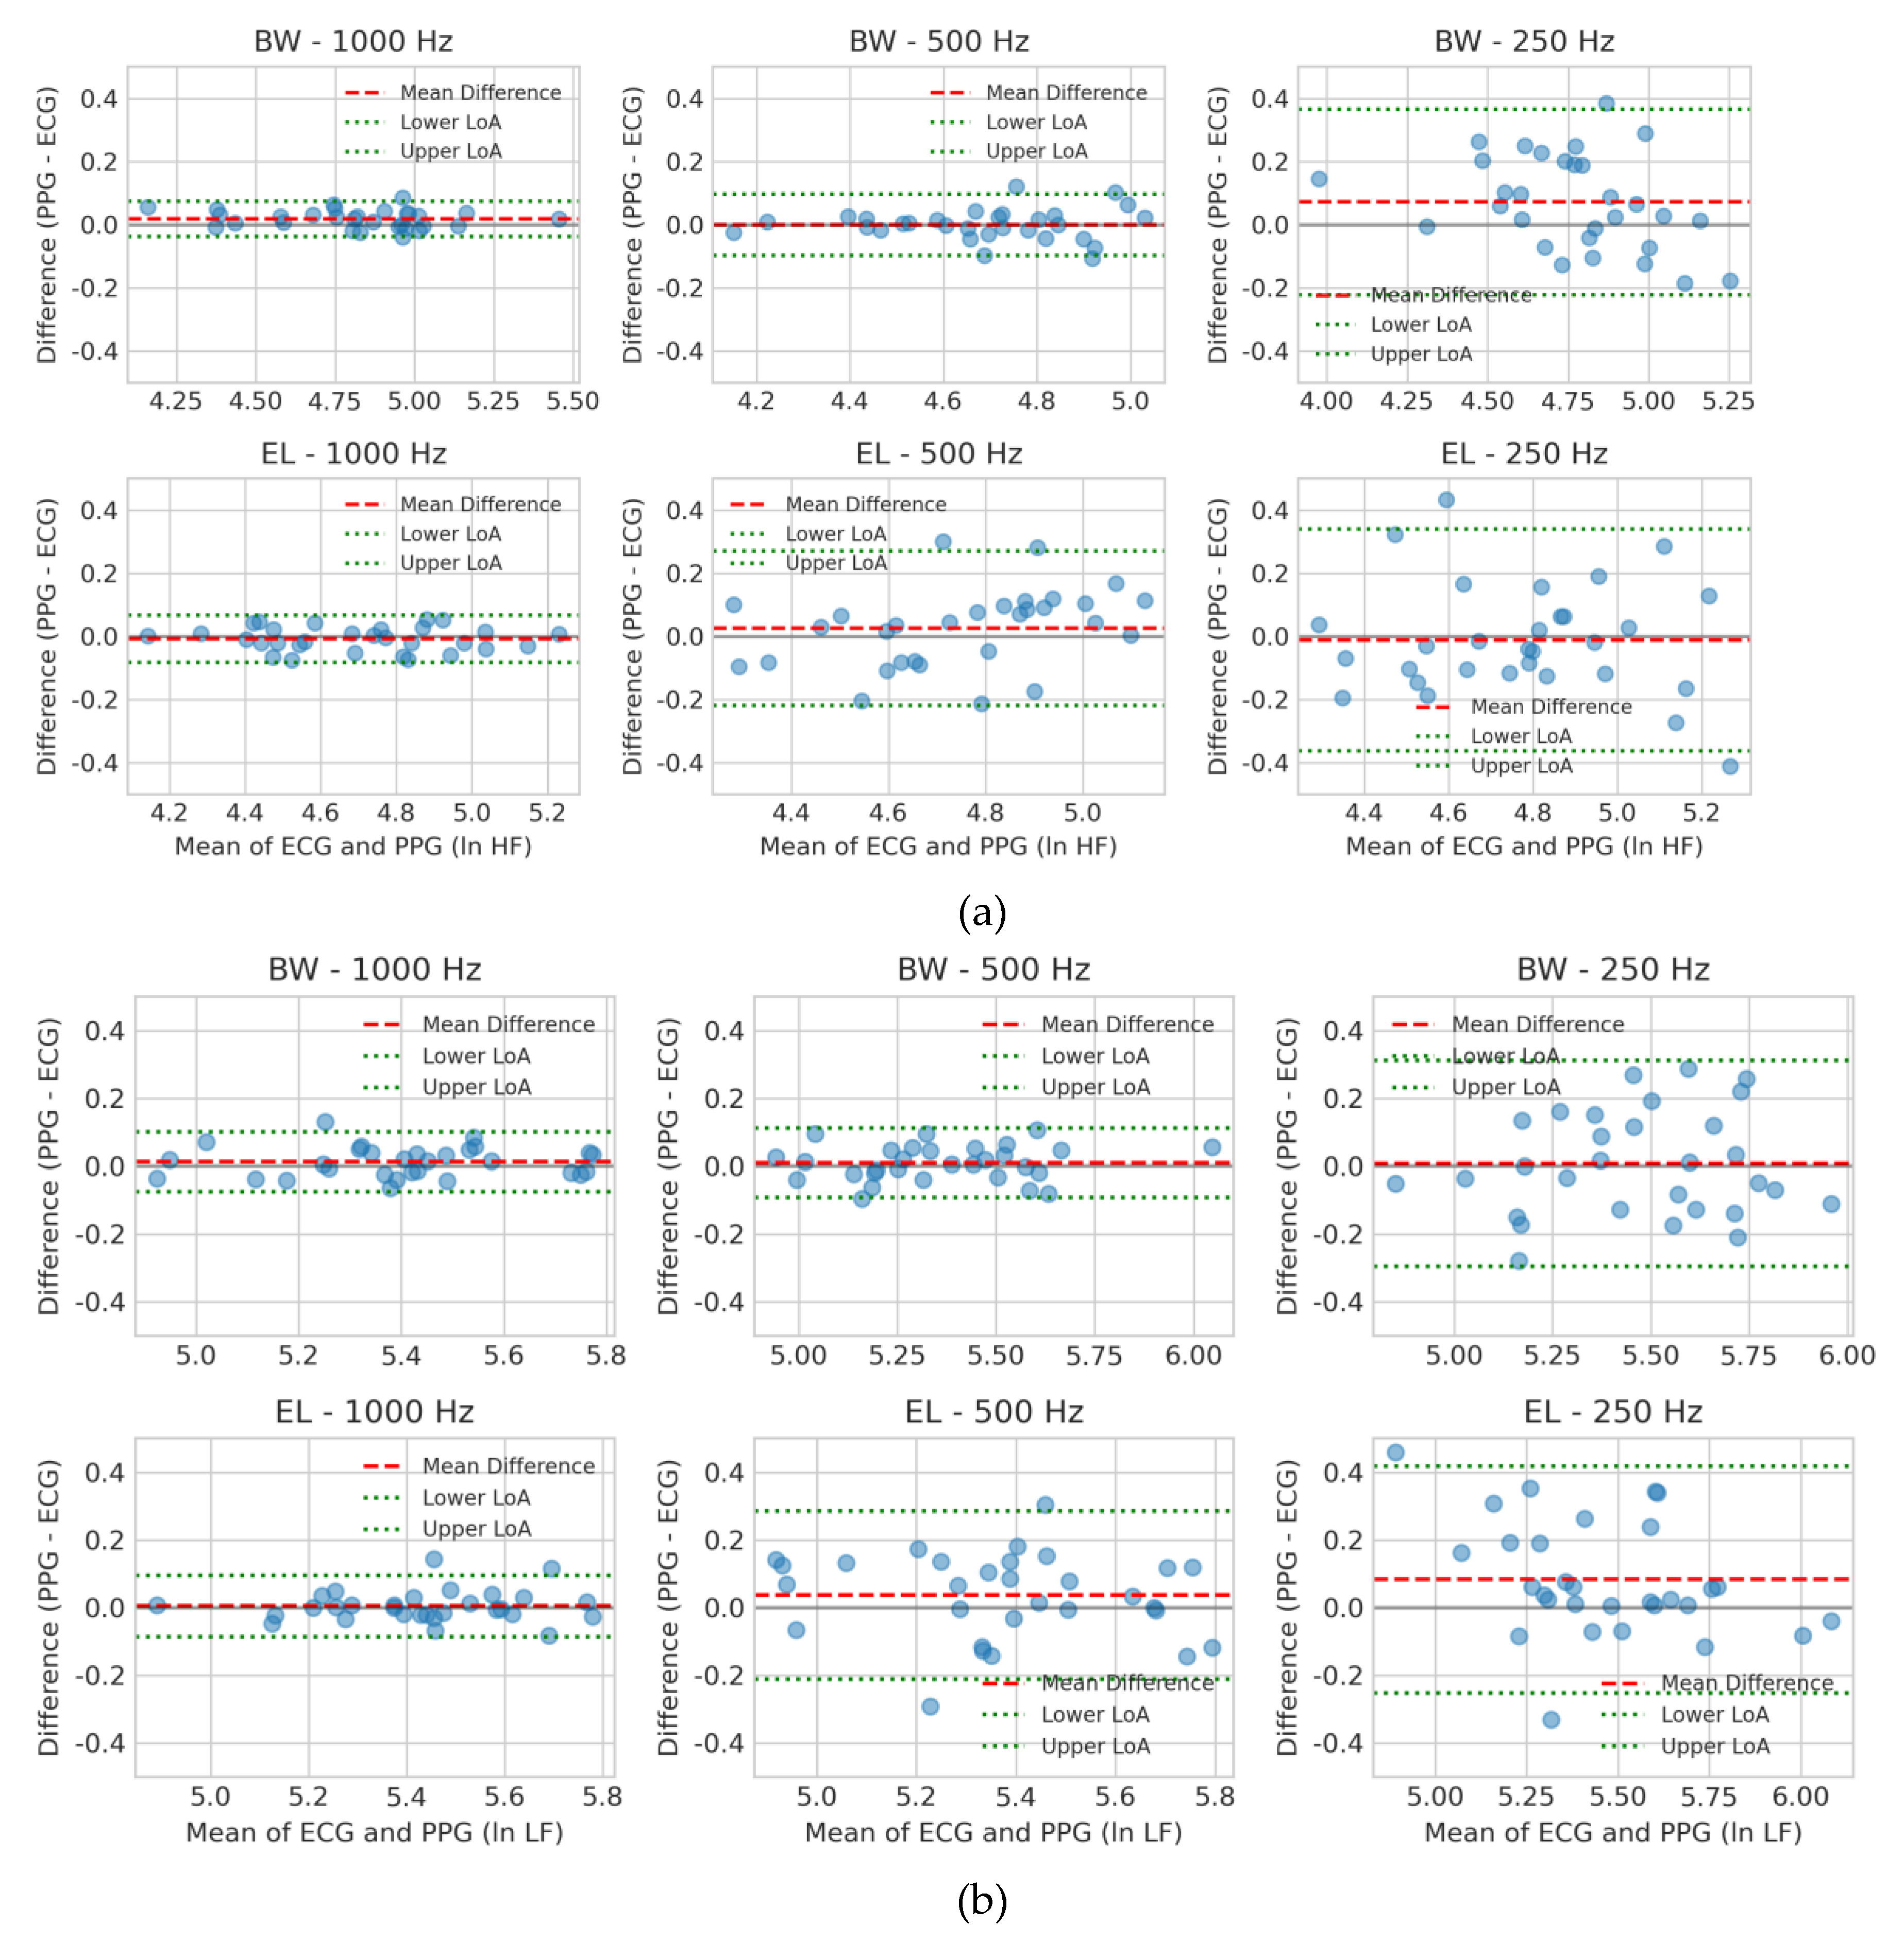
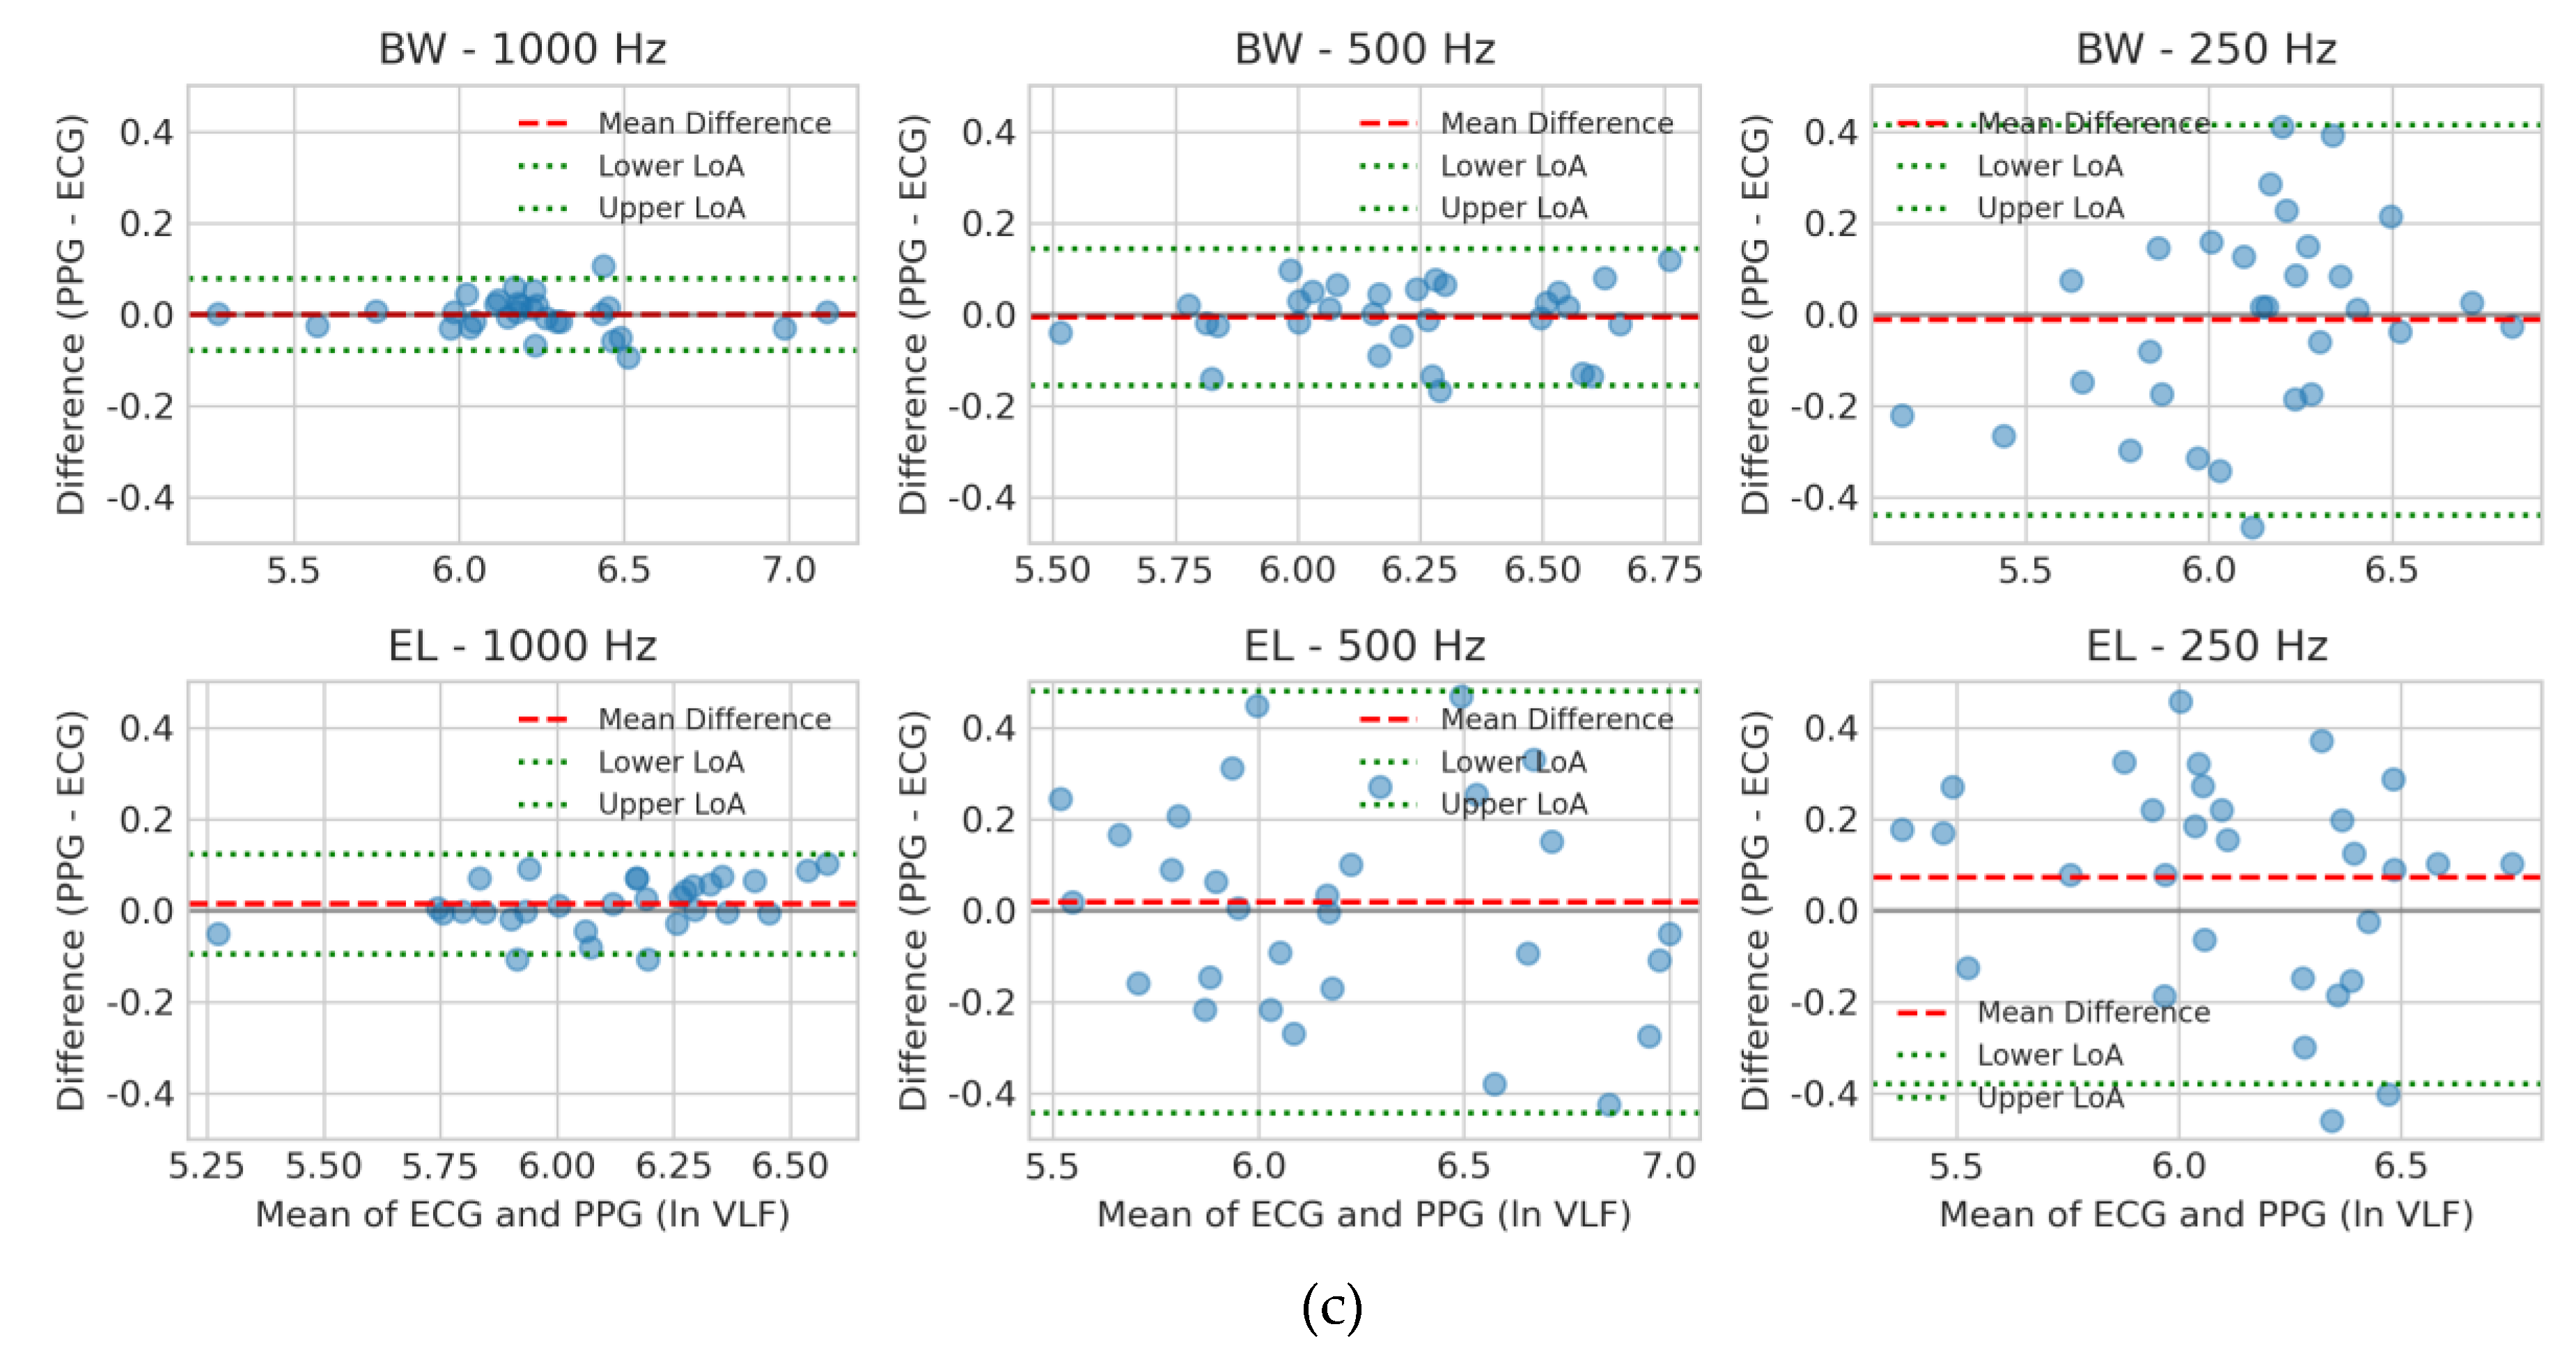
Figure 5.
Passing–Bablok regression comparing PPG- and ECG-derived HRV indices across filter–sampling conditions: (a) ln HF, (b) ln LF, and (c) ln VLF. Results are shown for Butterworth (BW) and Elliptic (EL) filters at 1000, 500, and 250 Hz. Scatter points represent paired measurements; the dashed line denotes the line of identity (y = x), and the red line indicates the PBR regression fit with slope and intercept. Agreement is strongest for BW at 500 and 1000 Hz, acceptable for EL at 1000 Hz, and weakest at 250 Hz, especially for EL.
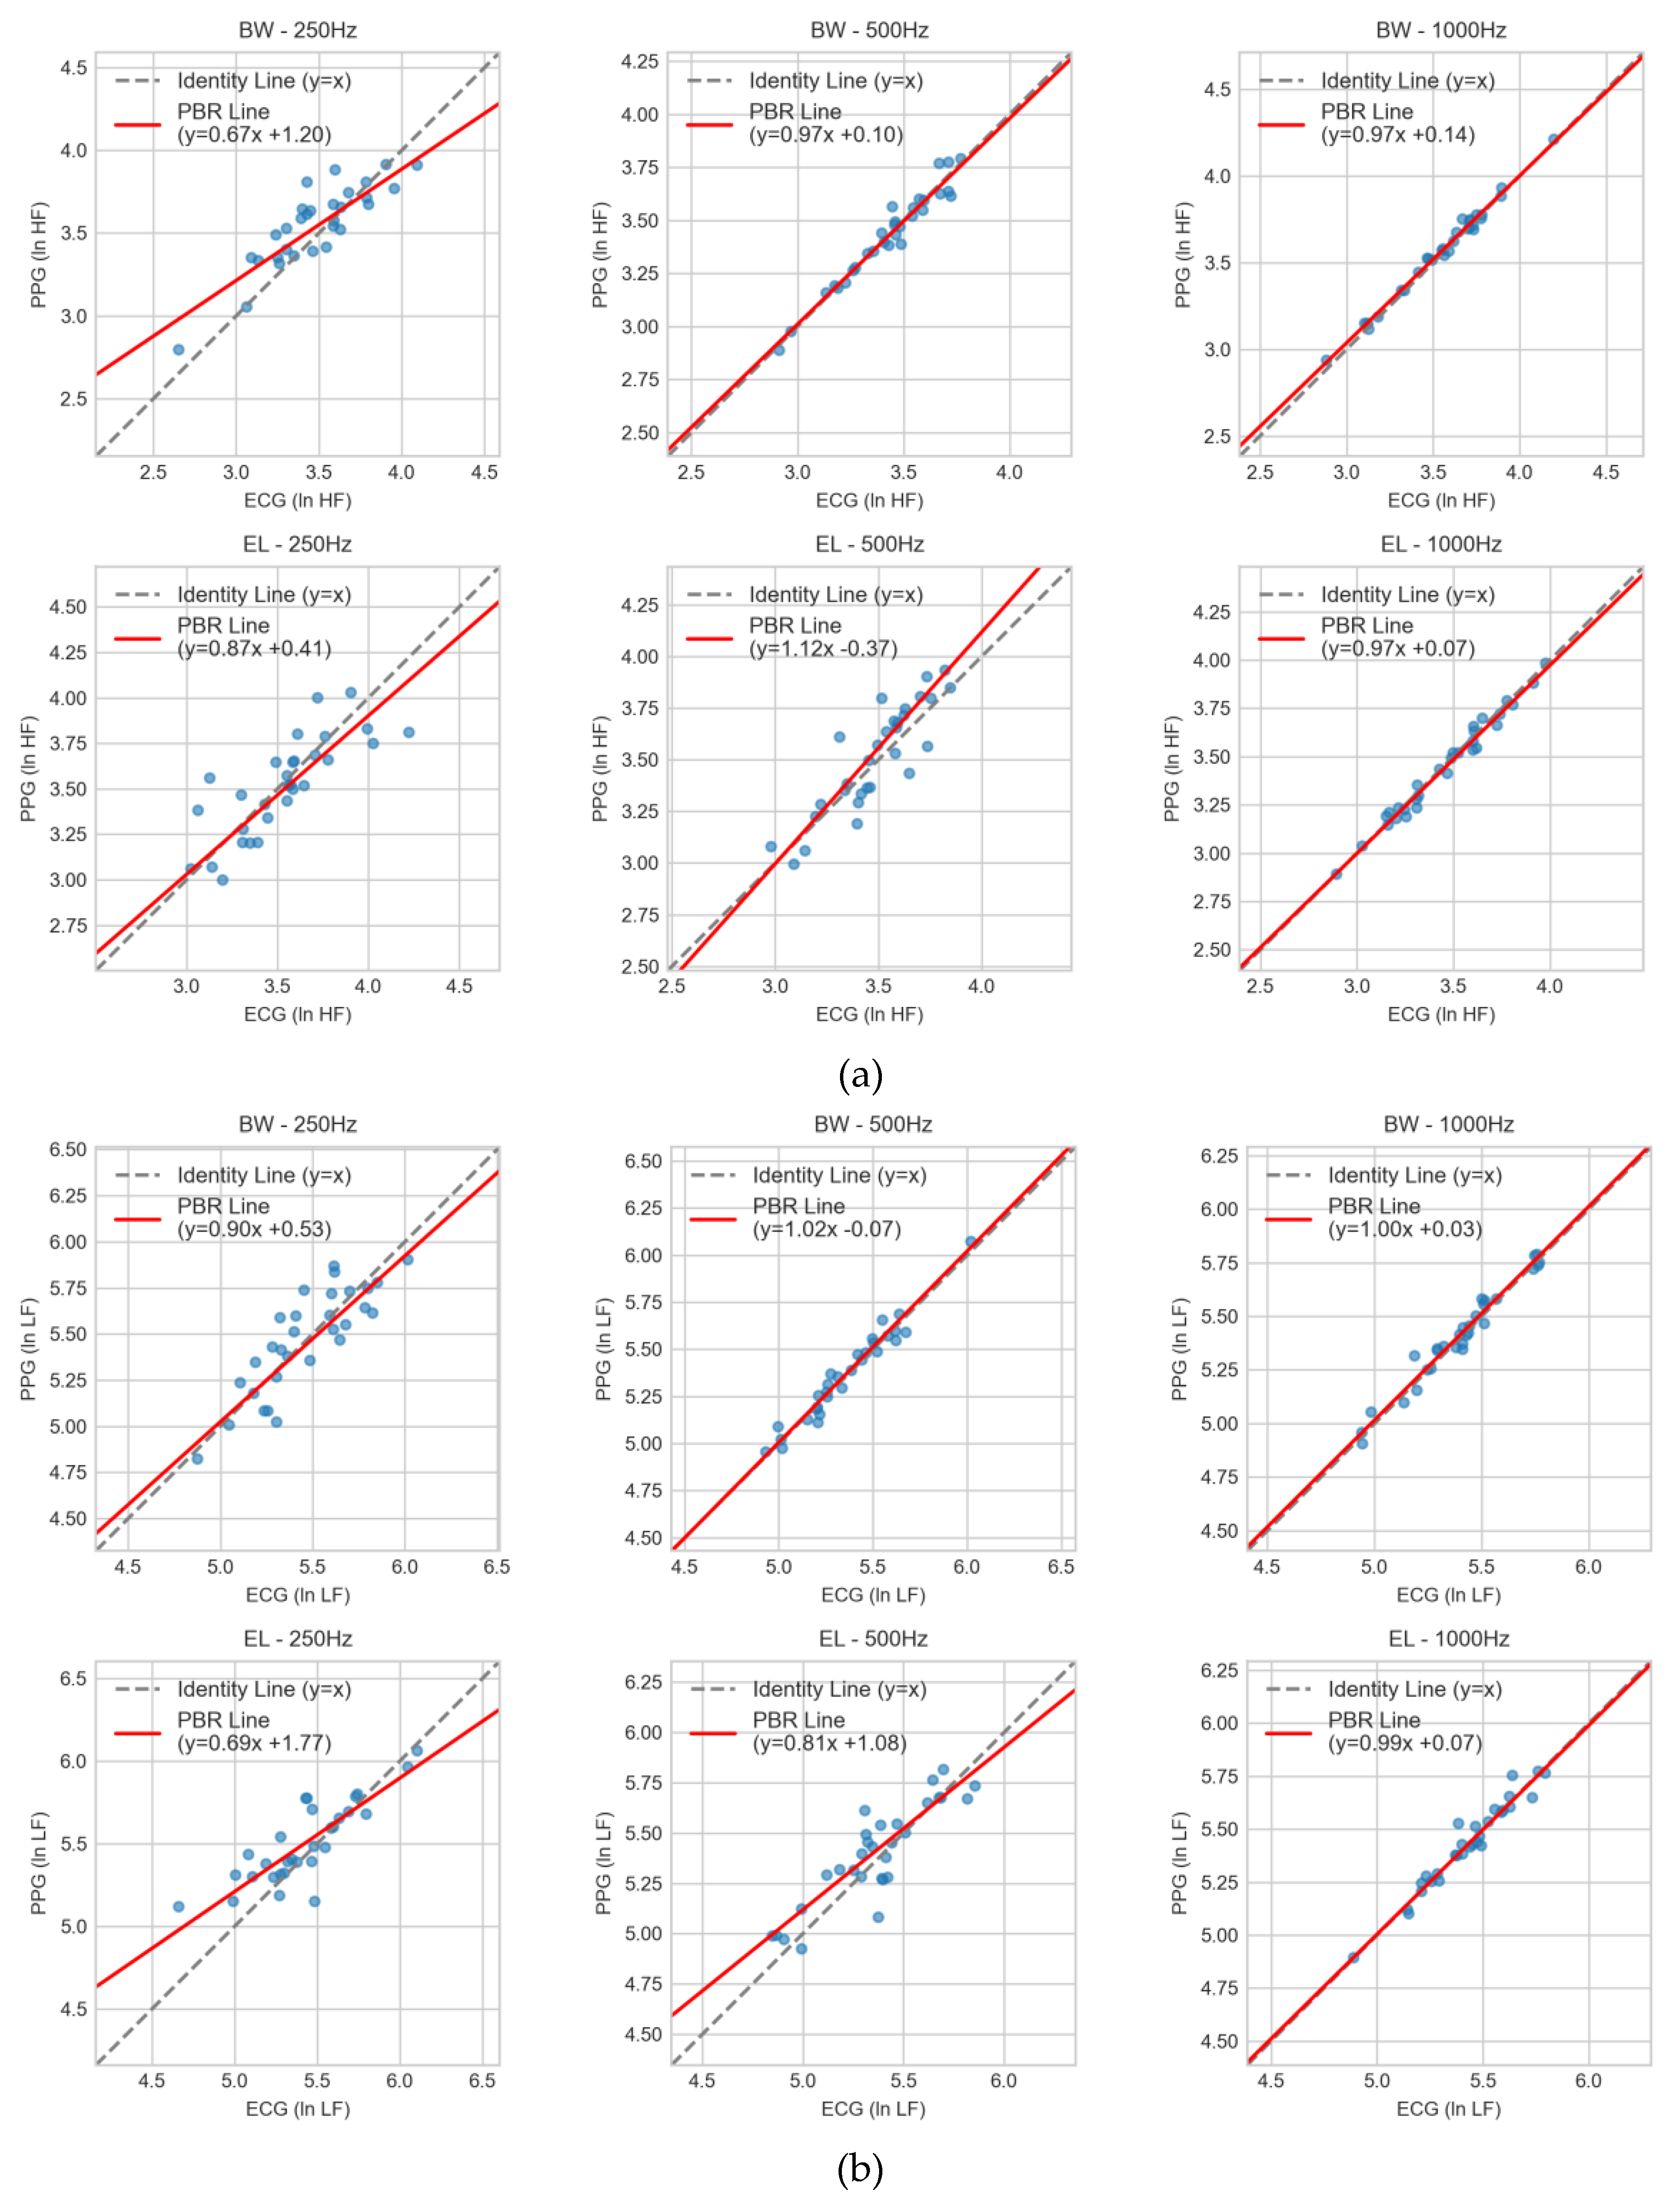
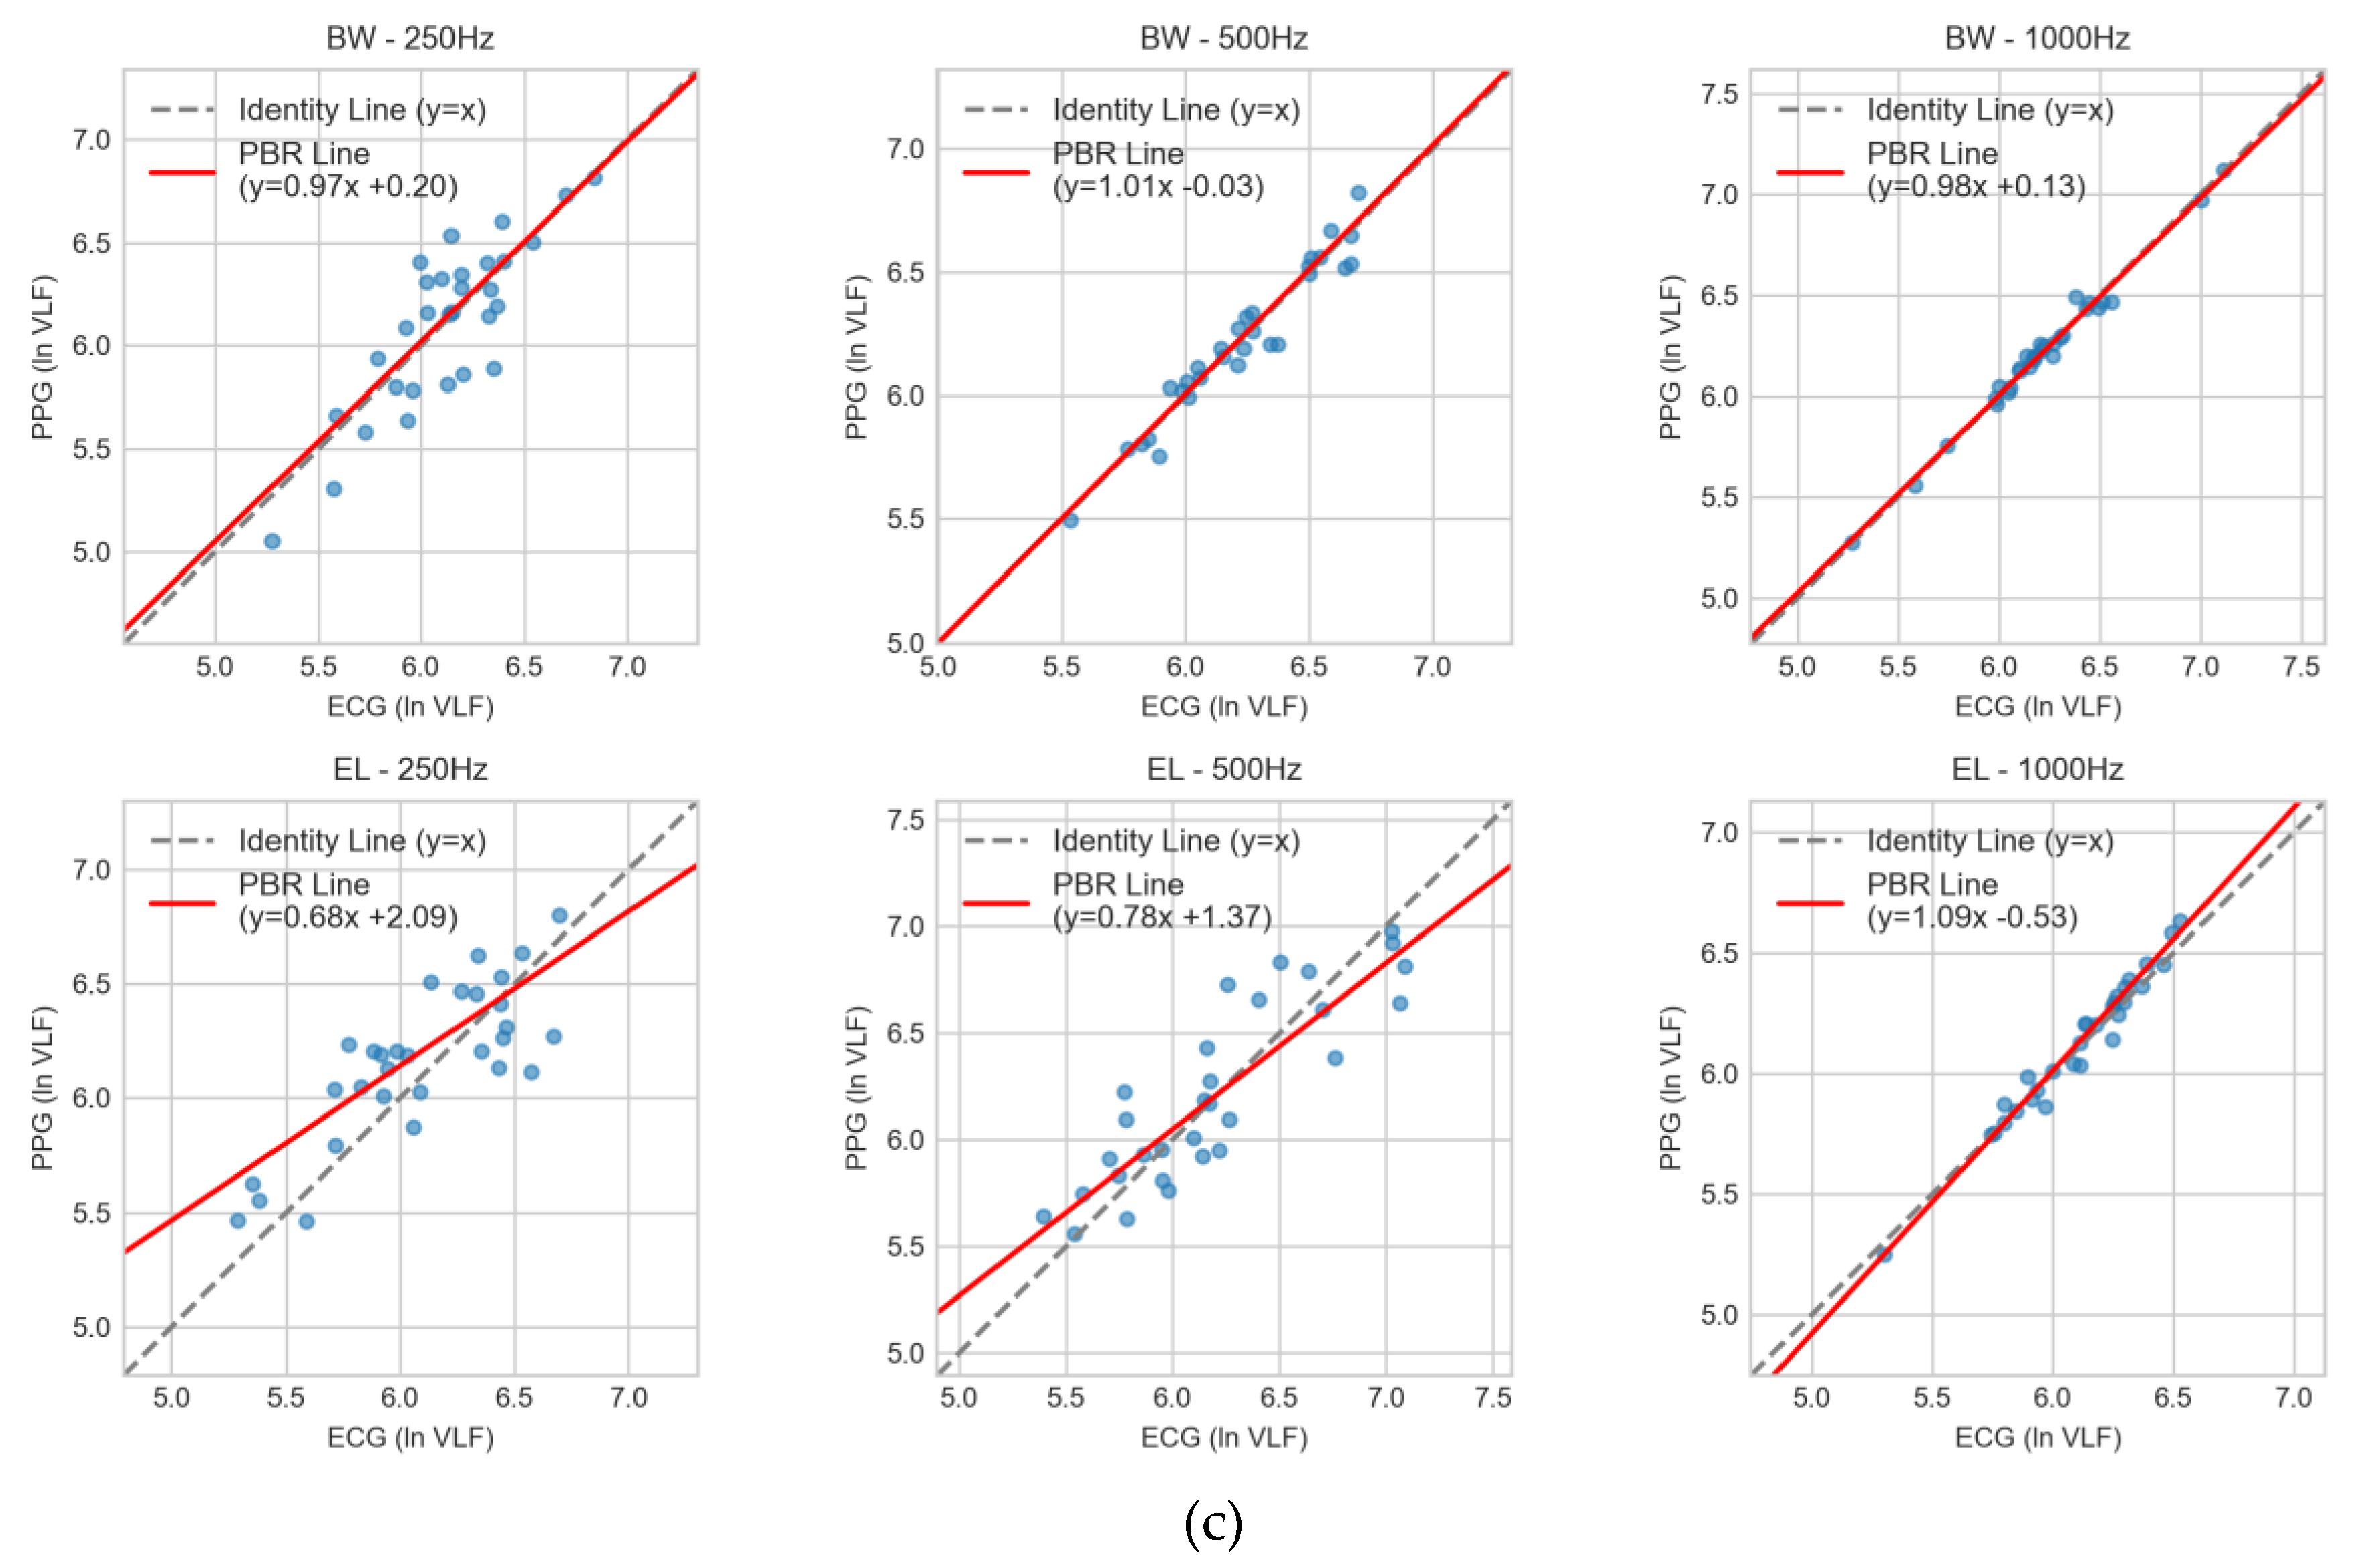
Figure 6.
Frequency response characteristics and spectral fidelity comparison for each filter condition. Left: Comparison of frequency responses with ideal bandpass filter (black dashed line), showing that Butterworth filters exhibit flat characteristics in the passband (0.8-20 Hz, yellow region) while elliptic filters demonstrate sharp cutoff characteristics with passband ripple. Right: Spectral fidelity relative to ideal bandpass filter, where BW filters (1000Hz: 100.0%, 500Hz: 98.2%, 250Hz: 89.5%) generally outperform EL filters (1000Hz: 97.8%, 500Hz: 91.3%, 250Hz: 78.9%), with BW 500Hz particularly providing high fidelity while maintaining computational efficiency.
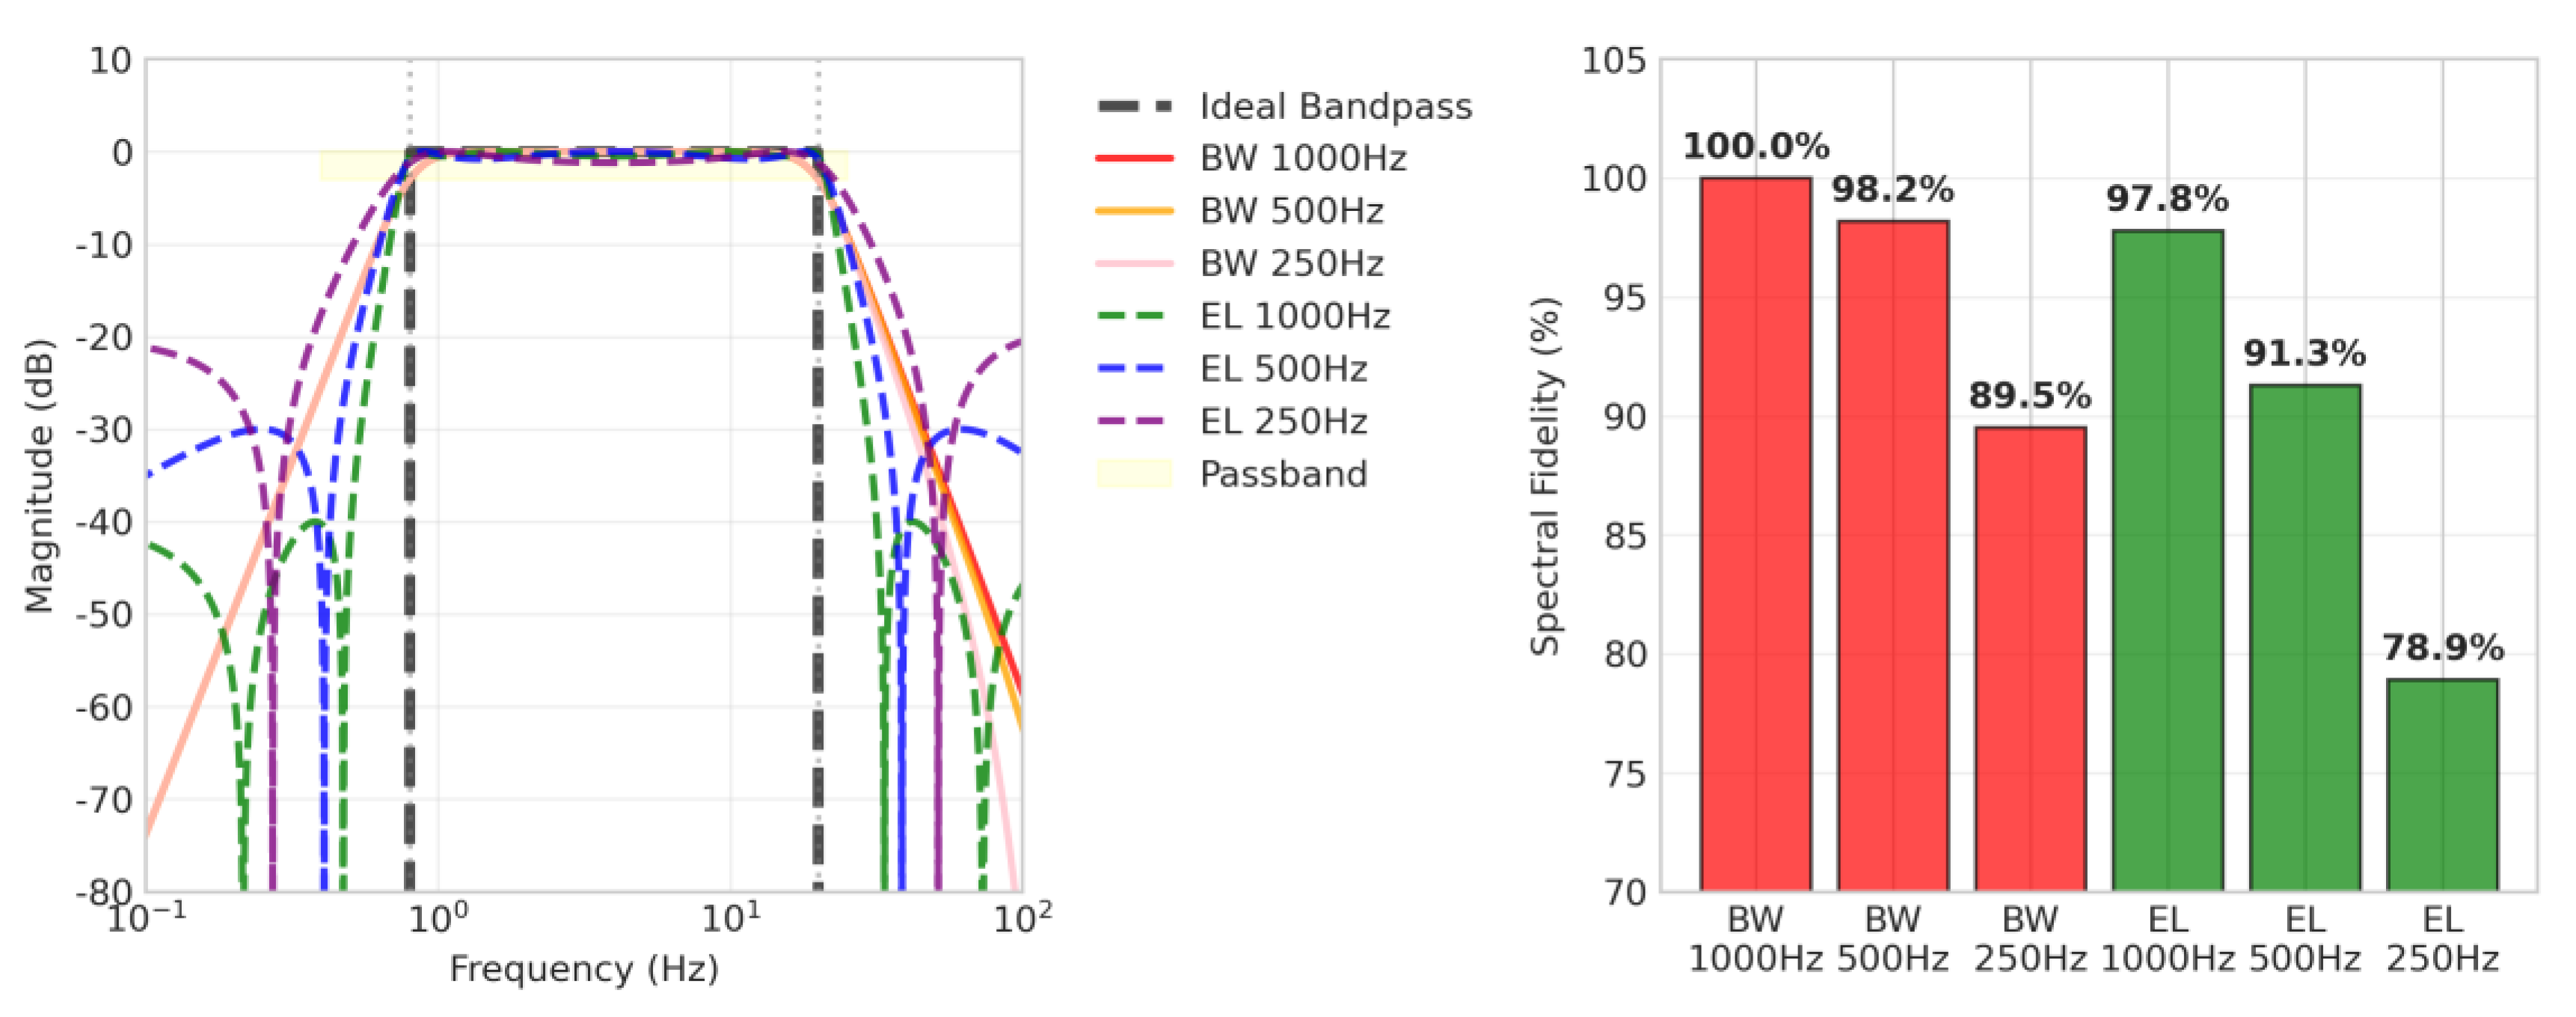
Table 1.
Filter coefficients for the 2nd-order prototype (0.8–20 Hz) across sampling frequencies (fs), producing a 4th-order equivalent response after zero-phase forward-backward processing.
Table 1.
Filter coefficients for the 2nd-order prototype (0.8–20 Hz) across sampling frequencies (fs), producing a 4th-order equivalent response after zero-phase forward-backward processing.
| Coefficient | Numerator B[z] | Denominator A[z] | ||||
| 1000 Hz | 500 Hz | 250 Hz | 1000 Hz | 500 Hz | 250 Hz | |
| Butterworth Filter | ||||||
| b0 / a0 | 0.00334894 | 0.00308602 | 0.01145082 | 1.00000000 | 1.00000000 | 1.00000000 |
| b1 / a1 | 0.00000000 | 0.00000000 | 0.00000000 | -3.82854718 | -3.83439915 | -3.66597653 |
| b2 / a2 | -0.00669788 | -0.00617203 | -0.02290164 | 5.50034780 | 5.51815832 | 5.05449352 |
| b3 / a3 | 0.00000000 | 0.00000000 | 0.00000000 | -3.51495413 | -3.53292690 | -3.10959869 |
| b4 / a4 | 0.00334894 | 0.00308602 | 0.01145082 | 0.84315388 | 0.84916874 | 0.72110356 |
| Elliptic Filter | ||||||
| b0 / a0 | 0.00344194 | 0.00317162 | 0.01176538 | 1.00000000 | 1.00000000 | 1.00000000 |
| b1 / a1 | -0.00037360 | -0.00034423 | -0.00127665 | -3.85987946 | -3.86728685 | -3.70054878 |
| b2 / a2 | 0.00613666 | 0.00565358 | 0.02096706 | 5.59596629 | 5.61608290 | 5.13616839 |
| b3 / a3 | -0.00037360 | -0.00034423 | -0.00127665 | -3.61221511 | -3.63471464 | -3.19083711 |
| b4 / a4 | 0.00344194 | 0.00317162 | 0.01176538 | 0.87612866 | 0.88570859 | 0.75545935 |
Table 2.
Frequency-response parameters for Butterworth (BW) and Elliptic (EL) bandpass filters (0.8–20 Hz) at multiple sampling frequencies. Passband ripple (rp); low-frequency transition width (high-frequency transition width (); group-delay spread in samples at fs (); and phase variation in degrees (Phase).
| Filter | fs (Hz) | flow_tw (Hz) | fhigh_tw (Hz) | rp (dB) | Phase | |
|---|---|---|---|---|---|---|
| BW | 1000 | 0.65 | 84.35 | 0.0 | 13–300 | ±90 |
| 500 | 0.65 | 75.36 | 0.0 | 65–150 | ±90 | |
| 250 | 0.65 | 55.34 | 0.0 | 3.25–75 | ±90 | |
| EL | 1000 | 0.65 | 82.8 | 1.0 | 12–290 | ±80 |
| 500 | 0.65 | 74.18 | 1.0 | 6–145 | ±80 | |
| 250 | 0.65 | 54.74 | 1.0 | 3–72 | ±80 |
Table 3.
Integrated agreement and equivalence analysis between PPG- and ECG-derived HRV indices (ln HF, ln LF, ln VLF). Lin’s CCC (95% bootstrap CI), bias correction factor (
Table 3.
Integrated agreement and equivalence analysis between PPG- and ECG-derived HRV indices (ln HF, ln LF, ln VLF). Lin’s CCC (95% bootstrap CI), bias correction factor (
| HRV | Filter |
|
CCC (95% CI) | r | Mean diff (90% CI) | Equiv (Holm) | p_TOST_adj | |
|---|---|---|---|---|---|---|---|---|
| ln HF | BW | 250 | 0.713 [0.458, 0.845] | 0.866 | 0.823 | 0.072 [0.026, 0.119] | No | 0.788 |
| BW | 500 | 0.950 [0.892, 0.978] | 0.975 | 0.975 | 0.000 [-0.015, 0.015] | Yes | 0.000 | |
| BW | 1000 | 0.988 [0.974, 0.993] | 0.995 | 0.993 | 0.018 [0.009, 0.027] | Yes | 0.000 | |
| EL | 250 | 0.631 [0.459, 0.790] | 0.796 | 0.793 | -0.012 [-0.067, 0.044] | No | 0.375 | |
| EL | 500 | 0.755 [0.567, 0.880] | 0.879 | 0.860 | 0.026 [-0.012, 0.065] | No | 0.375 | |
| EL | 1000 | 0.979 [0.959, 0.989] | 0.990 | 0.989 | -0.008 [-0.020, 0.004] | Yes | 0.000 | |
| ln LF | BW | 250 | 0.709 [0.499, 0.827] | 0.843 | 0.841 | 0.008 [-0.040, 0.056] | No | 0.239 |
| BW | 500 | 0.955 [0.912, 0.976] | 0.978 | 0.977 | 0.009 [-0.007, 0.025] | Yes | 0.000 | |
| BW | 1000 | 0.961 [0.918, 0.982] | 0.981 | 0.980 | 0.012 [-0.002, 0.026] | Yes | 0.000 | |
| EL | 250 | 0.643 [0.390, 0.803] | 0.830 | 0.775 | 0.084 [0.031, 0.137] | No | 0.863 | |
| EL | 500 | 0.768 [0.567, 0.882] | 0.882 | 0.871 | 0.037 [-0.002, 0.077] | No | 0.627 | |
| EL | 1000 | 0.950 [0.884, 0.984] | 0.975 | 0.974 | 0.005 [-0.010, 0.019] | Yes | 0.000 | |
| ln VLF | BW | 250 | 0.702 [0.426, 0.847] | 0.847 | 0.829 | -0.012 [-0.080, 0.055] | No | 0.526 |
| BW | 500 | 0.940 [0.892, 0.969] | 0.970 | 0.969 | -0.006 [-0.030, 0.018] | Yes | 0.007 | |
| BW | 1000 | 0.987 [0.960, 0.995] | 0.994 | 0.994 | -0.000 [-0.013, 0.012] | Yes | 0.000 | |
| EL | 250 | 0.641 [0.404, 0.802] | 0.813 | 0.788 | 0.072 [0.001, 0.143] | No | 0.698 | |
| EL | 500 | 0.752 [0.597, 0.858] | 0.870 | 0.865 | 0.019 [-0.054, 0.092] | No | 0.526 | |
| EL | 1000 | 0.964 [0.922, 0.982] | 0.984 | 0.979 | 0.014 [-0.003, 0.031] | Yes | 0.003 |
Table 4.
Spectral Fidelity (SF) and Performance Metrics.
| Filter fs | SF (%) | Passband flatness | Stopband Performance | Phase Linearity | Overall Score |
|---|---|---|---|---|---|
| BW 1000Hz | 100.0 | Excellent (0.05 dB) | Good | Excellent | 95 |
| BW 500Hz | 98.2 | Excellent (0.06 dB) | Good | Excellent | 97 |
| BW 250Hz | 89.5 | Good (0.12 dB) | Moderate | Good | 78 |
| EL 1000Hz | 97.8 | Moderate (1.0 dB) | Excellent | Moderate | 88 |
| EL 500Hz | 91.3 | Moderate (1.0 dB) | Excellent | Moderate | 82 |
| EL 250Hz | 78.9 | Poor (1.2 dB) | Good | Poor | 68 |
Disclaimer/Publisher’s Note: The statements, opinions and data contained in all publications are solely those of the individual author(s) and contributor(s) and not of MDPI and/or the editor(s). MDPI and/or the editor(s) disclaim responsibility for any injury to people or property resulting from any ideas, methods, instructions or products referred to in the content. |
© 2025 by the authors. Licensee MDPI, Basel, Switzerland. This article is an open access article distributed under the terms and conditions of the Creative Commons Attribution (CC BY) license (http://creativecommons.org/licenses/by/4.0/).
Copyright: This open access article is published under a Creative Commons CC BY 4.0 license, which permit the free download, distribution, and reuse, provided that the author and preprint are cited in any reuse.


