Submitted:
03 November 2025
Posted:
04 November 2025
You are already at the latest version
Abstract
Sustainable forest management requires a comprehensive understanding of how stand density regulates soil ecological processes. This study investigated the effects of stand density on soil properties and microbial communities in a Larix principis-rupprechtii plantation by combining high-throughput sequencing with soil physicochemical analysis to identify the optimal density regime for maintaining soil health. Results demonstrated that moderate-density (MD) management best balanced the stability of soil ecosystem structure, showing superior water retention, organic carbon content, and microbial diversity in the 0-30 cm soil layer. The mechanism underlying these improvements can be attributed to the moderately open canopy structure in MD stands, which facilitated efficient litter decomposition and drove functional complementarity between Basidiomycota (enhancing cellulose degradation capacity) and Acidobacteriota (adapted to oligotrophic conditions). Redundancy analysis revealed that soil pH and available nutrients (AK, AP) were key environmental factors driving microbial community restructuring: Actinobacteriota dominated in neutral, phosphorus-rich environments, while Acidobacteriota thrived under acidic, phosphorus-limited conditions. Fungal communities showed high sensitivity to management intensity, with significant shifts between Ascomycota and Basidiomycota, whereas bacterial communities remained relatively stable due to functional redundancy. We recommend the adoption of moderate-density management as a sustainable practice to enhance soil nutrient cycling and maintain microbial diversity, thereby providing scientific support for sustainable plantation management.
Keywords:
Larix principis-rupprechtii
; plantation forest
; plant–microbe–soil interactions
; stand density
; microbial diversity
1. Introduction
Forest ecosystems are a vital component of the terrestrial biosphere, whose structure and function are influenced by a variety of biological and abiotic factors. Among these, stand density-a key indicator in forest management-directly affects the micro-environmental conditions within forests (such as light, temperature, and humidity) and soil physicochemical properties (such as organic matter content, pH, and nutrient cycling), thereby regulating belowground ecological processes [1]. Soil microorganisms, as core drivers of the forest belowground ecosystem, participate in critical ecological functions including organic matter decomposition, nutrient transformation, and plant-soil feedbacks [2]. Stand density indirectly alters soil microclimate and resource availability by regulating canopy structure and understory conditions. High stand density typically leads to reduced light penetration and increased humidity, which slows down litter decomposition and affects the input of soil organic matter. In contrast, low stand density, characterized by sufficient light and better ventilation, may accelerate litter mineralization and promote nutrient release [3]. Furthermore, stand density influences root distribution and the composition of root exudates, thereby modifying the availability of soil carbon sources [4]. These changes may further impact microbial metabolic activity and community structure.
Soil microorganisms (including bacteria, fungi, archaea, etc.) are key biological groups driving material cycling and energy flow in forest ecosystems. Bacteria (such as Proteobacteria and Acidobacteria) play important roles in carbon and nitrogen cycling, while fungi (such as Ascomycota and Basidiomycota) predominantly govern lignin degradation and mycorrhizal symbiosis [5]. Microbial diversity is generally positively correlated with ecosystem stability, where high diversity implies stronger functional redundancy and environmental adaptability [6]. Therefore, understanding how stand density affects microbial community composition and diversity contributes to evaluating the long-term impacts of different management models on soil health.
Currently, there is a growing body of research on the effects of stand density on soil microorganisms, yet the findings remain inconsistent. For example, some studies suggest that high stand density may promote the enrichment of certain functional microbial groups (such as saprotrophic fungi) due to increased litter input [7]; whereas others have found that low stand density, with its higher resource availability, may support greater microbial diversity [8]. These discrepancies may arise from confounding factors such as forest type, climatic conditions, or soil properties. Moreover, most existing studies focus solely on individual groups such as bacteria or fungi, overlooking the integrated response of the microbial community and its functional implications.
Larix principis-rupprechtii, as a pioneer afforestation species in northern China, widely distributed across the North and Northwest regions, and is characterized by its strong adaptability and rapid growth. In recent years, due to the large-scale establishment of plantations, the impact of its management practices-such as thinning and density control-on ecosystem functioning has garnered increasing attention. However, research on how stand density affects soil microbial communities by altering the soil micro-environment remains limited, particularly in temperate plantation ecosystems. Therefore, this study investigates the influence of different stand densities on the composition and diversity of soil microorganisms in Chinese larch plantations, aiming to provide a scientific basis for optimizing forest management strategies and sustaining soil ecological functions.
2. Results
2.1. Differences in Soil Physicochemical Properties Among Chinese Fir Plantations with Different Stand Densities
2.1.1. Differences in Soil Nutrient Content
Soil water content (SW), pH, soil organic carbon (SOC), total nitrogen (TN), total phosphorus (TP), total potassium (TK), available phosphorus (AP), available potassium (AK), ammonium nitrogen (NH₄⁺-N), and nitrate nitrogen (NO₃⁻-N) content were significantly influenced by different stand retention densities (Figure 1). These parameters generally decreased with increasing soil depth, with all treatments showing significantly higher values in the 0-20 cm layer than in the 20-40 cm layer (P < 0.05). Soil pH decreased significantly with decreasing stand density (P < 0.05), with all soil layers being weakly acidic (range: 6.38-6.89). In the 0-30 cm layer, SW and SOC initially increased and then decreased with reduced stand density, with the moderate density (MD) treatment being significantly higher than the high density (HD), low density (LD), and control (CK) treatments (P < 0.05). No significant differences were observed in the 30-40 cm layer (P > 0.05). In the 0-20 cm layer, TP and TK decreased with decreasing stand density, with HD being significantly higher than MD, LD, and CK (P < 0.05). No significant differences were found in the 20-40 cm layer (P > 0.05). AP in the 0-30 cm layer was lower than in CK, with LD being significantly lower than HD, MD, and CK (P < 0.05). No significant differences were detected in the 30-40 cm layer (P > 0.05). In the 0-20 cm layer, AK exhibited a "V"-shaped pattern with decreasing stand density, and HD was significantly higher than the other treatments (P < 0.05). No significant differences were observed in the 20-40 cm layer (P > 0.05). NH₄⁺-N content decreased with decreasing stand density across all soil layers, and HD was significantly higher than the other treatments (P < 0.05). NO₃⁻-N content in the 0-30 cm layer decreased with decreasing stand density (P < 0.05), while no significant differences were found in the 30-40 cm layer (P > 0.05).
2.1.2. Differences in Soil Enzyme Activity
Different stand densities significantly affected the activities of soil sucrase (S-SUC), cellulase (S-CL), urease (S-URE), and acid phosphatase (S-ACP) (Figure 2). In the 0-30 cm layer, S-SUC and S-CL activities were decreased with reducing stand density, where it was significantly higher in LD and MD than in HD and CK (P < 0.05), with no significant differences in the 30-40 cm layer. S-URE activity was higher in HD and MD than in LD and CK in the 0-20 cm layer (P < 0.05), but showed no significant differences in the 20-40 cm layer. S-ACP activity decreased with decreasing stand density and was significantly higher in MD and LD than in HD and CK (P < 0.05).
2.2. Soil Microbial Community Structure in Chinese Fir Plantations Under Different Stand Densities
2.2.1. Differences in Soil Enzyme Activity
Venn diagrams illustrate the number of shared and unique OTUs across samples. Under the four stand density treatments, 306 fungal OTUs and 4,374 bacterial OTUs were shared among all groups (Figure 3). For the fungal community (Figure 3 a), the CK treatment contained the highest number of unique OTUs (1,599), followed by MD (1,577). As stand density increased, the number of unique fungal OTUs decreased, with the HD treatment showing the fewest (1,437). In the bacterial community (Figure 3 b), the MD treatment supported the most unique OTUs (33,243), followed by LD (29,026), while HD had the fewest (24,773). This indicates that moderate stand density favors the presence of unique bacterial taxa, whereas high stand density may negatively affect the diversity of certain bacterial species. Both bacterial and fungal OTU counts were lowest under the HD treatment, suggesting that excessively high stand density may suppress soil microbial diversity.
2.2.2. Differences in the Phylum-Level Structure of Soil Microorganisms
Figure 4 shows that 16 fungal (677 genera) and 43 bacterial phyla (887 genera) were identified in the Larix principis-rupprechtii plantation. The fungal community was dominated by Ascomycota (58.73% ± 15.27%), Basidiomycota (32.41% ± 18.55%), and Mortierellomycota (6.54% ± 3.31%), collectively representing 96.46%-98.07% of total composition (Figure 4 a). With decreasing stand density, Ascomycota and Mortierellomycota declined while Basidiomycota increased, indicating a shift toward basidiomycete dominance. The bacterial community was primarily composed of Actinobacteriota (21.81% ± 2.35%), Acidobacteriota (20.60% ± 1.46%), and Proteobacteria (13.92% ± 2.09%), totaling 55.86%-56.83% (Figure 4 b). Reduced stand density decreased Actinobacteriota but increased Acidobacteriota and Proteobacteria. Specifically, Actinobacteriota and Acidobacteriota abundances shifted from 22.89%/20.33% (high density) to 21.64%/21.25% (medium), and 19.69%/21.61% (low density). Under low density, Acidobacteriota surpassed Actinobacteriota as the most abundant phylum, indicating a density-dependent shift in bacterial dominance.
2.3. Soil Microbial Diversity Analysis in Larch Plantations Under Different Stand Densities
2.3.1. Alpha Diversity Analysis
For fungal diversity (Figure 5a), the Chao1 index decreased with soil depth. In the 0-20 cm layer, it increased with decreasing stand density, peaking in the LD treatment. In the 10-20 cm layer, it showed a hump-shaped trend, reaching its highest value under MD. These results suggest that low to moderate densities significantly enhance fungal richness. The coverage index approached 0.998 across samples, indicating high sequencing depth. It exhibited a "V"-shaped pattern with decreasing stand density, with higher values in the HD treatment. The Shannon and Simpson indices decreased with reduced density in the 0-30 cm layer (highest in HD), while in the 30-40 cm layer, they followed a hump-shaped pattern, peaking under MD.
For bacterial diversity (Figure 5b), the Chao1 index showed a hump-shaped response to decreasing stand density, with MD yielding the highest value, indicating enhanced richness at moderate density. The coverage index (≈0.980) confirmed sufficient sequencing depth and followed a trend similar to that of fungi. The Shannon index also exhibited a hump-shaped pattern, maximized under MD. In the 0-30 cm layer, the Simpson index was higher in MD and LD, suggesting dominant species exerted stronger influence under these treatments. In summary, stand density had a more pronounced impact on fungal diversity, with MD most effectively enhancing both fungal richness and diversity. Bacterial diversity was less affected by density variation, though MD still provided the most favorable conditions.
2.3.2. Principal Coordinate Analysis
Principal coordinate analysis (PCoA) based on Bray-Curtis distances at the genus level revealed that for fungal communities, PC1 and PC2 explained 12.70% and 12.00% of the total variation, respectively (Figure 6). These components were identified as the main factors driving differences among samples, indicating that stand density significantly influenced soil fungal community structure. Fungal communities in HD and MD clustered closely, indicating minimal compositional differences between these densities (Figure 6 a). In contrast, samples from other stand densities showed greater dispersion, demonstrating distinct structural variations. For bacterial communities (Figure 6 b), PC1 and PC2 accounted for 18.20% and 10.40% of the variation, respectively. Bacterial communities in CK and HD clustered together, as did those in MD and LD, suggesting relatively similar compositions within these pairs. However, significant separation was observed between the CK/HD and MD/LD clusters, indicating substantial compositional differences among these treatment groups.
2.4. Correlation Analysis Between Soil Physicochemical Properties and Microbial Communities
Correlation analysis revealed significant relationships among soil physicochemical properties and microbial indicators across different stand densities (Figure 7). TK and TP showed a significant positive correlation (r = 0.32, P < 0.05). AN was positively correlated with pH (r = 0.36) but negatively correlated with SW (r = -0.42) and SOC (r = -0.46). Soil pH demonstrated a positive correlation with TP (r = 0.35) but significant negative correlations with SOC (r = -0.53), TN (r = -0.39), SW (r = -0.56), S-ACP (r = -0.40), S-SUC (r = -0.66), and NN (r = -0.57). SW was positively correlated with SOC (r = 0.64), S-SUC (r = 0.53), TN (r = 0.47), NN (r = 0.61), and S-ACP (r = 0.49). SOC showed positive correlations with S-SUC (r = 0.54), TN (r = 0.71), NN (r = 0.56), and S-ACP (r = 0.61). S-SUC activity was positively correlated with TN (r = 0.52), NN (r = 0.70), S-ACP (r = 0.82), and AK (r = 0.41). TN was positively correlated with NN (r = 0.67), S-ACP (r = 0.68), AK (r = 0.35), and TP (r = 0.30). NN showed positive correlations with S-ACP (r = 0.72), AK (r = 0.54), and TP (r = 0.30). A significant positive correlation was also observed between S-ACP and AK (r = 0.42). All reported correlations were statistically significant (P < 0.05).
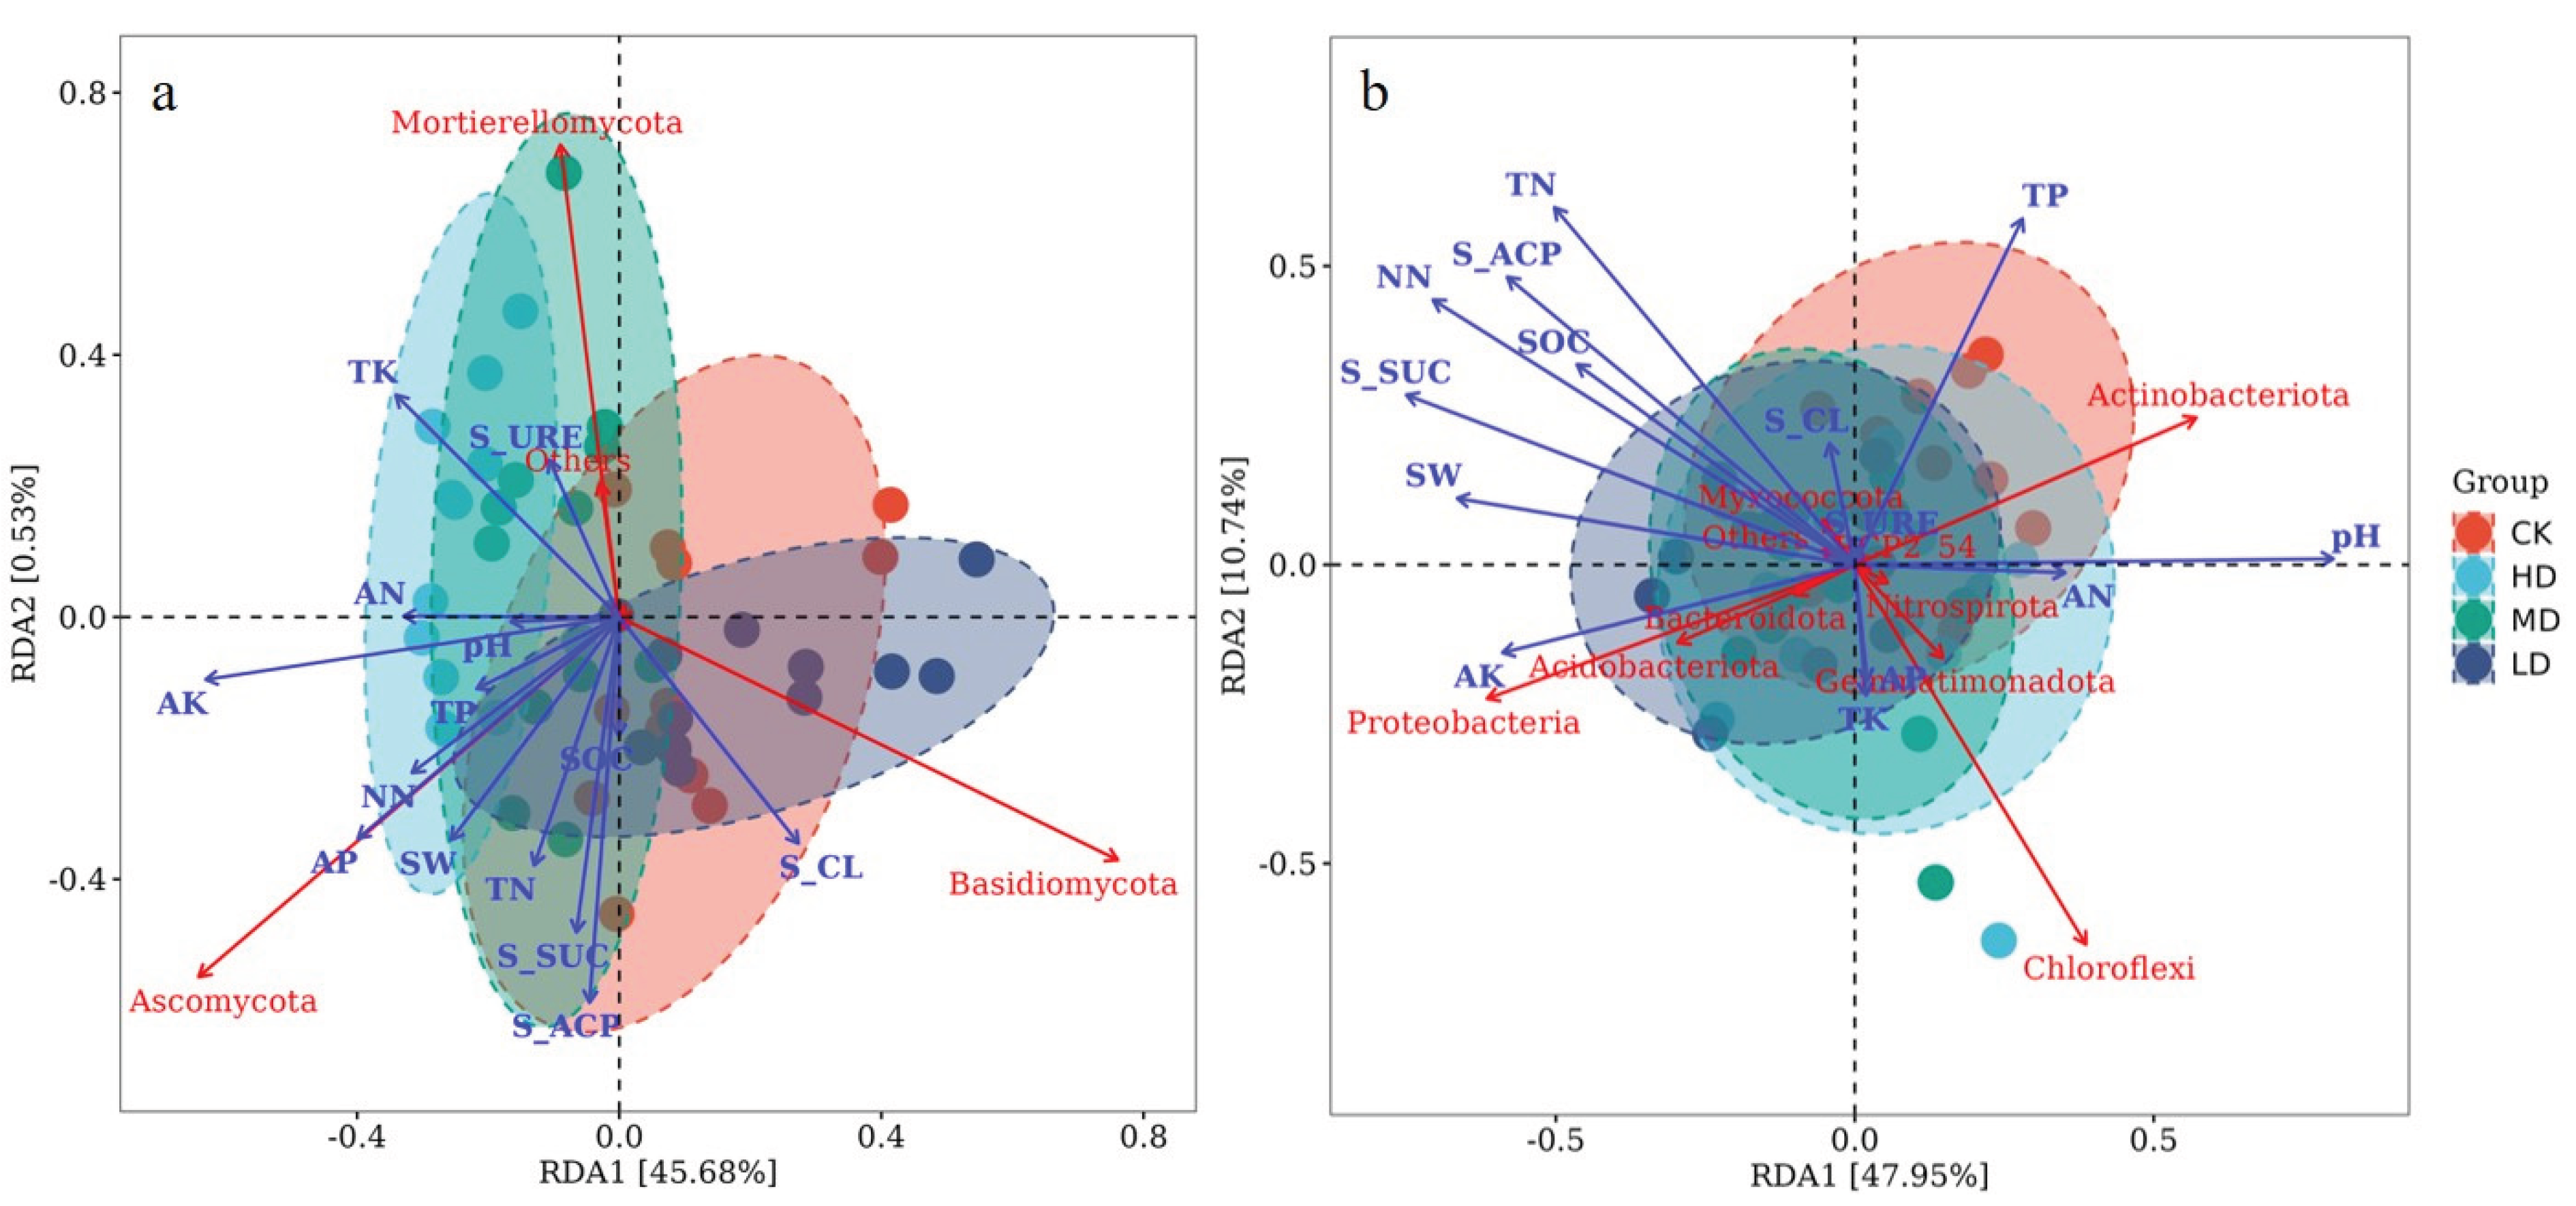
Soil fungal communities were significantly influenced by soil micro-environmental factors under different stand retention densities (Figure 8a). RDA1 and RDA2 explained 45.68% and 0.53% of the variation, respectively, with AK, AP, TK, S-ACP, S-SUC, and S-CL identified as key environmental drivers. AK, AP, S-ACP, and NN showed strong positive effects on Ascomycota. In contrast, TK and S-URE exhibited strong positive effects on Mortierellomycota but strong negative effects on Basidiomycota; these trends were particularly evident in HD and MD stands. Conversely, S-CL demonstrated a strong positive effect on Basidiomycota, which was more pronounced in CK and LD plots.
Soil bacterial communities were also significantly affected by soil micro-environmental factors (Figure 8b). RDA1 and RDA2 accounted for 47.95% and 10.74% of the variation, respectively, with pH, TP, TN, NN, S-ACP, S-SUC, and SW identified as key influencing factors. pH and TP had strong positive effects on Actinobacteriota - particularly evident in CK and HD plots - but strong negative effects on Proteobacteria and Acidobacteriota. In contrast, AK and SW showed strong positive effects on Proteobacteria and Acidobacteriota but strong negative effects on Actinobacteriota. However, these patterns did not show clear differentiation across stand density levels.
3. Discussion
3.1. Effects of Stand Density on Soil Physicochemical Properties
The stand retention density induced variations in soil physicochemical properties revealed a clear depth-dependent response pattern, highlighting the critical role of forest management in regulating belowground biogeochemical cycles. The observed decline in soil pH with decreasing retention density aligns with previous reports that reduced canopy coverage accelerates litter decomposition and organic acid accumulation [9]. Notably, the "mid-density (MD)" treatment consistently exhibited optimal soil water retention and SOC content in 0-30 cm layers, suggesting moderate density balances microclimate regulation and nutrient input. This contrasts with high-density (HD) stands where intense root competition likely limited SOC sequestration, and low-density (LD) plots where diminished litter fall impaired carbon replenishment-a phenomenon well-documented in temperate plantations [10].
The stratification of nutrient dynamics across soil profiles reflects distinct ecological drivers. The significant reduction of TN and TP in surface layers (0-20 cm) under LD treatment may stem from enhanced leaching losses due to reduced vegetation interception, as demonstrated in Chinese fir plantations [11]. Conversely, the non-significant changes in deep layers (30-40 cm) across all treatments imply limited management impacts on geologic nutrient pools, consistent with findings from boreal forest ecosystems [12]. Nitrogen speciation responses further elucidate microbial mediation mechanisms. The progressive decline of NH4+-N and NO3--N with retention density (HD > MD > LD) correlates with reduced nitrification rates under canopy opening, as observed in Mongolian oak forests [13]. The preservation of inorganic N pools in HD stands suggests that high density maintains sufficient shade to suppress nitrifier activity while allowing adequate through fall for ammonification-a delicate balance critical for preventing N leaching in managed forests.
The stratification of soil enzyme activities under varying retention densities demonstrates density-dependent functional adaptations in microbial-mediated biogeochemical processes. The elevated S-SUC and S-CL activities in LD and MD stands within 0-30 cm (Figure 2) likely reflect enhanced carbon substrate availability from accelerated litter decomposition, a phenomenon amplified by increased solar radiation penetration in thinned stands [14]. Contrastingly, S-URE activity peaked in HD stands within surface layers (0-20 cm), aligning with observations in Pinus tabuliformis Carrière plantations where canopy closure maintained higher nitrogen availability through reduced nitrification/denitrification losses [15]. This nitrogen conservation mechanism, however, appears compromised in LD treatments as evidenced by S-URE suppression, potentially exacerbating N limitation in intensively managed stands [16].
3.2. Effects of Stand Density on Soil Microbial Diversity and Community Composition
The density-driven shifts in fungal: bacterial dominance patterns unveil fundamental restructuring of belowground microbial functional guilds under retention densities. The progressive decline of Ascomycota and Mortierellomycota with decreasing retention density (Figure 3) parallels findings in Pinus halepensis Mill. forests, where canopy opening reduces cellulose-degrading specialists while favoring Basidiomycota-dominated wood decay fungi [17]. This functional transition-from litter decomposition (Ascomycota) to humus mineralization (Basidiomycota)-implies accelerated organic matter turnover in low-density stands, potentially explaining the observed SOC decline in surface layers. In bacterial communities, the density-dependent decrease of Actinobacteriota and concomitant rise of Acidobacteriota reflect carbon starvation strategies (Figure 3). Actinobacteria’s oligotrophic advantage in HD stands aligns with their high C-use efficiency under recalcitrant organic matter conditions [18]. Conversely, the Acidobacteriota dominance in LD treatments suggests metabolic adaptation to labile C inputs from understory vegetation-a pattern documented in North American hardwood forests [19]. The increased Proteobacteria further indicates r-strategist proliferation under resource-rich post- retention density environments [20].
Regarding the fungal community, the moderate density (MD) treatment exhibited the highest Chao1 and Shannon indices in the 10-20 cm soil layer. This aligns well with the ecological theory of "intermediate disturbance promoting diversity" [21]. Notably, the high density (HD) treatment showed the highest simpson index in the topsoil layer (0-30 cm), indicating that its fungal community structure may be dominated by a few prevalent taxa (e.g., Ascomycota). This phenomenon is consistent with observations by Tedersoo et al. [22] in global forest ecosystems. The optimal performance of the MD treatment in the deeper soil layer (30-40 cm) likely stems from its creation of a more balanced resource allocation pattern, avoiding both intense competition under high density and resource limitation under low density. In contrast, the response of bacterial diversity to stand density was relatively muted, with the MD treatment consistently exhibiting optimal diversity indices across different soil layers. This response pattern likely reflects the higher functional redundancy [23] and more flexible environmental adaptation strategies [24] characteristic of bacterial communities.
The density-driven divergence in microbial community structures, as revealed by PCoA (Bray-Curtis distance), underscores fundamental differences in ecological resilience between fungi and bacteria. The higher explanatory power of bacterial PC1 (18.20% vs. fungal 12.70%) aligns with their metabolic plasticity under resource fluctuations-a phenomenon observed in tropical forest soils where bacterial communities rapidly adapt to altered carbon inputs [25]. Notably, the contrasting bacterial patterns-with CK/HD and MD/LD forming distinct clusters-reflect niche partitioning along pH gradients (6.38-6.89). Acidobacteriota’s dominance in LD soils (24.15%) correlates with their acidophilic traits, while Actinobacteriota’s prevalence in HD (21.81%) mirrors adaptations to near-neutral microsites, consistent with findings in managed Pinus sylvestris stands [26].
3.3. Relationship Between Soil Microbial Community Structure and Environmental Factors
This study revealed the significant influence of stand retention density on soil fungal community structure through RDA, identifying soil available nutrients (AK, AP) and enzyme activities (S-ACP, S-URE) as key environmental drivers of fungal phylum-level distribution. This finding aligns with the hypothesis of co-evolution between "soil chemical properties and microbial functional groups" in global forest ecosystems [17]. The first two RDA axes cumulatively explained 46.21% of the variation, significantly higher than similar studies in artificial forest of pine seedlings in Mu Us Desert in China (e.g., 20.52% in Hai et al., [27]), suggesting that fungal communities in temperate plantations exhibit heightened sensitivity to environmental factors. The analysis showed significant positive effects of AK and AP on Ascomycota, consistent with the ecological characteristics of this phylum as r-strategists. Ascomycetes typically possess a rich array of hydrolytic enzymes (e.g., chitinases, cellulases), enabling them to rapidly utilize simple carbon sources and available phosphorus [28]. In this study, the significantly higher AP content in high-density (HD) stands compared to the control (CK) likely promoted the enrichment of Ascomycota (Figure 1). These results support the theoretical framework of "phosphorus availability driving fungal community assembly" [29], particularly pronounced in intensively managed plantations. The positive association between TK and Mortierellomycota highlights the specific role of potassium cycling in fungal ecology Mortierella species have been confirmed to possess potassium-solubilizing capacity [30] (Zhu et al., 2020), and their dominance under high TK conditions may reflect a specialized nutrient acquisition strategy (Figure 1). Notably, the negative correlation between Basidiomycota and TK implies lower potassium requirements among lignin-degrading fungi (e.g., white-rot fungi), consistent with findings in temperate forests by Bödeker et al. [31]. The positive correlation between S-ACP and Ascomycota likely reflects a microbial adaptation strategy under phosphorus-limited conditions. When soil available phosphorus is insufficient, microbes secrete phosphatases to mineralize organic phosphorus [32]. This mechanism is corroborated by the significantly higher S-ACP activity in HD stands compared to other treatments (Figure 2). Conversely, the positive correlation between S-URE and Mortierellomycota may indicate this phylum’s role in nitrogen cycling; its capacity to hydrolyze urea for nitrogen acquisition has been confirmed in metagenomic studies [33].Microenvironmental differentiation caused by varying retention densities significantly influenced fungal community assembly. The inverse relationship between Mortierellomycota and Basidiomycota in high-density stands (HD/MD) may originate from changes in carbon input quality driven by differences in canopy closure. Previous studies have demonstrated that high canopy closure promotes the accumulation of easily decomposable litter, favoring the growth of saprotrophic Mortierellomycota [34]. In contrast, low-density stands (LD) with ample sunlight favor the colonization of Basidiomycota due to litter with higher lignin content [35]. This interpretation is further supported by the positive correlation between S-CL and Basidiomycota, as this phylum includes important cellulose-degrading taxa.
This study revealed the significant influence of key environmental factors on soil bacterial community structure across different stand retention densities through RDA. The primary drivers identified were pH, TP, TN, NN, S-ACP, S-SUC, and SW. The first two RDA axes cumulatively explained 58.69% of the variation, indicating a strong filtering effect of the soil microenvironment on bacterial community composition. This result aligns with conclusions from global soil microbial biogeography research. pH emerged as one of the most critical factors influencing the bacterial community. The analysis showed a positive effect of pH on Actinobacteriota and negative effects on Proteobacteria and Acidobacteriota. This finding is consistent with the classical "soil pH-microbial diversity" theory [25], wherein actinobacteria are more adapted to neutral to slightly alkaline conditions, while Acidobacteria and certain Proteobacteria (e.g., α-Proteobacteria) prefer acidic environments [38] (Jones et al., 2009). The higher pH in this study may promote the growth of Actinobacteria due to their enhanced organic matter decomposition capacity, whereas under low pH, Acidobacteria may maintain competitive advantage through oligotrophic strategies [39]. The negative effects of TN and NN on Chloroflexi may reflect this phylum’s sensitivity to high nitrogen environments. Chloroflexi are typically found in oligotrophic soils and participate in decomposing recalcitrant organic matter [40]. High nitrogen input may inhibit their growth, consistent with findings from long-term fertilization experiments in agricultural soils [41]. Additionally, the negative correlations of S-ACP and S-SUC with Chloroflexi may indicate greater competitiveness of this phylum under conditions of low enzyme activity (i.e., low metabolic pressure), suggesting an oligotrophic growth strategy [42]. The positive effects of AK and SW on Proteobacteria and Acidobacteriota may be related to their metabolic flexibility. Proteobacteria (especially γ-Proteobacteria) encompass numerous strains capable of nitrogen fixation and diverse carbon metabolism [43], and higher SW may facilitate their dispersal and substrate utilization. In contrast, the negative response of Actinobacteriota to AK and SW may relate to their drought tolerance, as previous studies have shown Actinobacteria can maintain relatively high activity under dry conditions [44].
Unlike the fungal community, bacterial communities exhibited smaller differences among stand densities. This indicates that bacteria may possess higher functional redundancy [23]. This phenomenon supports the ecological theory that "microbial community assembly is governed primarily by environmental filtering rather than stochastic processes" [45]. Future research could integrate metagenomics to further dissect differences in bacterial functional genes across stand densities, enabling a more precise assessment of the impact of management practices on soil microbial functions.
4. Materials and Methods
4.1. Study Site Description
The experimental area is located in the Shanggaotai Forest Farm, Daqing Mountain Management Area, Inner Mongolia Autonomous Region, China (115°51′-112°23′ E, 40°56′-41°15′ N). This region experiences a cold-temperate, arid to semi-arid continental monsoon climate, characterized by long sunshine hours (approximately 2,735 annual average sunshine hours) and a frost-free period of about 120 days. The mean annual temperature is 6°C, and the mean annual precipitation is approximately 337.5 mm. The study was conducted on a south-facing slope within the forest farm, with an average gradient of 15 degrees. The soil is classified as cinnamon soil, with a depth exceeding 90 cm and a slightly acidic pH. The Larix principis-rupprechtii plantation in this area was established over 40 years ago, with this species being a fast-growing timber tree. According to land use classification, the area is designated as plantation forest. The understory vegetation is predominantly composed of shrubs such as Spiraea salicifolia L., Ostryopsis davidiana Decne, and Prunus sibirica L., along with herbaceous species including Stipa capillata Linn., Artemisia frigida Willd., and Thymus mongolicus (Ronniger) Ronniger.
4.2. Experimental Design and Soil Sampling
In the study area, four experimental sites were established, including three Larix principis-rupprechtii plantations with different stand retention densities (high (2077 trees ha-1), medium (1108 trees ha-1), and low (556 trees ha-1)) and one unharvested stand (CK (2800 trees ha-1)) as the control (Table 3). Soil samples were collected in August 2024. Within each forest stand, three 30 m × 30 m experimental plots were randomly established. All selected plots were free from livestock grazing and human disturbance, with a minimum inter-plot distance of 20 m. An adjacent unharvested stand was selected as a control for the three density treatments. Soil samples were collected from the 0-40 cm depth profile at 10 cm intervals using a sterile soil auger with a 5 cm diameter across all 12 plots.
To ensure soil sample homogeneity, samples were collected from four cardinal directions (east, south, west, and north) within each plot. Soil samples from each sampling point were thoroughly mixed to form a composite sample, ensuring representativeness. The composite samples were sieved through a 2-mm mesh to remove stones and plant residues. Subsequently, 1 kg of soil was placed into sterile zip-lock bags and transported to the laboratory in a -20°C vehicle freezer. One portion of each sample was air-dried indoors and then oven-dried at 105°C for 6 hours to determine pH, organic matter, and total nitrogen content. Another portion was stored at 4°C for subsequent analysis of ammonium nitrogen, nitrate nitrogen, and enzyme activities. Simultaneously, separate samples dedicated to microbial community analysis were preserved in liquid nitrogen during transport to maintain biological integrity. Upon arrival at the laboratory, these samples were promptly transferred to a -80°C freezer for storage. To ensure analytical reliability, three replicate subsamples were prepared from each composite sample for subsequent soil microbial community analysis.

Table 1.
Basic information of the survey sample site.
| Stand density | Longitude | Latitude | TH (m) | DBH (cm) | UBH (m) | CB (m) |
|---|---|---|---|---|---|---|
| 556 trees ha-1 | 112°04’29’’E | 41°05’11’’N | 15.6±0.35 a | 22.1±0.48 a | 4.2±0.52 b | 4.5±0.31 a |
| 1108 trees ha-1 | 112°03’48’’E | 41°05’36’’N | 15.2±0.88 a | 19.9±0.17 a | 4.4±0.15 b | 4.69±0.81 a |
| 2077 trees ha-1 | 112°04’05’’E | 41°05’23’’N | 14.8±0.15 a | 16.04±0.04 a | 4.9±0.71 b | 3.26±0.37 a |
| 2800 trees ha-1 | 112°03’29’’E | 41°05’33’’N | 14.5±0.12 a | 15.75±0.44 a | 5.3±0.15 a | 2.73±0.64 a |
Note: Different lowercase letters indicate significant differences in forest density between stands (p < 0.05). TH: tree height; DBH: diameter at breast height; UBH: under branch height CB: crown breadth.
4.3. Determination of Soil Physicochemical Properties
Various analytical techniques were employed to assess soil chemical properties. Soil samples were mixed with distilled water at a 1:2.5 ratio, extracted for 30 min, and the suspension pH was measured using a pH meter (Mettler Toledo, Shanghai, China). Soil water content was determined by the oven-drying method. Soil organic carbon (SOC) content was determined via the potassium dichromate heating method. Total nitrogen (TN) was quantified using the Kjeldahl method, while total phosphorus (TP) was measured by sodium hydroxide digestion followed by molybdenum-antimony colorimetry. Available phosphorus (AP) was extracted with ammonium fluoride and hydrochloric acid and analyzed by molybdenum-antimony colorimetry. Available potassium (AK) was extracted with ammonium acetate and determined by atomic absorption spectrometry. Additionally, ammonium nitrogen (NH₄⁺-N), nitrate nitrogen (NO₃⁻-N), and soil enzyme activities were measured. Specific procedures and conditions followed established methodologies [46] (Epoch 2, BioTek, America)].
4.4. DNA Extraction and Illumina Sequencing
Samples were retrieved from storage and promptly aliquoted (0.2-0.5 g) into centrifuge tubes containing extraction lysis buffer for homogenization using a Tissuelyser-48 multi-sample tissue grinder (Shanghai Jingxin, China) at 60 Hz. Total microbial genomic DNA was extracted from 0.5 g of fresh soil using the MagBeads FastDNA Kit for Soil (116564384, MP Biomedicals, CA, USA) following the manufacturer’s protocols. DNA quality and concentration were evaluated by 1.0% agarose gel electrophoresis and a NanoDrop® ND-2000 spectrophotometer (Thermo Scientific, USA), after which samples were stored at -80°C for subsequent analysis. The bacterial 16S rRNA gene and fungal 18S rRNA gene were amplified with primer pairs 338F/806R [47,48] and ITS-1F/ITS-2R [49], respectively, on an ABI GeneAmp® 9700 PCR thermocycler (CA, USA). Each 20 μL PCR reaction contained 4 μL of 5× Fast Pfu buffer, 2 μL of 2.5 mM dNTPs, 0.8 μL of each primer (5 μM), 0.4 μL of Fast Pfu polymerase, and 10 ng of template DNA. The thermal cycling program consisted of initial denaturation at 95°C for 3 min; 27 cycles of denaturation at 95°C for 30 s, annealing at 55°C for 30 s, and extension at 72°C for 45 s; final extension at 72°C for 10 min; and hold at 4°C. All amplifications were performed in triplicate. Amplicons were purified from 2% agarose gels using the AxyPrep DNA Gel Extraction Kit (Axygen Biosciences, Union City, USA) and quantified with a Quantus™ Fluorometer (Promega, USA). Equimolar amounts of purified amplicons were pooled and subjected to paired-end sequencing on an Illumina MiSeq PE300 platform (Illumina, San Diego, USA) following the standard protocols of Personal Biotechnology Co., Ltd. Shanghai, China (Shanghai, China).
4.5. Data Processing g and Analysis
Bioinformatic analysis of bacterial and fungal FASTQ raw sequencing data was performed using the QIIME2 pipeline [50]. Quality filtering was conducted with fastp (v0.19.6) [51], followed by sequence merging using FLASH (v1.2.6) [52]. After quality control and merging, the DADA2 plugin [53] within QIIME2 [50] was employed to denoise the optimized sequences under default parameters. The resulting sequences from DADA2 processing are referred to as amplicon sequence variants (ASVs). All sequences annotated as chloroplasts or mitochondria were removed. To minimize the impact of sequencing depth on subsequent alpha and beta diversity analyses, all samples were rarefied to 20,000 sequences per sample. Following this normalization, the average sequencing coverage remained at 99.09%. Taxonomic annotation of ASVs was performed using a naive Bayes classifier against the SILVA 16S rRNA gene database (v138) and the UNITE database (Release 8.0 https://unite.ut.ee/) for bacteria and fungi, respectively. Alpha diversity indices were calculated to assess microbial richness and diversity. The Chao1 and ACE indices were used to estimate OTU richness through different algorithms, while the Shannon index reflected both richness and evenness. The Simpson index indicated community dominance. All alpha diversity indices were computed through the Personal Biotechnology Cloud Platform (https://www.genescloud.cn/). Beta diversity, representing dissimilarities in microbial composition among communities, was visualized using principal coordinate analysis (PCoA) based on OTU profiles. Differences in soil physicochemical properties among stand densities were analyzed using SPSS Statistics (v25.0). One-way analysis of variance (ANOVA) with LSD post-hoc testing (p < 0.05) was applied for multiple comparisons. Spearman’s rank correlation analysis was used to examine relationships between soil properties and enzyme activities. Microbial community composition was analyzed by calculating relative abundances at the phylum level. RDA (Canoco5 software) was employed to identify driving factors of soil properties on microbial community structure.
5. Conclusions
This study demonstrates that moderate-density (MD) management in Larix principis-rupprechtii plantations optimally balances soil ecological functions. In the 0-30 cm soil layer, the MD treatment exhibited superior soil water retention, organic carbon content, and microbial diversity. The underlying mechanism can be attributed to the moderately open canopy, which facilitates efficient litter decomposition and fosters functional complementarity between Basidiomycota (enhancing cellulose degradation) and Acidobacteriota (adapted to oligotrophic conditions). Key driver analysis revealed that soil pH and available nutrients (AK, AP) primarily governed microbial community restructuring: Actinobacteriota dominated in neutral, phosphorus-rich environments, whereas Acidobacteriota thrived under acidic, phosphorus-limited conditions. Fungal communities responded sensitively to management intensity, with significant shifts between Ascomycota and Basidiomycota, while bacterial communities remained stable due to functional redundancy. This study recommends moderate-density management as a sustainable practice to enhance soil nutrient cycling and maintain microbial diversity, providing a scientific basis for the sustainable management of plantation forests.
Author Contributions
Conceptualization, F.L. and Z.W.; methodology, F.L. and K.Z.; software, L.L. and K.Z.; validation, L.H. and K.Z.; formal analysis, Z.W. and Q. D. (Qiuming Di); investigation, F.L., M. D. and L.L.; resources, L.H.; data curation, H.Y. (Hongwei Yang); writing—original draft preparation, F.L.; writing—review and editing, L.H.; visualization, H.Y. All authors have read and agreed to the published version of the manuscript.
Funding
This work was supported by grants from the Research Project for Enhancing the Quality and Efficiency of the Three-North Shelterbelt Program (2024NLTS04), funded by the "Unveiling and Commanding" Initiative for Scientific Research Capacity Enhancement of Inner Mongolia Academy of Forestry Science.
Data Availability Statement
Data are contained within the article.
Conflicts of Interest
The authors declare no conflicts of interest.
References
- Lull, C.; Bautista, I.; Lidón, A.; del Campo, A.D.; González-Sanchis, M.; García-Prats, A. Temporal effects of thinning on soil organic carbon pools, basal respiration and enzyme activities in a Mediterranean Holm oak forest. For. Ecol. Manag. 2020, 464, 118088. [Google Scholar] [CrossRef]
- Bahram, M.; Hildebrand, F.; Forslund, S.K.; Anderson, J.L.; Soudzilovskaia, N.A.; Bodegom, P.M.; Bengtsson-Palme, J.; Anslan, S.; Coelho, L.P.; Harend, H.; Huerta-Cepas, J.; Medema, M.H.; Maltz, M.R.; Mundra, S.; Olsson, P.A.; Pent, M.; Põlme, S.; Sunagawa, S.; Ryberg, M. . Tedersoo, L. Structure and function of the global topsoil microbiome. Nature 2018, 560, 233–237. [Google Scholar] [CrossRef] [PubMed]
- Prescott, C.E. Litter decomposition: What controls it and how can we alter it to sequester more carbon in forest soils? Biogeochemistry 2010, 101, 133–149. [Google Scholar] [CrossRef]
- Shen, F.; Jiang, Y.; Yang, Y.; Yang, L. Long-term impacts of stand density on soil fungal and bacterial communities for targeted cultivation of large-diameter Larix olgensis. For. Ecol. Manag. 2025, 591, 122842. [Google Scholar] [CrossRef]
- Liu, Y.Y.; Wang, S.; Li, S.Z.; Deng, Y. Advances in molecular ecology on microbial functional genes of carbon cycle. Microbiol. China 2017, 44, 1676–1689. (In Chinese) [Google Scholar] [CrossRef]
- Zhang, J.H.; Wang, J.Y.; Meng, Z.X.; He, J.; Dong, Z.H.; Liu, K.Q.; Chen, W.Q. Soil microbial richness predicts ecosystem multifunctionality through co-occurrence network complexity in alpine meadow. Acta Ecol. Sin. 2022, 42, 2542–2558. (In Chinese) [Google Scholar] [CrossRef]
- Wang, L.; Deng, D.; Feng, Q.; Xu, Z.; Pan, H.; Li, H. Changes in litter input exert divergent effects on the soil microbial community and function in stands of different densities. Sci. Total Environ. 2022, 845, 157297. [Google Scholar] [CrossRef]
- Xu, Z.; Fan, F.; Lin, Q.; Guo, S.; Li, S.; Zhang, Y.; Feng, Z.; Wang, X.; Rensing, C.; Cao, G.; et al. Effects of Different Stand Densities on the Composition and Diversity of Soil Microbiota in a Cunninghamia lanceolata Plantation. Plants 2025, 14, 98. [Google Scholar] [CrossRef]
- Augusto, L.; Ranger, J.; Binkley, D.; Rothe, A. Impact of several common tree species of European temperate forests on soil fertility. Ann. For. Sci. 2002, 59, 233–253. [Google Scholar] [CrossRef]
- Nave, L.E.; Vance, E.D.; Swanston, C.W.; Curtis, P.S. Harvest impacts on soil carbon storage in temperate forests. For. Ecol. Manag. 2010, 259, 857–866. [Google Scholar] [CrossRef]
- Neilen, A.D.; Chen, C.R.; Parker, B.M.; Faggotter, S.J.; Burford, M.A. Differences in nitrate and phosphorus export between wooded and grassed riparian zones from farmland to receiving waterways under varying rainfall conditions. Sci. Total Environ. 2017, 598, 188–197. [Google Scholar] [CrossRef]
- Li, F.; Wang, Z.; Hou, J.; Li, X.; Wang, D.; Yang, W. The changes in soil organic carbon stock and quality across a subalpine forest successional series. For. Ecosyst. 2024, 11, 100203. [Google Scholar] [CrossRef]
- Fu, M.; Wang, C.; Wang, Y.; Liu, S. Spatiotemporal patterns of soil nitrogen mineralization and nitrification in four temperate forests. Acta Ecol. Sin. 2009, 29, 3747–3758. (In Chinese) [Google Scholar]
- Burns, R.G.; DeForest, J.L.; Marxsen, J.; Sinsabaugh, R.L.; Stromberger, M.E.; Wallenstein, M.D.; Weintraub, M.N.; Zoppini, A. Soil enzymes in a changing environment: Current knowledge and future directions. Soil Biol. Biochem. 2013, 58, 216–234. [Google Scholar] [CrossRef]
- Yu, H.; Duan, Y.; Mulder, J.; Dörsch, P.; Zhu, W.; Xu-Ri; Huang, K.; Zheng, Z.; Kang, R.; Wang, C.; Quan, Z.; Zhu, F.; Liu, D.; Peng, S.; Han, S.; Zhang, Y.; Fang, Y. Universal temperature sensitivity of denitrification nitrogen losses in forest soils. Nat. Clim. Chang. 2023, 13, 726–734. [CrossRef]
- Baldrian, P. Distribution of Extracellular Enzymes in Soils: Spatial Heterogeneity and Determining Factors at Various Scales. Soil Sci. Soc. Am. J. 2014, 78, 11–18. [Google Scholar] [CrossRef]
- Tedersoo, L.; Bahram, M.; Põlme, S.; Kõljalg, U.; Yorou, N.S.; Wijesundera, R.; Ruiz, L.V.; Vasco-Palacios, A.M.; Thu, P.Q.; Abarenkov, K. . +48 authors Global diversity and geography of soil fungi. Science 2014, 346. [Google Scholar] [CrossRef]
- Ding, K.; Zhang, Y.T.; Zhang, J.H.; Chai, X.; Zhou, S.S.; Tong, Z.K. Effects of Chinese fir plantations with different densities on understory vegetation and soil microbial community structure. Chin. J. Plant Ecol. 2021, 45, 62–73. [Google Scholar] [CrossRef]
- Yang, A.; Lu, Y.; Zhang, J.; Wu, J.; Xu, J.; Tong, Z. Changes in Soil Nutrients and Acidobacteria Community Structure in Cunninghamia lanceolata Plantations. Sci. Silvae Sin. 2019, 55, 119–127. [Google Scholar] [CrossRef]
- Peng, J.; Liu, H.; Hu, Y.; Sun, Y.; Liu, Q.; Li, J.; Dong, Y. Shift in soil bacterial communities from K- to r-strategists facilitates adaptation to grassland degradation. Land Degrad. Dev. 2022; Article e4304. [Google Scholar] [CrossRef]
- Connell, J.H. Diversity in tropical rain forests and coral reefs. Science 1978, 199, 1302–1310. [Google Scholar] [CrossRef]
- Tedersoo, L.; Mikryukov, V.; Anslan, S.; Bahram, M.; Khalid, A.N.; Corrales, A.; Agan, A.; Vasco-Palacios, A.M.; Saitta, A.; Antonelli, A.; Rinaldi, A.C.; Verbeken, A.; Sulistyo, B.P.; Tamgnoue, B.; Furneaux, B.; Ritter, C.D.; Nyamukondiwa, C.; Sharp, C.; Marín, C. . Alberdi, A. The Global Forest Fungal Community: Composition, Functions, and Threat Response. Cell 2022, 185, 4250–4267. [Google Scholar] [CrossRef]
- Louca, S.; Polz, M.F.; Mazel, F.; Albright, M.B.N.; Huber, J.A.; O’Connor, M.I. . Parfrey, L.W. Function and functional redundancy in microbial systems. Nat. Ecol. Evol. 2018, 2, 936–943. [Google Scholar] [CrossRef] [PubMed]
- Erickson, D.W.; Schink, S.J.; Patsalo, V.; Williamson, J.R.; Gerland, U.; Hwa, T. A global resource allocation strategy governs growth transition kinetics of Escherichia coli. Nature 2017, 551, 119–123. [Google Scholar] [CrossRef]
- Lauber, C.L.; Hamady, M.; Knight, R.; Fierer, N. Pyrosequencing-based assessment of soil pH as a predictor of soil bacterial community structure at the continental scale. Appl. Environ. Microbiol. 2009, 75, 5111–5120. [Google Scholar] [CrossRef]
- Štursová, M.; Žifčáková, L.; Leigh, M.B.; Burgess, R.; Baldrian, P. Cellulose utilization in forest litter and soil: Identification of bacterial and fungal decomposers. FEMS Microbiol. Ecol. 2012, 80, 735–746. [Google Scholar] [CrossRef]
- Hai, L.; Zhou, M.; Zhao, K.; Hong, G.; Li, Z.; Liu, L.; Gao, X.; Li, Z.; Li, F. Soil Microbial Communities and Their Relationship with Soil Nutrients in Different Density Pinus sylvestris var. mongolica Plantations in the Mu Us Sandy Land. Forests 2025, 16, 547. [Google Scholar] [CrossRef]
- Nguyen, N.H.; Song, Z.; Bates, S.T.; Branco, S.; Tedersoo, L.; Menke, J. . Kennedy, P.G. FUNGuild: An open annotation tool for parsing fungal community datasets by ecological guild. Fungal Ecol. 2016, 20, 241–248. [Google Scholar] [CrossRef]
- Camenzind, T.; Hättenschwiler, S.; Treseder, K.K.; Lehmann, A.; Rillig, M.C. Nutrient limitation of soil microbial processes in tropical forests. Ecol. Monogr. 2018, 88, 4–21. [Google Scholar] [CrossRef]
- Zhu, R.; Jin, L.; Sang, Y.; Hu, S.; Wang, B.T.; Jin, F.J. Characterization of potassium-solubilizing fungi, Mortierella spp., isolated from a poplar plantation rhizosphere soil. Arch. Microbiol. 2024, 206, 157. [Google Scholar] [CrossRef]
- Bödeker, I.T.M.; Lindahl, B.D.; Olson, Å.; Clemmensen, K.E. Mycorrhizal and saprotrophic fungal guilds compete for the same organic substrates but affect decomposition differently. Funct. Ecol. 2016, 30, 1967–1978. [Google Scholar] [CrossRef]
- Margalef, O.; Sardans, J.; Fernández-Martínez, M.; Molowny-Horas, R.; Janssens, I.A.; Ciais, P. . Peñuelas, J. Global patterns of phosphatase activity in natural soils. Sci. Rep. 2017, 7, 1337. [Google Scholar] [CrossRef] [PubMed]
- Uroz, S.; Oger, P.; Lepleux, C.; Collignon, C.; Frey-Klett, P.; Turpault, M.P. Bacterial weathering and its contribution to nutrient cycling in temperate forest ecosystems. Res. Microbiol. 2011, 162, 820–831. [Google Scholar] [CrossRef]
- Prescott, C.E.; Grayston, S.J. Tree species influence on microbial communities in litter and soil: Current knowledge and research needs. For. Ecol. Manag. 2013, 309, 19–27. [Google Scholar] [CrossRef]
- Krah, F.-S.; Bässler, C.; Heibl, C.; Soghigian, J.; Schaefer, H.; Hibbett, D.S. Evolutionary dynamics of host specialization in wood-decay fungi. BMC Evol. Biol. 2018, 18, 119. [Google Scholar] [CrossRef]
- Fierer, N.; Jackson, R.B. The diversity and biogeography of soil bacterial communities. Proc. Natl. Acad. Sci. USA 2006, 103, 626–631. [Google Scholar] [CrossRef]
- Bahram, M.; Hildebrand, F.; Forslund, S.K.; Anderson, J.L.; Soudzilovskaia, N.A.; Bodegom, P.M. . Tedersoo, L. Structure and function of the global topsoil microbiome. Nature 2018, 560, 233–237. [Google Scholar] [CrossRef]
- Jones, R.T.; Robeson, M.S.; Lauber, C.L.; Hamady, M.; Knight, R.; Fierer, N. A comprehensive survey of soil acidobacterial diversity using pyrosequencing and clone library analyses. ISME J. 2009, 3, 442–453. [Google Scholar] [CrossRef]
- Kalam, S.; Basu, A.; Ahmad, I.; Sayyed, R.Z.; El Enshasy, H.A.; Dailin, D.J.; Suriani, N.L. Recent understanding of soil Acidobacteria and their ecological significance: A critical review. Front. Microbiol. 2020, 11, 580024. [Google Scholar] [CrossRef]
- Richardson, A.E.; Simpson, R.J. Soil microorganisms mediating phosphorus availability. Plant Physiol. 2011, 156, 989–996. [Google Scholar] [CrossRef]
- Zhou, J.; Guan, D.; Zhou, B.; Zhao, B.; Ma, M.; Qin, J. . Li, J. Influence of 34-years of fertilization on bacterial communities in an intensively cultivated black soil in northeast China. Soil Biol. Biochem. 2020, 90, 42–51. [Google Scholar] [CrossRef]
- Fierer, N. Embracing the unknown: disentangling the complexities of the soil microbiome. Nat. Rev. Microbiol. 2017, 15, 579–590. [Google Scholar] [CrossRef]
- Dai, T.; Zhang, Y.; Tang, Y.; Bai, Y.; Tao, Y.; Huang, B.; Wen, D. Identifying the key taxonomic categories that characterize microbial community diversity using full-scale classification: a case study of microbial communities in the sediments of Hangzhou Bay. FEMS Microbiol. Ecol. 2016, 92, fiw150. [Google Scholar] [CrossRef]
- Naylor, D.; DeGraaf, S.; Purdom, E. . Drought and host selection influence bacterial community dynamics in the grass root microbiome. ISME J. 2017, 11, 2691–2704. [Google Scholar] [CrossRef]
- Stegen, J.C.; Lin, X.; Fredrickson, J.K.; Chen, X.; Kennedy, D.W.; Murray, C.J. . Konopka, A. Quantifying community assembly processes and identifying features that impose them. ISME J. 2012, 7, 2069–2079. [Google Scholar] [CrossRef]
- Arcand, M.M.; Helgason, B.L.; Lemke, R.L. Microbial crop residue decomposition dynamics in organic and conventionally managed soils. Appl. Soil Ecol. 2016, 107, 347–359. [Google Scholar] [CrossRef]
- Liu, C.S.; Zhao, D.F.; Ma, W.J.; Guo, Y.D.; Wang, A.J.; Wang, Q.L.; Lee, D.J. Denitrifying sulfide removal process on high-salinity wastewaters in the presence of Halomonas sp. Appl. Microbiol. Biotechnol. 2016, 100, 1421–1426. [Google Scholar] [CrossRef]
- Srinivasan, S.; Hoffman, N.G.; Morgan, M.T.; Matsen, F.A.; Fiedler, T.L.; Hall, R.W.; Ross, F.J.; McCoy, C.O.; Bumgarner, R.; Marrazzo, J.M.; Fredricks, D.N. Bacterial communities in women with bacterial vaginosis: high resolution phylogenetic analyses reveal relationships of microbiota to clinical criteria. PLoS One 2012, 7, e37818. [Google Scholar] [CrossRef] [PubMed]
- Lu, L.H.; Yin, S.X.; Liu, X.; Zhang, W.M.; Gu, T.Y.; Shen, Q.R.; Qiu, H.Z. Fungal networks in yield-invigorating and -debilitating soils induced by prolonged potato monoculture. Soil Biol. Biochem. 2013, 65, 186–194. [Google Scholar] [CrossRef]
- Bolyen, E.; Rideout, J.R.; Dillon, M.R.; Bokulich, N.A.; Abnet, C.C.; Al-Ghalith, G.A.; Alexander, H.; Alm, E.J.; Arumugam, M.; Asnicar, F.; Bai, Y.; Bisanz, J.E.; Bittinger, K.; Brejnrod, A.; Brislawn, C.J.; Brown, C.T.; Callahan, B.J.; Caraballo-Rodríguez, A.M.; Chase, J.; Cope, E.K.; Da Silva, R.; Diener, C.; Dorrestein, P.C.; Douglas, G.M.; Durali, D.M.; Duvallet, C.; Edwardson, C.F.; Ernst, M.; Estaki, M.; Fouquier, J.; Gauglitz, J.M.; Gibbons, S.M.; Gibson, D.L.; Gonzalez, A.; Gorlick, K.; Guo, J.; Hillmann, B.; Holmes, S.; Holste, H.; Huttenhower, C.; Huttley, G.A.; Janssen, S.; Jarmusch, A.K.; Jiang, L.; Kaehler, B.D.; Kang, K.B.; Keefe, C.R.; Keim, P.; Kelley, S.T.; Knights, D.; et al. Reproducible, interactive, scalable and extensible microbiome data science using QIIME 2. Nat. Biotechnol. 2019, 37, 852–857. [Google Scholar] [CrossRef] [PubMed]
- Chen, S.F.; Zhou, Y.Q.; Chen, Y.R.; Gu, J. fastp: an ultra-fast all-in-one FASTQ preprocessor. Bioinformatics 2018, 34, 884–890. [Google Scholar] [CrossRef]
- Magoč, T.; Salzberg, S.L. FLASH: fast length adjustment of short reads to improve genome assemblies. Bioinformatics 2011, 27, 2957–2963. [Google Scholar] [CrossRef] [PubMed]
- Callahan, B.J.; McMurdie, P.J.; Rosen, M.J.; Han, A.W.; Johnson, A.J.A.; Holmes, S.P. DADA2: High-resolution sample inference from Illumina amplicon data. Nat. Methods 2016, 13, 581–583. [Google Scholar] [CrossRef] [PubMed]
Figure 1.
Effects of different stand retention densities on soil physicochemical properties in a Larix principis-rupprechtii plantation. Note: Different uppercase letters indicate significant differences among soil layers within the same stand density, and different lowercase letters indicate significant differences among stand densities within the same soil layer (P < 0.05).
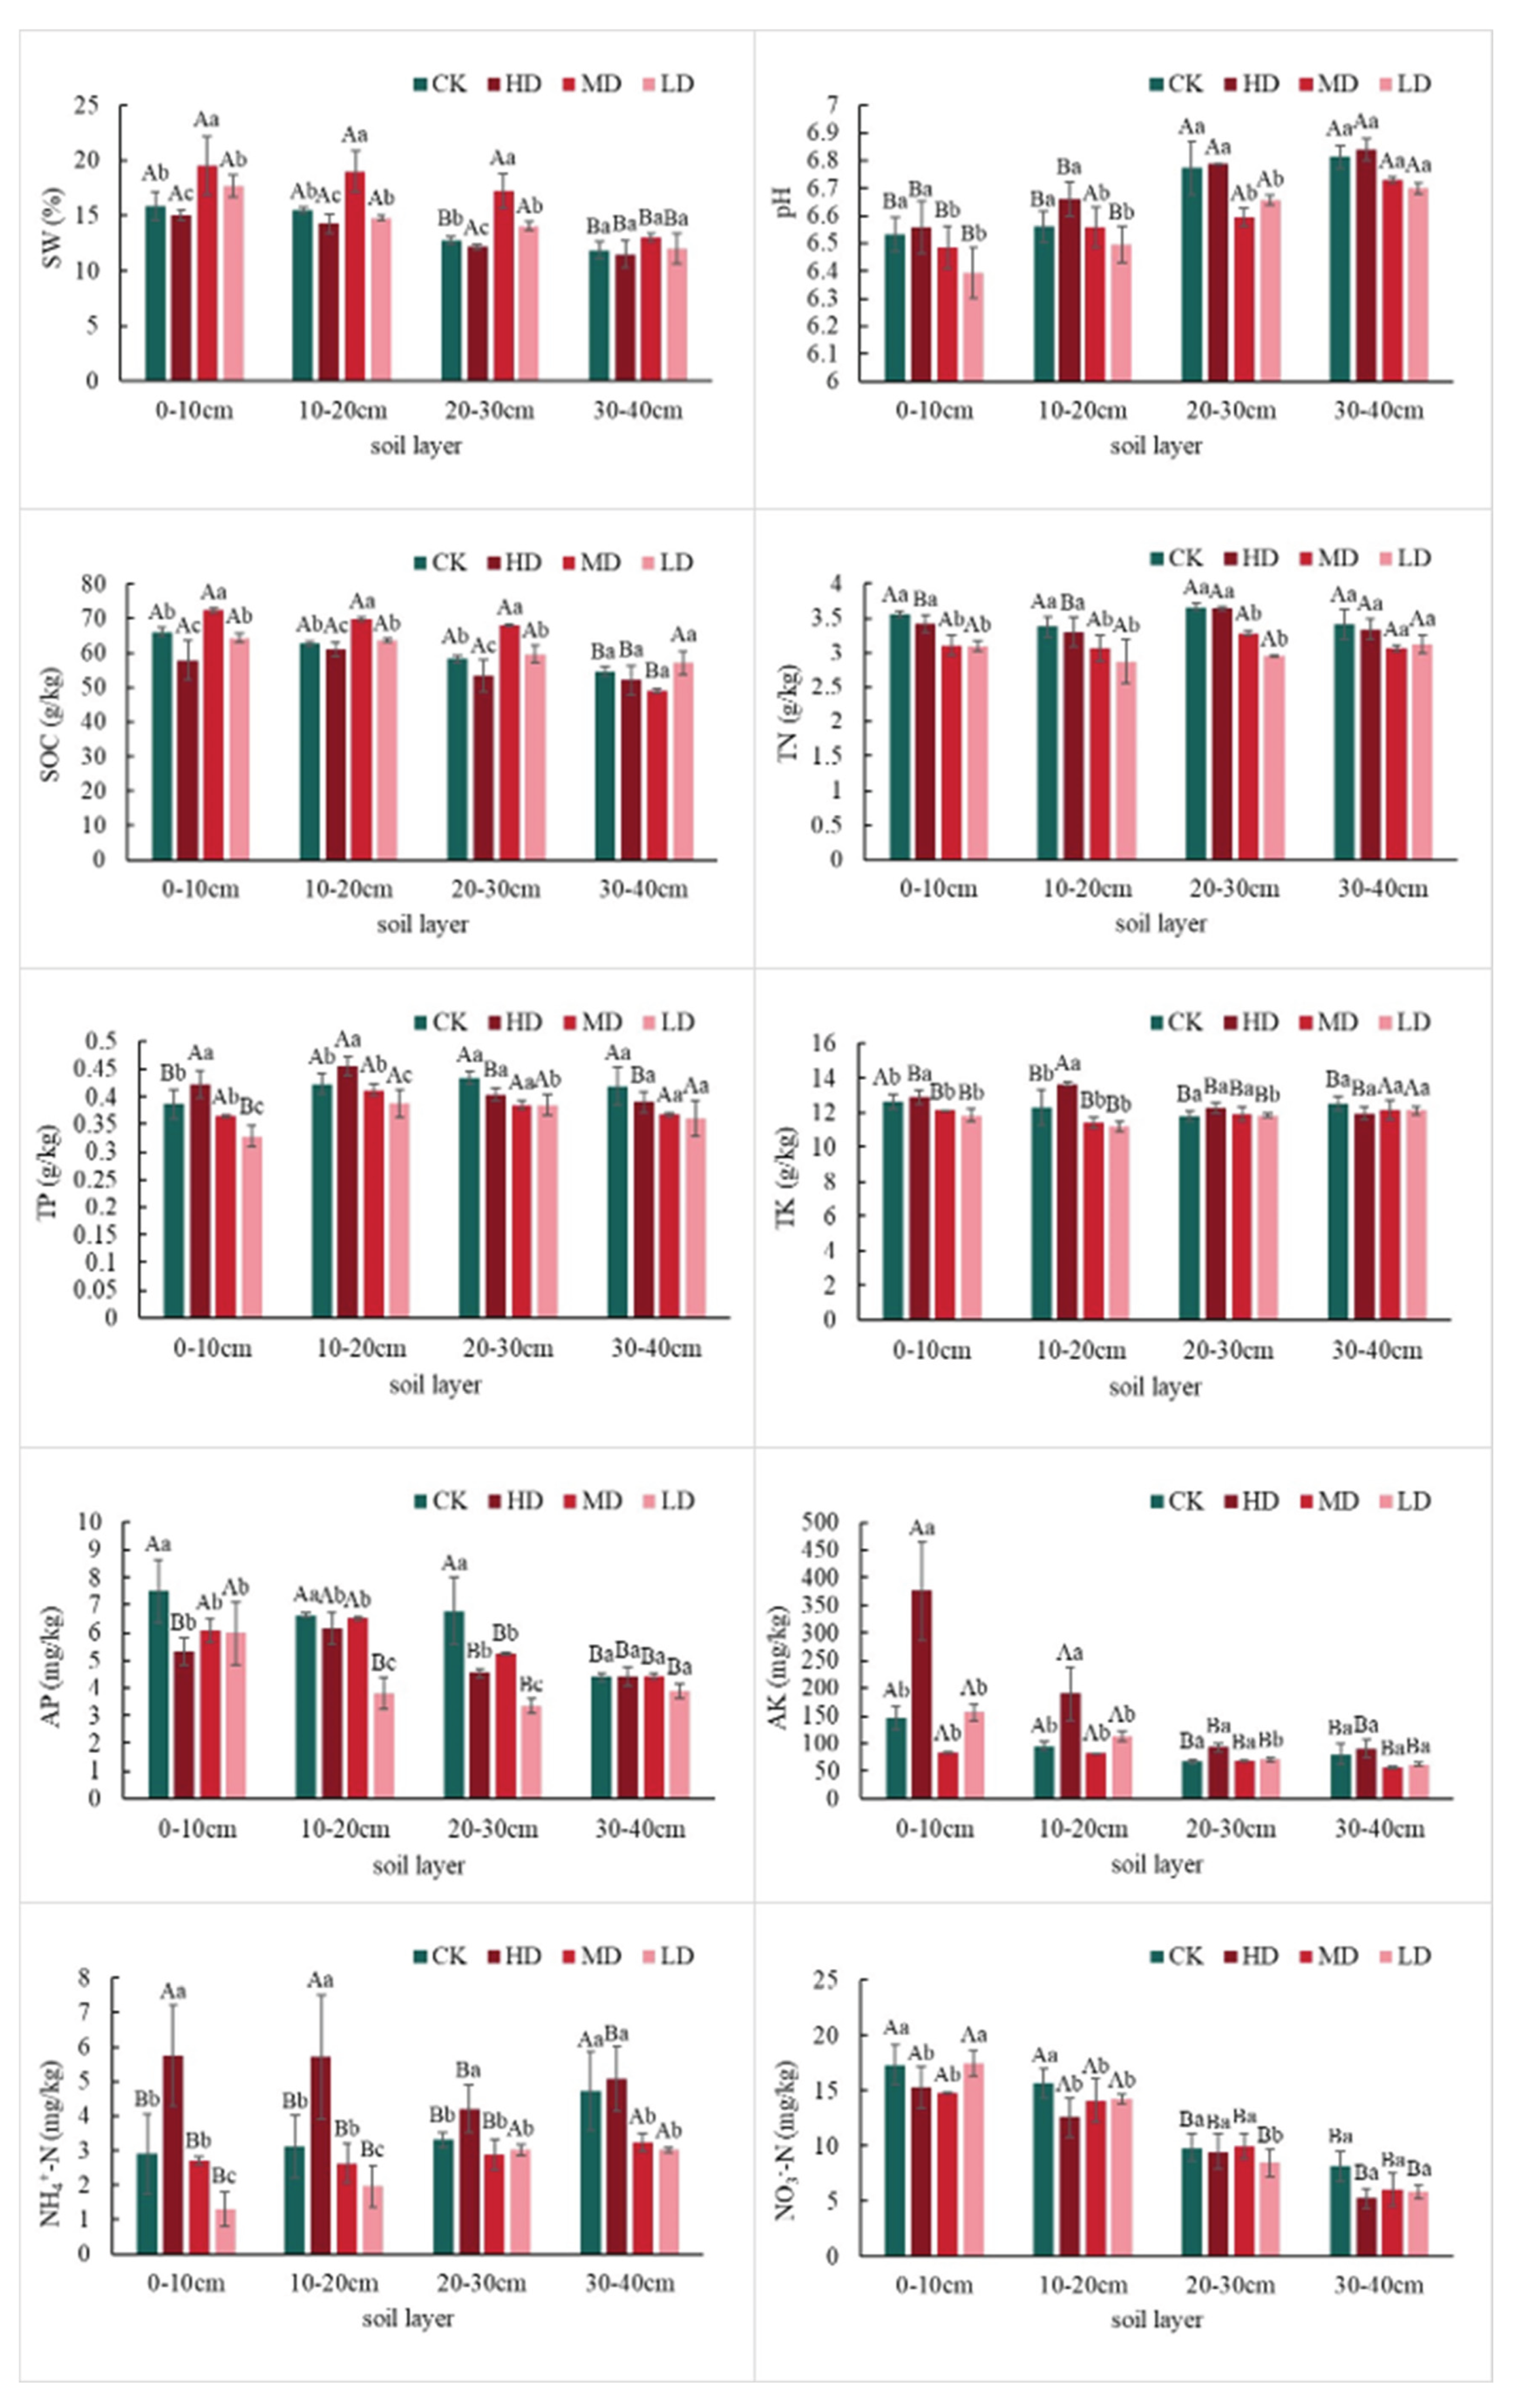
Figure 2.
Effects of different stand retention densities on soil enzyme activities in a Larix principis-rupprechtii plantation. Note: Different uppercase letters indicate significant differences among soil layers within the same stand density, and different lowercase letters indicate significant differences among stand densities within the same soil layer (P < 0.05).
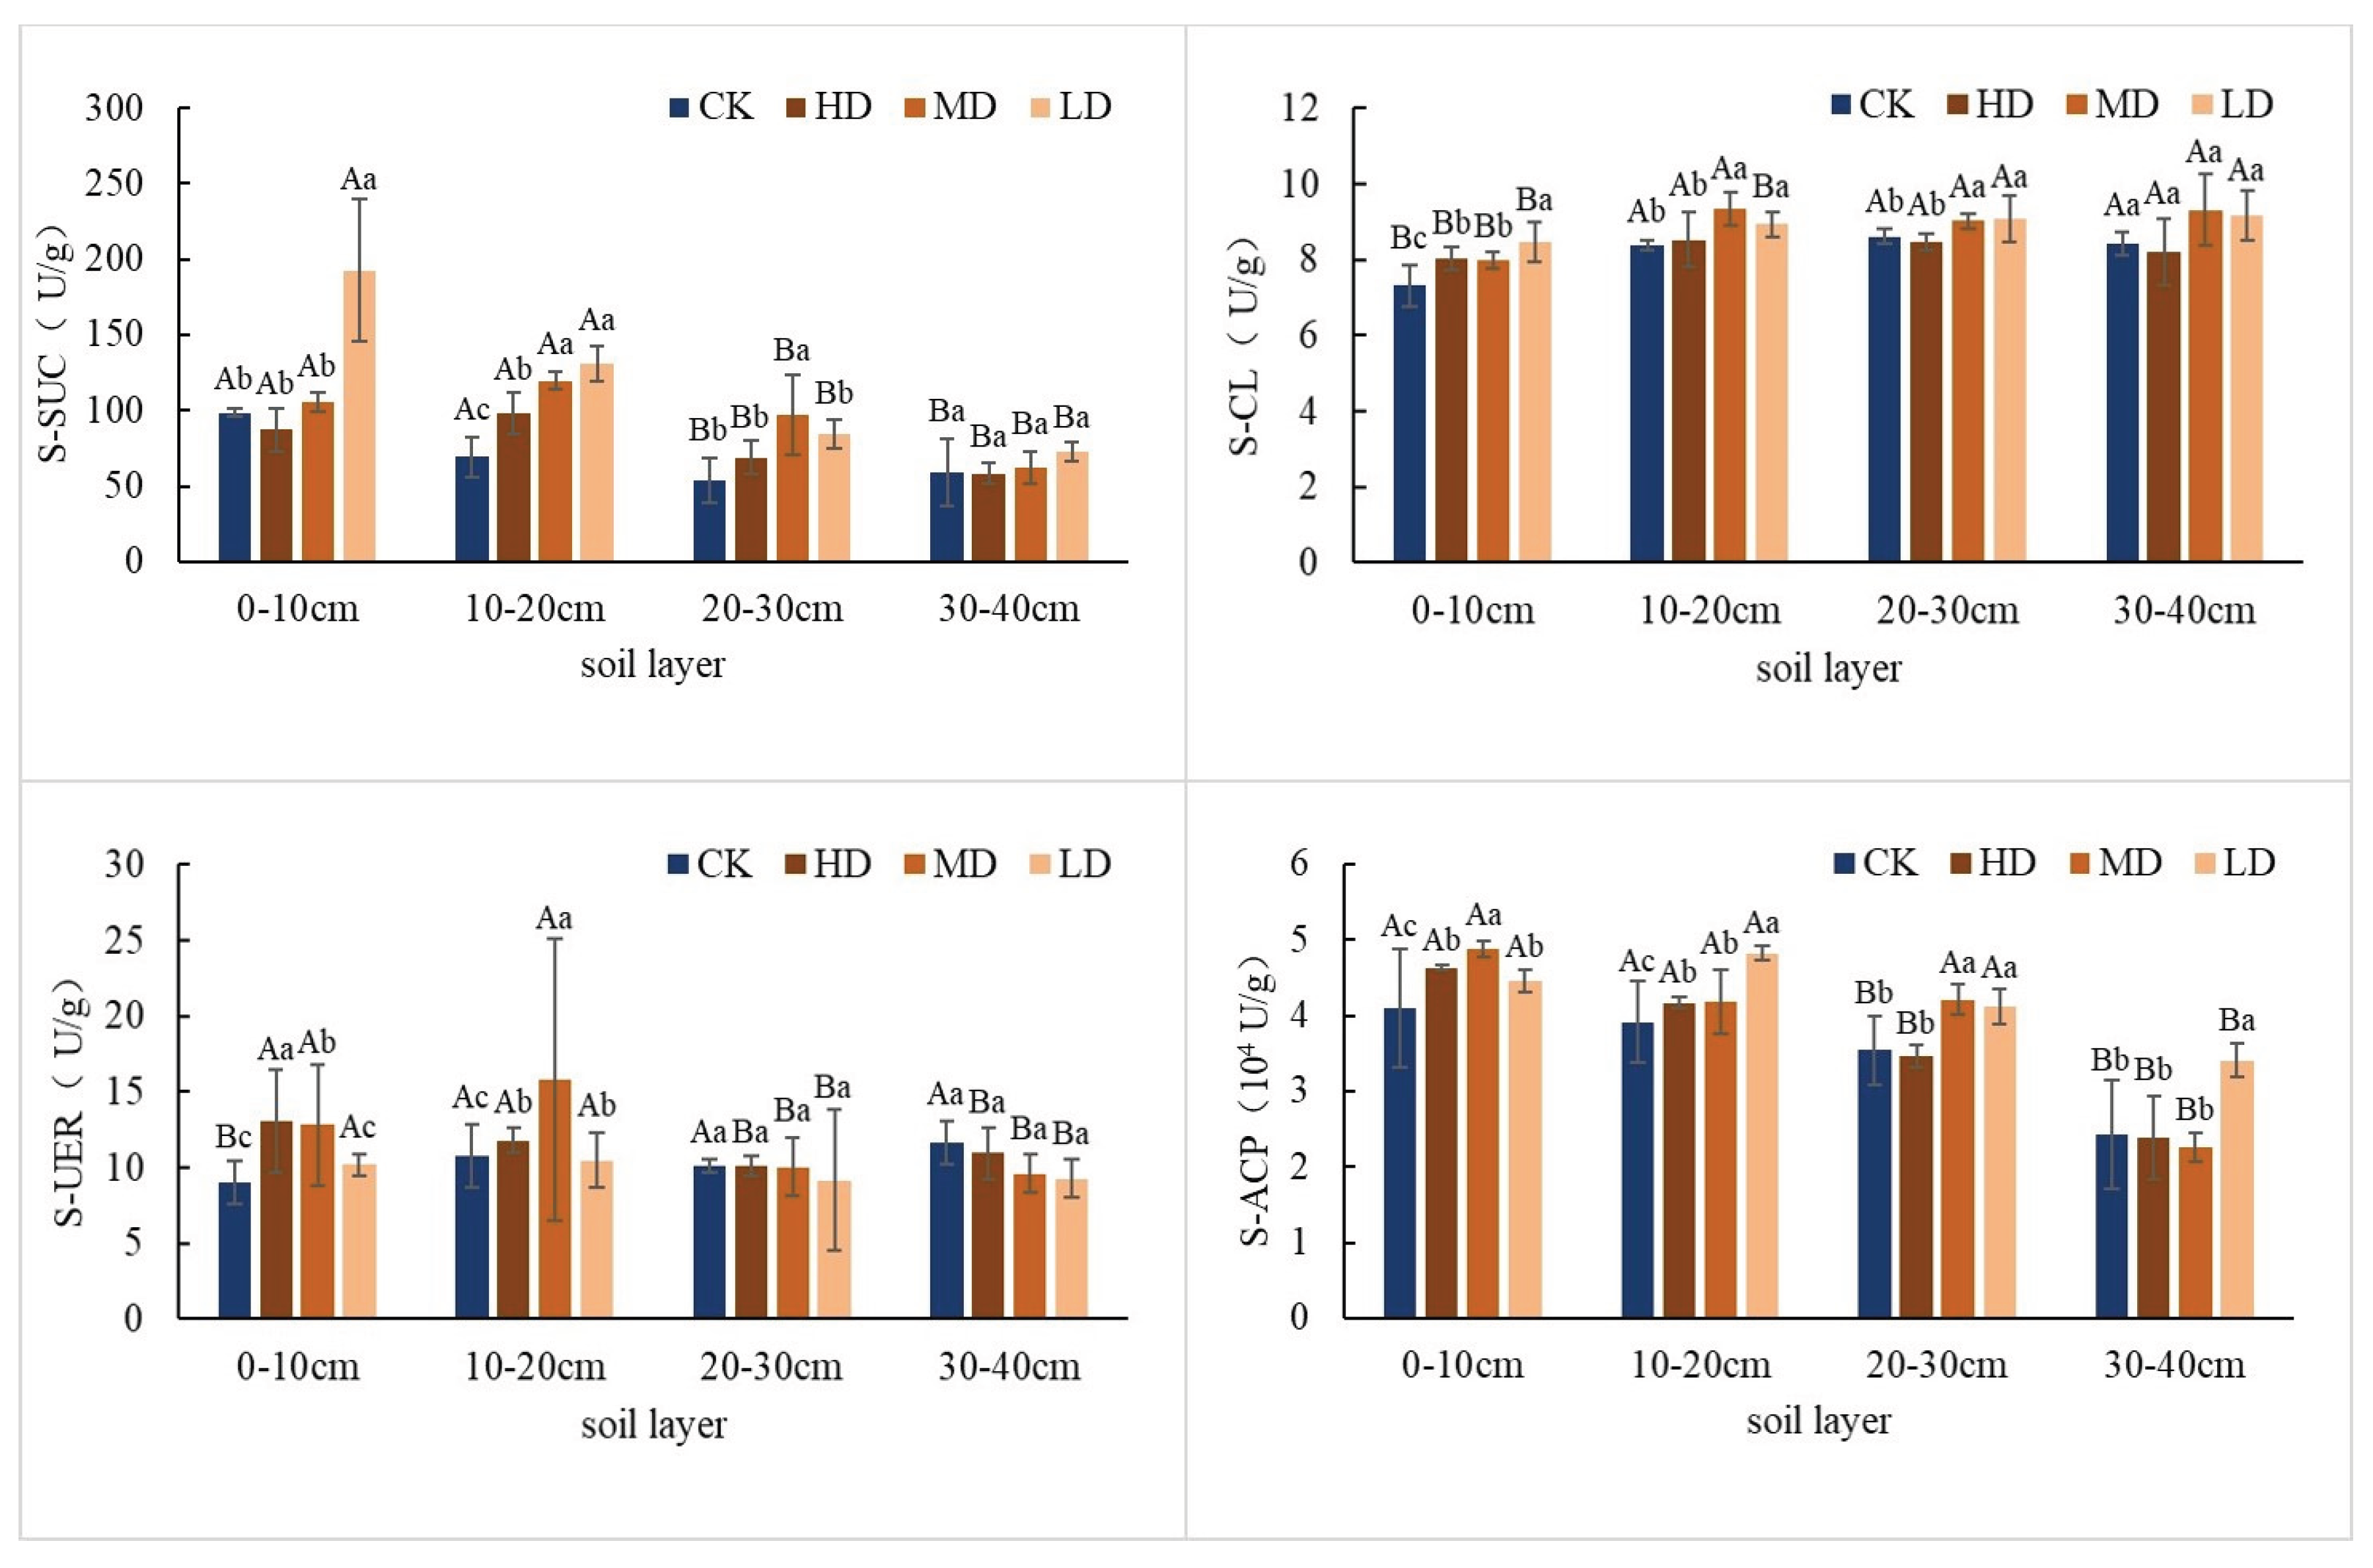
Figure 3.
Differences in soil fungal (a) and bacterial (b) species composition in a Larix principis-rupprechtii plantation under different stand densities. Note: The bar plot on the left represents the total number of species in each group. The dot-line plot at the bottom right illustrates intersection relationships among groups, where orange dots indicate presence and gray dots indicate absence. The upper bar plot displays the number of shared species corresponding to each intersection.
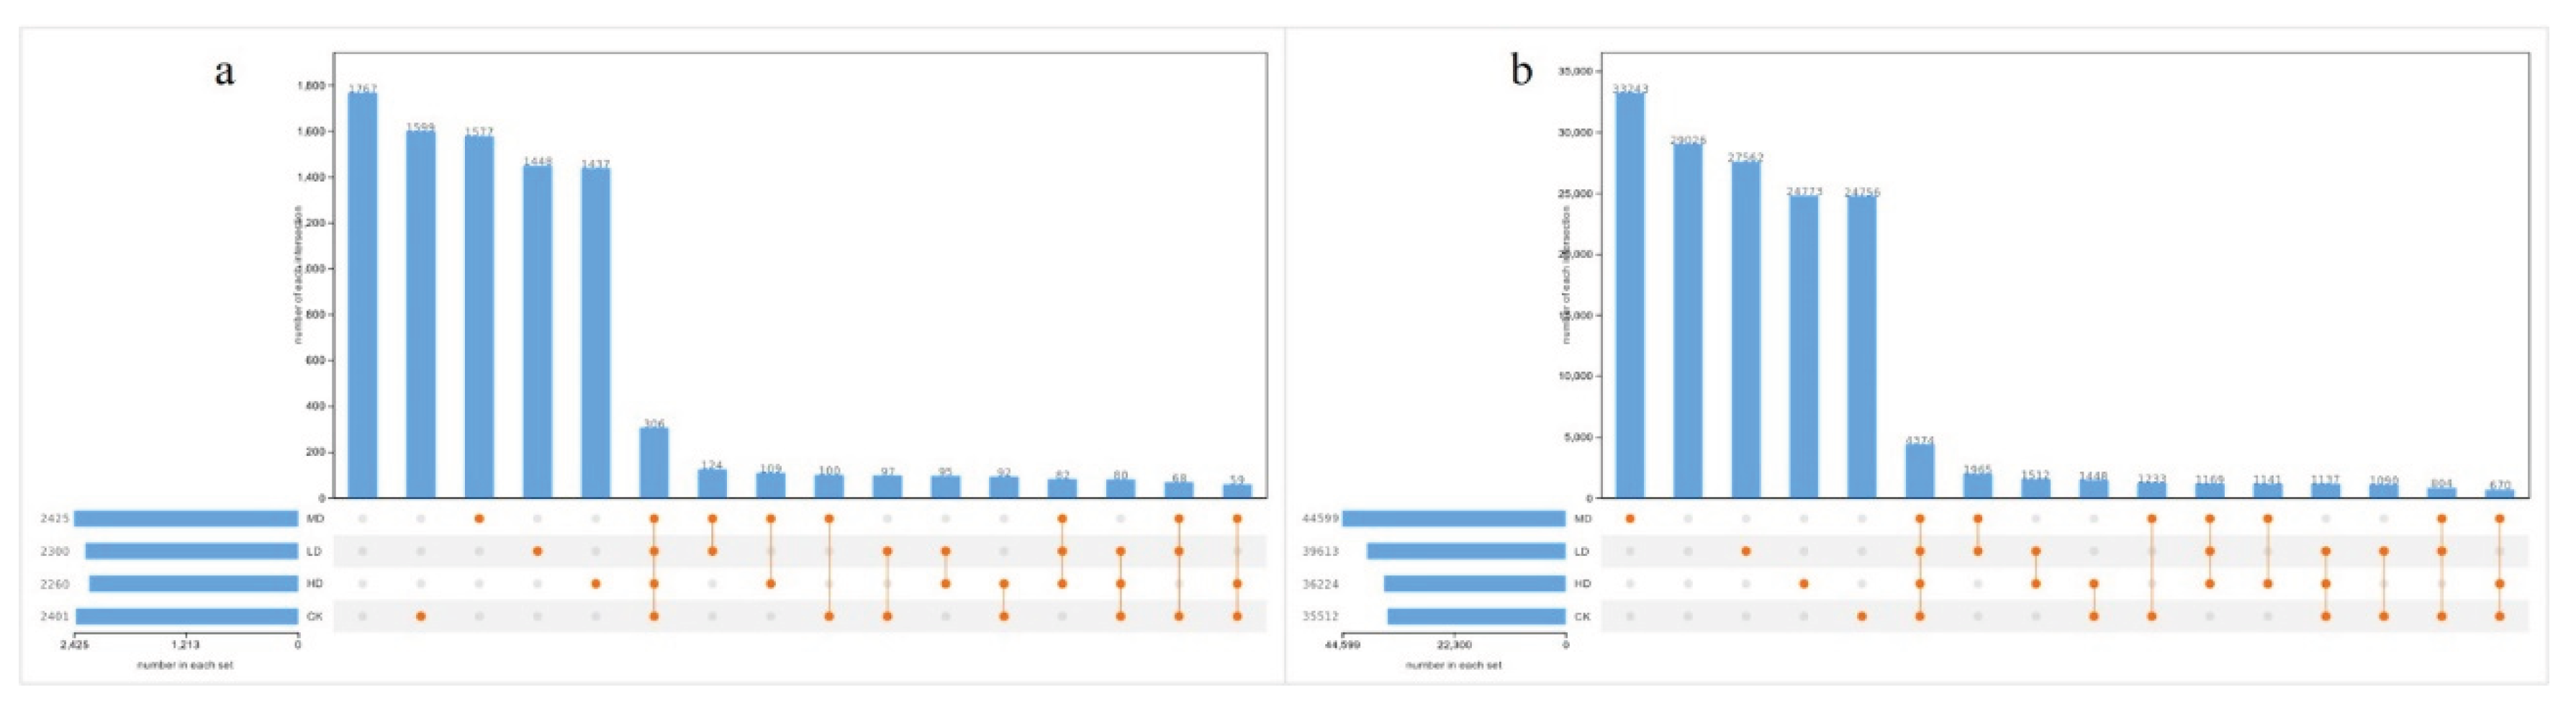
Figure 4.
Impact of stand retention density on relative abundance of fungal (a) and bacterial (b) phyla in a Larix principis-rupprechtii plantation under different stand densities.
Figure 4.
Impact of stand retention density on relative abundance of fungal (a) and bacterial (b) phyla in a Larix principis-rupprechtii plantation under different stand densities.
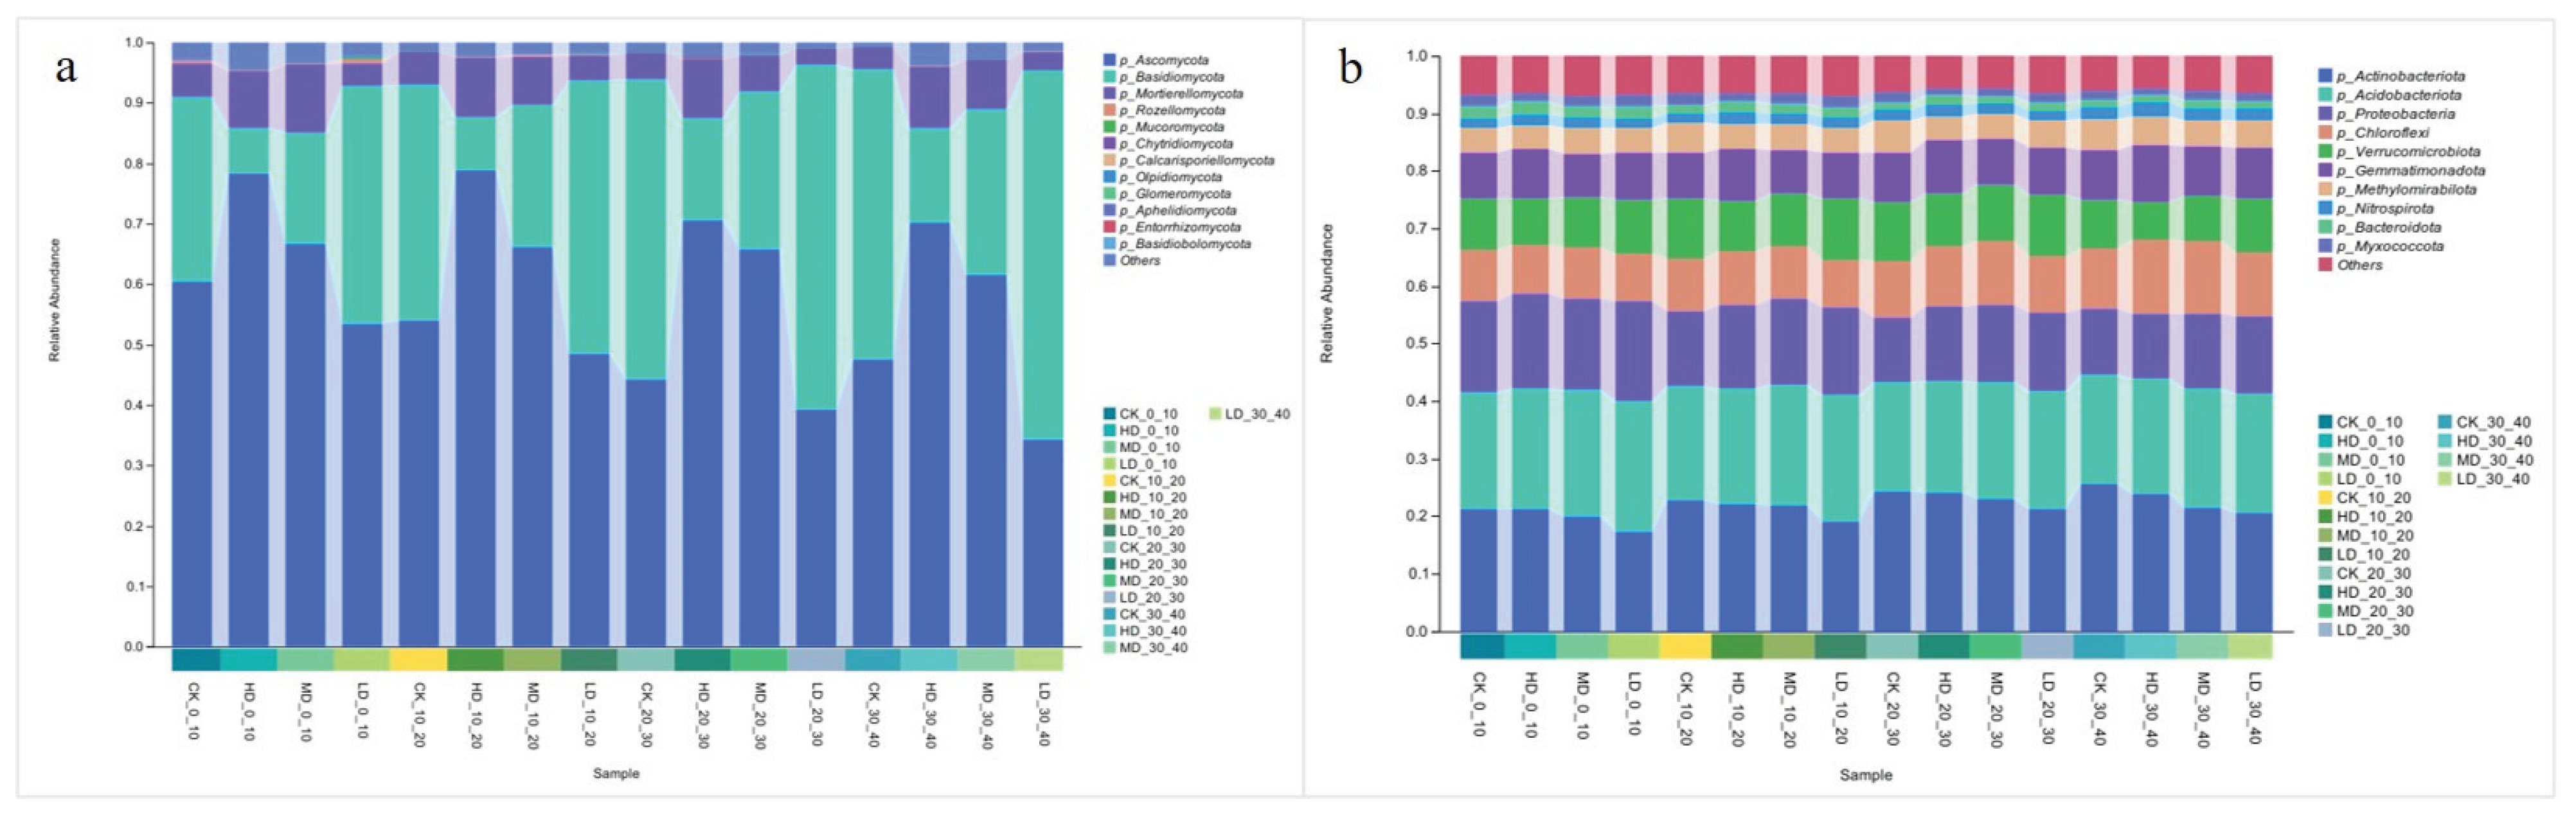
Figure 5.
Effects of different stand retention densities on soil fungal (a) and bacterial (b) alpha diversity indices in a Larix principis-rupprechtii plantation.
Figure 5.
Effects of different stand retention densities on soil fungal (a) and bacterial (b) alpha diversity indices in a Larix principis-rupprechtii plantation.
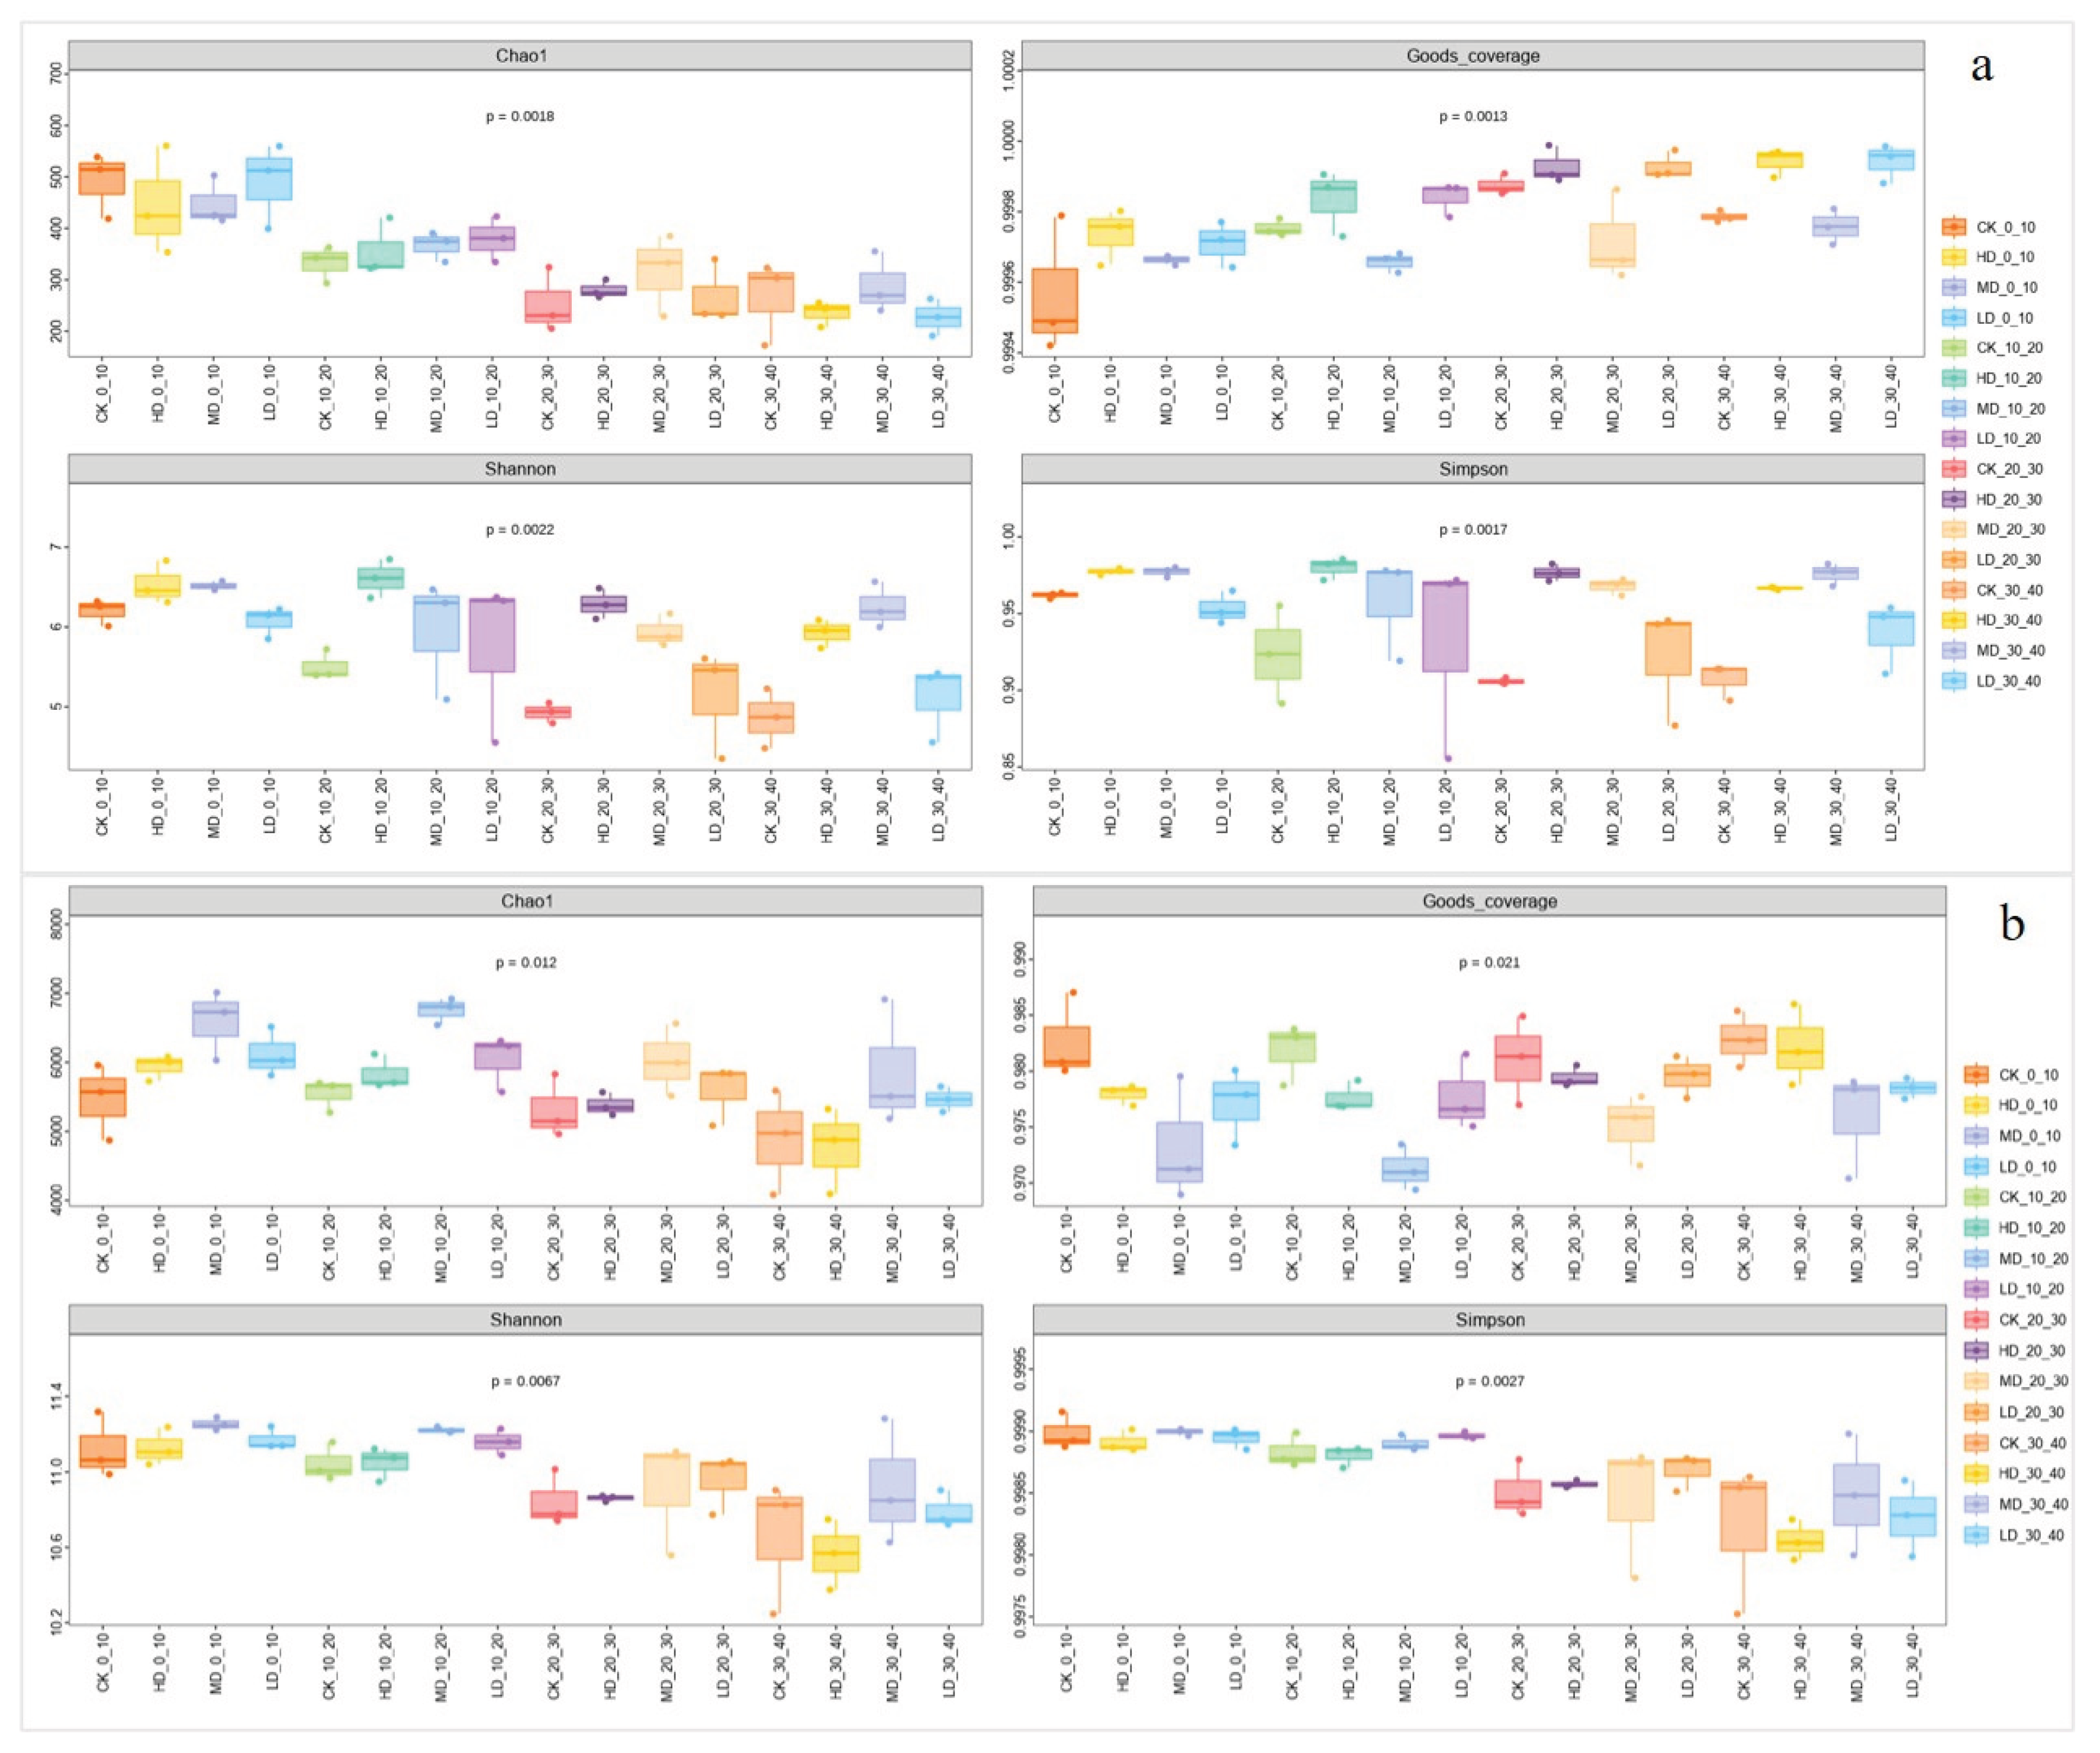
Figure 6.
Principal coordinate analysis of soil fungal (a) and bacterial (b) communities under different stand retention densities in a Larix principis-rupprechtii plantation.
Figure 6.
Principal coordinate analysis of soil fungal (a) and bacterial (b) communities under different stand retention densities in a Larix principis-rupprechtii plantation.
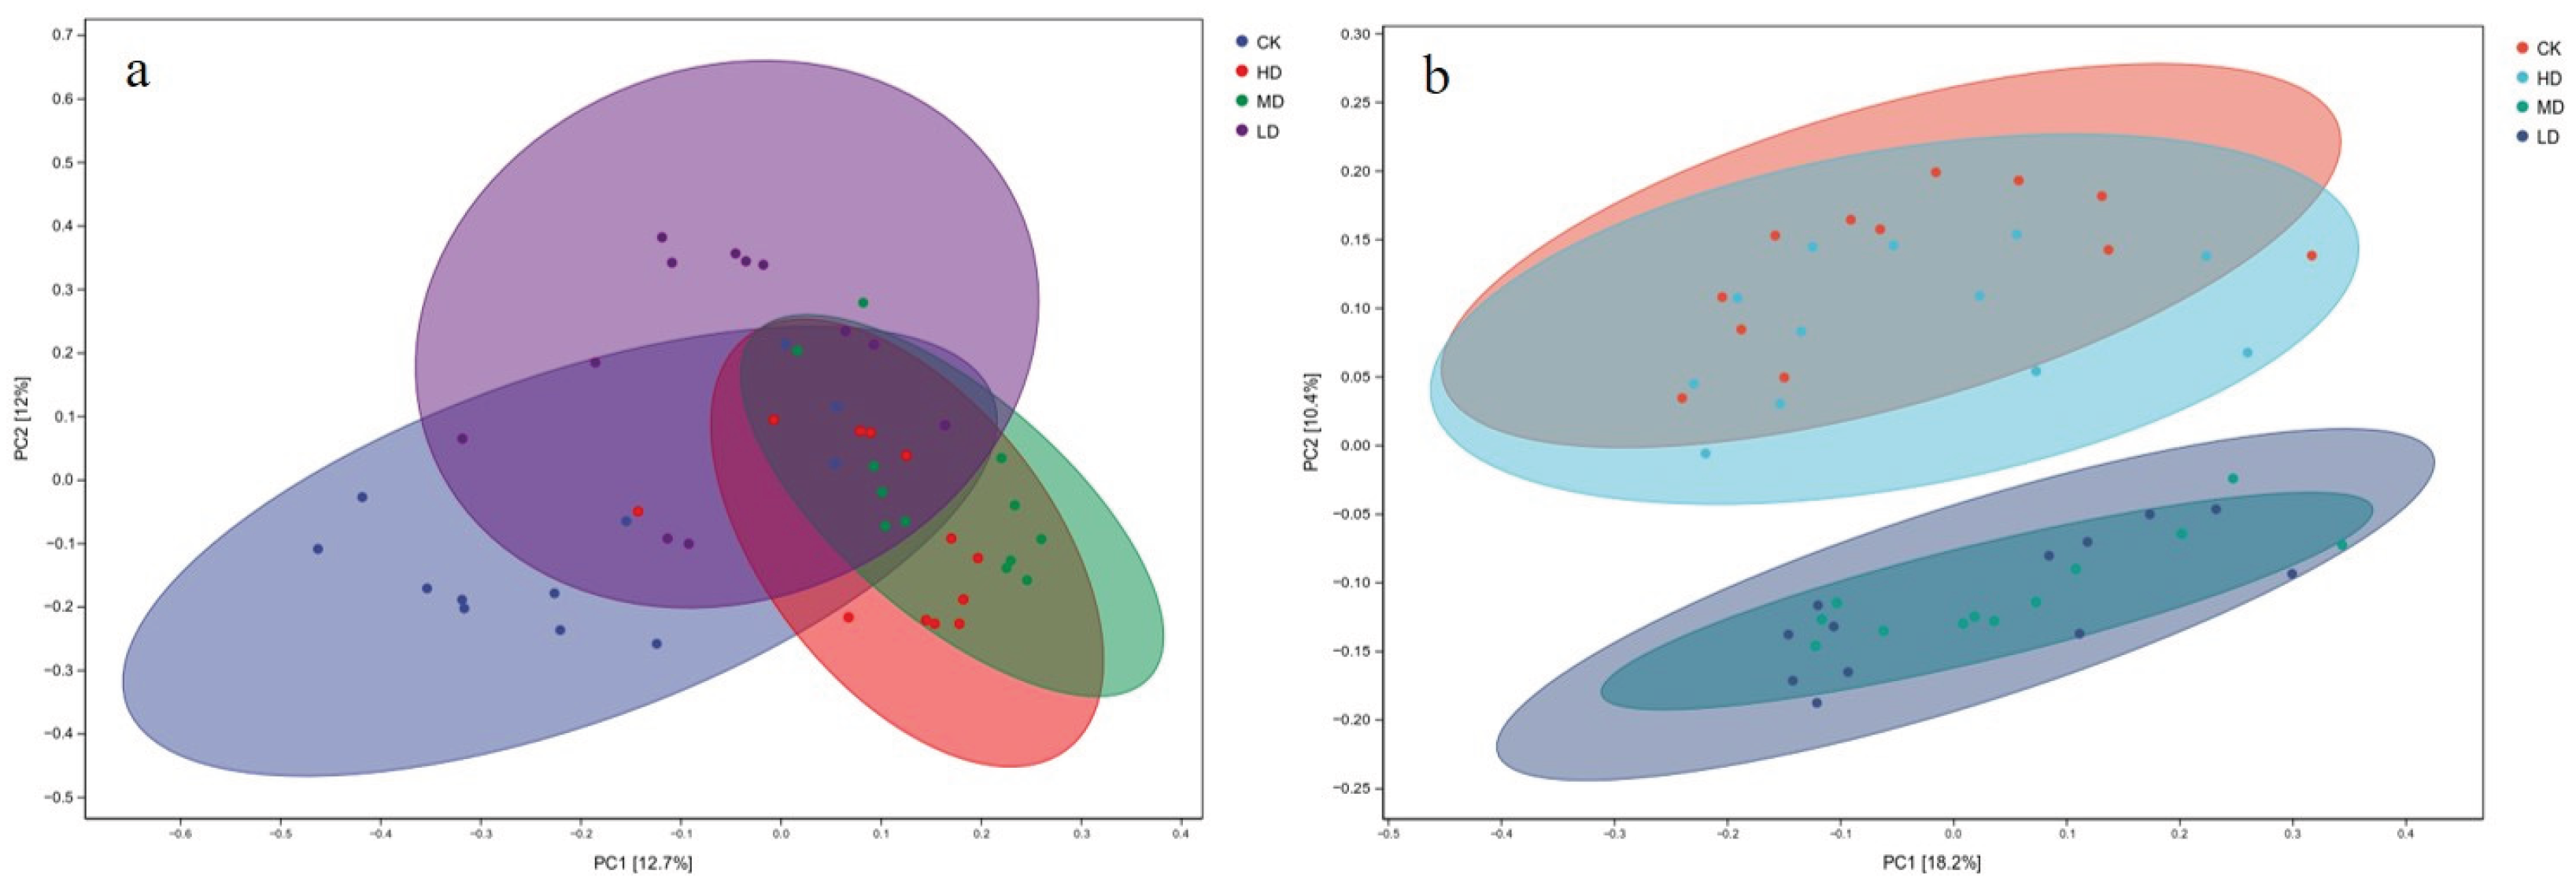
Figure 7.
Correlation between soil physicochemical properties and soil enzyme activities. Note: The abbreviations used in the figure are as follows: AK, available potassium; AP, available phosphorus; TK, total potassium; TN, total nitrogen; NN, nitrate nitrogen; AN, ammonium nitrogen; SOC, soil organic carbon; SW, soil water content; S-ACP, acid phosphatase; S-SUC, sucrase; S-CL, cellulase; S-URE, urease. The color gradient and asterisks represent the strength and statistical significance of the correlations, respectively.
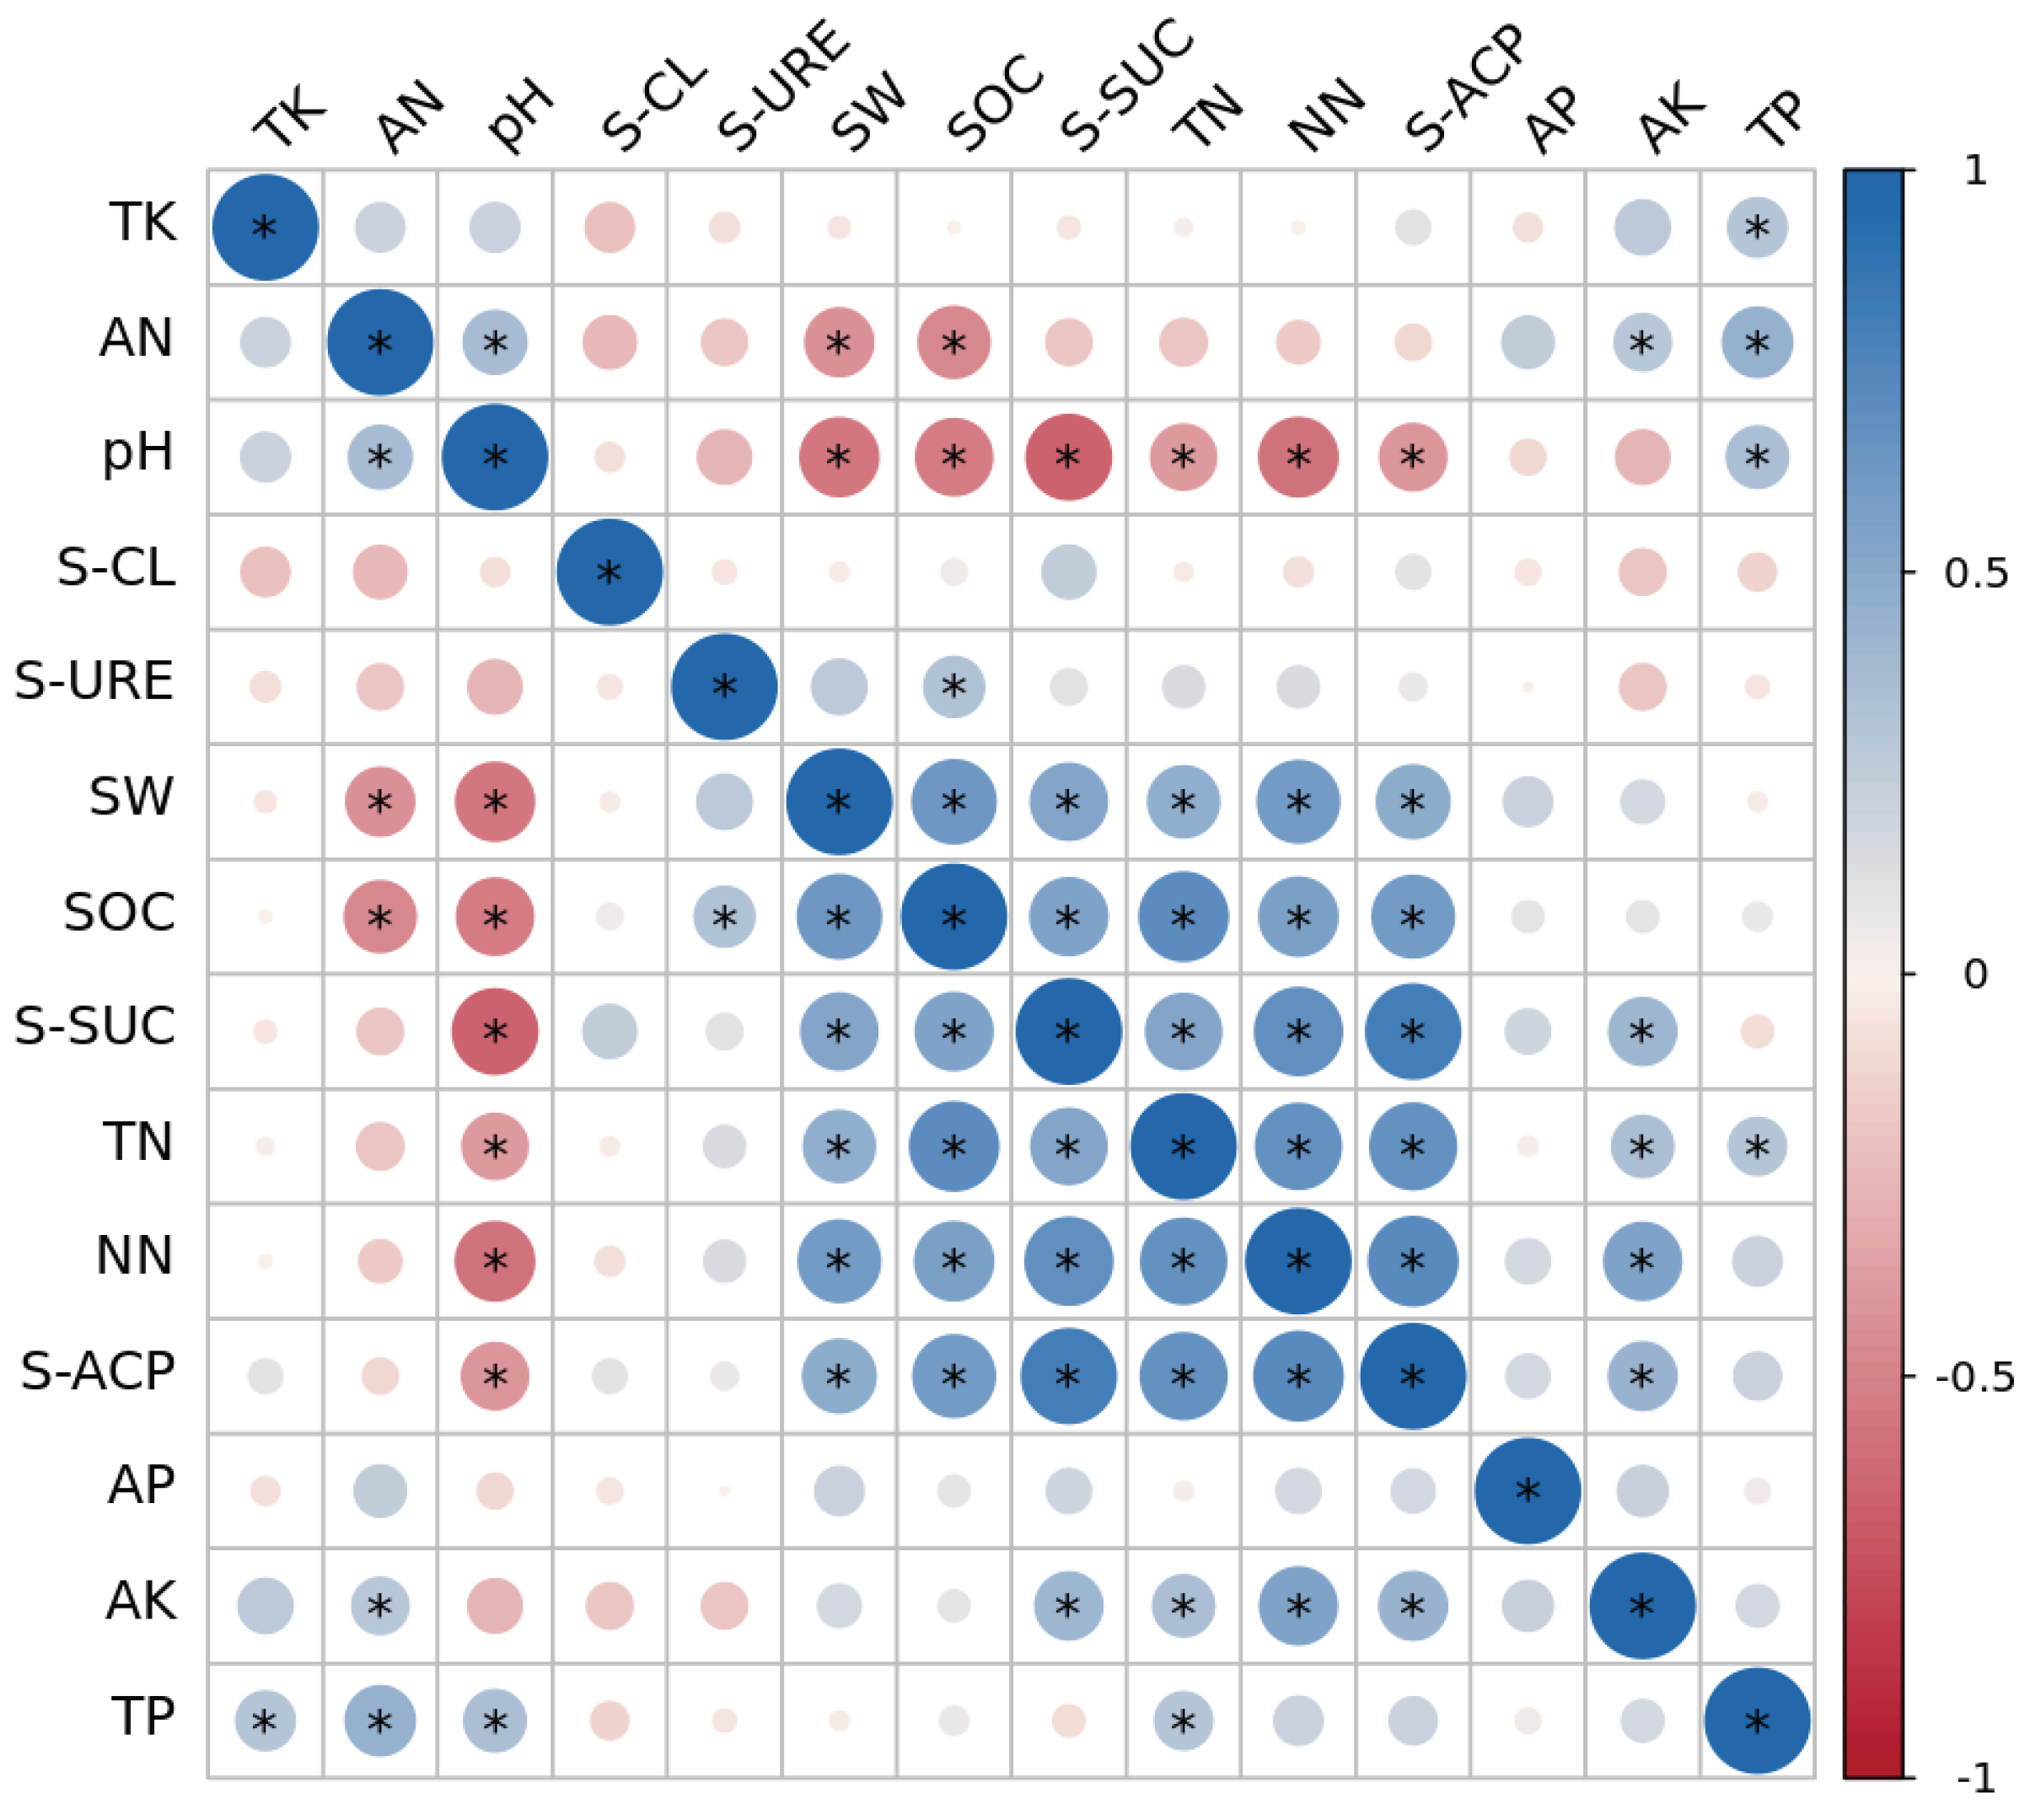
Figure 8.
RDA ordination plot of soil fungal (a) and bacterial (b) communities and soil icro-environmental factors. Note: RDA, redundancy analysis. Environmental factors are represented by blue arrows with abbreviations: AK, available potassium; AP, available phosphorus; TK, total potassium; TN, total nitrogen; NN, nitrate nitrogen; AN, ammonium nitrogen; SOC, soil organic carbon; SW, soil water content; S-ACP, acid phosphatase; S-SUC, sucrase; S-CL, cellulase; S-URE, urease. Fungal and bacterial phyla are indicated by red labels. The length and direction of arrows indicate the strength and direction of the relationship between environmental variables and community composition.
Disclaimer/Publisher’s Note: The statements, opinions and data contained in all publications are solely those of the individual author(s) and contributor(s) and not of MDPI and/or the editor(s). MDPI and/or the editor(s) disclaim responsibility for any injury to people or property resulting from any ideas, methods, instructions or products referred to in the content. |
© 2025 by the authors. Licensee MDPI, Basel, Switzerland. This article is an open access article distributed under the terms and conditions of the Creative Commons Attribution (CC BY) license (http://creativecommons.org/licenses/by/4.0/).
Copyright: This open access article is published under a Creative Commons CC BY 4.0 license, which permit the free download, distribution, and reuse, provided that the author and preprint are cited in any reuse.


