Submitted:
31 October 2025
Posted:
03 November 2025
You are already at the latest version
Abstract
Saudi Arabia is experiencing interactions between ongoing urbanization, tourism growth, infrastructure projects in western regions along the Red Sea, and volcanic hazards. The area contains extensive monogenetic volcanic fields with hundreds of volcanoes formed during the Quaternary period. The large scale of the region contributes to volcanological research often being limited and fragmented, resulting in insufficient age and chemical data for understanding the spatial and temporal development of many volcanic fields. Increased tourism has created a need for volcanic hazard as-sessments, particularly since some volcanic fields are considered as possible tourist destinations. Harrat Lunayyir, in northwestern Saudi Arabia, is an example where such assessments have been conducted. Hazard assessments seek to provide infor-mation about potential future eruption types, locations, and impacts over timeframes relevant to urban planning and risk management. Due to rapid local development, these assessments may be required on short notice for specific small areas within larg-er volcanic fields, even when geological data are limited. This report presents a deter-ministic, scenario-based method for addressing such requests in the Lunayyir Volcanic Field. Results indicate a young Holocene eruption site characterized by a complex sco-ria cone associated with lava spattering, Strombolian, violent Strombolian activity and extensive transitional type lava effusion.
Keywords:
volcanic field
; monogenetic
; scoria
; lava spatter
; ash
; lapilli
; fissure
; rifting
; Arabian shield
; red sea
; lava flow inundation
; Pāhoehoe
; geoheritage
; geotourism
1. Introduction
Monogenetic volcanic fields are a common form of volcanism on Earth, especially within intracontinental regions [1,2,3]. They produce many small-volume volcanoes that usually erupt over short timescales, generating less than 1 km³ of dense rock equivalent (DRE) during their entire lifecycle [2]. Future eruptions typically occur at sites distant from previous vent locations. However, regions with ongoing melting anomalies may see later eruptions on top of older volcanic structures [4,5]. Fields with high magma output and frequent eruptions—ranging from centuries to thousands of years—can develop numerous volcanoes that overlap or form clusters, creating complex volcanic landscapes that might differ from typical monogenetic patterns [3].
When eruption recurrence intervals are geologically short, distinguishing individual eruptive units within such complexes becomes difficult due to the absence of erosional or sedimentological markers. These overlapping volcanoes may still be considered monogenetic if each is fed by a distinct conduit that solidifies before subsequent eruptions occur nearby. The spatial distribution of monogenetic vents varies widely, from random to clustered or structurally aligned patterns, often interpreted as reflecting subsurface melting anomalies and crustal structure [6,7].
Recent research utilizing machine learning suggests that mature volcanic fields can form massifs dominated by volcanic products, fostering vent clustering and potentially creating magma storage zones such as dykes and sills [8,9,10,11,12,13,14,15]. This can promote fractional crystallization and the formation of more silicic magmas, leading to unique explosive or dome-forming eruptions. Although these traits are commonly associated with polygenetic volcanism, in some instances within monogenetic fields, eruptions remain isolated events, forming solitary block-and-ash flows or lava domes. Evidence also indicates that monogenetic systems may gradually transition toward polygenetic behavior, with instances of multiple magma sources or magmatic evolution during brief eruptive sequences, complicating classification and study [16,17,18,19,20,21,22,23,24,25,26].
In summary, monogenetic volcanoes exhibit a complexity that exceeds their small size and brief eruption periods, reflecting their connections to various lithospheric processes occurring across different spatial and temporal scales. This complexity complicates the assessment of volcanic hazards in these areas. Key hazard considerations include the location and timing of potential future eruptions, as well as the nature of possible volcanic events. Effective hazard management requires probabilistic assessments based on data about the temporal and spatial patterns of volcanism, supported by comprehensive volcano models that can be incorporated into spatiotemporal prediction frameworks.
To build such models, three essential components are needed: a comprehensive event library with accurate geochronology spread evenly across the volcanic field; a detailed catalog of vents, including an understanding of vent distributions ideally placed within event chronology; and a simplified volcano model capable of capturing and synthesizing the sequence of volcanic activity observed at individual volcanoes. The accuracy of hazard estimates is thus directly affected by the quality and completeness of these parameters, requiring minimum threshold values for practical probabilistic approaches.
For example, if the event age database is incomplete, unevenly distributed, or characterized by significant uncertainties, whether due to methodological errors or challenges in establishing field-based stratigraphy, the reliability of probabilistic models is greatly diminished. Similarly, a limited understanding of vent distributions or the lack of a comprehensive vent catalogue can pose major obstacles to model development. An additional complication comes from the frequent occurrence of multi-event or nested volcanoes [27,28], where multiple eruptions form new edifices over relatively short timescales, further complicating the accuracy of probabilistic modeling in these systems.
A major challenge in developing probabilistic models is that eruption prediction timelines are often expected to be much shorter than what geological records support. This expectation is influenced by public familiarity with more frequent hazards, such as earthquakes, floods, or landslides. These events occur on timescales—ranging from years to centuries—that align with human planning horizons and are reflected in probability estimates for disaster preparedness. In contrast, volcanic eruptions—especially in association with distributed volcanic fields—typically have recurrence intervals far longer than 50–200 years, creating a paradox between expectations and reality [29,30,31,32,33,34,35,36,37,38,39,40,41,42,43]. No definitive solution exists yet. In this report, we offer a narrative to illustrate these challenges and suggest possible methods for addressing them elsewhere.
Saudi Arabia is experiencing rapid socio-economic transformation as it prepares for a sustainable, post-oil future. The country has many potential tourism sites, including recreation and adventure tourism, many of which require significant infrastructure improvements to accommodate visitors [44,45,46,47,48,49,50,51,52,53,54,55,56,57,58]. In recent years, the geoheritage of the region is more recognized [59,60,61,62,63,64,65,66]. However, additional, comprehensive geoheritage research is needed to identify key geological features and suitable geosites for inclusion in the national tourism strategy.
Significant development initiatives along the Red Sea coast focus on adventure tourism [67,68,69,70] amid the striking landscapes of the Arabian Shield, characterized by dark basaltic lava flows and relatively young volcanic formations sitting over light-colored Precambrian crystalline basement rocks. While Cenozoic volcanic fields are widespread across western Arabia (Figure 1 – harrats and Lunayyir Position – main roads and towns, etc.), current infrastructure limitations restrict the growth of niche tourism in the region. Harrat Lunayyir, situated approximately 300 kilometers northwest of Al Madinah and near Um Lujj, emerges as a key destination for specialized tourism activities (Figure 1). Red Sea Global plans to further develop tourism offerings in this area, leveraging the region’s dramatic contrast between basaltic lava fields and crystalline basement rocks [71,72].
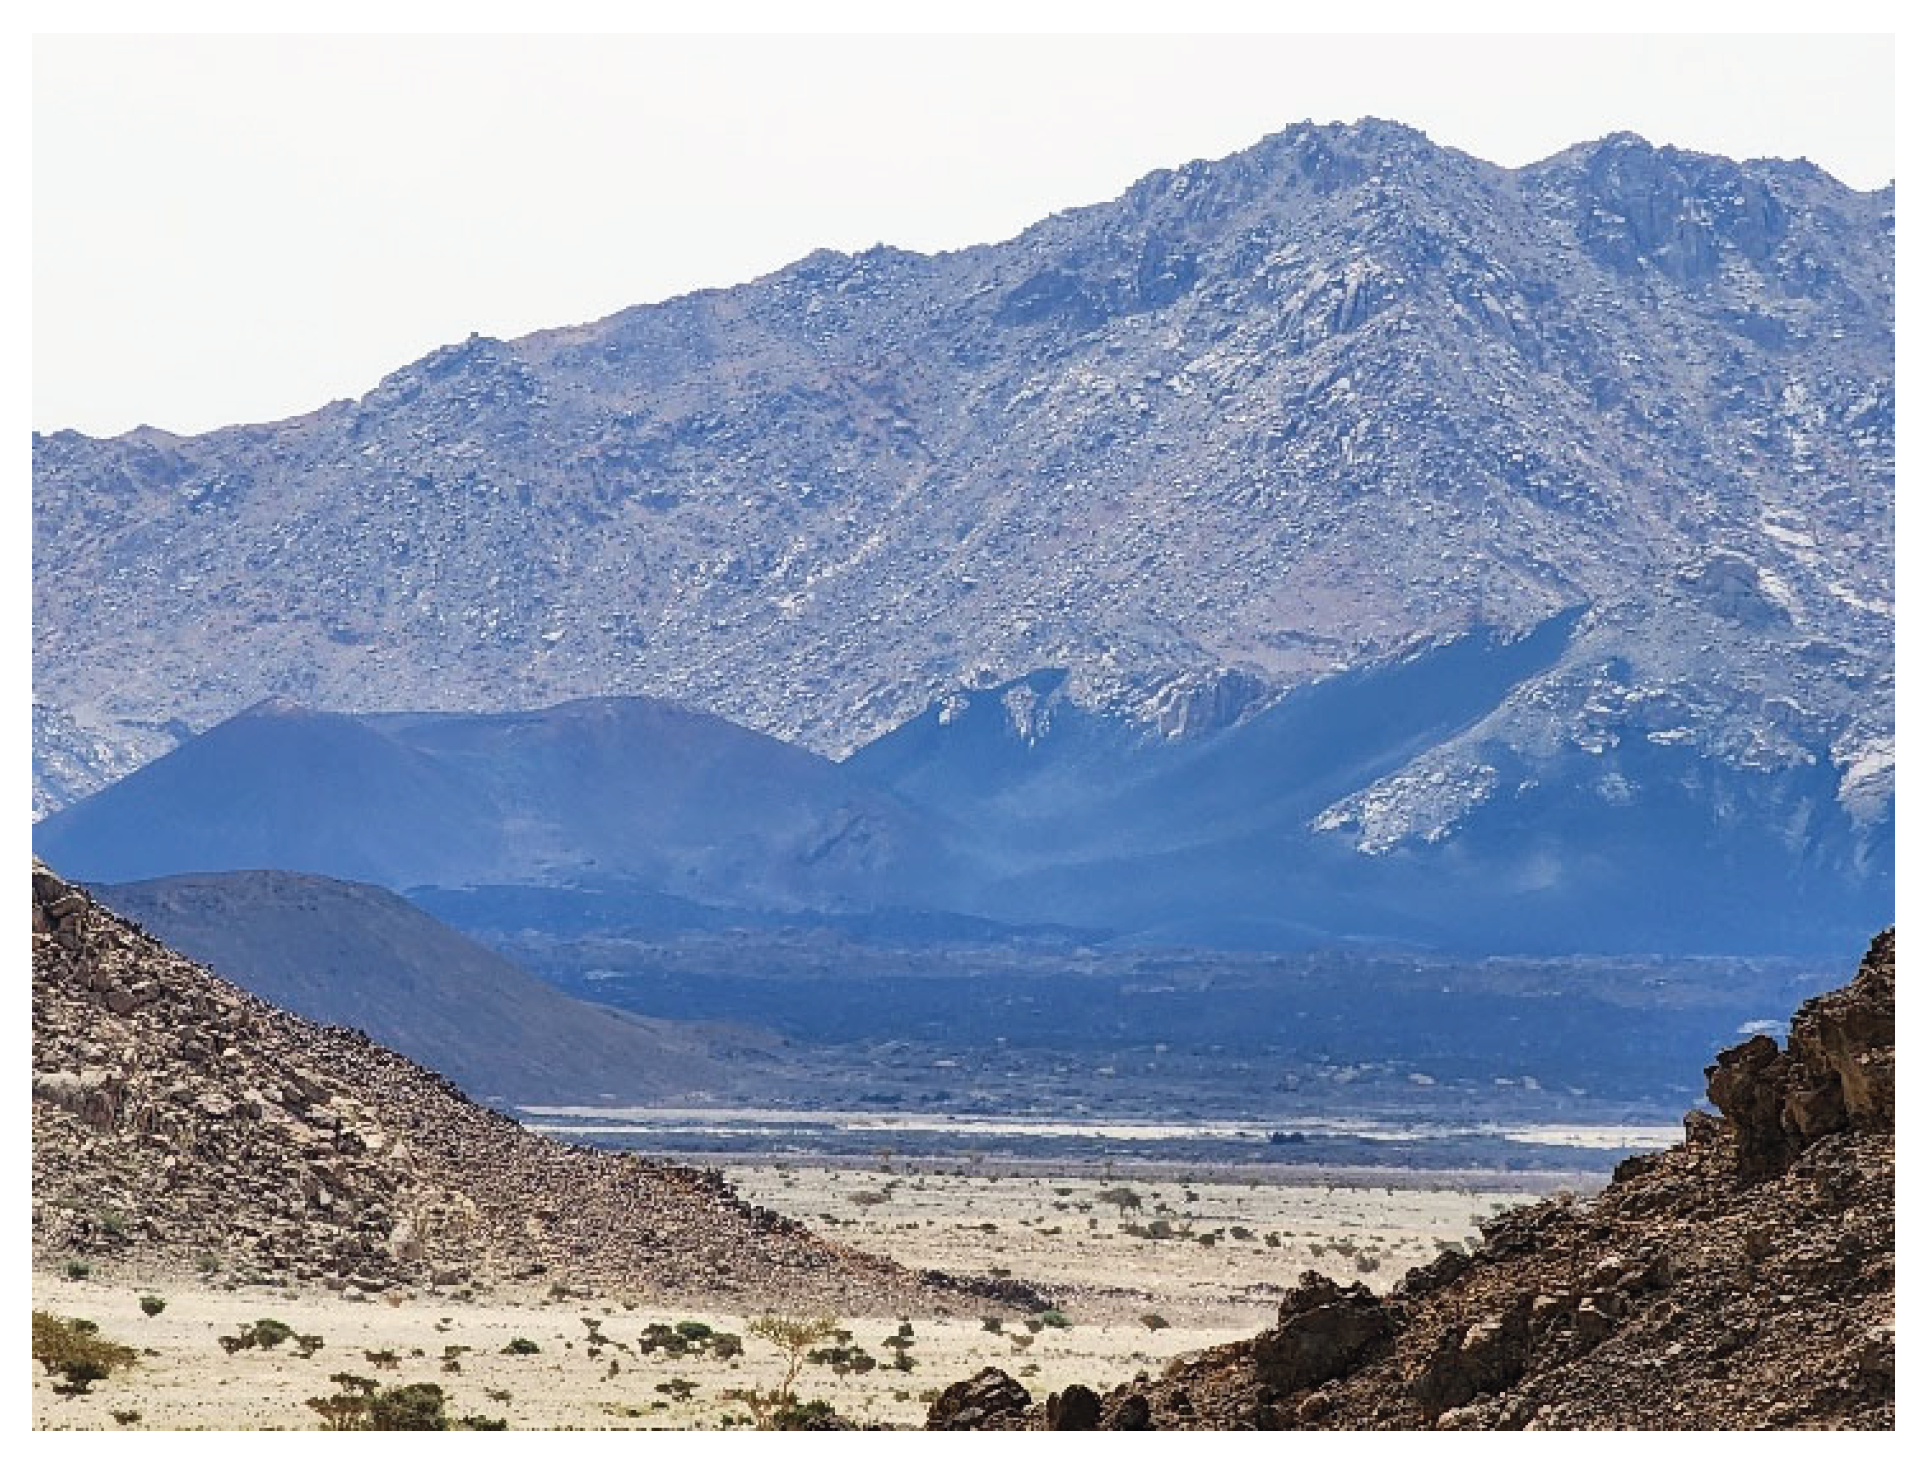
During the planning stage, tourism development centered on the so-called Option 4 region (Figure 2 – overview of Lunayyir), which includes a young scoria cone (Target Volcano), its surrounding plain, and a complex lava flow that extends over 10 km from the cone. The region's general physiography is illustrated in Figure 3 and Figure 4, highlighting a significant morphological feature where Precambrian basement rocks emerge, creating a landscape of steep basement hills and flat-bottomed Quaternary valley networks following major structural elements [72]. These valleys are the geomorphological features that host most of the Cenozoic volcanics.
Geological information is compiled from the available 1:250,000 geological map of the region [GM-053 – Wadi al’Ays sheet] and an updated, interim dataset of ongoing 1:100,000 geological mapping. We differentiate lava flow horizons (and associated explosive pyroclastic eruptions) by identifying an older part of the area, labeled as the Qj lithostratigraphy unit, which is inferred to have formed in the Late Pliocene to Pleistocene and largely crops out in the southern part of the volcanic field. Younger volcanism from the Pleistocene to Holocene is distinguished based on sporadic radiometric age dating (with unreliable K-Ar and sporadic Ar-Ar data) [71,72,74,75,76,77,78,79,80,81,82,83,84,85], morphology [86], and geological mapping based on relative stratigraphy, labeled from Qm1 to Qm6 from older to younger (Figure 5 – 1 to 100 k geology map). The study area is primarily composed of the youngest Qm6 lava flows, with small remnants of Qm5 nearby and some older eruptive products that have been modified by erosion (Figure 5).
Preliminary research, however, shows that Option 4 is exposed to significant natural hazards, mainly seismic and volcanic risks [71]. Seismic data since 2007 (Figure 6 – volcanics and seismic), including a notable 2009 unrest [75,77,80,81,83,85], reveal ongoing low-intensity earthquake swarms along a NW-SE belt, related to shallow crustal structures and possible faults. The 2009 event—possibly a failed eruption—is valuable for anticipating future volcano-seismic activity and understanding warning signs of eruptions. Probabilistic and deterministic assessments indicate generally low earthquake intensity in the area, but similar events remain possible. The region also faces highly irregular hazards, such as rockfalls and flash floods. Option 4 lies in a zone with high volcanic vent density and includes one of the youngest volcanoes based on its youthful morphological appearance, suggesting potential for future eruptions even on a century scale.
The Option 4 area (Figure 5) is situated in the center of Harrat Lunayyir and has been designated as high-risk for both seismic and volcanic hazards, as well as potential cascading events such as mass movements. This understanding of the hazard profile at the proposed development site prompted an assessment that specifically concentrated on the volcanic risks in this region, especially within the Option 4 area. The evaluation was requested under two main constraints: 1) completing the report in approximately six months, and 2) providing suggestions regarding the likelihood of volcanic eruptions over a 50- to 200-year span, which aligns with planning needs for major investments and development projects.
While these requirements are generally achievable for hazards like earthquakes, floods, or landslides—thanks to established observation networks, historical records, and spatial analyses—they are more challenging for volcanic systems that have not been extensively studied. At Harrat Lunayyir, critical geological data are still unavailable; information on the age, composition, and eruption styles of the volcanoes is limited and unevenly distributed. This makes it difficult to compare with other Saudi Arabian volcanic fields, such as Harrat Al Madinah, which benefits from detailed geological maps and associated books [88]. Although interest in developing an eruptive history database grew after the 2009 volcano-seismic events, current data remains sparse and inconsistent, making probabilistic hazard estimates for the desired timeframes more complicated. To address these issues, a systematic approach was used to identify key volcanic hazards that require further attention. This report outlines the initial conceptual framework for the volcanic geology of the region, which was later developed into a detailed geological model. It also includes recommendations for risk mitigation and monitoring strategies as necessary.
2. Materials and Methods
This study uses extensive desktop research to identify global analogs of volcanism relevant to the study area, providing a set of comparative examples to describe potential volcanic hazards in the region. It incorporates previously documented field observations, new reconnaissance mapping, and field recordings along with macroscopic descriptions of key samples and microtextural observations from coherent (lava) and pyroclastic rocks (e.g., ash and lapilli). The methodology is divided into two main approaches.
The first step outlines the main types of volcanic hazards linked to the volcanic history of northern Harrat Lunayyir. These hazards are associated with specific eruption styles, as indicated by the volcanic deposits that can be mapped in the field.
Digital elevation models were used to calculate eruptive volumes, identify units, and characterize landscape features. The overall geomorphological assessment employed the ALOS-PALSAR Digital Elevation Model (DEM) with a 12.5-meter resolution, which is adequate for capturing general volcanic geological details and useful for lava flow inundation simulations with Q-LavHA software in QGIS environments [32,89,90,91]. Near the youngest vent (Option 4), LiDAR (Light Detection and Ranging) provided a processed DEM at a 0.5 m resolution from the Red Sea Global development company. Because LiDAR coverage was limited to the youngest and one older intact scoria cone, as well as the proximal part of the Holocene lava flow field, it does not allow for comprehensive high-resolution volume estimates across all eruptive products. Nonetheless, LiDAR data enabled a detailed analysis of lava flow surface textures, pressure ridges, lava tubes, and channels, and facilitated a comparison between volume estimates from available LiDAR field data (a small area only around the source volcano) and ALOS-PALSAR DEMs.
Red Relief Surface Maps (RRSM) [https://www.rrim.jp/en/ - accessed on 30 October 2025] were generated by combining Red Slope Angle Maps and Differential Openness maps derived from the DEMs [92,93]. RRSM proved useful for delineating lava flow boundaries, enabling the identification of individual lava lobes [24,94,95,96,97] with LiDAR data, while ALOS-PALSAR provided broader lava flow distribution patterns.
Eruptive and edifice volumes were calculated from the DEMs using the QGIS Volume tool, which operated with the lowest and average pixel elevations along identified lava flow contacts. Field observations and GPS elevation measurements revealed that most emplacement surfaces are remarkably flat, dipping less than 1.5 degrees (approximately a 300 m drop over 12,000 m). This slight dip is unlikely to significantly impact volume calculations, except in areas where topography drops sharply—mainly along suspected structural lines where lava flows cascade. These zones were identified in the distal parts of the study area, where flows narrow and thin, contributing minimally to the total estimated volumes.
3. Results
This section may include subheadings. It should give a clear and concise summary of the experimental results, their interpretation, and the conclusions that can be drawn.
3.1. Field Observations
3.1.1. Spatter and Scoria Cones
Fire or lava fountaining eruptions happen when jets of low-viscosity magma shoot molten fragments, called spatters, into the air [98,99]. These sometimes-episodic events, which can look like water hose blasts, last from hours to days and are usually linked to fissures hundreds of meters long before focusing into point-source eruptions. Fountain heights often go beyond 200 meters, so a 500-meter exclusion zone is advised to stay clear of hot pyroclasts [98,99]. Magma speeds exit at several tens of meters per second. Fissure eruptions produce lower fire curtains, with mass eruption rates ranging from 10⁵ to 10⁶ kg/s. Main products include large spatters around vents, forming cones, and new lava flows that can cover older volcanic features. In the lava fields west of Target Volcano, volcanic spattering has covered previous landforms (Figure 7).
Weak convective plumes above magma fountains only lift fine ash particles a few hundred meters, while larger fragments quickly fall out [98,99]. Fountaining often occurs alongside or shifts into effusive activity, creating interconnected lava flows and mild explosive hazards. Lava fountains typically feed flows both directly and by depositing spatter clasts, resulting in alternating agglutinates and clastogenic lava where clastic textures remain visible. These features are standard near the source area. Hawaiian fountaining involves evenly bubbly magma ascent, contrasting with Strombolian eruptions, which feature slug flow, large bubble bursts, and greater pyroclast dispersion [99].
Volcanoes that mainly emit mafic, low-silica magmas are characterized by periods of open vent activity. During these times, explosive eruptions typically occur in rapid, individual bursts of spatter—called Strombolian-style (sensu stricto) explosive events—separated by intervals ranging from seconds to several hours. Explosion durations typically last from a few seconds to several tens of seconds [99,100,101]. These events produce rapid sprays of mostly fluidal spatter, scoria, volcanic bombs, and small amounts of ash. The deposits build up within a few hundred meters of the vent, gradually creating landforms known as scoria (cinder) cones [102].
Due to localized pyroclast dispersion during typical Strombolian eruptions, most eruptive products directly contribute to cone development. From a volcanic hazard standpoint, Strombolian-style explosions can disperse pyroclasts up to 1000 meters from the eruption site; this distance provides a helpful guideline for exclusion zones near active scoria cones. These eruptions mainly produce spatter cones, ramparts, and structures made of coarse scoriaceous lapilli and bomb-rich deposits. When smaller but sustained eruption columns occur, larger scoria cones composed of fine lapilli and coarse ash can form, with localized fallout deposits building up within approximately one kilometer. Strombolian eruption columns or spray heights typically range from a few tens of meters to under 200 meters, ejecting several hundred cubic meters of pyroclastic material per burst. Pyroclast exit velocities vary widely from 3 to 400 m s−1 [99]. Spatter bombs and scoria lapilli are projected along ballistic, mostly parabolic trajectories, contributing to the formation of modest spatter and scoria cones or ramparts beside the vent. Minor amounts of ash can get caught in short-lived, weak convective plumes, sometimes carried away by prevailing winds, although such plumes rarely reach above a few kilometers [99].
The study area exhibits numerous examples of low-intensity Strombolian-style explosive events, which are often part of larger eruption sequences characterized by occasional higher-intensity explosions and the gradual development of scoria cones. The cone-building pyroclastic succession at the Target Volcano in Option 4 illustrates these deposit types.
Figure 8.
The Target Volcano (25°20'33.69"N, 37°41'5.89"E), with its young scoria cone morphology (Qm6 vent), is visible in this view due to Strombolian-style explosive eruptions. An older scoria cone (25°22'21.57"N, 37°40'5.94"E), located at the left front of the Target Volcano, is part of the oldest volcanism in the volcanic field (Qm1). Its preserved vent is not as steep as the Target Volcano's vent.
3.1.2. Lava Flows
The formation of a solid crust on lava flows depends on how cooling influences viscosity over time, compared to the lava's shear rate [103]. In low-viscosity basalts, such as pāhoehoe, the viscoelastic layer absorbs strain, allowing the smooth crust to remain intact even when lava beneath flows rapidly, sometimes exceeding 10 m/s. This crust also remains preserved at low strain rates, such as when lava moves slowly across flat valley floors west of the Option 4 area. When strain rates on developing crust increase—due to steep slopes, sudden changes in slope angle, higher lava input, or increased eruption rates—the crust experiences plastic failure, resulting in surface textures that signal complex brittle-elastic deformation. This process leads to clinker, slabby, and ultimately aa-type lava flows (Figure 9).
As lava viscosity increases in distal regions and flow slows, its crystallinity rises, causing it to resemble ‘a‘ā lava [103]. Transitional surface textures often appear between smooth pāhoehoe and clinker-rich a’a, creating hybrid forms like shelly, slabby, and rubbly pāhoehoe—commonly seen in the study area (Figure 10) [104,105]. These transitions are also typical of the harrats in western Saudi Arabia [106].
When lava crusts form over a channel and stay intact, they create an underground lava tube, offering an alternative to open lava channels. In the Option 4 area, collapsed tube roofs reveal entry cavities (Figure 11), and nearby depressions, up to 10-15 meters deep, indicate extensive tube networks along the main systems. Lava tubes are also observed in other parts of Harrat Lunayyir, featuring short, well-developed tubes with visible openings in the central region, as well as near vents within the Option 4 area. Usually, tubes and open channels form complex distributary systems, found both near and away from volcano vents, especially where terrain slopes change. Smooth lava surfaces with fractured plates, as seen on satellite images, suggest the presence of complex tube networks extending several meters underground.
Additionally, two main open channels are identified. As cooling increased viscosity, the lava transformed into substantial rubble piles. Mechanical abrasion along these channels broke larger pāhoehoe crust plates into smaller, semi-rounded boulders. The marginal areas, which experienced more cooling and higher viscosity, formed toothpaste-like flows and characteristic 'aa' type lavas with squeeze-up features. The rough-surfaced region between the main open lava channels primarily consists of rubbly pāhoehoe. It is believed to be a former ponded lava zone, where initial crust formation was interrupted by new influxes of fresh lava, resulting in a complex rubbly pāhoehoe field. When a viscoelastic crust thickens along a lava channel, it solidifies, forming a strong roof over the flow. Molten lava then moves beneath this crust, keeping heat and mobility for longer periods. Large lava tubes, such as those in Harrat Rahat, can extend over a kilometer and serve as underground passages, allowing lava to travel great distances. The roof may collapse if the lava supply decreases or after eruptions, when lava drains away, leaving partially empty tubes. Fluctuations in lava output can add to surface complexity, blending collapsed tube roofs with active molten channels and viscous flows. This results in rugged terrain, as seen at Option 4’s proximal lava fields. Skylights over lava tubes form during eruptions, offering views of moving molten lava; after cooling, they become deep cavities linked to tube networks. These tubes, ranging from less than 1 m to over 30 m in diameter and 15 m in height, can channel lava over hundreds of kilometers beneath a mostly solid surface [107]. Surface features, such as pāhoehoe slabs, skylights, and updoming, indicate meter- to tens-of-meters-wide tubes along major lava pathways. Large roof collapses and extended tube openings suggest long, narrow tubes formed where lava accumulated behind barriers or in depressions. Lava stored in these main zones later traveled farther than expected. Tube-fed pāhoehoe flows can extend much farther than comparable a’a flows, making tube formation a key consideration in assessing lava flow hazards. A solid, insulating crust in pāhoehoe lavas enables flow inflation as magma accumulates beneath the rigid surface when the volumetric flow rate exceeds the advance rate, often at slope breaks [108,109]. This results in surface uplifts and can cause lava breakouts. Although most common in pāhoehoe, inflation and breakouts also occur in a’a lavas when their fronts slow due to cooling or gentler slopes. The resulting autobreccia increases resistance and thickens the flow. Pressure buildup behind stationary fronts may trigger bright breakouts through the margins or surface, a scenario typical in the study area and a hazard to consider during eruptions and recovery efforts.
3.1.3. Ash Plains
Explosive eruptions from low-viscosity magma, as observed at Mexico’s Parícutin volcano (1943–44), can produce large amounts of fine ash [110]. The initial phase of Parícutin's eruption began on February 20, 1943, quickly forming a 167 m scoria cone with up to 18 explosions per minute and a plume roughly 5 km high. Parícutin serves as a valuable comparison for the Target Volcano in Option 4 because of its similar sequence and structure. Between March 18 and June 9, 1943, the eruption intensified, creating more ash and a convective plume reaching 6 km and carried downwind [110]. The eruption style was characterized by frequent explosions, with a magma eruption rate estimated at 10⁴–10⁵ kg/s. Ash deposits spread as far as 250 km from the volcano, resulting in continuous tephra coverage; lapilli-sized fragments were transported several kilometers from the vent [111]. Inevitable scoria fall and cone-building deposits with high fragmentation and dispersal rates are commonly defined as "violent strombolian" [112,113], highlighting the episodic nature of these explosions despite differences from classic strombolian eruptions. Extensive ash and lapilli fields within Option 4, associated with the Target Volcano, suggest that violent Strombolian explosive eruptions have occurred in the region, indicating a potential volcanic hazard.
Recent assessments suggest using the term "violent Strombolian" specifically for eruptions that produce columns typically under 8 km and generate sizable fallout deposits with limited stratification [110]. However, vertical grain size variations can occur, as seen in ash and fine lapilli deposits approximately 3.5 km from the Target Volcano (Figure 12). These eruptions are characterized not only by their column height but also by sustained, pulsatory explosive activity that creates cone-shaped, stratified deposits rich in fine ash. In contrast, micro-Plinian eruptions tend to be more continuous and produce larger, more extensive deposits, such as coarse scoria cones and widespread massive deposits [98]. Recently, some eruption styles previously categorized as Strombolian have been reclassified as micro-Plinian, based on their consistent ash and pyroclast output [98]. This distinction highlights differences from violent Strombolian scoria cones. To better understand these styles, documented examples, like a detailed study of a scoria cone-forming eruption, are useful analogies. For instance, the 1973 basaltic eruption at Heimaey, Iceland, started with lava fountains reaching 50–100 meters from multiple vents along a 1.5 km fissure. [114,115]. Activity then focused on three vents near the fissure’s northern end, forming a 200-meter-high scoria cone with associated lava flows. Individual explosions resembled discrete fire fountain sprays. Later phases involved more sustained activity, producing a buoyant eruption column and depositing coarse, massive scoria near the vent, as well as localized fall deposits downwind. This event provides an analog to interpret potential eruption types and scales for the Target Volcano, informing future scenarios in the study area.
3.2. Volcanic Hazard Types
After outlining major eruption styles, we identify key volcanic hazards for the area. Using analogies and observations, we summarize these hazards and suggest mitigation measures in a table. We describe the precursory phase as the time of geophysical warnings, followed by hazard-specific onset stages, established eruptive processes, and post-event outcomes.
Large volumes and widespread lava flows indicate the importance of volcanic hazards associated with lava effusion. These can be classified by lava characteristics, such as pāhoehoe or transitional flows evolving into aa-type lava. Such hazards usually move slowly and are considered manageable, but they can cause significant long-term landscape changes and result in destruction.
Volcanic hazards can also arise from a range of explosive eruption styles, including: 1) the formation of lava spatter cones with associated lava fountaining; 2) the development of scoria cones; 3) Strombolian or mafic sub-Plinian explosive eruptions; and 4) deposition of ballistic projectiles. Additionally, volcanic degassing and vog (volcanic gas fog) are often observed alongside extensive lava flow emplacement, especially after the formation of scoria cones. Based on field observations and considerations, 8 different types of volcanic hazards can be identified. Each of them is documented in Appendix 1 in detail, such as
- 1)
- Pāhoehoe lava flow outpour
- 2)
- Transitional lava flow outpouring
- 3)
- Lava spatter cone formation, lava fountaining
- 4)
- Scoria (cinder) cone birth and growth
- 5)
- Ballistic impact
- 6)
- Cone collapse, cone rafting
- 7)
- Sub-Plinian explosive eruption and associated ash fall
- 8)
- Volcanic degassing, vog formation
3.3. Eruption Scenario Simulations
Eruption scenarios are concise, realistic narratives that summarize potential eruption types, timelines, and impacts, facilitating clear information transfer for volcanology, especially when probabilistic methods are not practical. Due to limited geological data at Harrat Lunayyir, hazard-based models were created using direct observations and desktop analysis. Two scenario types—localized point eruptions and fissure eruptions—have both occurred over the past 600,000 years, with fissure eruptions being more common and likely in future events. Three potential eruption sites were identified: vent 1 NW outside Option 4 (Figure 13); vent 2 near Target Volcano (Figure 14); and vent 4 SW inside Option 4 (Figure 15). Fissure vents were located at the same sites previously considered for point source vents (Figure 16 & Figure 17), with additional fissure settings simulating a particularly long fissure in the southwest of the region (Figure 18), aligned with the main structural feature of the area.
3.3.1. Well-Localized Eruption Point Development
Eruption points, typically singular locations, often form volcanic features like spatter or scoria cones. In our study, we used a 500 m radius for eruption footprints and a 1000 m exclusion zone for ballistic impacts. Lava flow simulations used the Q-LavHA QGIS plugin, with input parameters including a conservative 15 m lava thickness and a 25 m buffer, which provides a minimum estimate of the affected area. Any location with a non-zero probability in the simulation is considered at hazard. Because the terrain is flat, a flow of 50 km was set, following Q-LavHA recommendations for flat surfaces [89,90], consistent with known flows in Harrat Lunayyir. The Manhattan technique was applied to follow directional valleys typical of the region. Results are probability maps (Figure 13, Figure 14 & Figure 15) that mark all areas reached by lava as hazardous, with specific probabilities not emphasized.
3.3.2. Localized Fissure Eruption
After simulating eruptions from point sources, further tests examined how fissure eruptions could alter scenarios and impact regions (Figure 16,Figure 17&Figure 18). This was important for hazard assessments because most volcanoes in the Lunayyir field formed through fissures of different lengths. Short fissures, approximately a hundred meters long, often form elongated structures, while longer fissures extend several kilometers and feature aligned vents. One test modeled a 15 km NW-SW-trending fissure, like the 2009 event, with lava effusion simulated by Q-LavHA using emission points spaced every 90 m along its length (Figure 18). Each model included a 500 m buffer to represent areas where lava spatter cones and fountaining could deposit material near the active vents.
3.4. Lava Flow Inundation Hazard Zonation
This summary highlights the main lava inundation models (Figure 19), excluding cone base and ballistic impact visualizations, as their effects are much less significant. We used the lava inundation zone as a proxy to identify areas where development would be at high risk, which also aligns with previously recognized vent clusters, alignment zones, and graben features marked by structural weaknesses.
3.5. Lava Flow Volume Estimate
Estimating lava flow volume is key to understanding volcanic hazards. However, in our study area, there were no features suitable for accurate stratigraphic assignment or age dating due to time and resource constraints. As a result, we relied on existing maps, limited remote sensing, and targeted field surveys to outline the most probable extent of a young lava flow in northern Harrat Luinayyir. Comprehensive mapping of the nearly 100 km² region was not feasible within the project timeline, so surveys focused on key locations. Our findings, along with previous lava flow maps, showed varying interpretations of the youngest lava effusion in the area (Figure 20 & Figure 21).
The flow boundary delineation discrepancies were more apparent in the distal regions, where the distinction between main flow arteries, channels, and thin squeezed-out lava surfaces is difficult to distinguish. Red Image Surface Maps and a DEM combination map have also been used based on ALOS-PALSAR DEMs. As the DEM resolution is only 12.5 m, the resulting maps were only helpful in seeing the internal textures of the main lava bodies (Figure 22 & Figure 23), confirming the separation of lava sections within the flow field and allowing for slightly more restricted lava flow coverage, as previous mappings indicated.
For the lava volume calculation, the emplacement surface was generated using elevation data from around the flow margins and linear interpolation in QGIS. This surface is generally flat, with step-like drops in elevated areas and a gentle westward slope (Figure 24). The estimated thickness map indicates that the flow margins are thin, and the interior rarely exceeds a few tens of meters in thickness. The relative thickness map highlights key accumulation zones within the field (Figure 25). However, due to DEM resolution limits and uncertainties in pre-eruptive surface location, these values are approximate and used mainly to demonstrate that the flow followed the microtopography and ponded east of the cone (Figure 25). Assuming a uniform thickness of 10 m and an area of 30.616 km², the total lava volume is approximately 0.3 km³. Using an average lava thickness of about 30 m and uniform coverage, the total erupted lava volume would be around 1 km³. When accounting for voids, lava tubes, and high vesicularity, the dense rock equivalent (DRE) is approximately 30% of this volume, resulting in a range of 0.09 to 0.3 km³, based on estimates of 10 or 30 m lava thickness, respectively. These values are comparable to those of the well-documented Paricutin (Mexico) eruption [116], where the average flow thickness estimates ranged from 8 to 25 meters, while the covered area was calculated to be in the range of 1.892 to 12.317 km², yielding erupted volumes of 0.01 to 0.3 km³ without DRE corrections. DRE corrections would lower the eruptive volumes by approximately 20–30%. As Paricutin's activity occurred between February 1943 and March 1952 in 23 distinct eruptive phases, we can assume that the formation of the Qm6 lava flow field likely took place in multiple stages and could have lasted several months or more. It appears that our study area has not exhibited such complex and numerous eruptive episodes (23) and is likely to have experienced only a few, based on the lava flow mapping so far. This suggests that the eruption rate there might be estimated as higher than that of Paricutin. In short, in a shorter period with fewer eruptive phases, a larger volume of lava was produced. Volume calculations using GIS-based volume counts appear to provide overestimates of values ranging between approximately 1.6 and 3.3 km³, reflecting the uncertainty in defining the emplacement surface, the GIS-based calculation methods, and the resolution (12.5m) of the available DEM.
3.6. Ash Fall Hazards
Ash fall hazards in Saudi Arabia's Quaternary volcanic fields receive less attention than lava flow risks, mainly because ash deposits—often fine lapilli to fine ash—are rarely well-mapped. This is due to their preservation as mixed aeolian and pyroclastic layers, making mapping challenging. However, recent studies, especially near Al Madinah, have improved the understanding of these ash plains. The 1256 CE eruption southeast of Al Madinah produced a chain of scoria cones and a significant ash plain [117], similar to that found within the Option 4 area (Figure 26).
Based on limited spot measurements (due to access or preservation potential), a rough isopach map of tephra distribution has been created (Figure 27).
The United States Geological Survey (USGS) uses Ash3D software to predict the spread (ash clouds) and deposition (ash fall) from volcanic eruptions, primarily during Plinian eruption conditions (USGS Ash3D). This three-dimensional model simulates volcanic ash movement by factoring in time-varying wind patterns and other weather data to estimate ash transport under both current and past atmospheric conditions. The online tool provides near-real-time forecasts of ashfall centered on Harrat Lunayyir, using data from the Smithsonian Global Volcanism Program Holocene Volcanoes catalog. The vent is located near the center of the volcanic field, close to recent eruption sites southeast of the Option 4 area, roughly 20 km away. The model considers the estimated magma volume involved—specifically the tephra—and the height of the eruption column above sea level. Harrat Lunayyir sits about 1300 meters above sea level, so an eruption column reaching roughly 8700 meters above sea level corresponds to a 10 km plume in the model. This matches sub-Plinian or violent Strombolian eruptions. An initial simulation was run for an ash-producing eruption on July 19, 2024, using real-time wind data, with a plume height of 7 km above sea level (around 5.7 km above the volcano) and a total eruptive volume of 0.005 km³ DRE, with 5% of the volume airborne at the vent (Figure 28). The results, shown in Figure 31, suggest that central Harrat Lunayyir would receive between 1 and 3 centimeters of ash over an area three times larger than in Option 4. These modeled values are much lower than observed in the field and might reflect only a single phase of the eruption rather than the total effect across all eruption stages.
Ash fall hazard was identified during field mapping, with primary ash layers approximately 2 mm thick located about 8 km northwest of the youngest cone (Target Volcano). This distribution pattern indicates that a Strombolian or sub-Plinian style explosive eruption dispersed ash through the atmosphere over this distance. Based on these findings, an average ash distribution pattern can be constructed, assuming eruptions occur along the central axis or along a fissure aligned with the observed structural trend in the field. This approach provides a visual representation of the maximum extent, whereas the ash fall hazard should be considered. Since the impact of this hazard is generally low, it is recommended to acknowledge its presence, especially in spatially restricted areas where its effect could be more significant (such as potential roof collapses). Figure 29 illustrates this zone.
Ash fall can significantly impact buildings and their critical operational components. Inside, ash contamination may pose health risks to occupants (www.ivhhn.org), directly damage sensitive equipment such as electronics, and cause abrasion damage to flooring surfaces. Abrasive damage to roofing, cladding, and flooring materials during ash removal is often unavoidable, even with minimal ash buildup, which increases recovery costs. Ash fall may also disrupt essential building services, including electricity and water systems. Construction planning should consider using appropriate non-structural elements to reduce ash fall risks. Gutter systems, when installed, can collect ash from roofs, reducing drainage capacity and adding to structural loads; blockages in gutters and downpipes can lead to localized flooding and damage, especially to roofs, drainage networks, and ceiling spaces. Internal gutters are particularly vulnerable and often hard to clean. Metal roofs, fastenings, and claddings may be prone to corrosion, as ash deposits containing salt can accelerate deterioration. Painted surfaces and artistic features are at risk from acid leachates, which can cause rapid and significant damage, especially for tourism facilities that depend on aesthetic appeal. Structural concerns include potential roof deformation and collapse due to excessive ash loading. However, very thick deposits (>100 mm, more often >300 mm) are uncommon except within 5 km of the vent, they remain a design consideration. Field measurements recorded ash thicknesses of 300 mm at 4 km and 10 mm at 8 km from the source. Long-span, low-pitched roofs should generally be avoided, as they are most vulnerable to ash loading. Assuming an average basalt density of 2,900 kg/m³ and approximately 75% vesicularity observed in the study area, roof designs should be able to withstand up to 500 mm of ash cover (about 362 kg/m²), which is relevant within 2 km of a vent where lava inundation could occur within days. While simultaneous rainfall and ashfall are unlikely in this arid environment, the possibility cannot be ruled out. The overall impact level depends on these interconnected factors, as buildings function as integrated systems. Mitigation strategies, such as prompt and regular ash removal when safe, can lessen or even prevent adverse effects. Cleaning building exteriors and interiors after ashfall can be costly and time-consuming and may require ongoing effort due to recurring ash or wind- and water-driven remobilization. Taking key steps before, during, and after ashfall can help minimize damage. Protective gear is essential during cleanup, as roofs may be slippery or collapsing, especially if water blasting increases the ash’s weight. Fine ash removal creates dust that can cause discomfort, and all collected ash should be disposed of where it won’t be remobilized later.
4. Discussion
Geological studies and simulations indicate that Option 4 is in an area highly vulnerable to volcanic hazards, particularly lava flows, with eruptions potentially reaching a VEI 4 severity and dispersing ash over tens of kilometers. The likely eruption patterns closely resemble those seen in Iceland over the last thousand years, due to similar rift-related processes, basaltic sources, and fissure vent formations. Recent well-documented eruptions in Iceland have produced spatter cones, mild explosive phases, and steady low-viscosity lava flows, offering valuable insights for hazard mitigation in Harrat Lunayyir.
Volcanic hazards in the Option 4 area and surrounding regions are classified as having a low to moderate risk, although they can still cause significant impacts. Finding safe zones within this region is challenging, as approximately 80% of the Option 4 area is exposed to one or more types of volcanic hazards (Figure 30). In addition to lava flows, ash fall poses a significant threat, and an eruption could potentially reach VEI 3 or VEI 4 levels, producing extensive ash plains that may block access and mobility. Ash fall also increases the risk of total loss of facilities, roads, and equipment planned for development and use in Option 4.
There is currently no established industry practice for mitigating volcanic hazards related to monogenetic volcanism, especially in Saudi Arabia, where modern volcanic eruptions have not been observed. The most recent confirmed eruption occurred in 1256 CE southeast of Al Madinah City [118]. Stratigraphic evidence also suggests that eruptions within Harrat Lunayyir may date back to the Holocene, with an estimated occurrence between 4,500 and 1,000 years ago at the Target Volcano, which could be among the youngest sites in the region. However, these age estimates are uncertain, and the likely recurrence interval probably falls well outside a typical 50-year timeframe. This estimate is based on the number of vents—usually five to ten per volcanic complex—leading to an average recurrence rate of decades to centuries. However, this method highlights the limitations of current models.
Volcanic hazards in monogenetic volcanic fields—characterized by small volumes, mainly basaltic composition, absence of central magma chambers, dispersed volcanoes over large areas, vent distribution dictated by geology, and brief eruption durations—while the overall activity can last hundreds of thousands of years—pose significant challenges from a probabilistic standpoint. Often, there is limited age data or large error margins, making it difficult to predict where and when volcanoes form and erupt accurately; these two aspects are distinct, as shown by Harrat Lunayyir, where many volcanoes are complex vent structures that can become active rapidly but are supplied by different magma sources from separate melting events.
Industry practices have generally addressed volcanic hazards from monogenetic volcanism only at high-sensitivity sites, such as nuclear power plants, dams, major infrastructure, or high-risk waste repositories, where design criteria must consider hazards identified over thousands of years. For instance, high-level waste repositories (usually for nuclear waste) require hazard assessments spanning about 50,000 years—a period during which multiple vents can form in volcanic fields with eruption recurrence rates over thousands of years, as seen in the Auckland Volcanic Field (New Zealand) [37,119,120,121], Yucca Mountain (Nevada) [12,122,123], and Southern Armenia [35,124,125]. Studies in these regions have focused on urbanization and lifeline exposure (Auckland), planning for high-level power plants (Armenia), or designing waste repositories (Yucca Mountain). These studies were conducted within appropriate time frames and supported by high-resolution, evenly distributed age dating across the fields.
In contrast, predicting volcanic hazards for Harrat Lunayyir over a 50-year period is currently not feasible due to data and technical limitations. Even the most precise Ar-Ar radiometric dating methods have errors that surpass the resolution needed for this timescale. Consequently, the approach shifted from probabilistic estimates to a deterministic method that systematically considers all identified volcanic hazards. This involves preparing for any documented hazards throughout the entire field (~600,000 years of records), with a particular focus on Qm5 and Qm6 vent locations. These sites span an area like the broader Lunayyir vent zone, supporting the strategy of evaluating hazards based on the overall vent distribution of the field.
For industry applications, each identified type of volcanic hazard should be considered a potential scenario at any location where vents have historically formed. Design solutions should be scaled accordingly: for example, structures need to withstand lava flow inundation by considering fire hazards, mechanical stress, and assessing potential economic losses from such incidents; roofs should be designed to support at least 10 cm of ash accumulation, ideally up to 50 cm; and precautions should be implemented to protect sensitive equipment from fine ash infiltration, such as air conditioners, vehicle and generator filters, sewage systems, and drinking water supplies.
Hazard zones were identified based on three simulated long fissure lava flows, using the orientation and length of the 2009 fissure (~15 km) as a model. Using Q-LavHA, vents were placed every 100 meters along each fissure, forming three NW-SE trending lines (west, central, east). The lava inundation maps were combined and smoothed with a 100-meter buffer to define the ORANGE zone, indicating moderate volcanic hazard from lava flows. The RED zone, representing the highest hazard, was established by adding a 1,000-meter buffer around the fissures, where immediate edifice formation and pyroclastic activity are primary threats. YELLOW zones denote lower risk areas mainly affected by ash fall up to 1 cm, as shown in Figure 25.
Figure 31.
A simplified hazard zonation map derived from lava flow inundation simulations based on three extended fissure scenarios. The fissure lengths reflect the parameters observed during the failed 2009 eruption and subsequent fissure activity. Zone 2, or the medium hazard zone, represents the combined inundated areas from all three simulations. The primary NW-SE structural trends in the region, documented vent alignments, and the broader geological framework of greater Harrat Lunayyir informed the selection of fissure locations.
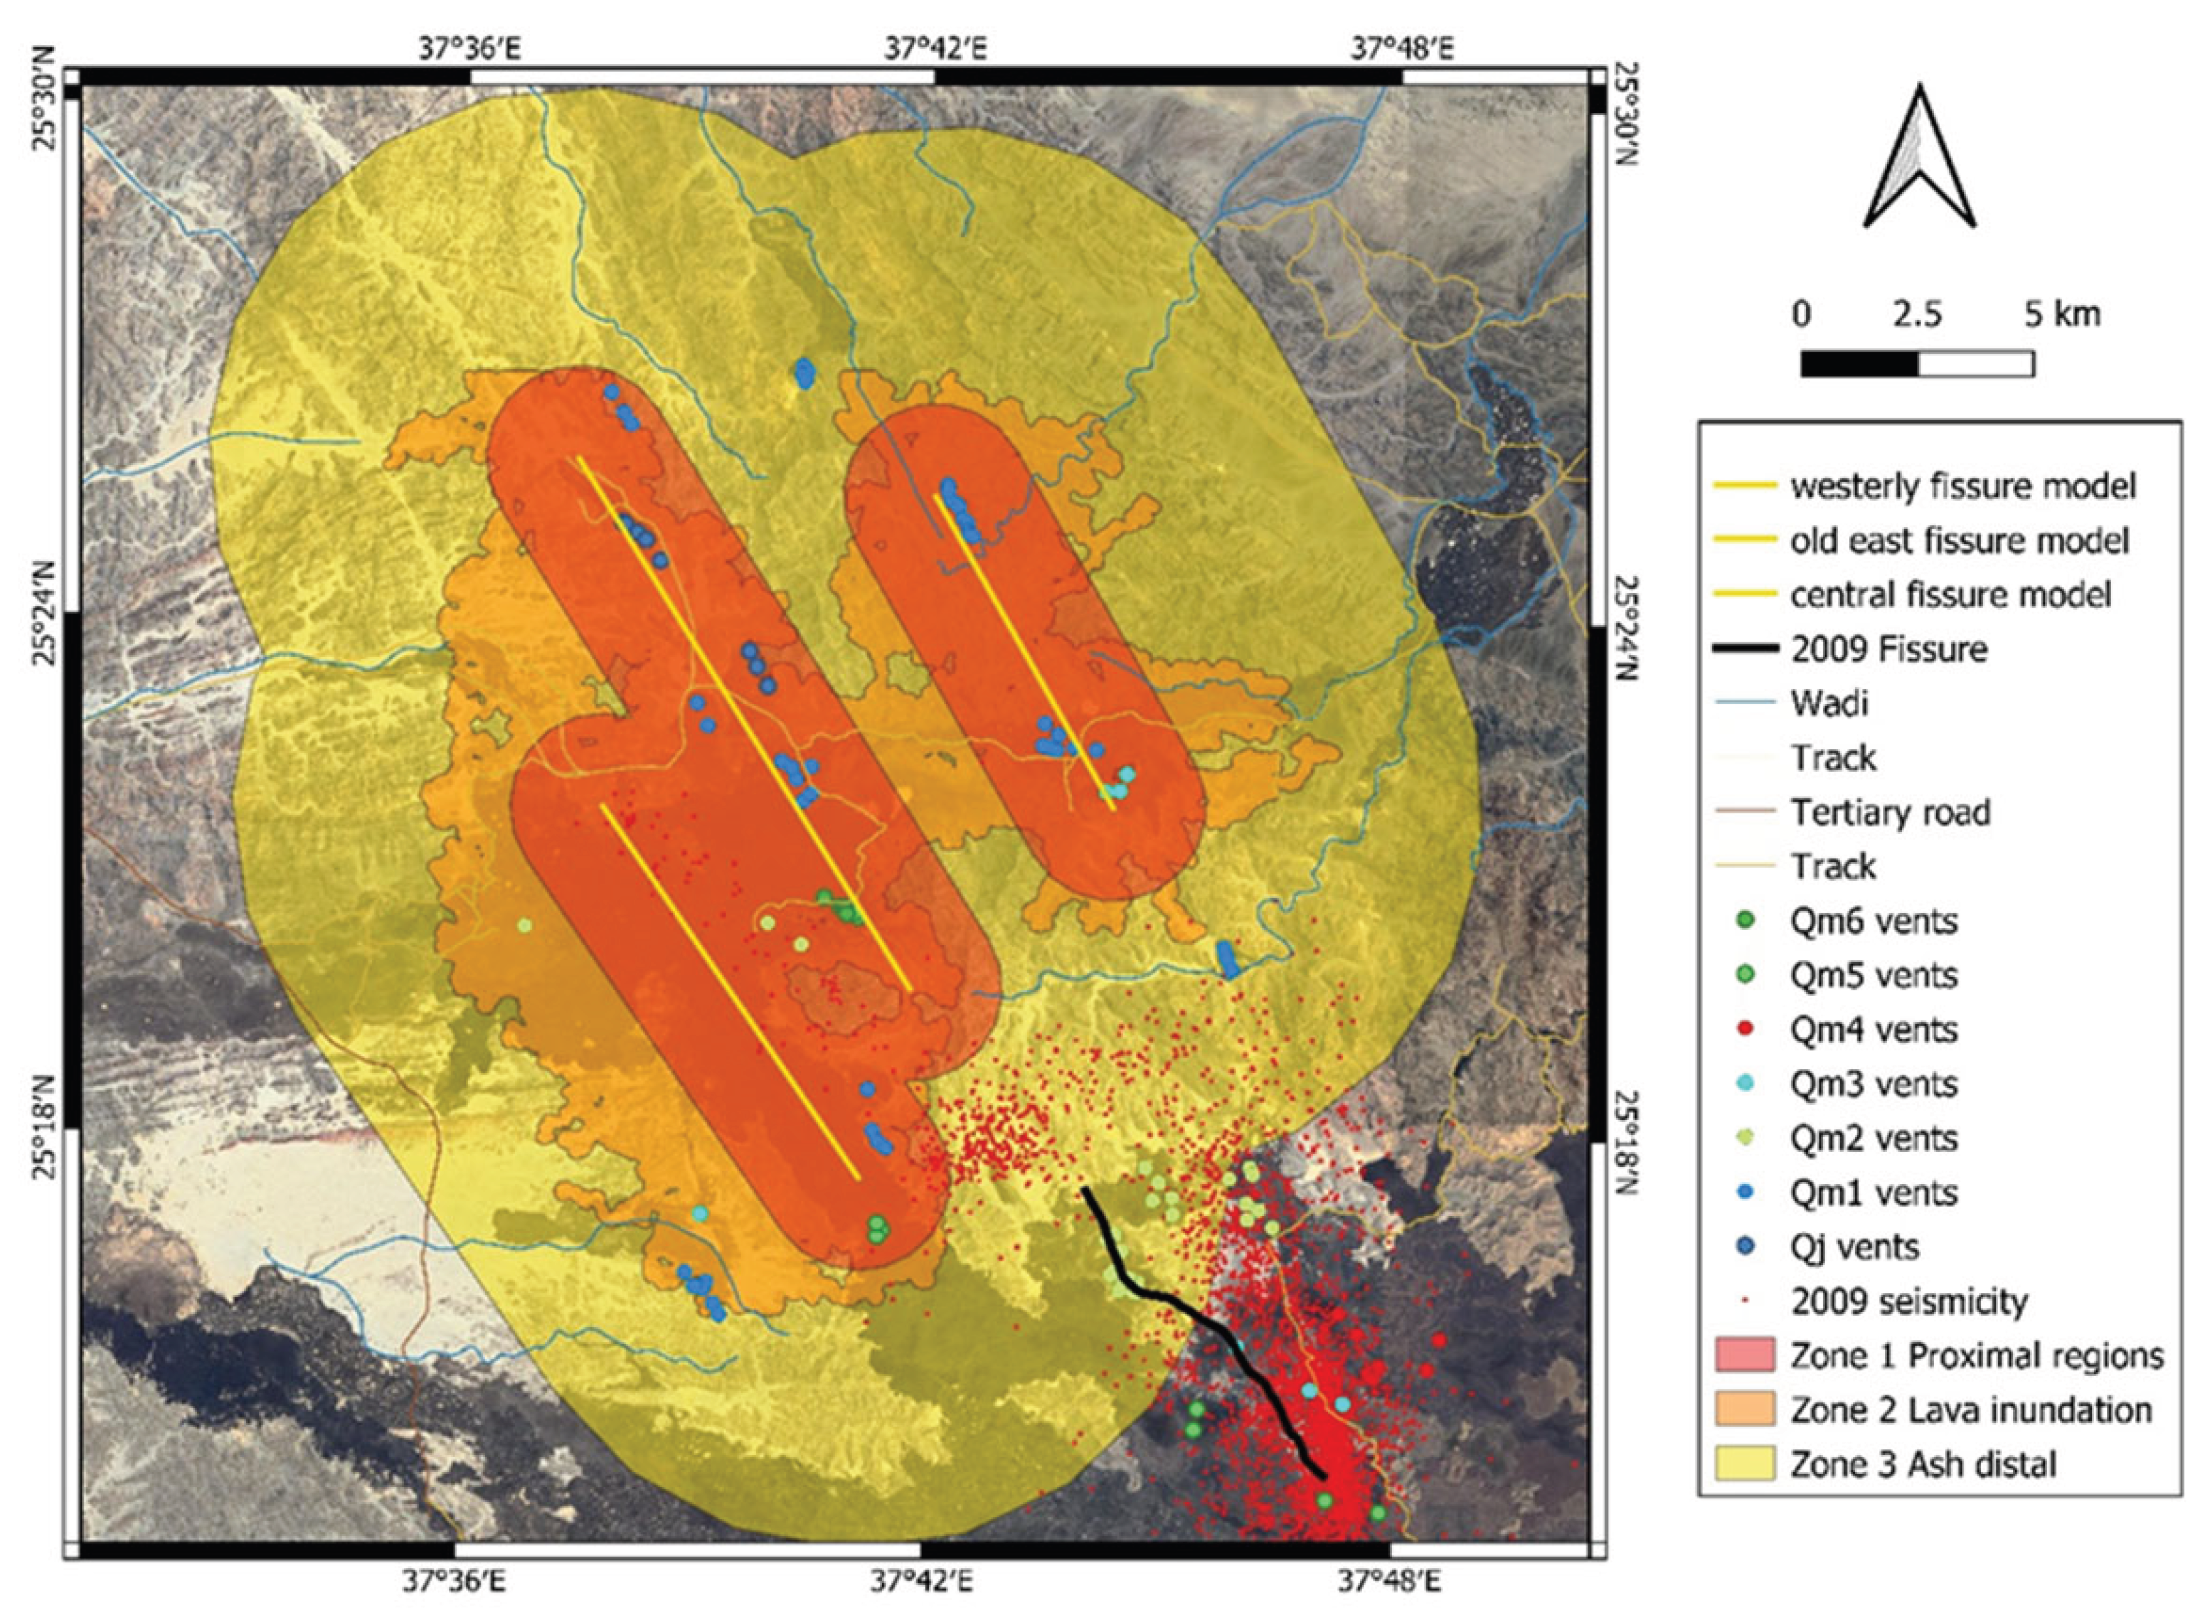
High-hazard zones are defined as the area immediately surrounding each fissure, including a 2,000 m buffer to account for potential proximal hazards such as ash fall, ballistic projectiles, lava fountain reach, and scoria cone growth. Low-hazard zones extend up to 8,000 m from the identified fissures, where an ash accumulation of at least 1 cm is anticipated. This threshold is supported by field studies and mapping, serving as a reliable indicator of potential volcanic ash hazard, especially if a future sub-Plinian eruption occurs—a scenario with significant likelihood based on the area's geological history.
It should be noted that the southeast corner of the study area corresponds to the site of the 2009 fissure opening and features a historically high vent density and explosive sub-Plinian activity. For the hazard map, volcanic hazards related to this southeastern region have not been included, allowing for a focused assessment of the northern territory. The north area, where Option 4 is located, remains clearly separated from central regions by prominent basement horsts, which influence fissure propagation and potential vent formation. These morphological features also act as practical barriers to prevent lava flow inundation from the southeast into the Option 4 area. Although ash fall may still pose a significant hazard, it does not materially change the overall hazard classification for Option 4. Additionally, this map does not include information on secondary or cascading hazards, such as remobilized ash or potential flash flood routes, nor does it address extremely distal, thin lava flow inundation. Thin lava flows are considered low hazard, while comprehensive modeling of flash flood risks requires further research focused explicitly on sedimentary gravity flows. Generally, flash flood channels or alluvial fans are usually located along steep valley slopes or near the foothills of major mountain ranges.
Estimating eruption probability remains uncertain at this stage due to limited precise knowledge about volcanic event sequences, which mainly relies on approximate assessments based on relative stratigraphy. The total activity of the volcanic field spans approximately 600,000 years, encompassing over 700 vent openings across around 150 multi-vent volcanoes. This age estimate is supported by 17 high-precision Ar-Ar radiogenic age dates, mostly from older lava flows, though the dataset is geographically and temporally uneven [84]. Previously, the total lifespan of the volcanic field was estimated to be 2.8 million years, which adds further uncertainty to probability calculations. The average recurrence rate for vent openings over the 600,000-year period would be roughly one event every 857 years, which can be rounded to a 1,000-year recurrence interval if events were evenly spaced—although this uniform distribution is unlikely. Therefore, the 1,000-year vent-opening interval should be viewed as a conservative estimate, with actual recurrence rates likely being higher. When considering the formation of volcanic edifices, with an estimated 150 volcanoes, the recurrence rate would be about 4,000 years. Based on these figures, it is reasonable to expect that complex, multi-vent eruptions could happen roughly every 4,000 years, as indicated by geological mapping throughout the entire field, regardless of vent age or location.
Assuming Qm5 began 4500 years ago and Qm6 started 1000 years ago, there were 33 vents formed during Qm6 and 71 during Qm5. This indicates volcanic events occurred, on average, every 50 years during Qm5 and every 30 years during Qm6. Combined, the recurrence rate is approximately one event every 43–50 years, provided that each vent represents a separate event. Many vents are part of complex structures, often erupting simultaneously along fissures that can be up to 3 km long. For example, six closely spaced vents in the youngest Qm6 phase formed along a NW-SE fissure matching recent earthquake patterns. If an average of five vents defines one eruption episode, the true recurrence doubles to roughly every 100 years: with ten vents per event, it’s about every 200 years. These rates have remained steady since Qm3, despite uncertainties in older eruption timing.
Recurrence rates for eruptions vary from 50 to 4,000 years, depending on the period examined. These numbers include only actual eruptions, excluding failed ones, which are difficult to track due to the limited availability of historical seismic data. Since events like the 2009 failed eruption may influence future risk, it is wise to include them in probabilistic models despite data gaps. Using conservative estimates, if the 2009 event is incorporated into a model starting from 2024 and assuming a 50-year recurrence interval, an eruption could occur within the next 35 years. This should be regarded as a worst-case scenario. Locating future events in a monogenetic volcanic field, such as Harrat Lunayyir, is challenging because new eruptions are likely to occur outside known vent areas but still within the overall zone. As volcanic fields develop and more vents form, future eruptions may break through existing volcanoes, forming complex mashups — a pattern seen in western Saudi Arabia's harrats, where younger volcanoes sometimes overlap older ones with big gaps in between.
After conducting both a desktop study and an on-site reconnaissance mapping of volcanic features throughout the Lunayyir Volcanic Field, we have found that a volcanic eruption would likely unfold through a specific sequence of events observed at most of the studied locations. These eruptive processes generally follow a predictable pattern, resulting in a series of cascading volcanic hazards that should be included in any hazard assessment. We identified this chain of events and ranked its likelihood using a straightforward four-tier system. Table 1 presents the potential progression of cascading volcanic hazards along with estimated likelihoods. It's important to note that this analysis is based on rapid assessment and does not reflect a detailed or quantitative evaluation involving precise counts of cases, eruptive volumes, or durations within individual eruption periods.
In Table 2 the identified volcanic hazard estimates are demonstrated within the target area.
5. Conclusions
Our research indicates that development within the Option 4 area would significantly compromise the region’s geoheritage integrity, as it encompasses one of the most pristine environments in Harrat Lunayyir. Such activity could lead to loss of geodiversity and decrease the value of geoheritage assets. The area is especially sensitive from a geoheritage perspective [87], characterized by ash deposits and its proximity to an exceptionally preserved scoria cone. Even with careful planning, development carries inherent risks to these unique features. The expert team from the Saudi Geological Survey (SGS) has determined that the combination of moderate volcano-seismic hazard intensity—posing significant challenges for infrastructure—and the outstanding geoheritage of the site justifies a cautious approach to any further development of Option 4. Although volcanic and seismic threats are rated as low to medium in intensity, they still pose significant risks, including potential economic impacts that have already been identified. SGS’s assessment reveals that a significant portion of the Option 4 site is situated within zones unsuitable for safe development due to persistent, high-impact hazards and the absence of feasible methods to delineate secure areas.
Exclusion zones have been established in areas with high volcanic seismic activity. SGS recommends placing development projects outside these sensitive areas. Multi-night stays should be avoided; instead, controlled daytime visits may be allowed only when volcano-seismic conditions are stable. A comprehensive mitigation plan (Table 3) will help reduce potential economic losses from geological hazards and enable quick interventions during visits.
Supplementary Materials
The following supporting information can be downloaded at the website of this paper posted on Preprints.org, Appendix 1.
Author Contributions
Conceptualization, K.N., M.T. and V.S.; methodology, K.N.; software, K.N and A.S.; validation, K.N. and M.T.; formal analysis, K.N, M.T:, A.S..; investigation, K.N.; resources, A.S.; data curation, A.S.; writing—original draft preparation, K.N.; writing—review and editing, M.T., V.S. and M.A..; visualization, K.N. and A.S.; supervision, K-N. and M.T.; project administration, A.S, M.A..; funding acquisition, A.S. All authors have read and agreed to the published version of the manuscript.
Funding
This research was funded by the Red Sea Global contract to the Saudi Geological Survey.
Data Availability Statement
Data relevant to this publication is included in the manuscript. Further information should be directed to the corresponding Author.
Acknowledgments
The Authors acknowledge the Saudi Geological Survey logistic support to conduct the research under the strong time constrain.
Conflicts of Interest
The authors declare no conflicts of interest.
References
- Németh, K. Monogenetic volcanic fields: Origin, sedimentary record, and relationship with polygenetic volcanism. Special Paper of the Geological Society of America 2010, 470, 43–66. [Google Scholar] [CrossRef]
- Smith, I.E.M.; Németh, K. Source to surface model of monogenetic volcanism: A critical review. In Geological Society Special Publication; 2017; Volume 446, pp. 1-28.
- Németh, K.; Kereszturi, G. Monogenetic volcanism: personal views and discussion. International Journal of Earth Sciences 2015, 104, 2131–2146. [Google Scholar] [CrossRef]
- Kshirsagar, P.; Aviles, R.M.; de Puy y Alquiza, M.J.; Chako Tchamabe, B.; Dominguez, A.J.C. Case study of a cluster of simple and complex monogenetic volcanoes in the north-east part of the Michoacan–Guanajuato Volcanic Field, Central Mexico: Nomenclature implications. Geological Journal 2024, 59, 2750–2771. [Google Scholar] [CrossRef]
- Chako Tchamabe, B.; Youmen, D.; Owona, S.; Ohba, T.; Németh, K.; Ngapna, M.N.; Asaah, A.N.E.; Aka, F.T.; Tanyileke, G.; Hell, J.V. Eruptive history of the Barombi Mbo Maar, Cameroon volcanic line, Central Africa: Constraints from volcanic facies analysis. Central European Journal of Geosciences 2013, 5, 480–496. [Google Scholar] [CrossRef]
- Le Corvec, N.; Bebbington, M.S.; Lindsay, J.M.; McGee, L.E. Age, distance, and geochemical evolution within a monogenetic volcanic field: Analyzing patterns in the Auckland Volcanic Field eruption sequence. Geochemistry, Geophysics, Geosystems 2013, 14, 3648–3665. [Google Scholar] [CrossRef]
- Le Corvec, N.; Spörli, K.B.; Rowland, J.; Lindsay, J. Spatial distribution and alignments of volcanic centers: Clues to the formation of monogenetic volcanic fields. Earth-Science Reviews 2013, 124, 96–114. [Google Scholar] [CrossRef]
- Lore, C.; Lee, H.S.; Pallant, A.; Connor, C.; Chao, J. Integrating Computational Thinking into Geoscientific Inquiry About Volcanic Eruption Hazards and Risks. International Journal of Science and Mathematics Education 2024, 22, 1173–1195. [Google Scholar] [CrossRef]
- Németh, K.; Martin, U. Shallow sill and dyke complex in western Hungary as a possible feeding system of phreatomagmatic volcanoes in "soft-rock" environment. Journal of Volcanology and Geothermal Research 2007, 159, 138–152. [Google Scholar] [CrossRef]
- Bertin, D.; Lindsay, J.M.; Cronin, S.J.; de Silva, S.L.; Connor, C.; Caffe, P.J.; Grosse, P.; Baez, W.; Bustos, E.; Constantinescu, R. Probabilistic Volcanic Hazard Assessment of the 22.5–28°S Segment of the Central Volcanic Zone of the Andes. Frontiers in Earth Science 2022, 10. [Google Scholar] [CrossRef]
- Hastings, M.S.; Connor, C.; Wetmore, P.; Malservisi, R.; Connor, L.J.; Rodgers, M.; la Femina, P.C. Large-Volume and Shallow Magma Intrusions in the Blackfoot Reservoir Volcanic Field (Idaho, USA). Journal of Geophysical Research: Solid Earth 2021, 126. [Google Scholar] [CrossRef]
- Gallant, E.; Cole, L.; Connor, C.; Donovan, A.; Molisee, D.; Morin, J.; Walshe, R.; Wetmore, P. Modelling eruptive event sources in distributed volcanic fields. Volcanica 2021, 4, 325–343. [Google Scholar] [CrossRef]
- Deng, F.; Connor, C.; Malservisi, R.; Connor, L.J.; White, J.T.; Germa, A.; Wetmore, P. A Geophysical Model for the Origin of Volcano Vent Clusters in a Colorado Plateau Volcanic Field. Journal of Geophysical Research: Solid Earth 2017, 122, 8910–8924. [Google Scholar] [CrossRef]
- Malaguti, A.B.; Corradino, C.; la Spina, A.; Branca, S.; Del Negro, C. Machine Learning Insights into the Last 400 Years of Etna Lateral Eruptions from Historical Volcanological Data. Geosciences (Switzerland) 2024, 14. [Google Scholar] [CrossRef]
- Abdulfarraj, M.; Abraham, E.; Alqahtani, F.; Aboud, E. Advancements in Geohazard Investigations: Developing a Machine Learning Framework for the Prediction of Vents at Volcanic Fields Using Magnetic Data. Geosciences (Switzerland) 2024, 14. [Google Scholar] [CrossRef]
- Uslular, G.; Le Corvec, N.; Mazzarini, F.; Legrand, D.; Gençalioğlu-Kuşcu, G. Morphological and multivariate statistical analysis of quaternary monogenetic vents in the Central Anatolian Volcanic Province (Turkey): Implications for the volcano-tectonic evolution. Journal of Volcanology and Geothermal Research 2021, 416. [Google Scholar] [CrossRef]
- Nicotra, E.; Viccaro, M.; Donato, P.; Acocella, V.; De Rosa, R. Catching the Main Ethiopian Rift evolving towards plate divergence. Scientific Reports 2021, 11. [Google Scholar] [CrossRef]
- Németh, K.; Moufti, M.R. Geoheritage Values of a Mature Monogenetic Volcanic Field in Intra-continental Settings: Harrat Khaybar, Kingdom of Saudi Arabia. Geoheritage 2017, 9, 311–328. [Google Scholar] [CrossRef]
- Toro, A.; Murcia, H.; Sánchez-Torres, L. Magmatic evolution of basaltic rear-arc monogenetic volcanism in southern Colombia. Journal of Volcanology and Geothermal Research 2025, 462. [Google Scholar] [CrossRef]
- Scheinost, A.; Ureta, G.; Aguilera, F. Torta domes as part of a new morphological and rheological classification based on the distribution of Quaternary domes in the Central Volcanic Zone of the Andes, northern Chile. Geomorphology 2025, 489. [Google Scholar] [CrossRef]
- Monsalve-Bustamante, M.L.; Avila-Vallejo, H.; Ortiz-Martin, I.D.; Osorio-Ocampo, S. Characterization and space–time distribution of Plio-Quaternary volcanism NE of Caldas, Colombia. In Geological Society Special Publication; 2025; Volume 558.
- Cavazos-Alvarez, J.A.; Carrasco-Núñez, G.; Sosa-Ceballos, G.; Lucci, F. Evolution of a large Quaternary monogenetic field; the multifaceted volcanism of the Serdán-oriental basin, México. Journal of Volcanology and Geothermal Research 2024, 446. [Google Scholar] [CrossRef]
- Avellán, D.R.; Cardona-Melchor, S.; Gómez-Vasconcelos, M.G.; Macías, J.L.; Layer, P.W.; Sosa-Ceballos, G.; Ruíz, M.C.; Benowitz, J.; Cisneros-Máximo, G.; Murcia, H.; et al. The Nieve volcanic cluster: A Pliocene - Pleistocene lava dome cluster in the Michoacán-Guanajuato volcanic field (México). Journal of Volcanology and Geothermal Research 2024, 450. [Google Scholar] [CrossRef]
- Gałaś, A.; Lewińska, P.; Aguilar, R.; Nowak, Ł. Remote sensing data applied to the reconstruction of volcanic activity in the Valley of the Volcanoes, Central Volcanic Zone, Peru. Journal of Geodynamics 2023, 156. [Google Scholar] [CrossRef]
- Ureta, G.; Németh, K.; Aguilera, F.; Kósik, S.; González, R.; Menzies, A.; González, C.; James, D. Evolution of a magmatic to a phreatomagmatic volcanic system: The birth of a monogenetic volcanic field, Tilocálar volcanoes, northern Chile. Journal of Volcanology and Geothermal Research 2021, 414. [Google Scholar] [CrossRef]
- Murcia, H.; Borrero, C.; Németh, K. Overview and plumbing system implications of monogenetic volcanism in the northernmost Andes' volcanic province. Journal of Volcanology and Geothermal Research 2019, 383, 77–87. [Google Scholar] [CrossRef]
- Runge, M.G.; Bebbington, M.S.; Cronin, S.J.; Lindsay, J.M.; Moufti, M.R. Integrating geological and geophysical data to improve probabilistic hazard forecasting of Arabian Shield volcanism. Journal of Volcanology and Geothermal Research 2016, 311, 41–59. [Google Scholar] [CrossRef]
- Runge, M.G.; Bebbington, M.S.; Cronin, S.J.; Lindsay, J.M.; Kenedi, C.L.; Moufti, M.R.H. Vents to events: Determining an eruption event record from volcanic vent structures for the Harrat Rahat, Saudi Arabia. Bulletin of Volcanology 2014, 76, 1–16. [Google Scholar] [CrossRef]
- Martí, J.; Ricci, J.; Planagumà, L.; Aguirre-Díaz, G.J. The Quaternary La Garrotxa volcanic field (NE of Iberia): A geochronological approach. Quaternary Science Advances 2025, 17. [Google Scholar] [CrossRef]
- Zimmerer, M.J. A temporal dissection of late Quaternary volcanism and related hazards within the Rio Grande rift and along the Jemez lineament of New Mexico, USA. Geosphere 2024, 20, 505–546. [Google Scholar] [CrossRef]
- Zarazúa-Carbajal, M.C.; Mendoza-Rosas, A.T.; Caballero-Jiménez, G.V.; Gómez-Vázquez, Á.; De la Cruz-Reyna, S. The spatiotemporal evolution of monogenetic scoria cones in the Paricutin-Tancítaro region, Mexico: Results from a Morpho-chronological analysis and its consequences on the distributed volcanic hazard. Journal of Volcanology and Geothermal Research 2024, 451. [Google Scholar] [CrossRef]
- Vilches, M.; Ureta, G.; Grosse, P.; Németh, K.; Aguilera, F.; Aguilera, M. Effusion rate estimation based on solidified lava flows: Implications for volcanic hazard assessment in the Negros de Aras monogenetic volcanic field, northern Chile. Journal of Volcanology and Geothermal Research 2022, 422. [Google Scholar] [CrossRef]
- Schmidt, C.; Laag, C.; Whitehead, M.; Profe, J.; Tongwa Aka, F.; Hasegawa, T.; Kereszturi, G. The complexities of assessing volcanic hazards along the Cameroon Volcanic Line using spatial distribution of monogenetic volcanoes. Journal of Volcanology and Geothermal Research 2022, 427. [Google Scholar] [CrossRef]
- Foote, A.; Németh, K.; Handley, H. The interplay between environmental and magmatic conditions in eruption style transitions within a fissure-aligned monogenetic volcanic system of Auckland, New Zealand. Journal of Volcanology and Geothermal Research 2022, 431. [Google Scholar] [CrossRef]
- Meliksetian, K.; Neill, I.; Barfod, D.N.; Milne, E.J.M.; Waters, E.C.; Navasardyan, G.; Grigoryan, E.; Olive, V.; Odling, N.; Karakhanian, A. Pleistocene - Holocene volcanism at the Karkar geothermal prospect, Armenia. Quaternary Geochronology 2021, 66. [Google Scholar] [CrossRef]
- Pedrazzi, D.; Kereszturi, G.; Lobo, A.; Geyer, A.; Calle, J. Geomorphology of the post-caldera monogenetic volcanoes at Deception Island, Antarctica — Implications for landform recognition and volcanic hazard assessment. Journal of Volcanology and Geothermal Research 2020, 402. [Google Scholar] [CrossRef]
- Ang, P.S.; Bebbington, M.S.; Lindsay, J.M.; Jenkins, S.F. From eruption scenarios to probabilistic volcanic hazard analysis: An example of the Auckland Volcanic Field, New Zealand. Journal of Volcanology and Geothermal Research 2020, 397. [Google Scholar] [CrossRef]
- Nieto-Torres, A.N.; Martin-Del-Pozzo, A.L. Spatio-temporal hazard assessment of a monogenetic volcanic field, near México City. Journal of Volcanology and Geothermal Research 2019, 371, 46–58. [Google Scholar] [CrossRef]
- Marrero, J.M.; García, A.; Berrocoso, M.; Llinares, Á.; Rodríguez-Losada, A.; Ortiz, R. Strategies for the development of volcanic hazard maps in monogenetic volcanic fields: The example of la Palma (Canary Islands). Journal of Applied Volcanology 2019, 8. [Google Scholar] [CrossRef]
- Osorio-Ocampo, S.; Macías-Vázquez, J.L.; Pola, A.; Cardona-Melchor, S.; Sosa-Ceballos, G.; Garduño-Monroy, V.H.; Layer, P.; García-Sánchez, L.; Perton, M.; Benowitz, J. The eruptive history of the Pátzcuaro Lake area in the Michoacán Guanajuato Volcanic Field, central México: Field mapping, C-14 and 40Ar/39Ar geochronology. Journal of Volcanology and Geothermal Research 2018, 358, 307–328. [Google Scholar] [CrossRef]
- Kereszturi, G.; Bebbington, M.; Németh, K. Forecasting transitions in monogenetic eruptions using the geologic record. Geology 2017, 45, 283–286. [Google Scholar] [CrossRef]
- Bebbington, M.S. Assessing spatio-temporal eruption forecasts in a monogenetic volcanic field. Journal of Volcanology and Geothermal Research 2013, 252, 14–28. [Google Scholar] [CrossRef]
- Cronin, S.J.; Neall, V.E. Impacts of volcanism on pre-European inhabitants of Taveuni, Fiji. Bulletin of Volcanology 2000, 62, 199–213. [Google Scholar] [CrossRef]
- Tchouamou Njoya, E.T.; Kassem, A.; Ragab, A.M.; Ahmed, T.S.A.; Nassr, A. Economic and Environmental Implications of Tourism Growth in Saudi Arabia: Insights from a CGE Model. African and Asian Studies 2025. [Google Scholar]
- Sultan, W.A.M.; Alsenosy, A.; Jaharadak, A.A.B. Examining The Influence of Various Big Data Capabilities on Tourism Firms in Saudi Arabia. International Journal of Accounting and Economics Studies 2025, 12, 104–114. [Google Scholar] [CrossRef]
- Sourp, L.; Fayad, A.; Gascoin, S. Impact of climate change on snow supply in Trojena, Saudi Arabia. Environmental Research Communications 2025, 7. [Google Scholar] [CrossRef]
- Sobaih, A.E.E.; Abdou, A.H.; Alshamayleh, H.Z.; Alshebami, A.S.; Abu Elnasr, A.E. Greening minds before businesses: navigating SDGs hurdles for micro and small hotels in Saudi Arabia. Cogent Business and Management 2025, 12. [Google Scholar] [CrossRef]
- Sampieri, S.; Bagader, M. Heritage Conservation and Tourism Development in Saudi Arabia: The Case of Historic Jeddah. In Proceedings of the Advances in Science, Technology and Innovation, 2025; pp. 49-58.
- Reda, F.M. Building the Future Heritage, Tourism and Media. In Proceedings of the Advances in Science, Technology and Innovation, 2025; pp. 145-161.
- Özerdem, C. Heritage and Identity: Neoliberal Mega-Projects in Mecca. International Journal of Islamic Architecture 2025, 14, 157–178. [Google Scholar] [CrossRef]
- Mukhametov, A.; Moreva, E.; Bayramli, M.; Smirnov, A.; Egorov, I. Alternative Strategies for the Development Vector of the Arabian Peninsula Countries. International Journal of Sustainable Development and Planning 2025, 20, 1535–1552. [Google Scholar] [CrossRef]
- Moscatelli, M.; Albrahim, N.; Aldawood, R. Biophilic Urbanism for Sustainable and Resilient Neighborhood. The Case of Al Murabba, Riyadh. In Proceedings of the Lecture Notes in Civil Engineering, 2025; pp. 80-89.
- Manal, A. The Role of Renewable Energy in Driving Economic Transformation and Sustainable Development in Saudi Arabia. International Journal of Energy Economics and Policy 2025, 15, 364–373. [Google Scholar] [CrossRef]
- Kassem, A.; Tchouamou Njoya, E.T.; Ragab, A.M.; Nassr, A.; Adelazim Ahmed, T.S. Tourism Expansion, Water Scarcity, and Economic Implications in Saudi Arabia: Insights from a CGE Analysis. African and Asian Studies 2025. [Google Scholar]
- Kashef, M.; Balkhy, D. Heritage Tourism and Societal Transformations: Al-Ula World Heritage Site. Heritage and Society 2025. [Google Scholar] [CrossRef]
- Iqbal, T.; Aftab, F. Exploring Tourism's Contribution to Saudi Arabia's Vision 2030: Aligning with UN SDG 8 for Sustainable Growth. International Journal of Sustainable Development and Planning 2025, 20, 1283–1289. [Google Scholar] [CrossRef]
- Aldalbahi, S.M.M. Environmental Carrying Capacity Assessment for Environmental Planning, and Sustainable Management of National Parks in Saudi Arabia. Environment and Ecology Research 2025, 13, 120–130. [Google Scholar] [CrossRef]
- Thompson, M.C.; Quilliam, N. Saudi vision 2030: Repurposing ministries and creating new institutions. 2024; pp. 327-358.
- Sen, S.; Abouelresh, M.O.; Santra, A.; Al-Musabeh, A.H.; Al-Ismail, F.S. Geoheritage Assessment of the Geosites in Tuwaiq Mountain, Saudi Arabia: in the Perspective of Geoethics, Geotourism, and Geoconservation. Geoheritage 2024, 16. [Google Scholar] [CrossRef]
- Sen, S.; Abouelresh, M.O.; Joydas, T.V.; Almusabeh, A.; Al-Ismail, F.S.; Pulido, B. Geoheritage and Geotourism Potential of NEOM, Saudi Arabia: Linking Geoethics, Geoconservation, and Geotourism. Geoheritage 2024, 16. [Google Scholar] [CrossRef]
- Sen, S.; Abouelresh, M.O.; Al-Musabeh, A.H.; Al-Ismail, F.S. Potential Geoheritage resources in Saudi Arabia for geotourism development: In the context of IUCN theme. International Journal of Geoheritage and Parks 2024, 12, 98–112. [Google Scholar] [CrossRef]
- Sen, S.; Almusabeh, A.; Abouelresh, M.O. Geoheritage and Geotourism Potential of Tuwaiq Mountain, Saudi Arabia. Geoheritage 2023, 15. [Google Scholar] [CrossRef]
- Al Mohaya, J.; Elassal, M. Assessment of Geosites and Geotouristic Sites for Mapping Geotourism: A Case Study of Al-Soudah, Asir Region, Saudi Arabia. Geoheritage 2023, 15. [Google Scholar] [CrossRef]
- Abd El-Aal, A.; Abdullah, G.M.S.; Al-Metwaly, W.M.; AbdelMaksoud, K.M. Geological and archeological heritage resources assessment of the Najran Province; towards the 2030 vision of Saudi Arabia. Resources Policy 2023, 85. [Google Scholar] [CrossRef]
- Moufti, M.R.; Németh, K. Geoheritage of volcanic harrats in Saudi Arabia; Springer: Heidelberg, 2016; pp. 1–194. [Google Scholar]
- Turki, H.Z.; Khan, H.A.; Sen, S. Geoheritage and Geotourism Potential of the North Riyadh UNESCO Global Geopark, Saudi Arabia. Geoheritage 2025, 17. [Google Scholar] [CrossRef]
- Filippi, L.D.; Mazzetto, S. Comparing AlUla and The Red Sea Saudi Arabia’s Giga Projects on Tourism towards a Sustainable Change in Destination Development. Sustainability (Switzerland) 2024, 16. [Google Scholar] [CrossRef]
- Amal, M.O.T.; Sahide, A.; Bustami, M.R. Saudi arabia's diversification strategy through the red sea project in facing the international petroleum competition. Jurisdictie: Jurnal Hukum dan Syariah 2024, 15, 380–411. [Google Scholar] [CrossRef]
- Robitzch, V.; Kattan, A.; Dunne, A.; Coker, D.J. Saudi Arabia Case Study: The Development of Saudi Arabia’s Red Sea Coastline: Challenges Facing Sustainable Resource Use. 2023; pp. 73-93.
- Alyusuf, A. Sustainable tourism development in the red sea of the kingdom of saudi arabia: Threats and opportunities. In Proceedings of the Proceedings of the International Conference on Tourism Research, 2021; pp. 36-43.
- Németh, K., Sowaigh, A., Toni, M., Sokolov, V., Moqeem, F. Volcanic hazard assessment of northern Harrat Lunayyir, Kingdom of Saudi Arabia: Volume 5 of 5. Saudi Geological Survey Project Contract Report 2025, SGS-PCR-2024-2 (Volume 5 of 5), 68.
- Németh, K.; Toni, M.; Sokolov, V.; Sowaigh, A.; Ashor, M.; Moqeem, F. Eruption Scenarios of a Monogenetic Volcanic Field Formed within a Structurally Controlled Basement Terrain: Harrat Lunayyir, Saudi Arabia. In A Comprehensive Study of Volcanic Phenomena, Németh, K., Ed.; IntechOpen: Rijeka, 2024.
- Geologic map of the Arabian Peninsula; 270A; 1963.
- Mukhopadhyay, M.; Mukhopadhyay, B.; Mogren, S.; Nandi, B.K.; Ibrahim, E. Regional significance of crustal and sub-crustal rheological heterogeneities beneath the Harrat Lunayyir and their continuity into the neighboring harrats, Western Saudi Arabia – Perspectives of the Afar plume activity. Journal of African Earth Sciences 2022, 186. [Google Scholar] [CrossRef]
- Saibi, H.; Mogren, S.; Mukhopadhyay, M.; Ibrahim, E. Subsurface imaging of the Harrat Lunayyir 2007–2009 earthquake swarm zone, western Saudi Arabia, using potential field methods. Journal of Asian Earth Sciences 2019, 169, 79–92. [Google Scholar] [CrossRef]
- Alamri, A.; Duncan, R.; Kent, A.; Alfouzan, F. Geochemical and Geophysical Evolution of Regional Mantle Flow Beneath Volcanic Harrats in the West Arabian Shield (Saudi Arabia). In Advances in Science, Technology and Innovation; 2019; pp. 9-11.
- Al Shehri, A.; Gudmundsson, A. Thermal mapping of the 2009 dyke emplacement at Harrat Lunayyir, Saudi Arabia. Arabian Journal of Geosciences 2019, 12. [Google Scholar] [CrossRef]
- Vigliotti, L.; Cai, M.Y.; Rasul, N.M.A.; Al-Nomani, S.M.S. Palaeomagnetism and geochronology of the Harrats Lunayyir and Khaybar Lava Fields, Saudi Arabia. In Geological Setting, Palaeoenvironment and Archaeology of the Red Sea; 2018; pp. 417-435.
- Sanfilippo, A.; Cai, M.Y.; Jácome, A.P.G.; Ligi, M. Geochemistry of the lunayyir and khaybar volcanic fields (Saudi Arabia): Insights into the origin of cenozoic arabian volcanism. In Geological Setting, Palaeoenvironment and Archaeology of the Red Sea; 2018; pp. 389-415.
- Zahran, H.M.; El-Hady, S.M.; Abuelnaga, H.S. Aeromagnetic data over Harrat Lunayyir and surrounding areas, western Saudi Arabia. Arabian Journal of Geosciences 2017, 10. [Google Scholar] [CrossRef]
- Zahran, H.M.; El-Hady, S.M. Seismic hazard assessment for Harrat Lunayyir – A lava field in western Saudi Arabia. Soil Dynamics and Earthquake Engineering 2017, 100, 428–444. [Google Scholar] [CrossRef]
- Mogren, S.; Saibi, H.; Mukhopadhyay, M.; Gottsmann, J.; Ibrahim, E.K.H. Analyze the spatial distribution of lava flows in Al-Ays Volcanic Area, Saudi Arabia, using remote sensing. Arabian Journal of Geosciences 2017, 10. [Google Scholar] [CrossRef]
- Mukhopadhyay, B.; Mogren, S.; Mukhopadhyay, M.; Dasgupta, S. Incipient status of dyke intrusion in top crust - evidences from the Al-Ays 2009 earthquake swarm, Harrat Lunayyir, SW Saudi Arabia. Geomatics, Natural Hazards and Risk 2013, 4, 30–48. [Google Scholar] [CrossRef]
- Duncan, R.A.; Al-Amri, A.M. Timing and composition of volcanic activity at Harrat Lunayyir, western Saudi Arabia. Journal of Volcanology and Geothermal Research 2013, 260, 103–116. [Google Scholar] [CrossRef]
- Pallister, J.S.; McCausland, W.A.; Jónsson, S.; Lu, Z.; Zahran, H.M.; El Hadidy, S.; Aburukbah, A.; Stewart, I.C.F.; Lundgren, P.R.; White, R.A.; et al. Broad accommodation of rift-related extension recorded by dyke intrusion in Saudi Arabia. Nature Geoscience 2010, 3, 705–712. [Google Scholar] [CrossRef]
- al Shehri, A.A. Volcanic Geomorphology and Morphometry Classification of Cinder Cone in Harrat Lunayyir Saudi Arabia by Using GIS and Remote Sensing. Journal of Environmental and Earth Sciences 2025, 7, 304–318. [Google Scholar] [CrossRef]
- Németh, K.; Sowaigh, A.; Zakharovskyi, V.; Toni, M.; Ashor, M.; Sokolov, V.; Moqeem, F.; Abdulhafaz, K.; Hablil, T.; Sehli, T.; et al. The Volcanic Geoheritage in the Pristine Natural Environment of Harrat Lunayyir, Saudi Arabia: Opportunities for Geotourism and Geohazard Issues. Heritage 2025, 8. [Google Scholar] [CrossRef]
- Robinson, J.E.; Downs, D.T. Overview of the Cenozoic Geology of the Northern Harrat Rahat Volcanic Field, Kingdom of Saudi Arabia. US Geological Survey Professional Paper 2023, 2023. [Google Scholar] [CrossRef]
- Mossoux, S.; Saey, M.; Bartolini, S.; Poppe, S.; Canters, F.; Kervyn, M. Q-LAVHA: A flexible GIS plugin to simulate lava flows. Computers and Geosciences 2016, 97, 98–109. [Google Scholar] [CrossRef]
- Becerril, L.; Larrea, P.; Salinas, S.; Mossoux, S.; Ferrés, D.; Widom, E.; Siebe, C.; Martí, J. The historical case of Paricutin volcano (Michoacán, México): challenges of simulating lava flows on a gentle slope during a long-lasting eruption. Natural Hazards 2021, 107, 809–829. [Google Scholar] [CrossRef]
- Németh, K.; Moufti, M.R. Lava Flow Hazard and Its Implication in Geopark Development for the Active Harrat Khaybar Intracontinental Monogenetic Volcanic Field, Saudi Arabia. Land 2023, 12. [Google Scholar] [CrossRef]
- Chiba, T.; S., K.; Suzuki, Y. Red relief image map: new visualization method for three dimensional data. The International Archives of the Photogrammetry, Remote Sensing and Spatial Information Sciences. Vol. XXXVII. Part B2. Beijing 2008 2008, 1071-1076.
- Chiba, T.; Kaneta, S.; Ohashi, M. Digital Terrain Representation Methods and Red Relief Image Map, A New Visualization Approach. Proceedings of the International Cartographic Association, 2, 2019., 29th International Cartographic Conference (ICC 2019), 15–20 July 2019, Tokyo, Japan. 2019. [CrossRef]
- Ulusoy, İ.; Diker, C.; Şen, E.; Aydın, E.; Akkaş, E.; Gümüş, E.; Çubukçu, H.E.; Erkut, V. Surface expressions of morphostructural features at Hasandağ stratovolcano on DEM datasets. Mediterranean Geoscience Reviews 2021, 3, 175–191. [Google Scholar] [CrossRef]
- Karátson, D.; Yepes, J.; Favalli, M.; Rodríguez-Peces, M.J.; Fornaciai, A. Reconstructing eroded paleovolcanoes on Gran Canaria, Canary Islands, using advanced geomorphometry. Geomorphology 2016, 253, 123–134. [Google Scholar] [CrossRef]
- Favalli, M.; Fornaciai, A. Visualization and comparison of DEM-derived parameters. Application to volcanic areas. Geomorphology 2017, 290, 69–84. [Google Scholar] [CrossRef]
- Özpolat, E.; Yildirim, C.; Görüm, T. The Quaternary landforms of the Büyük Menderes Graben System: the southern Menderes Massif, western Anatolia, Turkey. Journal of Maps 2020, 16, 405–419. [Google Scholar] [CrossRef]
- Giordano, G.; Cas, R.; Wright, J.V. Explosive Eruption Styles, Columns, and Pyroclastic Fallout Deposits. In Volcanology: Processes, Deposits, Geology and Resources, Cas, R., Giordano, G., Wright, J.V., Eds.; Springer International Publishing: Cham, 2024; pp. 519-691.
- Taddeucci, J.; Edmonds, M.; Houghton, B.; James, M.R.; Vergniolle, S. Chapter 27 - Hawaiian and Strombolian Eruptions. In The Encyclopedia of Volcanoes (Second Edition), Sigurdsson, H., Ed.; Academic Press: Amsterdam, 2015; pp. 485-503.
- Houghton, B.F.; Wilson, C.J.N.; Smith, I.E.M. Shallow-seated controls on styles of explosive basaltic volcanism: A case study from New Zealand. Journal of Volcanology and Geothermal Research 1999, 91, 97–120. [Google Scholar] [CrossRef]
- Houghton, B.F.; Gonnermann, H.M. Basaltic explosive volcanism: Constraints from deposits and models. Geochemistry 2008, 68, 117–140. [Google Scholar] [CrossRef]
- Németh, K.; Kereszturi, G. Monogenetic Basaltic Volcanoes: Genetic Classification, Growth, Geomorphology and Degradation. In Updates in Volcanology - New Advances in Understanding Volcanic Systems, Németh, K., Ed.; IntechOpen: London, 2012.
- Cas, R.; Wright, J.V.; Giordano, G. Basaltic and Other Low-Viscosity Lavas. In Volcanology: Processes, Deposits, Geology and Resources, Cas, R., Giordano, G., Wright, J.V., Eds.; Springer International Publishing: Cham, 2024; pp. 229-309.
- Harris, A.; Latutrie, B.; Van Wyk de Vries, B.; Saubin, É.; Foucher, M.; Gurioli, L.; Zanella, E.; Médard, E.; Nauret, F. Emplacement of monogenetic lava flows on eroded terrain, Part II: The case of the Artière valley (Grave Noire, France). Journal of Volcanology and Geothermal Research 2023, 438. [Google Scholar] [CrossRef]
- Latutrie, B.; Harris, A.; Van Wyk de Vries, B.; Gurioli, L.; Médard, E. Emplacement of lava flows on eroded terrain, part I: The case of the Tiretaine valley (Chaîne des Puys, France). Journal of Volcanology and Geothermal Research 2023, 438, 107808. [Google Scholar] [CrossRef]
- Murcia, H.; Németh, K.; Moufti, M.R.; Lindsay, J.M.; El-Masry, N.; Cronin, S.J.; Qaddah, A.; Smith, I.E.M. Late Holocene lava flow morphotypes of northern Harrat Rahat, Kingdom of Saudi Arabia: Implications for the description of continental lava fields. Journal of Asian Earth Sciences 2014, 84, 131–145. [Google Scholar] [CrossRef]
- Brown, C.; Bryan, S.E.; Gust, D.A.; Dalton, H. Insights into the development of small-volume long lava flows: A case study of the Coalstoun Lakes Volcanic Field, southeast Queensland, Australia. Journal of Volcanology and Geothermal Research 2024, 451. [Google Scholar] [CrossRef]
- Self, S.; Keszthelyi, L.; Thordarson, T. The importance of pāhoehoe. Annual Review of Earth and Planetary Sciences 1998, 26, 81–110. [Google Scholar] [CrossRef]
- Self, S.; Thordarson, T.; Keszthelyi, L. Emplacement of continental flood basalt lava flows. In Geophysical Monograph Series; 1997; Volume 100, pp. 381-410.
- Pioli, L.; Erlund, E.; Johnson, E.; Cashman, K.; Wallace, P.; Rosi, M.; Delgado Granados, H. Explosive dynamics of violent Strombolian eruptions: The eruption of Parícutin Volcano 1943-1952 (Mexico). Earth and Planetary Science Letters 2008, 271, 359–368. [Google Scholar] [CrossRef]
- Foshag, W.F.; Gonzalez, R.J. Birth and development of Paricutin volcano. U.S. Geol. Surv. Bull. 1956, 965 D, 355–489. [Google Scholar]
- Walker, G.P.L. Explosive volcanic eruptions — a new classification scheme. Geologische Rundschau 1973, 62, 431–446. [Google Scholar] [CrossRef]
- Valentine, G.A.; Gregg, T.K.P. Continental basaltic volcanoes - Processes and problems. Journal of Volcanology and Geothermal Research 2008, 177, 857–873. [Google Scholar] [CrossRef]
- Self, S.; Sparks, S.; Booth, B.; Walker, G.P.L. The 1973 Heimaey Strombolian Scoria deposit, Iceland. Geological Magazine 1974, 111, 539–548. [Google Scholar] [CrossRef]
- Thorarinsson, S.; Steinthórsson, S.; Einarsson, T.; Kristmannsdöttir, H.; Öskarsson, N. The eruption on Heimaey, Iceland. Nature 1973, 241, 372–375. [Google Scholar] [CrossRef]
- Larrea, P.; Salinas, S.; Widom, E.; Siebe, C.; Abbitt, R.J.F. Compositional and volumetric development of a monogenetic lava flow field: The historical case of Paricutin (Michoacán, Mexico). Journal of Volcanology and Geothermal Research 2017, 348, 36–48. [Google Scholar] [CrossRef]
- Kawabata, E.; Cronin, S.J.; Bebbington, M.S.; Moufti, M.R.H.; El-Masry, N.; Wang, T. Identifying multiple eruption phases from a compound tephra blanket: an example of the AD1256 Al-Madinah eruption, Saudi Arabia. Bulletin of Volcanology 2015, 77. [Google Scholar] [CrossRef] [PubMed]
- Camp, V.E.; Hooper, P.R.; Roobol, M.J.; White, D.L. The Madinah eruption, Saudi Arabia: Magma mixing and simultaneous extrusion of three basaltic chemical types. Bulletin of Volcanology 1987, 49, 489–508. [Google Scholar] [CrossRef]
- Bebbington, M.S. Spatio-volumetric hazard estimation in the Auckland volcanic field. Bulletin of Volcanology 2015, 77. [Google Scholar] [CrossRef]
- Hayes, J.L.; Wilson, T.M.; Deligne, N.I.; Lindsay, J.M.; Leonard, G.S.; Tsang, S.W.R.; Fitzgerald, R.H. Developing a suite of multi-hazard volcanic eruption scenarios using an interdisciplinary approach. Journal of Volcanology and Geothermal Research 2020, 392. [Google Scholar] [CrossRef]
- Hopkins, J.L.; Smid, E.R.; Eccles, J.D.; Hayes, J.L.; Hayward, B.W.; McGee, L.E.; van Wijk, K.; Wilson, T.M.; Cronin, S.J.; Leonard, G.S.; et al. Auckland Volcanic Field magmatism, volcanism, and hazard: a review. New Zealand Journal of Geology and Geophysics 2021, 64, 213–234. [Google Scholar] [CrossRef]
- Valentine, G.A.; Perry, F.V. Volcanic risk assessment at Yucca Mountain, NV, USA: Integration of geophysics, geology and modeling. In Volcanic and Tectonic Hazard Assessment for Nuclear Facilities; 2009; Volume 9780521887977, pp. 452-480.
- Wetmore, P.H.; Hughes, S.S.; Connor, L.J.; Caplinger, M.L. Spatial distribution of eruptive centers about the Idaho National Laboratory. In Volcanic and Tectonic Hazard Assessment for Nuclear Facilities; 2009; Volume 9780521887977, pp. 385-405.
- Sugden, P.; Meliksetian, K.; Savov, I.P.; Barfod, D.; Wilson, M.; Connor, C.; Navasardyan, G.; Grigoryan, E.; Manucharyan, D. Post-collisional shift from polygenetic to monogenetic volcanism revealed by new 40Ar/39Ar ages in the southern Lesser Caucasus (Armenia). Journal of Volcanology and Geothermal Research 2021, 412. [Google Scholar] [CrossRef]
- Connor, L.J.; Connor, C.B.; Meliksetian, K.; Savov, I. Probabilistic approach to modeling lava flow inundation: A lava flow hazard assessment for a nuclear facility in Armenia. Journal of Applied Volcanology 2012, 1. [Google Scholar] [CrossRef]
Figure 1.
Cenozoic volcanic fields of Saudi Arabia. Harrat Lunayyir is located near the Red Sea Coast, near the local service center of Um Lujj. The map displays the most recent volcanoes and records volcanic eruptions in the Middle East, sourced from the Smithsonian Institution's Global Volcanism Program database. River outlines are from the World River Database. The Volcanic fields (harrats) are based on the USGS Geological Map of the Arabian Peninsula data source [73][ https://www.arcgis.com/home/item.html?id=c364d4f44caf4d49af12eb18eac0867e – accessed on 30 October 2025].
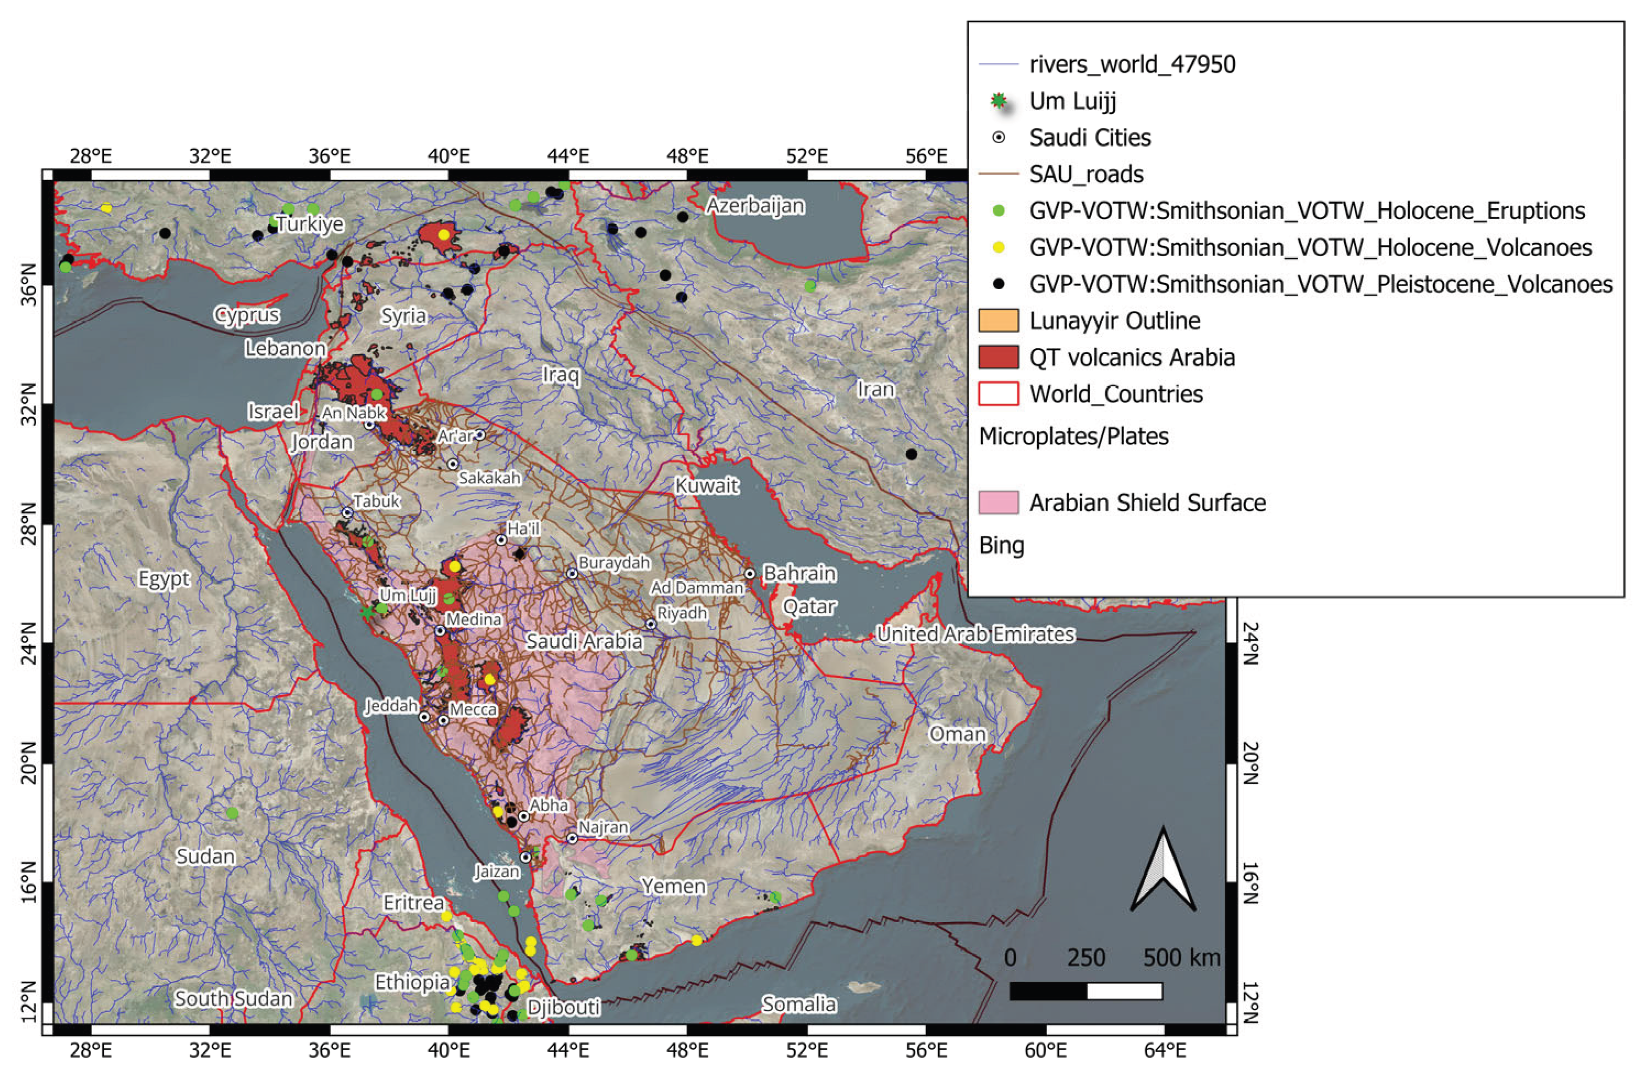
Figure 2.
Harrat Lunayyir is displayed on a hillshade map generated from a 12.5m resolution ALOS-PALSAR Digital Elevation Model. Identified volcanoes are distributed along a clearly recognizable lineament with local cluster formations. The red area marked on the map indicates the region considered for long-term tourism development. In contrast, the blue area highlights the focus area where tourism plans are under serious consideration. The red star marks the “Target Volcano," a young scoria cone near a planned tourism facility. Green and purple lines indicate the cross-section lines shown in Figure 3 and Figure 4, respectively.
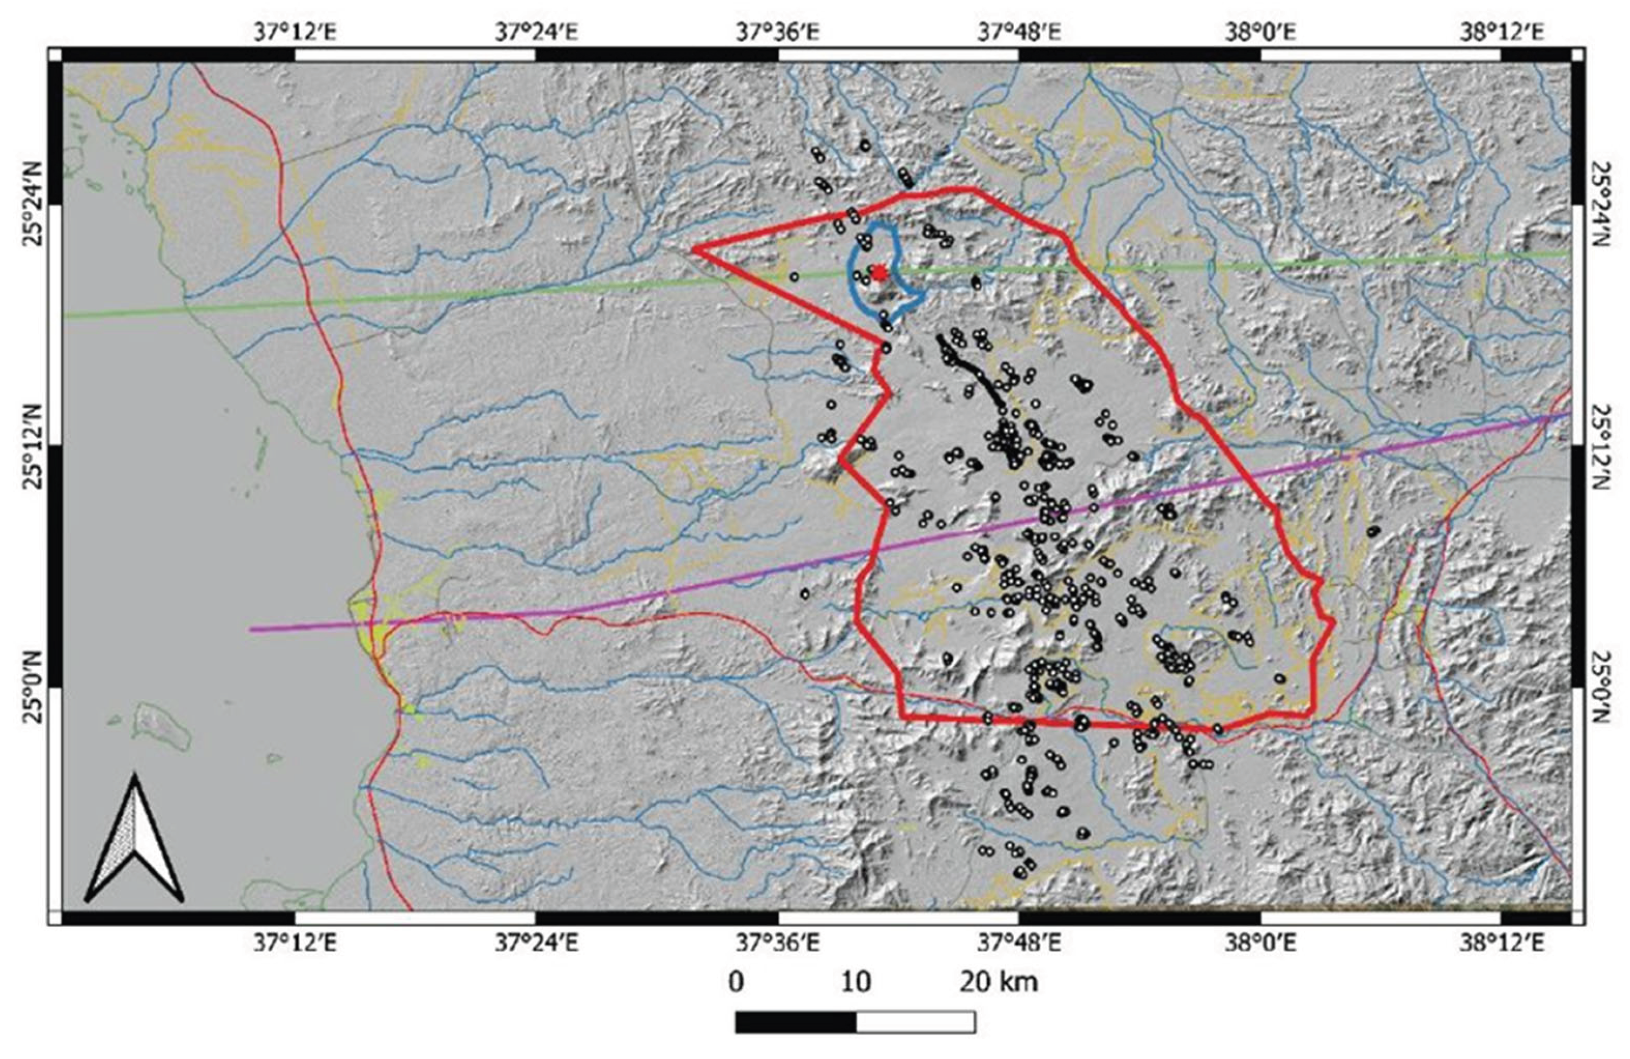
Figure 3.
Topographic cross section from west to east across the northern part (green line on Figure 2) of Harrat Lunayyir.
Figure 3.
Topographic cross section from west to east across the northern part (green line on Figure 2) of Harrat Lunayyir.
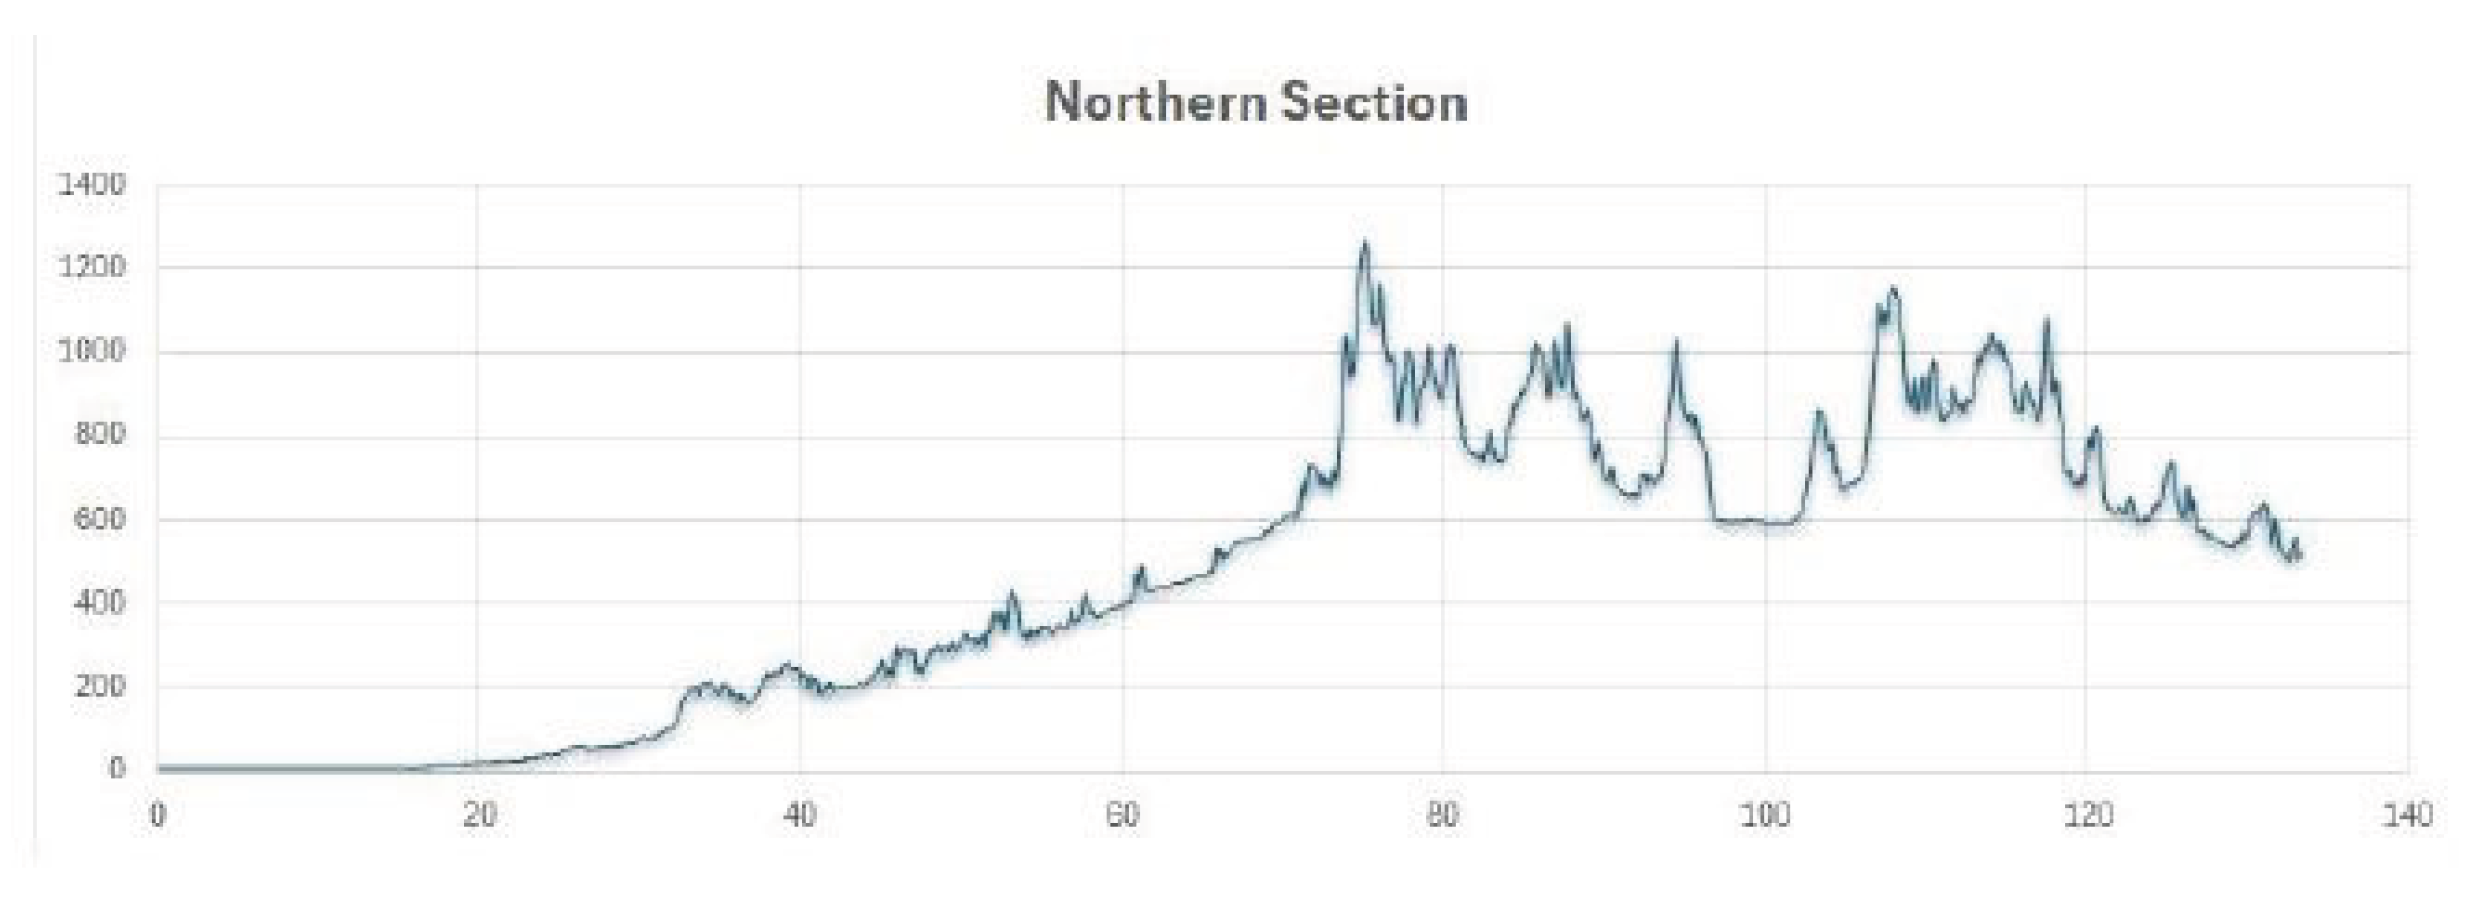
Figure 4.
Topographic cross section from west to east across the southern part (green line on Figure 2) of Harrat Lunayyir.
Figure 4.
Topographic cross section from west to east across the southern part (green line on Figure 2) of Harrat Lunayyir.
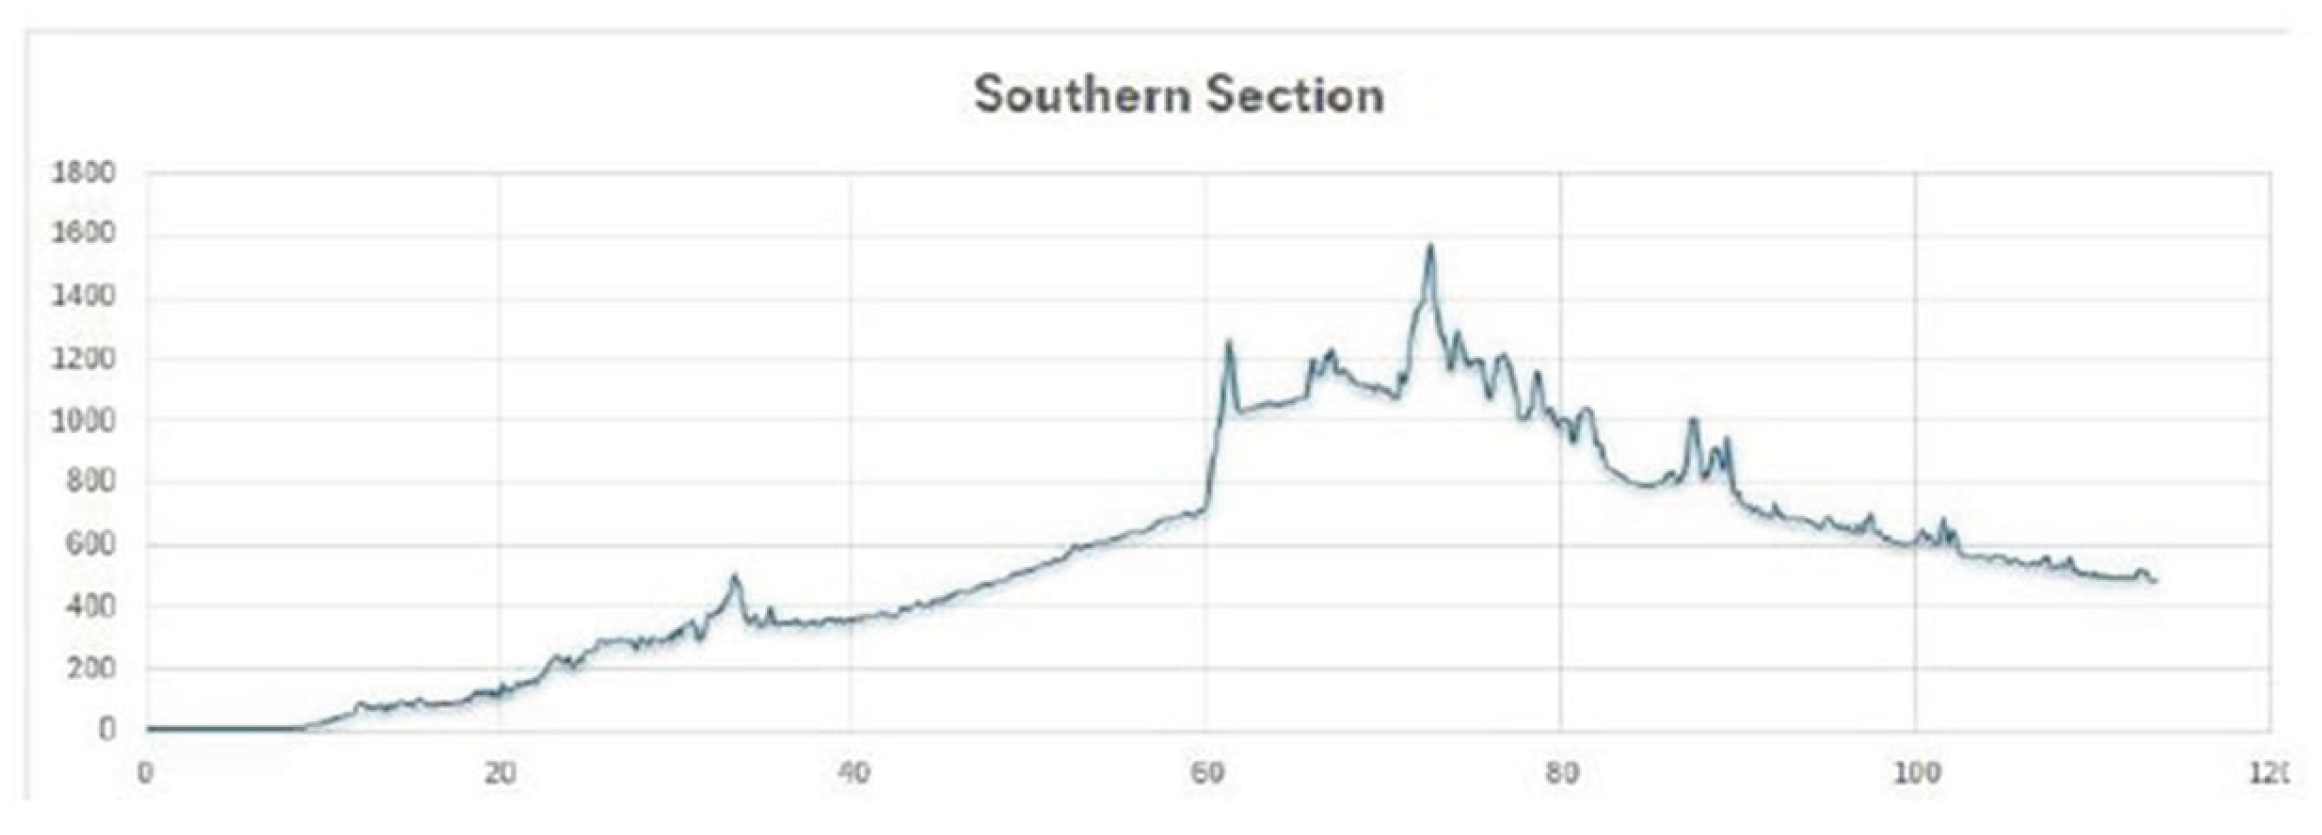
Figure 5.
A geology map of the study area also shows 26 significant geosites [87]. The Option 4 research area is marked by a blue outline, while the boundaries of the Wider Area of Interest of the Red Sea Global tourism development are indicated by thick red lines (WAI RSG).
Figure 5.
A geology map of the study area also shows 26 significant geosites [87]. The Option 4 research area is marked by a blue outline, while the boundaries of the Wider Area of Interest of the Red Sea Global tourism development are indicated by thick red lines (WAI RSG).
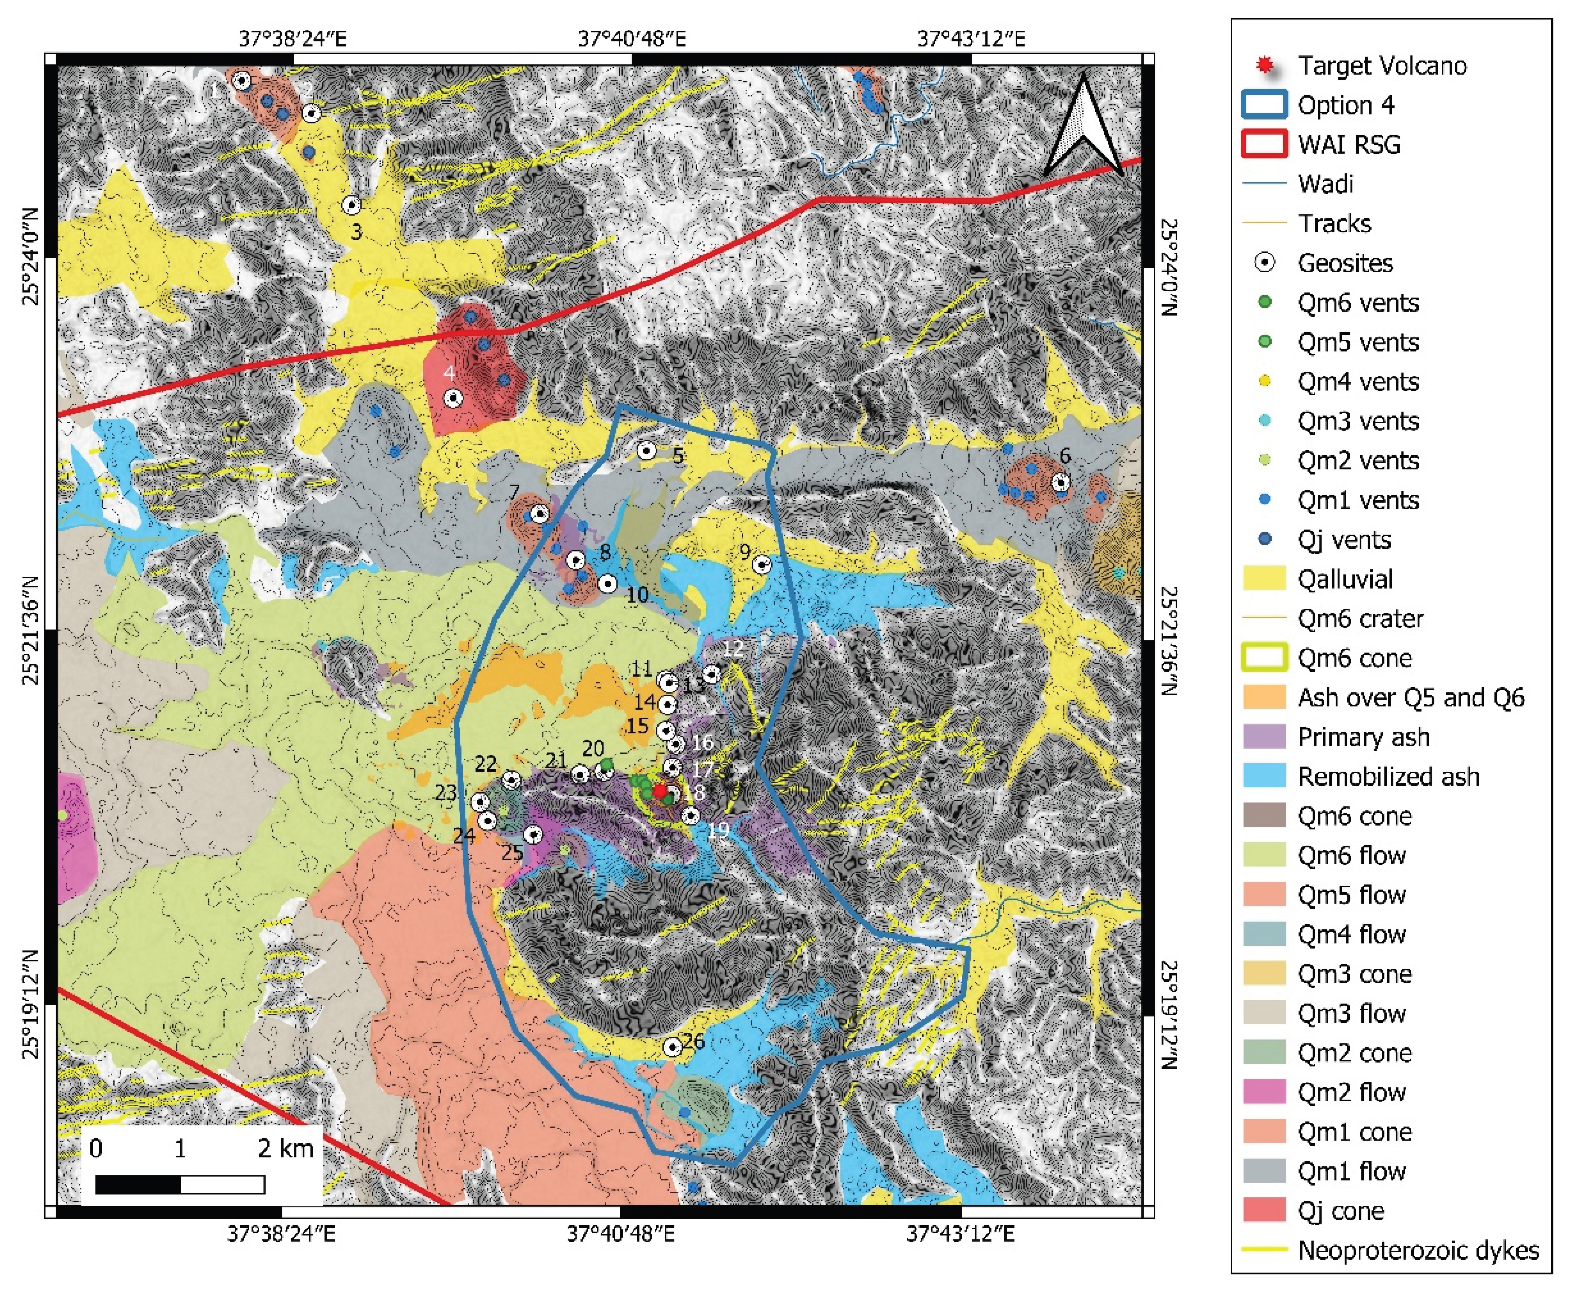
Figure 6.
Total seismicity recorded by the Saudi Geological Survey seismic network marking the 2009 volcano seismic unrest and the fissure opened during that event just south of the Option 4 area.
Figure 6.
Total seismicity recorded by the Saudi Geological Survey seismic network marking the 2009 volcano seismic unrest and the fissure opened during that event just south of the Option 4 area.
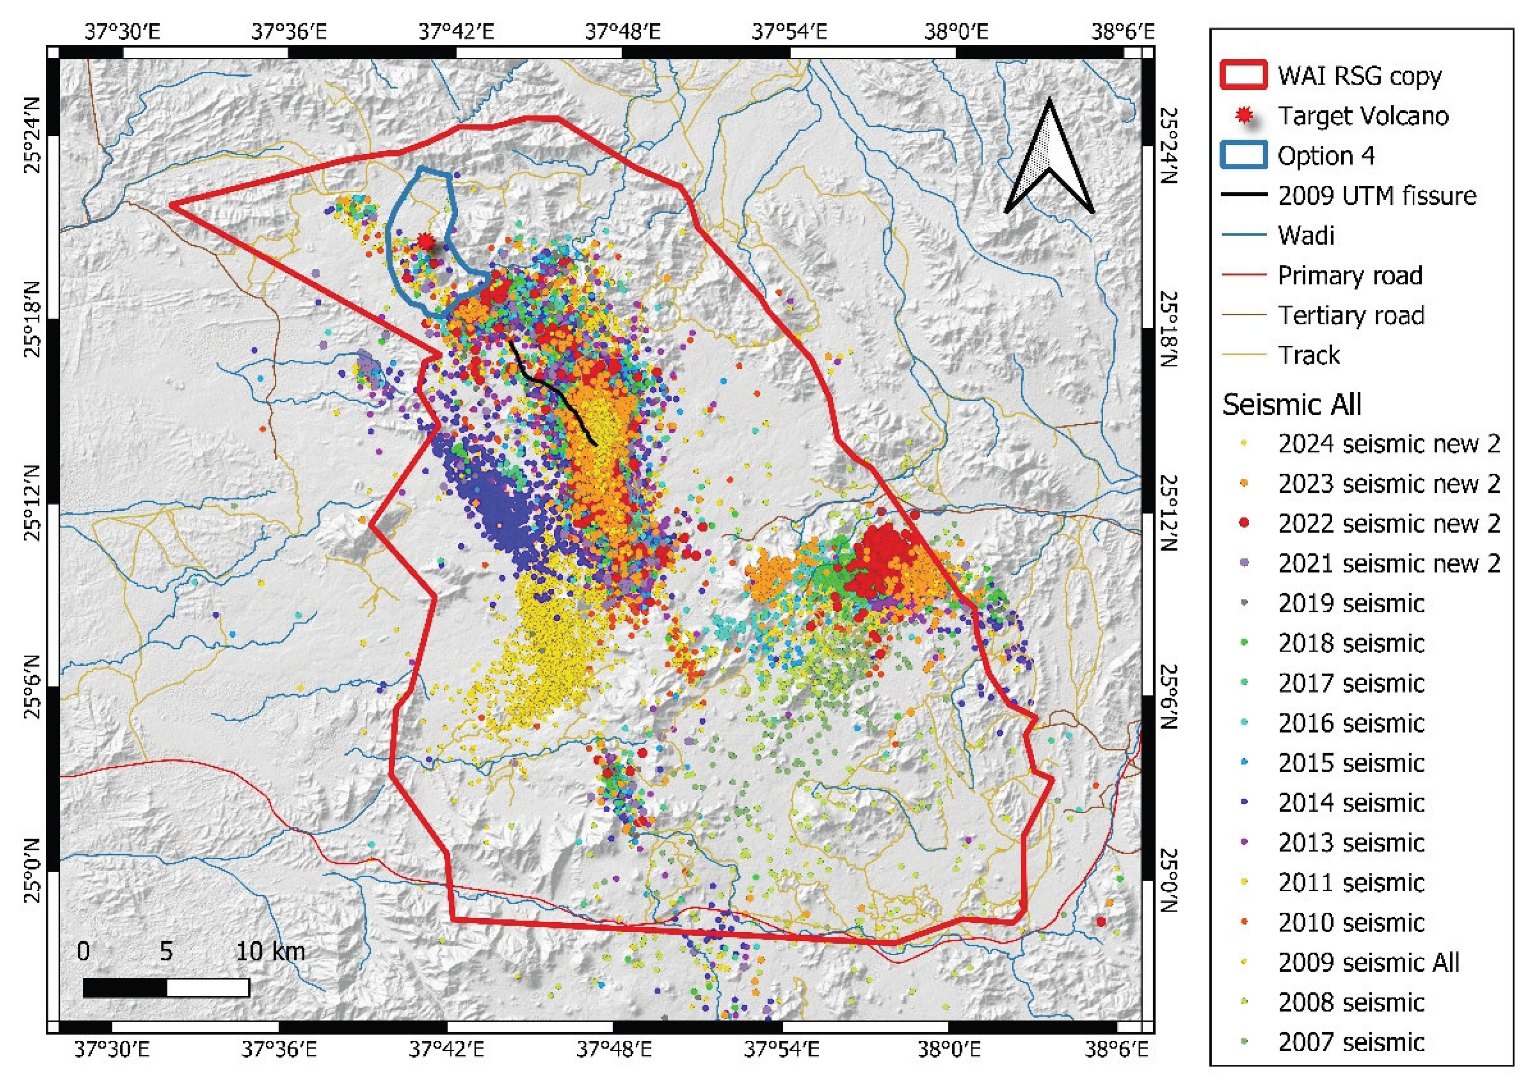
Figure 7.
Partially engulfed former lava spatter ramparts (located in the middle of the view) within the main channel of the youngest lava flow mapped west of the Target Volcano (visible on the left side of the view) within Option 4 area (25°21'1.50"N, 37°40'46.81"E).
Figure 7.
Partially engulfed former lava spatter ramparts (located in the middle of the view) within the main channel of the youngest lava flow mapped west of the Target Volcano (visible on the left side of the view) within Option 4 area (25°21'1.50"N, 37°40'46.81"E).
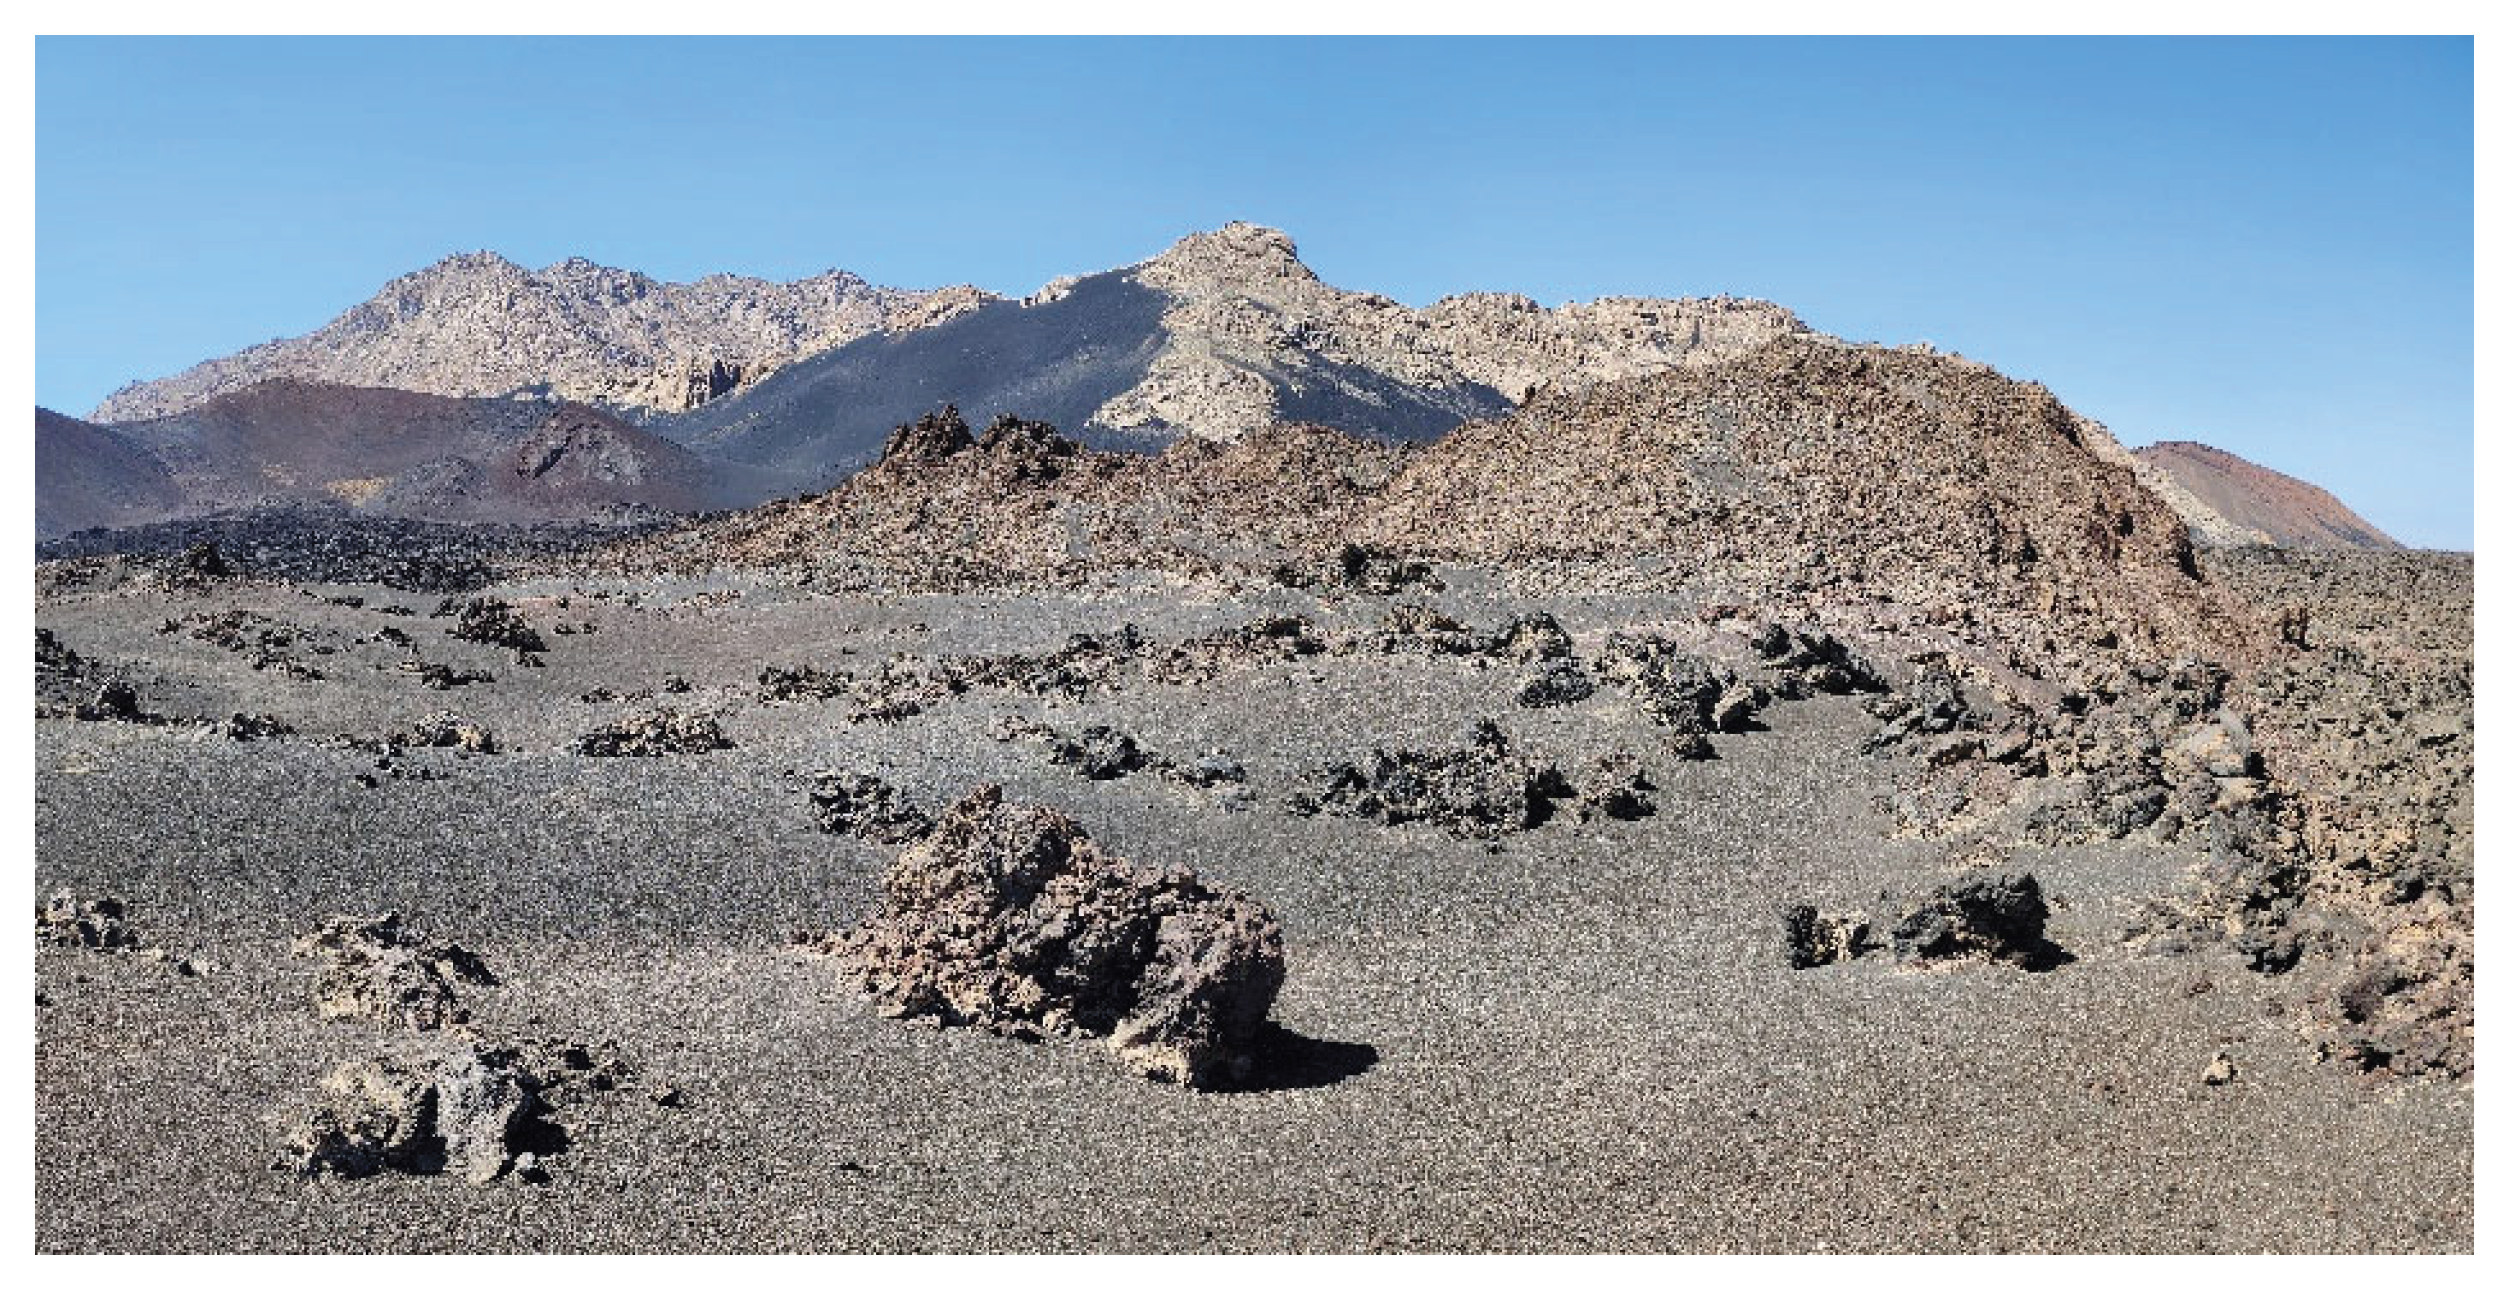
Figure 9.
Rubbly or slabby pāhoehoe surface texture in the main feeding arteries of the lava field just west of the Target Volcano. The location coordinate is 25°21'19.48"N, 37°41'5.03"E.
Figure 9.
Rubbly or slabby pāhoehoe surface texture in the main feeding arteries of the lava field just west of the Target Volcano. The location coordinate is 25°21'19.48"N, 37°41'5.03"E.
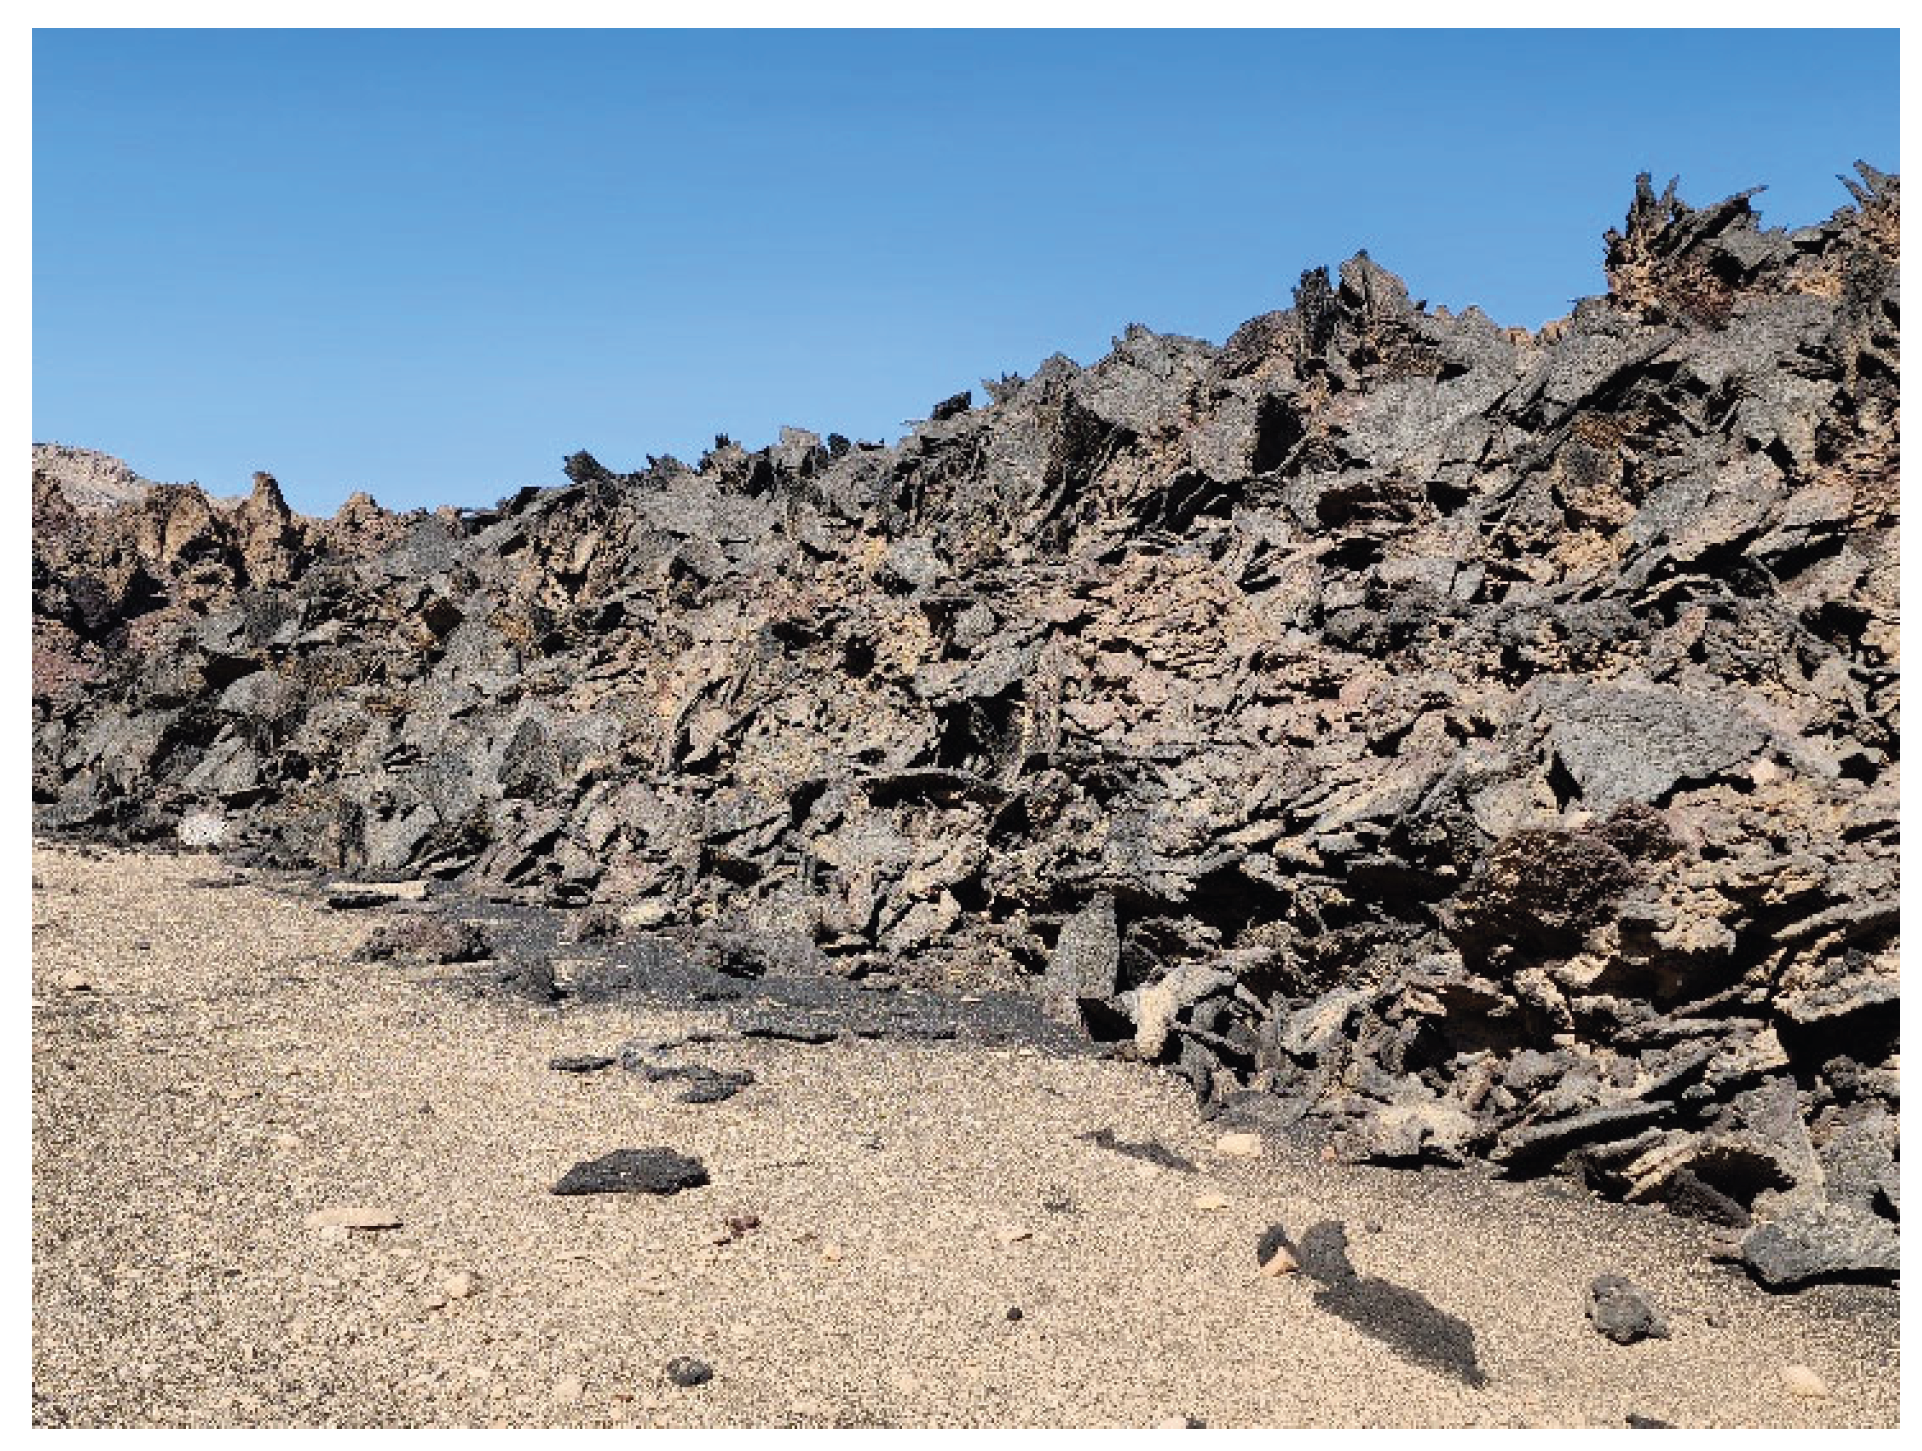
Figure 10.
Typical shelly pāhoehoe, with a light cream color zone in the foreground within the crater opening, is visible at the vent location at the leading development site in the westward-facing open main crater of the Target Volcano. These shelly pāhoehoe regions host some lava tumuli—chimneys with visible cavities that formed after lava drained back and out. The photo was taken from the point at 25°20'36.48"N, 37°41'3.27"E, looking toward the NW, which is the main structural axis of the region and the primary orientation of the vent alignments in the Lunayyir Volcanic Field.
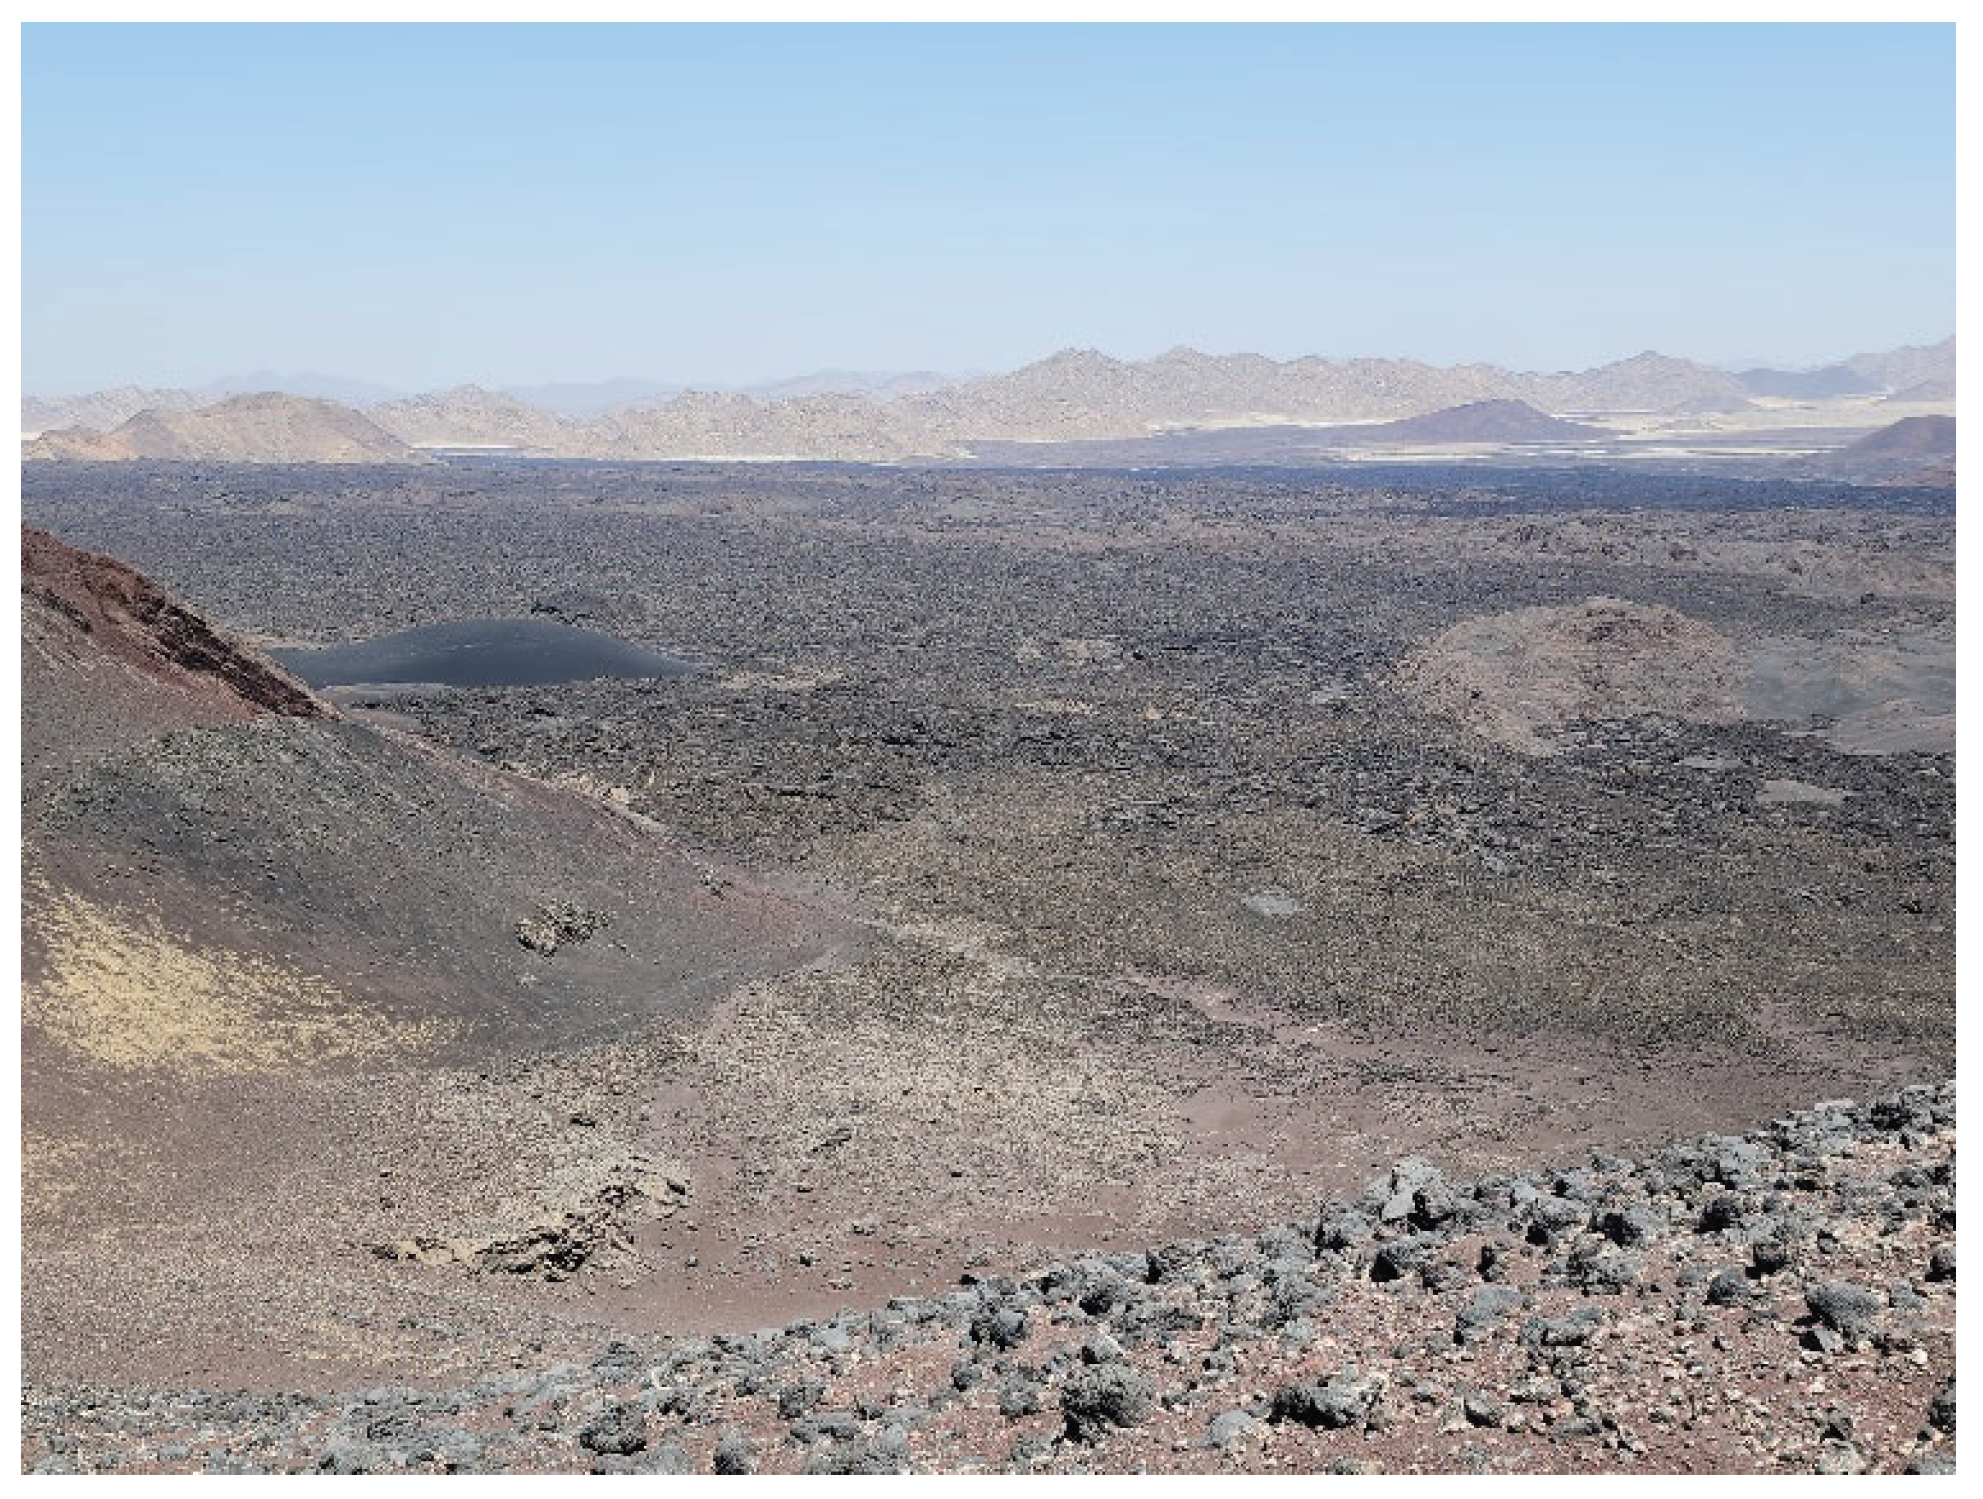
Figure 11.
Collapsed roof of a pāhoehoe lava field over a master tube below. Note that the collapsed feature (dark rubbly zone in the middle view) is about 10 m deep, with large slabs of pāhoehoe crusts, several meters across, from solidified and ripped-up lava flow surfaces. In these ponded zones, we can estimate a potential lava flow (25°21'48.70"N, 37°38'39.16"E).
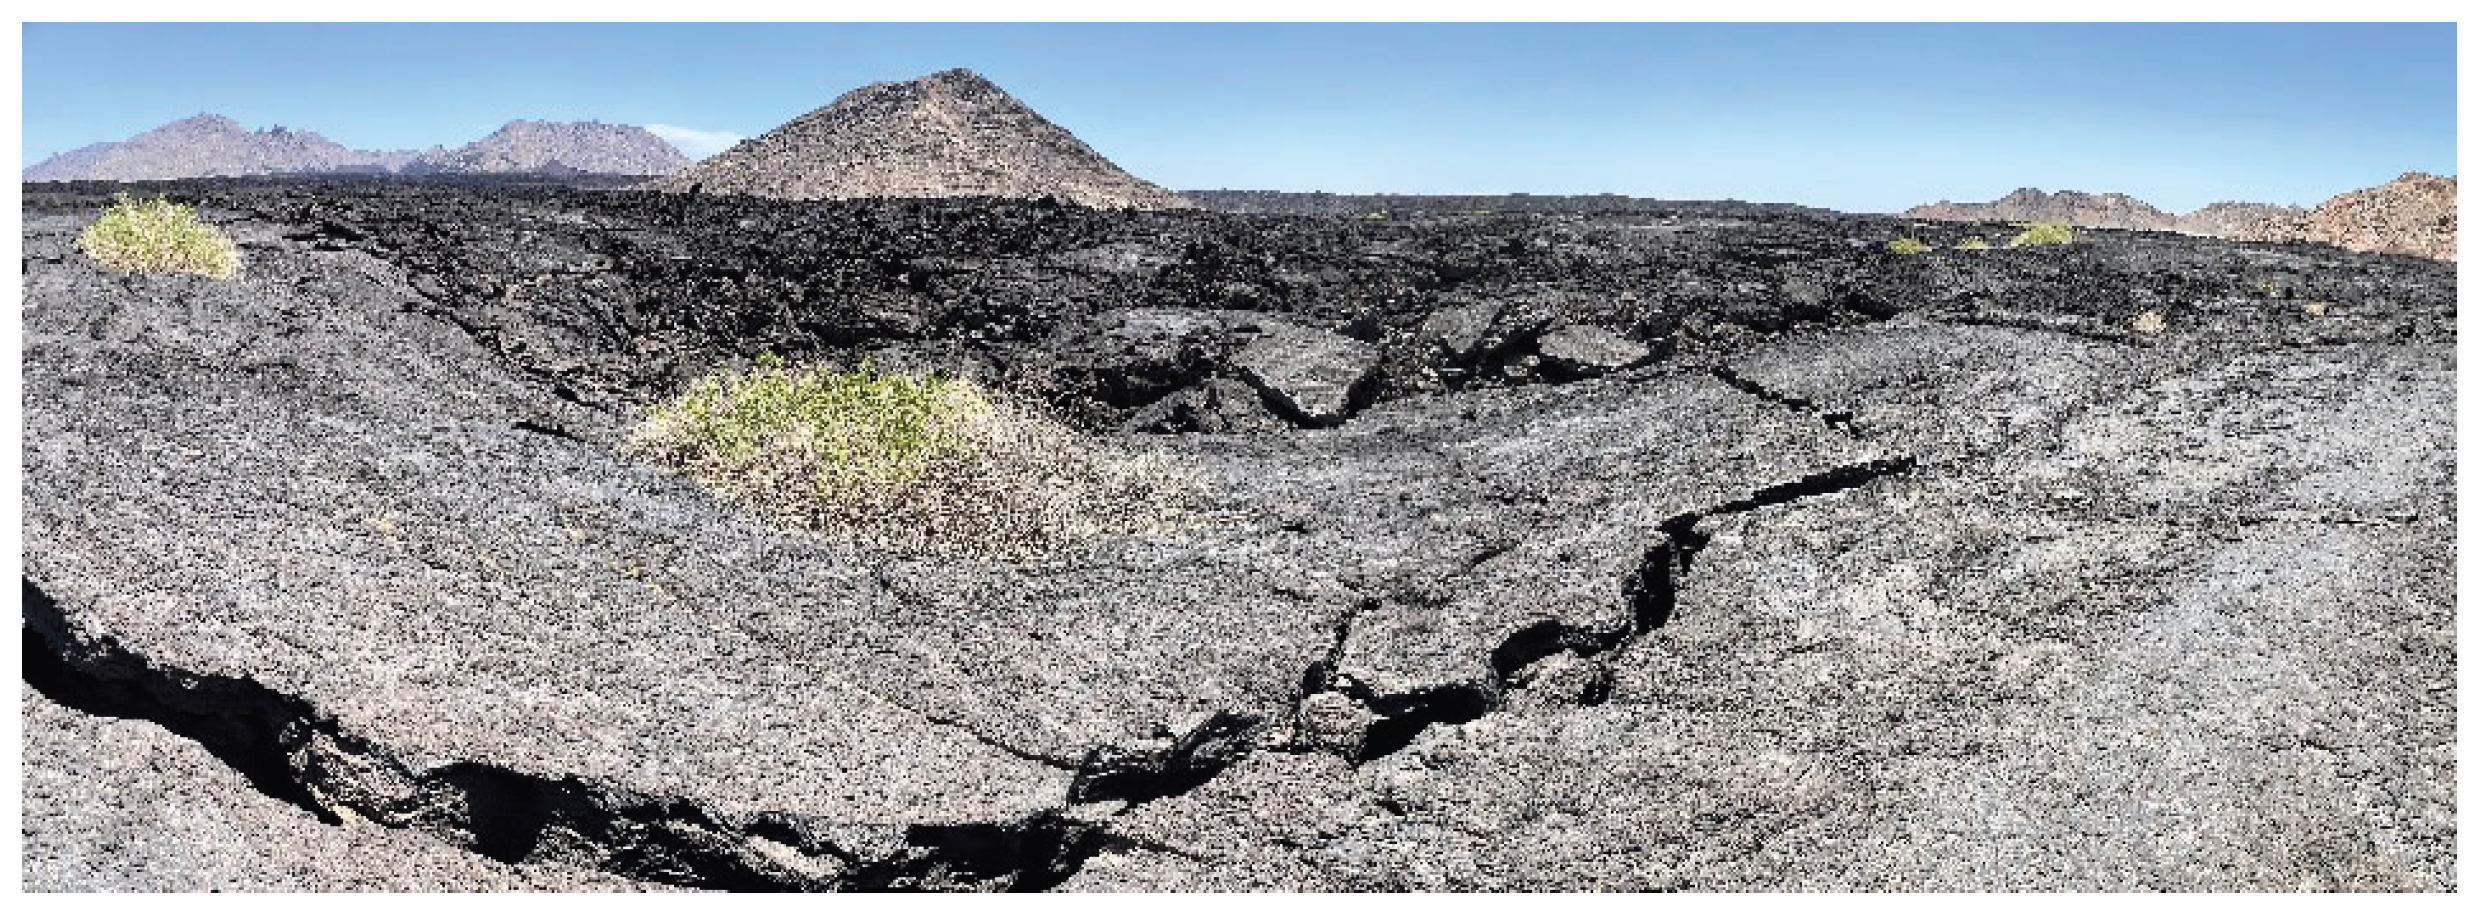
Figure 12.
Pyroclastic succession approximately 20 cm thick (black coarse ash and fine lapilli) located about 3.5 km from the source (Target Volcano) on a steep slope of an older scoria cone (25°22'19.99"N, 37°40'16.67"E).
Figure 12.
Pyroclastic succession approximately 20 cm thick (black coarse ash and fine lapilli) located about 3.5 km from the source (Target Volcano) on a steep slope of an older scoria cone (25°22'19.99"N, 37°40'16.67"E).
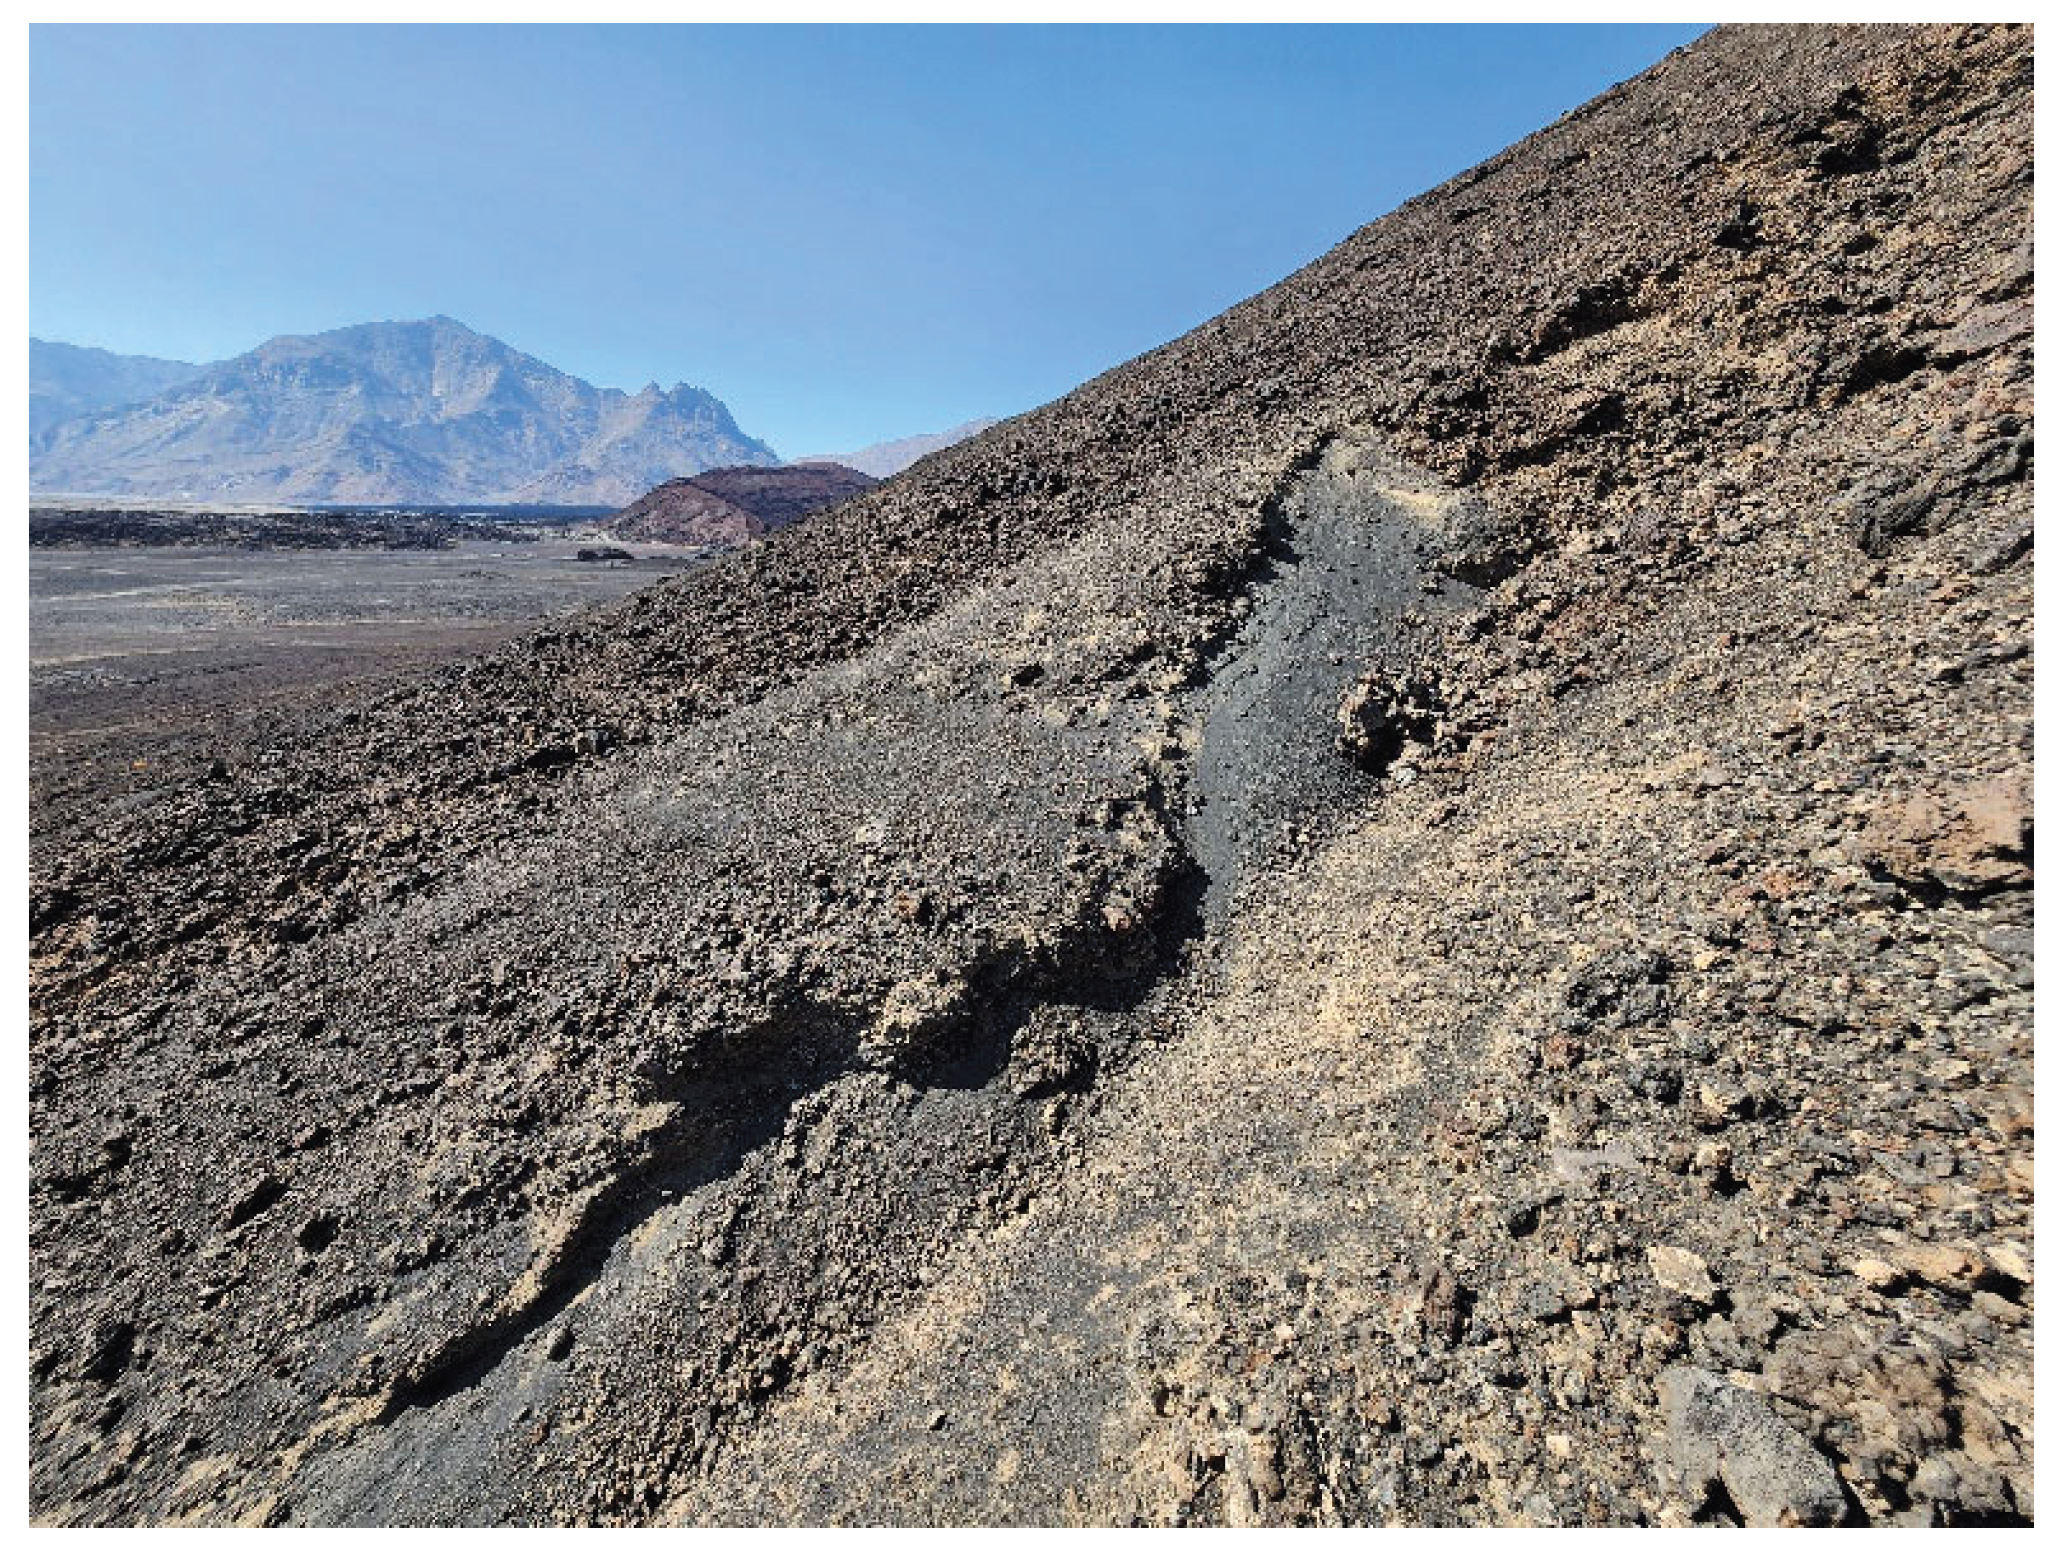
Figure 13.
Cone formation and lava effusion from vent 1 in the NW outskirt of the Option 4 area.
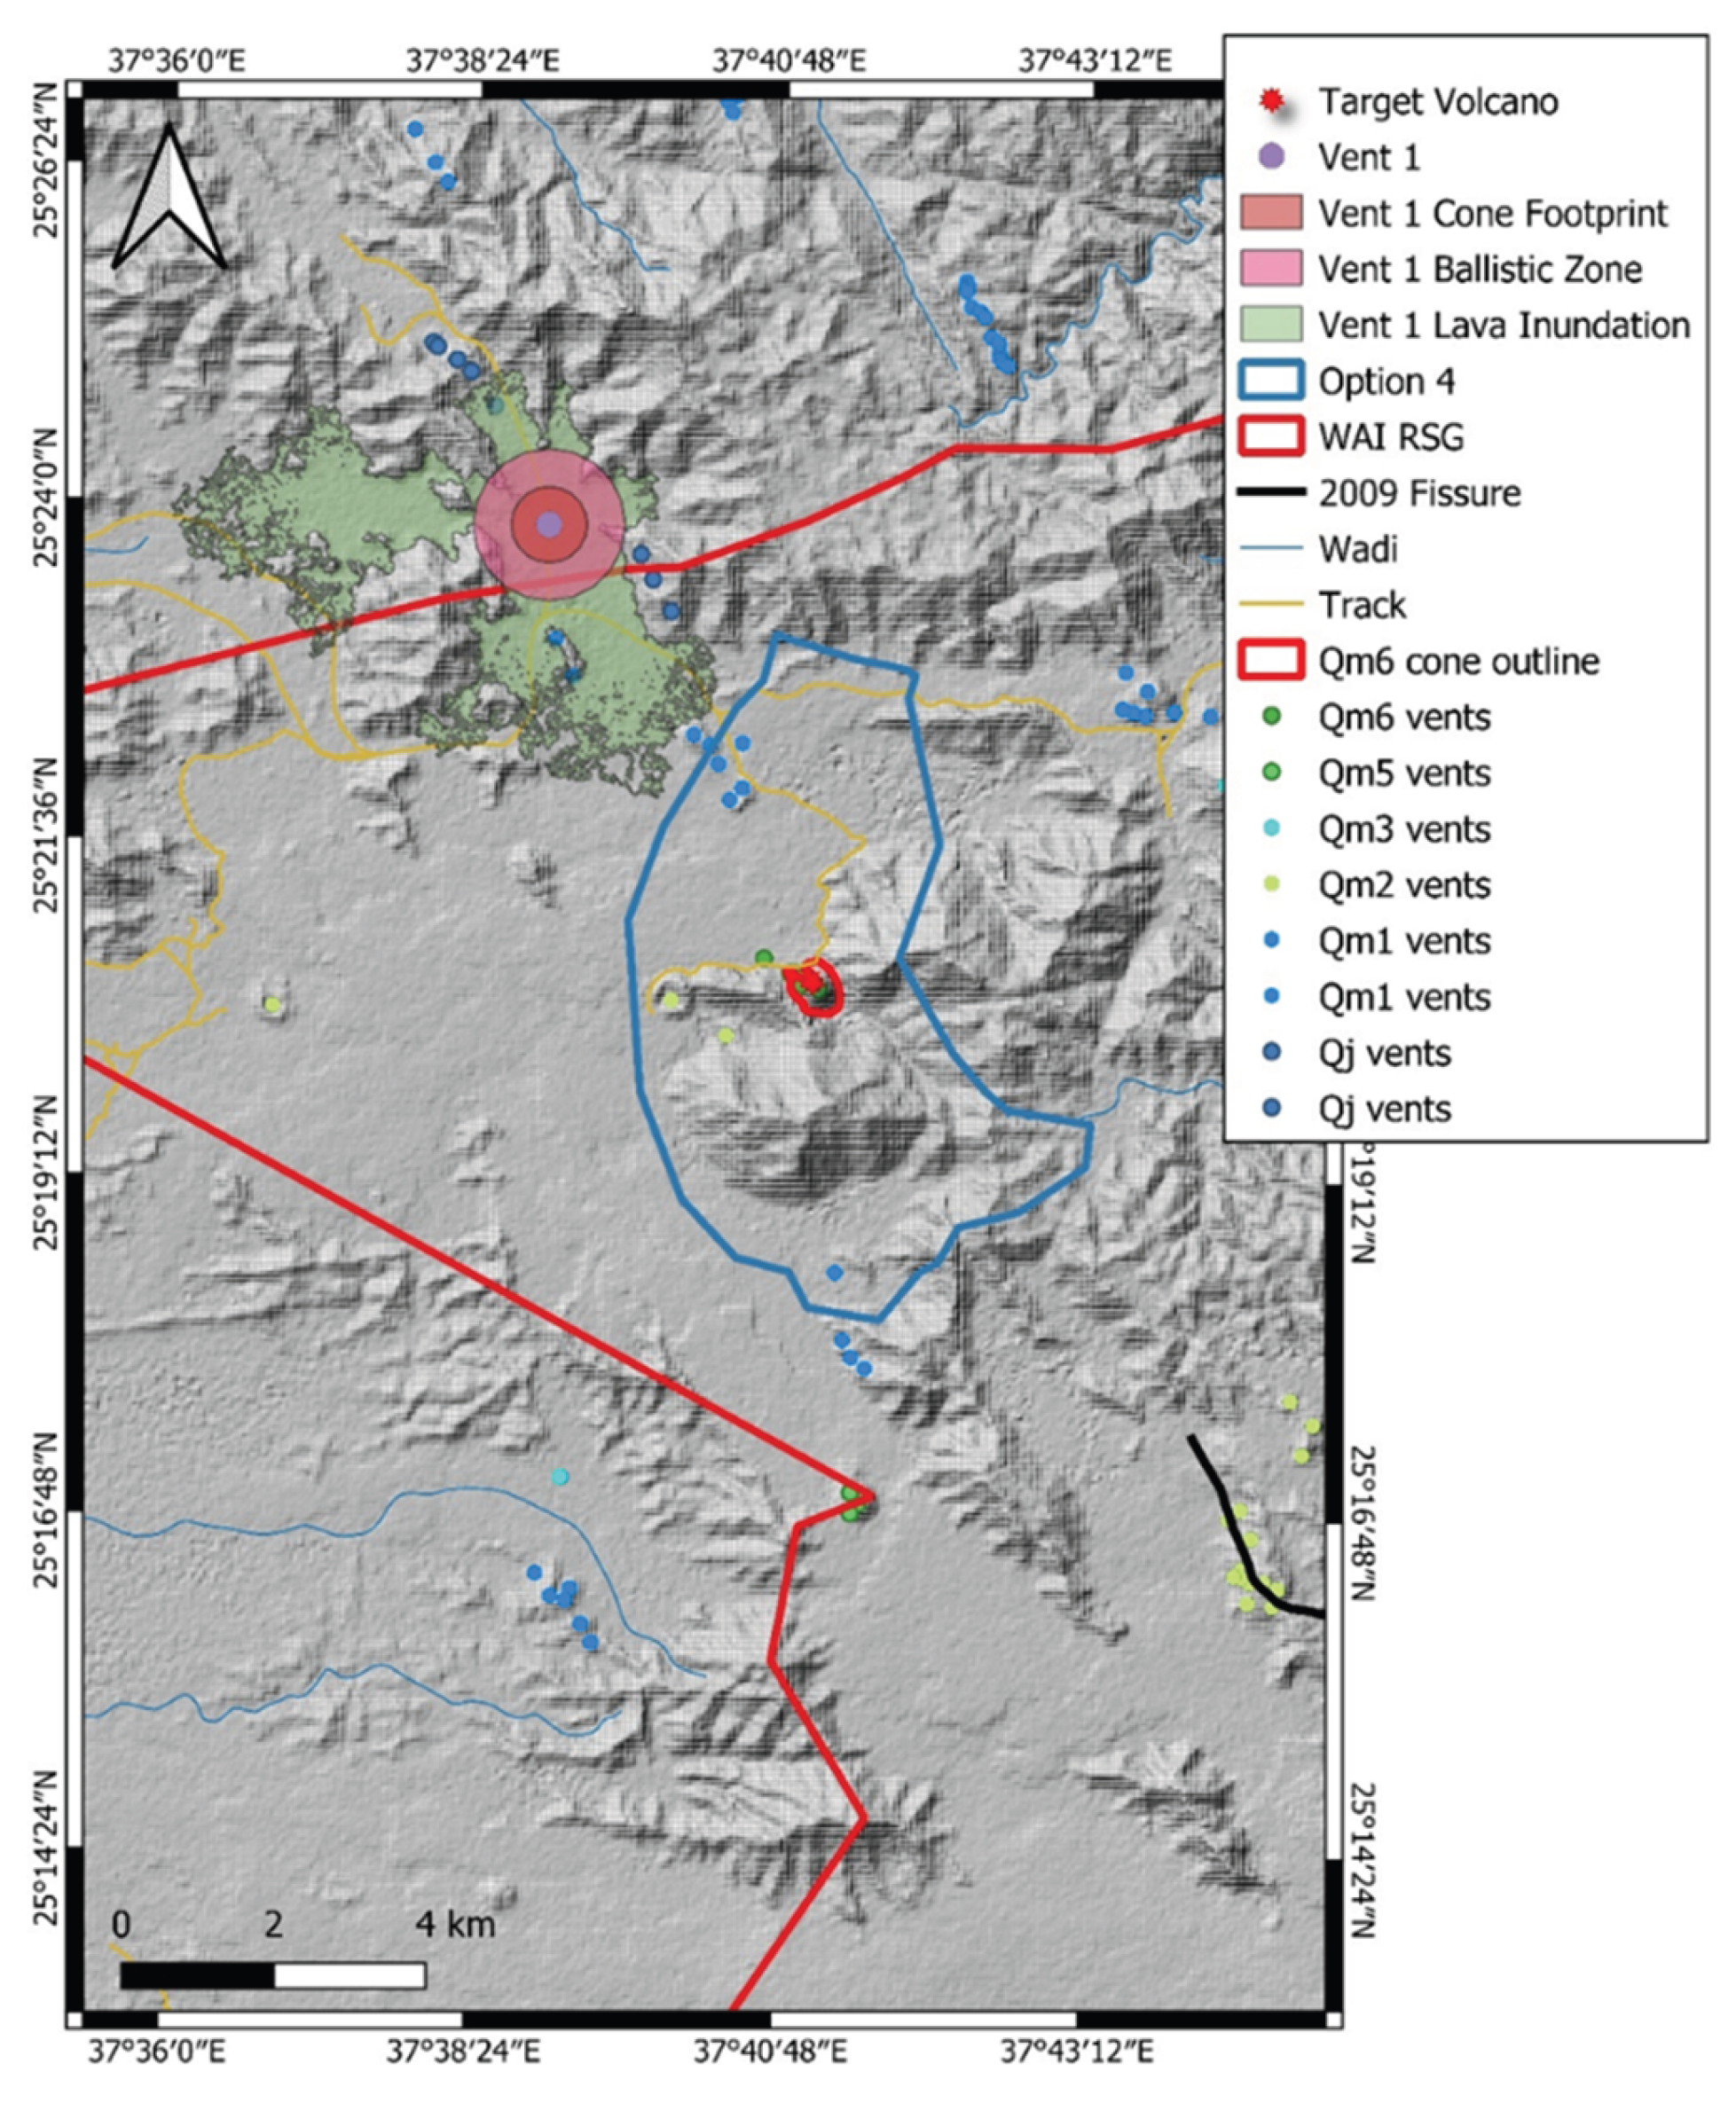
Figure 14.
Eruption scenario with the vent opening adjacent to the Target Volcano. Note that approximately 30% of the surface area of the Option 4 region will be directly affected.
Figure 14.
Eruption scenario with the vent opening adjacent to the Target Volcano. Note that approximately 30% of the surface area of the Option 4 region will be directly affected.
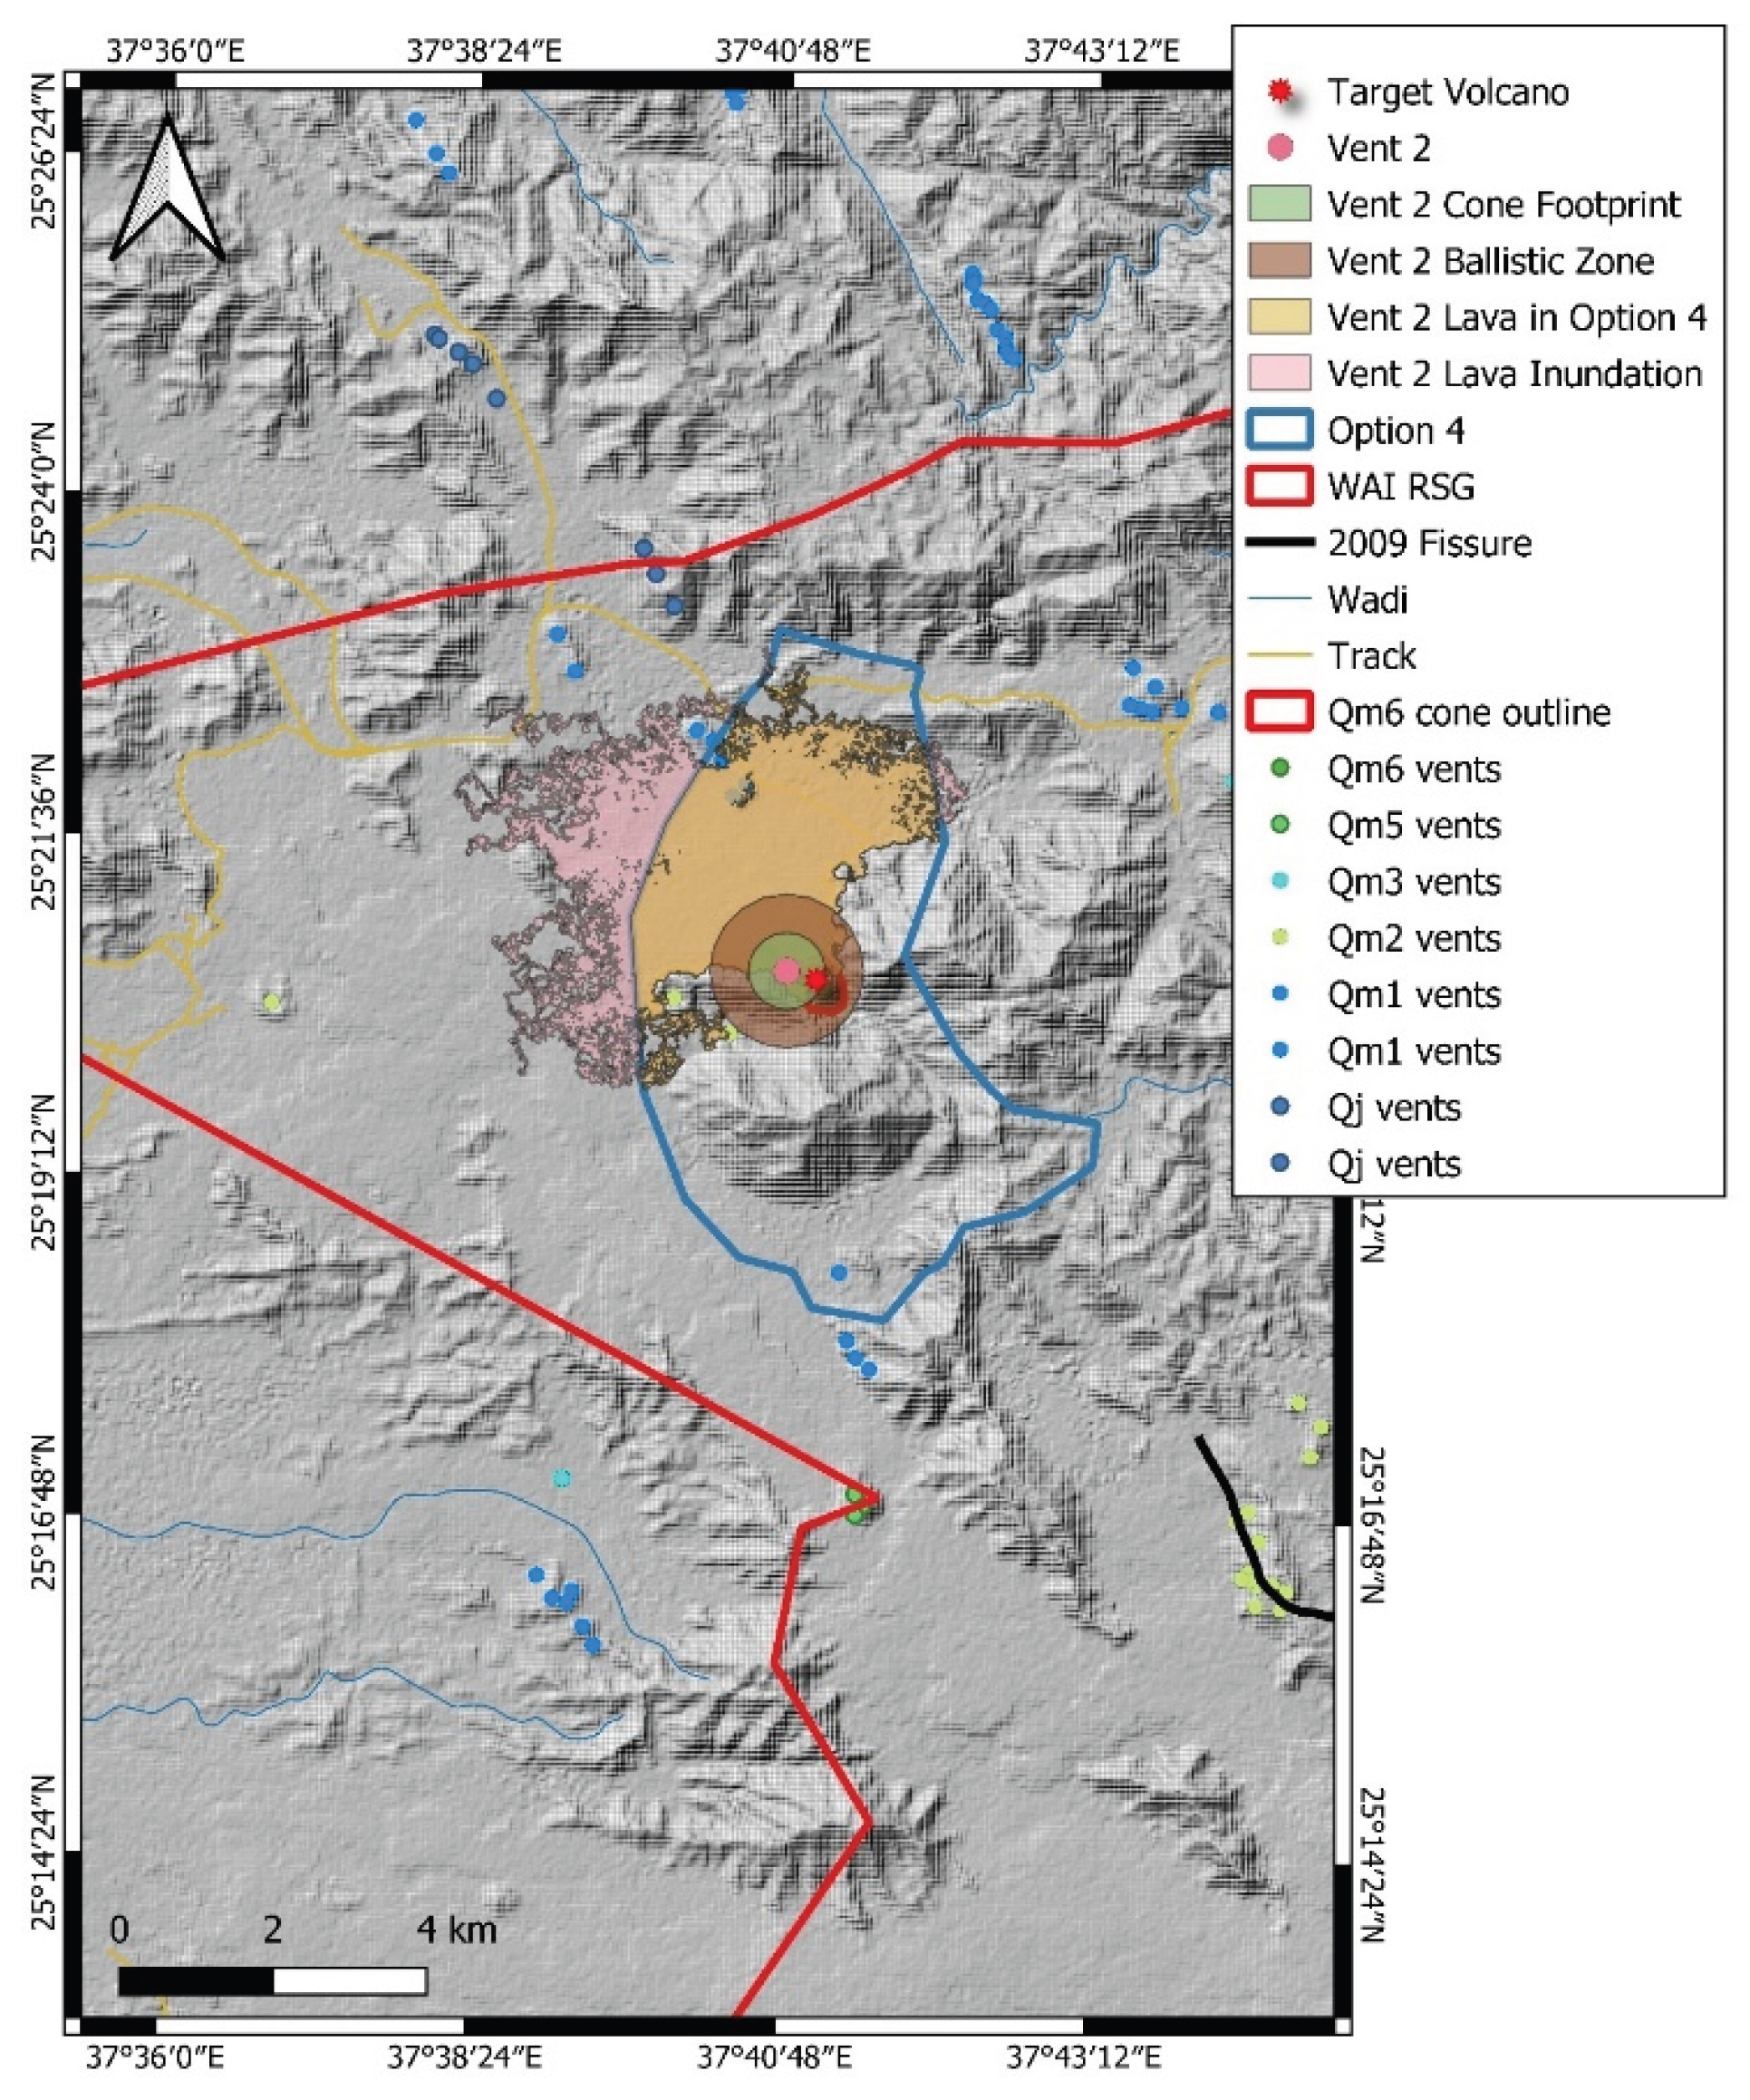
Figure 15.
Vent opening simulation in the SW part of the Option 4 area.
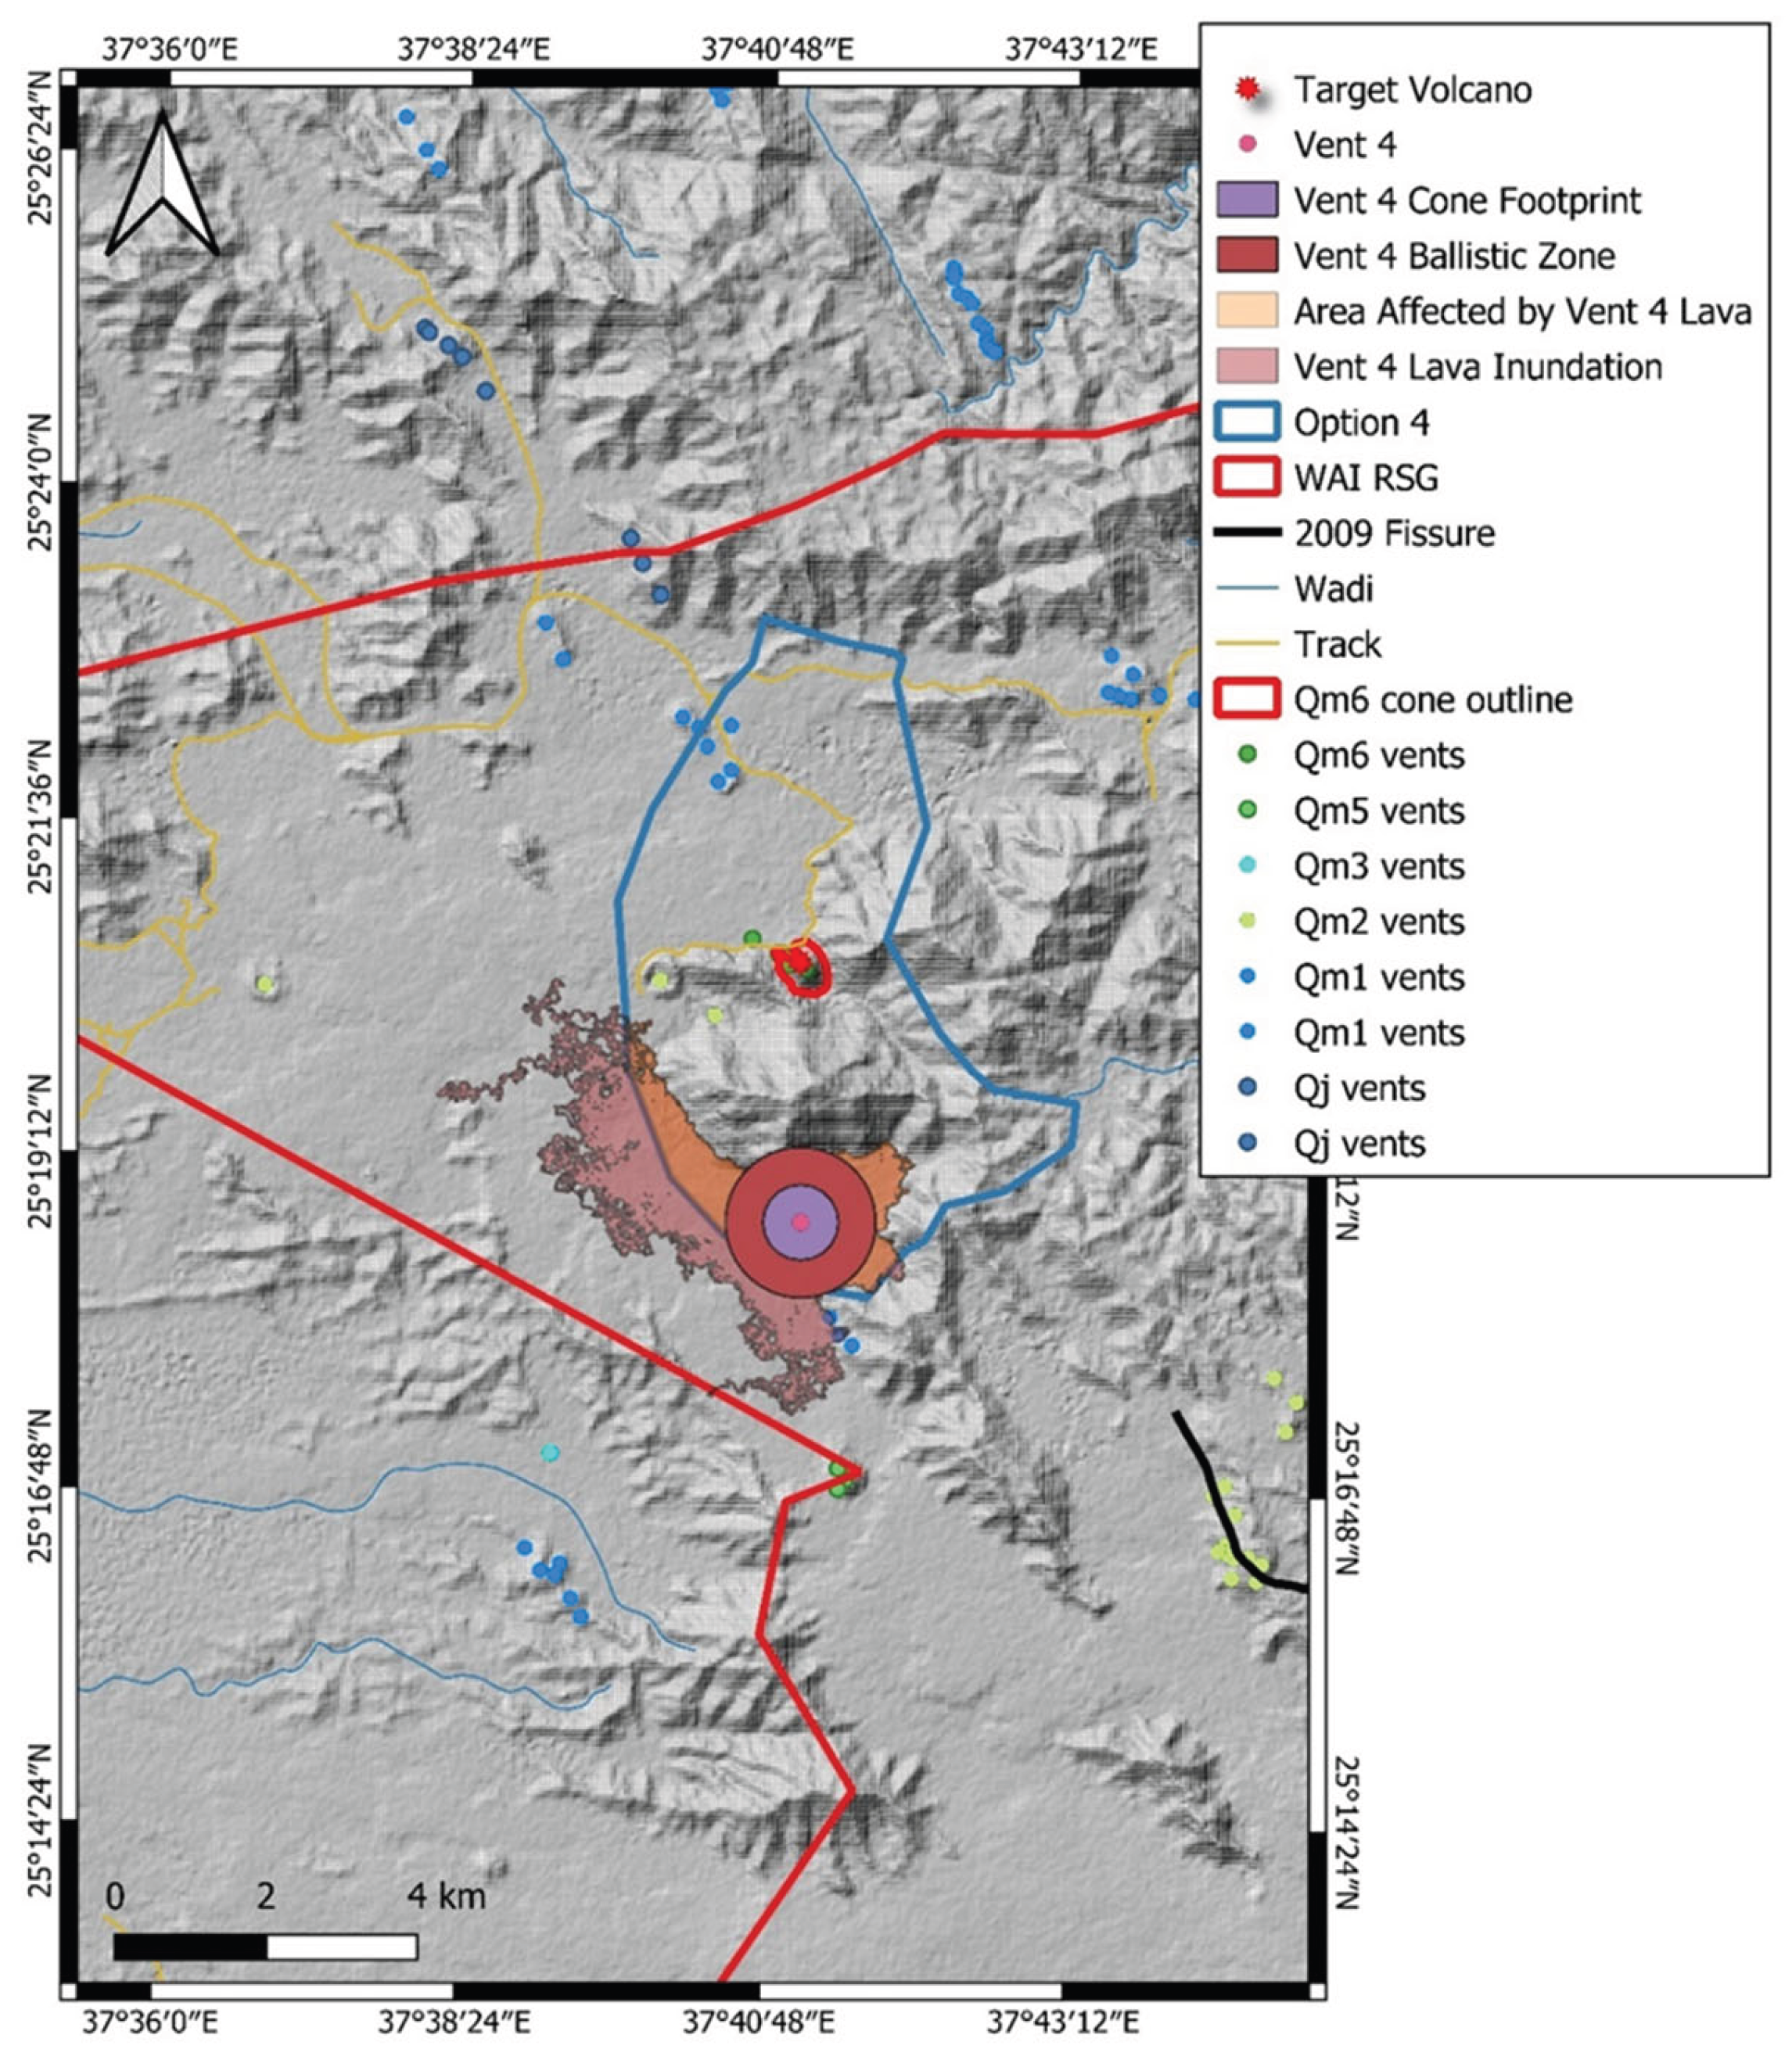
Figure 16.
Fissure 1 simulation and hazard impact characterization. Note that this situation would not directly affect the Option 4 area, but would cut off the development site via the access road to the west, leaving only escape routes toward the east that would take a considerable amount of time to reach remote villages.
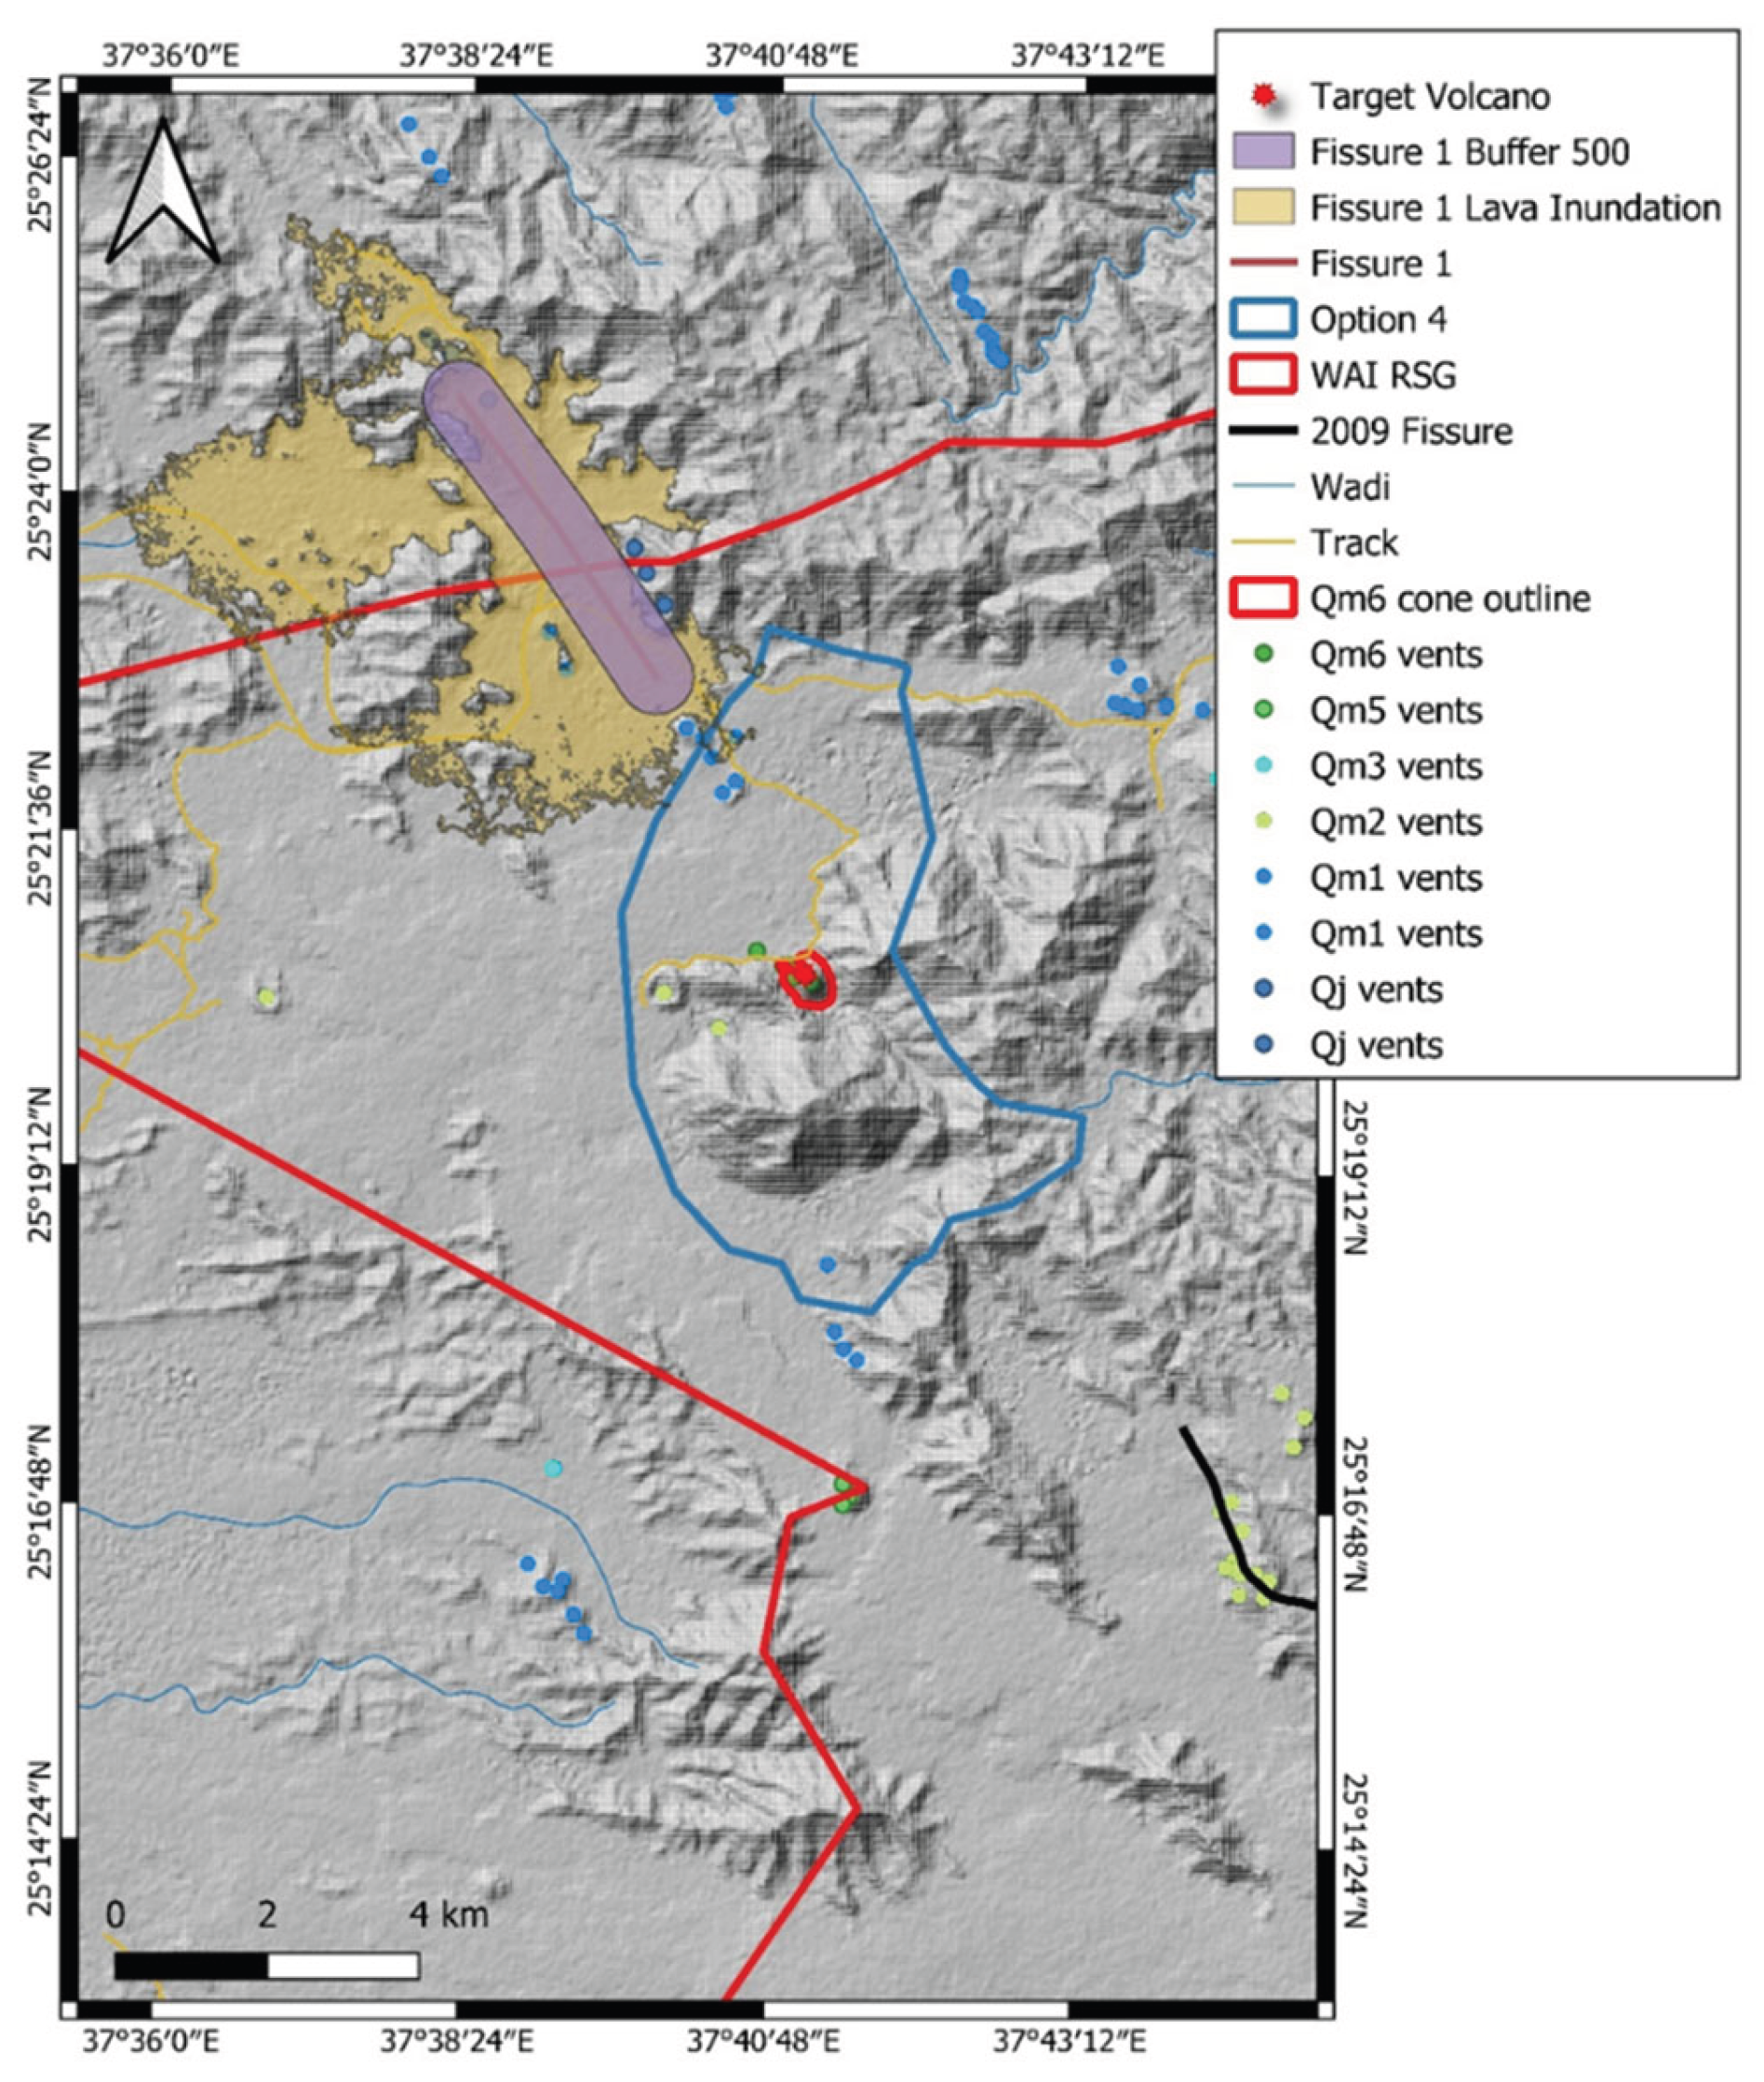
Figure 17.
Fissure 2 simulation involves a fissure opening approximately 2 km long, with the same strike direction as the vent alignments identified near the Target Volcano.
Figure 17.
Fissure 2 simulation involves a fissure opening approximately 2 km long, with the same strike direction as the vent alignments identified near the Target Volcano.
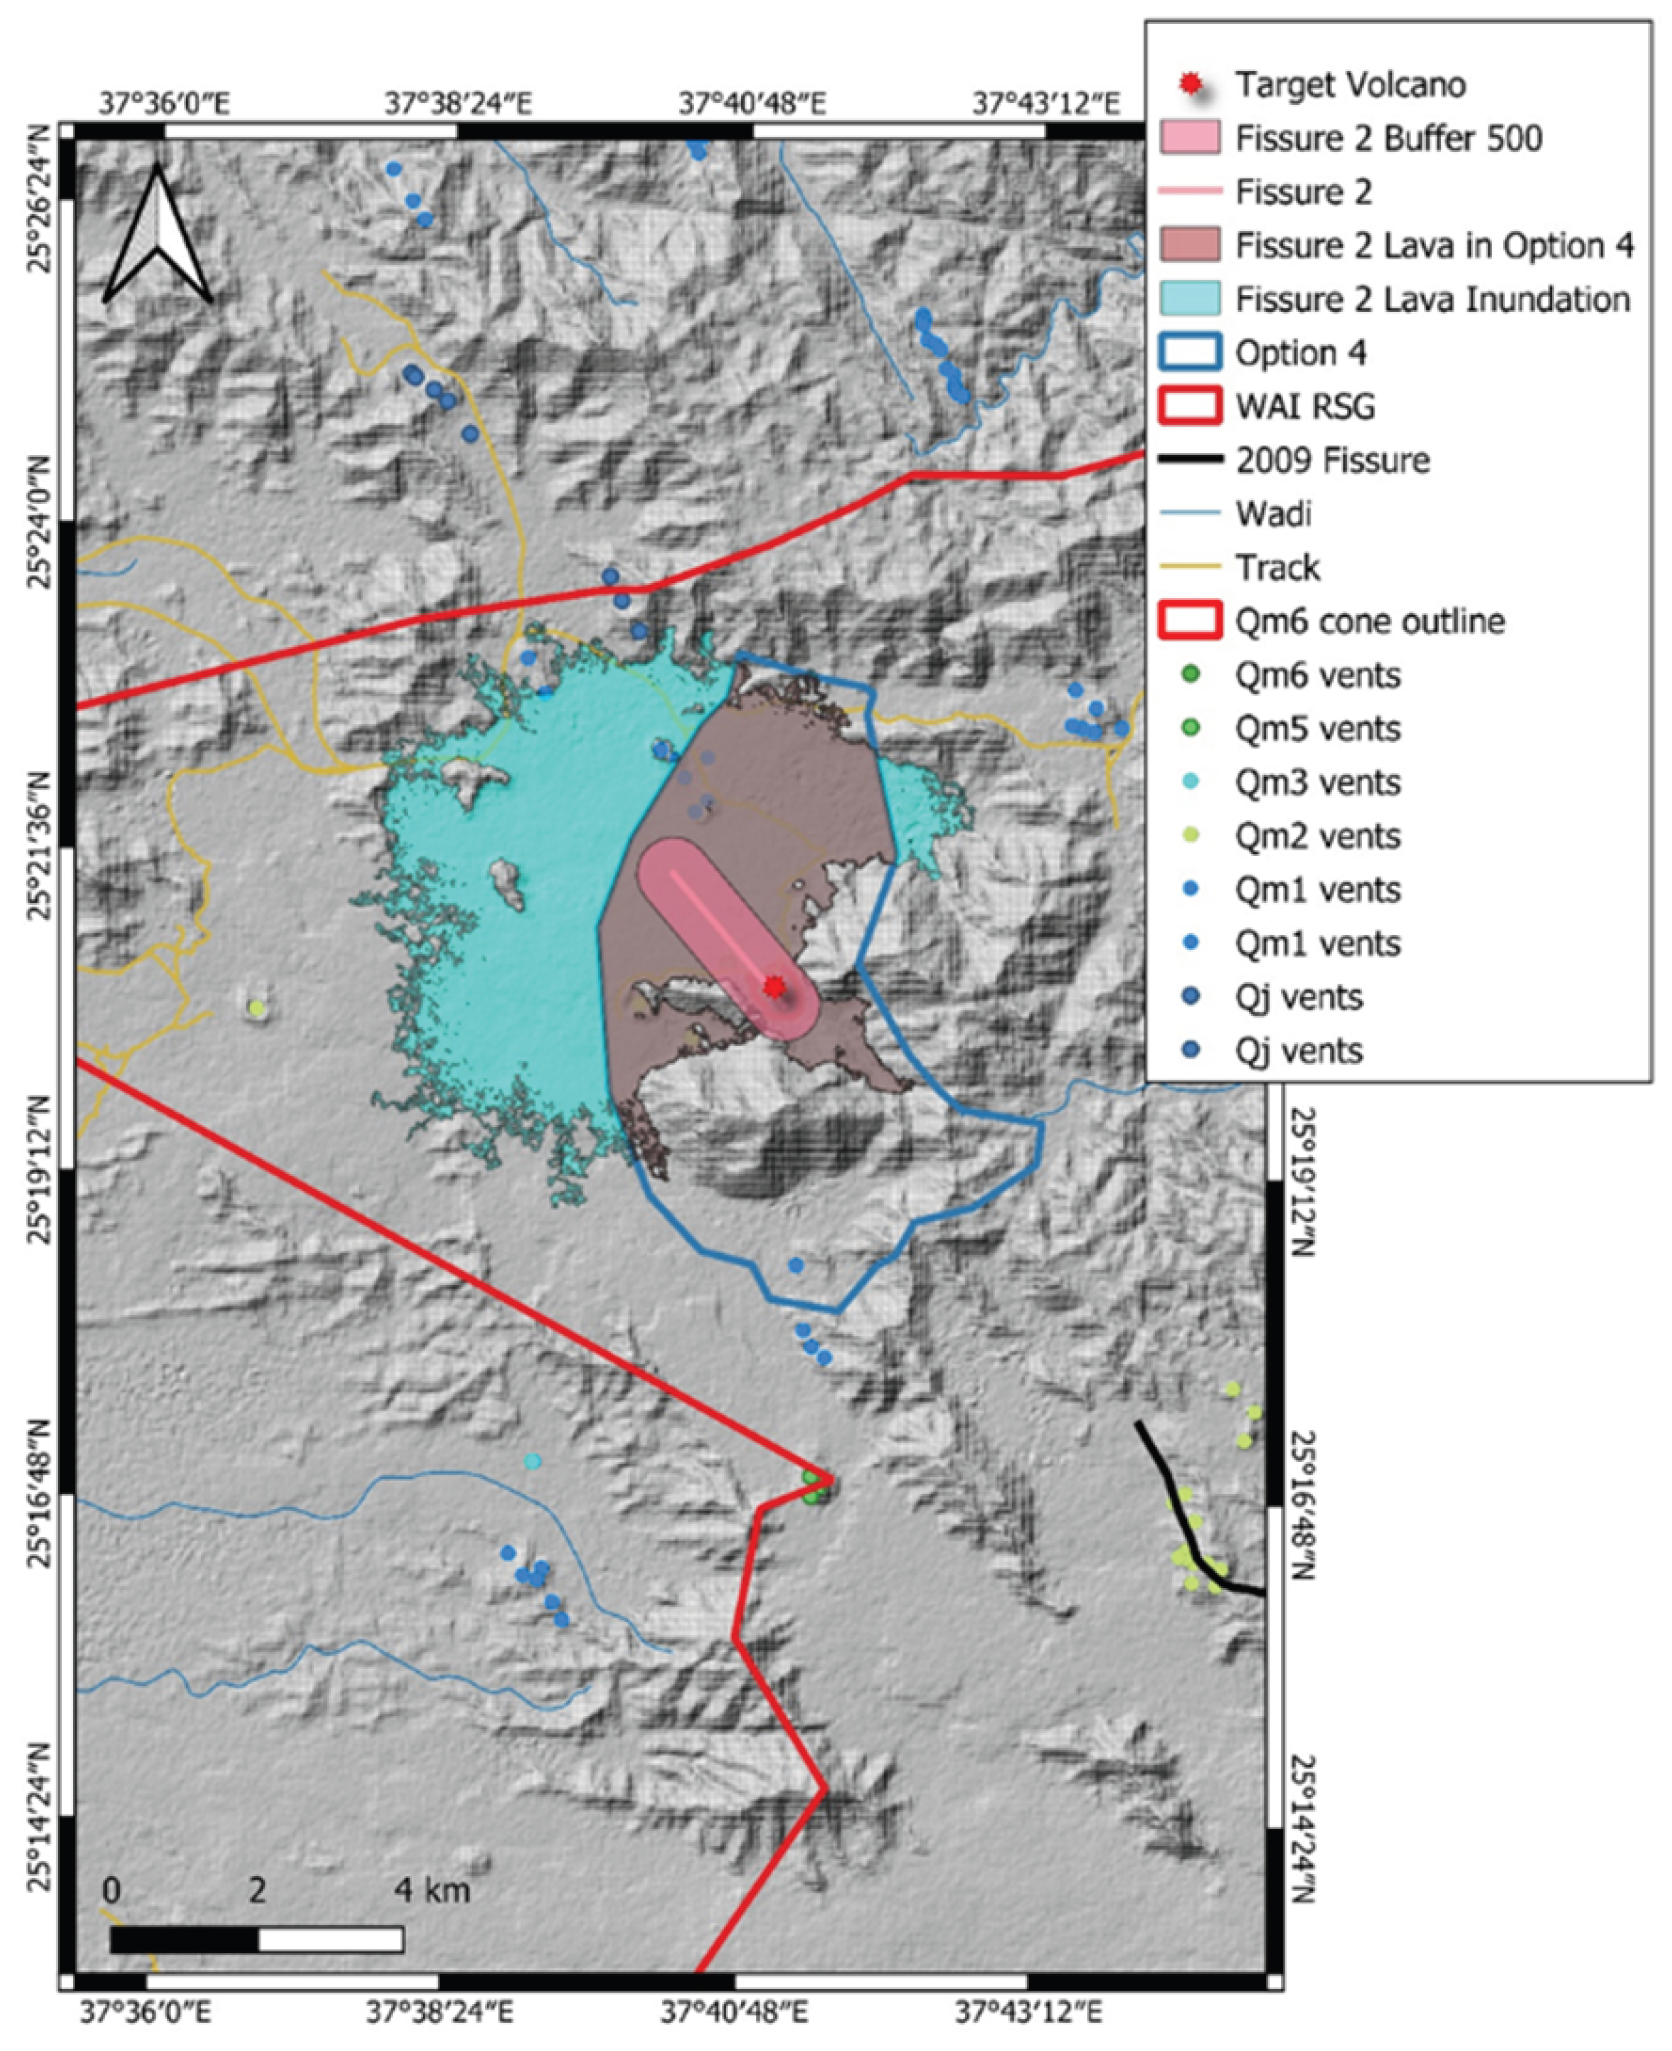
Figure 18.
An extensive fissure eruption along the SW edge of the Option 4 area could cause significant destruction and landscape changes, impacting about 27% of the area. The lava probably won't reach the development site, but its secondary effects could lead to abandoning the site. In this case, the access road would likely stay open.
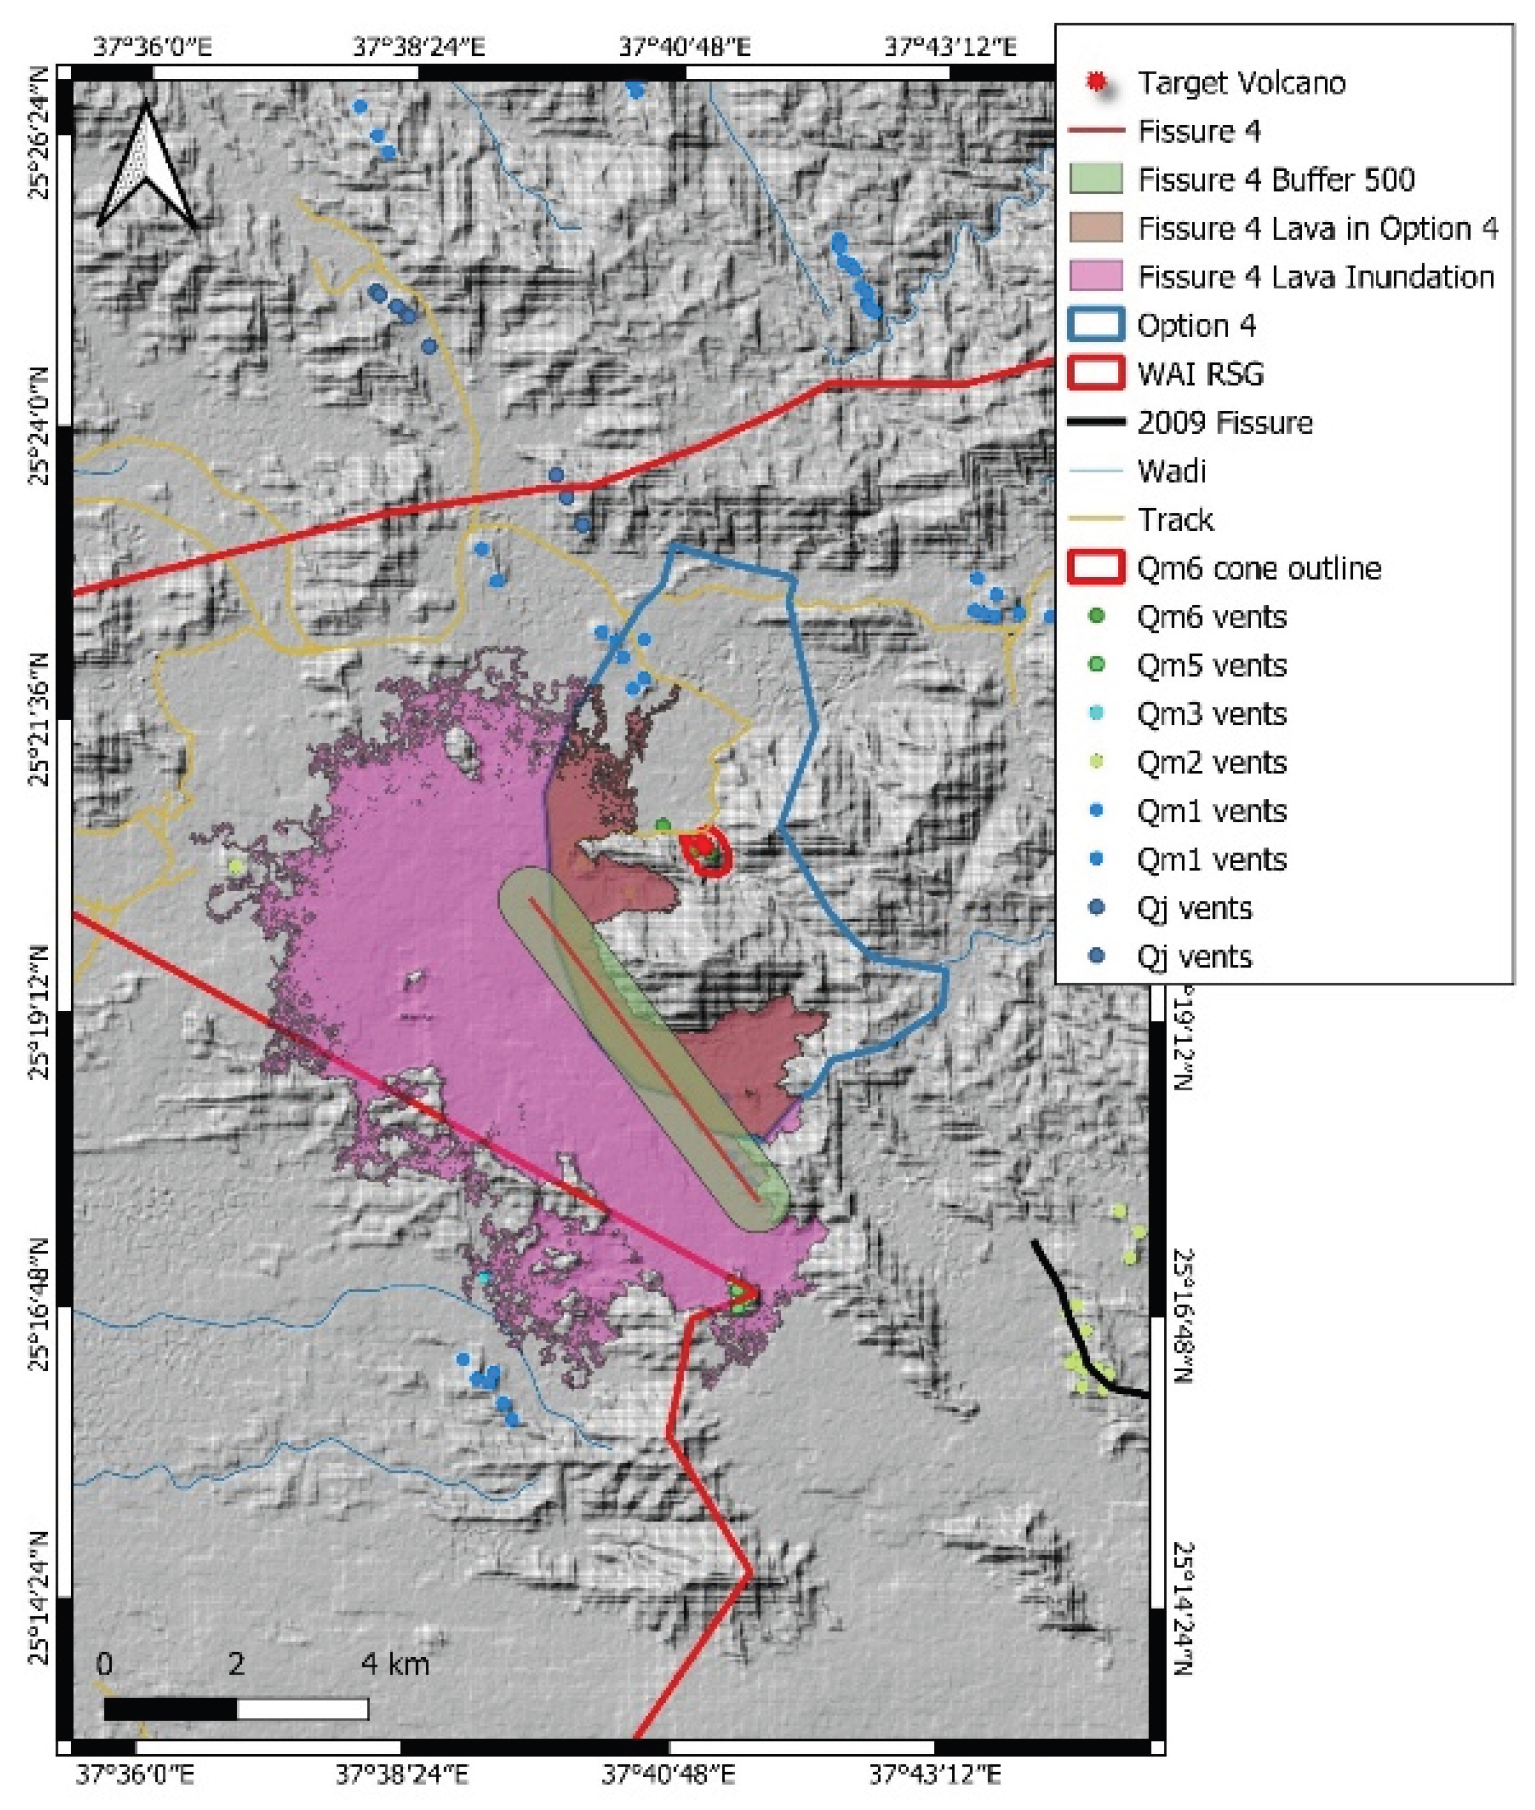
Figure 19.
Total lava inundation exclusion zone map shows the areas where the maximum expected lava flow inundation would occur. This map was created by combining three lava inundation simulations along three long fissures (marked yellow lines) that follow the same structural pattern as the overall area. This pattern aligns with the vent alignment (various vents are shown with color codes indicating their relative stratigraphic age) and the recorded seismicity locations (marked by yellow dots). In areas marked in red, lava flow impact is expected and could likely cause significant property damage if an eruption occurs.
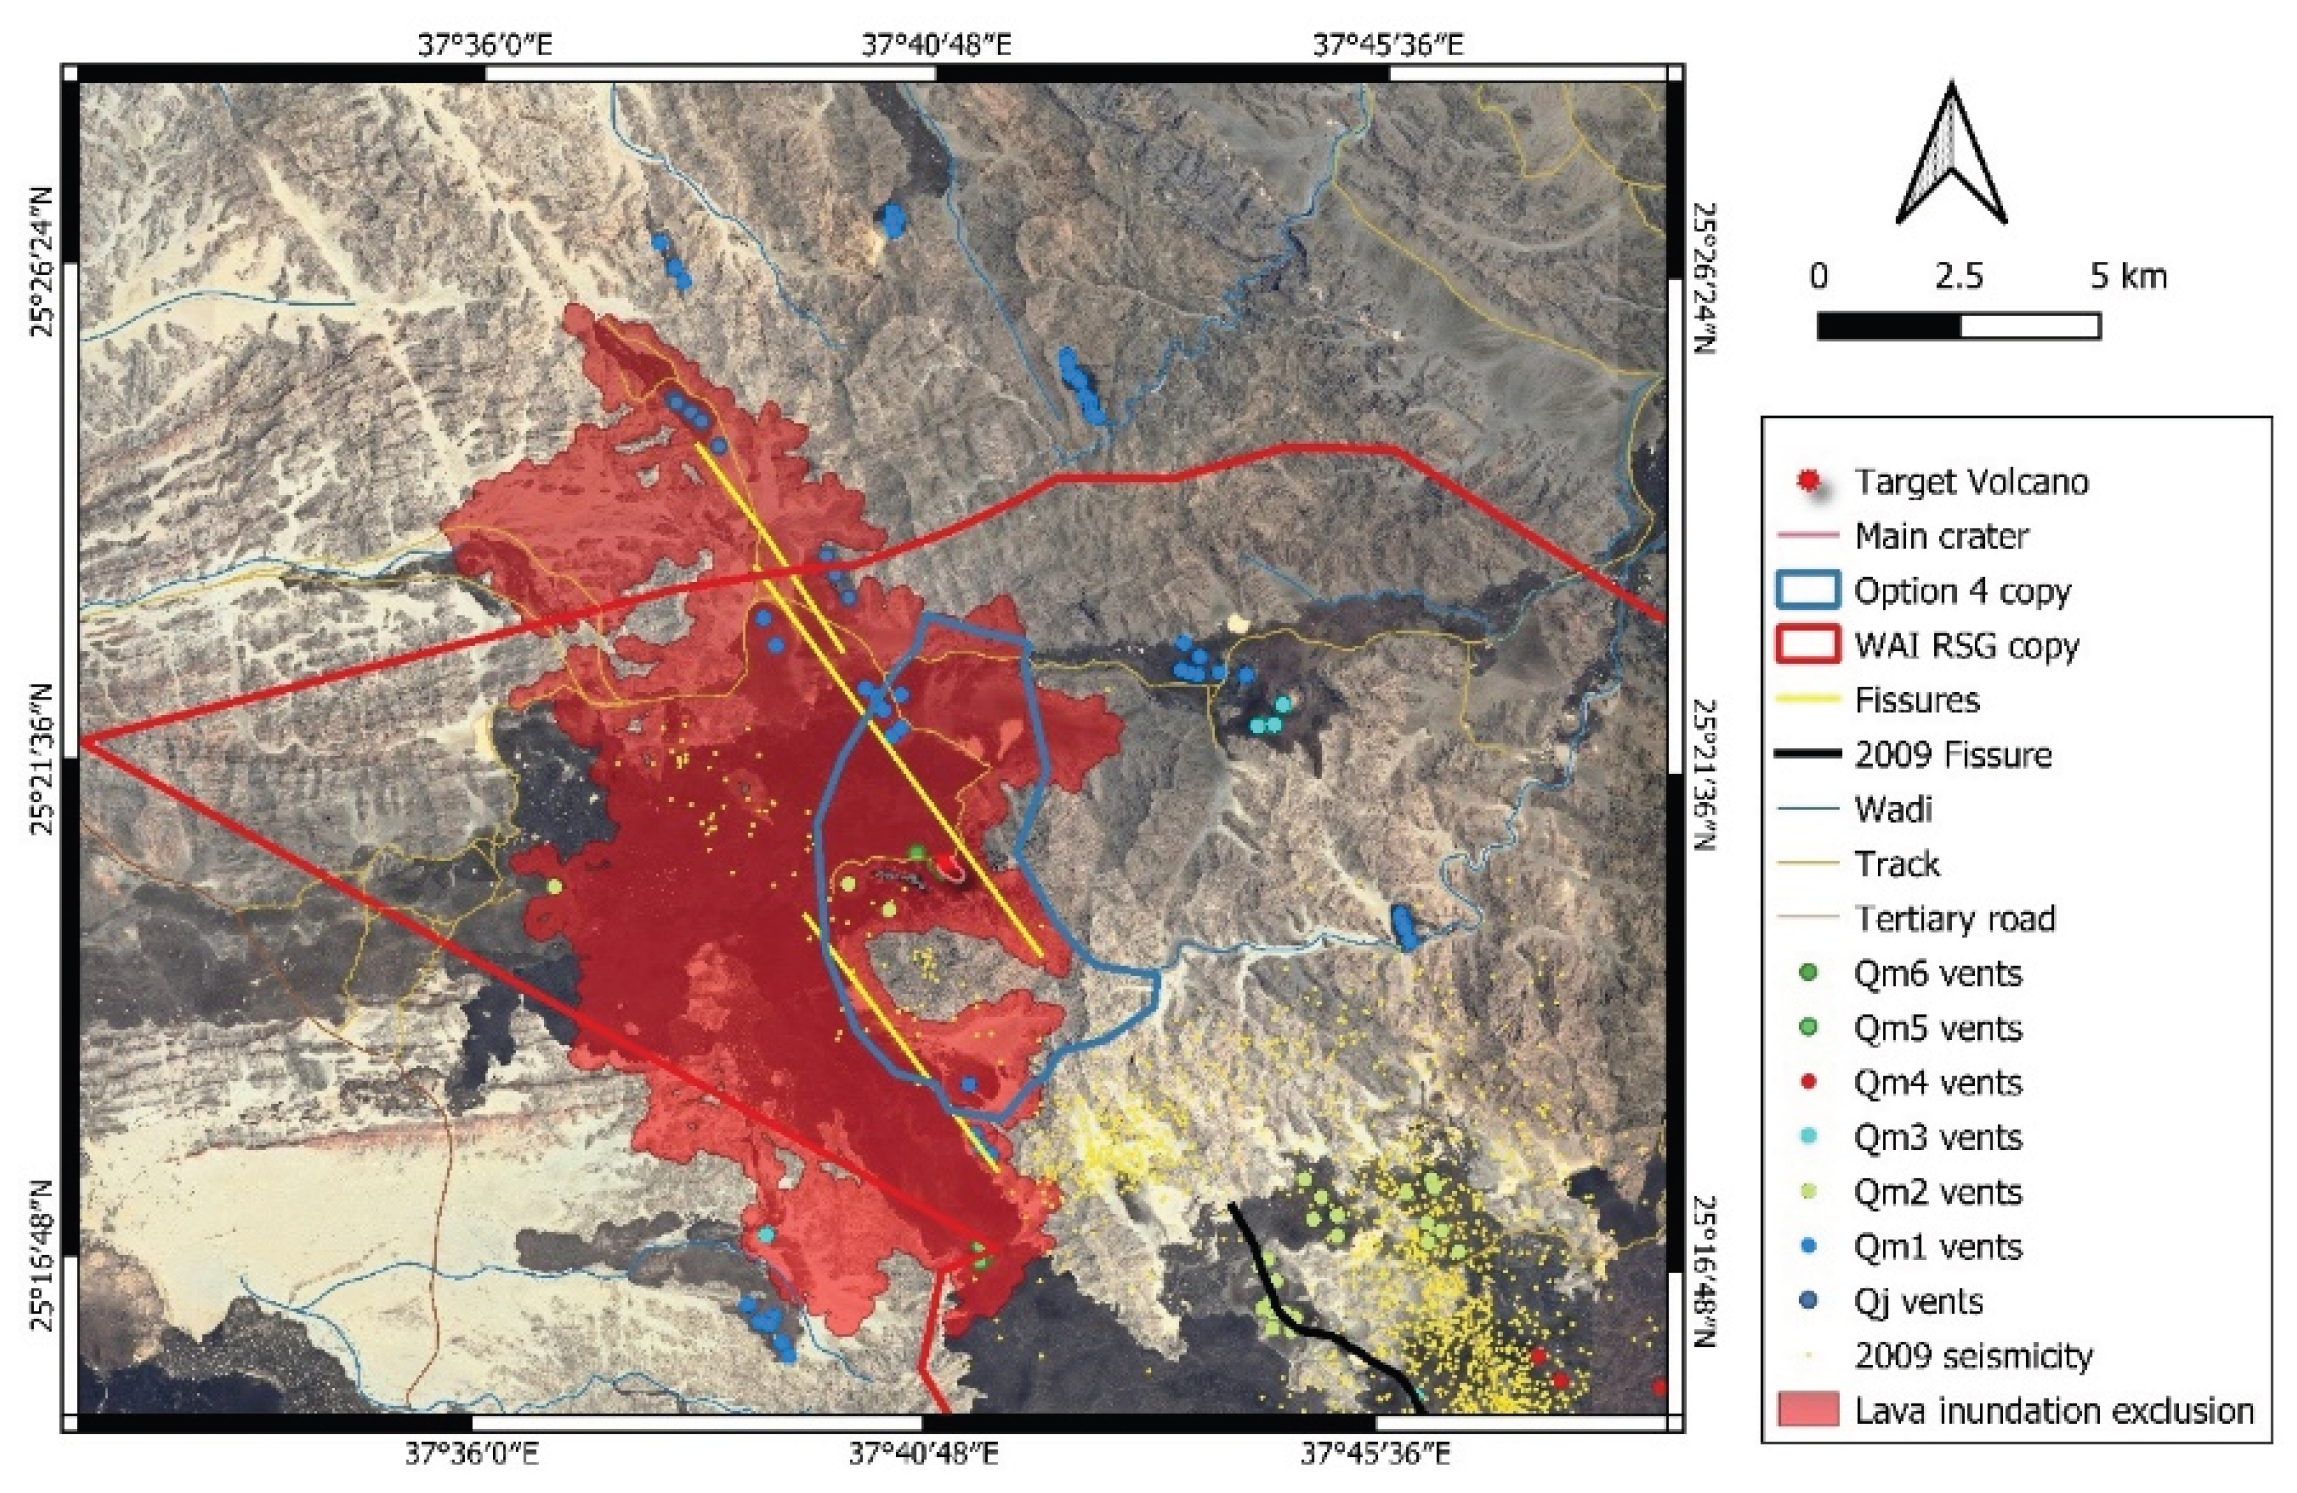
Figure 20.
Lava flow mappings of the region revealed three distinct patterns, underscoring the challenges of precise lava flow mapping when a large volume of lava forms complex lava fields. The map shows the interim 1 to 100k scale geology map, with lithostratigraphic units ranked by lava flows from Qj, Qm1 to 6. The outline of the flow has been revised, separating the youngest flow field into different zones. The latest revision shows slightly different patterns in the western edge of the flow fronts.
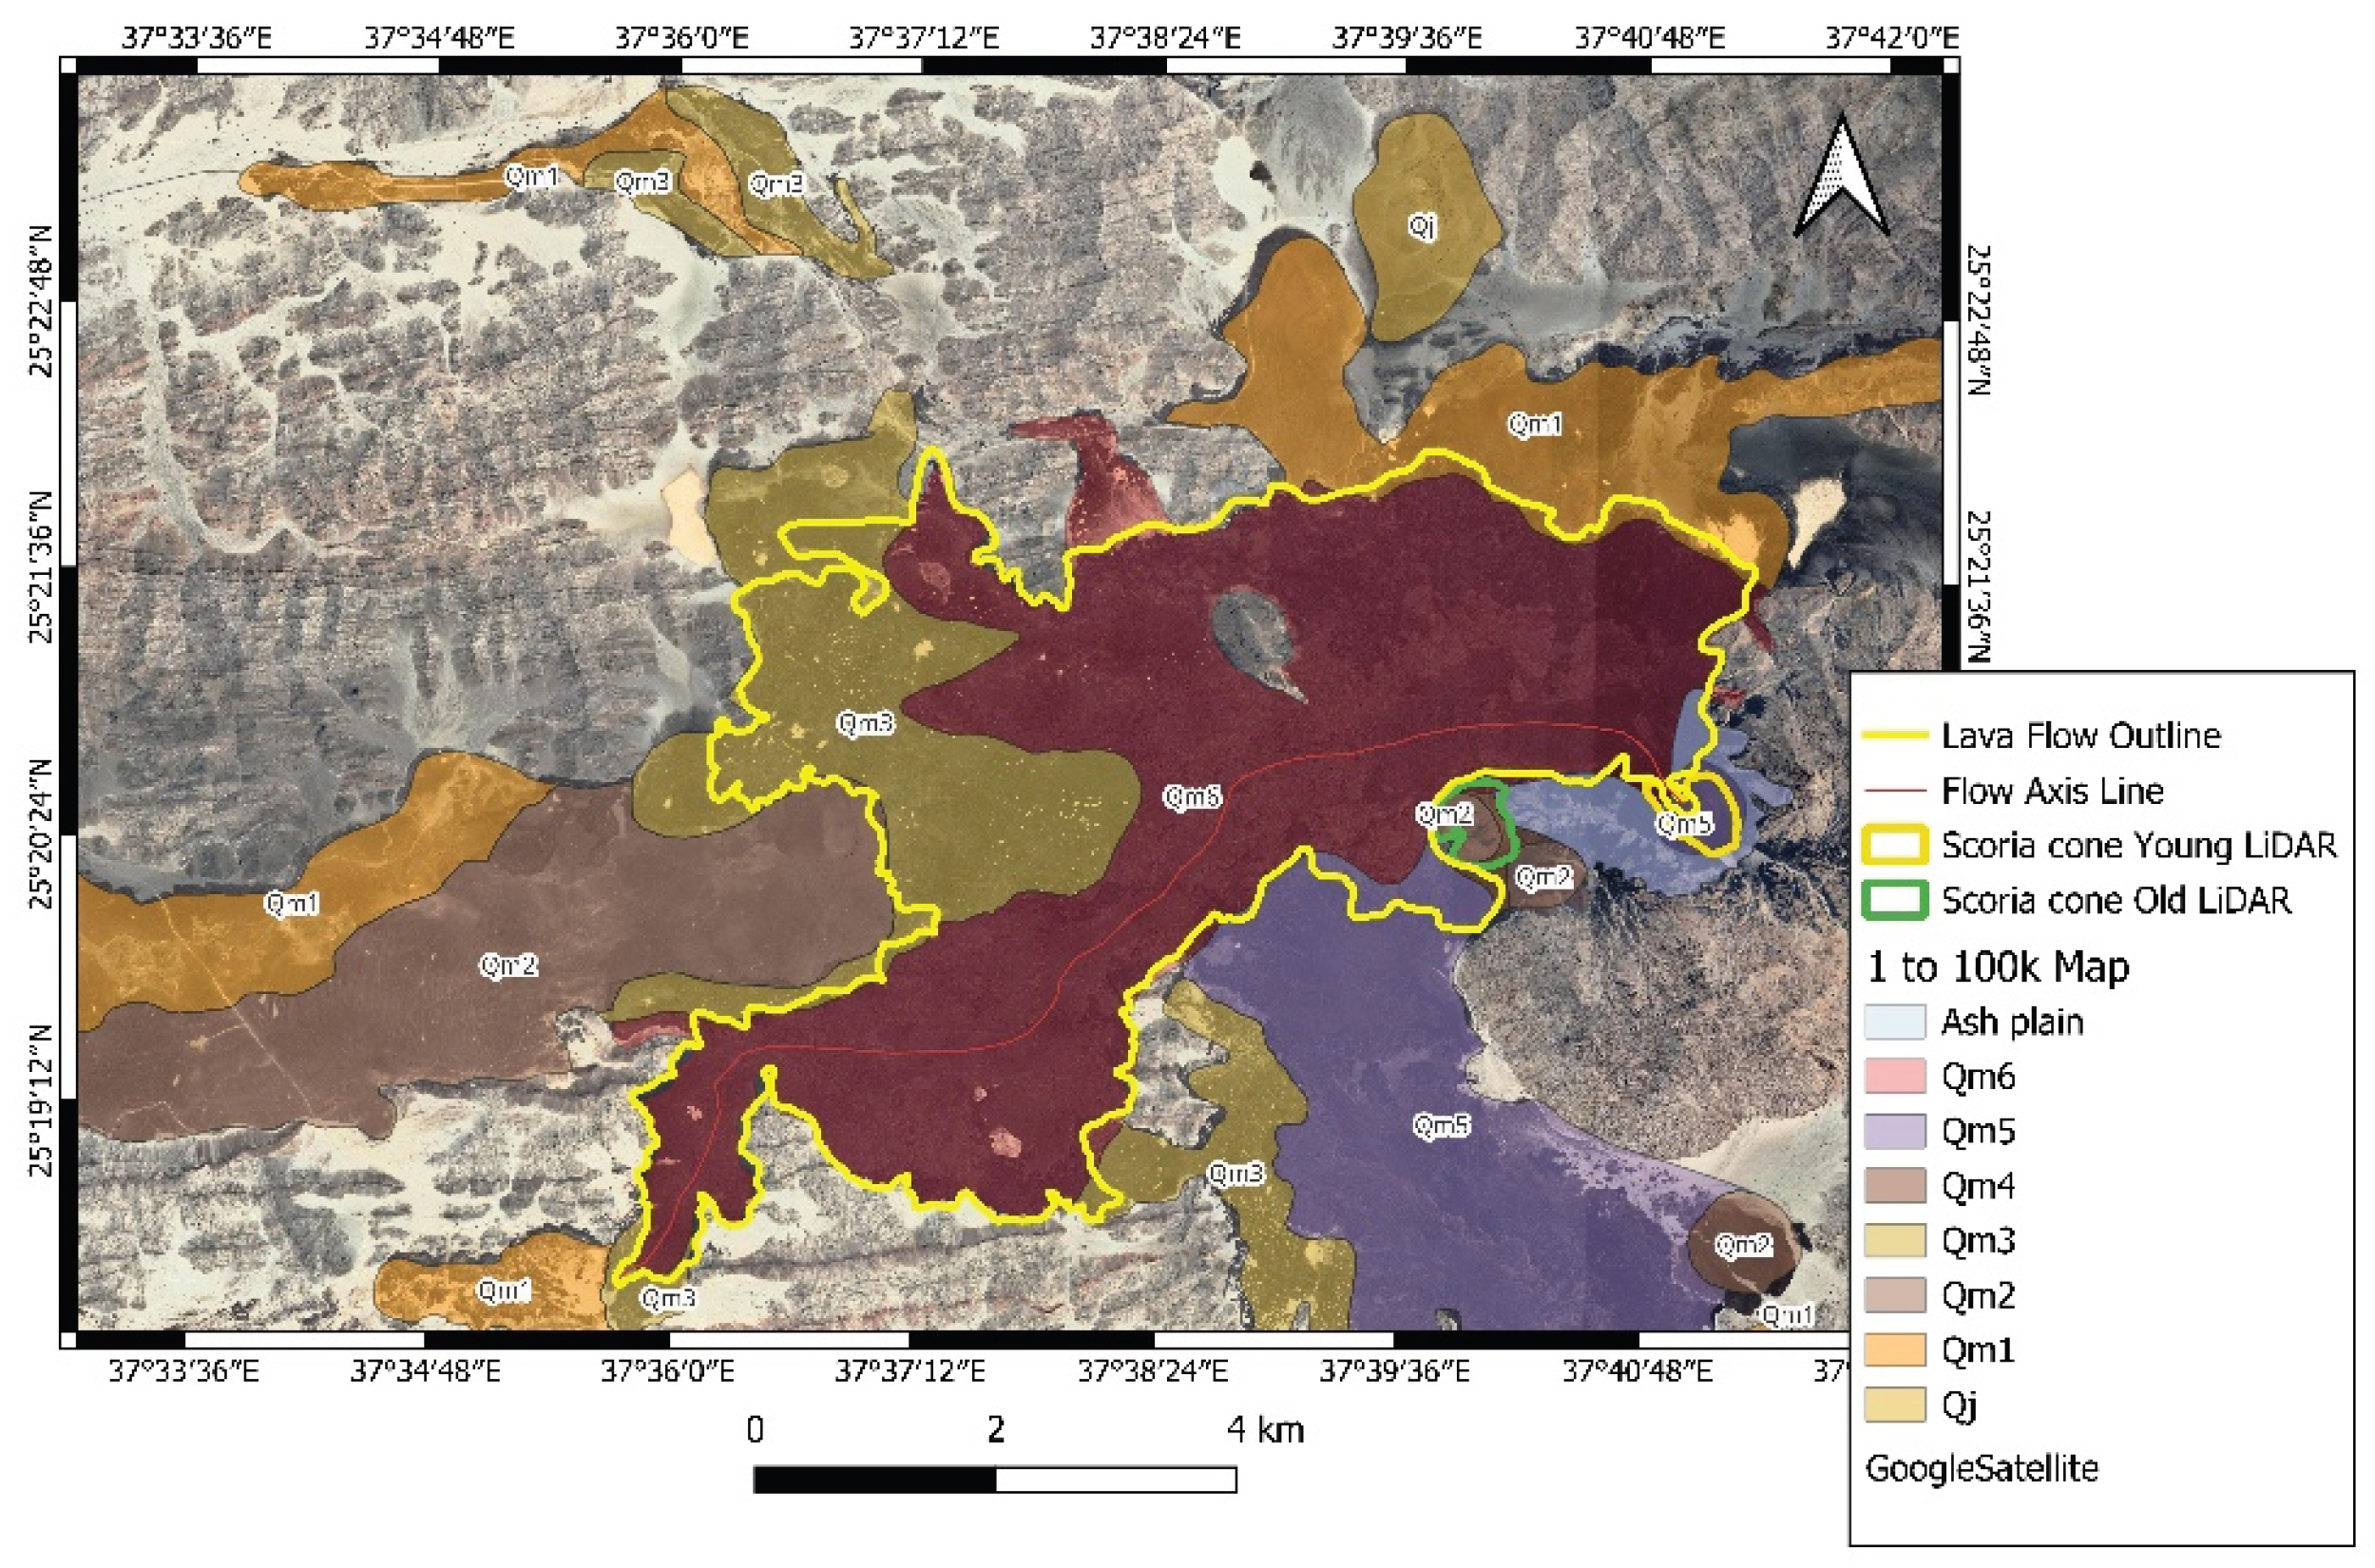
Figure 21.
One of the latest surveys distinguishes Main Flow, Main Flow Distal, Marginal Flow, and Youngest Flow within the young lava field. In this work, the volume calculations followed a slightly revised pattern where in a thin distal areas has been excluded due to the heavily erosion modified nature of the region where basaltic rocks forming dissected cover on the desert flow that can also be interpreted as some redistribution of rocks from thin lava flows hence we focused only those regions where the lava front is distinct and characteristic.
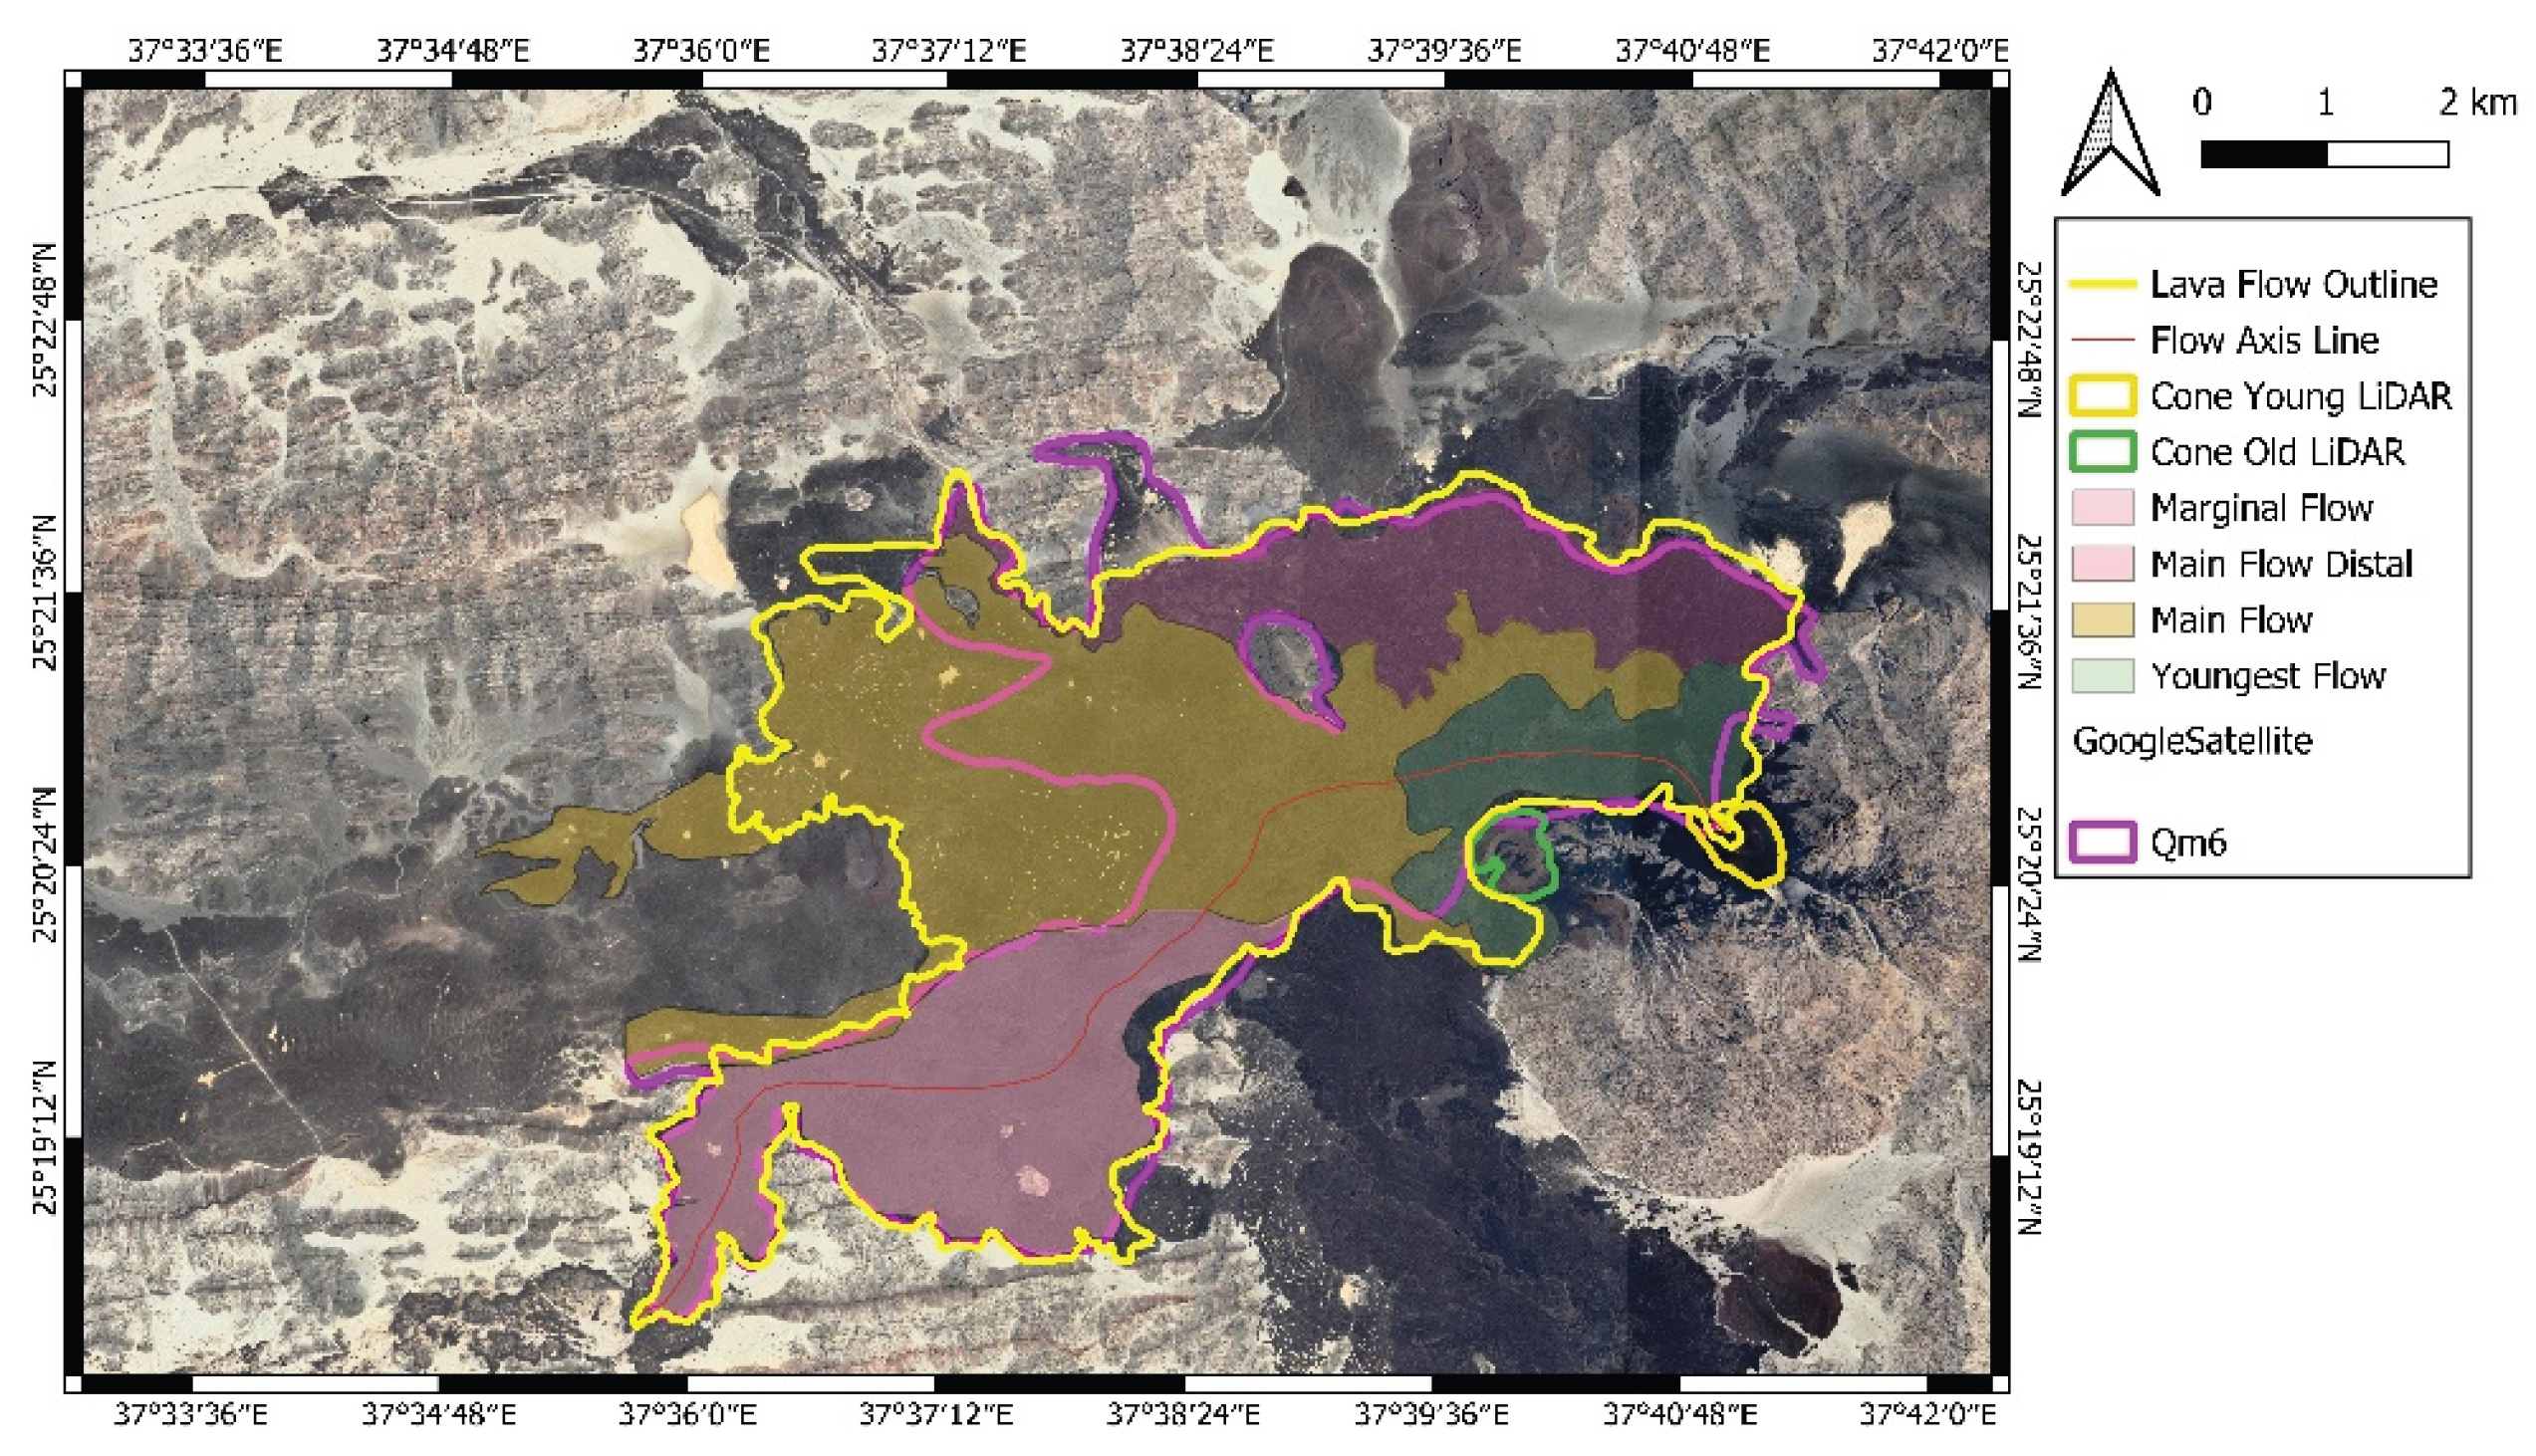
Figure 22.
While the resolution of the DEM is not superb, the Red Relief Image Map still shows a specific pattern of flow lobes and fronts that has been assigned as part of the youngest lava flow field in the study area.
Figure 22.
While the resolution of the DEM is not superb, the Red Relief Image Map still shows a specific pattern of flow lobes and fronts that has been assigned as part of the youngest lava flow field in the study area.
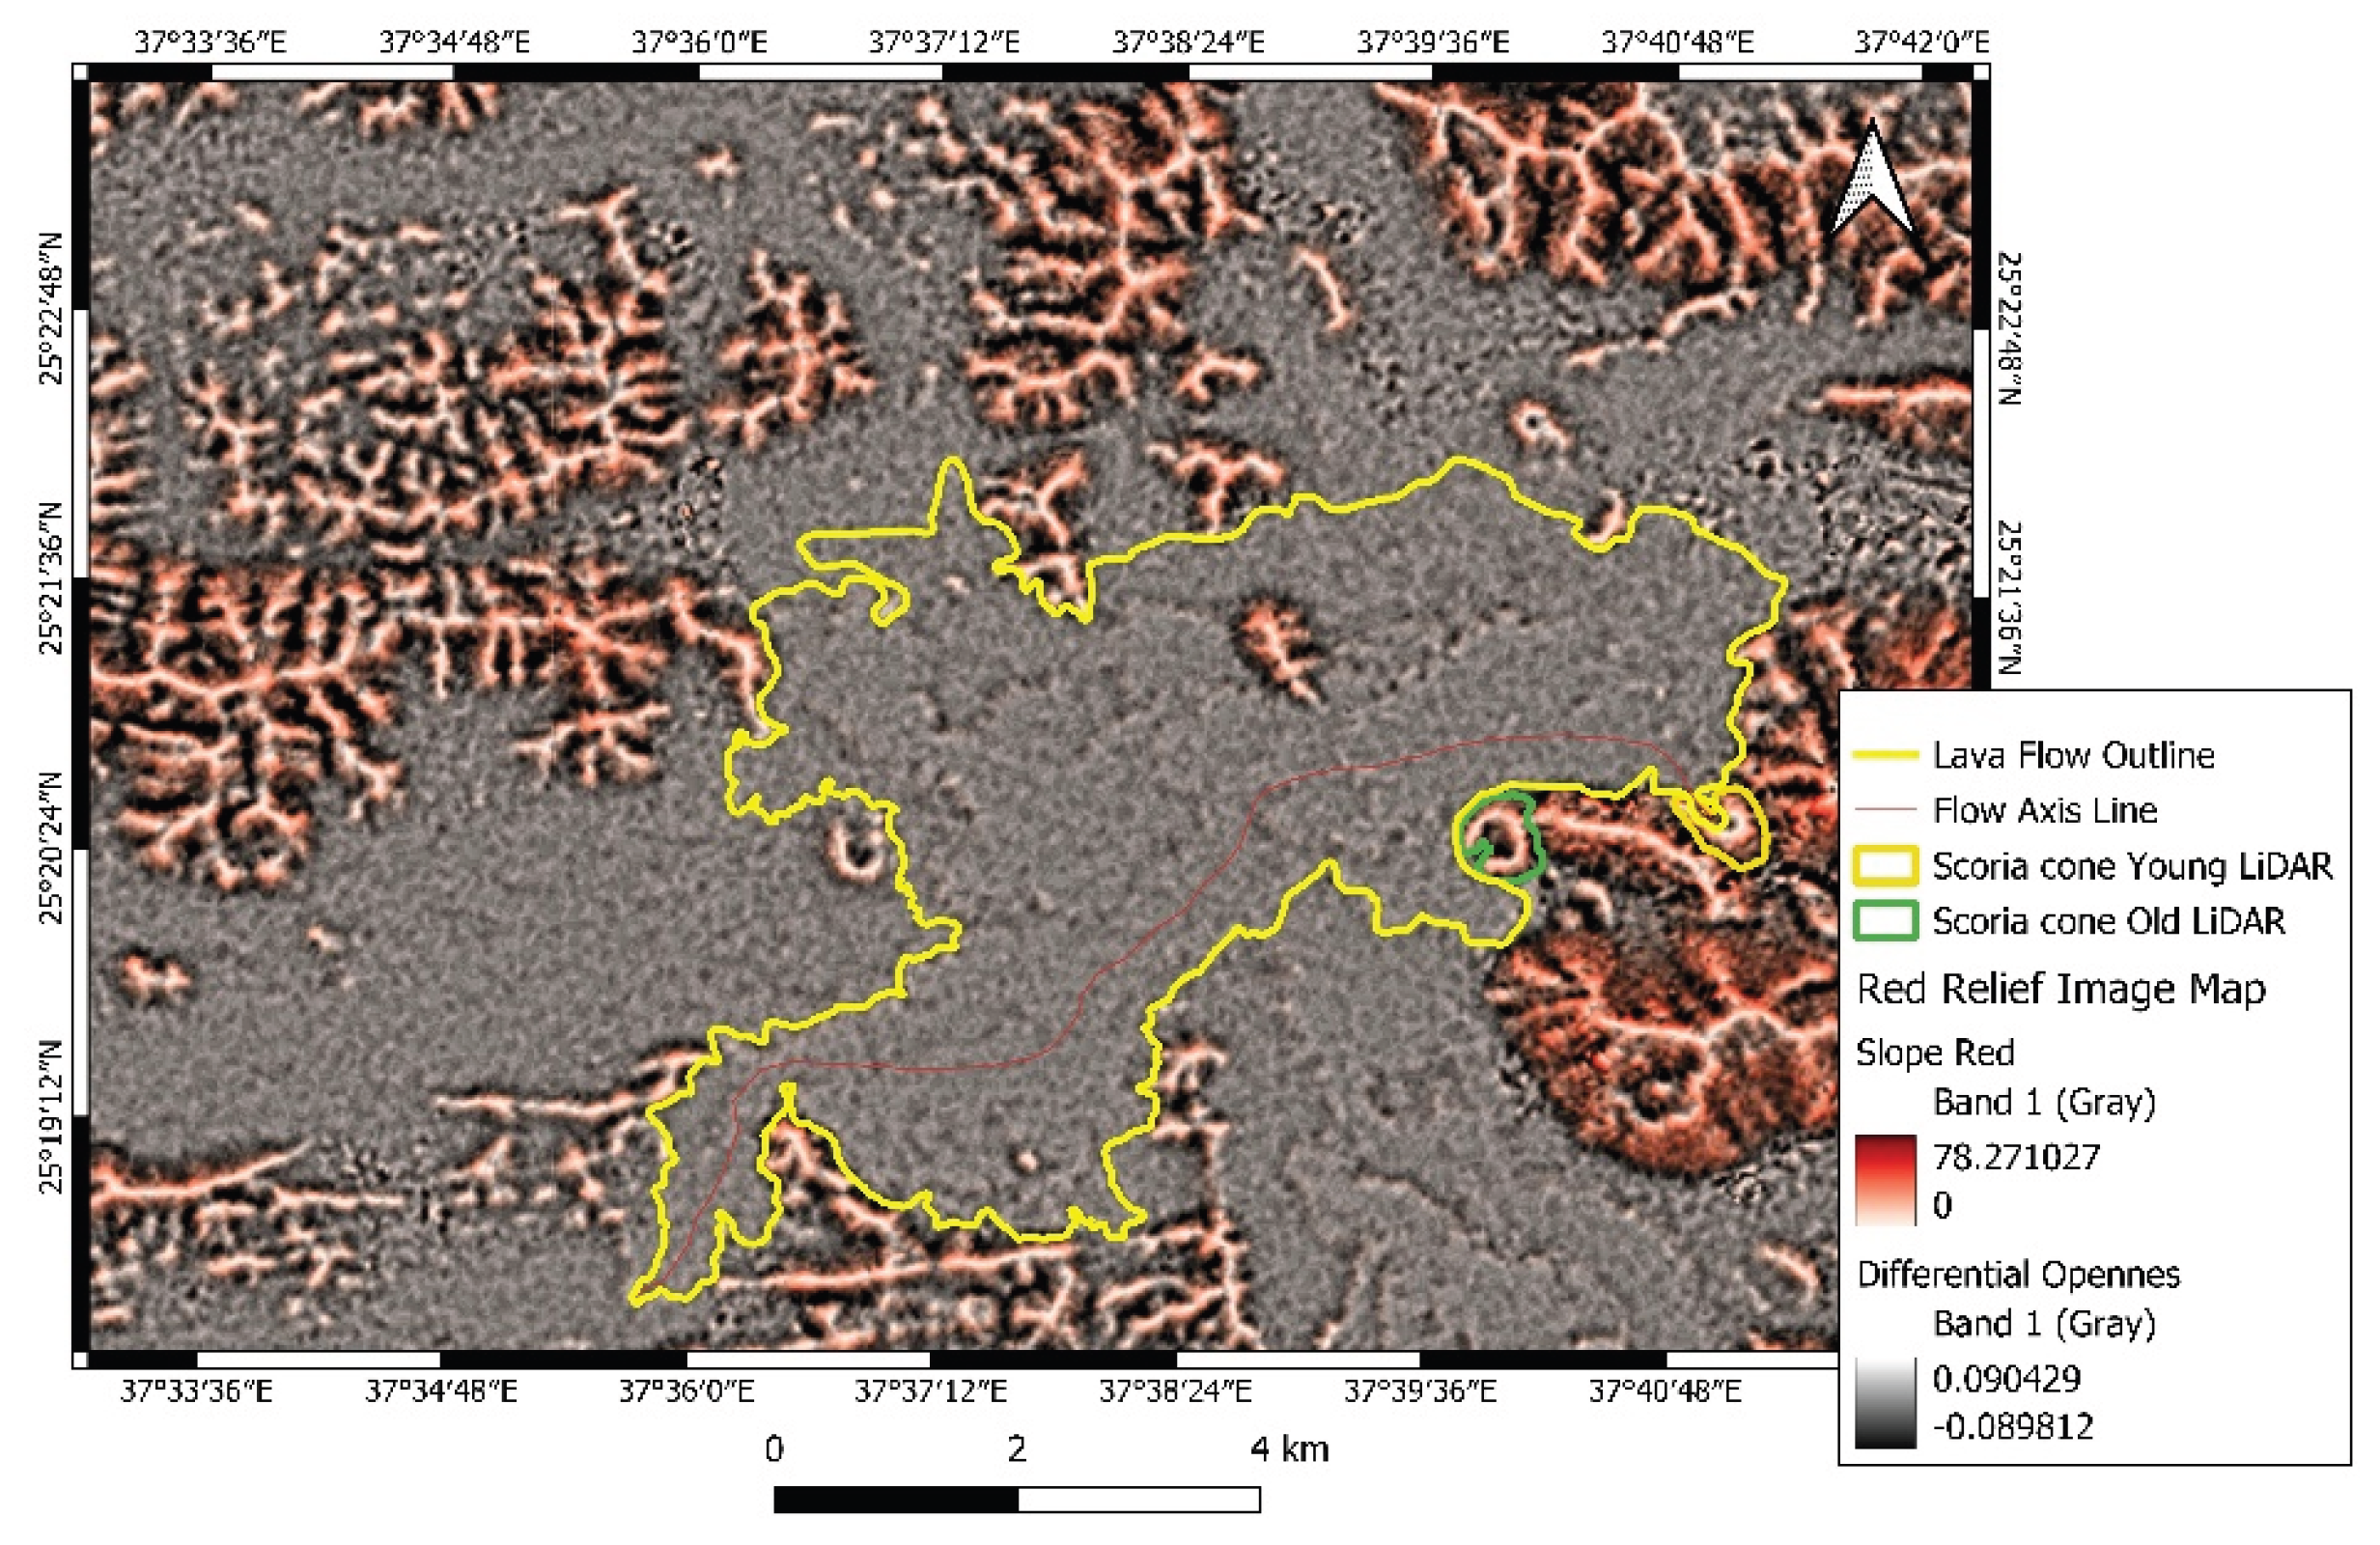
Figure 23.
A combined terrain visualization technique, which combines the DEM, Hillshade, Slope, and Differential Openness highlights, effectively highlights and justifies the lava flow delineation used in the volume calculations in this work. The red outline marks the basement hills sticking out from the lava flow field.
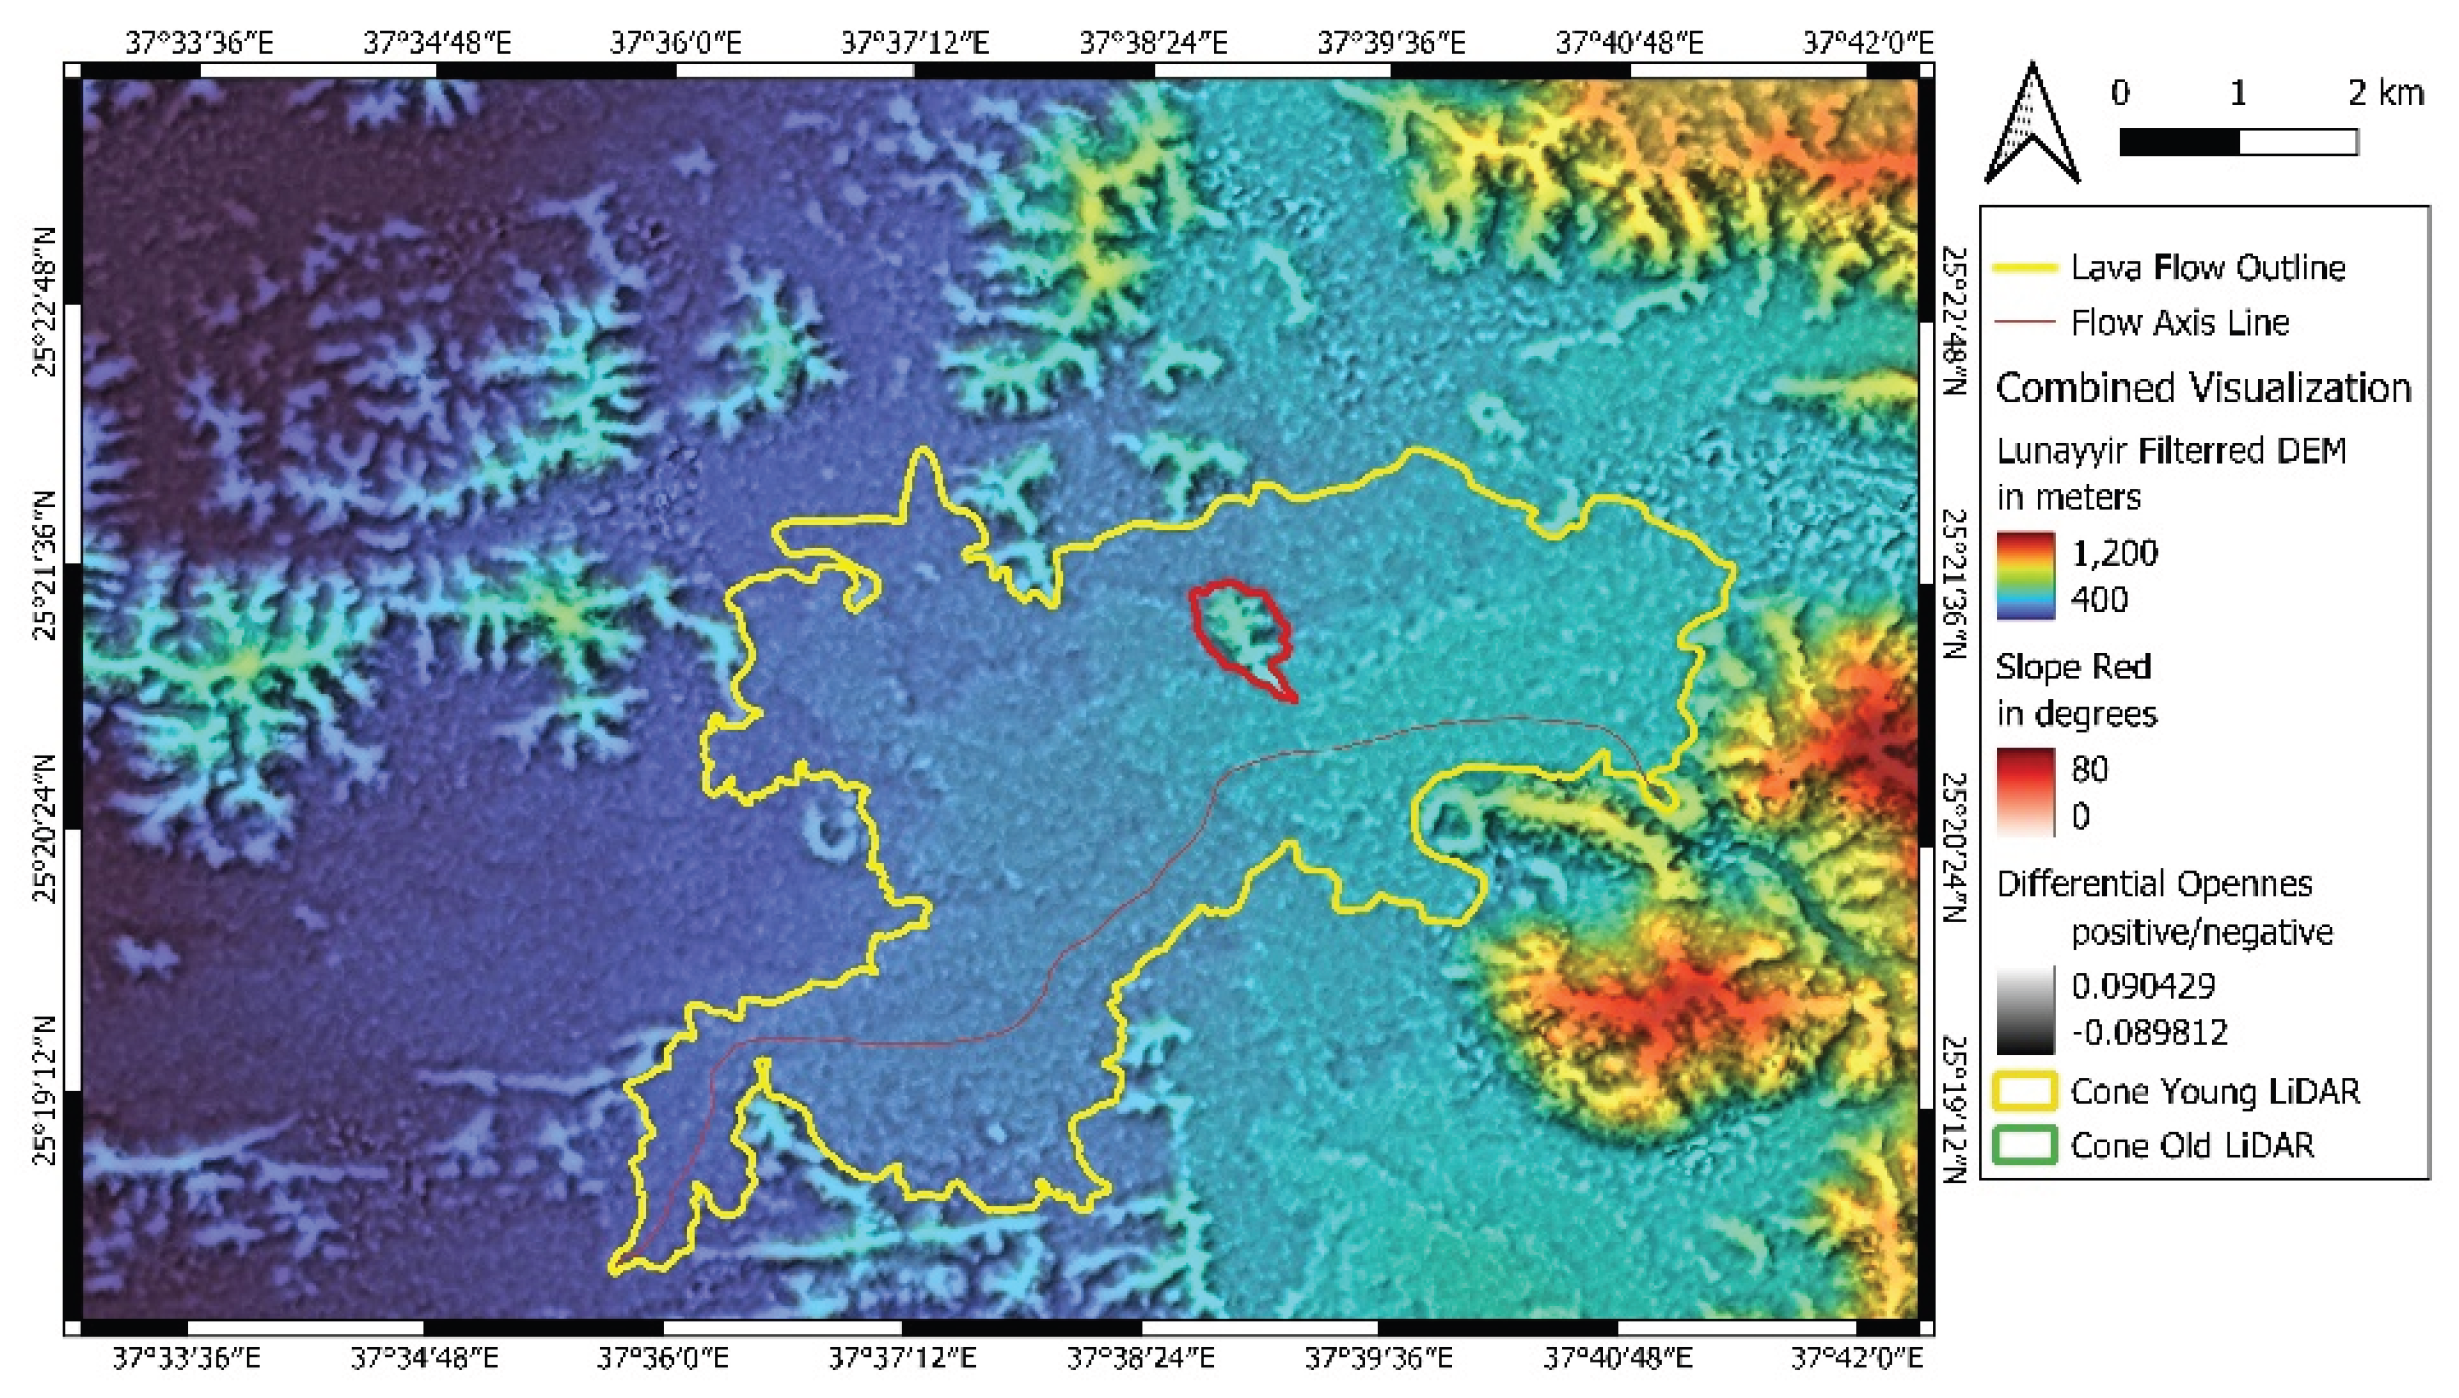
Figure 24.
Lava flow surface elevation map based on Linear interpolation techniques of the elevations collected outside of the lava flow areas. White arrows point to places where thin lava squeeze-outs and erosional modification are suspected, making it difficult to assign the area to a specific flow. Red dot marks an older scoria cone that functioned as an obstacle to stop and divert the flow.
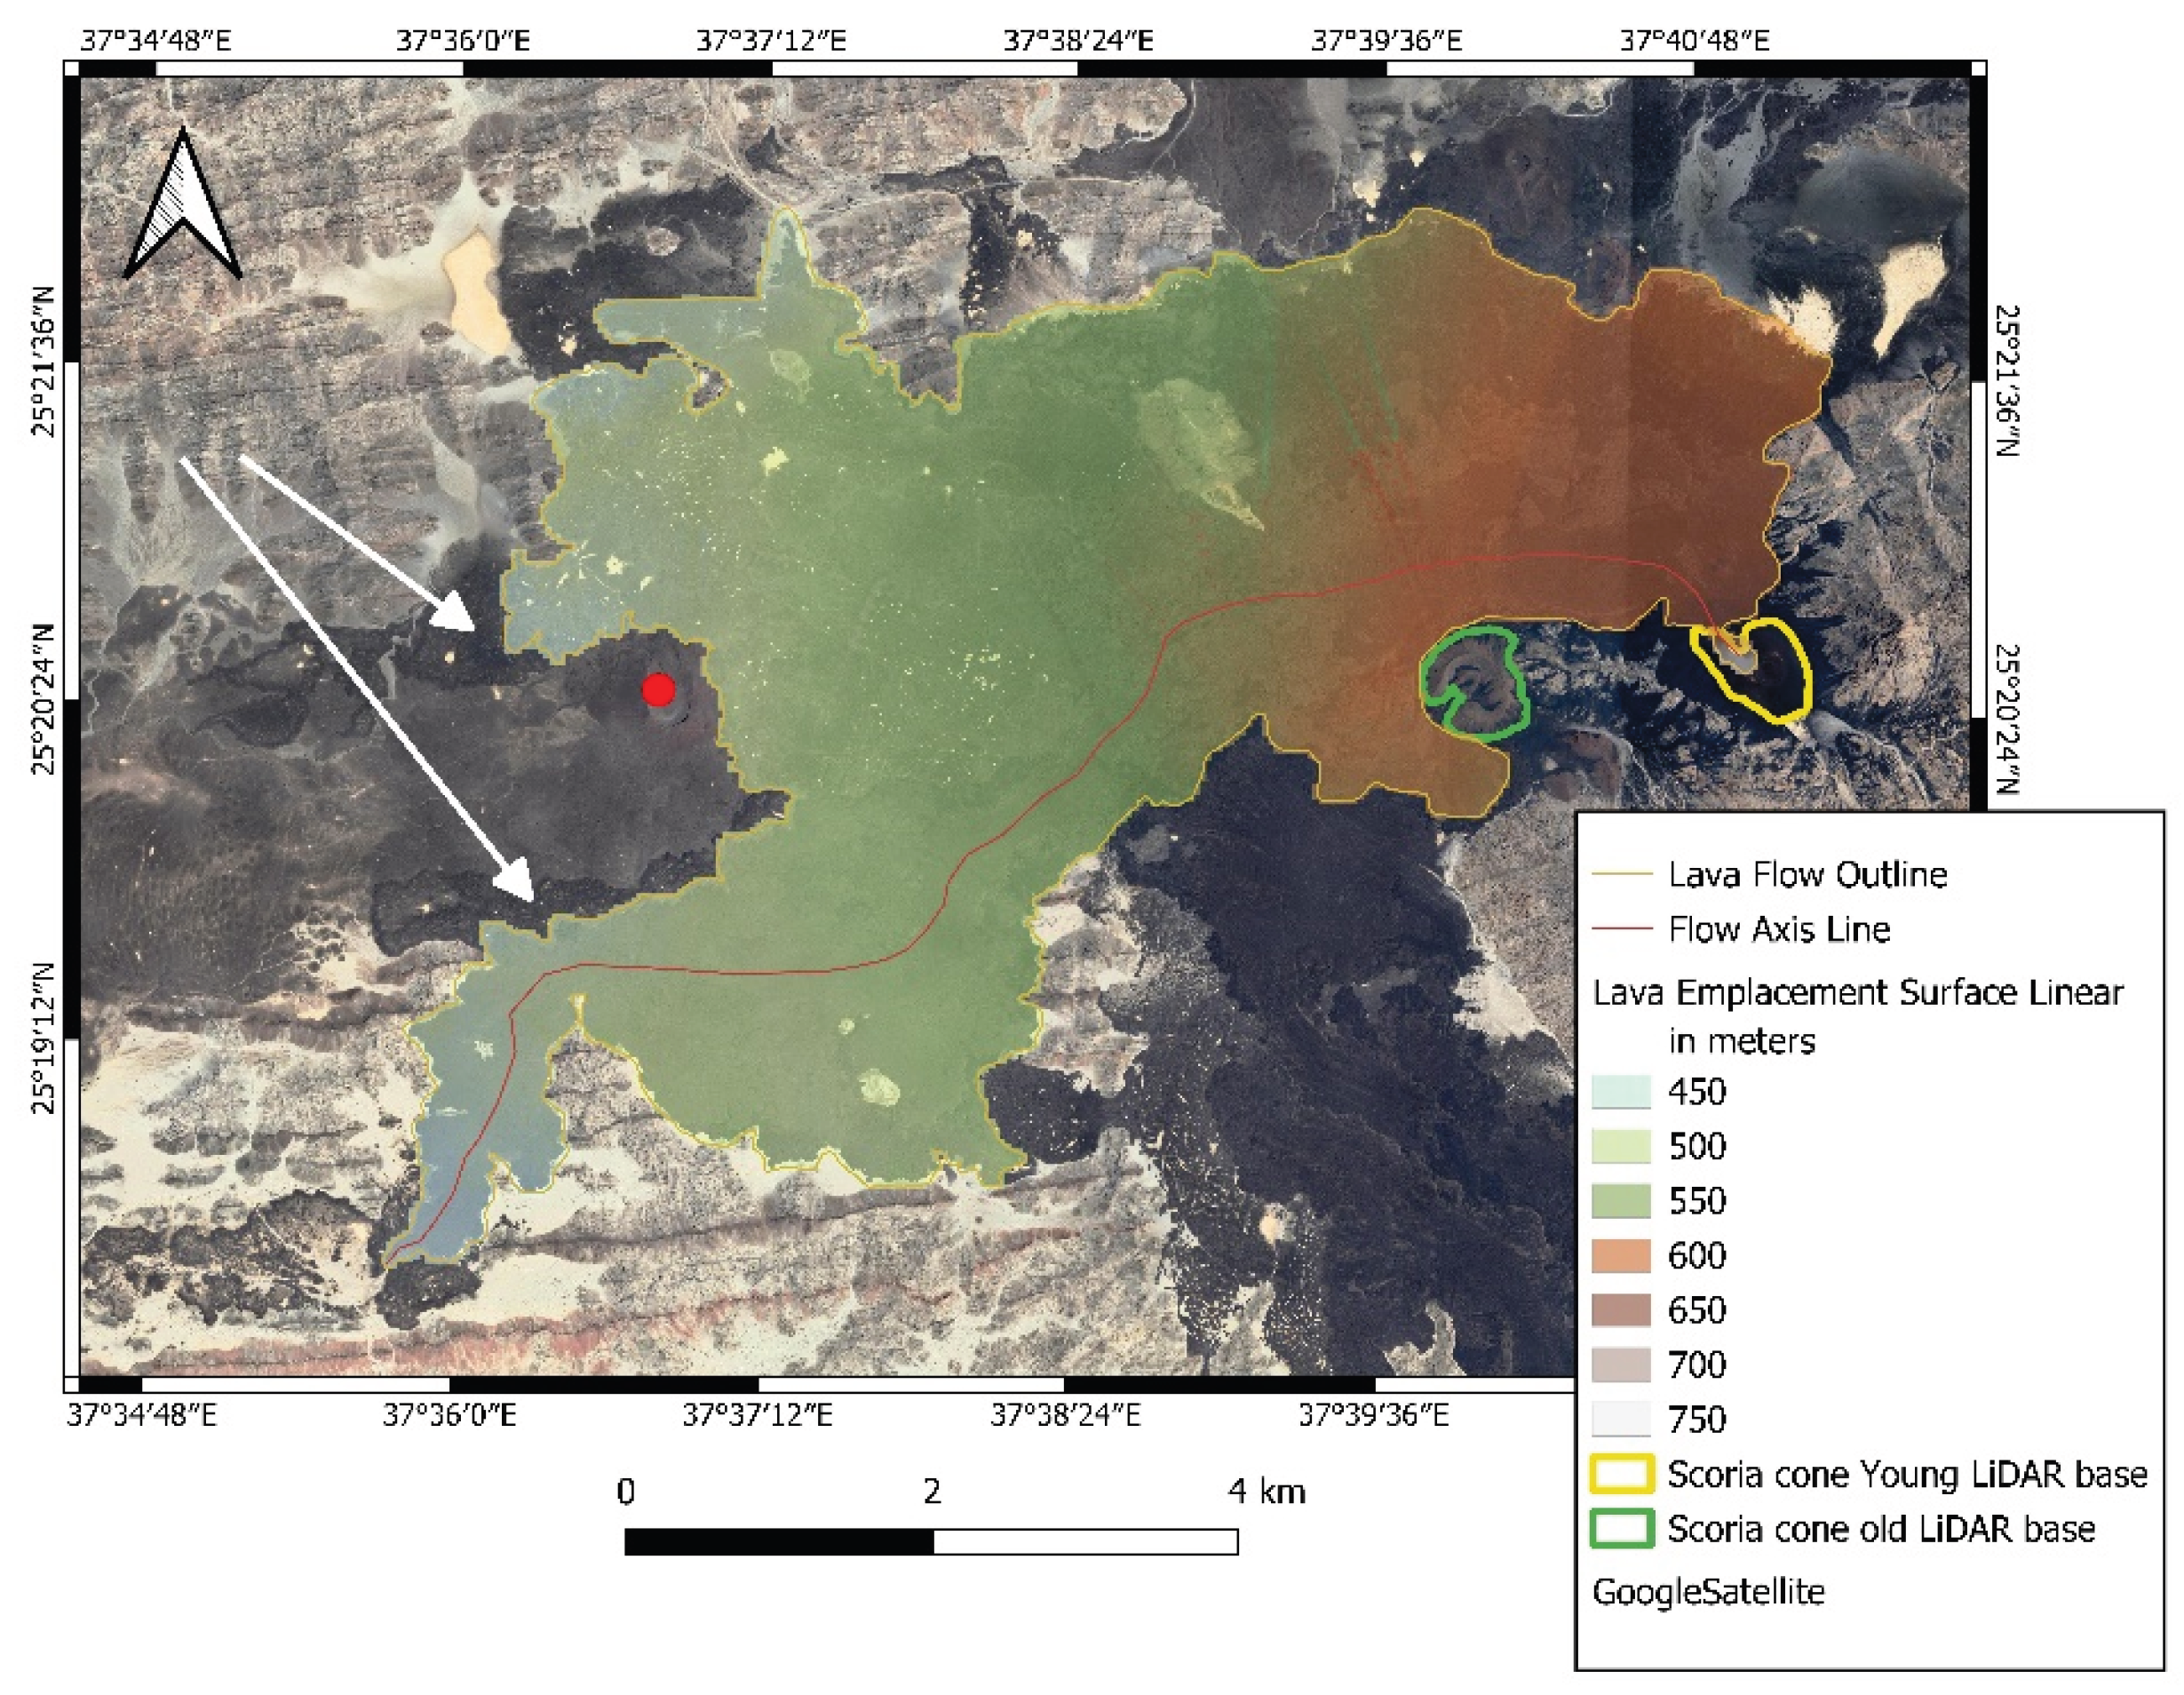
Figure 25.
Flow thickness model map calculated from the generated lava flow base surface and the terrain DEM data. Note that the image is only indicative for areas with thick lava flows (yellow-orange color), while thin lava flows are deep blue. The absolute thickness range is suspected to be in a few meters to a few tens of meters. The basement hill marked with a blue outline also shows its elevation rising high above the top of the lava flow field.
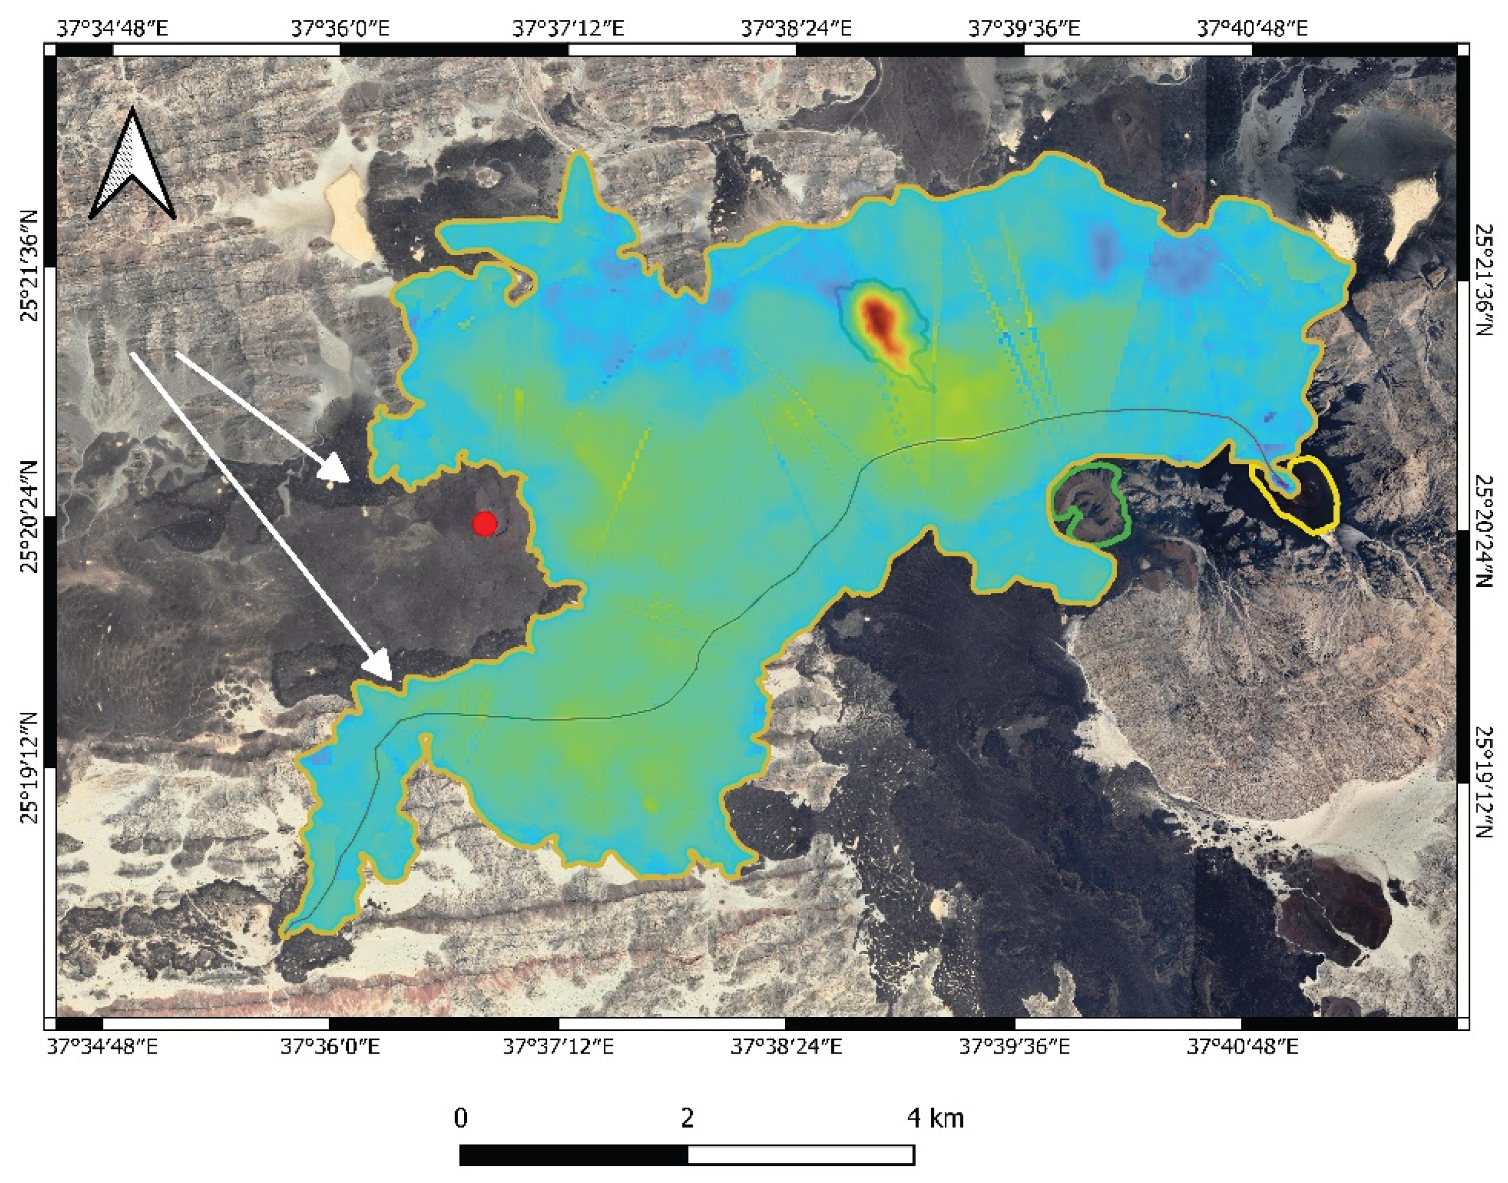
Figure 26.
A rough estimate of the potential ash cover is based on measurements from a few spots' thickness and satellite image analysis to identify remote traces of ash. Use this map as a preliminary estimate of ashfall distribution, which should be mapped more accurately later in a separate study.
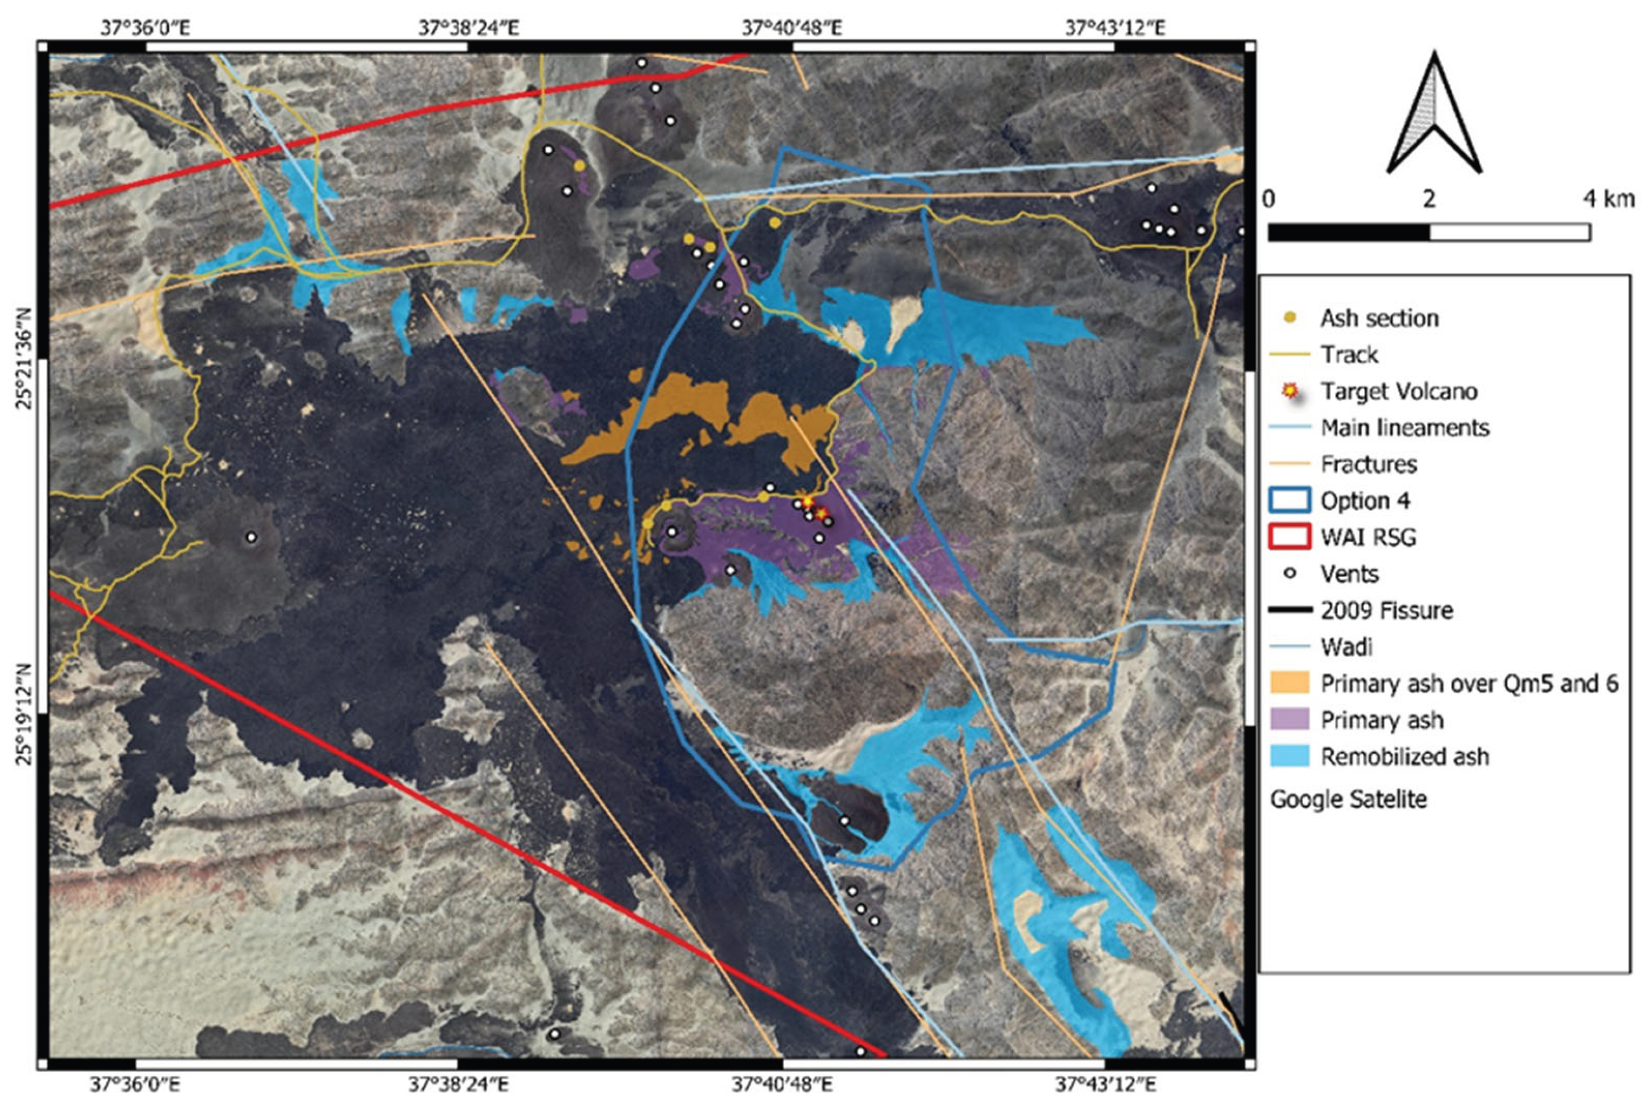
Figure 27.
Simplified isopach map showing 1, 10, and 100 cm thick ash tephra layers inferred from spot measurements collected during reconnaissance mapping of the region for ash fall.
Figure 27.
Simplified isopach map showing 1, 10, and 100 cm thick ash tephra layers inferred from spot measurements collected during reconnaissance mapping of the region for ash fall.
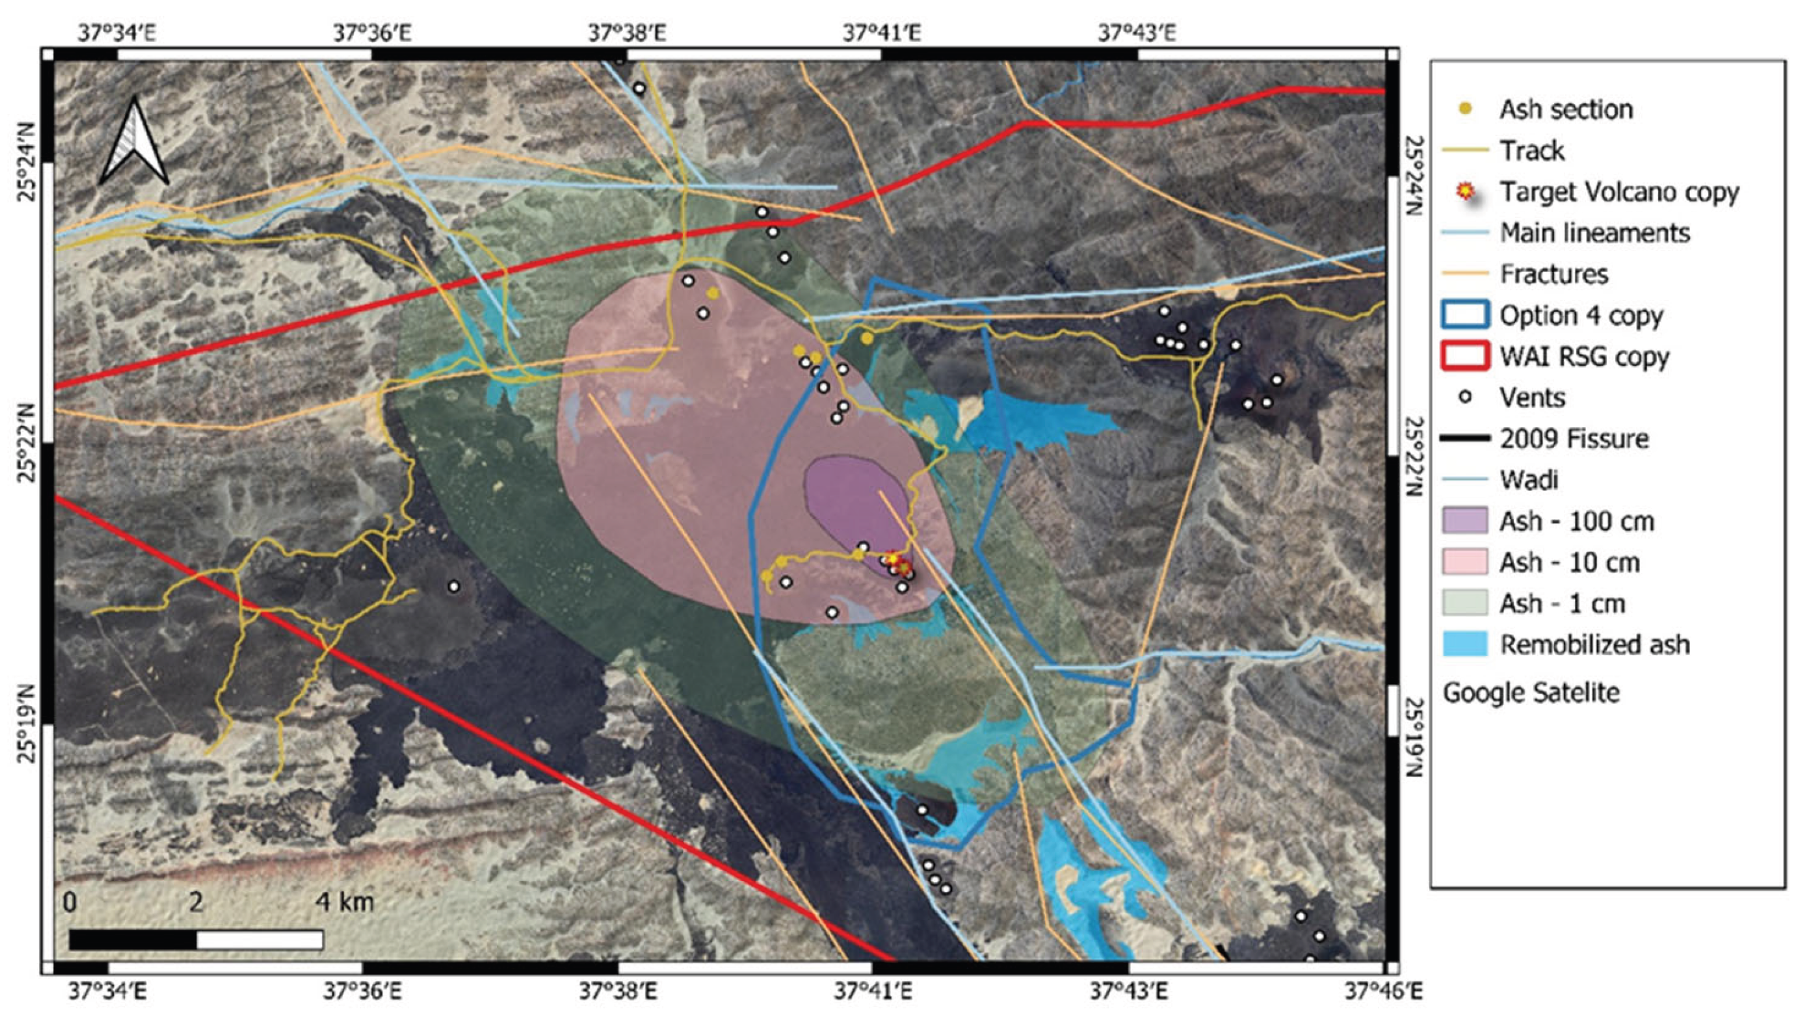
Figure 28.
Ash fall simulation using the USGS Ash3D tool with input parameters of a 7 km plume, 0.005 km³ DRE magma input, and an eruption duration of approximately 6 hours.
Figure 28.
Ash fall simulation using the USGS Ash3D tool with input parameters of a 7 km plume, 0.005 km³ DRE magma input, and an eruption duration of approximately 6 hours.
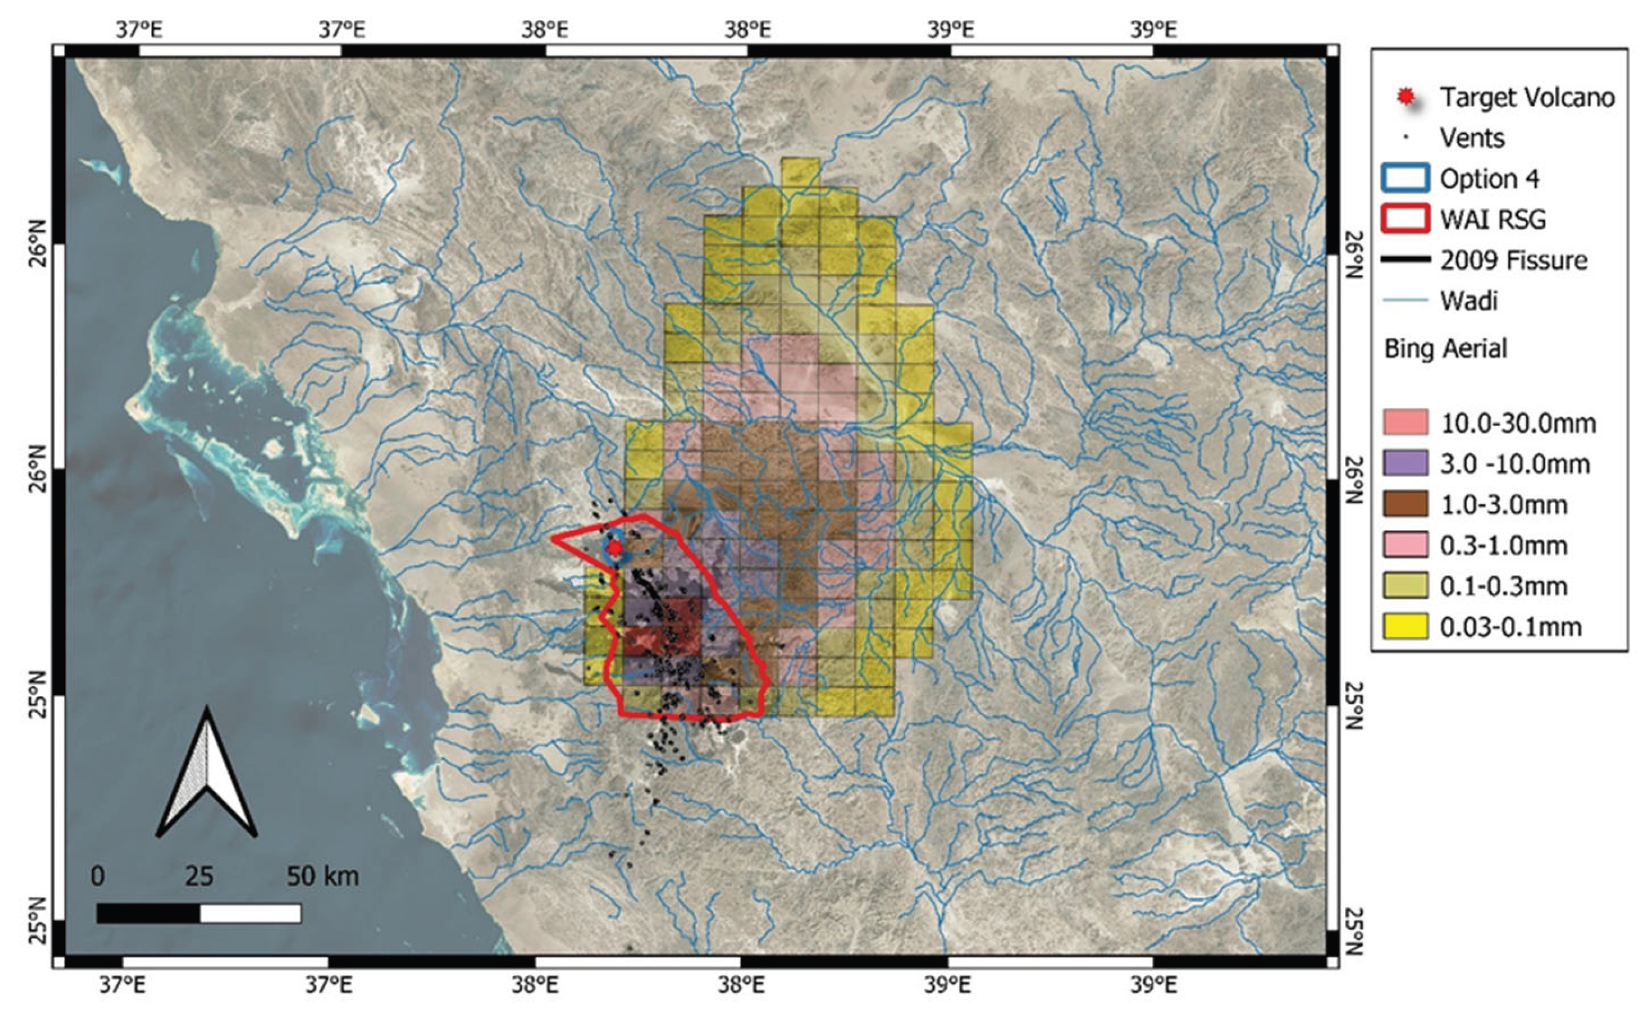
Figure 29.
Area where 2 mm ash fall may occur if the vent opening is anywhere along the marked long fissure. The actual spread pattern will depend on the wind during the eruption. Keep in mind that this is a relatively low-impact hazard, and it can be avoided by staying about a kilometer away from the vent.
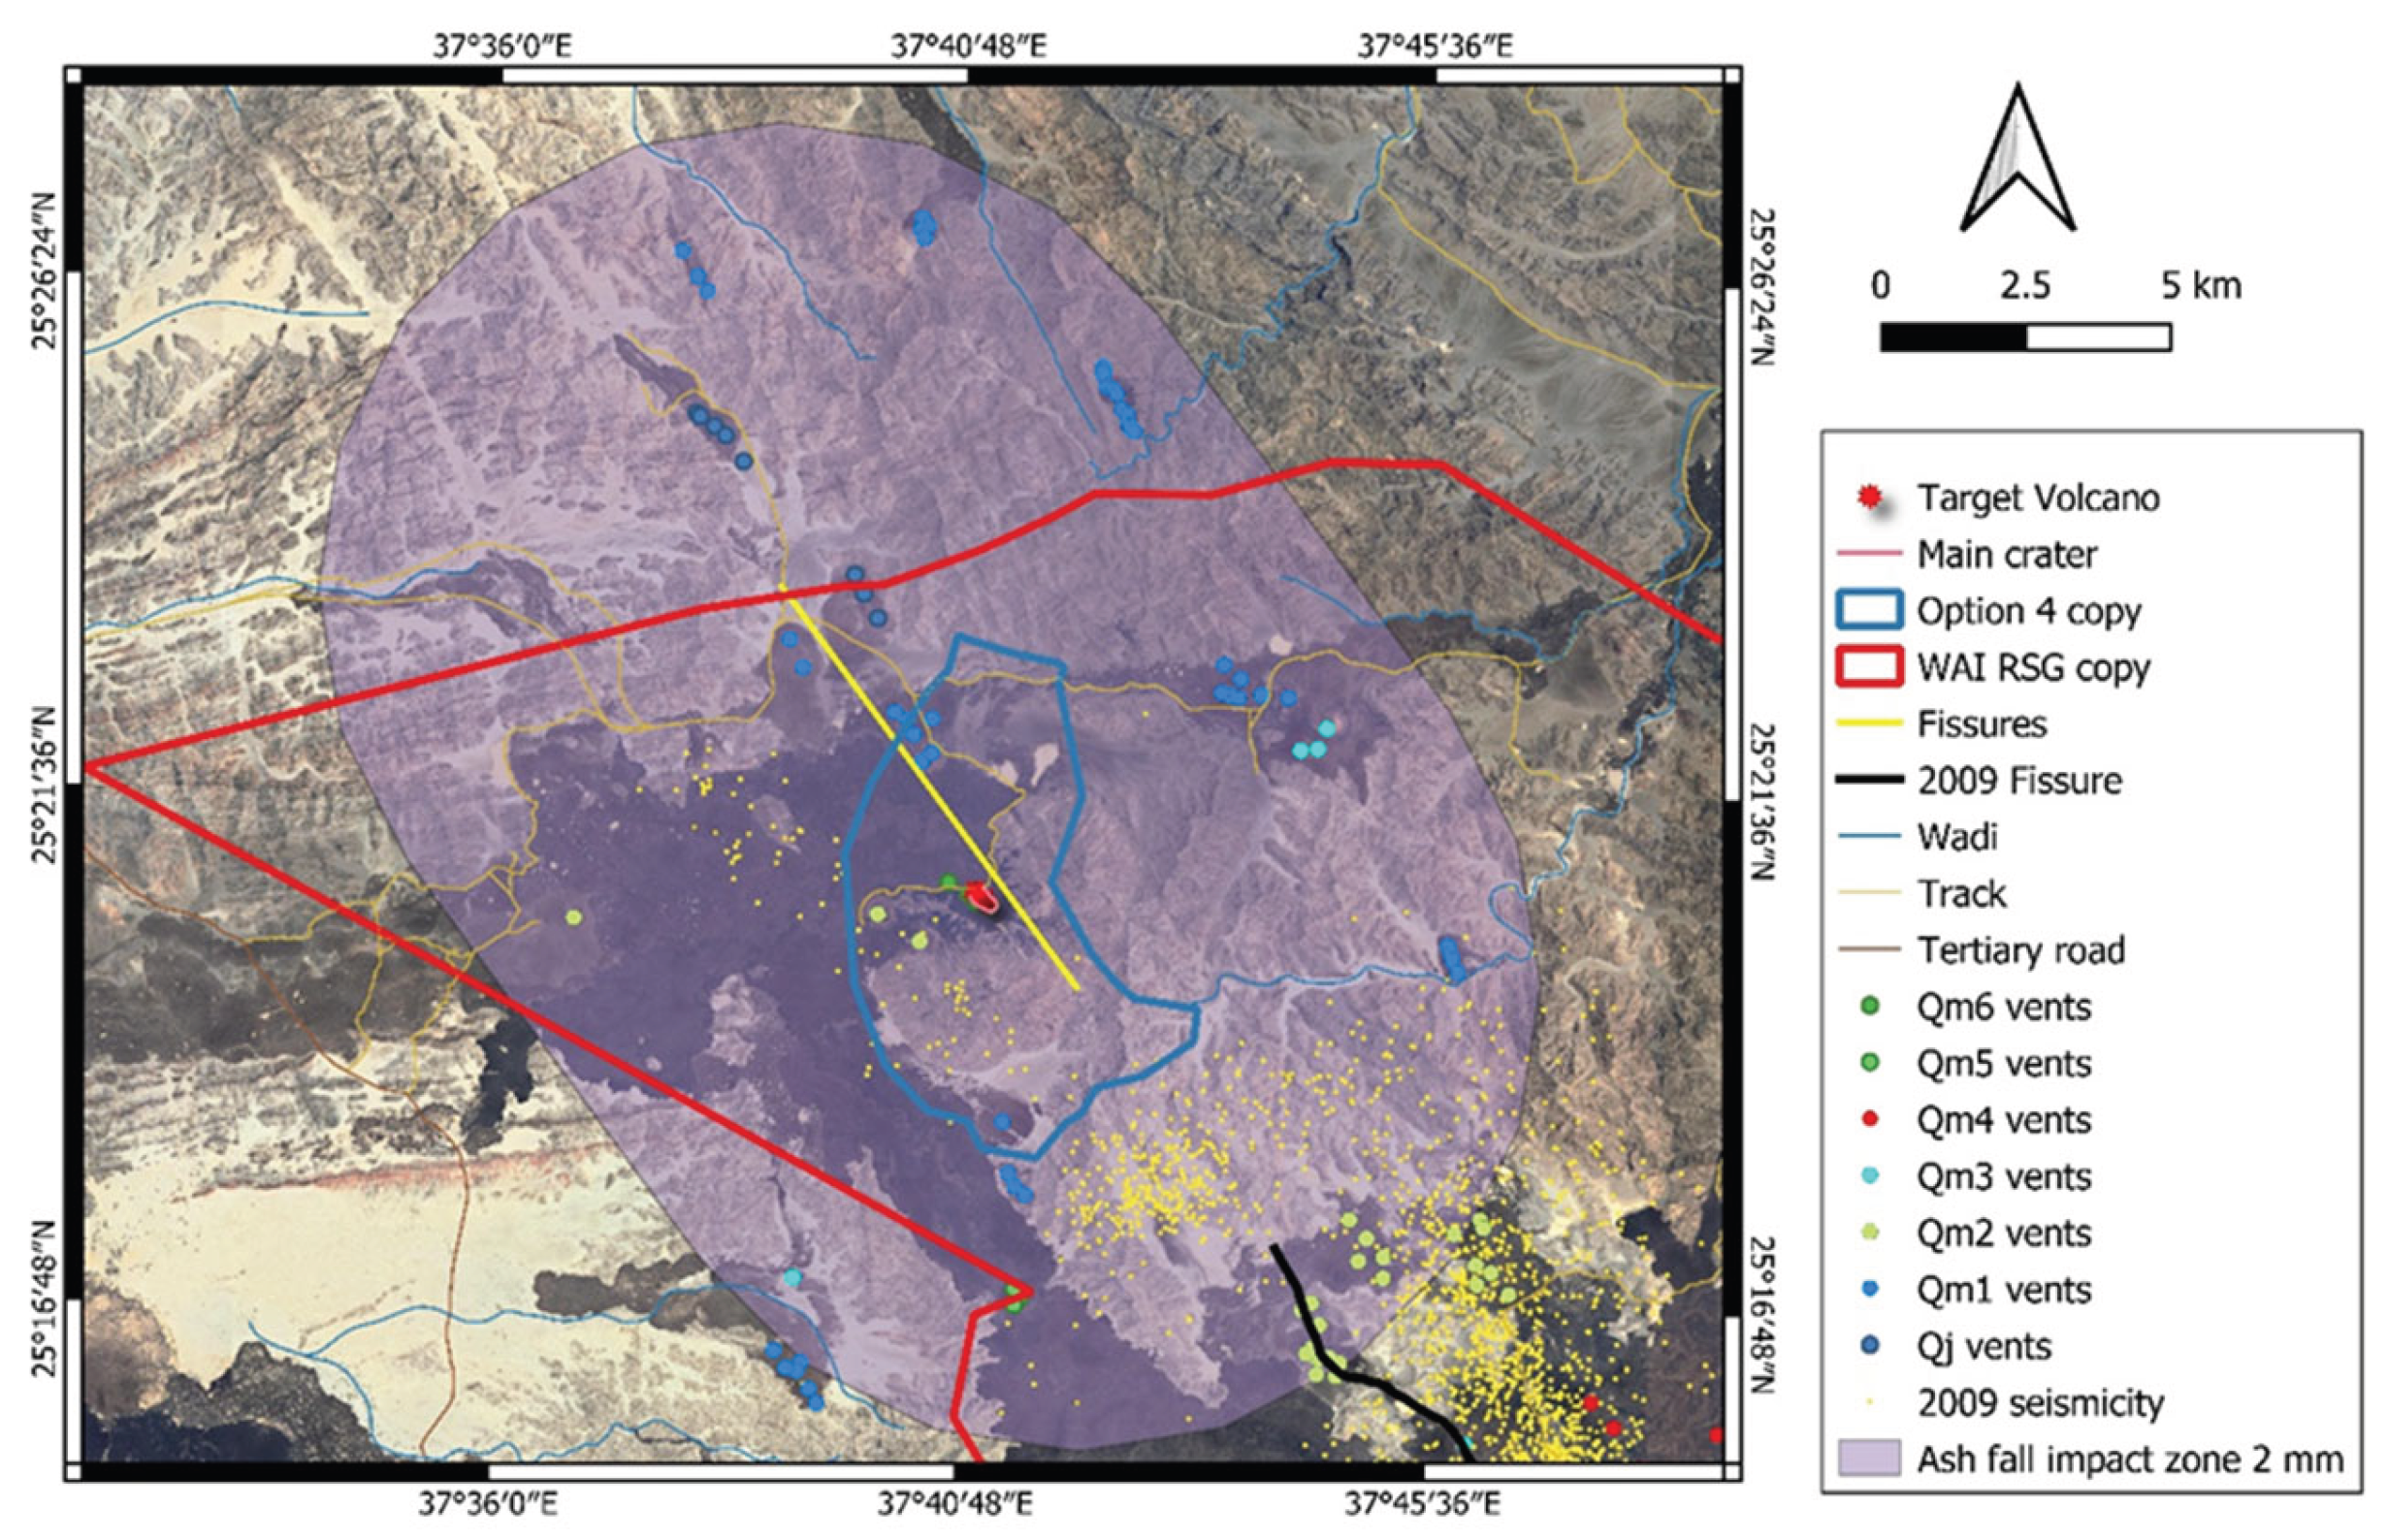
Figure 30.
A map shows the lava flow risk in the area. It appears that if eruptions occur within the NW-SE zone, most of the Option 4 region would face immediate and ongoing danger, which could even be life-threatening if the eruption happens at an inconvenient time, such as during the night. The chances of being cut off by lava blocking access roads are high. There’s no point in marking safe zones, as lava would probably reach the access roads within hours. The safest place right now is on higher ground along the northern access road. However, that area would then be cut off from the local service town in the Um Lujj region.
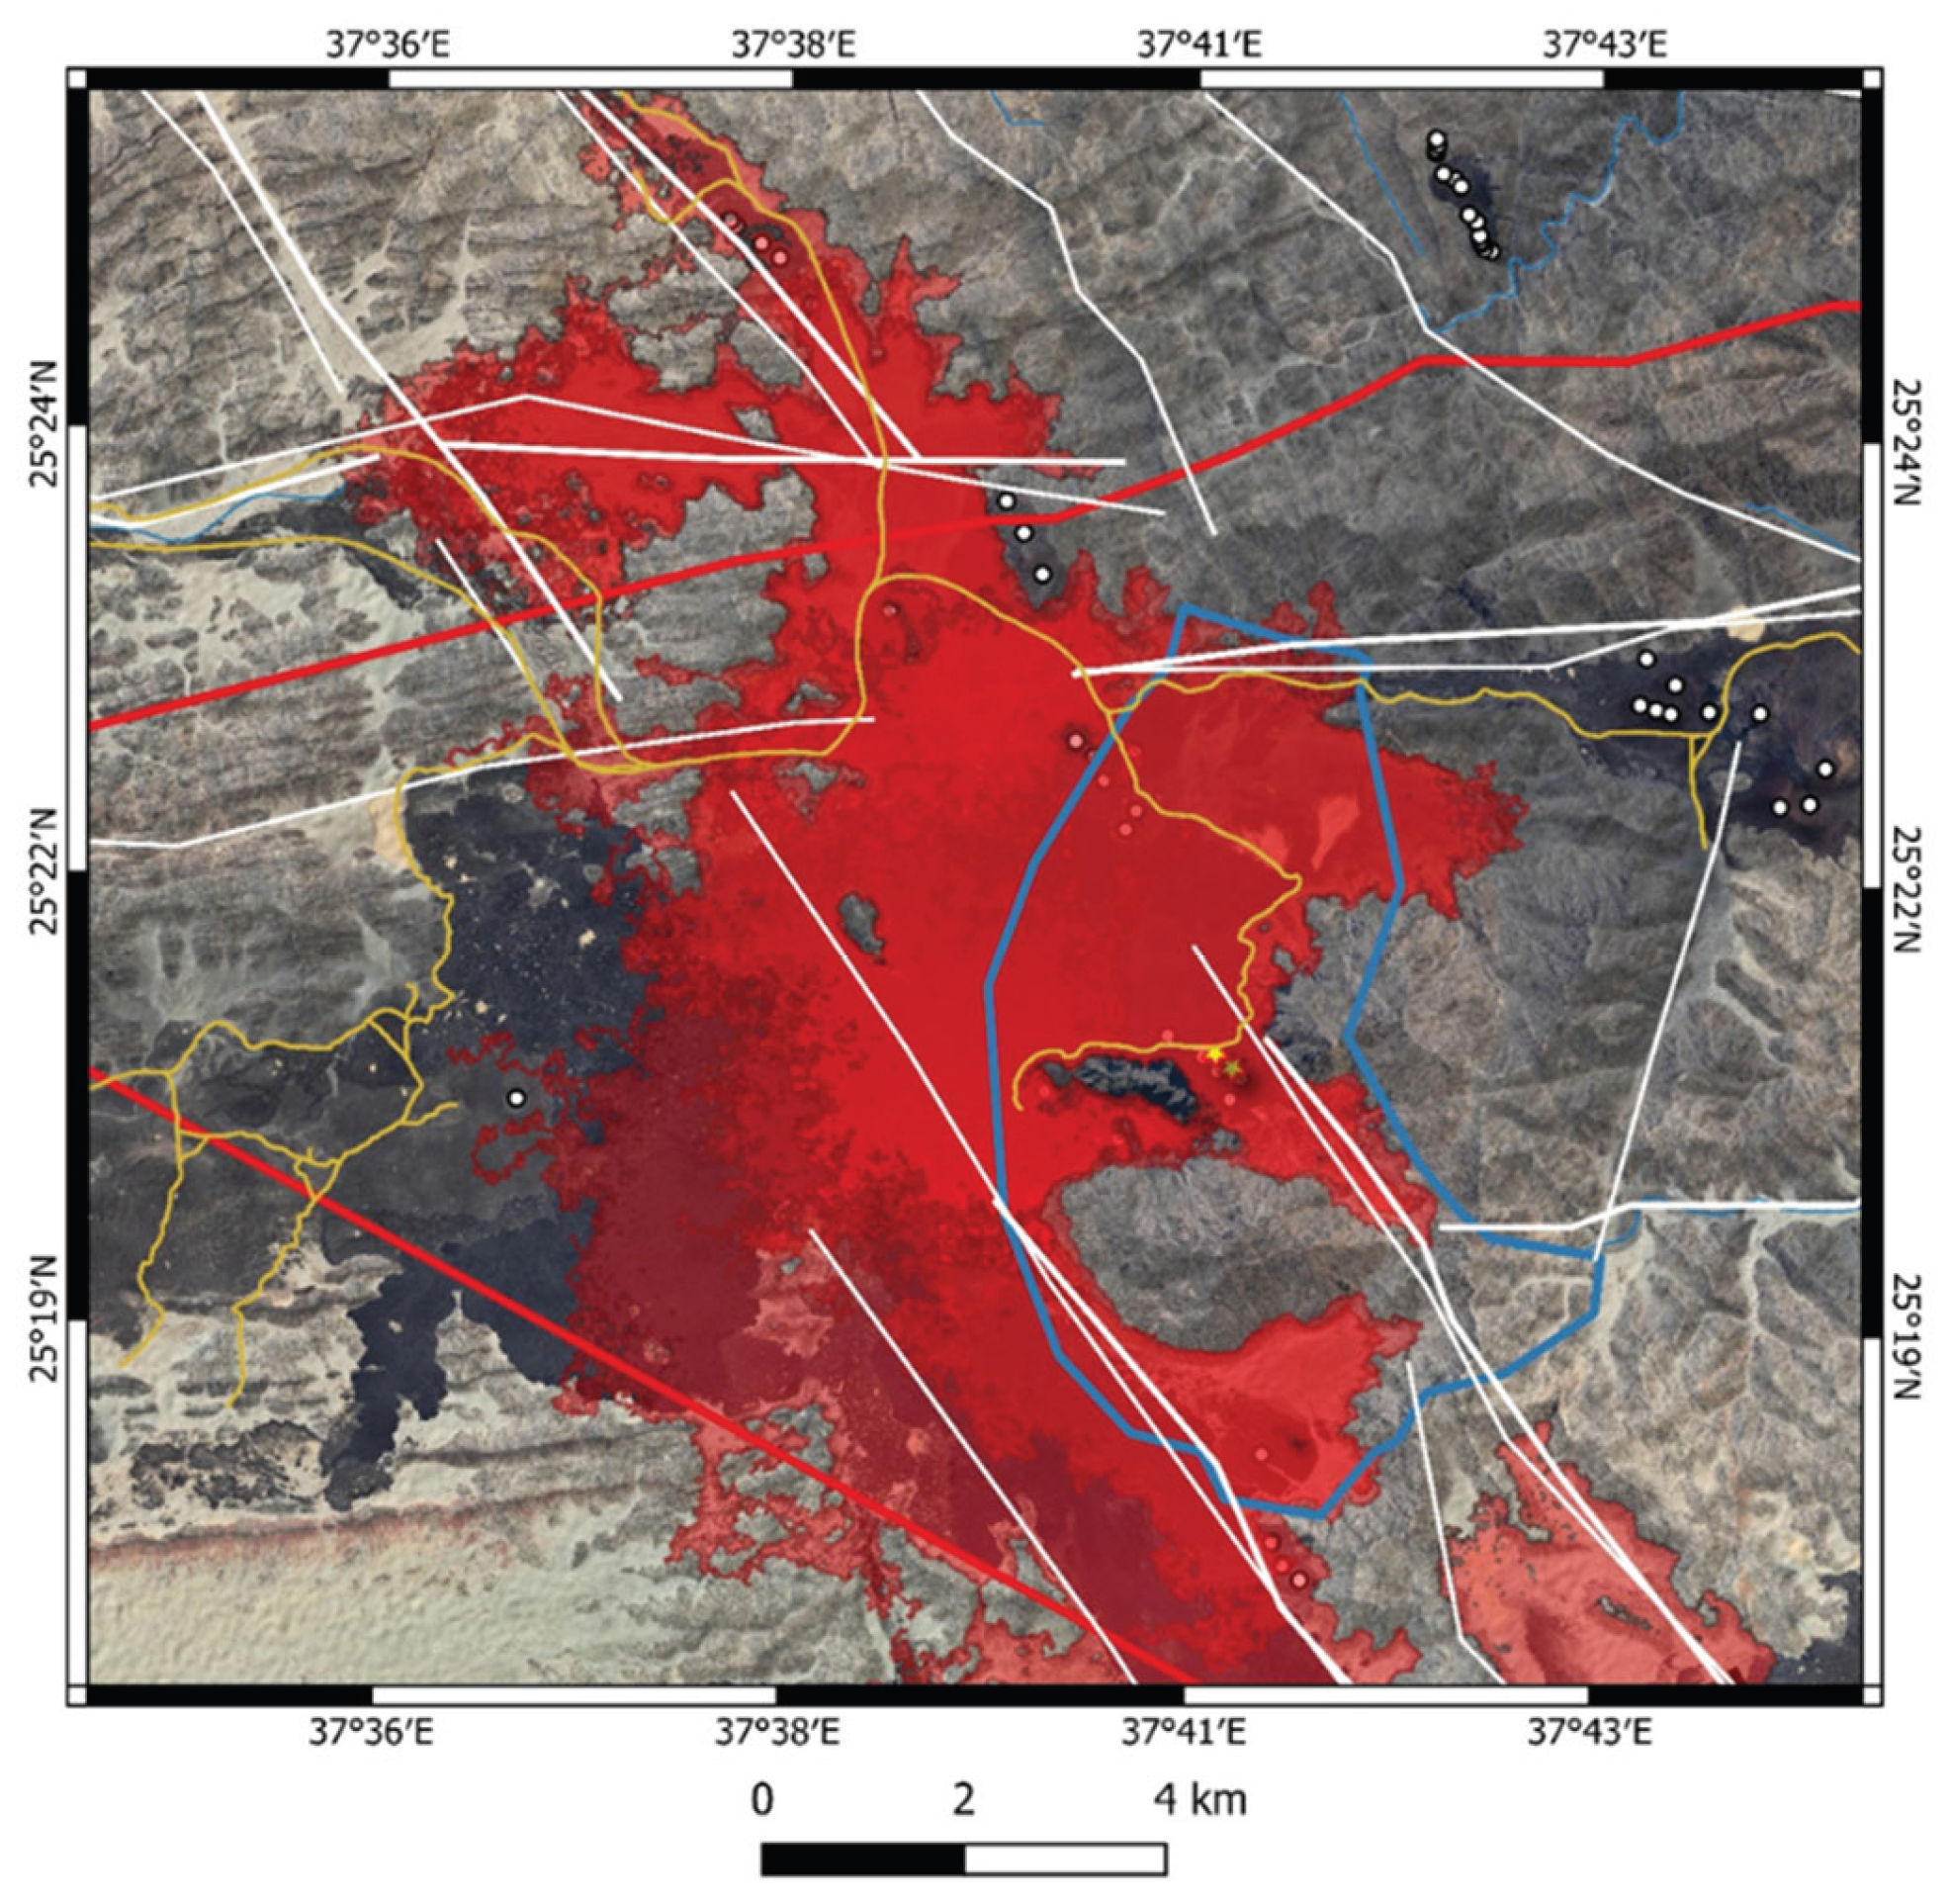

Table 1.
⠀
| Chain of volcanic hazards / cascading hazards if an eruption starts |
Likelihood Ranking | Estimated Duration |
|---|---|---|
| Fissure opening – Lava fountaining – Pāhoehoe lava outpour – Transitional flow field development – Inflation/deflation zone development – Scoria cone edifice growth – Ballistic bombardments – Small scale rafting -Lava outpour repetition – Sub-Plinian/violent Strombolian explosive event with moderate ash dispersal – Cone regrowth – slight lateral fissure shifting – Major paroxysmal sub-Plinian explosive event – Major ash dispersal – Longitudinal fissure rupture – Additional vent formations through the entire length of the fissure – Paired eruptions and compound volcanic edifice formation – Major rafting and collapse events |
LOW |
DAYS to YEARS |
| Fissure opening – Lava fountaining – Pāhoehoe lava outpour – Transitional flow field development – Inflation/deflation zone development – Scoria cone edifice growth – Ballistic bombardments – Small scale rafting -Lava outpour repetition – Sub-Plinian/violent Strombolian explosive event with moderate ash dispersal – Cone regrowth – slight lateral fissure shifting |
MODERATE |
DAYS to MONTH |
| Fissure opening – Lava fountaining – Pāhoehoe lava outpour – Transitional Flow field development – Inflation/deflation zone development – Scoria cone edifice growth – Ballistic bombardments – Small scale rafting |
HIGH |
DAYS to MONTH |
| Fissure opening – Lava fountaining – Pāhoehoe lava outpour – Transitional Flow field development – Inflation/deflation zone development |
CERTAIN |
DAYS to WEEKS |
Table 2.
⠀
| Category 1 (likelihood / expectation during lifetime of project) | Category 2 (likelihood / expectation during lifetime of project) | Category 3 (likelihood / expectation during lifetime of project) | |
|---|---|---|---|
| Example/s | Ash fall / dispersion in distal areas in comparison to vent opening position | Lava inundation of medial to distal regions from volcanic eruption site(s) | Complex eruption scenario of proximal regions where volcanic edifice grows, proximal lava outpouring, and heavy ash fall can be accompanied by volcanic edifice instability (rafting and collapse) |
| Severity / Impact | (x) Manageable | (x) Manageable | (x) Unmanageable, built environment suffers irreparable and unrecoverable damage |
| Mitigation Through Design | 1- Design buildings and roofs to support 1 – 2 meters of ash accumulation. 2- Design accessibility and escape routes to exit the hazard zone. |
1- Install detection systems and monitoring services that alert all people in the development vicinity to prepare for evacuation. (Warning signs before any risk to humans can be potentially ensured) 2- Design escape routes. 3- Accept potential loss of assets and design to limit asset loss as much as possible. |
Mitigation should focus on quick evacuation, minimizing delays in complete access, and the rapid removal of valuable items from the premises. This latter process must be pre-designed to achieve maximum efficiency of the rescue operation. |
| Information | Ash zonation modeling | Lava flow modeling | Model scenario of events |
Table 3.
⠀
| Volcanic hazard | Low risk | Moderate risk | High risk |
|---|---|---|---|
| Areas may experience ashfall that is 1 cm or less thick. | Lava flow zones beyond vent areas | Potential vent zones are identified by analyzing the combination of structural elements, vent alignments, and age constraints. | |
| Pāhoehoe lava flow | Use fire-resistant materials and avoid flammable items. Ensure the building design does not encourage accidental lava diversion; avoid holes, tunnels, or underground chambers. | Use fire-resistant exterior materials, minimize the use of materials prone to accidental ignition and capable of transferring fire into the building, and design clear escape routes with procedures to ensure evacuation within 24 hours. | Use fire-resistant materials in construction. Strengthen the building frame to endure mechanical pressure and include a survival chamber stocked with at least 24 hours of supplies for the typical number of occupants. |
| Transitional lava flow | Ensure the exterior is structurally sound and mostly perpendicular, capable of resisting lava flow and withstanding pressure from up to 2 meters of lava, even with some overhang. | Use durable, sloped exterior materials to divert incoming lava. Design a complex outer structure to split lava flow for cooling and natural barrier formation. Build stone fences to slow down and disperse lava into smaller, more manageable areas. | Construct a durable, insulated structure with a sealed environment and life support systems—including gas and air filters, as well as a water supply for the expected number of occupants—so that they can endure at least 24 hours if trapped. Incorporate helipads or elevated, lava-safe landing zones for rescue within the first 24 hours. |
| Lava spatter eruption | All precautions relevant to lava flows are deemed suitable for handling lava spattering events. | Ensure the building includes shelters built to withstand heat and protect against incoming debris weighing several kilograms and impacting at speeds of several tens of meters per second. | Design buildings with simple geometry to minimize spatter buildup and secondary flow inside the structure. |
| Scoria cone formation and growth | In low-risk zones, the likelihood of scoria cone formation is very low, and no preventive measures are recommended aside from being prepared to handle possible ashfall. | Scoria cones could develop in this area; follow ash fall safety measures. | Scoria cone formation is anticipated in this area, so all recommendations regarding roof reinforcement are relevant. |
| Ballistic impact | In areas marked as low-risk on the map, the chance of ballistic impact is minimal. | In regions with moderate risk, the chance of a ballistic impact is low; it is advisable to use reinforced roof structures that may include elastic components capable of absorbing impact energy and decreasing the likelihood of fracturing. | Ballistic impacts are likely in the red zone due to the vent locations. Buildings here must have reinforced walls and windows capable of withstanding 100 kg projectiles moving at up to 100 m/s. |
| Scoria cone collapse and rafting | No need specific measure | No specific measures are needed; an adaptive mitigation strategy has been implemented. | In this area, proximity to scoria cones and major lava outflow sites poses a moderate to high risk of cone collapse. It is advisable to build structures on a continuous, reinforced foundation designed to move as a unit in the event of a nearby gravity-induced collapse, helping the structure stay intact and be transported atop the collapsing material along the lava flow surface. |
| Sub-Plinian to violent Strombolian eruption style | In these areas, a sub-Plinian eruption may cause fine ash fallout. Air filters and air conditioning systems should be ready to handle this, and facilities must be prepared for quick fine ash cleaning and disposal. | Sub-Plinian eruptions are likely to occur in this zone, with moderate ash accumulation expected. Facilities must have real-time ash cleanup plans and accessible tools. Roofs should be able to support up to 10 m of ash. | There is a high likelihood that this intense phase of volcanic activity will occur once an eruption begins. This area may experience significant ash fall; therefore, roof structures should be designed to support approximately 50 cm of ash buildup, with maximum levels potentially reaching up to 2 meters within 1 km of the source. Building designs must ensure that controlled roof collapse does not endanger human life, while also maintaining the building’s functionality and keeping external access points available for emergency response. |
| Volcanic degassing, vog formation | This area is away from the lava field, and vog levels depend on wind conditions. Buildings should have personal air filter kits available in case of high gas concentrations. | The risk of vog exposure is considered moderate to high. Intensive vog formation is expected in areas where lava gathers, such as in depressions or behind physical barriers. | There is a high risk of vog, which can be dangerous. All visitors are required to carry their own personal breathing equipment. |
Disclaimer/Publisher’s Note: The statements, opinions and data contained in all publications are solely those of the individual author(s) and contributor(s) and not of MDPI and/or the editor(s). MDPI and/or the editor(s) disclaim responsibility for any injury to people or property resulting from any ideas, methods, instructions or products referred to in the content. |
© 2025 by the authors. Licensee MDPI, Basel, Switzerland. This article is an open access article distributed under the terms and conditions of the Creative Commons Attribution (CC BY) license (http://creativecommons.org/licenses/by/4.0/).
Copyright: This open access article is published under a Creative Commons CC BY 4.0 license, which permit the free download, distribution, and reuse, provided that the author and preprint are cited in any reuse.


