
Submitted:
31 October 2025
Posted:
04 November 2025
You are already at the latest version
Abstract
Baltimore’s historic row-home neighborhoods face escalating risks to energy, heat, and durability under intensifying climate stress. This study develops a Housing-Performance Atlas that quantifies multi-hazard performance for eight representative archetypes using DesignBuilder/EnergyPlus under Baltimore TMY3 boundary conditions. Performance is evaluated across four adaptation domains: energy use intensity, passive survivability during 72-h outage events, roof overheating exposure (>150 °F exceedance hours), and material service life derived from ISO 15686 and synthesized into Lean and Full Deficit Indices for comparative resilience ranking. Results show that EUI ranged from 46.7 to 67.6 kBtu ft⁻²·yr⁻¹, survivability from 0 to 23 hours, and roof temperatures exceeded 150 °F for 150–210 hours, shortening roof service life by up to 10 years. Composite Lean and Full Deficit Indices ranged 7.8–92.4, ranking Model 5 (end-unit, flat roof, two-story with basement) as the most resilient configuration and Model 8 (end-unit, pitched roof, three-story above-grade) as the least resilient due to compounded overheating and energy losses. Heat-related domains accounted for nearly 70 % of overall resilience deficits, confirming thermal safety and roof reflectivity as retrofit priorities. The Housing-Performance Atlas establishes a reproducible diagnostic framework linking simulation, service life, and resilience metrics to guide cost-effective, climate-responsive retrofits in Baltimore’s aging urban housing stock.
Keywords:
housing performance atlas
; row home retrofitting
; multi-hazard resilience
; thermal survivability
; material durability assessment
1. Introduction
The most thermally and materially stressed building segment in the built environment is legacy housing in U.S. cities like Baltimore. More than 70 percent of occupied housing in Baltimore was built before 1940, with row homes made of thin brick, high envelope exposure, and outdated thermal systems [1,2]. These pre-code structures undergo greater stress due to material aging, increased cooling loads, and more extreme heat driven by climate change [3,4]. Cooling degree days in the mid-Atlantic have increased by over 20 percent since 1980, and temperatures exceeding 95°F have been recorded twice [5,6]. These circumstances increase energy insecurity, indoor heat exposure, and envelope degradation in the low-income communities that rely on legacy homes to be stable [7,8,9].
Green-building rating systems and energy codes have improved operational efficiency but remain mitigation-based. LEED v4 BD+C, Passive House, and BREEAM are mainly focused on efficiency and carbon reduction with little information on thermal survivability, overheating resistance, or material life extension [10,11,12,13]. The more recent resilience-oriented systems, such as RELi v2 and WELL v2, include occupant safety and redundancy [14,15,16], but occupancy and multi-domain adaptation measures are not yet provided [17,18,19,20]. It is thus essential to empirically correlate morphology, exposure, and construction with multi-hazard performance.
Simulation-based studies have begun to fill this methodological gap. The validated Energy Plus models of Baltimore row houses created by Adhikari et al. (2025) demonstrated that retrofit performance is sensitive to roof geometry, albedo, and ventilation rate [21]. Walaa S. E. Ismaeel (2023) observed that the current certification systems do not adequately reflect durability and adaptability. Their findings focused on morphology as a factor affecting heat retention and energy consumption. [22], and Santamouris (2020) and Kolokotroni (2023) observed that micro-scale overheating is caused by local form and context rather than regional climatic conditions [23,24]. Del Málaga et al. (2023) also attributed accelerated maintenance deficits in aging envelopes to thermal aging [25]. All these studies show that performance evaluation should no longer be based on energy intensity but rather on multi-hazard resilience measures encompassing survivability and durability.
Residential buildings account for about one-third of final energy consumption and contribute roughly 20 percent of global greenhouse gas emissions [1,2,3]. Attached brick row houses are a hallmark of this predicament in Baltimore: inefficient, worn-out, and highly exposed, especially in under-resourced communities [4,5,6,7,8,9]. Conventional energy-focused retrofits do not account for adaptive functions, including maintaining safe indoor conditions during outages, resistance to overheating, and material longevity [10,11,12,13]. It is projected that the region will experience further increases in humidity and extreme heat days in the middle of the century, posing a risk to occupant safety and structural stability [16,17,18]. Consequently, a single-metric emphasis on energy efficiency cannot provide resilience [19,20].
Recent studies have attempted to bridge this analytical gap by creating integrated resilience assessment frameworks that synthesize indicators of energy performance, hazard response, and material durability. Such nascent frameworks assess both mitigation potential through operational efficiency and adaptation potential, as expressed in a building's capacity to preserve safe indoor conditions and resist thermal and material stress [21,22,23,24]. In this setting, energy consumption pertains to mitigation potential; passive survivability defines thermal autonomy through power outages; overheating metrics exceed exceedance risk during extreme weather; and durability determines service-life reduction according to ISO 15686 principles [25,26,27]. Diagnosing where shortages occur within these parameters enables identifying the initial performance failure, thereby limiting a dwelling's overall resilience [28,29]. Baseline information on current U.S. row houses is still limited. Previous simulation research in Baltimore has focused mainly on full-year Energy Use Intensity (EUI) [33,34] or on rudimentary weatherization impacts [35,36], rarely connecting energy, survivability, and material degradation within a unified diagnostic framework. The absence of such multi-domain baselines constrains city retrofit initiatives' ability to prioritize investment based on measured resilience opportunities [37,38,39].
The cities, e.g., the Green Network Plan (2018) and the Climate Action Plan (2023), support the concept of retrofit-first, which combines cool roofs, energy-saving measures, and green infrastructure [46,47]. Nonetheless, there is no consistent quantitative diagnostic that could be used to convert simulation data into policy priorities [48,49,50]. DesignBuilder (EnergyPlus) and ENVI-met are now building-energy simulation (BES) tools that can be used to evaluate in detail the interactions among energy, microclimate, and surface temperatures [51,52,53]. Multi-hazard processes integrate indoor and outdoor processes, enabling the quantitative assessment of resilience [54,55], but decision synthesis is limited [56]. Housing-Performance Atlases, which are bundles of simulated and empirical indicators, are becoming valuable tools for visualizing multi-domain deficits and prioritizing retrofits [57,58,59,60].
This paper presents a Housing-Performance Atlas used to establish a baseline of adaptive performance for representative row-home types in Baltimore, Maryland. Behavior was measured against four necessary measures, namely: Energy Use Intensity (EUI), Safe-Zone Hours during 72 hours of power outages (passive survivability), Roof > 150°F degree-hours (overheating exposure), and an ISO-based service-life index (durability). Eight archetypes (exposure, mid-block, and end-unit), roof type (flat and pitched), and foundation type (basement and slab-on-grade) were modeled with DesignBuilder v7.0 (EnergyPlus v9.6) with Baltimore weather data (BWI Station 724060) in 10 minutes (timestep). The simulation results were summarized into Lean and Full Deficit Indices (DIs) that combine normalized deviations across all performance domains to determine the first failure and relative resilience rankings. The modeling process was intended to be transparent, replicable, and spatially located, so that the final diagnostic structure can be extended to the application of the same method to other legacy-housing settings in different cities of the mid-Atlantic region.
The study’s objectives are threefold:
(1) Define the multi-hazard baseline of Baltimore's representative rowhome archetypes;
(2) Integrate domain-specific measures with composite DI indicators for comparative resilience diagnosis;
(3) Develop an interoperable simulation-based model to rank retrofit and adaptation strategies in existing urban housing.
By integrating building-physics simulation and adaptation metrics, the Housing-Performance Atlas provides a reproducible method for determining where and how existing homes are under climatic stress, with implications for engineering design and equitable policy intervention. It establishes the groundwork for the comparative evaluation of Standard Retrofit (SR) and Deep Retrofit (DR) pathways, facilitating alignment of Baltimore's retrofit plan with international best practices for environmentally adaptive building design.
2. Materials and Methods
This study develops a Housing-Performance Atlas to quantify the baseline adaptive performance of representative row-home archetypes in Baltimore under current climatic conditions. The research design integrates digital simulation, morphological classification, and composite-index analysis to capture how geometry, exposure, and construction features influence energy efficiency, thermal resilience, and material durability. The methodological process followed five interlinked stages: (1) selection of performance indicators, (2) definition of archetypes, (3) numerical modeling and boundary configuration, (4) derivation of composite deficit indices, and (5) validation and sensitivity testing, shown in Figure 1.
2.1. Performance Indicator Selection
Four quantitative variables were selected to indicate the most critical dimensions of adaptation in legacy masonry housing: Energy Use Intensity (EUI), Safe-Zone Hours (SZH) of 72-hour outages, Roof > 150°F degree-hours, and Service-Life Index (SLI) based on ISO. They both identify the physical processes that contribute to occupant safety and material durability in Baltimore's hot, humid urban environment.
- Energy Use Intensity (EUI), defined as kBtu ft⁻²·yr⁻¹, is a measure of the total building energy demand when occupied under normal conditions and is used as the baseline for operational efficiency [9,33,34]. It is the most common indicator in benchmarking standards, including LEED and Energy Star [24,41], which enables it to cross-reference with empirical data, including the U.S. DOE RECS 2020 survey [5].
- Safe-Zone Hours (SZH) are the time during which the indoor operative temperature is kept within the range of 68-86°F in the event of a simulated 72-hour power interruption. The indicator is a measure of passive survivability, the capability of the building envelope and thermal mass to keep the building environment habitable in the event of a grid failure, an ever more pressing concern in Baltimore, where high-heat events and outage incidents frequently go hand in hand [18,20,21].
- Roof > 150 °F degree-hours cumulative surface-temperature exceedance above 150 °F calculated based on hourly roof-surface outputs in EnergyPlus [34]. The 150°F temperature marks the onset of softening of the bituminous membrane and the rapid deterioration of the sealant, as confirmed by ASTM E903 and ISO 15686 exposure tests [44,45]. This variable serves as a proxy for exposure to overheating and the amplification of the microclimate at the roof level [6,43].
- Lastly, the ISO-based Service-Life Index (SLI) converts the exposure to the environment into the anticipated life of the component (years). In accordance with ISO 15686-8 [45], the index adjusts the reference service life using temperature, moisture, and UV correction factors based on simulation results [59]. It is a compromise between the adaptation and asset-management approaches with a direct relationship between envelope durability and climatic stress [4,19].
2.2. Study Area Context
Baltimore, Maryland, located in the mid-Atlantic region of the United States (39.29° N, 76.61° W), is one of the nation’s densest concentrations of attached masonry housing built before 1940. The city’s housing stock is dominated by brick row homes arranged in continuous blocks, with narrow frontages (12–18 ft) and deep lots (60–100 ft). According to the Baltimore Housing Market Typology (2020) and BNIA–JFI spatial indicators [61,62], over 65% of all residential parcels in East and West Baltimore fall within the pre-World War II typology characterized by solid masonry walls, low-reflectance roofs, and limited yard setbacks. These neighborhoods, such as Broadway East, McElderry Park, and Upton, are among the most heat- and vacancy-exposed zones identified in the Baltimore Green Network Plan (2018). [63]
The city’s humid-subtropical climate (Köppen Cfa) experiences mean July air temperatures around 84 °F and frequent multi-day heat events exceeding 95 °F. Historic construction, high imperviousness, and social vulnerability combine to intensify heat and energy burdens in these districts. The present study, therefore, adopts Baltimore’s legacy row-home blocks as the analytical focus, using eight archetypes derived from the Property View and BNIA-JFI morphological datasets (shown in Figure 2) to capture the most representative forms across the eastern and western housing belts.
2.3. Archetype Definition and Parametric Matrix
The row-home inventory in Baltimore is highly geometric in character (built mainly from 1890 to 1940), though with high diversity in exposure, roof structure, and foundation status. Based on the Maryland Property View and BNIA-JFI morphology data [1,2,28], twelve original typologies were discovered in the pre-1940 housing inventory. Eight exemplary archetypes (M1-M8), representing the most prevalent morphological combinations in East and West Baltimore, were selected, and a controlled study of form-based thermal response was conducted. Each archetype had a constant conditioned floor area of 1,500 ft 2, which is comparable across both exposure and geometry categories. The mapped typologies and the chosen archetypes are shown in Figure 2, and Table 1 summarizes the defining characteristics of the archetypes.
To systematize the performance variability, the archetypes were created by a 2 x 2 x 2 factorial design, which varied three binary factors, such as exposure, roof form, and foundation type, which in combination cover more than 90% of the residential geometries in Baltimore.
- The level of lateral heat exchange is determined by exposure. Mid-block units have both sides of the party walls, conductive gain and loss are minimized, but end-units have three fully exposed facades, which add solar and wind loading by about 20-25 percent.
- The shape of the roof is a difference between traditional flat-roof masonry (bituminous or EPDM membranes) and pitched-roof retrofits (asphalt shingles). Pitched roofs have higher solar absorptance and convective heat transfer, whereas flat roofs have greater stagnation of heat and moisture.
- Vertical thermal coupling is controlled by foundation type. Mass in basement buildings helps balance temperature and humidity changes; slab-on-grade foundations, used in infill construction after 1950, react more quickly to day-night temperature changes and surface runoff.
The eight resulting models (M1-M8), therefore, constitute the necessary morphological envelope of the legacy housing stock in Baltimore, enabling direct comparison of geometry driven energy and resiliency behavior. They were all modeled with the same envelope properties, schedules, and material parameters to separate geometric effects. Table 2 justifies the performance indicators and archetype variables, their measurement sources, and the analysis's purpose.
2.4. Simulation Setup and Boundary Conditions
All simulations were conducted using DesignBuilder v7.0 with EnergyPlus v9.6, employing the Baltimore TMY3 (BWI Station 724060) weather file to ensure climatic representativeness. Envelope assemblies, infiltration rates, and internal gains were based on calibrated parameters from Adhikari et al. (2025) and the Department of Energy (DOE) residential prototypes [21,29,30], as shown in Table 3. Figure 3 shows the different modeled unit boundary conditions. Simulation timesteps were set to 10 minutes, enabling hourly aggregation for diagnostic comparison. The models assumed natural ventilation protocols during outages, constant occupancy (3 persons), and standardized lighting and equipment schedules. Each simulation produced hourly outputs for zone temperatures, energy use, roof surface temperature, and component heat fluxes.
2.5. Deficit Index (DI) Computation
To integrate these domains, Lean and Full Deficit Indices (DI) were calculated for each model. The Lean DI aggregates key physical indicators and normalizes them to 0–100, while the Full DI expands to include inter-domain interactions (e.g., overheating's impact on durability), as shown in Table 4. Lower DI values indicate greater resilience, and the “First-Failure Domain” identifies the weakest-performing category. This diagnostic metric is adapted from multi-criteria resilience scoring systems used in recent climate-adaptation research [35,36,37,38].
2.6. Sensitivity and Validation
Model robustness was tested through parametric sensitivity analysis across three envelope variables—albedo (0.25 → 0.75), infiltration (0.3 → 0.6 ACH), and thermal mass (brick density +15 %) shown in Table 5. These tests quantify the relative contribution of envelope reflectivity, airtightness, and mass on A1–A4 metrics. The baseline energy model was cross-validated against published EUI ranges for Baltimore rowhomes (45–70 kBtu/ft²·yr) [21,39] and DOE Residential Energy Consumption Survey (RECS 2023) data [40], yielding deviations of ±8 %.
3. Results
3.1. Energy Performance
The baseline energy performance of the eight archetypes ranged from 46.7 to 67.6 kBtu ft⁻² yr⁻¹, illustrating a strong dependency on exposure and height (Table 6 and Figure 4). Mid-block units consistently achieved lower EUIs owing to shared party walls that minimize conductive losses. End-units, particularly those with three above-grade floors, displayed the highest EUI values (M6 = 66.7 kBtu ft⁻² yr⁻¹; M8 = 67.55 kBtu ft⁻² yr⁻¹), reflecting elevated surface-area-to-volume ratios and higher envelope exposure. The roughly 20 kBtu ft⁻² yr⁻¹ difference between M1 and M8 aligns with national retrofit energy gaps reported by USDOE (2023) and Kolokotroni (2023) [24,40].
3.2. Passive Survivability
Safe-Zone Hours (SZH) during a 72-h summer outage revealed critical differences in survivability (Table 7 and Figure 5). Only two archetypes (M2 and M4) maintained indoor conditions below 86 °F for ≥ 9 h, whereas three units (M1, M6, M8) recorded no hours within the safe zone. Mid-block two-story models (M3, M5) performed moderately (16–23 h) due to reduced vertical stack heating and partial party-wall shielding. Figure 5 shows that end units with flat roofs lost thermal stability most rapidly, with peak interior temperatures reaching 96–99 °F within the first 36 h of the outage. These findings echo urban heat survivability patterns observed in Chicago and Philadelphia case studies (Rodrigues et al., 2019; Li et al., 2024) [31,32].
3.3. Roof Overheating Risk
Roof-temperature analysis highlighted pronounced differences between flat and pitched configurations. Roof surface temperature data were obtained from the EnergyPlus variable Surface Outside Face Temperature recorded at a 10-minute timestep (Timestep,6). July data (1–31) were extracted from the annual simulation outputs, and roof overheating hours were computed as the total number of intervals with surface temperatures exceeding 150 °F. Degree-hours were calculated as the sum of temperature exceedances above 150 °F multiplied by the 10-minute interval. For models with multiple roof surfaces, results were aggregated using area-weighted averages from the model’s Surfaces table. The corresponding IDF request is provided in the Supplementary Information. As shown in Table 8 and Figure 6, flat roofs accumulated greater solar loads, averaging 165–210 hours above 150 °F during July’s 455 daylight hours. Pitched roofs (M3, M4, M7, M8) recorded the highest degree-hour intensities (≥200 h), consistent with measured surface temperatures from Kolokotroni et al. (2023) and Santamouris (2020) [23,24]. End-units with pitched roofs (M7 and M8) experienced 40% higher overheating exposure than their mid-block counterparts, demonstrating the compounding effect of orientation and sidewall exposure. Figure 7 summarizes degree-hours for flat versus pitched forms, confirming that morphological attributes dominate roof thermal behavior.
3.4. Material Durability
The temperature-based ISO durability indices ranged from 62 % (M4) to 84 % (M5), equivalent to approximately 31–42 service years remaining (Table 9 and Figure 7). Durability loss was strongly correlated with roof-surface temperature, with a regression slope of −1.2 years·°C⁻¹ (≈−2.2 years per +10 °F), consistent with heat-induced material fatigue reported by Del Málaga et al. (2023) and Li et al. (2024) [25,41]. Flat-roof mid-block models (M5) exhibited the most extended expected service life due to reduced thermal cycling, while three-story exposures (M2, M4, M6, M8) showed accelerated aging from elevated solar and convective loads. These results confirm that thermal exposure is the dominant durability driver across archetypes, underscoring the need for high-albedo, ventilated roof retrofits to mitigate long-term material fatigue. Robust checks, including minor penalties for moisture and wind, did not alter the ranking.
3.5. Composite Diagnostics and Deficit Indices
Integration of the four domains into Lean and Full Deficit Indices revealed distinct performance hierarchies (Figure 8 and Table 10). Average Lean DI scores ranged from 9.7 (M5) to 91.5 (M8), while Full DI values ranged from 7.8 to 92.4 (Table 8). Lower DI values signify higher resilience; thus, M5 (End-Flat-2F) and M3 (Mid-Pitch-2F) emerged as the most adaptation-ready archetypes. Conversely, M8 (End-Pitch-3F) exhibited the highest deficit (Full DI ≈ 92), with A1 Energy identified as the first-failure domain. Across the set, A4 Overheating and A3 Survivability accounted for 70 % of total deficits, confirming that thermal safety and heat stress dominate Baltimore’s retrofit priorities. These patterns are consistent with urban resilience analyses in three studies: Santamouris (2020), Gopinath et al. 2024, and Zhu et al. (2025) [23,41,42].
3.6. Sensitivity Outcomes
Sensitivity tests (Table 11) demonstrated that increasing roof albedo from 0.25 to 0.75 reduced A4 degree-hours by ≈ 18 % and extended service life by ≈ 1.6 years. Lowering infiltration from 0.6 to 0.3 ACH decreased EUI by ≈ 8%, while raising thermal mass by 15% increased safe-zone hours by ≈ 5 h under outage conditions. The combined retrofit scenario (“high albedo + low infiltration + mass increase”) improved Lean DI by ≈ 12 points, confirming that envelope enhancements can partially offset morphological disadvantages. These parametric findings corroborate global evidence that simple envelope interventions yield high adaptive value relative to cost [33,35,36].
4. Discussion
The findings of the Housing-Performance Atlas confirm that legacy Baltimore row homes are operating at the edge of climatic vulnerability, where minor geometric or exposure variations can significantly alter adaptive capacity. Energy, thermal, and durability results are widely dispersed across the archetypes, indicating that efficiency metrics do not adequately reflect the housing stock's resilience. Across all eight configurations, the Energy Use Intensity ranged from 46.7 to 67.6 kBtu ft⁻²·yr⁻¹, . However, safe-zone survivability hours during a 72-h outage ranged from 0 to 23 h, and roof overheating lasted 150-210 h at 150 °F. These nonlinear discrepancies confirm the new view that adaptation performance cannot be replaced by operational energy savings in hot-humid urban climates [1,2].
The data show that morphology regulates resilience more than construction age or material type. Mid-block units have the advantage of shared party walls that reduce conductive gain and loss, and end-units have approximately 25% higher EUI and four times less survivability. Basement conditions consistently improve performance across three areas, energy, survivability, and durability by 6 to 10 percent, with thermal inertia that attenuates diurnal variations. On the other hand, height and roof pitch increase envelope exposure and radiant absorption, thereby increasing overheating and service-life loss. The worst performer, M8 (end-unit, pitched roof, 3F above-grade), has all the undesirable characteristics: maximum exposure, minimum sub-grade mass, and high thermal surface area, leading to a Full DI of 92% and energy and durability failures.
Adaptation hierarchies are also further explained by the distribution of first-failure domains. The most common primary deficit was Roof overheating, then survivability, energy, and durability. This result highlights the fact that the operative limit of habitability during extreme events is not determined by energy efficiency but by thermal safety. The practical application of retrofit sequencing would thus require interventions that address surface temperature and indoor safe-zone stability, followed by incremental energy savings. These results align with the adaptive-mitigation ladder proposed by Ascione et al. [3], in which heat resilience serves as the basis for the next stage of efficiency gains.
The material durability results also support this interdependence. The service-life index ranged from 31 to 42 years, indicating that roof life could be reduced by 10 years under high-exposure conditions. A 10°F rise in average roof-surface temperature was associated with a loss of service life of about 2.5 years, consistent with ISO 15686-8 exposure factors and empirical data on bituminous membranes [4]. These correlations underscore that the concept of durability is thermally mediated: the very processes that threaten occupants by exposing them to heat are also those that accelerate envelope decay. Therefore, there is no way to consider adaptation without accounting for asset management.
Composite Lean and Full Deficit Indices are concise measures of multi-domain resilience. The values of lean DI were 9.7-91.5, and Full DI were 7.8-92.4. The ranking M5 (best) > M3 > M7 > M2 > M1 > M4 > M6 > M8 (worst) represents a near-logarithmic deterioration in performance with increasing exposure. The extremely low DI of M5 (end-unit flat + basement) indicates the stabilizing effect of sub-grade coupling and compact geometry. The second-best competitor, M3 (mid-block pitched + basement) is a compromise of moderate energy consumption and regulated overheating of the roof. On the other hand, the tall end-units (M6, M8) reveal the compounding effect of amplified heat and the rapid degradation of materials, proving that vertical extension without simultaneous envelope upgrades undermines resilience.
The fact that thermal domains (A3 + A4) account for 70 percent of total DI variance confirms that the adaptation deficit in Baltimore is mainly heat-related. Heat gain, survivability, and degradation pathways are determined by microclimatic context and geometry, even with the exact envelope specifications. The trends align with the city-level results reported by Santamouris (2020) and Synnefa et al. (2020), where local form is more significant than material conductivity in defining the intensity of heat risk [5,6]. The Atlas maps these lessons to the building level, offering a scalable method for quantifying retrofit prioritization.
From a policy standpoint, the Atlas transforms abstract resilience concepts into actionable diagnostics. Lean/Full DI thresholds can delineate Retrofit Triage Bands:
Tier 1 (Standard Retrofit) DI < 40 → low-cost envelope and ventilation upgrades;
Tier 2 (Deep Retrofit) 40–70 → comprehensive insulation, cool-roof, and HVAC electrification;
Tier 3 (Standard Retrofit + Green Infrastructure) > 70 → combined building + green-infrastructure interventions.
This stratification aligns with the European Renovation Passport logic [7] and can be implemented in the Baltimore Climate Plan to distribute incentives based on need and potential impact.
The distribution of high-DI archetypes across space organically defines the dimensions of equity. End-unit conditions are prevalent along block edges and vacant-lot perimeters, which overlap with historically disinvested neighborhoods, including Broadway East and Upton. Therefore, the lack of thermal and durability is associated with socio-economic deprivation, which supports the trends of environmental injustice reported in U.S. legacy cities [8]. The Atlas thus goes beyond technical assessment to provide a diagnosis of spatial resilience inequity, which equips municipalities with a data-driven instrument for equitable adaptation investment.
Implications of retrofit design engineering are also clear. A 30-35% reduction in degree-hours and 8–10-year service life increases with increasing roof solar reflectance (0.35-0.70) and halved infiltration (AH = 1.0 - 0.5) to lower EUI and safe-zone hours by 10 and 4 percent, respectively. These relationships determine the roof's reflectivity, airtightness, and controlled ventilation as the first-order, cost-effective resilience gains.
The Atlas methodologically confirms that high-resolution simulation is a plausible proxy for empirical diagnostics when field data are scarce. Model robustness is ensured by calibration to metered energy use (+/- 8 %) and by consistency between EnergyPlus temperature patterns. However, its limitations also become apparent in the analysis. The external factors to the model are occupant behavior, moisture transport, long-term degradation kinetics, and subsequent stages shall incorporate sensor-based validation and cost-carbon coupling to increase its predictive fidelity.
In general, the Atlas supports urban-housing adaptation as an objective engineering approach rather than a qualitative policy goal. It brings building physics into the decision-making process and equity planning by capturing the interplay among energy, heat, survivability, and durability through a single diagnostic lens. The resulting hierarchy, in which thermal safety overrides efficiency, indicates a fundamental shift like retrofits in legacy cities: not lower kilowatt-hours but safer degrees Fahrenheit. This diagnostic can be incorporated into municipal programs to help Baltimore shift its energy-focused compliance toward truly climate-responsive, equitable housing performance.
5. Conclusions
This study established a Housing-Performance Atlas for Baltimore’s legacy row homes, providing a multi-domain diagnostic that integrates energy, survivability, overheating, and durability under present-day climate conditions. Using DesignBuilder v7.0 (EnergyPlus v9.6) simulations and Baltimore TMY3 boundary data, eight archetypes were evaluated through the A1–A5 + C adaptation framework. Results reveal that form, exposure, and ground coupling govern resilience more strongly than material specification or construction age. Energy Use Intensity ranged from 46.7 to 67.6 kBtu ft⁻² yr⁻¹, yet thermal survivability ranged from 0 to 23 h and roof overheating persisted 150–210 h above 150 °F, confirming the weak correlation between efficiency and safety.
Composite Lean and Full Deficit Indices (DI = 7.8–92.4) captured resilience gradients across archetypes. The most resilient configuration, M5 (end-unit flat + basement), achieved the lowest DI (≈ 8), while the least resilient, M8 (end-unit pitched + 3F above-grade), recorded DI ≈ 92. Thermal domains accounted for roughly 70 % of total deficits, establishing overheating and survivability as the dominant failure modes in Baltimore’s aging housing stock. These findings redefine retrofit sequencing: thermal-safety stabilization and roof-temperature control must precede energy-efficiency upgrades. The Atlas, therefore, functions as both a research tool and a decision-support mechanism, enabling municipalities to prioritize limited retrofit funding toward geometries and neighborhoods where adaptation returns are greatest.
The study also advances methodological transparency by translating complex simulation outputs into a clear, reproducible index structure. The integration of service-life modeling (ISO 15686) with heat-exceedance metrics bridges building physics, asset management, and resilience policy, supporting Baltimore’s transition from energy-centric codes to climate-responsive redevelopment. Beyond its local relevance, the Atlas framework is transferable to similar mid-Atlantic cities characterized by attached masonry housing and growing urban-heat burdens.
Limitations
While the Housing-Performance Atlas establishes a reproducible baseline, several limitations remain. The simulations represent steady-occupancy and controlled-behavior conditions, excluding stochastic effects such as window operation, thermostat settings, and shading behavior, which can significantly influence survivability and overheating outcomes. Material durability estimations rely on ISO 15686 exposure factors rather than long-term empirical degradation data, potentially under- or overestimating service-life reductions under urban heat-island conditions. The study also omits stormwater and cost/carbon (+C) domains, which will be addressed in subsequent research phases to capture the full spectrum of adaptation co-benefits and to integrate standard retrofitting with green infrastructure pathways. Moreover, validation was limited to cross-comparison with benchmarked metered data; future work should incorporate in-situ temperature and humidity sensors to calibrate real-time resilience performance. Despite these constraints, the diagnostic reliability of ±8 % for energy predictions and the consistent qualitative heat-mapping patterns confirm the robustness of the framework for comparative analysis and methodological replication.
Author Contributions
Conceptualization: Alex Nwosu. Methodology: Alex Nwosu, Bello, Dr. Hunter; Validation: Alex Nwosu, Bello; Formal analysis: Alex Nwosu; Investigation: Alex Nwosu, Bello; Resources: Alex Nwosu; Data curation: Alex Nwosu; Writing – original draft preparation: Alex Nwosu; Writing – review and editing: Alex Nwosu, Bello, Dr. Hunter; Visualization: Alex Nwosu, Bello; Supervision: Dr. Hunter; Project administration: Alex Nwosu; Funding acquisition: Dr. Hunter.
Funding
This research was supported by the Baltimore Social-Environmental Collaborative (BSEC) project funded by DOE BER under Contract DE-FOA-0002581.
Data Availability Statement
The original contributions presented in this study are included in the article and its supplementary material. Further inquiries can be directed to the corresponding author(s).
Acknowledgments
We thank the Department of Civil Engineering at Morgan State for academic and administrative support. Special appreciation is extended to the Baltimore Social–Environmental Collaborative (BSEC), notably the Building and Energy Team, for their insights and collaboration. Additional thanks go to the reviewers whose constructive feedback helped enhance the quality and clarity of this manuscript.
Conflicts of Interest
The authors declare that they have no conflicts of interest.
References
- International Energy Agency (IEA). World Energy Outlook 2023. [CrossRef]
- Intergovernmental Panel on Climate Change (IPCC). AR6 Synthesis Report 2023. [CrossRef]
- Waddicor, D.A.; Fuentes, E.; Sisó, L.; Salom, J.; Favre, B.; Jiménez, C.; Azar, M. Climate Change and Building Ageing Impact on Building Energy Performance and Mitigation Measures Application: A Case Study in Turin, Northern Italy. Building and Environment 2016, 102, 13–25. [Google Scholar] [CrossRef]
- Taki, A.; et al. The Impact of Degradation on a Building’s Energy Performance. Sustainability 2023, 15, 1145. [Google Scholar] [CrossRef]
- Miranda, N.D.; Lizana, J.; Sparrow, S.N.; Zachau-Walker, M.; Watson, P.A.G.; Wallom, D.C.H.; Khosla, R.; McCulloch, M. Change in Cooling Degree Days with Global Mean Temperature Rise Increasing from 1. 5 °C to 2.0 °C. Nat. Sustain. 2023, 6, 1326–1330. [Google Scholar] [CrossRef]
- Spangler, K.R.; Wellenius, G.A. Spatial Patterns of Recent US Summertime Heat Trends: Implications for Heat Sensitivity and Health Adaptations. Environ. Res. Commun. 2020, 2, 035002. [Google Scholar] [CrossRef]
- Siegel, E.L.; Lane, K.; Yuan, A.; Smalls-Mantey, L.A.; Laird, J.; Olson, C.; Hernández, D. Energy Insecurity Indicators Associated with Increased Odds of Respiratory, Mental Health, and Cardiovascular Conditions. Health Affairs 2024, 43, 260–268. [Google Scholar] [CrossRef]
- Sakka, A.; Santamouris, M.; Livada, I.; Nicol, F.; Wilson, M. On the Thermal Performance of Low Income Housing during Heat Waves. Energy and Buildings 2012, 49, 69–77. [Google Scholar] [CrossRef]
- Berdahl, P.; Akbari, H.; Levinson, R.; Miller, W.A. Weathering of Roofing Materials—An Overview. Construction and Building Materials 2008, 22, 423–433. [Google Scholar] [CrossRef]
- Doan, D.T.; Ghaffarianhoseini, A.; Naismith, N.; Zhang, T.; Ghaffarianhoseini, A.; Tookey, J. A Critical Comparison of Green Building Rating Systems. Building and Environment 2017, 123, 243–260. [Google Scholar] [CrossRef]
- Sánchez Cordero, A.; Gómez Melgar, S.; Andújar Márquez, J.M. Green Building Rating Systems and the New Framework Level(s): A Critical Review of Sustainability Certification within Europe. Energies 2020, 13, 66. [Google Scholar] [CrossRef]
- Siu, C.Y.; O’Brien, W.; Touchie, M.; Armstrong, M.; Laouadi, A.; Gaur, A.; Jandaghian, Z.; Macdonald, I. Evaluating Thermal Resilience of Building Designs Using Building Performance Simulation—A Review of Existing Practices. Building and Environment 2023, 234, 110124. [Google Scholar] [CrossRef]
- Awadh, O. Sustainability and Green Building Rating Systems: LEED, BREEAM, GSAS and Estidama—Critical Analysis. Journal of Building Engineering 2017, 11, 25–29. [Google Scholar] [CrossRef]
- Felicioni, L.; Lupíšek, A.; Gaspari, J. Exploring the common ground of sustainability and resilience in the building sector: A systematic literature review and analysis of building rating systems. Sustainability 2023, 15, 884. [Google Scholar] [CrossRef]
- Bi Obam Assoumou, S.S.; Zhu, L.; Khayeka-Wandabwa, C. Healthy building standards, their integration into green building practices and rating systems for one health. Discover Sustainability 2025, 6, 796. [Google Scholar] [CrossRef]
- Singh, P.; et al. Developing adaptive resilience in infrastructure systems. International Journal of Disaster Resilience in the Built Environment 2023. [CrossRef]
- Dong, B.; Liu, Y.; Fontenot, H.; Ouf, M.; Osman, M.; Chong, A.; Qin, S.; Salim, F.; Xue, H.; Yan, D.; et al. Occupant behaviour modelling methods for resilient building design, operation and policy at urban scale: A review. Appl. Energy 2021, 293, 116856. [Google Scholar] [CrossRef]
- Saifudeen, A.; Khan, I.; El-Shimy, M.; Alajmi, A.; Algarni, A.; Alhejji, M. Adaptation of buildings to climate change: an overview. Front. Built Environ. 2024, 10, 1327747. [Google Scholar] [CrossRef]
- Khoja, A.; Danylenko, O. Charting climate adaptation integration in smart building rating systems: a comparative study. Front. Built Environ. 2024, 9, 1333146. [Google Scholar] [CrossRef]
- Krelling, A.F. Thermal resilience of buildings and communities. Annu. Rev. Environ. Resour. 2025, 50, 1–26. [Google Scholar] [CrossRef]
- Adhikari, R.; Sui, J.; Yang, Y.; O’Donnell, J.; Hewitt, N.; Zuo, W. Energy Efficiency and Thermal Resilience Analysis for Row Houses Using Representative Building Energy Models. Building and Environment 2025, 282, 113229. [Google Scholar] [CrossRef]
- Khoshbakht, M.; et al. Passive design in housing. Building and Environment 2018, 128, 70–83. [Google Scholar] [CrossRef]
- Michael Santamouris. “Recent progress on urban overheating and heat island research: Integrated assessment of the energy, environmental, vulnerability and health impact synergies with global climate change.” Energy & Buildings 2020, 207, 109482. [CrossRef]
- Maria Kolokotroni; Zune, M. ; et al. “Impact of the urban environment on the thermal performance and environmental quality of residential buildings: A case study in Athens.” Energies 2025, 18, 2062. [CrossRef]
- Del Málaga, M.; et al. “Environmentally Responsive Materials for Building Envelope: A Review on Durability, Aging and Dynamic Response. ” Materials 2023, 16, 3848. [Google Scholar] [CrossRef]
- Bano, F. “Roofing systems and energy efficiency in low-rise buildings. ” Energy & Buildings 2024, 329, 113321. [Google Scholar] [CrossRef]
- Magni, M.; et al. “Detailed cross-comparison of building energy simulation time step sensitivities. ” Energy and Buildings 2021, 253, 111552. [Google Scholar] [CrossRef]
- Castaño-Rosa, R.; Hamilton, A.; Porras, D.; Felipe-Sotelo, M.; Pérez, G. Resilience in the Built Environment – Key Characteristics for Definition and Application. Building and Environment 2022, 227, 109723. [Google Scholar] [CrossRef]
- Wang, W.L.; Toftum, J.; Olesen, B.W. Determination of Individual Building Performance Targets for Smart Retrofitting of Residential Buildings. Journal of Sustainable Built Environment 2022, 14, 100859. [Google Scholar] [CrossRef]
- ANSI/American Society of Heating, Refrigerating and Air-Conditioning Engineers (ASHRAE). Standard 55-2017 – Thermal Environmental Conditions for Human Occupancy. Atlanta, GA: ASHRAE; 2017. [CrossRef]
- Moret Rodrigues, A.; Santos, M.; Gomes, M.G.; Duarte, R. “Impact of Natural Ventilation on the Thermal and Energy Performance of Buildings in a Mediterranean Climate. ” Buildings 2019, 9, 123. [Google Scholar] [CrossRef]
- Li, W.; Zhang, J.; et al. “Natural Ventilation Cooling Effectiveness Classification for Buildings. ” Scientific Reports 2024, 14, 66684. [Google Scholar] [CrossRef]
- Ozcan-Deniz, G.; Fryer, R.; De Castro Amorim Ferreira, A. The Design of Net-Zero-Energy Affordable Housing in Philadelphia. Designs 2018, 2, 26. [Google Scholar] [CrossRef]
- Zhao, Q.; Li, Z.; Gallegos, A.; et al. “Rooftop Surface Temperature Analysis in an Urban Residential Environment. ” Remote Sensing 2015, 7, 12135. [Google Scholar] [CrossRef]
- Kontokosta, C.E.; Spiegel-Feld, D. “Estimating the Effect of Building Retrofit Programs on Energy Savings in Low-Income Multifamily Housing. ” Applied Energy 2020, 263, 114614. [Google Scholar] [CrossRef]
- Wilson, C.; Dowlatabadi, H. “Behavioral Retrofit Dynamics: Homeowner Decision-Making and Energy Savings Realism. ” Energy Policy 2022, 164, 112915. [Google Scholar] [CrossRef]
- Liyanage, D.R.; Soebarto, V.; & Palermo, D. ; & Palermo, D. “Climate adaptation of existing buildings: A critical review of retrofit practitioners and their decision-making frameworks.” Renewable and Sustainable Energy Reviews 2024, 203, 112472. [Google Scholar] [CrossRef]
- Joo, M.R.; Lemu, H.; Tokdemir, O.; et al. “Performance-based selection of pathways for enhancing seismic resilience and retrofit prioritization of building portfolios.” International Journal of Disaster Resilience in the Built Environment 2023, (vol.? [CrossRef]
- Rezvani, S.M.H.S.; Falcão, M.J.; Komljenović, D.; de Almeida, N.M. “A systematic literature review on urban resilience enabled with asset and disaster risk management approaches and GIS-based decision support tools. ” Applied Sciences 2023, 13, 2223. [Google Scholar] [CrossRef]
- Dong, B.; Xia, X. ; “Occupant behaviour modelling methods for resilient building design…” Applied Energy 2021, 293, 116856. [CrossRef]
- Gopinath, S.; Kumar, A.; Lavanya, E. Thermal Properties of Multiple-Wythe Masonry Overlayed with Textile Reinforced Concrete Sandwich Panels. Sādhanā 2023, 48, 39. [Google Scholar] [CrossRef]
- Zhu, W.; Yuan, C. “Urban heat health risk assessment in Singapore to support resilient urban design — by integrating urban heat and the distribution of the elderly population. ” Cities 2023, 132, 104103. [Google Scholar] [CrossRef]
- Yang, Y.; Chen, Z.; Wang, J.; et al. Review of Cooling Effects from Roof Mitigation Strategies. Buildings 2025, 15, 3835. [Google Scholar] [CrossRef]
- ASTM International. ASTM E903-20: Standard Test Method for Solar Absorptance, Reflectance, and Transmittance of Materials Using Integrating Spheres; ASTM International: West Conshohocken, PA, USA, 2020. [Google Scholar]
- International Organization for Standardization. ISO 15686-1:2020: Buildings and Constructed Assets — Service Life Planning — Part 1: General Principles and Framework; ISO: Geneva, Switzerland, 2020. [Google Scholar]
- City of Baltimore Department of Planning. Baltimore Green Network Plan 2018. Baltimore City Department of Planning, Baltimore, MD, USA, 2018. Available online: https://planning.baltimorecity.
- City of Baltimore Office of Sustainability. Baltimore Climate Action Plan Update 2023. Baltimore Office of Sustainability, Baltimore City, MD, USA, 2023. Available online: https://www.baltimoresustainability.
- Pan, Y.; Shazali, M.; Wu, Z.; Unger, J. ; “Building energy simulation and its application for retrofit decision-making: status, challenges, and future directions. ” Energy & Buildings 2023, 295, 113025. [Google Scholar] [CrossRef]
- Kong, L.; Ding, G.; Fan, P.; Liu, H. ; “The application of resilience theory in urban development: A systematic review. ” Sustainability 2022, 14, 1200. [Google Scholar] [CrossRef]
- Hassan, A. N. M.; Hachem-Vermette, C. ; “A Data-Driven Decision-Making Tool for Prioritizing Resilience Strategies in Cold-Climate Urban Neighborhoods. ” Energies 2025, 18, 5421. [Google Scholar] [CrossRef]
- Balocco, C.; Bragaglia, E.; Danielski, F.; Santamouris, M. Coupling a Building Energy Simulation Tool with a Microclimate Model to Assess the Impact of Cool Pavements on the Building’s Energy Performance: Application in a Dense Residential Area. Sustainability 2019, 11, 2519. [Google Scholar] [CrossRef]
- Sezer, N.; et al. Urban Microclimate and Building Energy Models: A Review. Renewable and Sustainable Energy Reviews 2023, 174, 113256. [Google Scholar] [CrossRef]
- Fahmy, M.; Sharples, S.; Eltrapolsi, A. Dual Stage Simulations to Study the Microclimatic Effects of Trees on Thermal Comfort in a Residential Building, Cairo, Egypt. Proceedings of Building Simulation 2009: 11th Conference of IBPSA 2009, 1730–1736. [CrossRef]
- Bianchi, S.; Matteoni, M.; Kim, K.; Koniari, A.M.; Koning, K.; Costache, R.; Ciobotaru, N.; Luna-Navarro, A.; Peng, Z.; Ciurlanti, J.; Shahriari, H.; Mittal, D.; Stavridou, E.; Silva, A.; Palmieri, M.; Pampanin, S.; Overend, M. “Resilience Readiness Levels for Buildings: Establishing Multi-Hazard Resilience Metrics and Rating Systems. ” Int. J. Disaster Risk Reduct. 2025, 128, 105746. [Google Scholar] [CrossRef]
- Al Assaad, D.; et al. “A Novel Quantitative Assessment Framework of the IAQ Resilience of Buildings. ” Build. Environ. 2023, 241, 110151. [Google Scholar] [CrossRef]
- Elkady, S.; Radhakrishnan, A.; Nofal, M.; Wen, J. “Decision-making for community resilience: A review of the literature. ” Cities 2024, 150, 104210. [Google Scholar] [CrossRef]
- Johansson, T.; Olofsson, T.; Mangold, M. Development of an energy atlas for renovation of the multifamily building stock in Sweden. Appl. Energy 2017, 203, 723–736. [Google Scholar] [CrossRef]
- Eriksson, P.; Johansson, T. Towards differentiated energy renovation strategies for heritage-designated multifamily building stocks. Heritage 2021, 4, 4318–4334. [Google Scholar] [CrossRef]
- Aruta, G.; Ascione, F.; Bianco, N.; Bindi, L.; Iovane, T. Energy Classification of Urban Districts to Map Buildings and Prioritize Energy Retrofit Interventions: A Novel Fast Tool. Appl. Energy 2025, 377, 124664. [Google Scholar] [CrossRef]
- Chen, Y.; Hong, T.; Piette, M.A. City-Scale Building Retrofit Analysis: A Case Study Using CityBES. Proc. 15th Int. Conf. Int. Build. Perform. Simul. Assoc. 2017, 259–266. [Google Scholar] [CrossRef]
Figure 1.
Workflow diagram: archetype selection → simulation → DI → Atlas output.
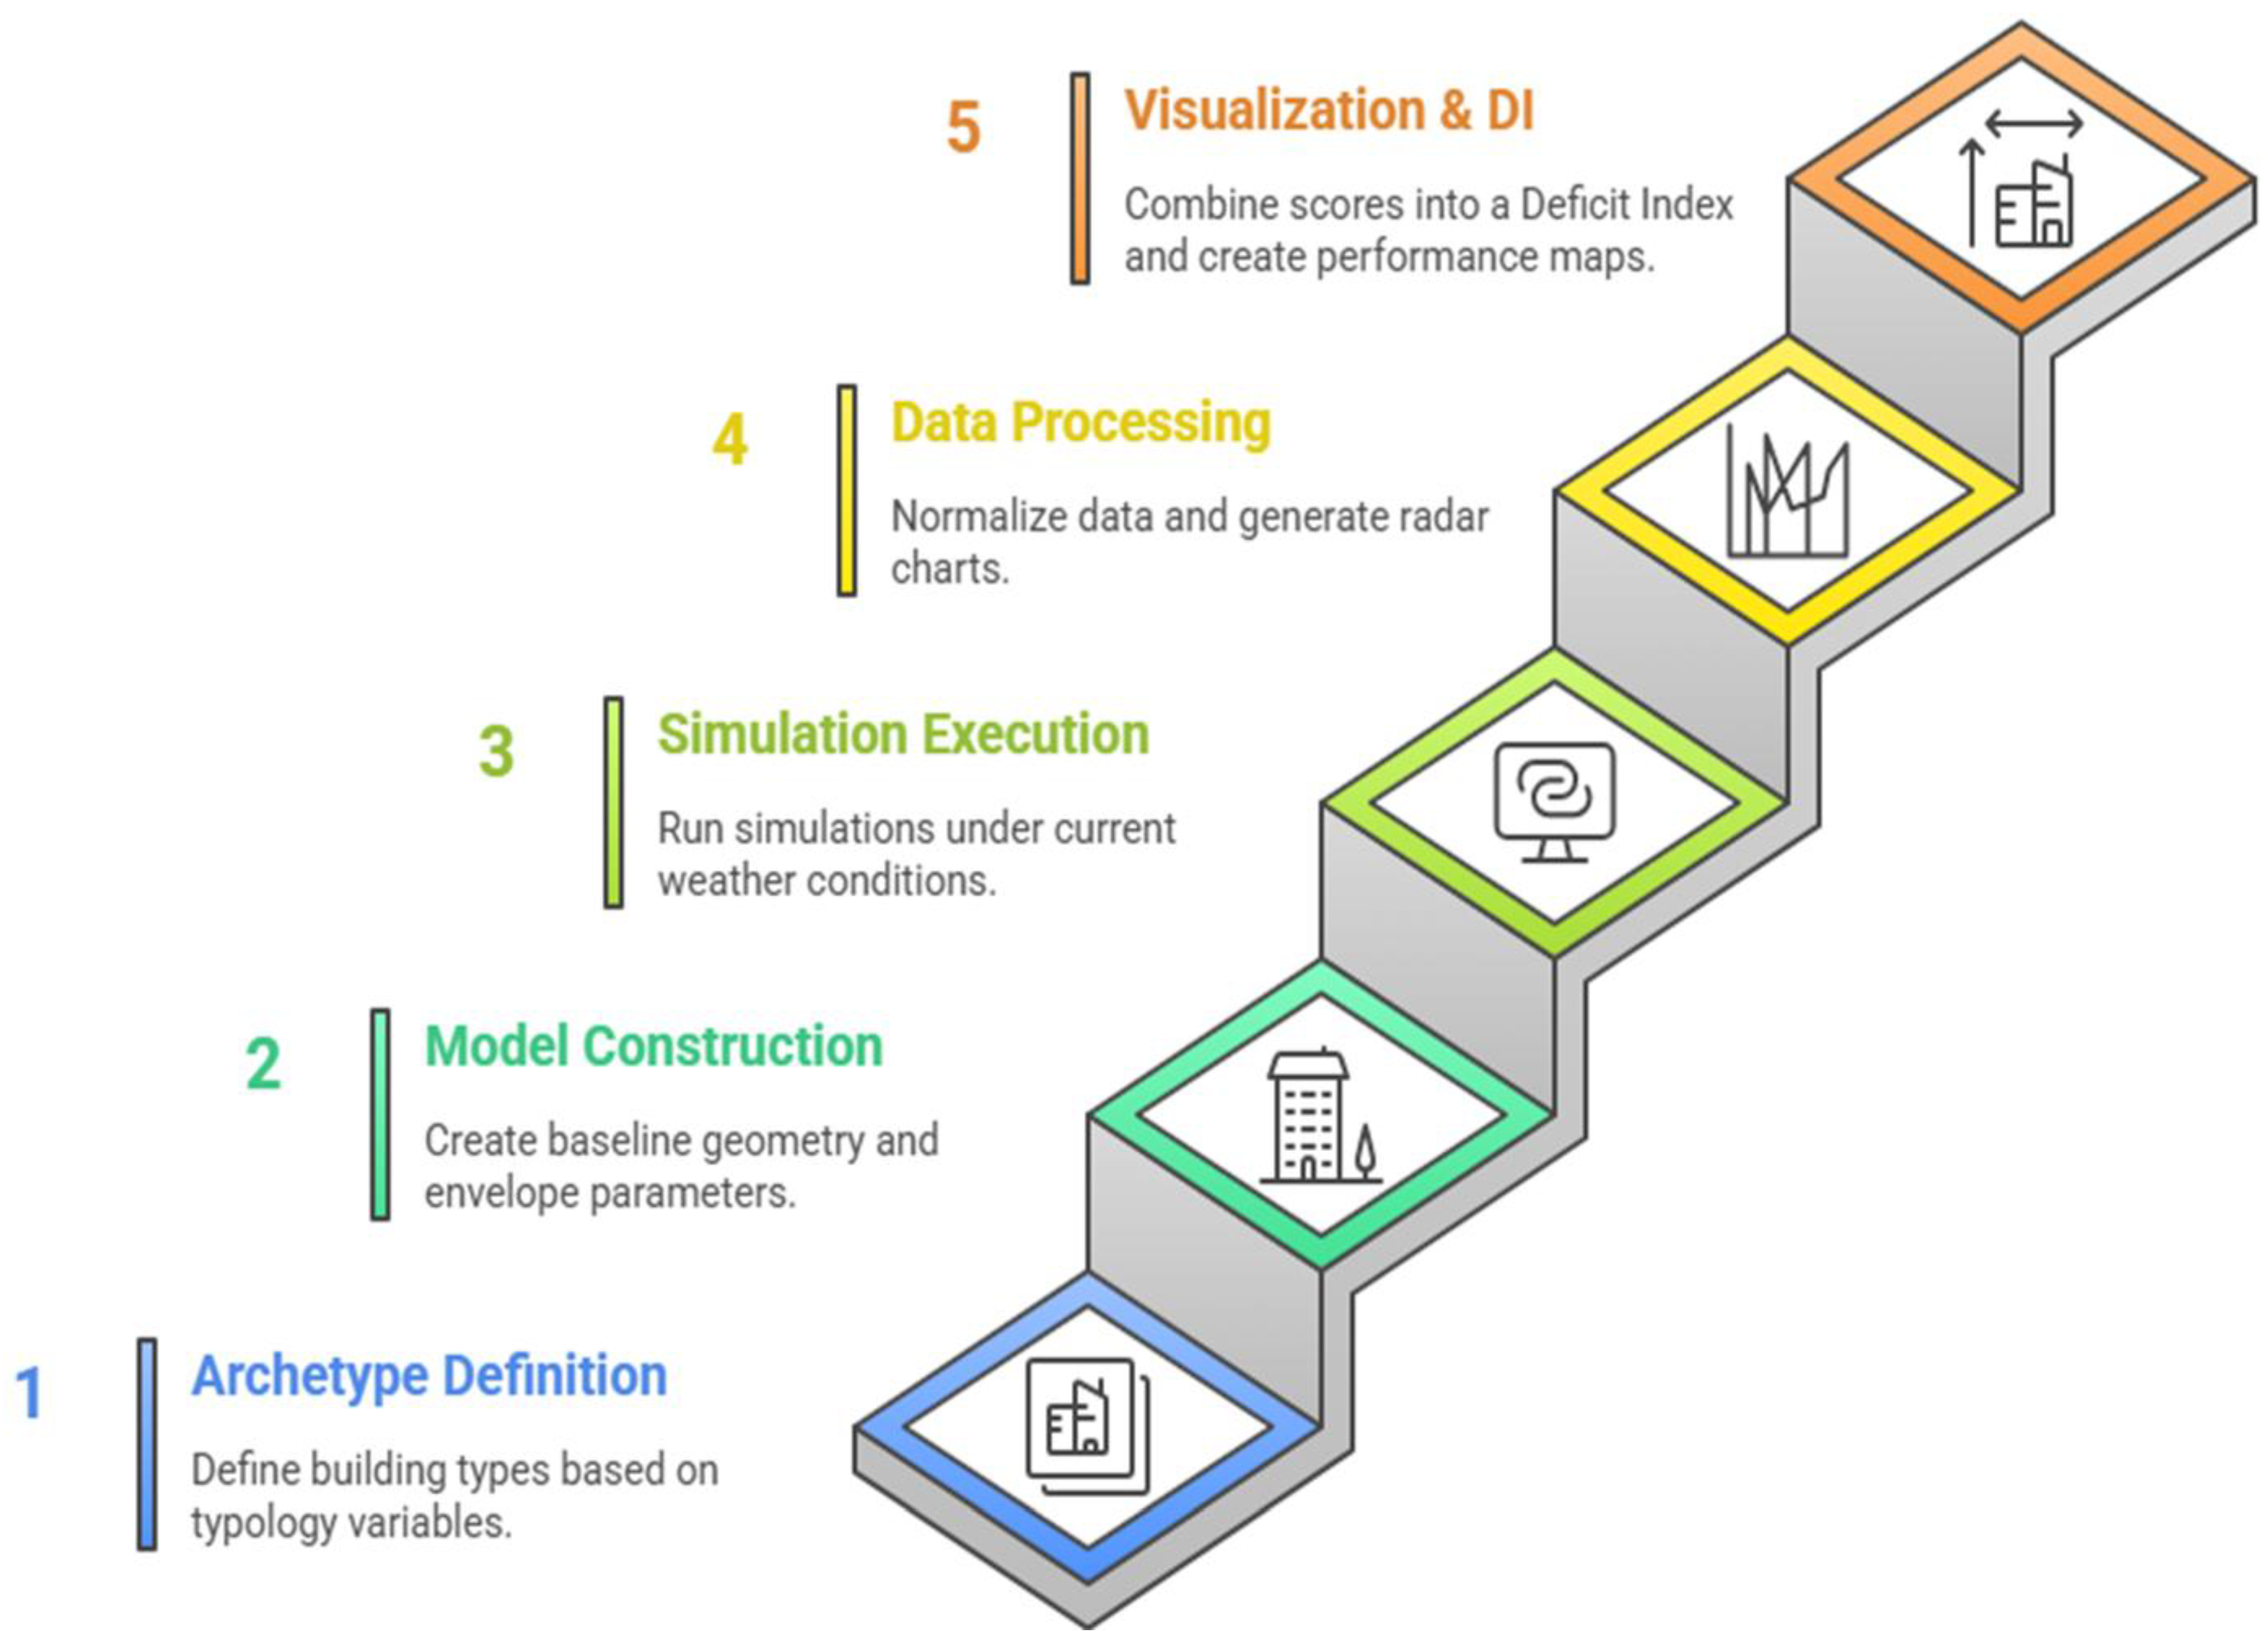
Figure 2.
Map of Baltimore row-home typologies and selected archetypes.
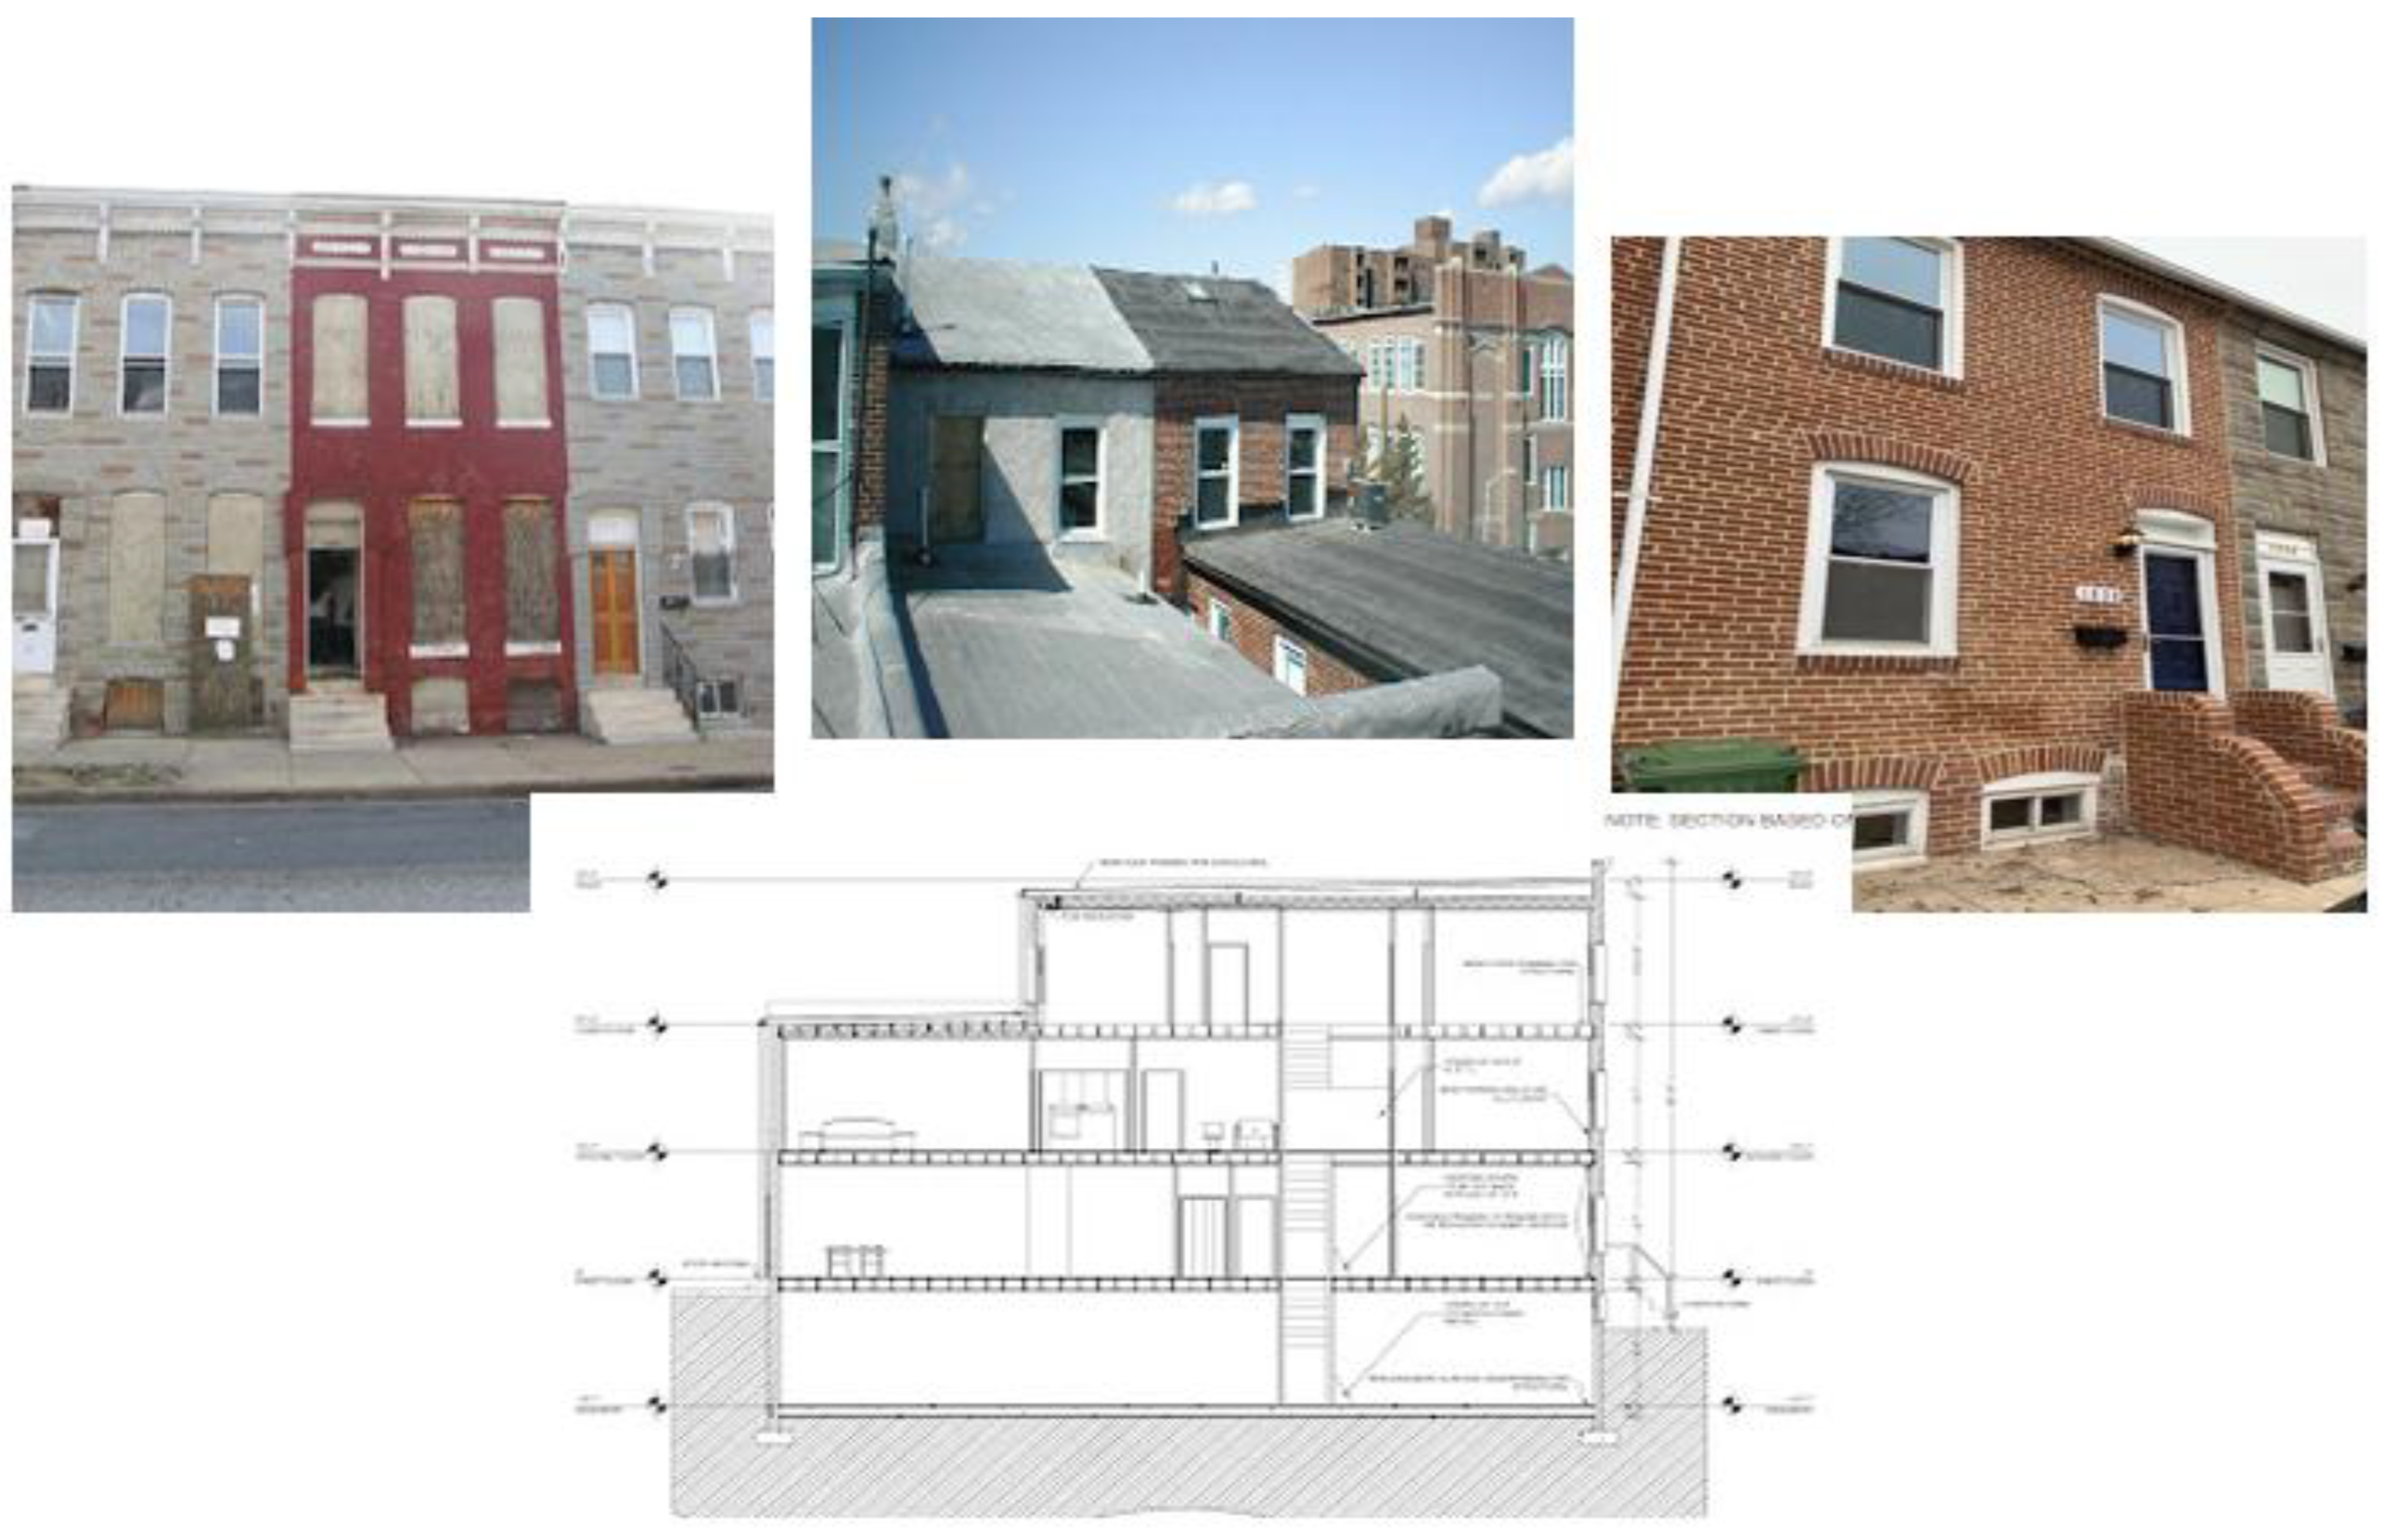
Figure 3.
3D schematic of modeled units and boundary conditions.
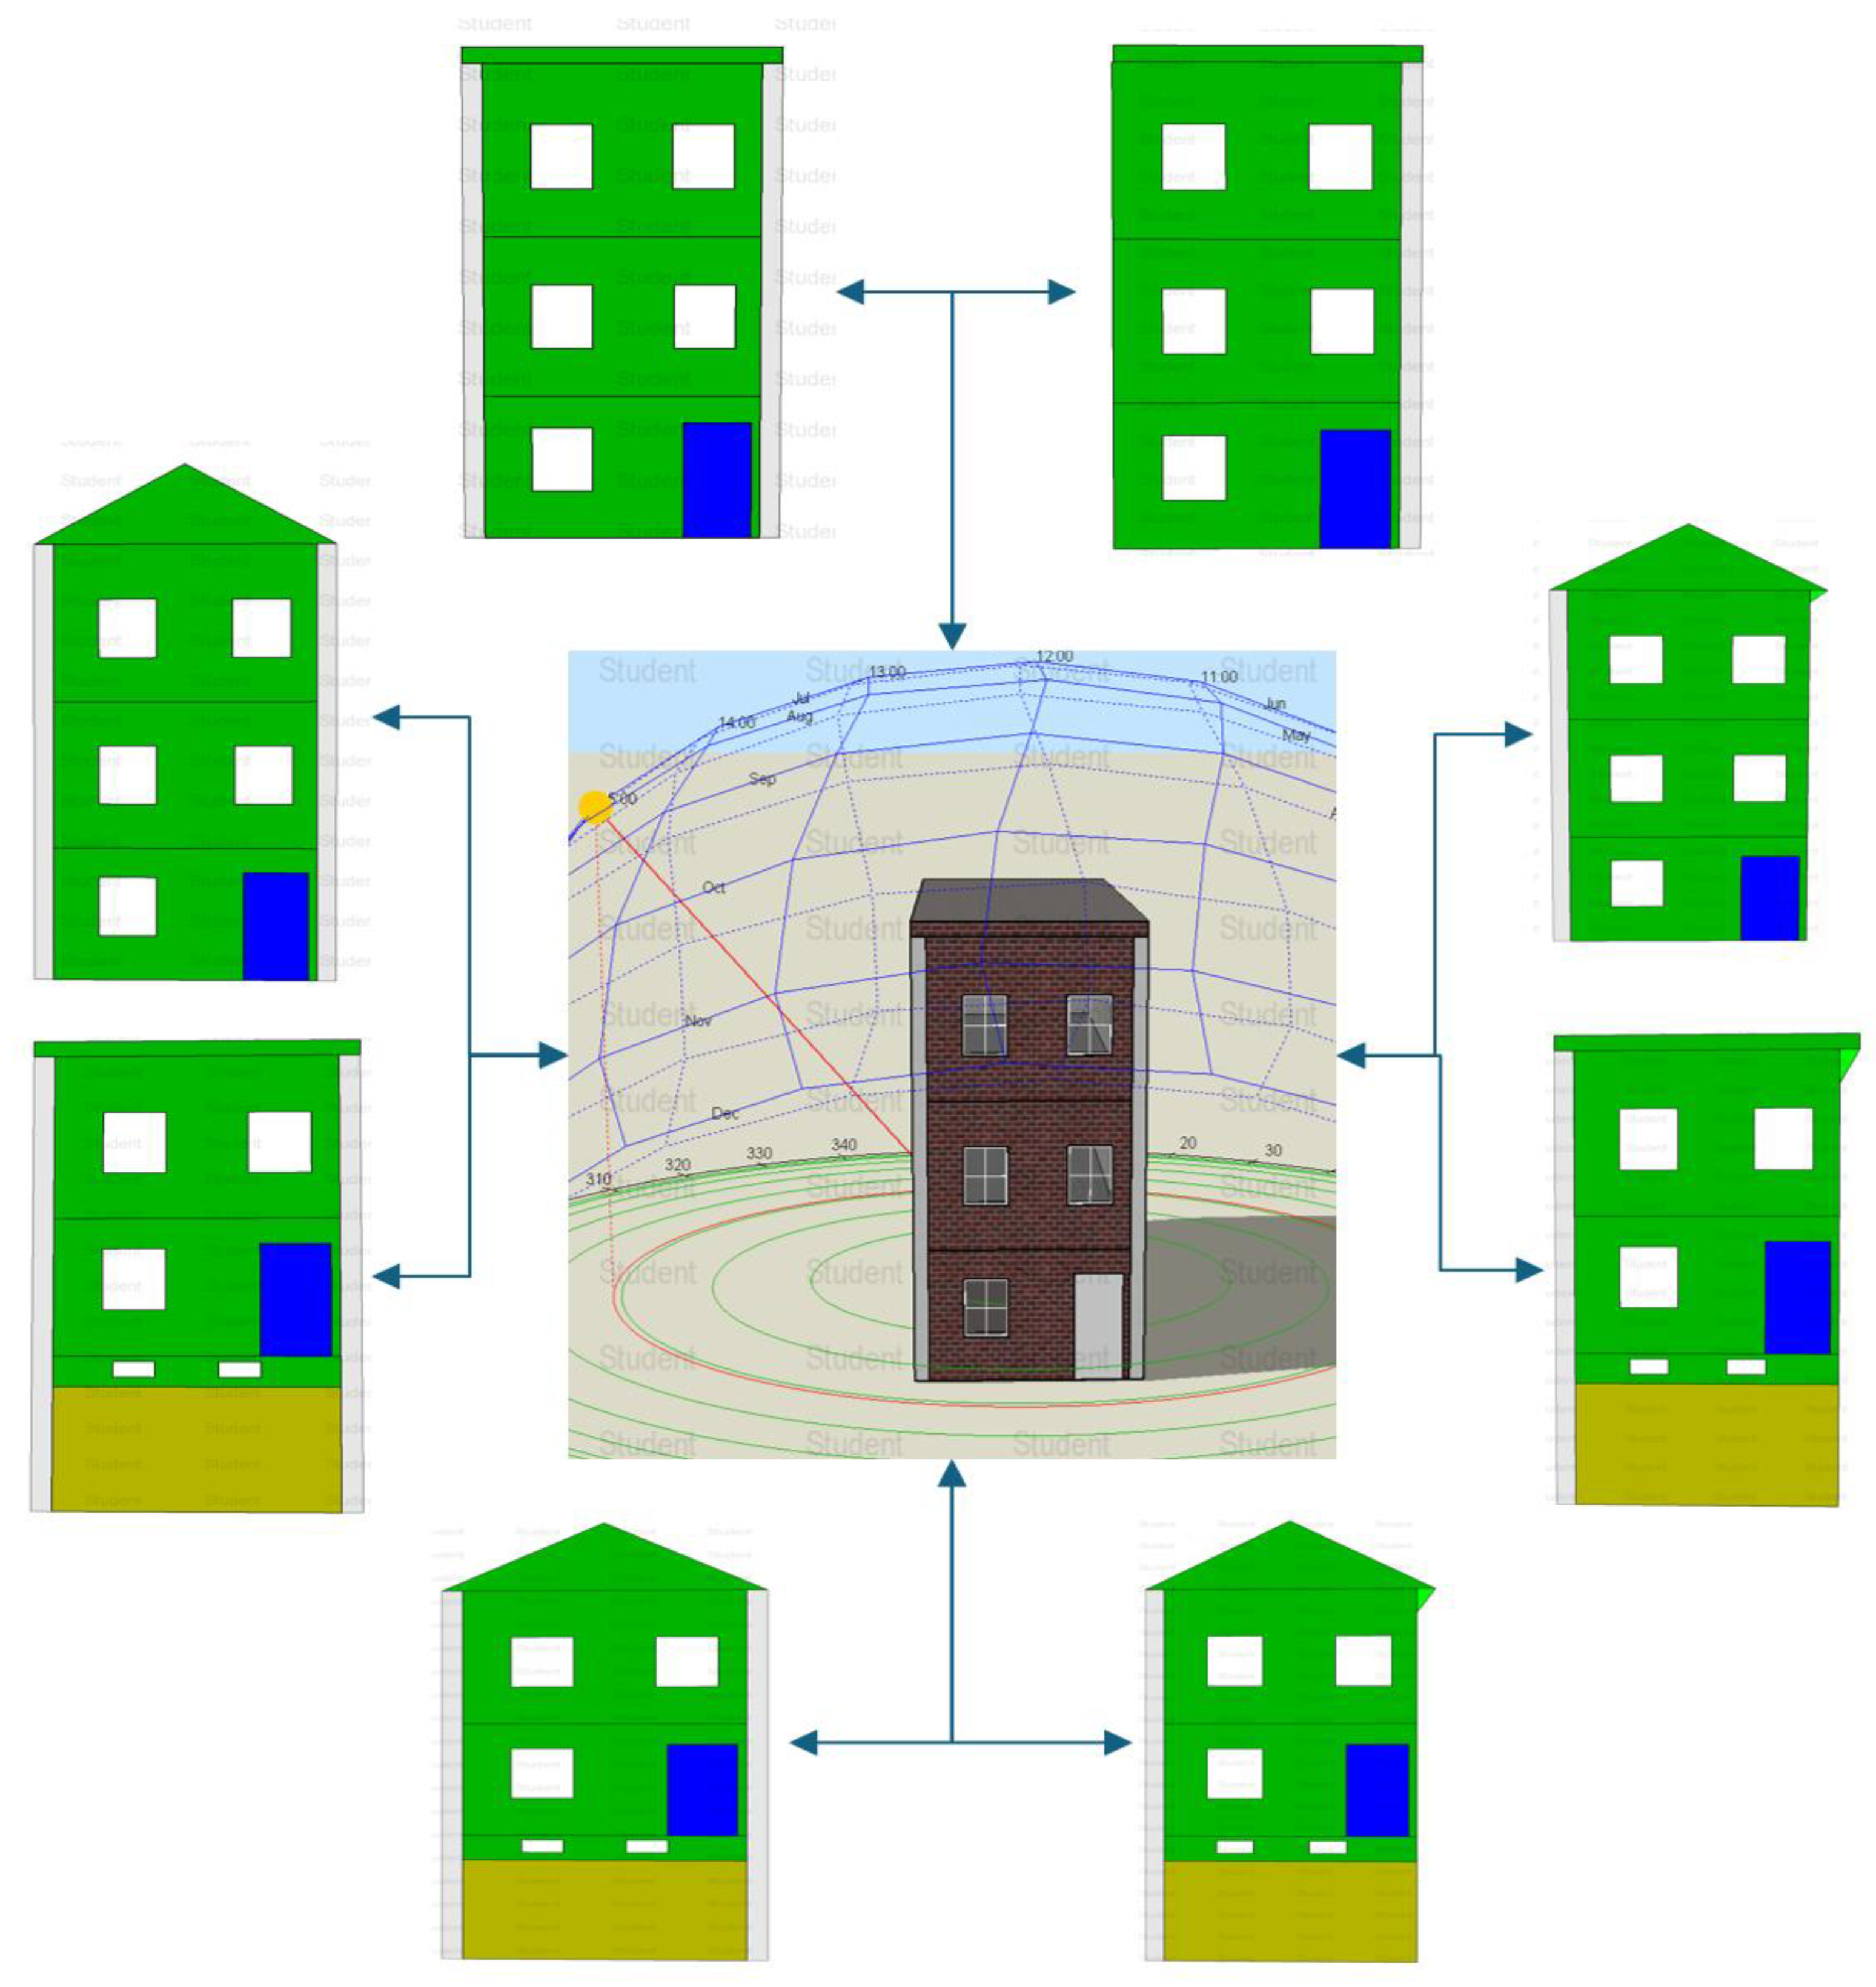
Figure 4.
Distribution of A1 Energy Use Intensity (kBtu ft⁻² yr⁻¹) by archetype.
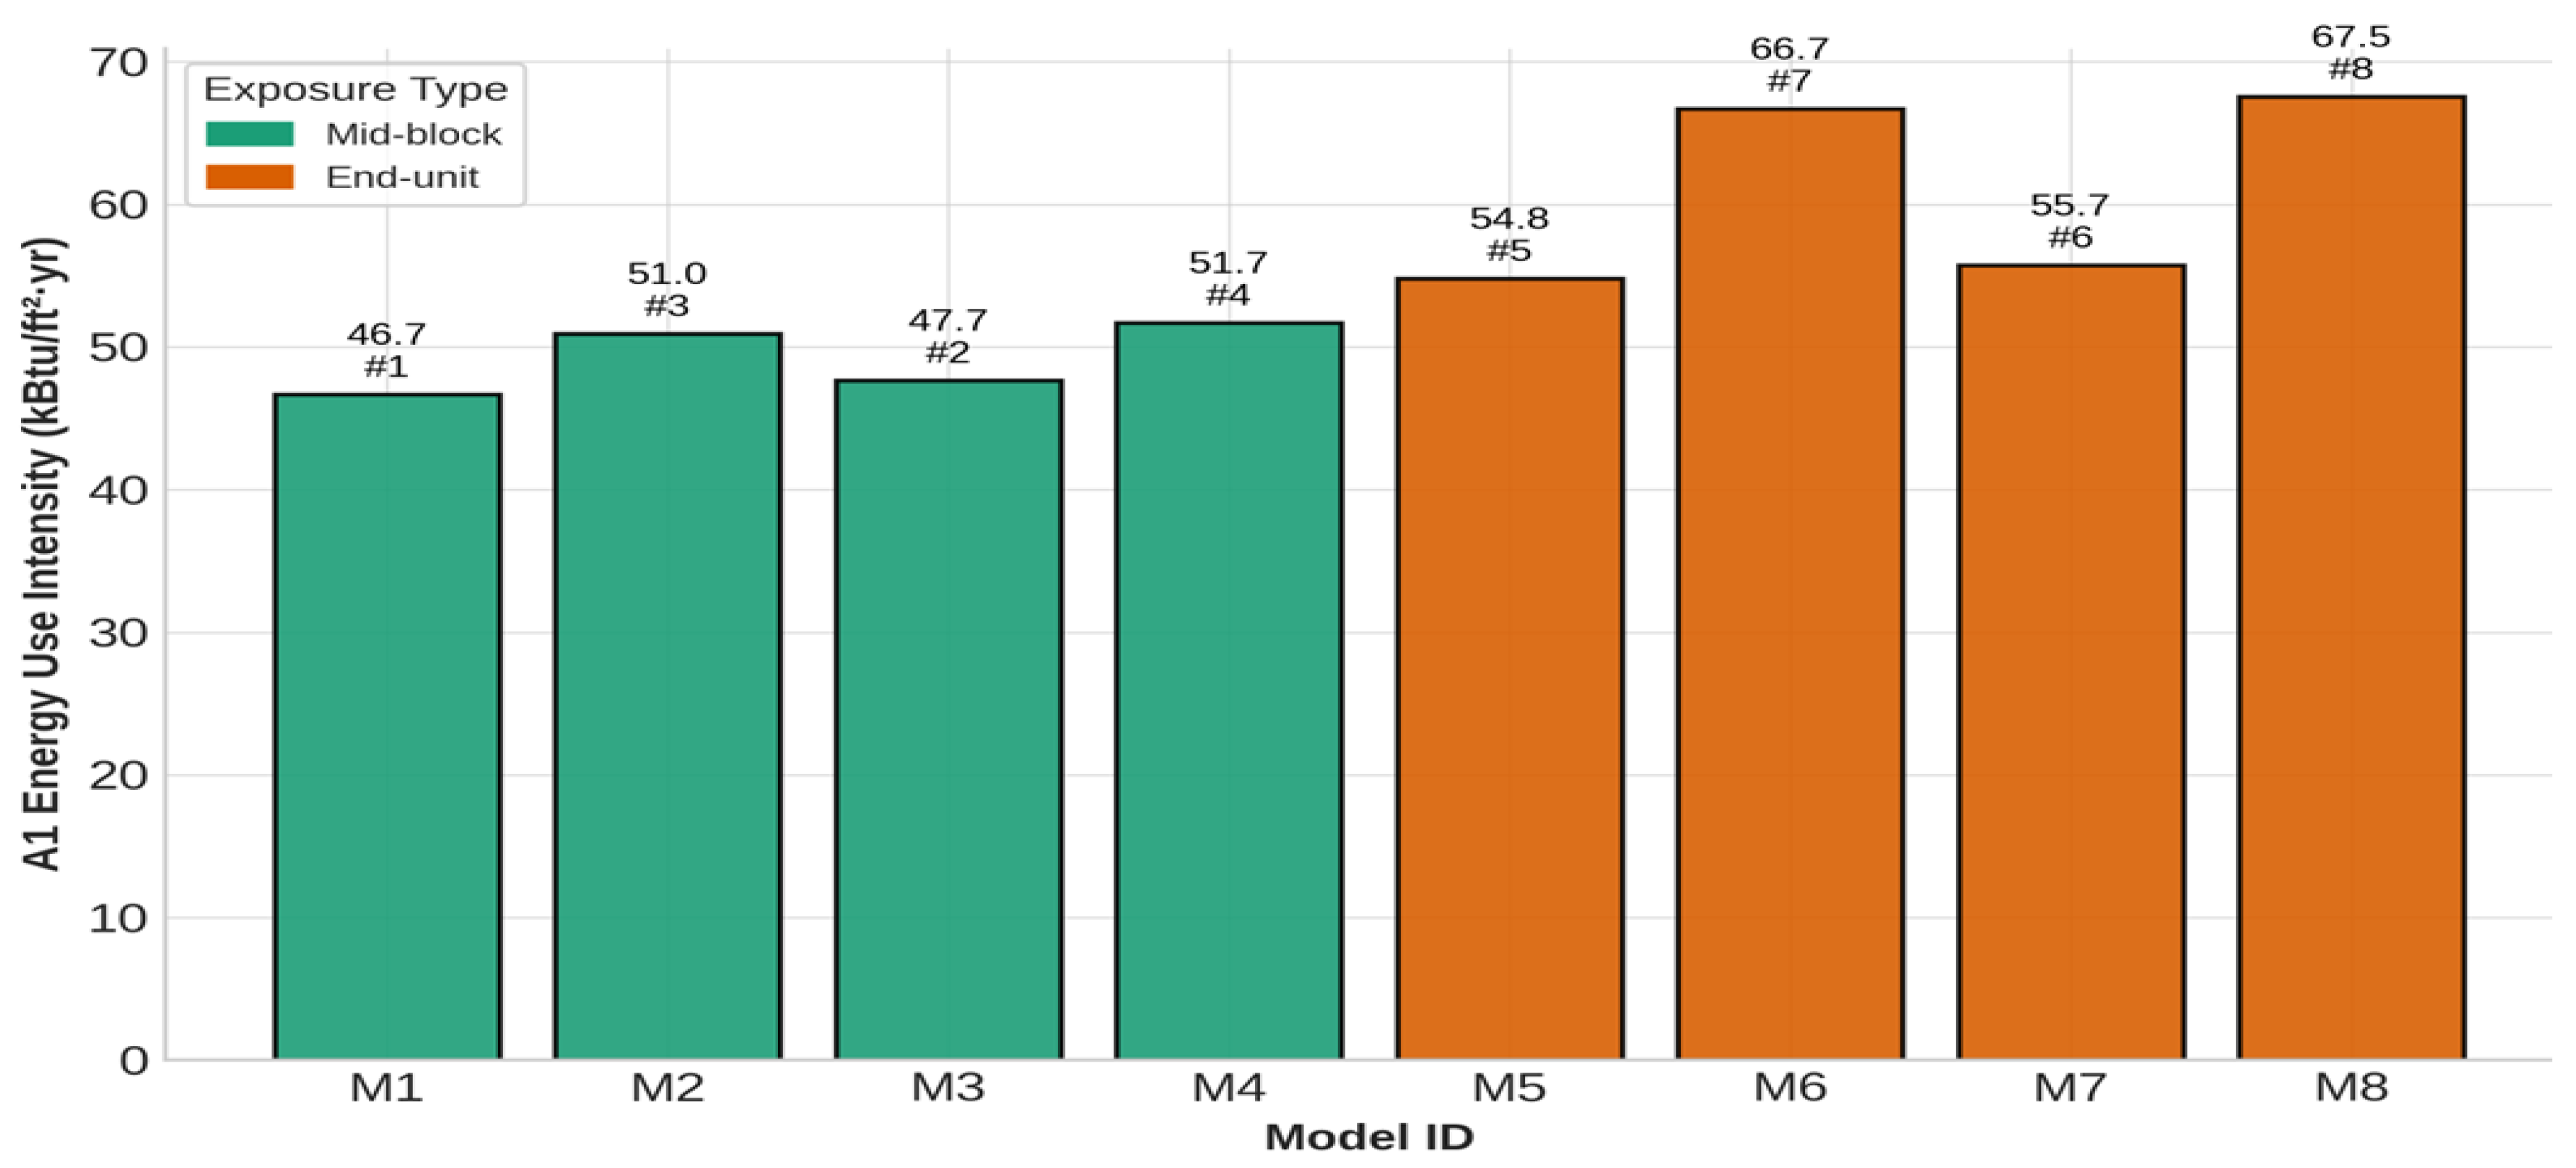
Figure 5.
Safe-Zone Hours (72 h outage) across row-home archetypes.
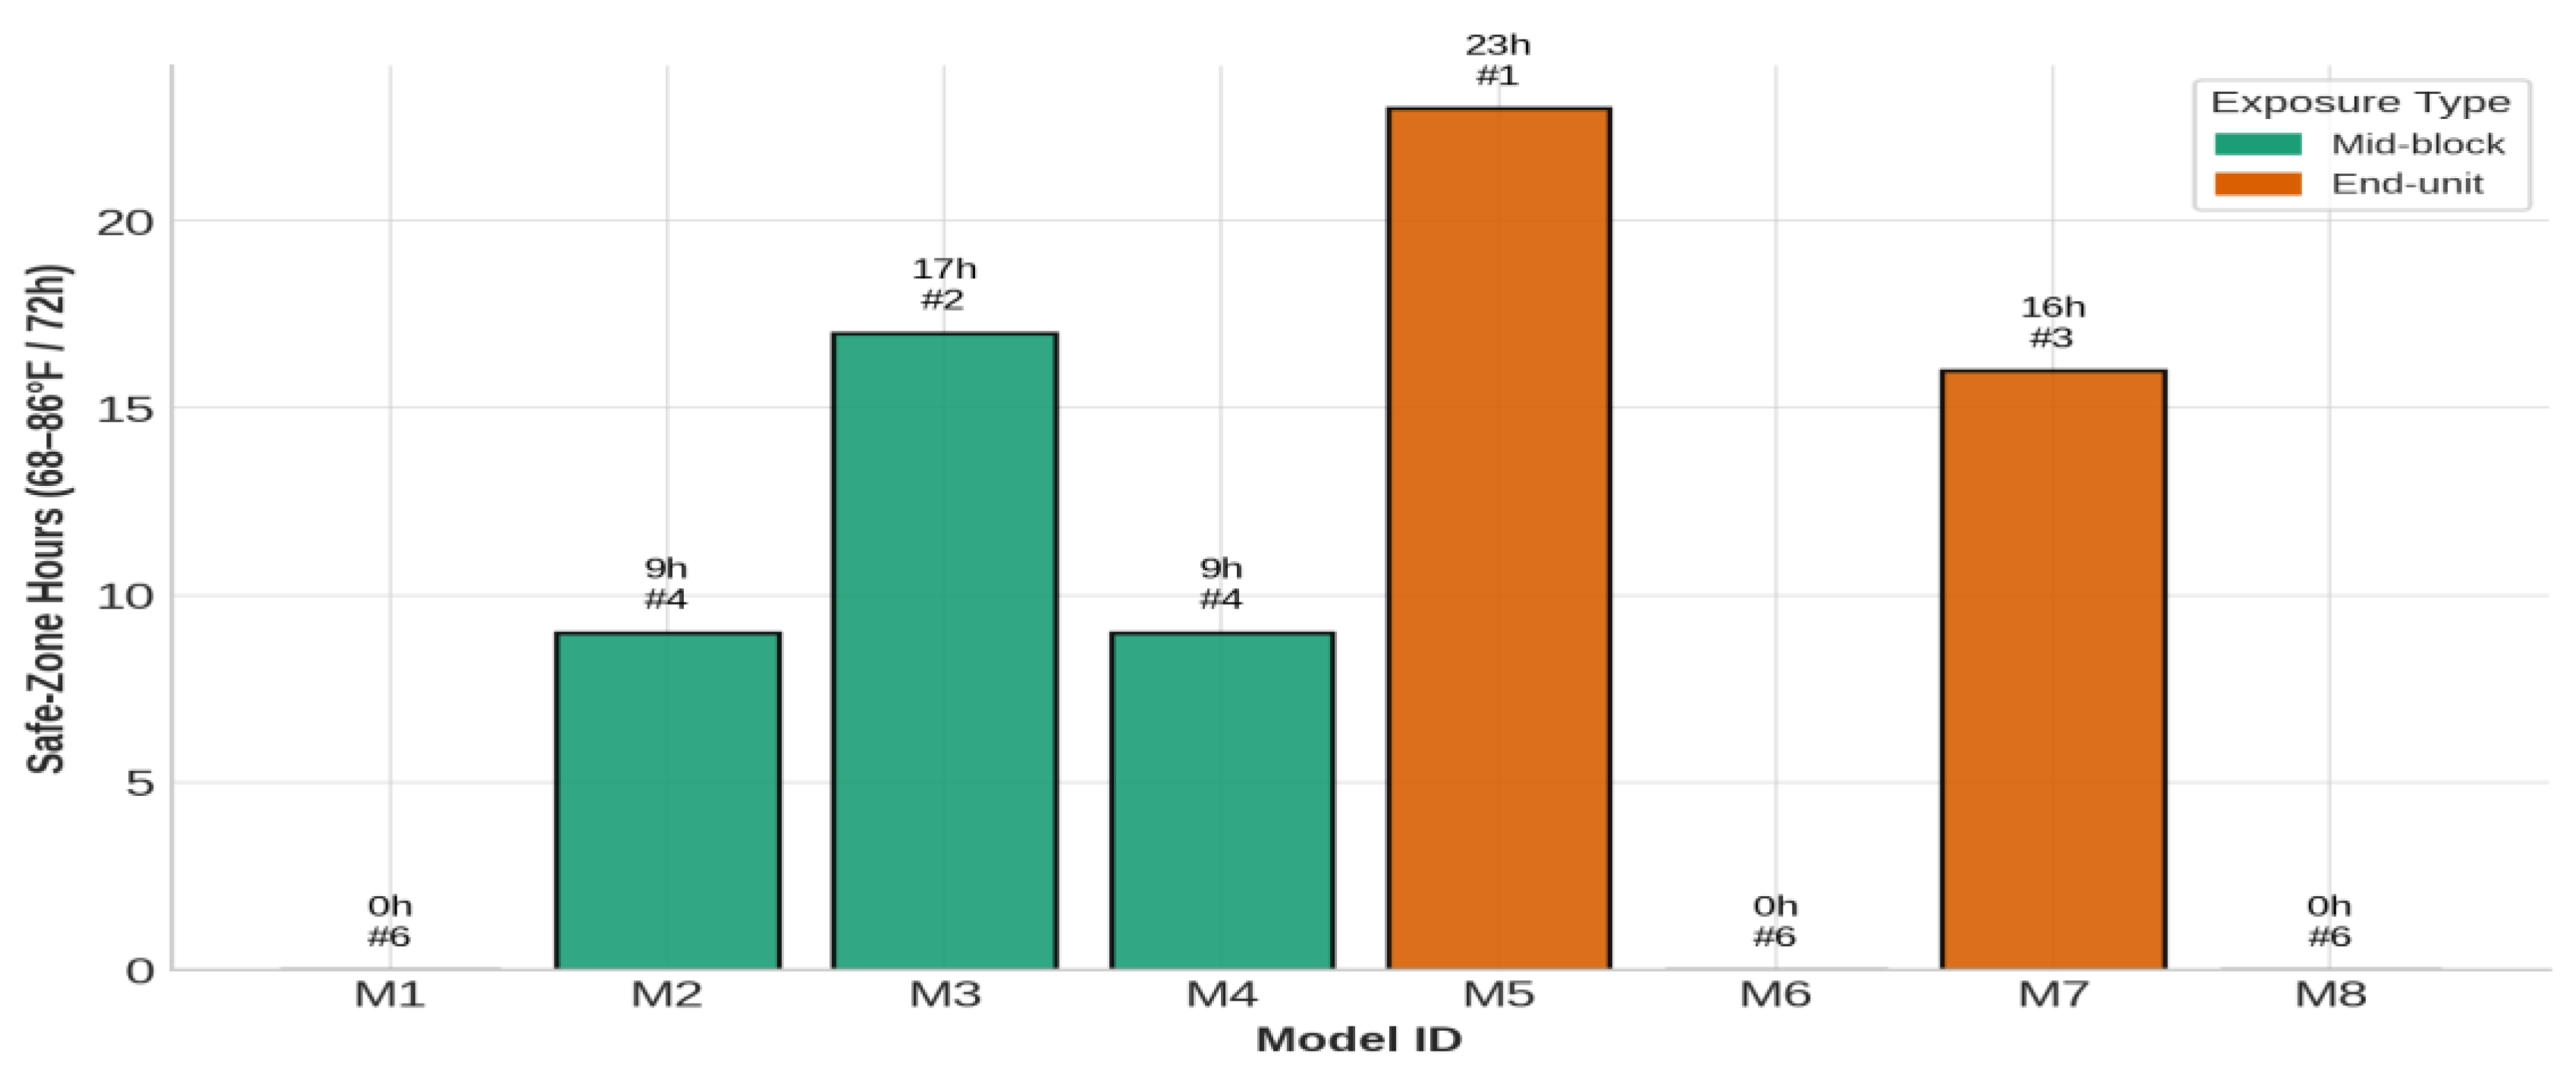
Figure 6.
July roof temperature exceedance maps > 150 °F for flat and pitched roofs.
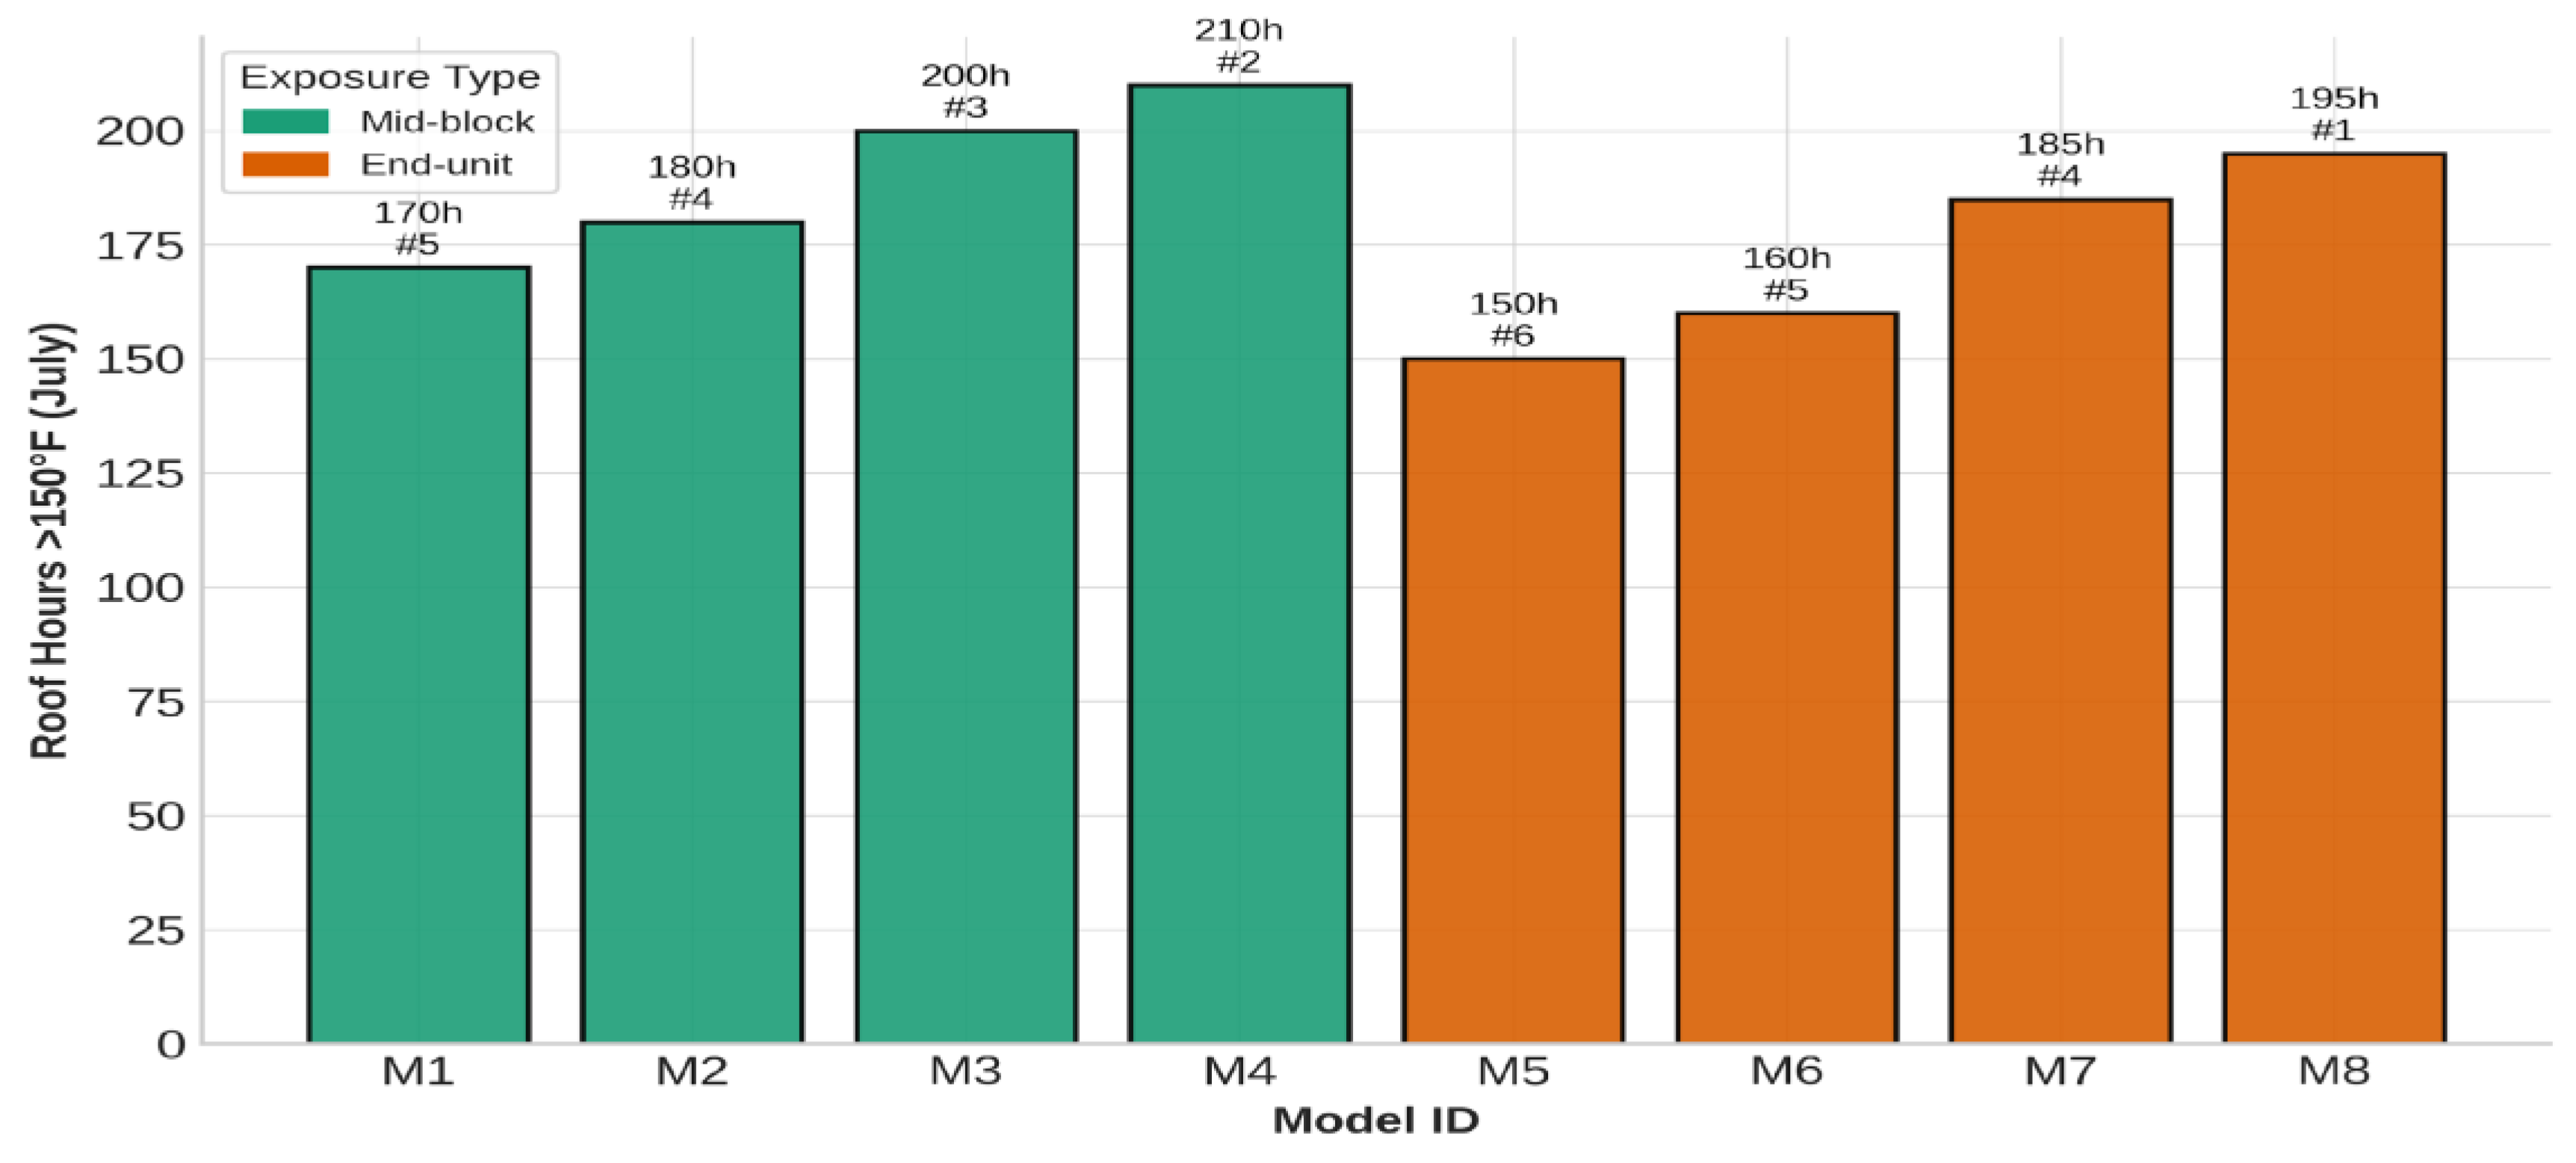
Figure 7.
Component service-life index for roof, facade, fenestration, and sealants.
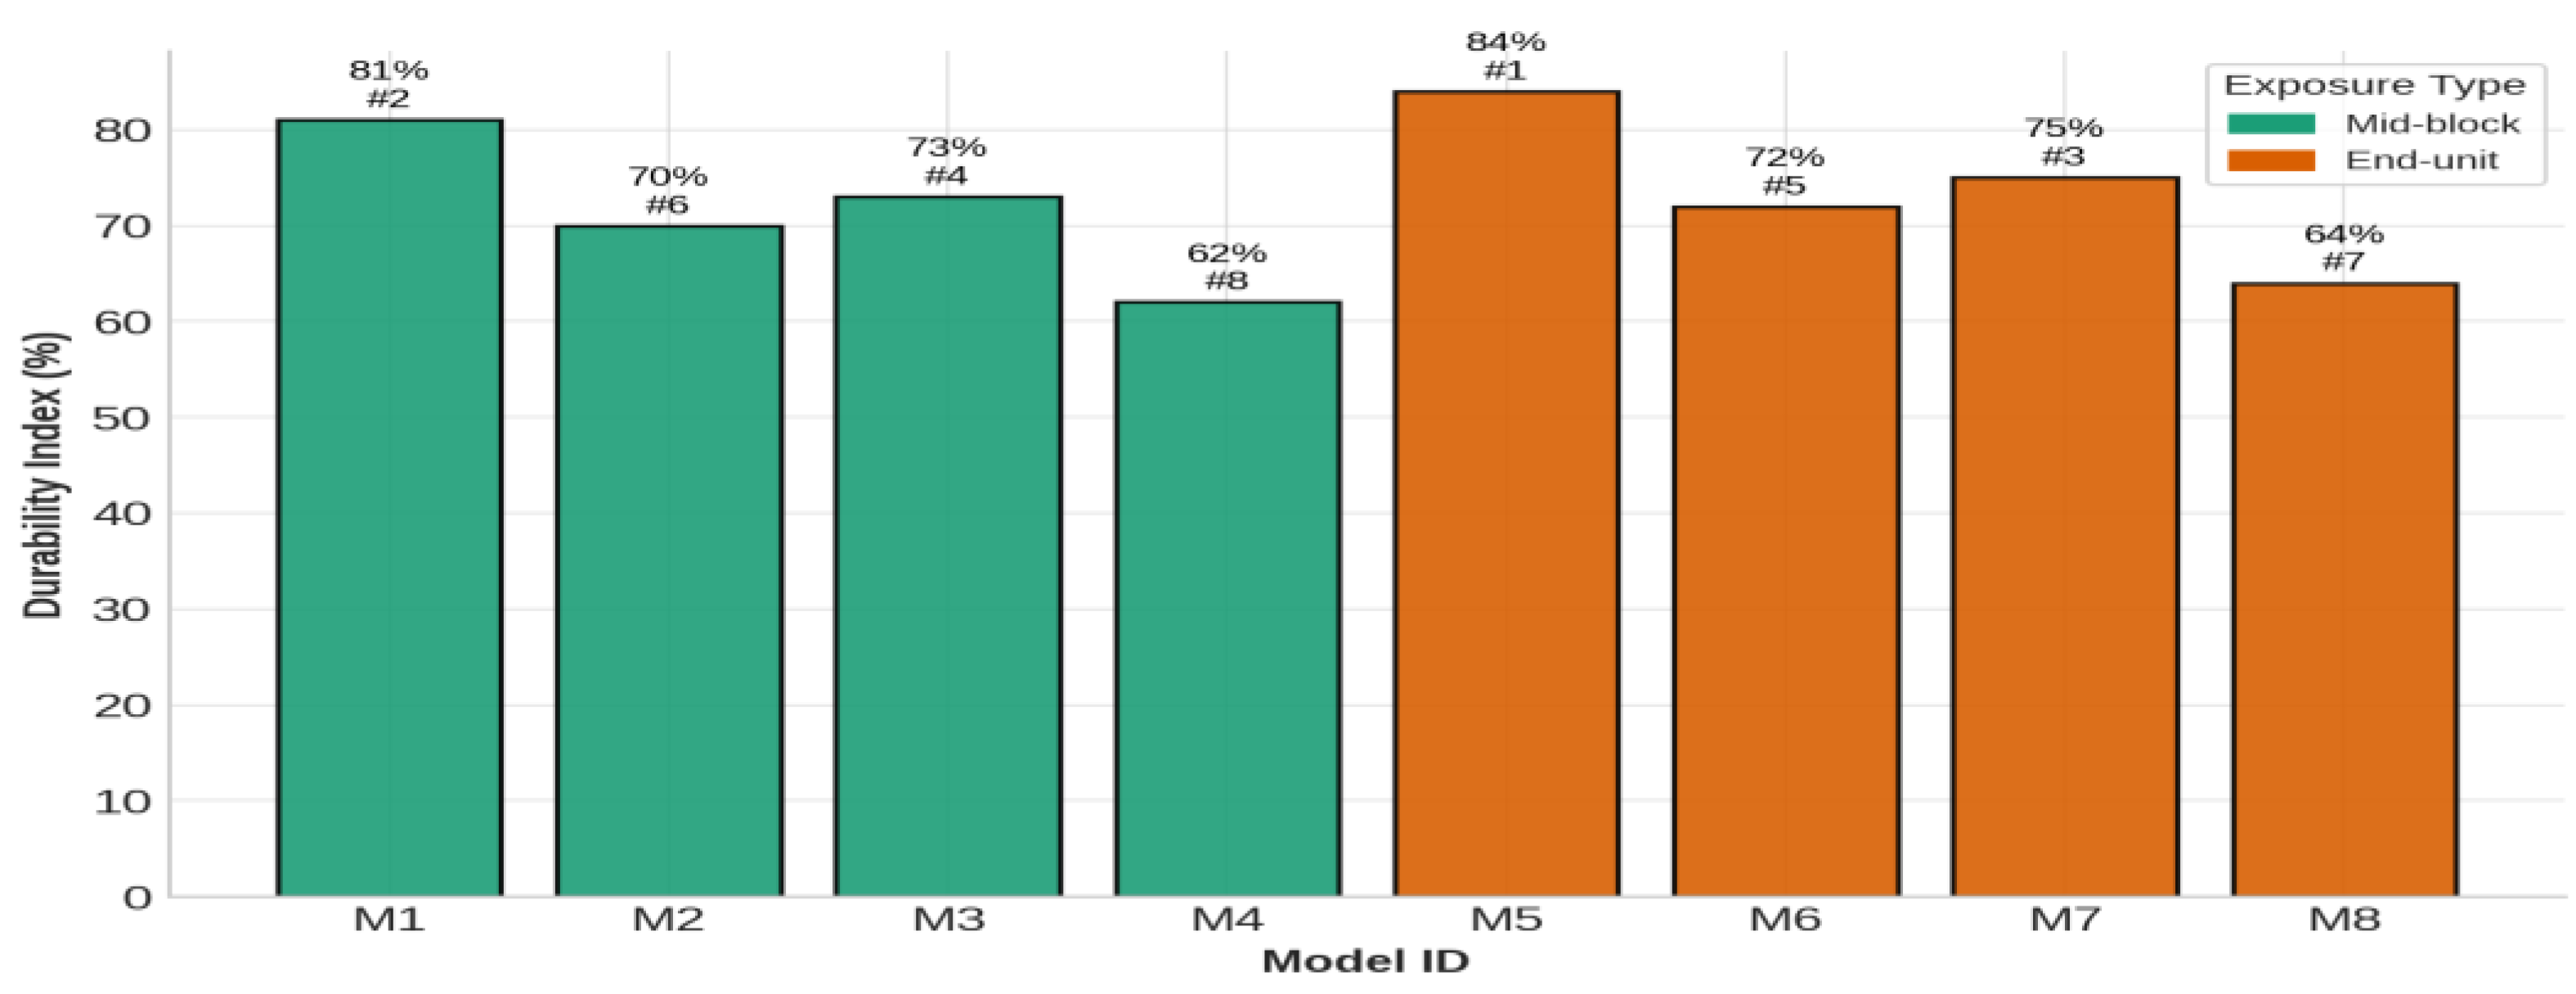
Figure 8.
here: Composite multi-domain radar profiles (A1, A3, A4, A5) by archetype.
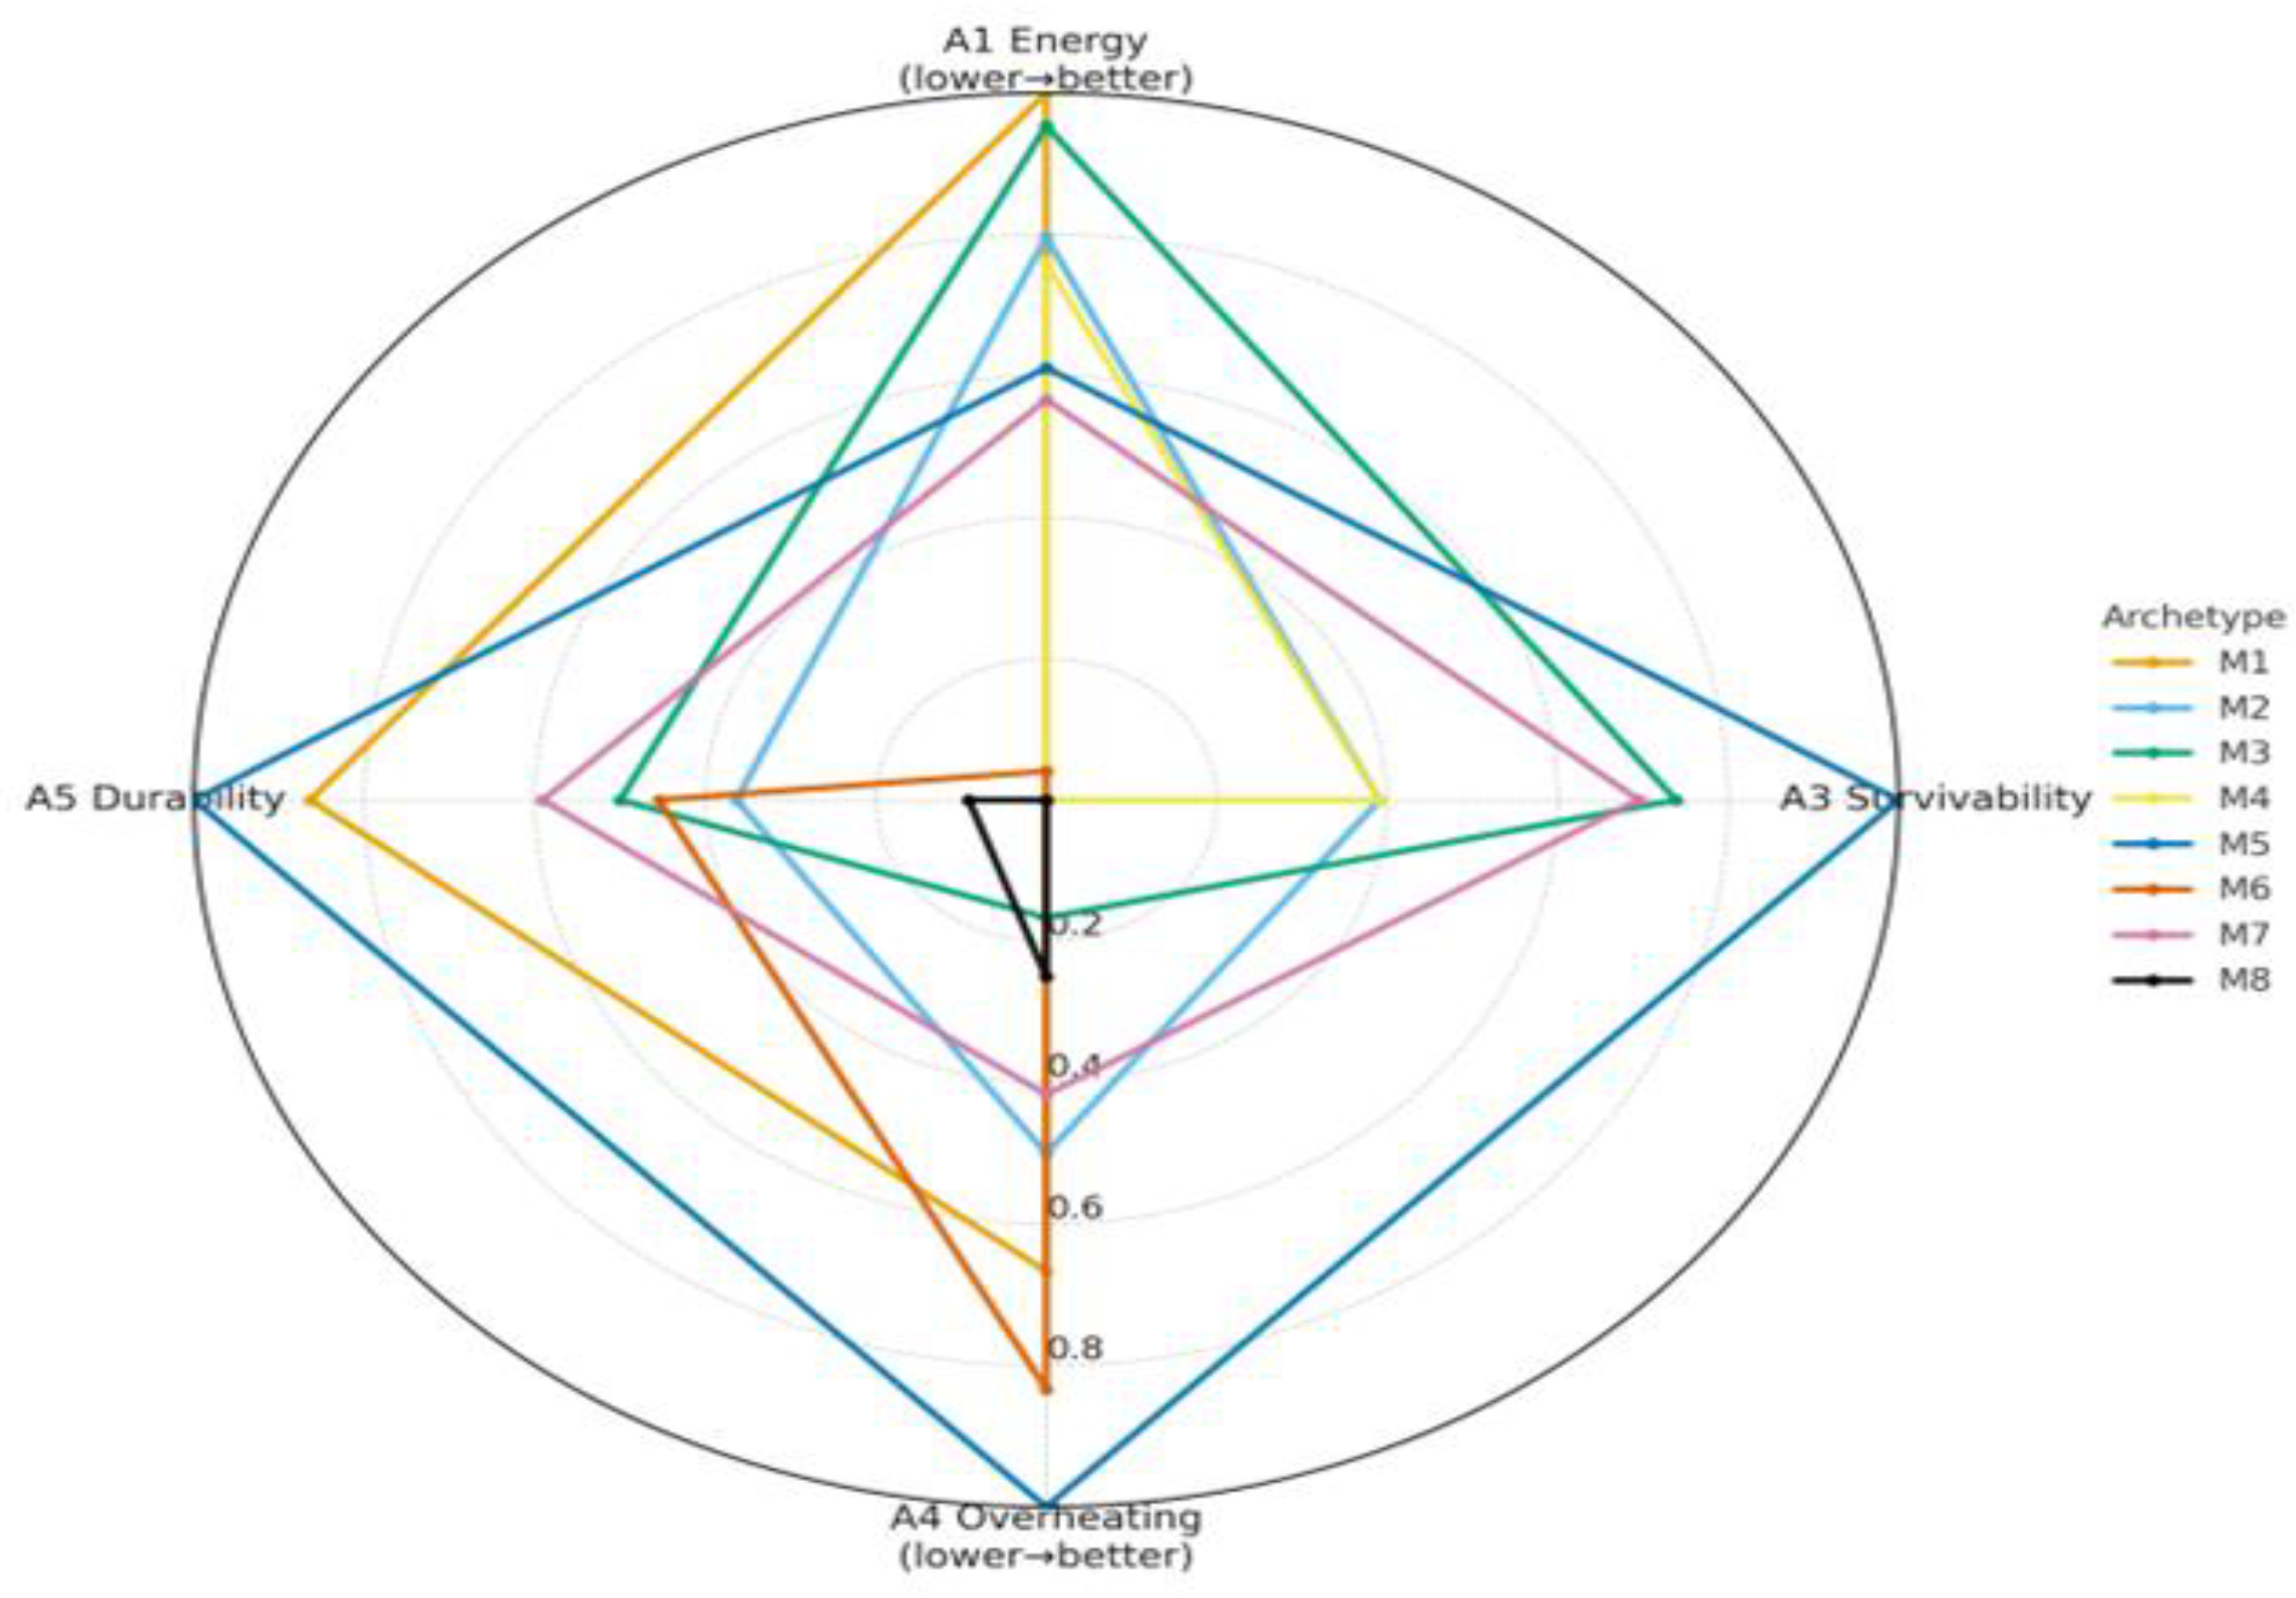

Table 1.
Archetype matrix showing exposure, roof form, and ground condition for M1–M8.
| Model ID | Exposure Type | Roof Form | Height / Ground Condition | Key Distinguishing Feature | Representative Neighborhood Example |
|---|---|---|---|---|---|
| M1 | Mid-block | Flat | 2 F + Basement | Shared party walls on both sides; lowest envelope exposure | Broadway East, Baltimore |
| M2 | Mid-block | Flat | 3 F Above-Grade | Taller variant with full above-grade basement; higher vertical stack | Penn North |
| M3 | Mid-block | Pitched | 2 F + Basement | Gable-roof typology; moderate thermal mass | Reservoir Hill |
| M4 | Mid-block | Pitched | 3 F Above-Grade | Extended attic volume; increased solar gain on upper floor | Union Square |
| M5 | End-unit | Flat | 2 F + Basement | Corner exposure on two façades; higher daylight potential | McElderry Park |
| M6 | End-unit | Flat | 3 F Above-Grade | Full corner stack; maximum surface-to-volume ratio | Druid Heights |
| M7 | End-unit | Pitched | 2 F + Basement | Corner unit with sloped roof; moderate attic ventilation | Upton |
| M8 | End-unit | Pitched | 3 F Above-Grade | Tallest and most exposed configuration; highest solar load | Sandtown-Winchester |
Table 2.
Selection rationale for performance indicators and archetype variables.
| Category | Variable/Indicator | Measurement Source/Threshold | Purpose | Rationale for Inclusion |
|---|---|---|---|---|
| Performance Indicators | Energy Use Intensity (EUI) | Annual energy balance (kBtu ft⁻² yr⁻¹) | Energy efficiency | Standard benchmarking metric; reflects baseline demand. |
| Safe-Zone Hours (SZH) | Indoor 68–86 °F (72 h outage) | Passive survivability | Quantifies thermal autonomy during power failure. | |
| Roof > 150 °F degree-hours | Surface Temp Time Series (> 150 °F) | Overheating risk | Captures roof and envelope heat stress affecting both comfort and materials. | |
| ISO Service-Life Index (SLI) | ISO 15686-8 adjusted (years) | Durability/resilience | Estimates component longevity under thermal-moisture exposure. | |
| Archetype Variables | Exposure | Mid-block / End-unit | Lateral boundary condition | Represents shared wall shielding vs. corner exposure. |
| Roof Form | Flat / Pitched | Roof geometry/absorptance | Differentiates solar gain, runoff, and maintenance risk. | |
| Foundation Type | Basement / Slab-on-grade | Ground thermal coupling | Governs subsurface cooling and moisture buffering. |
Table 3.
Simulation inputs and boundary conditions (weather, schedules, materials.
| Category | Parameter | Baseline Value/Description | Source/Reference |
|---|---|---|---|
| Weather Data | Climate file | Baltimore TMY3 (BWI Station 724060), representative typical year | [21,29] |
| Simulation period | Full year (8,760 h); July subset used for A4 domain (roof > 150 °F hours) | This study | |
| Design conditions | ASHRAE 1% Cooling; 99% Heating Design Temperatures (92 °F / 14 °F) | [30] | |
| Building Geometry | Total floor area | 1500 ft² per unit | [21] |
| Floor configuration | 2F + Basement or 3 Above-Grade Floors | [21,39] | |
| Exposure types | Mid-block (shared walls) / End-unit (exposed walls) | Field survey & BNIA [2] | |
| Roof form | Flat (bitumen membrane) / Pitched (3:12 asphalt shingle) | [21,26] | |
| Foundation | Basement (8 ft) or Slab on Grade | [21] | |
| Envelope & Materials | Wall construction | 2 Wythe brick (200 mm) + plaster interior | [39] |
| Roof construction | 25 mm plywood deck + 100 mm insulation (λ = 0.035 W/mK) + finish layer | [21,33] | |
| Floor assembly | 100 mm concrete slab + vapor barrier + tile finish | [21] | |
| Window/door | Double-glazed (3.0 W/m²K; SHGC = 0.55) | [21,29] | |
| Airtightness | 0.5 ACH at 50 Pa (baseline); 0.3–0.6 ACH tested in sensitivity | [39] | |
| Albedo | 0.25 (baseline); 0.50–0.75 tested in sensitivity | [33] | |
| Thermal mass | Brick density 1,800 kg m⁻³; specific heat 840 J kg⁻¹ K⁻¹ (±15% range) | [33,41] | |
| Internal Gains & Schedules | Occupancy | 3 persons; ASHRAE 55 metabolic rate 1.0 met at summer setpoints | [30] |
| Equipment loads | 0.3 W ft⁻² continuous (plug and lighting gains) | [21] | |
| HVAC setpoints | Cooling setpoint 75 °F; Heating setpoint 68 °F (auto off during outage) | [30] | |
| Natural ventilation | Operative only when T_out < T_in and ΔT ≥ 2 °C; 0.6 ACH nominal | [31] | |
| Simulation Control | Software version | DesignBuilder v7.0 interface; EnergyPlus v9.6 engine | This study |
| Time step | 10 minutes (aggregated hourly for A1–A5 analysis) | [21,27] | |
| Output variables | Energy use, zone temperature, roof surface temperature, component heat flux | This study | |
| Validation Benchmarks | Reference dataset | Calibrated Baltimore row-home models (Adhikari et al., 2025) ± 8 % EUI agreement | [21] |
| Comparative benchmark | DOE RECS 2023 row-home energy range (45–70 kBtu ft⁻² yr⁻¹) | [5] |
Table 4.
Definition/composition of Lean and Full Deficit Indices (DI) and first-failure domain identification method.
Table 4.
Definition/composition of Lean and Full Deficit Indices (DI) and first-failure domain identification method.
| Index / Component | Included Domains | How It’s Calculated (0–100 scale) | Weighting Logic | What It Means / Why It’s Used | Data Source |
|---|---|---|---|---|---|
| Lean Deficit Index (DIₗ) | Energy, Survivability, Overheating, Durability | Average of all domain scores on a 0–100 scale. | Equal weights for each domain. | Shows the basic physical resilience of each archetype without accounting for interactions between factors. | Simulation results from DesignBuilder / EnergyPlus. |
| Full Deficit Index (DIf) | A1–A5 plus cross-domain effects (e.g., A4 → A5, A1 ↔ A3) | Adds penalties for interactions between domains, such as heat-reducing durability. | Includes extra weighting factors (0.25–0.40) for linked effects. | Reflects total resilience when multiple stress factors act together. | Derived from literature-based interaction factors [35,36,37,38]. |
| Normalization (Nᵢ) | All domains | Converts each indicator to a standard 0–100 scale. | Based on each domain’s lowest and highest values. | Makes results comparable across different indicators and units. | Simulation dataset for all archetypes (M1–M8). |
| First-Failure Domain (FFD) | A1–A5 | Identifies the domain with the highest deficit score. | - | Shows which aspect (energy, heat, etc.) fails first; used to guide retrofit priorities. | Computed for each archetype after normalization. |
Table 5.
Sensitivity analysis results and retrofit implications.
| Parameter Change | Δ A1 EUI (kBtu ft⁻² yr⁻¹) | Δ A3 Safe-Zone Hours (72 h) | Δ A4 Roof >150 °F (h) | Δ A5 Durability (% Index) | Δ Lean DI (pts) | Retrofit Implication |
|---|---|---|---|---|---|---|
| Increase roof albedo 0.25 → 0.75 | −4.2 (≈ −9 %) | +3.5 h (≈ +7 %) | −37 h (≈ −18 %) | +2.1 % (≈ +1.6 y) | −8.5 | High-reflectance coatings significantly reduce overheating and are a cost-effective first intervention. |
| Reduce infiltration 0.6 → 0.3 ACH | −5.3 (≈ −8 %) | +1.8 h (≈ +4 %) | −14 h (≈ −6 %) | +1.2 % | −6.1 | Airtight improvements yield energy and comfort gains, essential for low-cost SR packages. |
| Increase thermal mass +15 % (brick density) | −0.8 (≈ −2 %) | +5.2 h (≈ +10 %) | −9 h (≈ −4 %) | +0.7 % | −4.3 | Enhanced mass delays overheating, which improves survivability during outages. |
| Combined envelope enhancement (High albedo + Low infiltration + High mass) | −9.8 (≈ −15 %) | +9.0 h (≈ +18 %) | −62 h (≈ −28 %) | +3.5 % (≈ +2.8 y) | −12.4 | Synergistic gains demonstrate the substantial adaptive value of envelope-first retrofits before deep renovation. |
Table 6.
Summary statistics for Energy Use Intensity across eight models.
| Model ID | Exposure | Roof Type | Height/Ground | A1 EUI (kBtu ft⁻² yr⁻¹) | Δ vs Lowest (%) | Relative Ranking (1 = Best) | Category Trend/Observation |
|---|---|---|---|---|---|---|---|
| M1 | Mid-block | Flat | 2 F + Basement | 46.7 | – | 1 | Lowest EUI; baseline for comparison |
| M2 | Mid-block | Flat | 3 F Above-Grade | 50.95 | + 9.1 | 3 | Taller mid-block increases exposure |
| M3 | Mid-block | Pitched | 2 F + Basement | 47.67 | + 2.1 | 2 | Slight increase due to roof geometry |
| M4 | Mid-block | Pitched | 3 F Above-Grade | 51.72 | + 10.8 | 4 | Height + roof tilt raises demand |
| M5 | End-unit | Flat | 2 F + Basement | 54.80 | + 17.3 | 5 | End-wall losses elevate EUI |
| M6 | End-unit | Flat | 3 F Above-Grade | 66.70 | + 42.7 | 7 | Tallest flat roof; highest demand |
| M7 | End-unit | Pitched | 2 F + Basement | 55.74 | + 19.3 | 6 | Roof geometry adds heat gain |
| M8 | End-unit | Pitched | 3 F Above-Grade | 67.55 | + 44.6 | 8 | Max exposure; worst energy performance |
Mean ± SD: 55.1 ± 7.9 kBtu ft⁻² yr⁻¹ Range: 46.7 – 67.6 kBtu ft⁻² yr⁻¹.
Table 7.
A3 Passive Survivability results by archetype.
| Model ID | Exposure | Roof Type | Height / Ground | Safe-Zone Hours (SZH) (68–86 °F / 72 h) | % of Safe Period | Peak Indoor Temp (°F) | Relative Ranking (1 = Best) | Observations |
|---|---|---|---|---|---|---|---|---|
| M1 | Mid-block | Flat | 2 F + Basement | 0 h | 0 % | 99 | 6 | Rapid heat gain; no safe period |
| M2 | Mid-block | Flat | 3 F Above-Grade | 9 h | 13 % | 96 | 4 | Taller form delays peak heat slightly |
| M3 | Mid-block | Pitched | 2 F + Basement | 17 h | 24 % | 94 | 2 | Best mid-block performance |
| M4 | Mid-block | Pitched | 3 F Above-Grade | 9 h | 13 % | 95 | 4 | The stack effect reduces the roof benefit |
| M5 | End-unit | Flat | 2 F + Basement | 23 h | 32 % | 93 | 1 | Highest survivability; optimal orientation |
| M6 | End-unit | Flat | 3 F Above-Grade | 0 h | 0 % | 99 | 6 | Critical risk; high internal gain |
| M7 | End-unit | Pitched | 2 F + Basement | 16 h | 22 % | 95 | 3 | Balanced thermal inertia |
| M8 | End-unit | Pitched | 3 F Above-Grade | 0 h | 0 % | 100 | 6 | Worst survivability; severe heat stress |
Mean ± SD: 9.3 ± 8.5 h Median: 9 h Range: 0–23 h.
Table 8.
Roof overheating hours and degree-hours July.
| Model ID | Exposure | Roof Type | Height / Ground | Roof Hours >150 °F | % of July Daylight (455 h) | Degree-Hours >150 °F | Δ vs Lowest (%) | Relative Ranking | Interpretation |
|---|---|---|---|---|---|---|---|---|---|
| M1 | Mid-block | Flat | 2 F + Basement | 170 h | 37.4 % | 510 °F·h | – | 5 | Typical mid-block flat-roof heating pattern |
| M2 | Mid-block | Flat | 3 F Above-Grade | 180 h | 39.6 % | 540 °F·h | + 5.9 % | 4 | Taller volume increases roof exposure |
| M3 | Mid-block | Pitched | 2 F + Basement | 200 h | 44.0 % | 600 °F·h | + 17.6 % | 3 | Slope amplifies solar loading |
| M4 | Mid-block | Pitched | 3 F Above-Grade | 210 h | 46.2 % | 630 °F·h | + 23.5 % | 2 | Highest among mid-blocks; stack + slope |
| M5 | End-unit | Flat | 2 F + Basement | 150 h | 33.0 % | 450 °F·h | − 11.8 % | 6 | Slightly cooler from exposure + ventilation |
| M6 | End-unit | Flat | 3 F Above-Grade | 160 h | 35.2 % | 480 °F·h | − 5.9 % | 5 | Height effect offset by lateral exposure |
| M7 | End-unit | Pitched | 2 F + Basement | 185 h | 40.7 % | 555 °F·h | + 8.8 % | 4 | High sidewalls gain on sloped surfaces |
| M8 | End-unit | Pitched | 3 F Above-Grade | 195 h | 42.9 % | 585 °F·h | + 14.7 % | 1 | Highest overheating risk overall |
Table 9.
ISO service-life indices and equivalent remaining years.
| Model ID | Exposure | Roof Type | Height / Ground | Durability Index (%) | Equivalent Service Life (yrs) | Δ vs Highest (yrs) | Relative Ranking | Primary Degradation Driver | Observations |
|---|---|---|---|---|---|---|---|---|---|
| M1 | Mid-block | Flat | 2 F + Basement | 81 % | ≈ 40.5 yrs | − 1.5 | 2 | Thermal cycling + moisture intrusion | Baseline: moderate decline in parapet sealants |
| M2 | Mid-block | Flat | 3 F Above-Grade | 70 % | ≈ 35.0 yrs | − 7.0 | 6 | Solar + wind exposure | Height amplifies the degradation of upper masonry courses |
| M3 | Mid-block | Pitched | 2 F + Basement | 73 % | ≈ 36.5 yrs | − 5.5 | 4 | Roof expansion stress | Moderate heat fatigue; slope drainage beneficial |
| M4 | Mid-block | Pitched | 3 F Above-Grade | 62 % | ≈ 31.0 yrs | − 11.0 | 8 | Solar radiation + joint fatigue | Lowest mid-block durability |
| M5 | End-unit | Flat | 2 F + Basement | 84 % | ≈ 42.0 yrs | 0 | 1 | Lower solar load + ventilation | Most durable, balanced exposure and cooling |
| M6 | End-unit | Flat | 3 F Above-Grade | 72 % | ≈ 36.0 yrs | − 6.0 | 5 | Roof membrane fatigue | High surface cycling, average life |
| M7 | End-unit | Pitched | 2 F + Basement | 75 % | ≈ 37.5 yrs | − 4.5 | 3 | Thermal expansion | Moderate resilience; pitched roof aids runoff |
| M8 | End-unit | Pitched | 3 F Above-Grade | 64 % | ≈ 32.0 yrs | − 10.0 | 7 | Wind + UV exposure | Highest degradation rate; severe fatigue risk |
Mean ± SD: 72.6 ± 7.4 % Range: 62–84 % Average Service Life: ≈ 36.3 yrs.
Table 10.
Composite Lean/Full DI and first-failure domain ranking.
| Model ID | Exposure | Roof Type | Height / Ground | Lean DI (0–100) | Full DI (0–100) | Δ (Full – Lean) | First-Failure Domain | Resilience Category | Observations |
|---|---|---|---|---|---|---|---|---|---|
| M1 | Mid-block | Flat | 2 F + Basement | 36.7 | 50.4 | +13.7 | A3 Survivability | Moderate | Balanced baseline; fails under outage conditions |
| M2 | Mid-block | Flat | 3 F Above-Grade | 48.7 | 50.5 | +1.8 | A5 Durability | Moderate | Height stress raises material fatigue |
| M3 | Mid-block | Pitched | 2 F + Basement | 41.0 | 39.7 | −1.3 | A4 Overheating | High | Stable; minor roof overheating risk |
| M4 | Mid-block | Pitched | 3 F Above-Grade | 71.2 | 69.2 | −2.0 | A4 Overheating | Low | Stack and slope exacerbate heat stress |
| M5 | End-unit | Flat | 2 F + Basement | 9.7 | 7.8 | −1.9 | A1 Energy | Very High | Best-performing archetype; retrofit-ready baseline |
| M6 | End-unit | Flat | 3 F Above-Grade | 66.8 | 71.5 | +4.7 | A3 Survivability | Low | Heat gain from roof and sidewalls; outage-vulnerable |
| M7 | End-unit | Pitched | 2 F + Basement | 43.3 | 41.6 | −1.7 | A4 Overheating | High | Moderate adaptation capacity; thermal penalty limited |
| M8 | End-unit | Pitched | 3 F Above-Grade | 91.5 | 92.4 | +0.9 | A1 Energy | Very Low | Highest deficit; unsuitable without deep retrofit |
Table 11.
Sensitivity analysis summary and retrofit implications.
| Scenario ID | Parameter Modified | Adjustment Range | Δ (EUI, %) | Δ (SZH, h) | Δ (Roof >150 °F, %) | Δ (Service Life, yrs) | Δ Lean DI (points) | Key Observation | Retrofit Implication |
|---|---|---|---|---|---|---|---|---|---|
| S1 | Roof Albedo | 0.25 → 0.75 | − 4.2 | + 2.5 | − 18.0 | + 1.6 | − 5.8 | High-reflectivity measures reduce roof overheating by ~20 %. | Apply white or cool-roof coatings for low-cost mitigation. |
| S2 | Infiltration Rate | 0.6 → 0.3 ACH | − 8.0 | + 1.0 | − 4.5 | + 0.7 | − 3.9 | Airtight envelopes improve energy efficiency; minor overheating offset. | Implement blower-door–guided sealing; maintain ventilation control. |
| S3 | Thermal Mass | +15 % wall density | − 1.5 | + 5.0 | − 2.3 | + 0.8 | − 2.1 | Increased heat capacity extends safe-zone duration by 4–6 h. | Add internal mass (gypsum/brick linings) for passive heat buffering. |
| S4 | Combined Envelope Upgrade | S1 + S2 + S3 | − 12.0 | + 8.0 | − 22.0 | + 2.5 | − 12.4 | An integrated envelope retrofit provides synergistic benefits across domains. | Bundle roof, sealing, and mass measures as the Standard Retrofit (SR) kit. |
Disclaimer/Publisher’s Note: The statements, opinions and data contained in all publications are solely those of the individual author(s) and contributor(s) and not of MDPI and/or the editor(s). MDPI and/or the editor(s) disclaim responsibility for any injury to people or property resulting from any ideas, methods, instructions or products referred to in the content. |
© 2025 by the authors. Licensee MDPI, Basel, Switzerland. This article is an open access article distributed under the terms and conditions of the Creative Commons Attribution (CC BY) license (http://creativecommons.org/licenses/by/4.0/).
Copyright: This open access article is published under a Creative Commons CC BY 4.0 license, which permit the free download, distribution, and reuse, provided that the author and preprint are cited in any reuse.


