
Submitted:
31 October 2025
Posted:
04 November 2025
You are already at the latest version
Abstract
Background: Duchenne muscular dystrophy (DMD) is a genetic disorder caused by mutations in the dystrophin gene. DMD is characterized by exon deletions in about 76% of cases, with common deletions in exons 47, 48, 51, and 52. We evaluated the ef-fectiveness of an mRNA-based therapy targeting these exon deletions, which are fre-quently seen in DMD patients. Methods: The current study involved two protocols: 1. applying the therapy to cells from patients diagnosed with DMD, and 2. applying the therapy to genetically modified transgenic mdx/d2 mice. After treatment, dystrophin was detected in all experimental groups. Results: showed that, beyond dystrophin, cell membrane proteins such as sarcoglycan, dystroglycan, and actin was also highly ex-pressed. Behavior tests assessing functional dystrophin demonstrated improved mo-bility, motor skills, walking, resting times, and a lower risk of falling. Conclusions: Our study proved that the mRNA complex successfully produced functional dystrophin in transgenic mdx/d2 mice without causing allergic reactions or damage to the kidney, intestines, muscles, or brain.
Keywords:
DMD
; exon deletion
; mRNA
; mdx/d2
1. Introduction
The dystrophin gene is the largest in the human genome, comprising 79 exons and encoding the 427 kDa dystrophin protein. Functionally, dystrophin is an essential cytoskeletal protein located on the inner surface of the muscle cell membrane and is concentrated at sites of cell-cell contact [1]. In muscle, dystrophin is an essential part of the dystrophin-glycoprotein complex (DGC), and the associated glycoprotein complex includes dystroglycan, sarcoglycan, sarcospan, and laminin [2]. Dystroglycan consists of two subunits, α and β. α-Dystroglycan, an extracellular peripheral membrane protein and laminin-2 receptor, anchors the DGC to the extracellular matrix (ECM). Sarcoglycans form a tight complex with sarcospan, strengthening the connection between α- and β-dystroglycans. Besides its structural role, the sarcoglycan-sarcospan subcomplex also plays a part in signal transduction and mechanoprotection [3]. This entire complex is essential for muscle physiology and function. However, the absence of dystrophin causes the complete loss of the dystrophin-associated protein complex and leads to membrane fragility disorders [4]. Dystrophin-associated disorders are identified as Duchenne Muscular Dystrophy (DMD). Exon deletions make up 60-70% of cases observed in DMD, while frameshift mutations and duplications account for 30-40% [5]. The most common hotspot for exon deletions in DMD is located in the core of dystrophin, between exons 45 and 55 [6]. In particular, the central region is nearly indispensable in function and serves as the source of the genetic pathology for DMD.
In DMD, these mutations result in premature termination of protein translation, leading to the production of dysfunctional, unstable dystrophin [7]. Dysfunctional dystrophin leads to muscle weakness. Early signs include trouble climbing stairs, difficulty walking without support, and frequent falls; these usually appear between ages 2 and 3. Most patients become wheelchair-dependent between ages 10 and 12 and need respiratory support by around age 20. With proper care, many with DMD die from heart or lung failure between the ages of 20 and 40 [5,8]. Dystrophin is mainly expressed in skeletal and cardiac muscle. However, it has also been found in the brain, liver, intestine, kidney, and retina. Its presence in the brain is less extensive than in the muscles, which helps explain some of the central nervous system symptoms of the disease [9]. For example, there is a decline in learning ability, impaired muscle coordination, and degeneration of both afferent and efferent nerves. Epilepsy occurs more frequently than in the general population, and autism-like behaviors have been occasionally observed [10]. It is known that ALT and AST enzymes, in particular, are characteristically elevated in the liver [11]. Problems like constipation caused by muscle weakness have been reported in the gastrointestinal system [12]. Studies have indicated that cysteine levels in the kidneys are increased in DMD [13]. These studies have demonstrated that renal involvement is linked to chronic cardiac dysfunction, low water intake, and diuretic use [14]. Long-term follow-up studies have shown that, although myofibrillar atrophy, necrosis, and fatty degeneration are observed in DMD patients, endomysial fibrosis remains the standard myopathological parameter, depending on the severity of the pathology [15].
Various studies have determined that the healing ability of muscle tissue is limited compared to other tissues. Fibrosis formation and ongoing myofibrillar destruction cannot be fully offset by satellite cell proliferation. The inflammatory process that follows muscle necrosis leads to the formation of fibrotic tissue and the replacement of fatty tissue [16]. In our study, we investigated, for the first time, the effect of whole dystrophin transferred to muscle cells using cells from DMD patients and transgenic experimental animals.
2. Materials and Methods
2.1. Pre-Experimental Stages and Patent Process
Exon 52, 51, 48, and 47 mRNA-carrier complexes were applied for the patent process (Application No: 25/002849, Reference No: 21428/5). In the current study, we discussed the results of the patented complex and the mRNA-carrier complexes for exons 52, 51, 48, and 47, which were limited in providing detailed information (sequences and release information).
2.2. Experimental Design
The study was designed in two steps. 1. In vitro (patient donated cells n=6), and 2. In vivo (transgenic mice mdx/d2 n=60) (Figure 1).
2.3. Primary Cell Culture Preparation
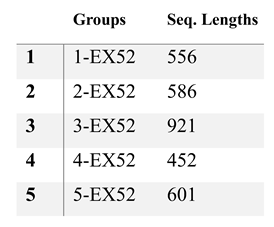
2.3.1. EXON 52 Test
Bladder cells from 6 patients with DMD were cultured in fresh DMEM (Sigma, USA). Experimental groups included: Positive Control (healthy individual cells), Negative Control (DMD patient bladder cells), and various exon 52 sequences (n=8). The in vitro experiment was carried out over 24 hours. At the end of the study, immunohistochemistry and Western Blot tests were performed.

Table 1.
Exon deletions and base sequences used for in vitro analyses.
 |
2.4. Animal Study
Sixty transgenic mdx/d2 mice were obtained from the Jackson Laboratory (USA). The EX52, EX48, EX51, and EX47 groups were determined as 52, 48, 51, and 47, respectively. The experimental duration was 45 days.
2.5. Treatment Preparation
100 µL Exon-mRNA was injected into the back of both legs (hip extensor muscle). The treatment compound was mixed with saline and administered via injection. At the end of the experiment, 0.8-1 ml of blood was collected from the heart while the mice were under inhaled anesthesia. Tissues, including skeletal muscle, heart, intestine, kidney, and brain, were harvested and fixed in 10% formaldehyde. Muscle samples intended for pathology were processed accordingly. Other tissues were homogenized with liquid nitrogen for biochemical analysis.
2.6. Behavioral Tests
Before mRNA transfer, mice underwent behavioral testing. The averages for each group were calculated and analyzed three times, both before and after medication. Behavioral tests included a 5-minute motor function test, measuring rest and movement distance. Rotarod test: The number of falls was recorded over 200 seconds. Additionally, the catwalk test involved walking along a 30 cm-wide corridor. Footprints were taken to measure the mice’s foot distances.
2.7. Molecular Analyses
ELISA, PCR, Western blot, IHC, and IF analyses were conducted using cell isolates obtained from both primary cultures and tissue and blood samples.
2.7.1. ELISA Tests
The obtained tissue samples were homogenized, then lysed with cell lysis buffer and centrifuged at 1500 rpm for 5 minutes. After centrifugation, the supernatant was collected for ELISA testing and stored at -20 °C until further analysis. Analyses were conducted following the protocols of the commercially available ELISA kit. The parameters tested included TAC (Rel Assay Diagnostic, TZ24152A), TOS (Rel Assay Diagnostic, 0K251770), ɒ-klotho (BT Lab, 202408010), PPARγ (BT Lab, 202408010), and NO (BT Lab, 202208002). Each experiment used 15 mg of tissue. All analyses were performed in triplicate.
2.7.2. Gene Expression
Total RNA was extracted from homogenized tissue and cell samples using an RNA isolation kit (EcoTech, TRY271224). RNAs obtained from muscle tissues were used for cDNA synthesis (ThermoFisher, 2979096). All steps were carried out according to the manufacturer’s instructions. Then, the gene expression levels of IL-1, IL-6, IL-8, IL-10, α-actin, α-spectrin, β-dystroglycan, γ-sarcoglycan, and dystrophin were measured in three replicates.
Table 2.
Probe sequences of analyzed genes.
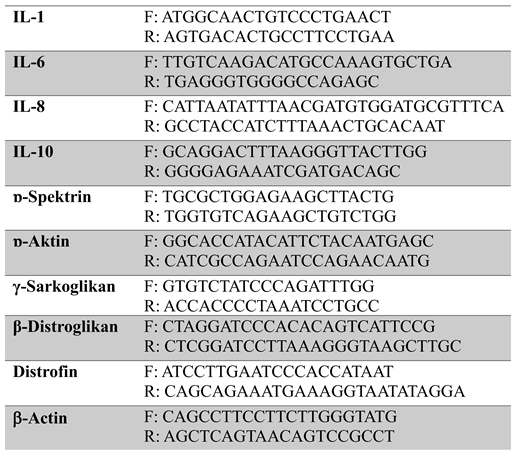 |
For genes, 0.25 µl of right and left primers, 0.15 µl of probe, 3 µl of cDNA, three master mixes, and 12.75 µl of distilled water were added to each lane (tube). The final volume was adjusted to 20 µl. Forty-five cycles were performed after 600 seconds at 95 °C, 10 seconds at 95 °C, and 30 seconds at 60 °C. The expression levels of IL-1, IL-6, IL-8, IL-10, ɒ-actin, ɒ-spectrin, β-Dystroglycan, γ-sarcoglycan, and dystrophin were detected.
2.7.3. Western Blot
15 μL of the resulting cell lysates were mixed with an equal volume of SDS-PAGE gel loading buffer. After incubation at 95 °C for 5 minutes, 15 μL of the sample was loaded onto the gel for Western blot analysis. For this procedure, the gel was incubated in 1X transfer buffer for 5 minutes. After cutting the PVDF membrane to match the gel size, it was first shaken with pure methanol for 5 minutes. Following this, the methanol was decanted, and 1X transfer buffer was added. The membrane was shaken in this buffer for 5 minutes. At the end of this step, two pieces of blotting paper, a nitrocellulose membrane, the gel, and two more pieces of blotting paper were assembled into the semidry blotting device. The device was then turned off, and blotting was performed for 7 minutes under a 25-watt electrical field. Afterward, the membrane was removed, and 10 mL of blocking buffer (2.5% milk powder) was added to the front of the membrane, which was then incubated for 1 hour at room temperature. Following gentle shaking, the membrane was washed twice with 20 mL of PBST (pH 7.2) for 5 minutes each on a shaker. After washing, the dystrophin Antibody (sc-33697) was diluted 1:1,000 in blocking buffer and added to the blocking buffer. The membrane was incubated with the antibody-containing buffer overnight at +4 °C. At the end of this period, the membrane was washed six times for 5 minutes each with gentle agitation using PBST. The antibody was visualized by generating a chemical signal with Femto and Pico substrates (ECL reagent).
2.7.4. IF (Immunofluorescence) Analysis
5 µm sections were prepared on polylysine slides, deparaffinized, dehydrated, and then washed with PBS. To inhibit endogenous peroxidase activity, the sections were incubated in 3% hydrogen peroxide for 10 minutes. To prevent antigen masking in the nucleus, the sections were heated in a microwave oven four times for 5 minutes each in an antigen-retrieval solution (citrate buffer, pH 6). After microwave treatment, the sections were cooled to room temperature. While still in the solution, the sections were washed with PBS without removing them. Protein blocking was applied to the tissues. Primary antibodies (p53, Ki-67, PCNA, and Bax) were then incubated in a humidified chamber according to the times recommended in the antibody package insert, followed by another PBS wash. Immunofluorescence antibody (FITC) was added at a 1:50 dilution and incubated in the dark for 45 minutes. A mixture of 9 parts distilled water and 1 part glycerol was applied to the tissues, covered with a coverslip, and examined under a fluorescence microscope (enter microscope brand).
2.7.5. IHC (Immunohistochemical) Analysis
Rat striated muscle tissue was used as a positive control for immunohistochemistry. Tissues were fixed with 10% formaldehyde for 24 hours. pH six citrate buffer was used for antigen retrieval. After antigen retrieval, the slides were incubated with 10% hydrogen peroxide for 15 minutes to block endogenous peroxidase activity. The blocking solution was then applied to the slides, and they were incubated with primary antibodies against dystrophin (mouse monoclonal anti-human; dilution, 1:100; catalog no. sc-53546; Santa Cruz Biotechnology, Inc., Dallas, TX, USA) for 1 hour at room temperature. Then, the samples were washed with PBS for 15 minutes and incubated with the HRP Detection System (Epredia, UltraVision Detection System). Biotin-treated secondary antibody and streptavidin-peroxidase complex were then applied to the samples. Next, AEC (Epredia, AEC chromogen kit) was used as the chromogen for 5 minutes. Slides were stained with Harris hematoxylin as a background stain. Immunohistochemical staining was evaluated based on optical density. Five random fields were examined on each slide. Slides were photographed, and protein expression was measured using ImageJ software at ×20 magnification on a Nikon Eclipse E200 microscope (Nikon Corp., Tokyo, Japan). Logarithmic evaluation of integrated optical density (OD) was performed to assess staining intensity in immunoreactive areas.
2.7.6. Statistical Analysis
GraphPad Prism 8.0.2 was used for statistical analysis of histopathological examinations, with p<0.05 set as the threshold for significance. The Duncan test was employed for intergroup comparisons. The nonparametric Kruskal-Wallis test assessed group differences, while the Mann-Whitney U test evaluated differences between groups. To determine the intensity of positive staining from images obtained through immunofluorescence staining, five random fields from each image were selected and analyzed using ZEISS Zen Imaging Software. Data were presented as the mean ± standard deviation (mean ± SD) for area percentage. A one-way ANOVA followed by the Tukey test was used to compare positive immunoreactive cells and immunopositive-stained areas with those of healthy controls. A p<0.05 was considered significant. Data are shown as mean ± SD.
3. Results
3.1. EXON 52 In Vitro Test Results
3.1.1. Western Blot Analysis
The image of the protein bands obtained from primary cells after electrophoresis on the gel is shown in Figure 5. Protein bands are observed between the positive control, DMD control, and Exon 52. The protein band is around 25 kDa and appears to be attached to dystrophin in the positive control. Prominent bands are visible between EXON 52.
The results are displayed for the Positive Control (healthy individual cells), the Negative Control (cells from an individual with DMD), and the Treatment Groups (Treatment Complex + DMD bladder cells). The 25 kD band was detected at high protein levels in groups 1, 2, 3, 4, and 5. The increase observed in cell membrane compartments correlates with dystrophin (Figure 2).
3.1.2. Genetic Analyses
RT-PCR analysis was performed on cell isolates obtained from primary culture. The results of the investigation into dystrophin levels are shown in Figure 3. At this stage, the experiment was continued with the EX48, EX51, and EX47 groups, which were deemed adequate. The data showed that levels of dystrophin, β-Dystroglycan, γ-sarcoglycan, and ɒ-Spectrin increased, especially in the EX51 group compared to the DMD control group (P<0.01).
3.2. In vivo test for EXON 52, 51, 48, and 47 mRNA complex
3.2.1. Behavioral Analyses
The motor function test results are shown in Figure 4. The results indicate that rest periods decreased in all groups, and this decrease was significantly smaller than in the DMD control group (P<0.01). The shortest rest periods were seen in the EX52 group. A proportional reduction in rest periods increases the desire to move. Considering the distance covered, high mobility is evident. While the increase was minor in the EX48 group, it was similar in the EX52, EX51, and EX47 groups.
In the Rotarod test, the DMD control group averaged 34 falls within 200 seconds, while the EX48 group had 8, and the other treatments had 1 (P<0.01).
3.2.2. ELISA Analyses
The total antioxidant capacity test data are presented in Figure 5. The results are expressed as Trolox Equiv/L-1. TAC levels increased in all groups except the DMD control group. The data for the EX52, EX51, and EX47 groups are similar (P<0.01). The EX48 group showed less variation compared to the other treatments (P<0.05).
Total oxidant level test data are shown in Figure 5. The data obtained are presented as H2O2 Equiv/L-1. The TOS result for the DMD control group was 4.9 H2O2 Equiv/L-1. TOS levels decreased in all treatment groups compared to the control group. Data from the EX52, EX51, and EX47 groups were similar to each other and showed a significant difference from the DMD control group (P<0.01). The difference was smaller in the EX48 group than in the other treatments (P<0.05).
ɒ-Klotho, PPARγ, and NO level test data are shown in Figure 5. The data are expressed in nM. The ɒ-Klotho level in the DMD control group was 2.4 nM. An increase in ɒ-Klotho levels was observed in all groups except the EX48 group (P>0.05). Data from the EX52, EX51, and EX47 groups showed a significant difference from the DMD control group (P<0.01).
The PPARγ level for the DMD control group was 1.4 nM. Data from the EX52 and EX51 groups showed a significant difference from the DMD control group (P<0.05). No significant difference was observed between the EX48 and EX47 groups and the other groups (P>0.05). The NO level in the DMD control group was 1.8 nM. NO levels increased in all groups except the EX48 group (P>0.05). Data from the EX51, EX52, and EX47 groups showed a significant difference compared to the DMD control group (P<0.01).
3.3.3. Gene Expression Analyses
The expression levels of dystrophin, β-Dystroglycan, γ-sarcoglycan, ɒ-Spectrin, IL-1, IL-6, IL-8, and IL-10 are shown in Figure 6. The DMD control group was assigned a 1-fold ratio. The data indicate that expression levels of dystrophin, β-Dystroglycan, γ-sarcoglycan, and ɒ-Spectrin were significantly higher in all treatment groups. Based on IL markers, inflammation was reduced.
β-Dystroglycan levels were nearly 15 times higher in the EX51 group, while the lowest was 2.5 times in the EX48 group (P<0.01).
In γ-Sarcoglycan levels, expression was nearly 9-fold higher in the EX51 and EX47 groups (P<0.01), while the lowest was 1.8-fold in the EX48 group (P<0.05).
In ɒ-Actin levels, expression was nearly 8 times higher in the EX52 and EX51 groups (P<0.01), while the lowest was 1.6 times in the EX48 group (P<0.05).
IL-1 expression decreased in all groups except EX48. The most significant decrease, nearly 0.6-fold, was observed in the EX47 and EX51 groups (P<0.01). The EX48 group showed a 1.2-fold decrease (P<0.05).
IL-6 expression levels decreased across all treatment groups except EX48. The most notable reductions were observed in the EX52 and EX47 groups, with approximately 0.6-fold decreases (P<0.01). The EX48 group showed a 1.4-fold decrease (P<0.05).
IL-8 expression levels decreased in all treatment groups except EX48. The most notable reduction was observed in the EX52 and EX51 groups, approximately 0.4-fold (P<0.05). There was no significant difference between the EX48 and EX51 groups (P>0.05).
IL-10 expression levels decreased in all treatment groups except EX48. The most significant increase was observed in the EX51 and EX52 groups, approximately 3-fold (P<0.01). There was no significant difference in the EX48 group (P>0.05).
3.3.4. Immunofluorescence and Immunohistochemistry Analysis for Muscles
Immunofluorescence analysis showed no pathological findings in the brain, kidney, or intestinal tissues (Figure 7, Figure 8, Figure 9, Figure 10, Figure 11, Figure 12, Figure 13 and Figure 14).
DMD Control: When muscle and heart tissues were examined using immunofluorescence, very mild intracytoplasmic expression of Spectrin α, β-dystroglycan, α-actinin, and γ-sarcoglycan was observed in the muscle fibers of myocytes.
E52: When muscle and heart tissues were examined using immunofluorescence, moderate intracytoplasmic expression of Spectrin α, β-dystroglycan, α-actinin, and γ-sarcoglycan was observed in the muscle fibers of myocytes.
E48: When muscle and heart tissues were examined using immunofluorescence, moderate intracytoplasmic expression of Spectrin α, β-dystroglycan, α-actinin, and ¥-sarcoglycan was observed in the muscle fibers of myocytes.
E51: When muscle and heart tissues were examined using immunofluorescence, significant intracytoplasmic expression of Spectrin α/β, β-dystroglycan, α-actinin, and γ-sarcoglycan was observed in the muscle fibers of myocytes.
E47: When muscle and heart tissues were examined using immunofluorescence, significant intracytoplasmic expression of Spectrin α/β, β-dystroglycan, α-actinin, and γ-sarcoglycan was observed in the muscle fibers of myocytes. Statistical data for the immunofluorescence results are shown in Figure 14.
Figures: 100 µm.
3.3.5. IHC Analysis
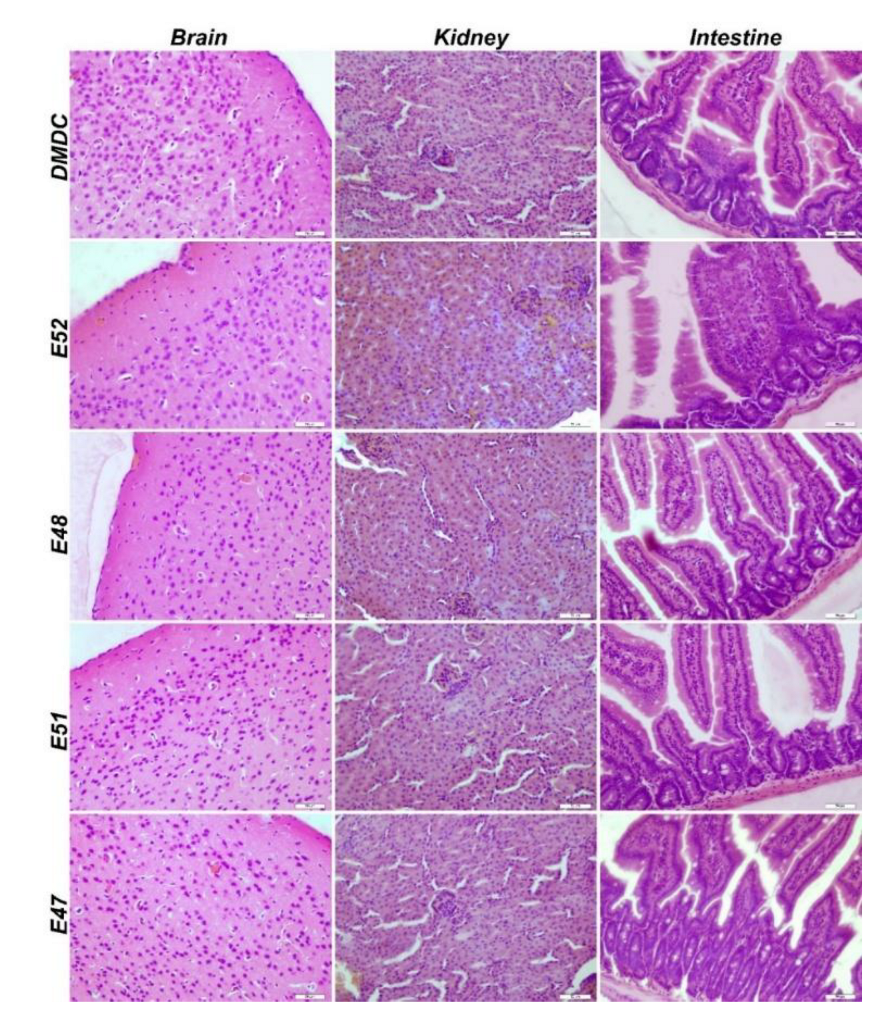
Histopathological examination of the brain, kidney, and intestinal tissues revealed no statistically significant difference in pathological findings (Figure 15).
4. Discussion
The in vitro study showed that the majority of 5 different sequences + carrier combinations are effective, but we chose the highest dystrophin expression rates. In this relation, promoter, 5’ and 3’ sequences, and polyA were applied for the EXON 51, 48, and 47 dystrophins. Four exons — 52, 51, 48, and 47 — were selected for animal experiments because they represent four of the most common deletions among DMD mutations.
At this stage, the animal experiment planning was conducted as follows. The experiment lasted 45 days and included two-stage transfers. The first transfer was planned to restore all muscles, and the second to cover newly formed muscles. Sixty mdx/d2 mice were sourced from the Jackson Laboratory. The mdx/d2 strain was chosen for our studies because it closely resembles the model of human muscle damage. The comparison confirmed that dystrophin was produced. This data demonstrates the complex’s ability to cross the cell membrane and synthesize the dystrophin protein. Nonetheless, functional dystrophy must be validated through behavioral tests.
Behavioral tests
Motor function test
Motor function tests are routinely used to assess movement ability. An increase in movement ability or a decrease in rest periods indicates that motor cortex and muscle coordination have been achieved [17]. The applied treatment has been found to increase the ability to move and stay on the rotarod during the experiment [18]. Studies have shown improvements in wire-holding time and rotarod walking time in treated mice that produce dystrophin compared to controls. Due to decreased muscle strength (along with increased fatigue), mdx/d2 mice frequently fall from the rotating plate. The DMD control group dropped an average of 34 times in 200 seconds, while the EX48 group dropped an average of 8 times, and the other treatments dropped an average of 1 time. Visible improvement indicates increased muscle strength and that the dystrophin produced is functional.
The motor test is similar to the rotarod test. Studies have shown that the experimental mice traveled a shorter distance than the control group. However, the treated mice were found to move more vigorously and walk longer distances [19]. When examining the distance covered and rest periods, increased mobility was observed in the treatment groups compared to the control group.
Determining Gene Expression Levels
At this stage of our study, dystrophin, β-dystroglycan, γ-sarcoglycan, α-actin, and α-spectrin were detected at both the cellular and tissue levels. Studies generally monitor the level of dystrophin produced. However, our study supports the following notion: dystrophin forms the internal link with ɒ-actin, while β-dystroglycan, γ-sarcoglycan, and ɒ-spectrin connect to the extracellular matrix. Therefore, investigating this complex in its entirety is essential to assessing the study’s success. CRISPR-Cas9, one of the leading methods currently used to treat DMD, increases dystrophin levels. However, it is emphasized that fibrosis negatively affects muscle development. Therefore, they suggest a gradual improvement in the treatment processes described. The first signs of improvement were reported after 1 year of treatment [20]. Although our study was short-term, the results obtained within 45 days have significant therapeutic effects. Studies have reported increases in dystrophin production after treatment ranging from 6.255 to 11% [21]. The exact amount of dystrophin sufficient for DMD patients is unknown. This is due to individual differences. The dystrophin ratio obtained in our study was much higher. The DMD control group was rated at 1. The highest results were found in the EX51 group, with dystrophin expression nearly 10-fold higher. These results are also supported by Western blot and IHC data.
Eteplirsen, also known as Exondys 51 (Sarepta Therapeutics, Inc.), was the first drug approved by the FDA for DMD. In DMD patients with mutations amenable to exon 51 skipping, this treatment increased dystrophin expression by 0.28% and 0.93% after 48 and 180 weeks of treatment, respectively [22]. A significant difference was demonstrated in the 6-minute walk test 36 months after initial treatment, and six patients, with a mean age of 9 years, had lost mobility. A phase 3 randomized, double-blind, dose-finding, and comparison study is ongoing to assess the safety and efficacy of high-dose eteplirsen. Preliminary results from the phase 2 MOMENTUM study demonstrated that monthly dosing of SRP-5051, with exon 51 skipping, at 30 mg/kg resulted in an average increase in dystrophin expression of 6.55% in patients with DMD [20].
In the study by Paola et al., ROS-activated tyrosine kinase in DMD promotes the degradation of β-dystroglycan (β-DG), a component of the dystrophin-glycoprotein complex that can amplify damaging signals [23]. In mdx/d2 mice, a 4-week subcutaneous treatment with dasatinib (DAS), a pan-Src-TKs inhibitor approved as an anti-leukemic agent, increased muscle β-DG and resulted in minimal improvements in morphofunctional indices. The study is valuable because it conducted a single β-dystroglycan trial in a DMD model. In our research, TAC, MTT, TOS, IL-1-6-8-10, and β-dystroglycan ratio were evaluated. TAC, TOS, and MTT analyses, which correspond to ROS parameters, showed that muscle inflammation and oxidative stress decreased after our treatment. Survival rates were higher in the treatment groups than in the DMD control group. Additionally, the expression level of the β-Dystroglycan gene increased nearly 15-fold in the EX51 group, suggesting that β-, γ-, and δ-sarcoglycan function as a single unit. Notably, myofiber degeneration can occur independently of dystrophin in γ-sarcoglycan-deficient mice, even though they have normal dystrophin levels and localization. Furthermore, apoptotic myonuclei are highly expressed in γ-sarcoglycan-deficient skeletal muscles, suggesting that programmed cell death contributes to myofiber degeneration [24]. Based on this information, γ-sarcoglycan gene expression is essential regardless of DMD. Our study showed that γ-sarcoglycan expression increased nearly ninefold in the EX51 group compared to the DMD control group.
Limited studies in the literature suggest that defects in actin and spectrin binding sites may occur in dystrophin-deficient muscle [25]. It is known that this error is caused by the degradation of accumulated proteins by proteinases. However, it is normal for the levels of these proteins to increase as reinforcement occurs after the bridges are formed and dystrophin is restored. An eightfold increase in ɒ-actin expression and a nearly sixfold increase in ɒ-spectrin expression were detected in the EX51 and EX52 groups.
One study investigated epigenetic silencing of the klotho gene in the mdx mouse model of DMD to determine whether klotho silencing is a key feature of the disease. The data indicated that klotho undergoes muscle-specific silencing during the acute onset of mdx/d2 pathology. Expression of a klotho transgene in mdx/d2 mice has been shown to restore longevity, reduce muscle wasting, improve cellular function, and significantly increase the muscle-resident stem cell pool required for regeneration. Transgene expression was paralleled by decreased fibrosis and reduced expression of collagen types 1 and 3 in the late, progressive stages of mdx/d2 pathology. Therefore, epigenetic silencing of klotho during muscular dystrophy has been suggested to significantly contribute to the loss of regenerative capacity and increased fibrosis of dystrophic muscle in the later stages of DMD [26]. In our study, ɒ-Klotho levels were increased in all groups except EX48 (P>0.05). Data obtained from groups EX52, EX51, and EX47 showed significant differences compared to the DMD control group (P<0.01). Peroxisome proliferator-activated receptor γ (PPARγ) is a transcriptional coactivator that binds to various transcription factors. PPARγ coactivator 1 (PGC-1) has a wide range of biological effects in different tissues. It plays a key role in regulating oxidative metabolism, thereby regulating reactive oxygen species production, autophagy, and mitochondrial biogenesis. Because of these findings, numerous studies aimed at determining the role of PGC-1 in the neuromuscular system have suggested that PGC-1 may be a promising target for treatments targeting neuromuscular diseases [27]. The restoration of dystrophin and beta-dystroglycan, along with increased expression of PPARγ, a key component of cell metabolism, indicates improved function. In our study, PPARγ levels were increased in all groups except EX48 (P>0.05). Data from the EX52 and EX51 groups showed a significant difference from the DMD control group (P<0.05). The same pattern was also observed in the NO level test. Increased NO levels due to oxidative stress led to a positive treatment response, and our study data showed a decrease in its expression.
ELISA analyses of dystrophin, β-dystroglycan, γ-sarcoglycan, ɒ-actin, and ɒ-spectrin protein levels were found to be consistent with RT-PCR results. While expression in all treatment groups was clearly higher than in the DMD control group, EX52, EX51, and EX47 showed the highest protein levels. Dystrophin, in particular, showed high expression. The increase observed in cell membrane compartments is proportional to dystrophin.
Histopathological Findings
Different organs were evaluated at this stage. Dystrophin is expressed in muscle, brain, monocytes, fibroblasts, and, to a lesser extent, in other organs. However, a deficiency in dystrophin levels affects the entire system. In DMD, the developmental stages, skeletal muscles, brain, immune system, heart, and lungs are primarily affected. In patients with DMD, muscle biopsy characteristically reveals necrotic or degenerative muscle fibers, often observed in clusters. Macrophages and CD4+ lymphocytes surround these necrotic fibers. Additionally, small, immature fibers with central nuclei are observed, reflecting muscle regeneration from myoblasts, resulting in a balance between necrotic and regenerative processes in the early stages of the disease [28]. Subsequently, the muscles’ regenerative capacity appears exhausted, and muscle fibers are gradually replaced by connective and fatty tissue. Therefore, the symptoms of Duchenne muscular dystrophy are thought to result from an imbalance between muscle fiber necrosis and myoblast regeneration. Necrosis is the primary pathological feature, but animal evidence suggests that regenerative capacity may decline with age. In our study, histopathological examination of the control DMD group revealed myofibrils of varying sizes, generally rounded in cross-section, with centrally located nuclei. Inflammatory cell infiltration and areas of necrotic tissue were observed. These histopathological findings were also observed in the other EX52, EX48, EX51, and EX47 groups, but these findings decreased from EX52 to EX47.
Immunohistochemistry was used to evaluate dystrophin, spectrin, dystroglycan, and sarcoglycan expression in striated muscle tissue from each group. Dystrophin expression increased in the EX51 (13.6±3.8%) and EX47 (8.63±3.06%) groups compared to the control group (1.24±0.09%) (P<0.05).
5. Conclusions
In conclusion, mRNA treatment solutions for deleted exons in DMD disease show promise. However, we need future studies to examine satellite cells’ responses to dystrophin mRNA and a clinical study to determine dystrophin levels across muscle types.
Supplementary Materials
The following supporting information can be downloaded at the website of this paper posted on Preprints.org.
Author Contributions
Conceptualization, D.C., S.G., O.C., and A.T.; methodology, D.C., B.A., D.G.F., S.Y., S.B., K.K., E.N., O.C., E.S., M.K., S.G., and A.T.; validation, D.C., and S.G.; investigation, D.C., S.G., O.C., and A.T.; data curation, D.C., B.A., D.G.F., S.Y., S.B., K.K., E.N., O.C., E.S., M.K., S.G., and A.T.; writing D.C., B.A., D.G.F., S.Y., S.B., K.K., E.N., O.C., E.S., M.K., S.G., and A.T.; writing review and editing, D.C., B.A., D.G.F., S.Y., S.B., K.K., E.N., O.C., E.S., M.K., S.G., and A.T.; supervision, A.T. All authors have read and agreed to the published version of the manuscript.
Funding
This research was funded by the project number 22670, Presidency of Turkish Health Institutes (TÜSEB).
Institutional Review Board Statement
In vitro study: Code: 218345, date: 31.10.2023, Bilecik Şeyh Edebali University Ethics Committee; Animal study: Acıbadem Mehmet Ali Aydınlar University Animal Experiments Local Ethics Committee, ACU-HADYEK-2024/51, July 24, 2024.
Informed Consent Statement
Not applicable.
Data Availability Statement
The dataset presented in this study is available from the corresponding author upon reasonable request.
Conflicts of Interest
The authors declare no conflicts of interest.
Abbreviations
The following abbreviations are used in this manuscript:
| DGC | Dystrophin-glycoprotein complex |
| ECM | Extracellular matrix |
| DMD | Duchenne Muscular Dystrophy |
| IHC | Immunohistochemical |
| IF | Immunofluorescence |
| PPAR- γ | Proliferator-activated receptor γ |
| EX | Exon |
| TAC | Total Antioxidant Capacity |
| TOS | Total Oxidative Stress |
| NO | Nitric Oxide |
References
- Ervasti, J.M. and K.P. Campbell, A role for the dystrophin-glycoprotein complex as a transmembrane linker between laminin and actin. The Journal of cell biology, 1993. 122(4): p. 809-823.
- Constantin, B. , Dystrophin complex functions as a scaffold for signalling proteins. Biochimica et Biophysica Acta (BBA)-Biomembranes, 2014. 1838(2): p. 635-642.
- Gao, Q.Q. and E.M. McNally, The dystrophin complex: structure, function, and implications for therapy. Comprehensive physiology, 2015. 5(3): p. 1223-1239.
- Hughes, D.C. , et al., Age-related differences in dystrophin: impact on force transfer proteins, membrane integrity, and neuromuscular junction stability. Journals of Gerontology Series A: Biomedical Sciences and Medical Sciences, 2017. 72(5): p. 640-648.
- Duan, D. , et al., Duchenne muscular dystrophy. Nature reviews disease primers, 2021. 7(1): p. 13.
- Vo, A.H. and E.M. McNally, Modifier genes and their effect on Duchenne muscular dystrophy. Current opinion in neurology, 2015. 28(5): p. 528-534.
- García-Rodríguez, R. , et al., Premature termination codons in the DMD gene cause reduced local mRNA synthesis. Proceedings of the National Academy of Sciences, 2020. 117(28): p. 16456-16464.
- Mercuri, E., C. G. Bönnemann, and F. Muntoni, Muscular dystrophies. The Lancet, 2019. 394(10213): p. 2025-2038.
- Bies, R.D. , et al., Human and murine dystrophin mRNA transcripts are differentially expressed during skeletal muscle, heart, and brain development. Nucleic acids research, 1992. 20(7): p. 1725-1731.
- Zhang, X.-f., W. Hu, and J. Hu, Neurological impairments in Duchenne muscular dystrophy: A comprehensive review. Acta Neurologica Belgica, 2025: p. 1-12.
- Zhu, Y. , et al., Serum enzyme profiles differentiate five types of muscular dystrophy. Disease Markers, 2015. 2015(1): p. 543282.
- Lo Cascio, C.M. , et al., Gastrointestinal dysfunction in patients with Duchenne muscular dystrophy. PLoS One, 2016. 11(10): p. e0163779.
- Kutluk, M.G. and Ç.S. Doğan, Kidney involvement and associated risk factors in children with Duchenne muscular dystrophy. Pediatric Nephrology, 2020. 35(10): p. 1953-1958.
- Villa, C.R. , et al., Identifying evidence of cardio-renal syndrome in patients with Duchenne muscular dystrophy using cystatin C. Neuromuscular Disorders, 2016. 26(10): p. 637-642.
- Klingler, W. , et al., The role of fibrosis in Duchenne muscular dystrophy. Acta Myologica, 2012. 31(3): p. 184.
- Desguerre, I. , et al., Endomysial fibrosis in Duchenne muscular dystrophy: a marker of poor outcome associated with macrophage alternative activation. Journal of Neuropathology & Experimental Neurology, 2009. 68(7): p. 762-773.
- Sindhurakar, A. , et al., An automated test of rat forelimb supination quantifies motor function loss and recovery after corticospinal injury. Neurorehabilitation and neural repair, 2017. 31(2): p. 122-132.
- Aartsma-Rus, A. and M. van Putten, Assessing functional performance in the mdx mouse model. Journal of visualized experiments: JoVE, 2014(85): p. 51303.
- Taglietti, V. , et al., Duchenne muscular dystrophy trajectory in R-DMDdel52 preclinical rat model identifies COMP as biomarker of fibrosis. Acta neuropathologica communications, 2022. 10(1): p. 60.
- Therapeutics, S. , Sarepta Therapeutics Reports Positive Clinical Results from Phase 2 MOMENTUM Study of SRP-5051 in Patients with Duchenne Muscular Dystrophy Amenable to Skipping Exon 51| Sarepta Therapeutics, Inc.[Internet].(2021).
- Happi Mbakam, C., G. Lamothe, and J.P. Tremblay, Therapeutic strategies for dystrophin replacement in Duchenne muscular dystrophy. Frontiers in Medicine, 2022. 9: p. 859930.
- Aartsma-Rus, A. and A.M. Krieg, FDA approves eteplirsen for Duchenne muscular dystrophy: the next chapter in the eteplirsen saga. Nucleic acid therapeutics, 2017. 27(1): p. 1-3.
- Mantuano, P. , et al., β-Dystroglycan restoration and pathology progression in the dystrophic mdx mouse: outcome and implication of a clinically oriented study with a novel oral dasatinib formulation. Biomolecules, 2021. 11(11): p. 1742.
- Hack, A.A. , et al., γ-Sarcoglycan deficiency leads to muscle membrane defects and apoptosis independent of dystrophin. The Journal of cell biology, 1998. 142(5): p. 1279-1287.
- Guhathakurta, P. , et al., Enhancing interaction of actin and actin-binding domain 1 of dystrophin with modulators: Toward improved gene therapy for Duchenne muscular dystrophy. Journal of Biological Chemistry, 2022. 298(12).
- Wehling-Henricks, M. , et al., Klotho gene silencing promotes pathology in the mdx mouse model of Duchenne muscular dystrophy. Human molecular genetics, 2016. 25(12): p. 2465-2482.
- Suntar, I. , et al., Natural products, PGC-1α, and Duchenne muscular dystrophy. Acta Pharmaceutica Sinica B, 2020. 10(5): p. 734-745.
- Deconinck, N. and B. Dan, Pathophysiology of duchenne muscular dystrophy: current hypotheses. Pediatric neurology, 2007. 36(1): p. 1-7.
Figure 1.
Experiment design. A) In vitro analysis: Primary cells were collected from DMD patients. A primer cell was used to select an effective mRNA sequence. B) In vivo analysis was performed on mdx/d2 mice: mRNA from exons 52, 51, 48, and 47 was tested in primary isolated cells.
Figure 1.
Experiment design. A) In vitro analysis: Primary cells were collected from DMD patients. A primer cell was used to select an effective mRNA sequence. B) In vivo analysis was performed on mdx/d2 mice: mRNA from exons 52, 51, 48, and 47 was tested in primary isolated cells.
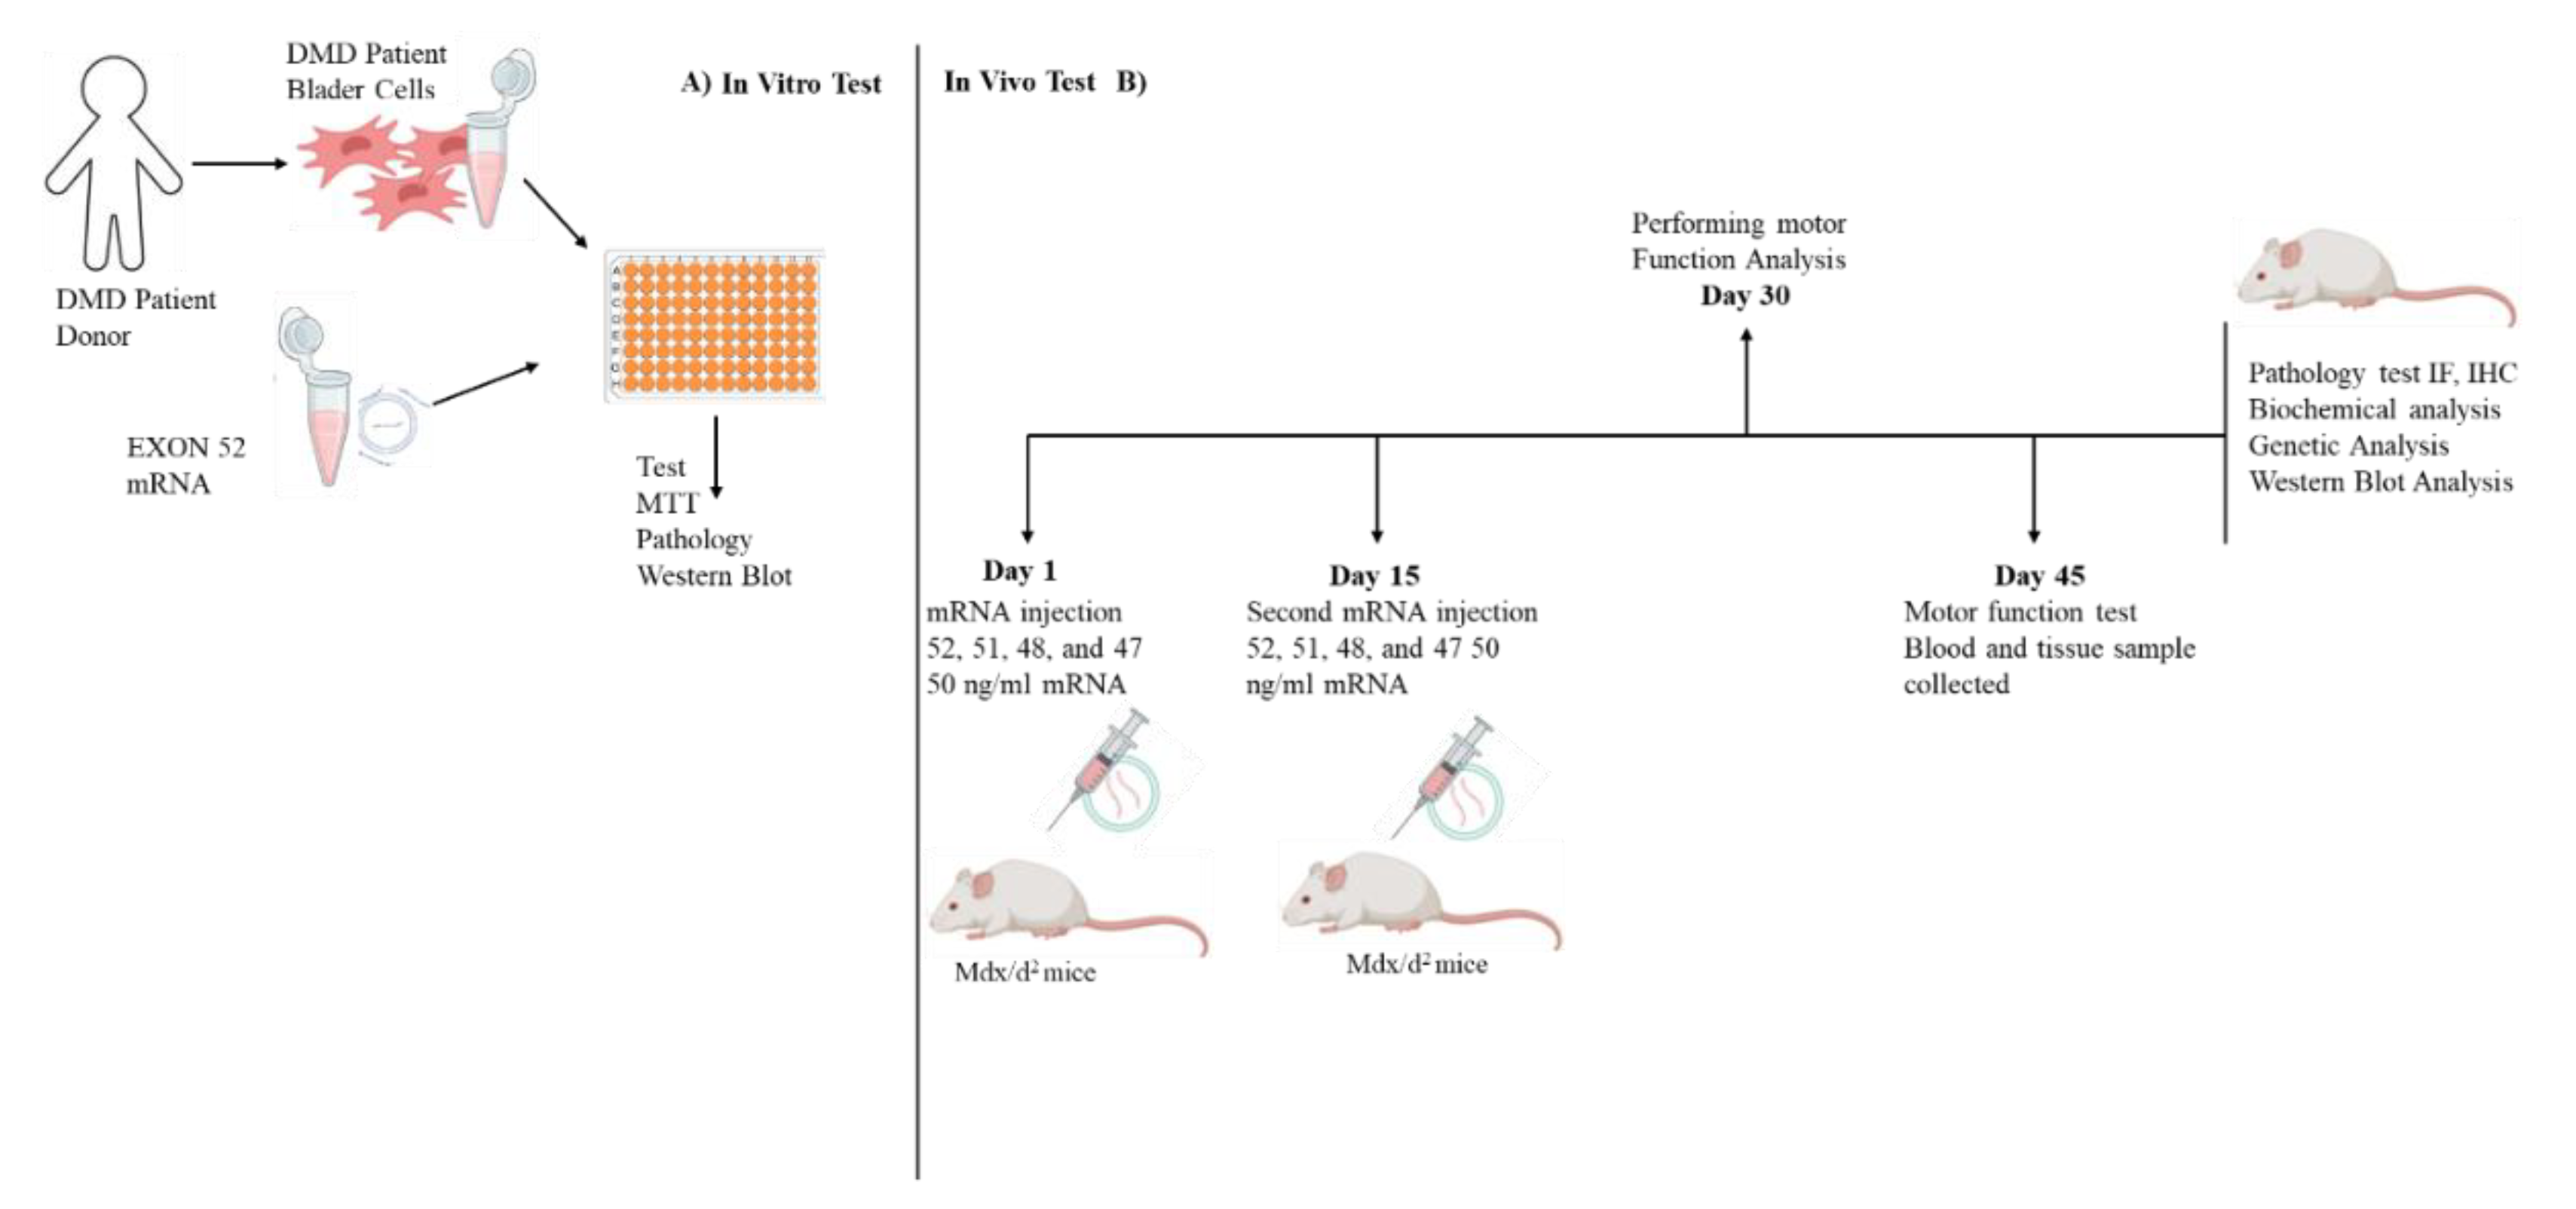
Figure 2.
Different WB results for 52 exon-mRNA treatments are shown. Expression of Spectrin α, α-actinin, β-Dystroglycan, γ-sarcoglycan, and Dystrophin is displayed.
Figure 2.
Different WB results for 52 exon-mRNA treatments are shown. Expression of Spectrin α, α-actinin, β-Dystroglycan, γ-sarcoglycan, and Dystrophin is displayed.
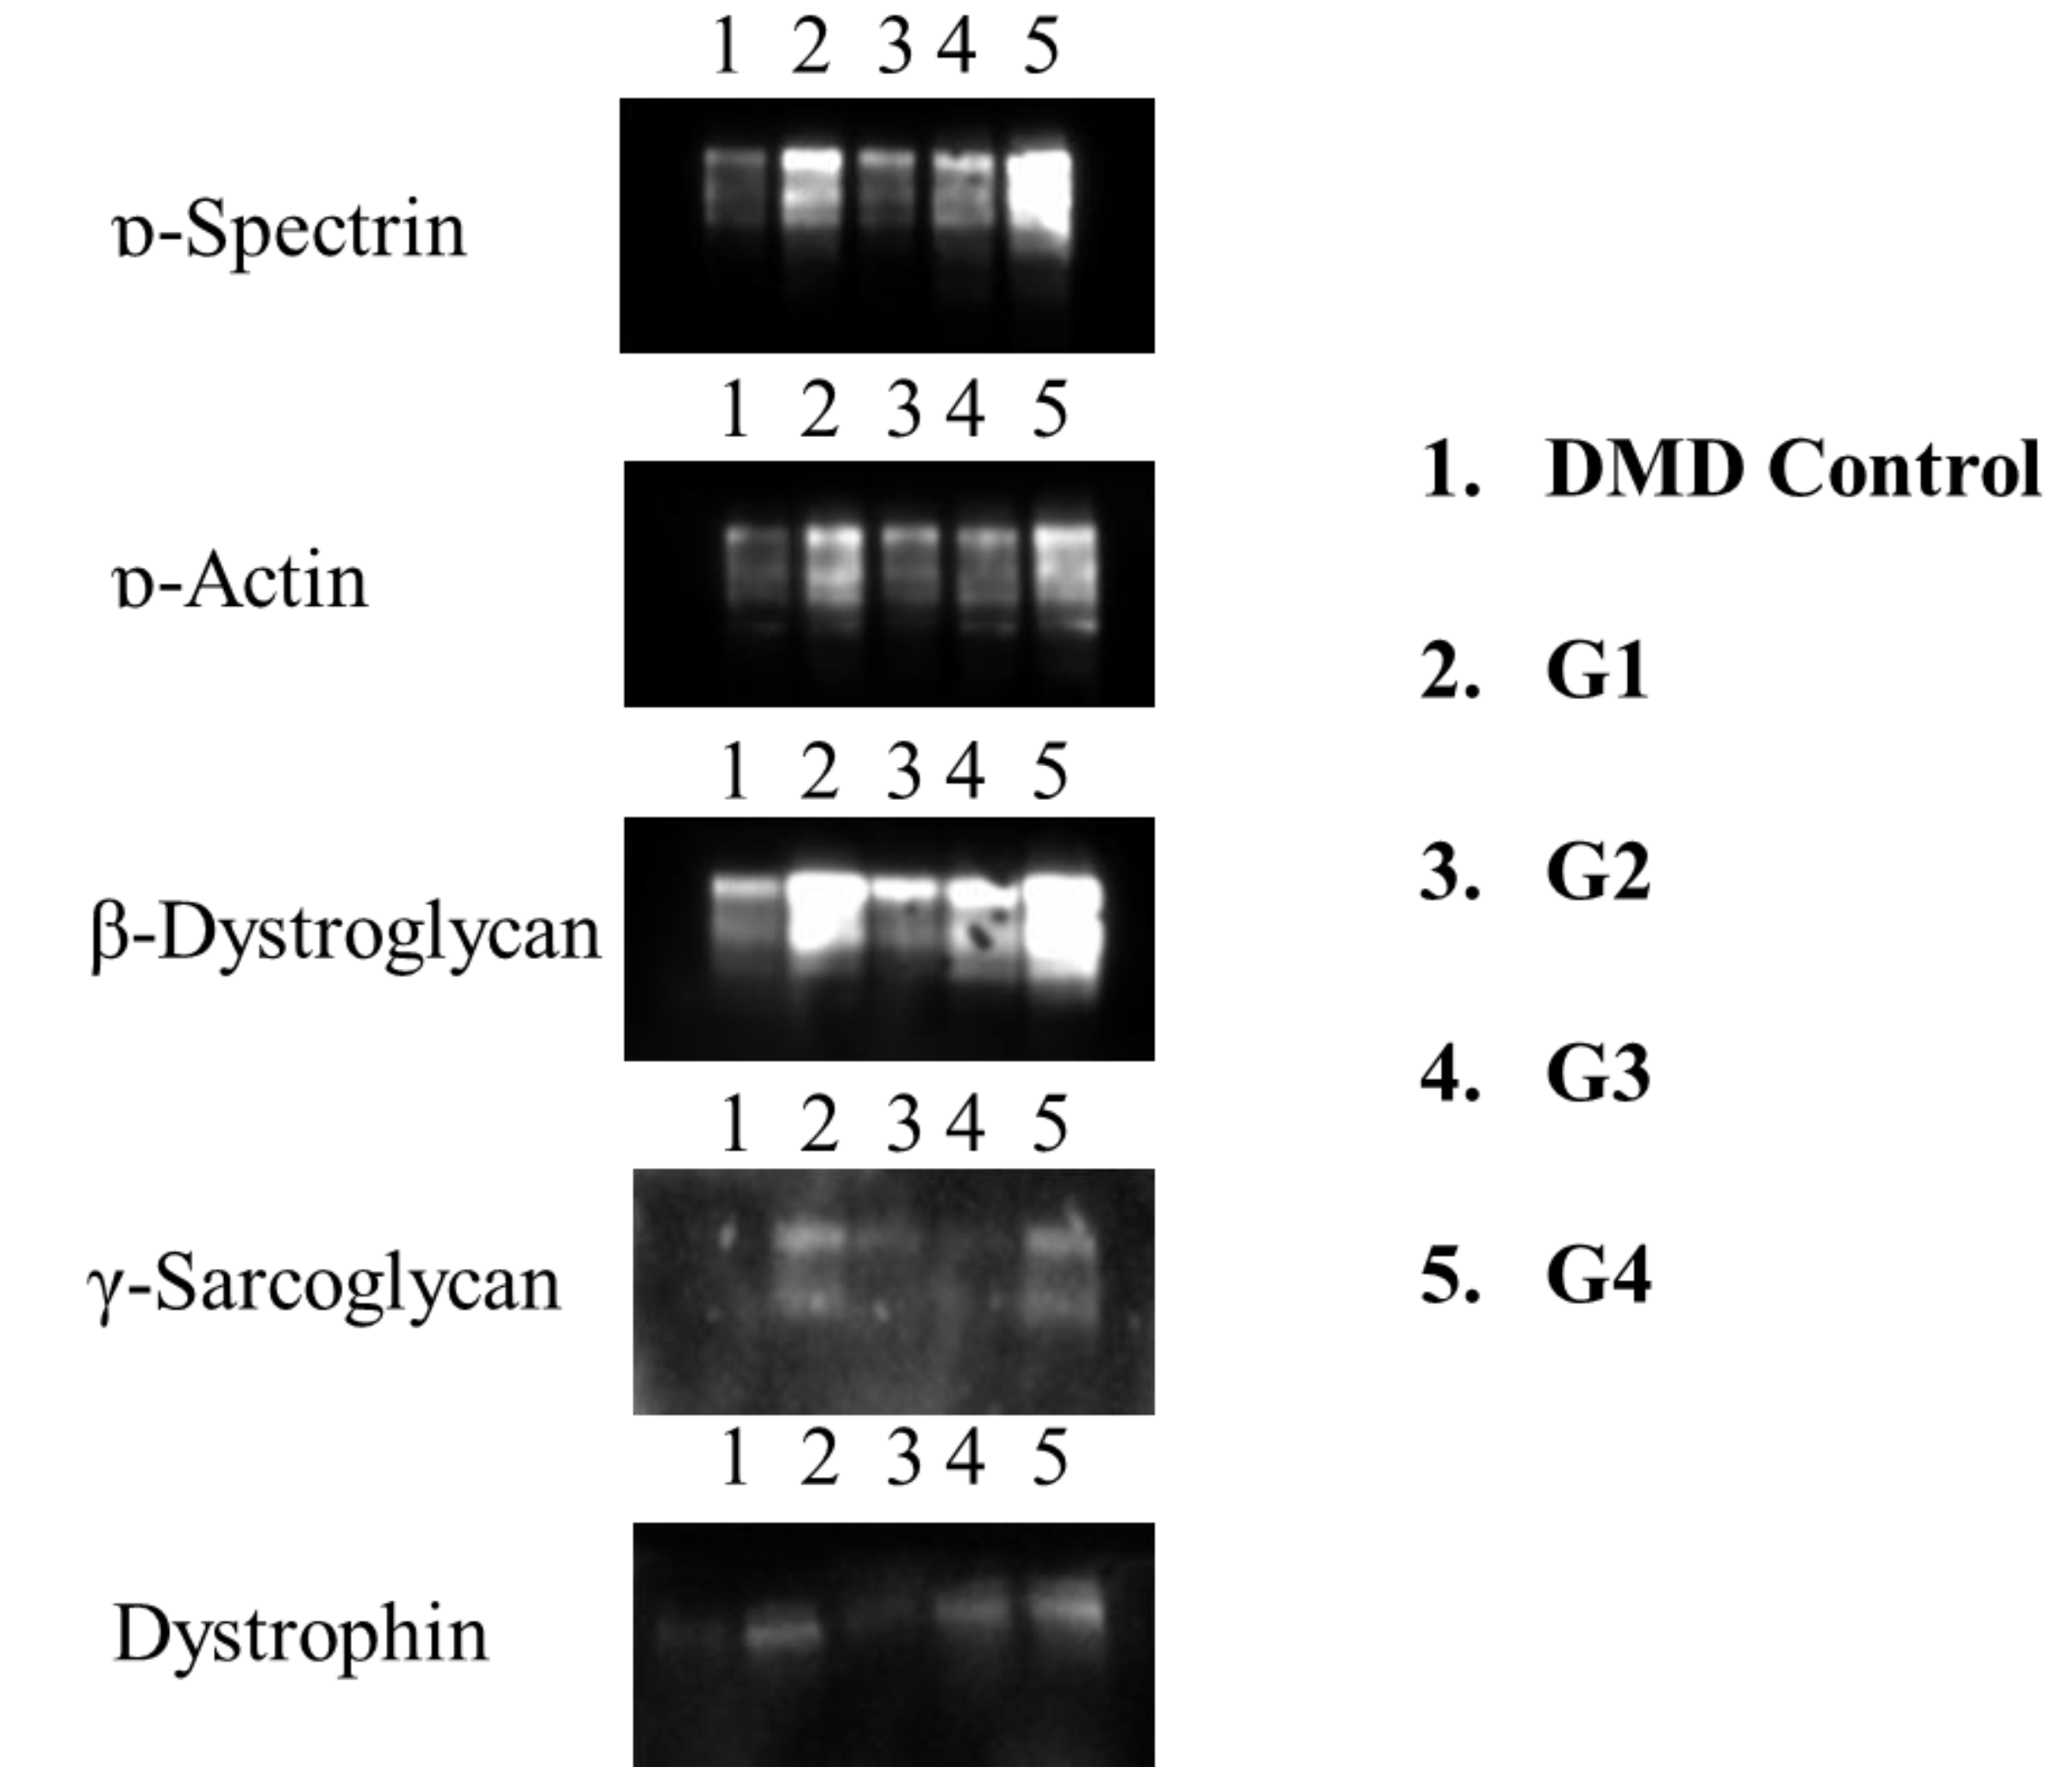
Figure 3.
DMD muscle cells obtained from primary cell culture and dystrophin, β-Dystroglycan, γ-sarcoglycan, and ɒ-Spectrin levels.
Figure 3.
DMD muscle cells obtained from primary cell culture and dystrophin, β-Dystroglycan, γ-sarcoglycan, and ɒ-Spectrin levels.
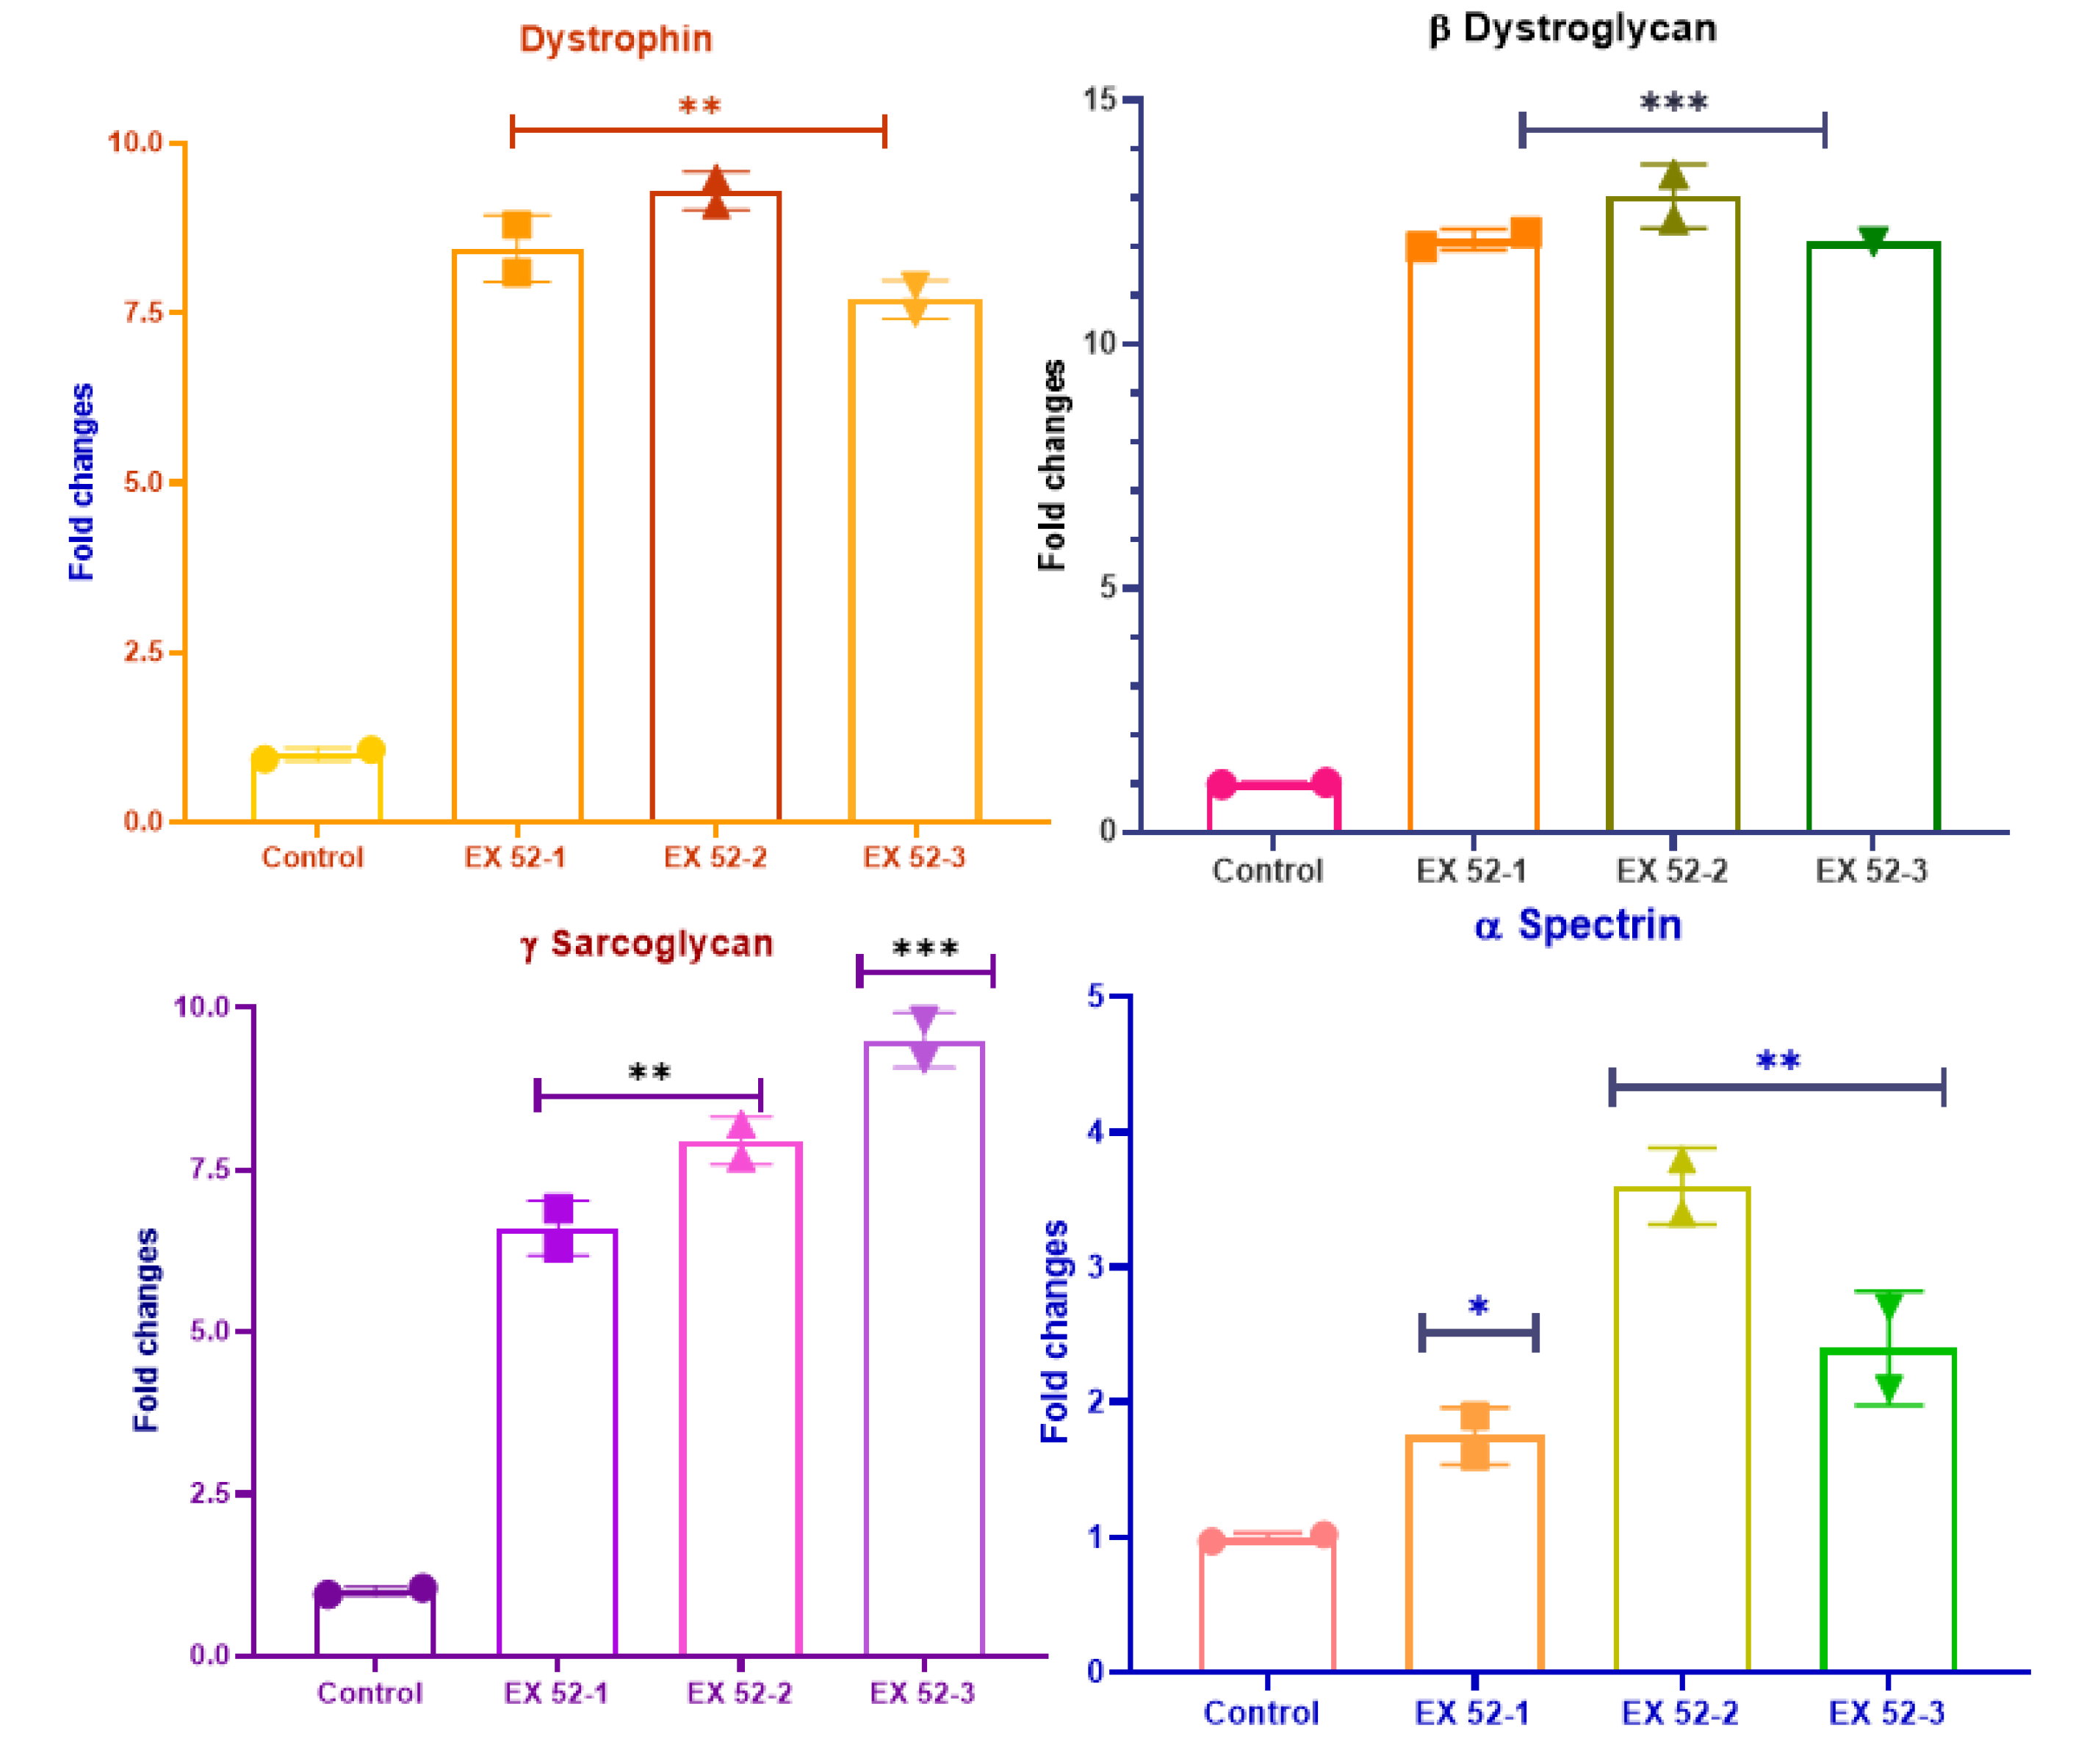
Figure 4.
Behavioral test results of mdx/d2 mouse groups (**P<0.01).
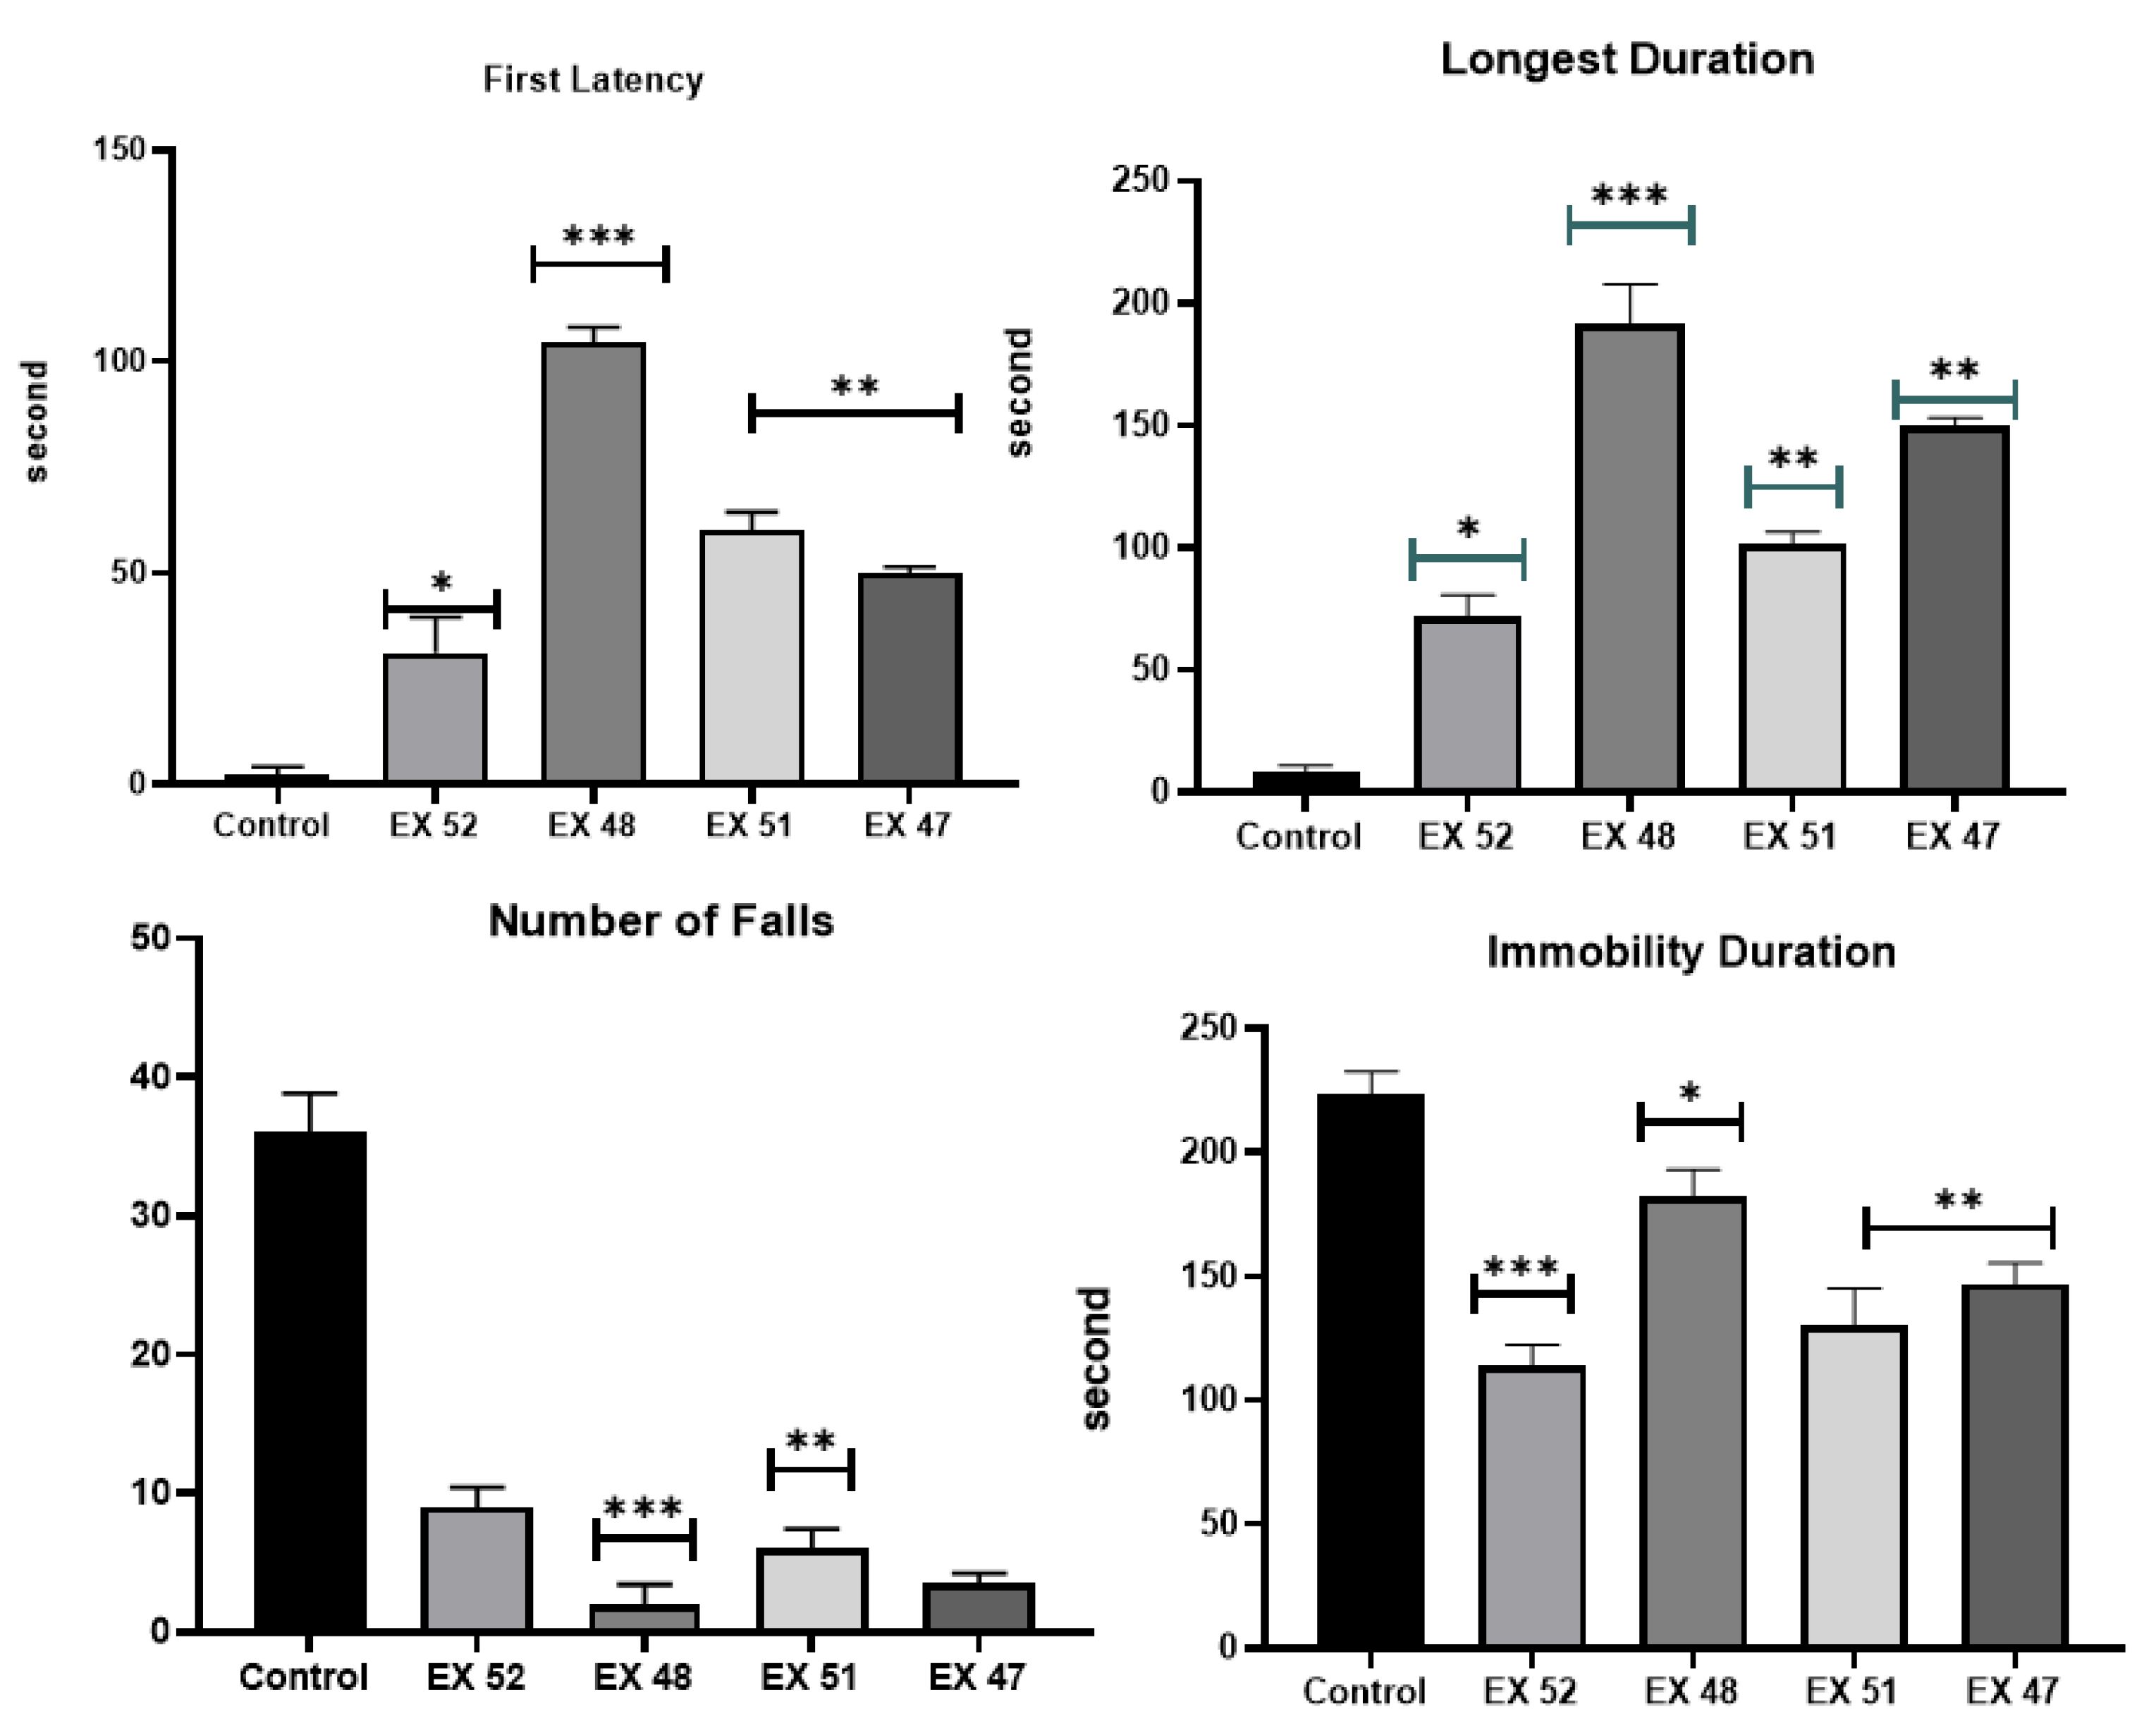
Figure 5.
TAC, TOS, NO, Klotho, and PPARγ levels in muscle tissues obtained from mdx/d2 mice.
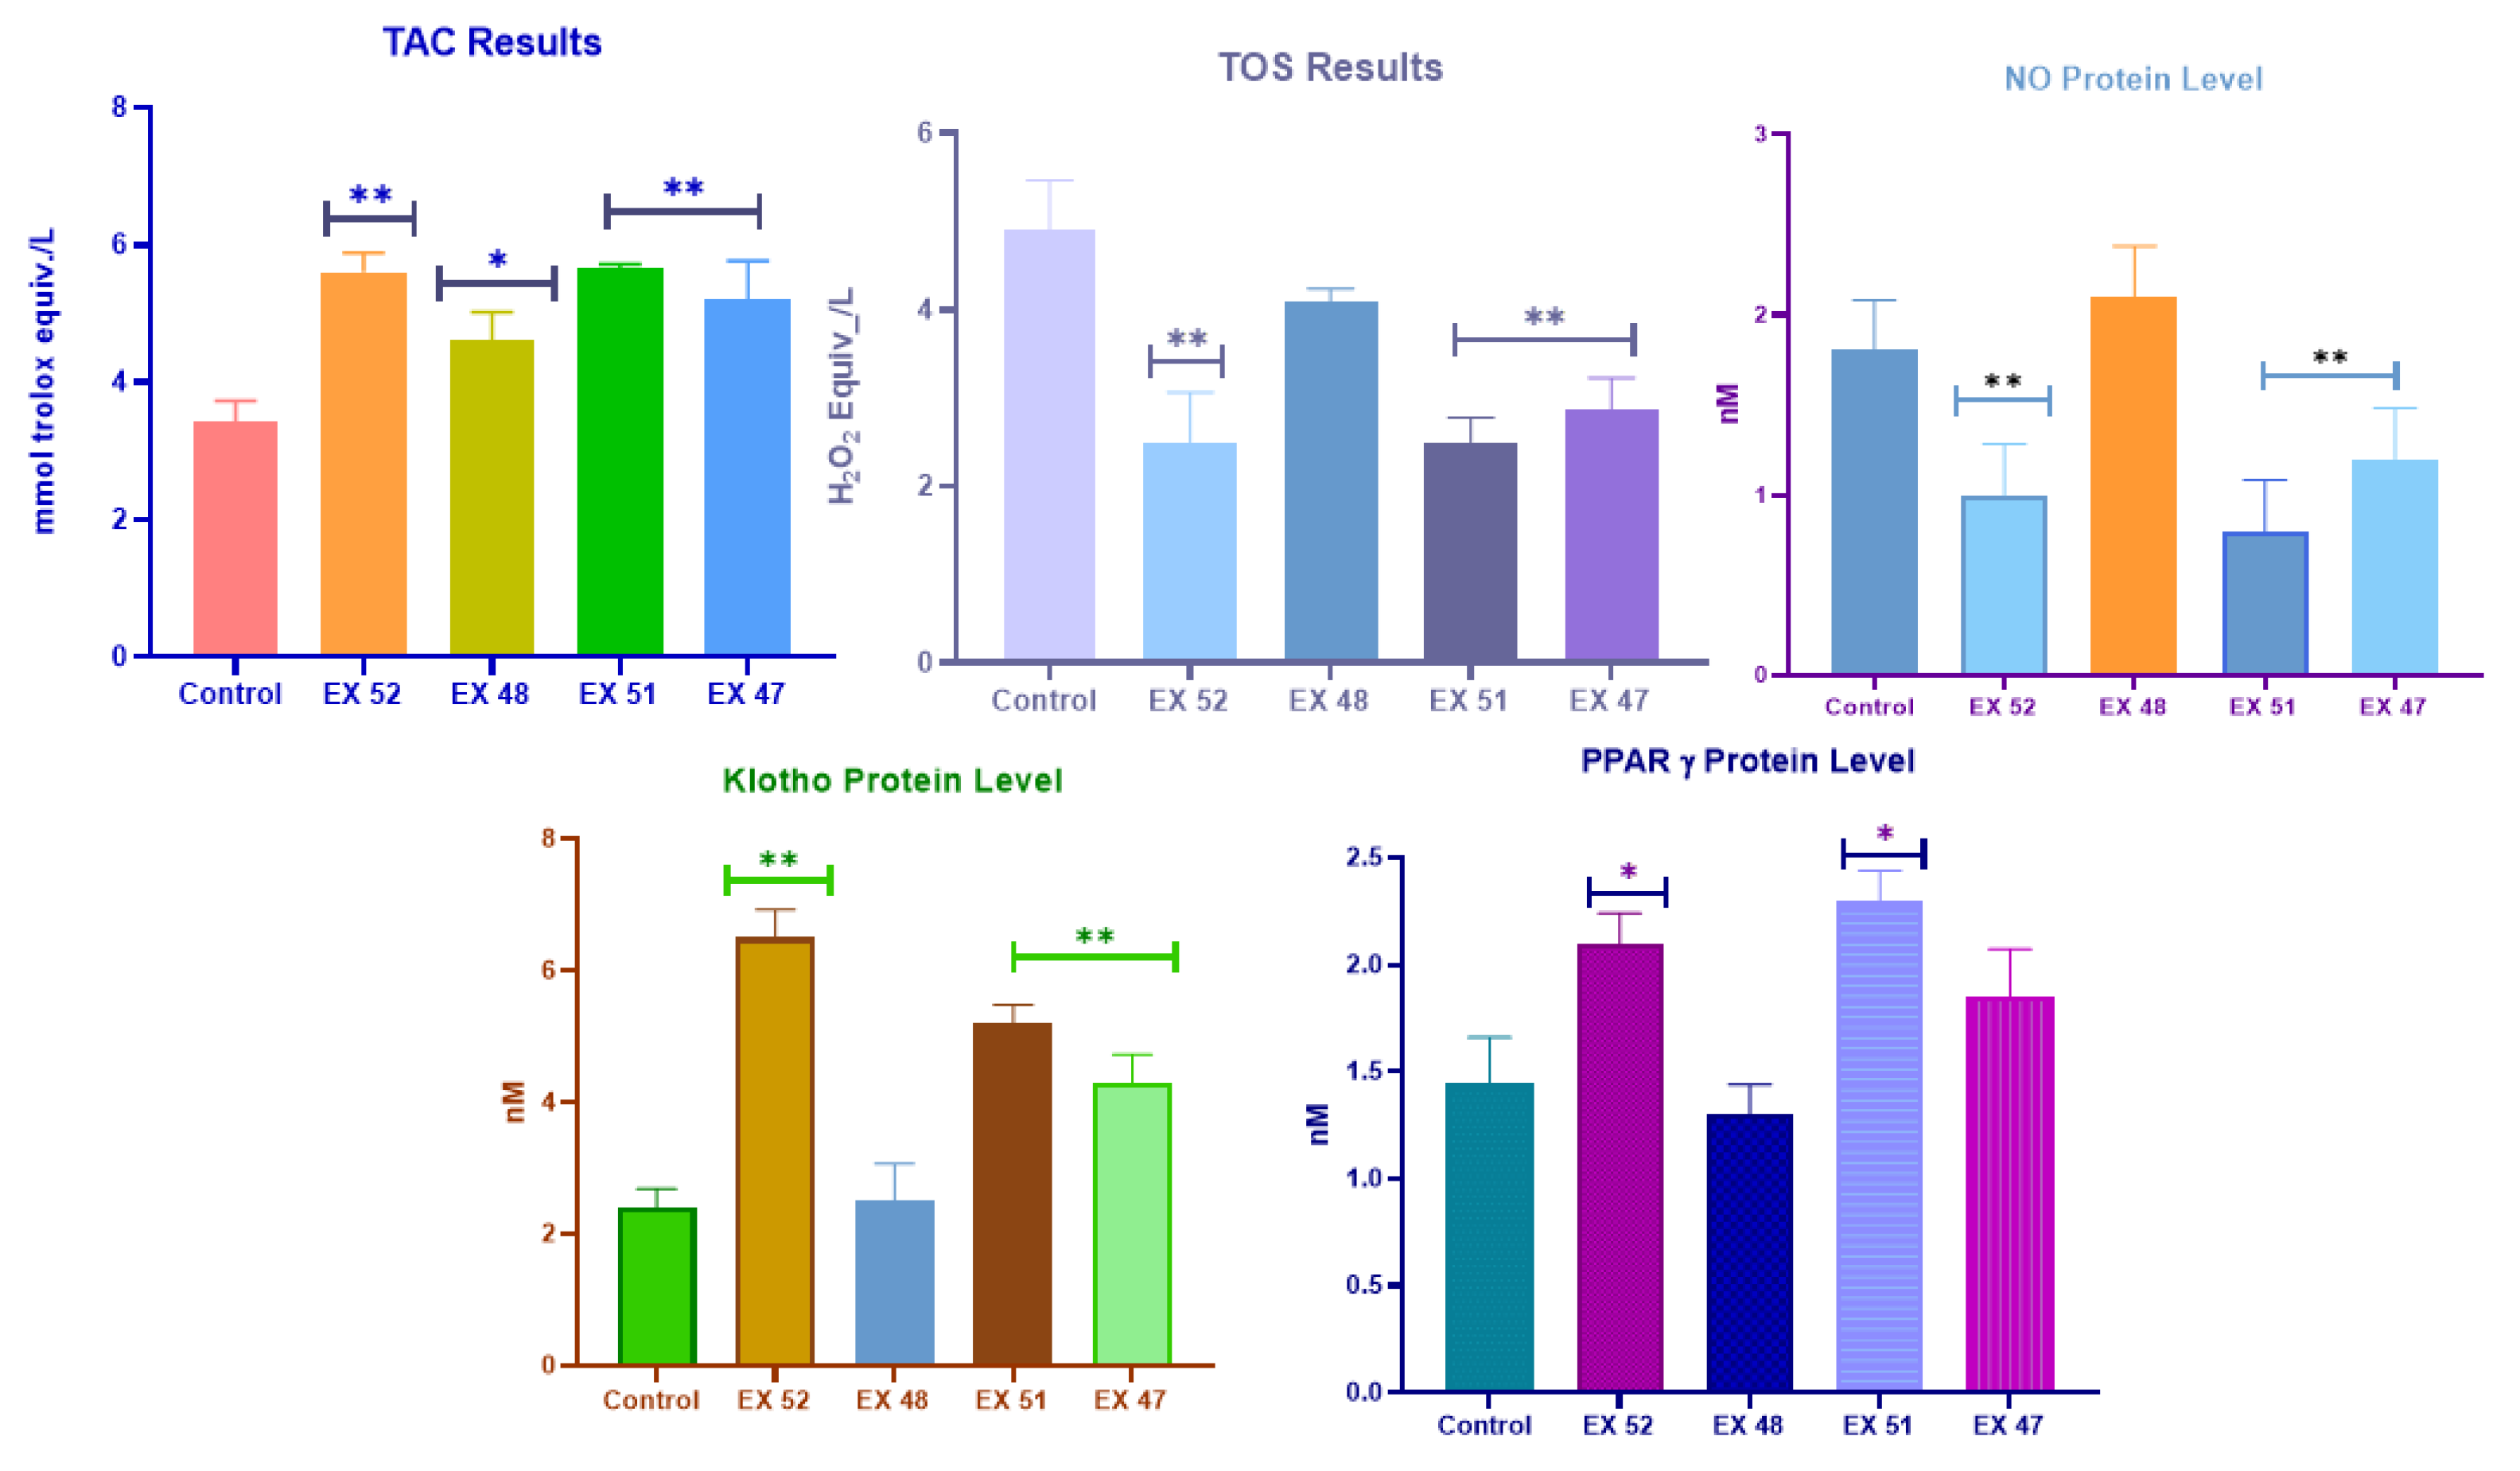
Figure 6.
Muscle tissue obtained from mdx/d2 mice and dystrophin, β-Dystroglycan, γ-sarcoglycan, ɒ-Spectrin, IL-1, IL-6, IL-8, and IL-10 expression levels.
Figure 6.
Muscle tissue obtained from mdx/d2 mice and dystrophin, β-Dystroglycan, γ-sarcoglycan, ɒ-Spectrin, IL-1, IL-6, IL-8, and IL-10 expression levels.
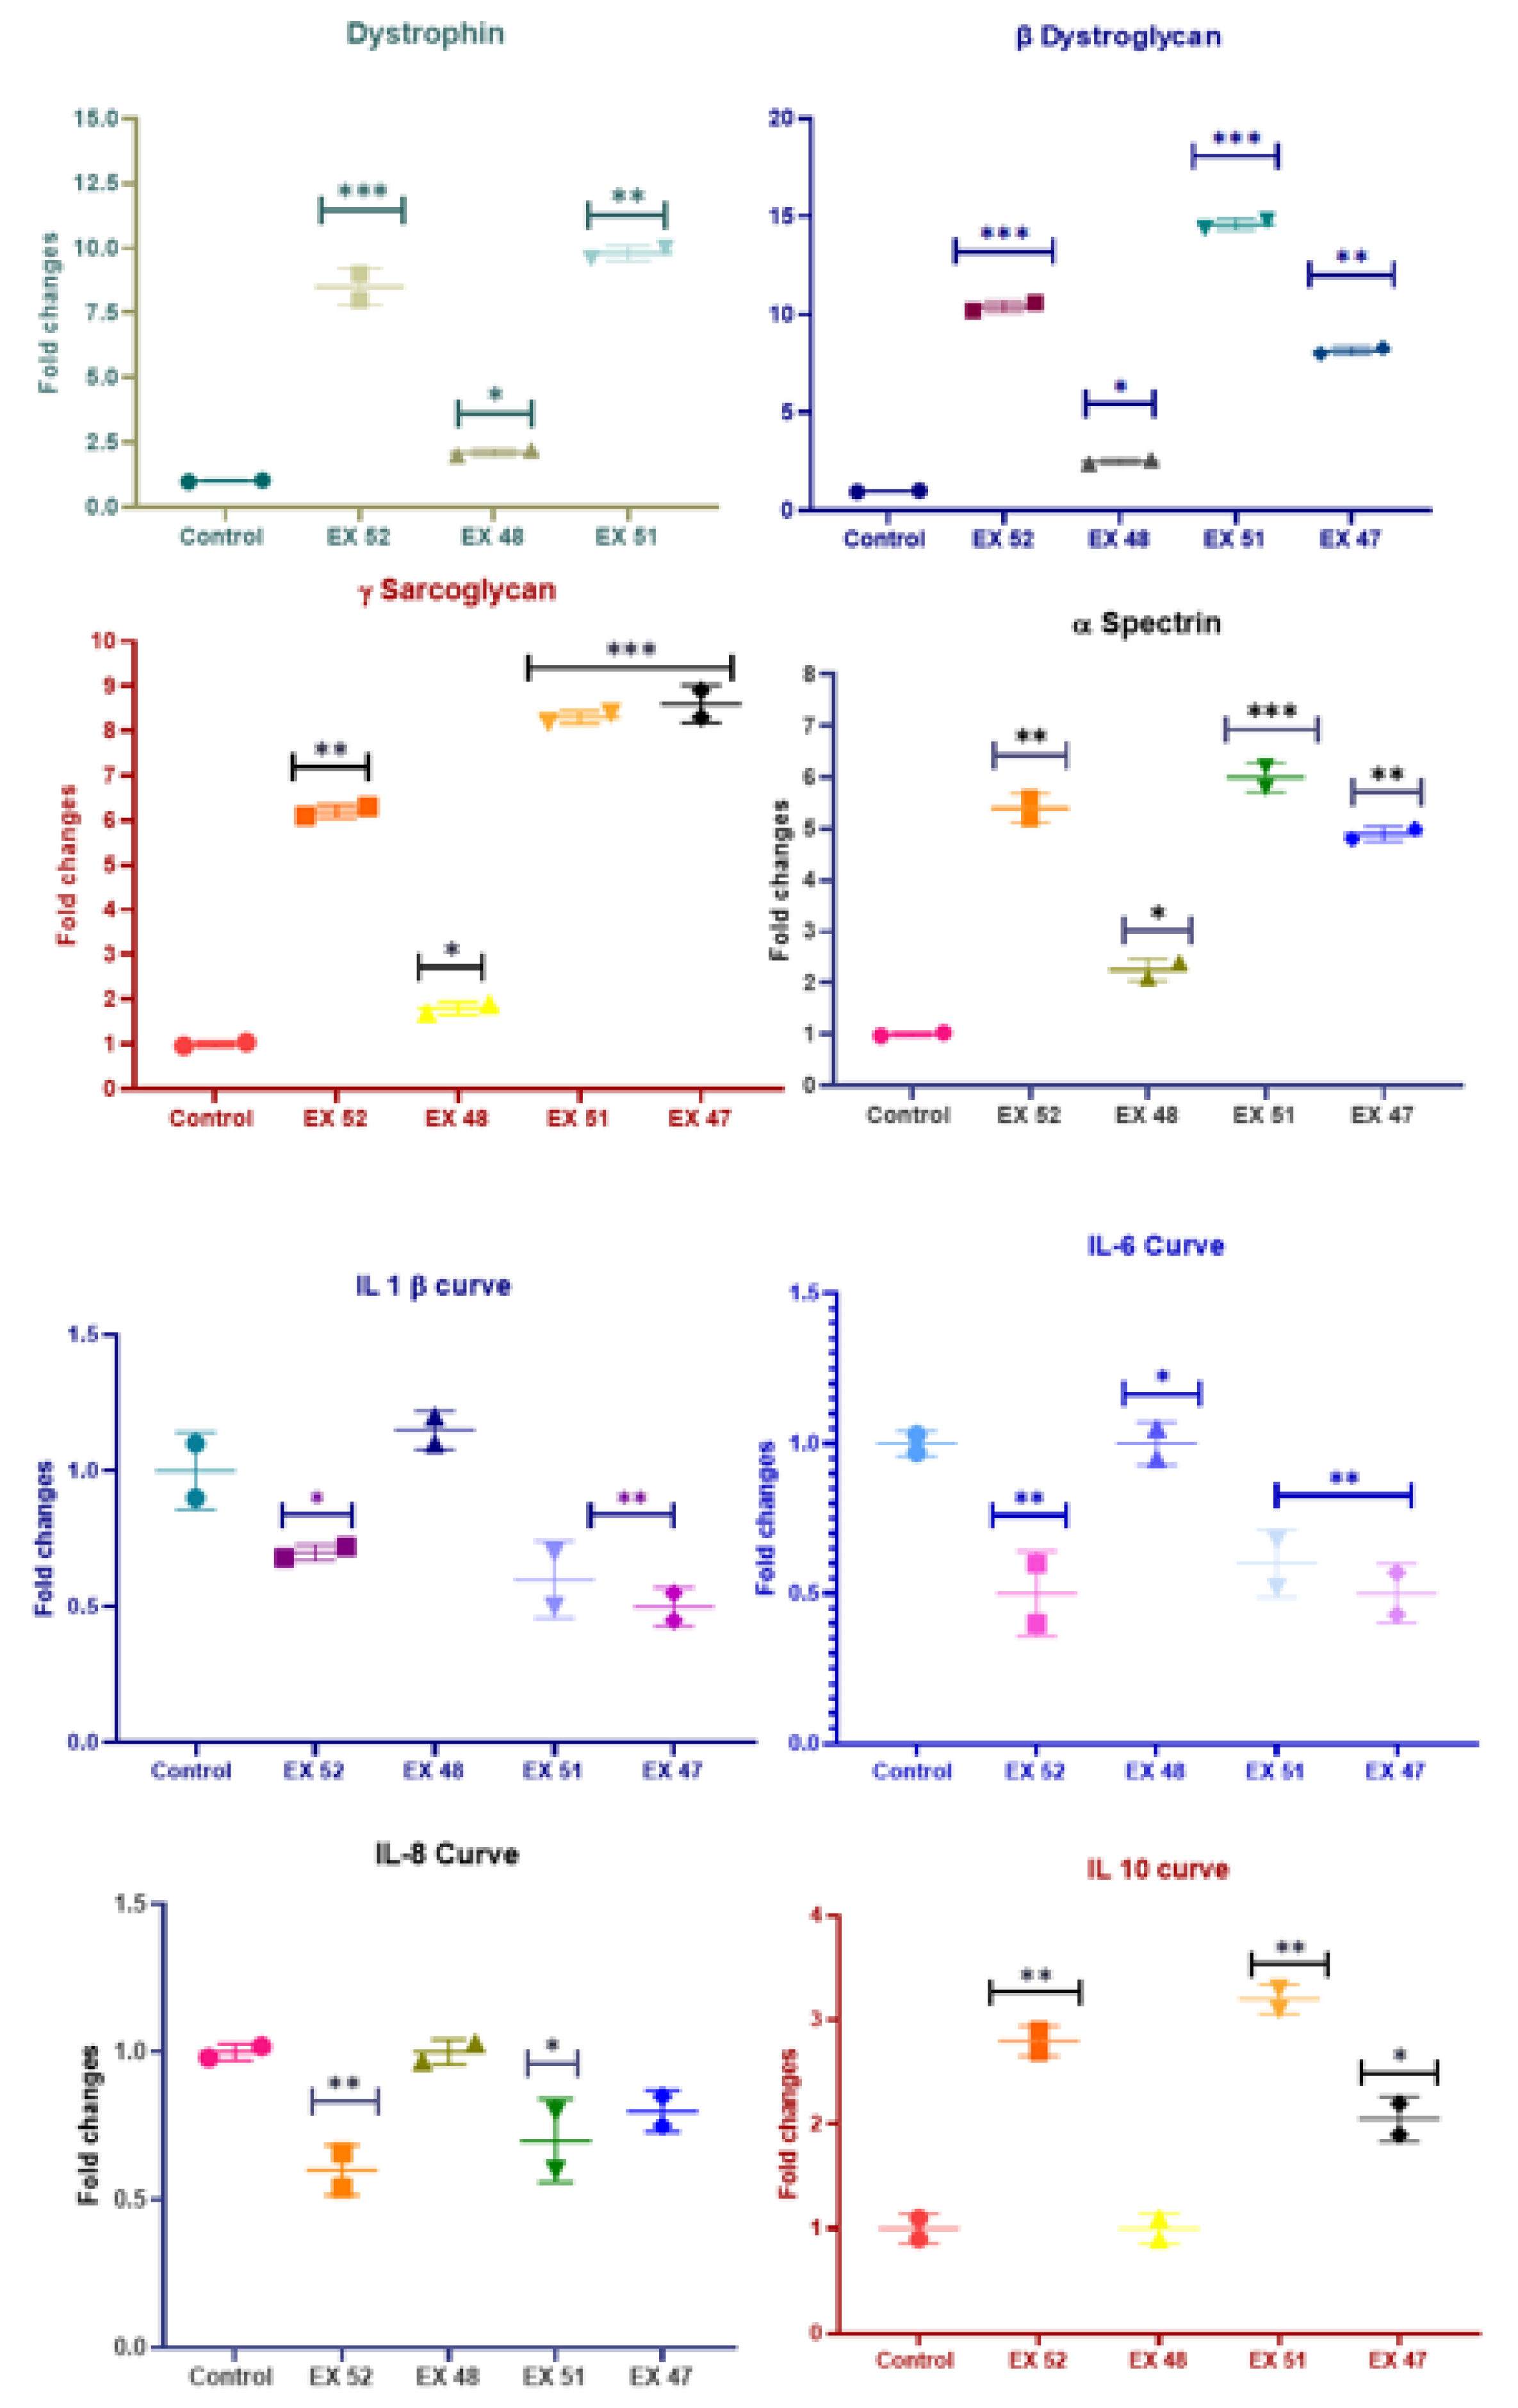
Figure 7.
IF images of cardiac muscle tissue obtained from mdx/d2 mice (Intracytoplasmic Spectrin α expressions (FITC) and α-actinin expressions (Texas Red) in myocytes, IF, Bar: 50µm).
Figure 7.
IF images of cardiac muscle tissue obtained from mdx/d2 mice (Intracytoplasmic Spectrin α expressions (FITC) and α-actinin expressions (Texas Red) in myocytes, IF, Bar: 50µm).
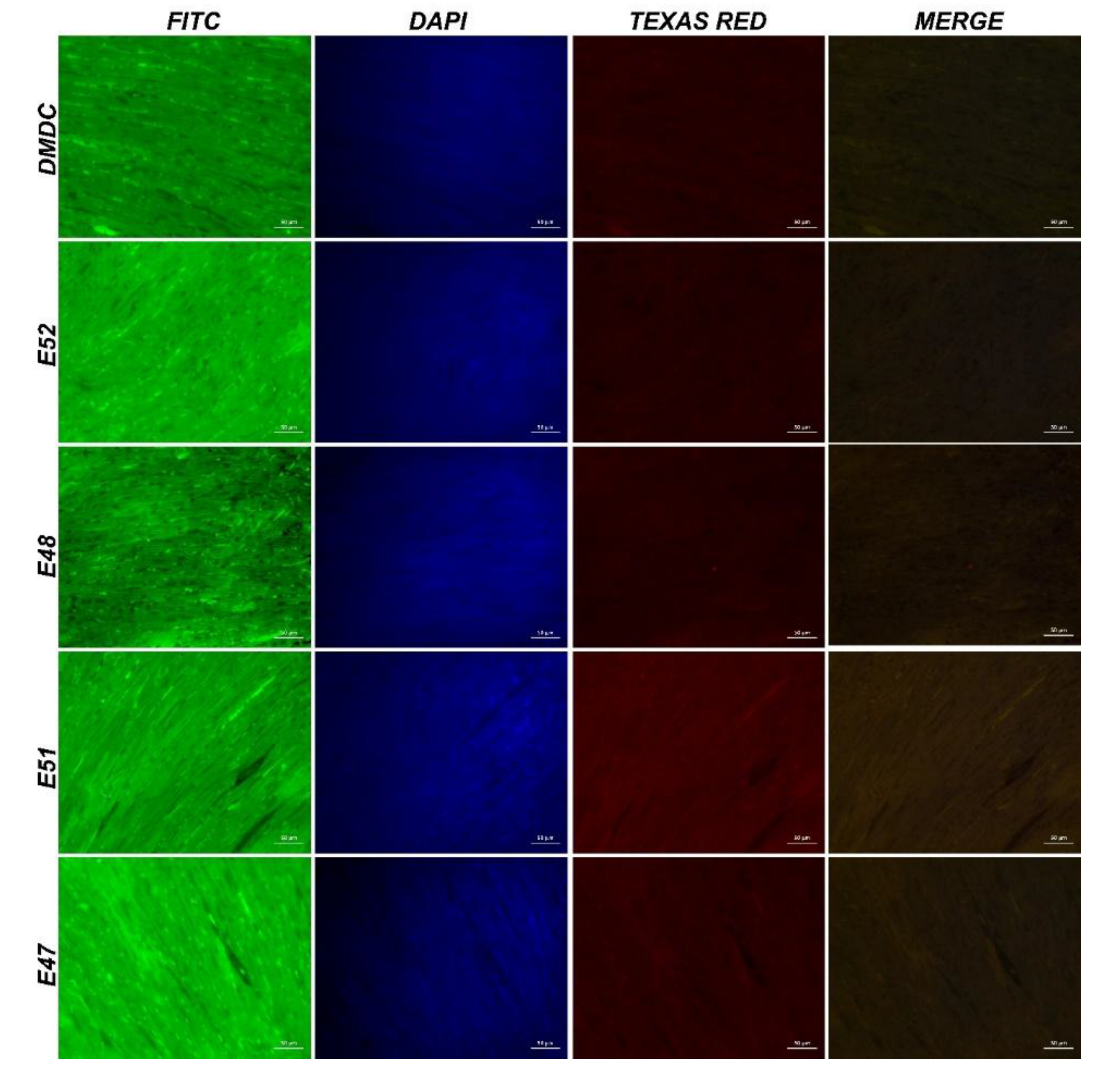
Figure 8.
IF images of muscle tissue obtained from mdx/d2 mice (Intracytoplasmic Spectrin α expressions (FITC) and α-actinin expressions (Texas Red) in myocytes, IF, Bar: 50µm).
Figure 8.
IF images of muscle tissue obtained from mdx/d2 mice (Intracytoplasmic Spectrin α expressions (FITC) and α-actinin expressions (Texas Red) in myocytes, IF, Bar: 50µm).
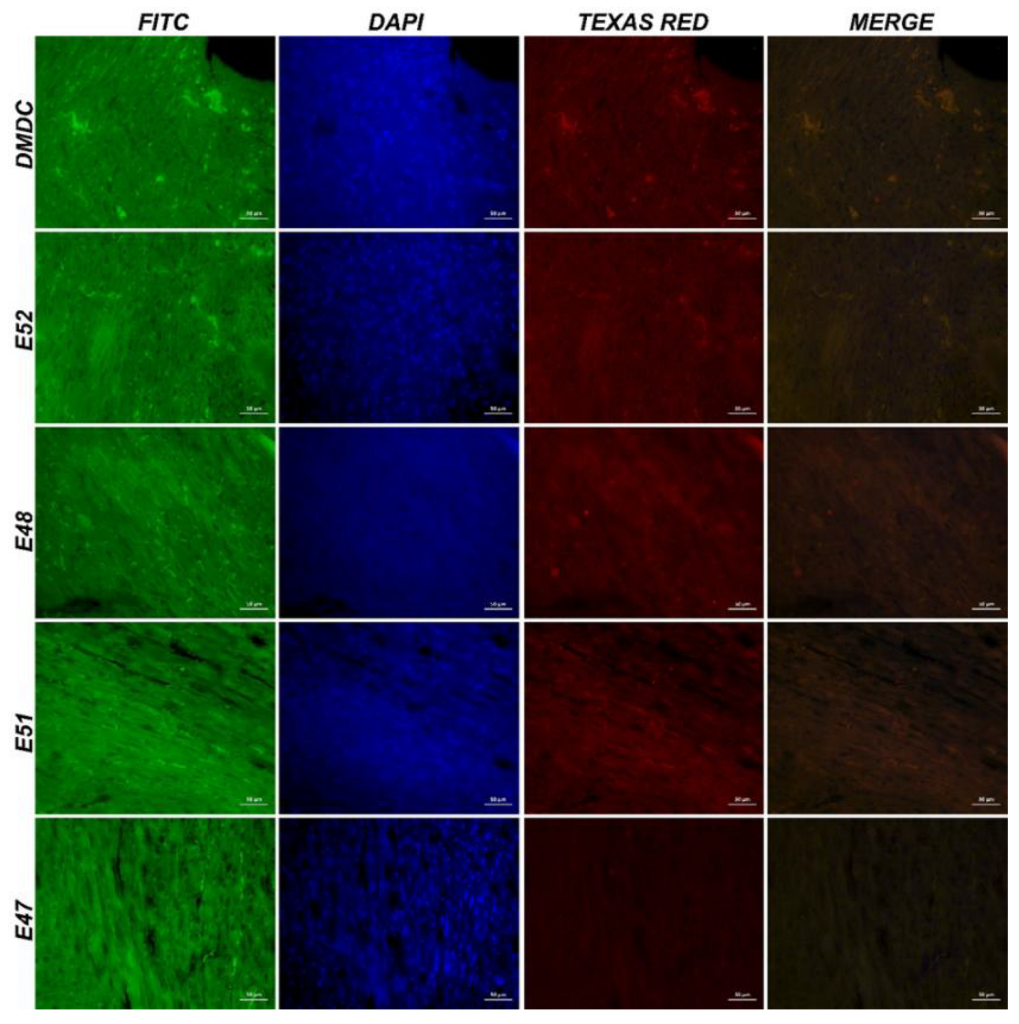
Figure 9.
IF images of cardiac muscle tissue obtained from mdx/d2 mice (Intracytoplasmic β-dystroglycan expressions (FITC) and γ-sarcoglycan expressions (Texas Red) in myocytes, IF, Bar: 50µm).
Figure 9.
IF images of cardiac muscle tissue obtained from mdx/d2 mice (Intracytoplasmic β-dystroglycan expressions (FITC) and γ-sarcoglycan expressions (Texas Red) in myocytes, IF, Bar: 50µm).
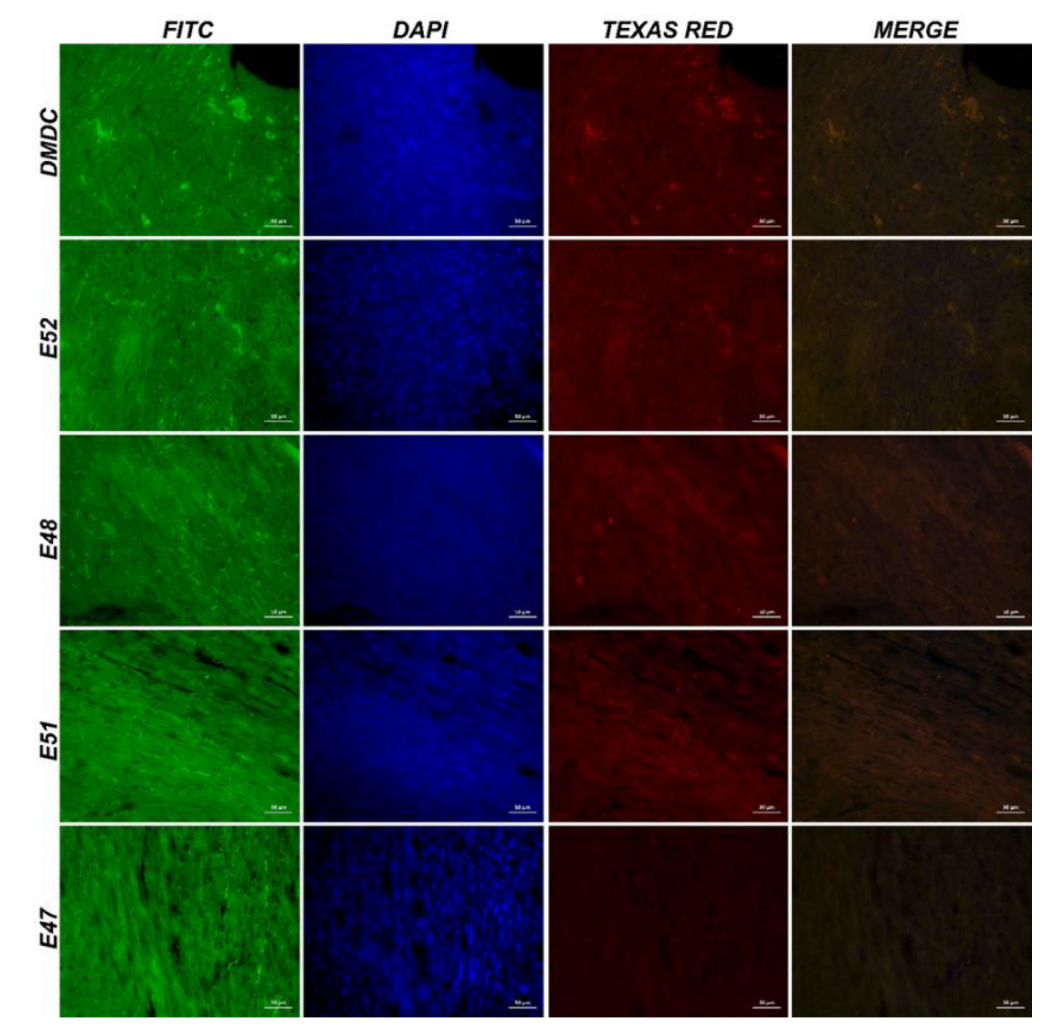
Figure 10.
IF image of muscle tissue obtained from mdx/d2 mice (Intracytoplasmic β-dystroglycan expressions (FITC) and γ-sarcoglycan expressions (Texas Red) in myocytes, IF, Bar: 50µm).
Figure 10.
IF image of muscle tissue obtained from mdx/d2 mice (Intracytoplasmic β-dystroglycan expressions (FITC) and γ-sarcoglycan expressions (Texas Red) in myocytes, IF, Bar: 50µm).
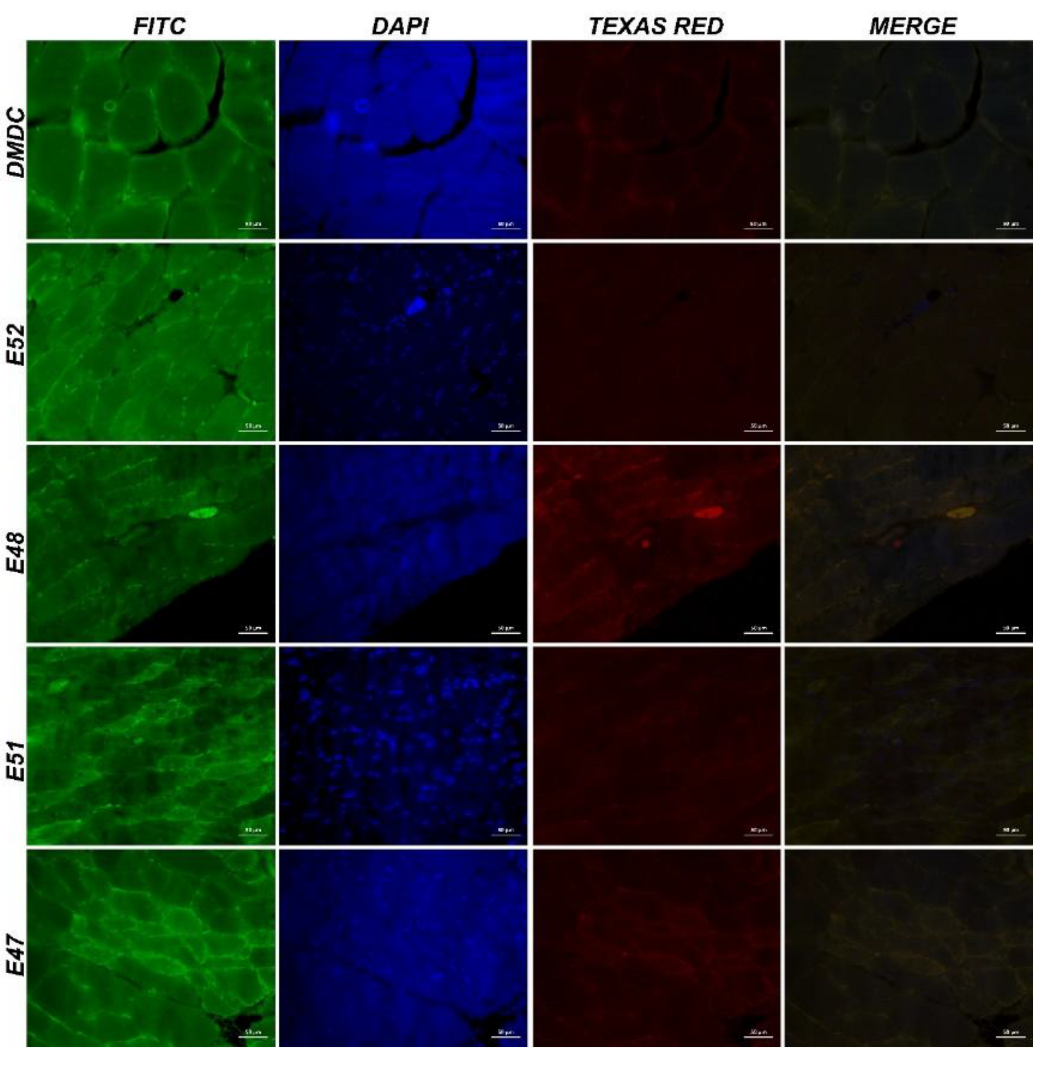
Figure 11.
IHC images of cardiac muscle tissue from mdx/d2 mice. Degeneration and necrosis in DMD Control (A), E52 (B), E48 (C), E51 (D), E47 (E) myocytes, inflammation in interstitial spaces, H&E, Bar: 50µm.
Figure 11.
IHC images of cardiac muscle tissue from mdx/d2 mice. Degeneration and necrosis in DMD Control (A), E52 (B), E48 (C), E51 (D), E47 (E) myocytes, inflammation in interstitial spaces, H&E, Bar: 50µm.
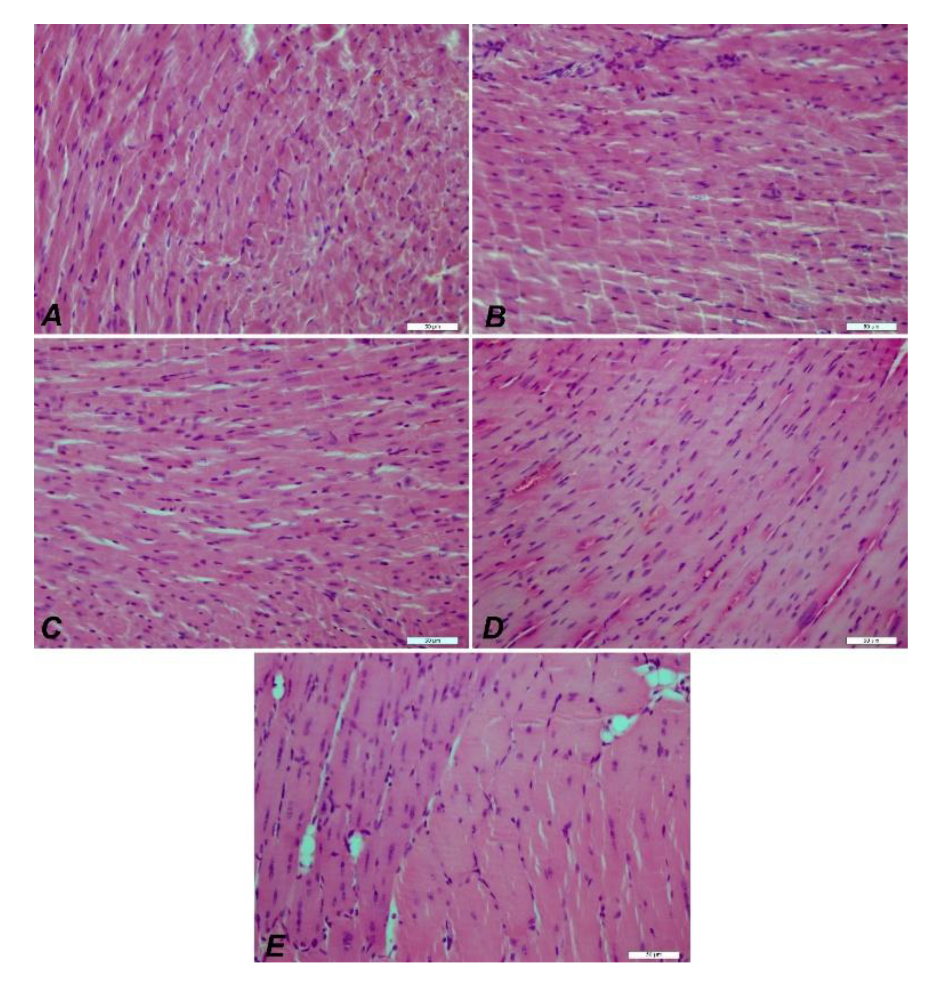
Figure 12.
IHC images of muscle tissue from mdx/d2 mice. DMD Control (A), E52 (B), E48 (C), E51 (D), E47 (E) myocyte degeneration and necrosis, inflammation in interstitial spaces, H&E, Bar: 50µm.
Figure 12.
IHC images of muscle tissue from mdx/d2 mice. DMD Control (A), E52 (B), E48 (C), E51 (D), E47 (E) myocyte degeneration and necrosis, inflammation in interstitial spaces, H&E, Bar: 50µm.
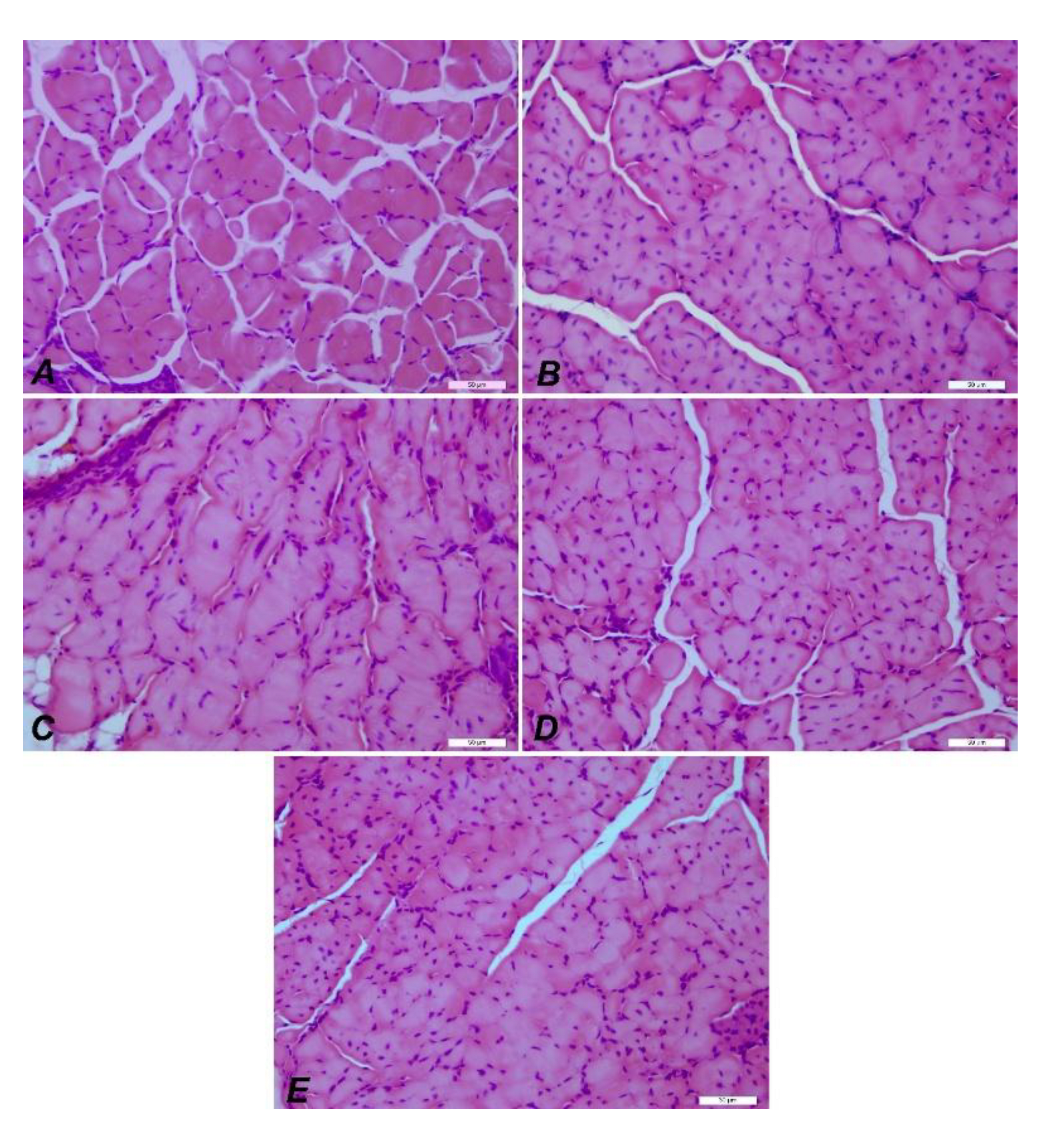
Figure 13.
Statistical analysis of histopathological findings and immunofluorescence staining results seen in muscle tissue. Myocyte degeneration (****P<0.0001), myocyte necrosis (****P<0.0001), inflammation (****P<0.0001), Spectrin α expression levels (****P<0.0001), α-actinin expression levels (****P<0.0001), and β-dystroglycan expression levels (****P<0.0001), γ-sarcoglycan expression levels (****P<0.0001).
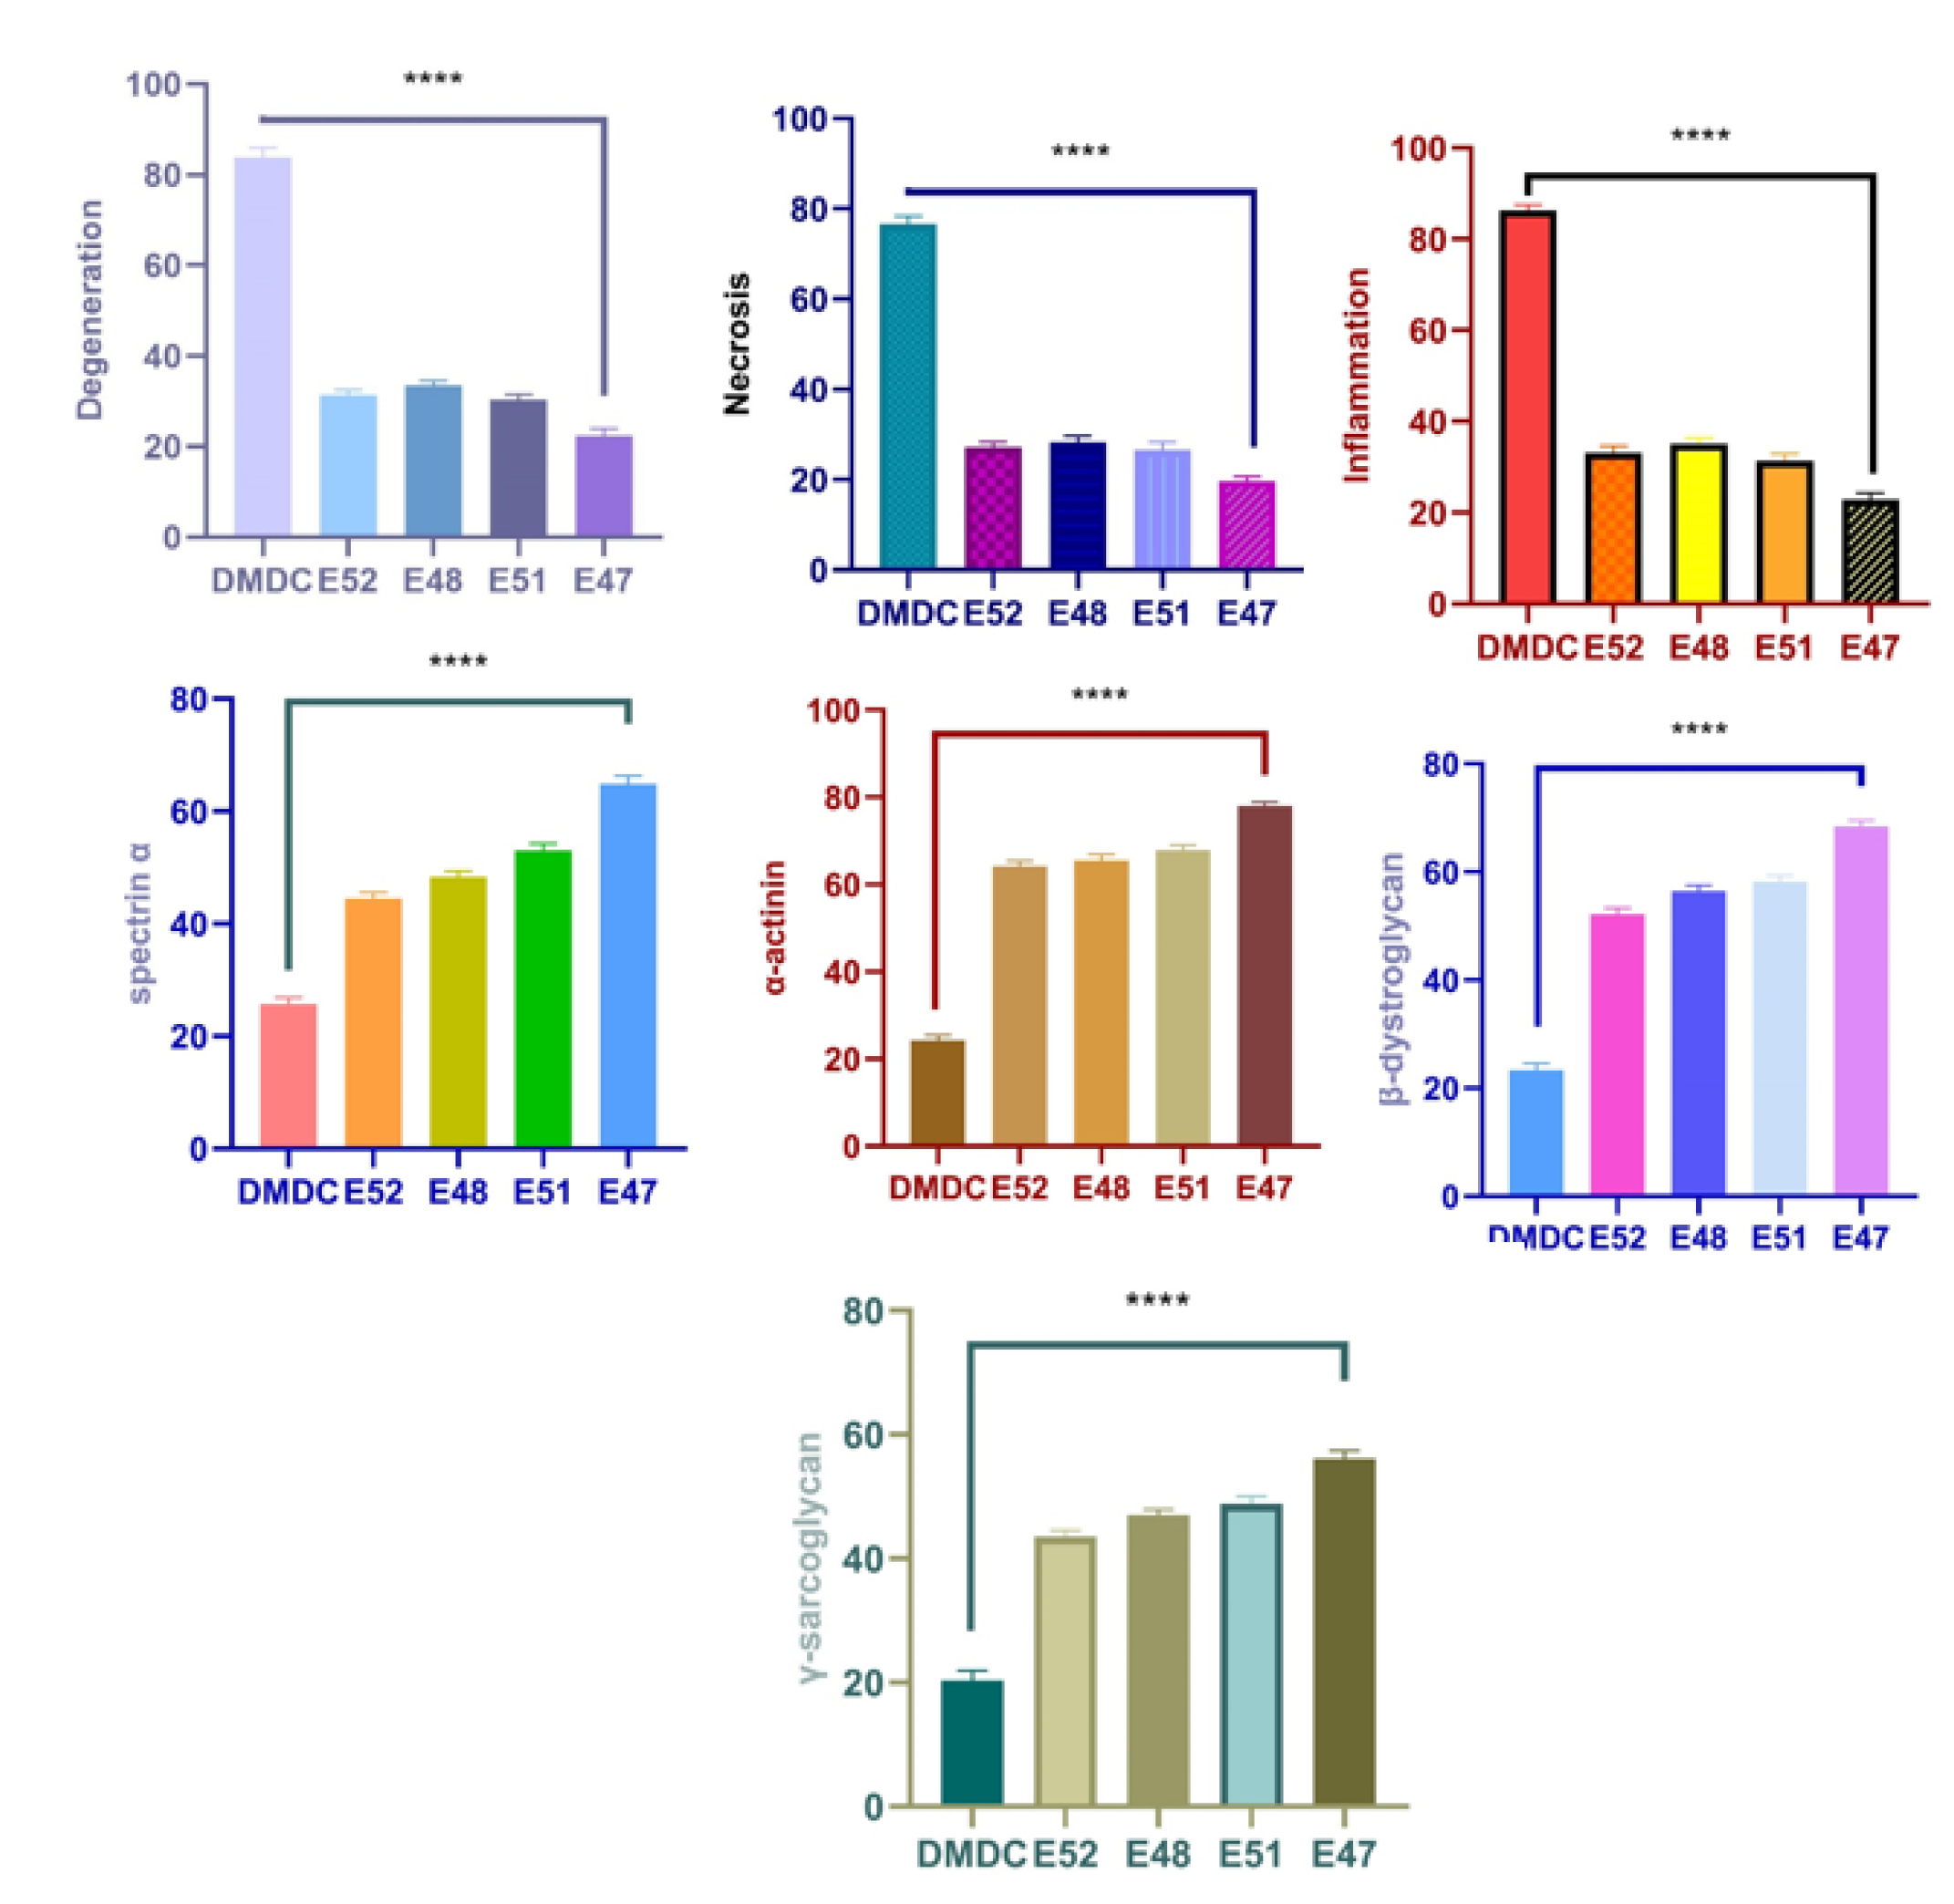
Figure 14.
Hematoxylin and eosin staining of the groups. Groups A: Control, B: EX52, C: EX48, D: EX51, and E: EX47. Although the pathological findings in the control group were observed in all groups, they decreased from EX52 to EX47. 50µm bars in all.
Figure 14.
Hematoxylin and eosin staining of the groups. Groups A: Control, B: EX52, C: EX48, D: EX51, and E: EX47. Although the pathological findings in the control group were observed in all groups, they decreased from EX52 to EX47. 50µm bars in all.
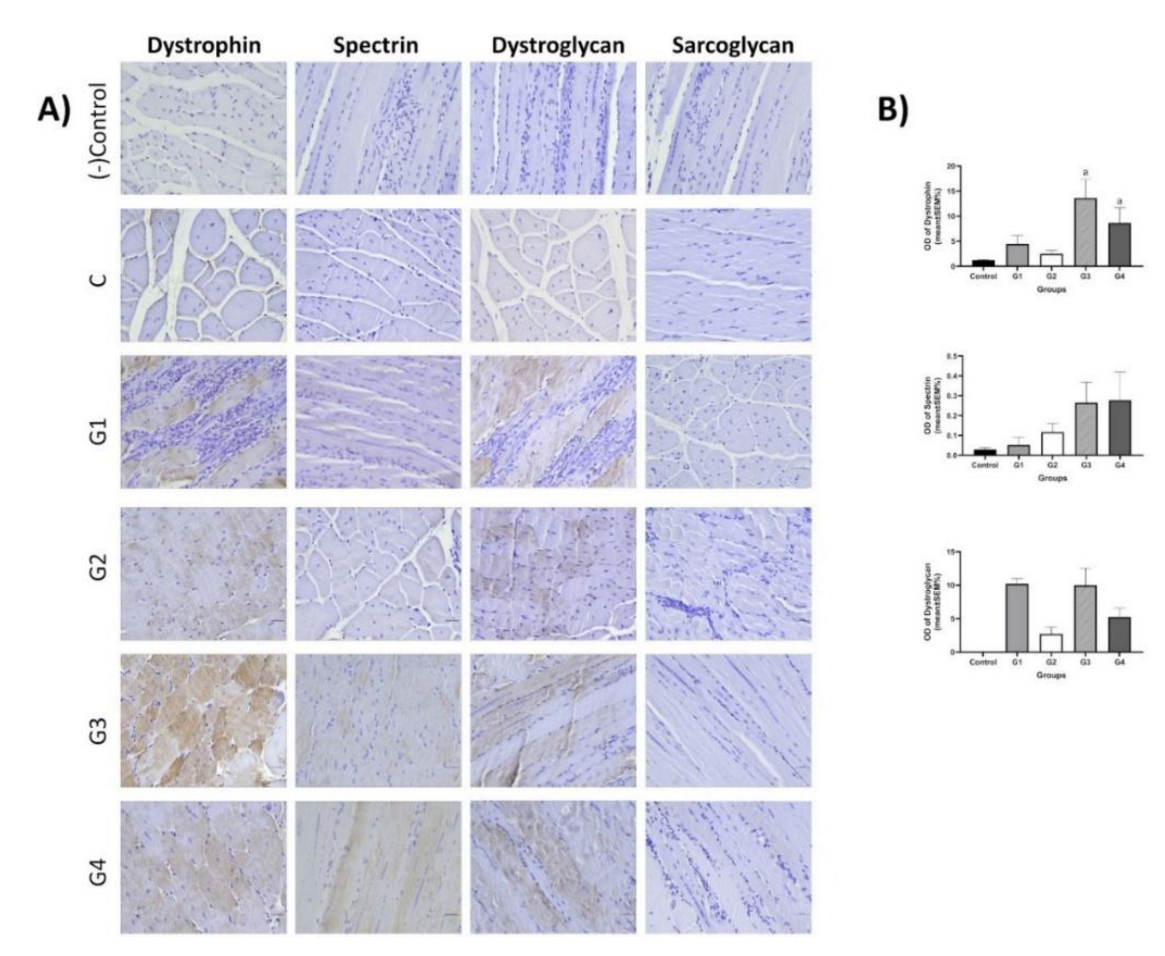
Figure 15.
IHC staining of brain, kidney, and intestinal tissues of dmx/d2 mice (Control, H&E, Bar: 50µm). This section may be divided by subheadings. It should provide a concise and precise description of the experimental results, their interpretation, and the experimental conclusions that can be drawn.
Disclaimer/Publisher’s Note: The statements, opinions and data contained in all publications are solely those of the individual author(s) and contributor(s) and not of MDPI and/or the editor(s). MDPI and/or the editor(s) disclaim responsibility for any injury to people or property resulting from any ideas, methods, instructions or products referred to in the content. |
© 2025 by the authors. Licensee MDPI, Basel, Switzerland. This article is an open access article distributed under the terms and conditions of the Creative Commons Attribution (CC BY) license (http://creativecommons.org/licenses/by/4.0/).
Copyright: This open access article is published under a Creative Commons CC BY 4.0 license, which permit the free download, distribution, and reuse, provided that the author and preprint are cited in any reuse.


