Submitted:
30 October 2025
Posted:
31 October 2025
You are already at the latest version
Abstract
Background. To address hepatotropic body distribution and toxicity, transfection systems based on protein architecture have been proposed. Attenuated anthrax toxin (aATx) has provided the backbone for a first in-class transfection system that, in the wild, uses intraluminal vesicles (ILVs) as an intermediary compartment during the translocation of large molecules into the cytosol. Small interfering (si)RNA molecules non-covalently attached to a carrier (LFn-PKR), would not be predicted to be an aATx translocase substrate. Previously siRNA has been shown to be delivered to the cytosol using this system. Methods. Here, the localisation of 32P-labelled siRNA delivered using aATx, was quantified directly and related to siRNA activity. In addition, inhibition of ILV formation by hypertonic sucrose or wheatgerm agglutinin (WGA) was shown to inhibit the aATx mediated cytosolic translocation of siRNA. Results. To this end MCF-7 cells were used to establish siRNA intracellular distribution in relation to pharmacological activity by targeting STAT3 gene expression. After lipofectamine-mediated transfection using 100nM 32P-labelled siRNA, 45±3.2% (±SD; n=3) of the cell associated siRNA was found in the cytosol. After the transfection of 100nM 32P-labelled siRNA using aATx, 77±2.5% (±SD; n=3) of the cell associated siRNA was found in the cytosol and resulted in a reduction in STAT3 expression of 64.04±14.17% (±SD; n=3) relative to an untreated control by Western analysis. Further, 25μg/mL of WGA inhibited 75.23±0.06% (±SD; n=3) of the knockdown attributed to a non-WGA treated control. Relative to the control, treatment with 200mM sucrose resulted in a reduction of 74.58±7.76% (±SD; n=3) of target gene knockdown. Conclusions. These data indicated that the insertion of the PA pore into endosomal membrane was not weakening the endosomal limiting membrane leading to vesicular bursting during transfection.
Keywords:
anthrax toxin
; drug delivery
; siRNA
; endocytosis
; intraluminal vesicle
1. Introduction
The widespread use of transfection systems mediating RNA delivery for vaccination against SARS-CoV-2 underscore the utility of RNA based medicines [1]. However, the success of these systems has also highlighted the limitations associated with RNA drug delivery technologies. Whilst drugs mediating the delivery of synthetic mRNA to striated muscle and small interfering (si)RNA to the liver have met with regulatory approval, delivery to other tissues remains challenging [2,3]. As these limitations are driven by physiochemistry, new systems have been explored. One such system utilises architecture that has evolved to mediate cytosolic drug delivery and is based upon attenuated anthrax toxin (aATx) [4,5,6,7,8]. Questions remain about the mechanisms that this system uses to deliver cargo across the cell membrane. Wild-type ATx has been reported to utilise intraluminal vesicles (ILVs) formed within endosomes to facilitate the destruction of the phosphorylated (abluminal) portion of activated mitogenic receptors [9] ILVs also serve as an intermediary compartment prior to the delivery of approximately 80% of internalised lethal factor (LF), internalised as anthrax lethal toxin to the cytosol [10]. Translocation into the lumen of the ILV, within the endosome requires protective antigen (PA) protein which, after hydrolytic activation and oligomerisation, acts as a cation selective translocase that requires the “unfolding” of translocase substrates [11]. Substrate unfolding, also known as a molten globular transition, has been reported to be critical for the translocase substrate to move across the phenylalanine clamp at the base of the PA vestibule, which has an internal diameter of ~6Å [11]. We previously reported the use of an aATx system to deliver specific proteins, ASOs and siRNA to the cytosol of mammalian cells, with high efficiency and low toxicity [4]. For siRNA and ASOs delivery, substrate unfolding would dislocate anionic siRNA or ASOs from the LF derived shuttle protein. Consequently, our previous work indicated that under certain conditions, it was possible that the PA pore may radially expand, as its lattice-like structure might suggest, instead of the cargo unfolding completely. Herein, we characterise this system further and identify ILVs as transfection intermediaries. The shuttle proteins used herein consisted of the non-toxic N-terminal region (amino acids 25-255) of ATx Lethal Factor (LF) (referred to as LFn), fused-in-frame with sequence coding for the RNA binding domain of protein kinase R (LFn-PKR) [4]. As the diameter of the phenylalanine clamp would, if static, prohibit the passage of anionic siRNA and the unfolding of the LFn-PKR would dislocate it from non-covalently attached cargo, an investigation into the trafficking mechanisms responsible for transfection using the aATx system [4] was undertaken. To this end, it was asked if siRNA could be measured in the cytosol (directly) after subcellular fractionation, rather than relying on an indirect measure of siRNA translocation such as i) pharmacological activity [4,8] or ii) the presence of LFn-PKR or a fluorescently labelled LFn derivative [4] or iii) fluorescently labelled siRNA [8]. To quantitate the uptake and intracellular distribution of siRNA the covalent labelling of siRNA was undertaken using 32P. The use of radionucleotides was necessary, as the sensitivity of the fluorescence assays we had previously explored was not sufficient for a quantitative rather than a qualitative estimation of subcellular distribution [8].
To investigate the role of ILVs during aATx mediated transfection, two inhibitors of ILV formation and one of endocytic vesicle fusion were assayed for an effect upon PA translocase activity. Recombinant LFn fused-in-frame with diphtheria toxin a chain (LFn-DTA), previously shown to be a PA pore substrate [12], served as a positive control for PA-mediated translocation, and LFn-PKR non-covalently attached to siRNA [4] was used to evaluate the translocation of siRNA complexes. The inhibitors evaluated were: the lectin wheatgerm agglutinin (WGA), which binds to N-acetylglucosamine and sialic acid residues on the plasma membrane [13], crosslinking internalised cell membrane and leading to an expansion in the diameter of endocytic vesicles at higher concentrations [14,15], wortmannin, a fungal metabolite and potent inhibitor of phosphoinisitol (PI)3 kinase required for early endocytic vesicle fusion [16], and hypertonic sucrose previously shown to increase vesicle intraosmotic pressure [17,18]. We reasoned that WGA-mediated membrane cross-linking would limit the ability of the endosomal sorting complex required for transport (ESCRT) to drive ILV biogenesis and invagination into the endosomal lumen [19]. Further it was asked if hypertonic sucrose and the associated increase in intraendosomal osmotic pressure would also prevent ILV invagination and ultimately translocase activity. Wortmannin’s mode of activity has been reported to prevent material from accessing late, multivesicular endosomes, limiting the ability of the translocase to function [11,16].
2. Materials and Methods
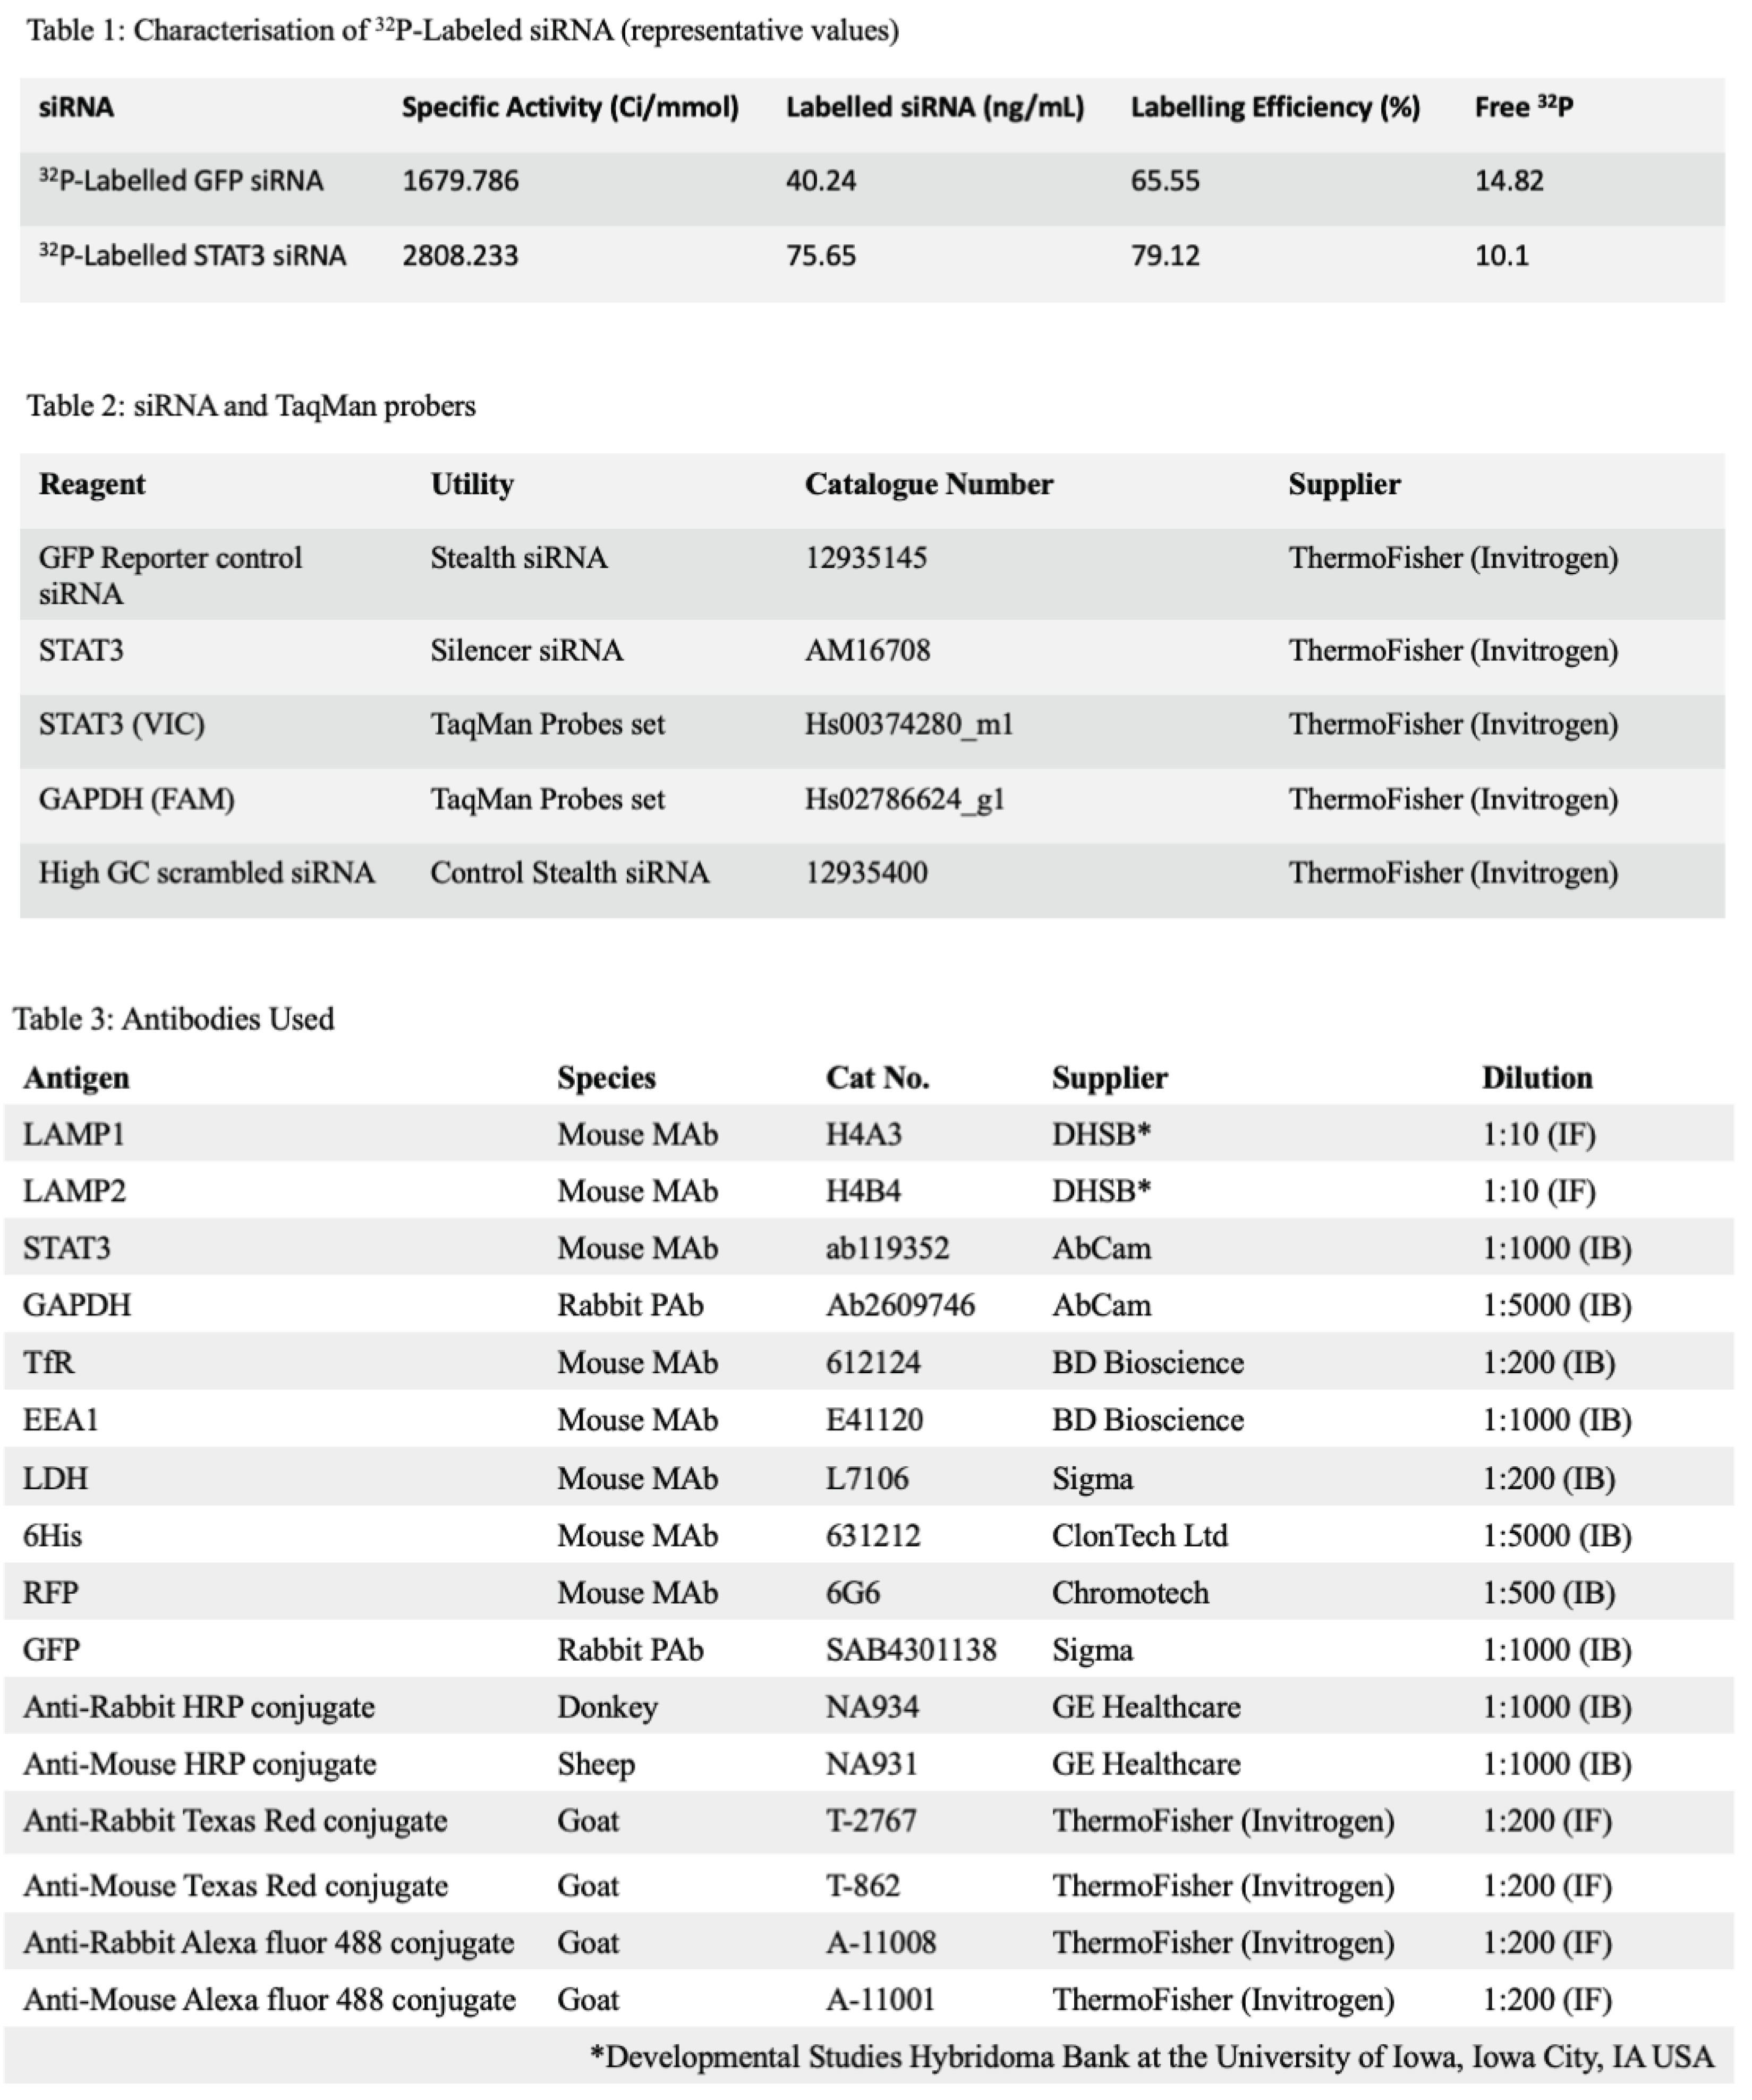
Materials. The LSM880 confocal microscope with Airyscan unit was from Carl Zeiss Ltd., (Oberkochen, Germany), the Triathler scintillation counter from Hydex (Turku, Finland), and the Multiskan™ FC Microplate Spectrophotometer from ThermoFisher Scientific (Horsham, UK). Nucleofection was performed using a Nucleofector 2b (Lonza, Basel, Switzerland). RT-qPCR was performed using a QuantStudio 3 system from Applied Biosystems (ThermoFisher Scientific, Horsham, UK). NIH Image J was used to perform densitometry after the digitisation of exposed X-ray films. MCF7 STAT3 downregulation Western blots were also captured using a ChemiDocMP imaging system (BioRad Ltd., Watford, UK). Lipofection reagents were from Invitrogen (ThermoFisher Scientific, Horsham, UK). Wortmannin, and Wheatgerm agglutinin were from ThermoFisher (Invotrogen, Paisley, UK). All other laboratory reagents were from Sigma Chemical Company (Dorset UK) unless otherwise stated. Bacterial lysates were generated using a French Press (ThermoFisher Scientific, Horsham, UK) set at 1500psi. The source and details of the siRNA, TaqMan Probes and antibodies used are given (Tables 1–3). The details of the cells used, and their culture conditions are given (Table 4). The oligonucleotides used for sequencing the transgene inserted into the HEK293 SC008 cells are also detailed (Tables S1-S4).
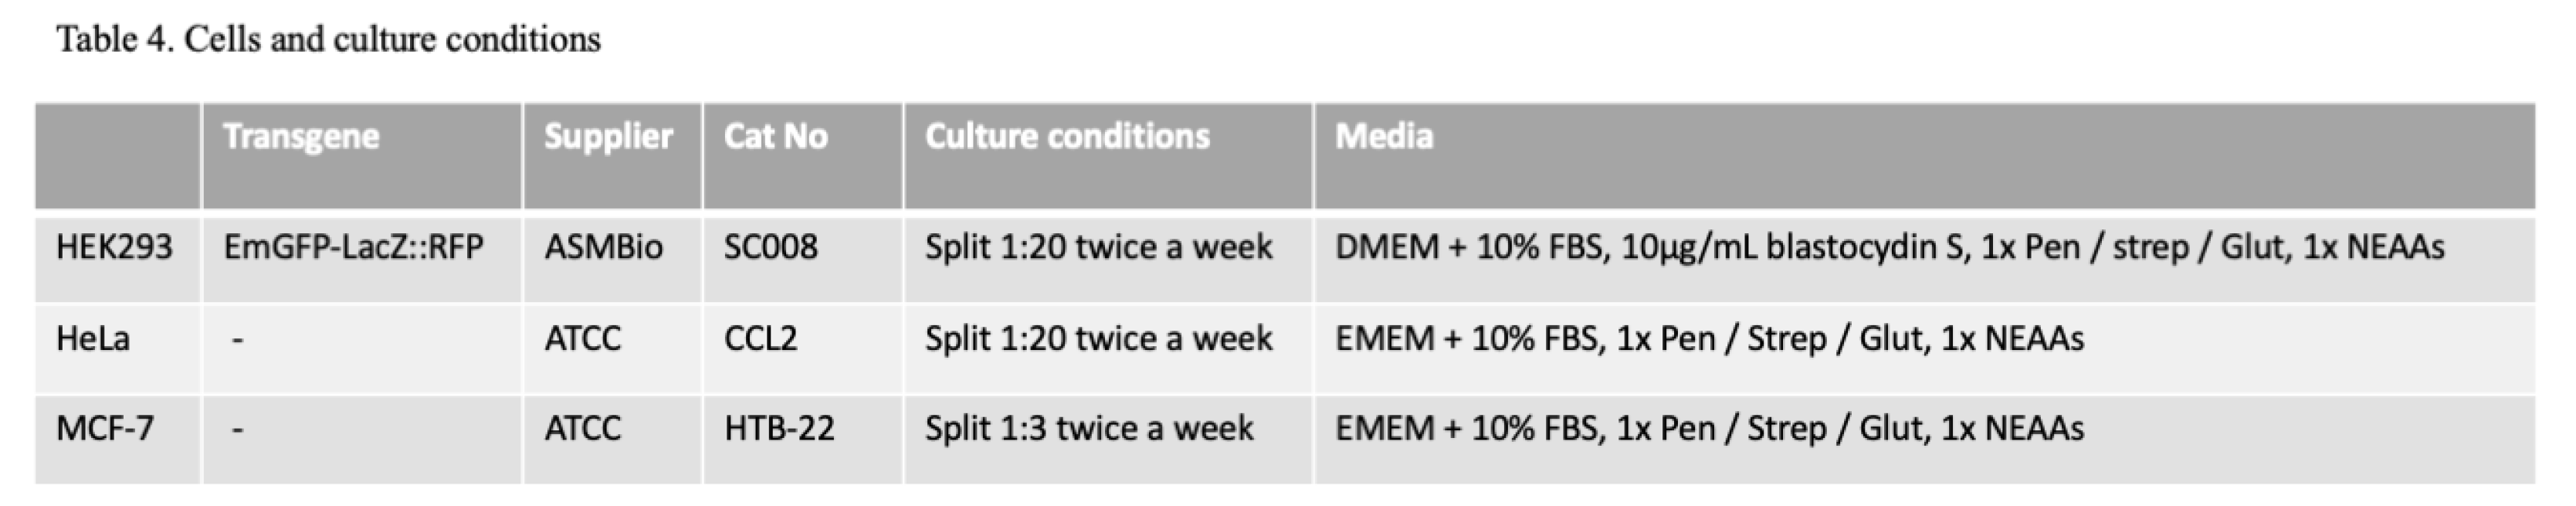
Methods.Cell culture. Cells were cultured as described (Table 4) under standard incubation conditions (i.e., at 37oC in a humidified atmosphere containing 5% (v/v) CO2). Dulbecco’s minimal essential medium (D-MEM), minimum essential media (MEM), Roswell Park Memorial Institute (RPMI)1640 media, foetal bovine serum, 100x penicillin-streptomycin-glutamine, 100x nonessential amino acid and blasticidin S HCl (10mg/mL) were from Gibco (ThermoFisher Scientific, Paisley, UK). Cells were maintained in T75 culture flasks with vented caps and passaged whilst sub-confluent twice a week. For subcellular fractionation, cells were cultured in T175 dishes and grown until 90% confluency using 15mL of complete media. When needed, cells were washed using sterile phosphate buffered saline (PBS).
Recombinant Protein Production. Recombinant PA83, LFn-PKR and LFn-DTA were produced as previously described [4,8,12] and characterised by Western immunoblotting and commissive staining. After dialysis the proteins were gently filter sterilised using a 0.2µ filter and stored at -20oC as 1mL aliquots in PBS. The PA preparations were also filter sterilised and stored at a concentration not exceeding 2mg/mL at -20oC.
X-gal colorimetric reporting system. HEK-293 SC008 cells stably expressing green fluorescent protein (GFP) fused-in-frame with beta-galactosidase (LacZ) and bicistronic red fluorescent protein (RFP) were mobilised using sterile trypsin EDTA (TE) buffer (Gibco, ThermoFisher, Paisley, UK), and used to seed a 6-well plate at a cell density of 1×10⁶/well then incubated overnight. After incubation, the cells were treated with either media (control), WGA (ThermoFisher Scientific, Paisley UK), sucrose or wortmannin at the stated concentrations for 24h. Cells were then incubated with 50µg/mL PA83 and 50µg/mL LFn-PKR which had been preincubated with siRNA directed against EmGFP for 5min at room temperature to give the stated siRNA concentration. Subsequently, the cells were incubated at 37oC for 48h for each treatment. After the indicated incubation period, media from the 6-well plates (Sigma-Aldrich, Dorset UK) was discarded, and 500µL of RIPA buffer (lysis buffer) (Sigma Aldrich, Dorset UK) was added to each well and the plate was incubated on ice for 15min. The RIPA buffer was aspirated in each well to facilitate cell disruption and added to a labelled sterile 1.5mL Eppendorf which was centrifuged for 10min, at 21 000xg at 4oC. The supernatant was decanted into a fresh, sterile Eppendorf and (3x10µL) aliquots were used to estimate protein concentration using a BCA assay kit (Sigma, Dorset, UK), following the manufacturer’s instructions. Following this, 400µL of supernatant was added to 12µL of X-gal (50mM in DMSO), at which point aliquots (100µL) were added into a 96-well plate. Hydrolysis of X-gal was then measured at 37oC at an absorbance of 620nm over a total time of 6h30min, reading every 15min. In each instance the point of maximum divergence from the control was used to calculate the degree of knockdown.
LFn-DTA Cytotoxicity Assay. Toxicity profiles used to determine the optimal amount of PA and LFn-DTA were performed. Here a 16mg/mL stock of LFn-DTA was diluted to the stated concentration using complete cell culture media (initially as 2x stock solutions to accommodate the displacement of a second 2x concentration of PA solution). HeLa cells were seeded at 1×10⁴ cells/well in a 96-well TC treated sterile plate and left under standard TC incubation conditions for 24h. The (2x) PA solution was prepared at twice the stated concentrations. The media from the HeLa cells was removed and replaced with either 50µL of the (2x LFn-DTA) solution and then 50µL of the (2x PA) solution, or by substituting one or both reagents with complete media to generate appropriate controls i.e., PA with no LFn-DTA, LFn-DTA with no PA, cells with no LFn-DTA or PA. The cells were then incubated for 45h prior to the addition of 20µL of sterile 5mg/mL 3-4,5 dimethyl-thiazol-2,5 diphenyl tetrazolium bromide (MTT) in PBS, for 3h under standard incubation conditions. The media was then removed and 100µL of dimethyl sulfoxide (DMSO) added to each well. After 20min, the OD560 was recorded. Absorbance values were imported into Excel (Microsoft Corporation, Redmond, WA., USA) and the data expressed as cell viability (%) relative to an untreated control. For the inhibition studies, 6-well plates were used and the cell seeding density was adjusted to 1x10⁶cells/well. The PA::LFn-DTA complex was prepared at the stated concentrations of PA, LFn-DTA and inhibitor in complete cell culture media to a total volume of 2mL, which was added to each well of cells where stated. After the stated incubation period cell viability was assessed by addition of 20µL of 5mg/mL sterile MTT diluted in PBS. Cells were then incubated for 3h, the media was removed and 100µL of DMSO added. The plate was then incubated for 30min, at room temperature and read at 560nm using Multiscan EX Microplate photometer (ThermoLifeSciences, Essex, UK).
Confocal imaging. HeLa cells were treated with the stated concentrations of the listed inhibitors which were chased into a late endocytic compartment. This was achieved by adding WGA conjugated -Alexa Fluor®488 (WGA-A488) or -Texas Red (WGA-TxR) dissolved in PBS, filter sterilised using a 0.2µ filter, to a previously established monolayer of cells grown on a cover slip in a 6-well culture plate at a density of 1x10⁶ cells/plate. This “pulse” of Alexa Fluor 488- or Texas Red -labelled WGA (Invitrogen, ThermoFisher Scientific, Paisley, UK) was incubated with cells for 4h at 37oC in complete media. This was then washed with PBS and cells then bathed in complete media. Following an 18h incubation (“chase”) period, the cell monolayer was washed with PBS and the cells fixed. Fixation was performed by adding freshly prepared 2% (w/v) paraformaldehyde (PAF) to the cell monolayer. After three washes in PBS, Triton-X-100 permeabilization buffer was added containing diamidino-2-phenylindole (DAPI) at a final concentration of 100ng/mL. After three washes in PBS, 1mL of blocking buffer (PBS containing 2% (v/v) FBS) was added to each well and left for 1h. The coverslips decorated with fixed cells were then mounted onto microscope slides in PBS containing 1% (w/v) n-propyl gallate and 50% (v/v) glycerol before being sealed (using nail varnish) and imaged using a confocal LSM880. Live cell imaging of the HEK293 cells was achieved using glass bottomed cell culture plates (ThermoFisher Scientific, Paisley, UK) and imaging the cells in complete media without phenol red. To this end 5% (v/v) CO2 was passed over the open culture dishes and images acquired at the designated time using a LSM880 with its environmental chamber humidified and set to 37oC. The environmental chamber was set up 4h prior to imaging to allow all components to come to equilibrium and to prevent drift in the Z-axis.
Radiolabelling siRNA with [γ-32P] ATP. All local and national training and safety guidelines were observed when receiving, handling, and disposing of 32P. Radiolabelling of siRNA was achieved using [γ-32P]- 3000Ci/mmol 10mCi/ml EasyTide ATP (PerkinElmer) and a 5’ end-labelling kit (Promega, Hampshire, UK) and following the manufacturers recommendations. Briefly, 24µL of a 20mM siRNA solution was treated with calf intestinal alkaline phosphatase (CIP) to remove the 5’ phosphate. After 30 min, at 37oC, a further 1µL of CIP was added to the reaction and it was incubated for a further 30min, at 37oC. The preparation was heated to denature the CIP and the dephosphorylated siRNA recovered by solvent extraction and isopropanol precipitation. This was performed by first adding an equal volume of phenol:chloroform and recovering the aqueous phase by centrifugation at 12 000xg for 1min at room temperature then adding an equal volume of phenol chloroform:isoamyl alcohol before recovering the aqueous phase as before. The siRNA was then recovered by isopropanol precipitation. The siRNA pellet was diluted into 24µL of DEPC treated water and the 5’ phosphate replaced with a 32P atom donated from (8µL) of [γ-32P]- 3000Ci/mmol 10mCi/ml EasyTide ATP, using T4 polynucleotide kinase. The reaction was stopped using EDTA and the 32P-labelled siRNA recovered by solvent extraction and isopropanol precipitation as before, leaving unincorporated radioactivity in the supernatant which was removed and safely disposed of. The pellet was then dissolved in 24µL of DEPC treated water. Specific activity was assessed by running a known volume of the 32P-labelled siRNA on a 15% (w/v) native PAGE gel and staining with gel red and using densitometry to estimate mass relative to a selection of cold siRNA standards. Free 32P was quantified by placing a 10µL of a 1:100 dilution of the 32P-labelled siRNA on a 2cm square of hybond N+ membrane and washing it with sodium phosphate buffer and comparing the emission (CPM) from the membrane with the input and recording the emissions from the washing buffer with the input and those remaining on the membrane. Scintillation counting was performed over 60s using a Triathler scintillation counter (Hydex, Turku, Finland) and using 2mL of scintillation fluid (Flo-Scint II, PerkinElmer, Beaconsfield, UK).
Subcellular fractionation. Subcellular fractionation was performed by differential centrifugation using a previously published protocol [4,20,21]. Briefly, cells were grown to 90% confluence in 3xT175 dishes and were transfected in a final volume of 8mL/dish using serum free media. Transfections were performed as previously stated [4] using 50µg/mL of PA and 50µg/mL LFn-PKR and the indicated amount of siRNA. Where appropriate the labelled siRNA was diluted with cold (non-labelled) siRNA. The siRNA was allowed to hybridise to the LFn-PKR for 5min, in half the final volume of serum free media before being added to the PA solution and the volume adjusted to the required amount using serum free media. After the removal of the existing complete media, the cells were washed 3x using sterile PBS which was also removed prior to the transfection media being added to the cell culture dishes. At the designated time, the cell culture media was removed, and the cells washed 3x in PBS, which was removed, and the excess blotted from the edge of the culture dish. Next, 200µL of HES buffer (20mM HEPES pH7.4, 250mM Sucrose and 1mM EDTA) was added to the first plate. The cells were mobilised using a rubber policeman and the cell suspension transferred to the next, blotted culture dish. This process was repeated, and the cells transferred to a 1.5mL Eppendorf. A further 200µL of HES buffer was used to wash the plates and the two cell suspensions combined. Cells were then lysed by rapid passage through a 21-gauge needle (10x) and subject to 600xg for 2 min, at 4oC. Then, 50% of the supernatant was removed and kept on ice. The other 50% was used to resuspend the pellet which was passed an additional 10x through a 21-gauge needle. The preparation was subject to 600xg as before and the supernatants pooled. The volume of this lysate was recorded and 50µL was removed and frozen and labelled lysate. The remaining lysate was subject to 1500xg for 2min at 4oC. The supernatant was removed, the volume recorded and 50µL removed, labelled and frozen after being designated post-nuclear supernatant (PNS). The pellet was resuspended in 100µL of HES buffer, designated the nuclear fraction and frozen. The remaining PNS was then subject to 200 000xg for 60min at 4oC and separated into a supernatant (cytosol fraction) and pellet (membrane fraction) which was resuspended in 100µL of HES buffer and frozen. The following day the frozen fractions were analysed for protein concentration and the radionucleotide emissions were recorded for a specific volume. Immunoblotting was undertaken to determine the level of enrichment of a control (EEA1), membrane (TfR) and cytosol (LDH) markers as described. The total amount of protein in the cell lysate was calculated as were the proportion in the nuclear, membrane and cytosol fractions. This was then used to calculate the distribution and mass (from specific activity) of siRNA in each compartment. Previously leakage from the membrane fraction had been controlled for [4], where translocation out of the membrane fraction was shown to be PA, temperature and time dependent. This observation agrees with our previous work undertaking subcellular fractionation where lysosomal rupture was only observed after using a polytron cell disrupter rather than a gentler form of lysis and disruption such as a Dounce homogeniser [21].
Western Immunoblotting. Immunoblotting was performed as previously described (Dyer et al., 2015), using the antibodies listed (Table 3). Approximately 50µg of PNS per well was run and after separation on a 12% (w/v) acrylamide resolving gel at 200v for 45min, samples were transferred onto 0.2µ nitrocellulose membrane at 400mA for 120 min. This blot was then washed in PBS containing 0.01% (v/v) TWEEN 20, (PBS-T) and blocked by incubation in PBS-T containing 5% (w/v) non-fat dried milk for 60min, at 37oC. Following this the blot was incubated on a shaking platform with the primary antibody (Table 3) diluted in PBS-T containing 5% (w/v) non-fat dried milk for 60min, at 37oC. After three x 5 min, washes in PBS-T, the blot was incubated with the secondary antibody (Table 3) also diluted in PBS-T containing 5% (w/v) non-fat dried milk for 60min, at 37oC. The blot was then washed for 2x 5min, in PBS-T and once for 5min, in PBS before being used to expose X-ray film (Scientific Laboratory Supplies Ltd., Notts, UK) in the presence of (picostable) ECL reagent (ThermoFisher Scientific, Paisley, UK) used in accordance with the manufacturer’s instructions. X-ray film was exposed for times varying between 5s – 24h depending on signal to noise ratio and signal strength. Exposed films were developed using an Ecomax X-ray film automatic processor (Photon Imaging Systems, Swindon, UK) following the manufacturer’s instructions. In the case of the anti-STAT3 antibody, the blots were blocked in Tris buffered saline (50mM Tris, 150mM sodium chloride pH 7.6) containing 0.1% (v/v) TWEEN 20 and 5% (w/v) BSA. Blots were washed each time in TBS-TWEEN 20 and primary hybridisation was performed at 4oC overnight under shaking conditions containing TBS 0.1% (v/v) TWEEN 20 and 5% (w/v) BSA. Subsequent repartitions were imaged using a ChemiDocMP system (BioRad Ltd., Watford, UK) following the manufacturer’s recommendations.
Data handling. Data from MTT assays was exported from the Scanit software (6.0) (ThermoFisher Scientific, Paisley, UK) into Excel (Microsoft). Here the mean and standard deviation (SD) for each treatment was found, and the control (%) calculated by dividing a given average or SD by 1/100th (i.e., 1%) of the non-treated control’s average reading. These data were then moved into Prism (v10.0) software (GraphPad by Dotmatics, CA, USA) and used to generate a graphical representation of the data. Appropriate statistical analysis was also performed using Prism as stipulated in the results section. For subcellular distribution experiments the specific activity of each 32P-labelled siRNA preparation was defined as described and used to calculate (allowing for radioactive decay with a half-life of 14.3 days) siRNA mass at a given time, within a specific compartment. Knowing subcellular compartment protein concentrations allowed for the calculation of total compartmental volumes including the amounts removed to read protein concentration and CPS. Results were expressed as proportion (%) total cell associated radioactivity and hence calculated mass/compartment. As the input number of cells was also known, an estimate (as a small proportion of cells did not lyse and were removed from the equation and the effect of the treatment on cell doubling time was not established) of siRNA mass/compartment /cell in relation to pharmacological activity was also undertaken. Statistical comparisons were made using an ordinary one-way ANOVA test (Dunnett’s T3 multiple comparison test) in every instance except Figure S1 (panel c) where an unpaired T-test was used.
3. Results
The aAtx-based drug delivery technology described herein is relatively embryonic and questions remain regarding its mechanism of action. Indirect evidence of the PA::LFn-PKR mediated cytosolic delivery of ASOs and siRNA have been published [4]. These data were surprising given the published mode of action of the PA translocase [11]. Consequently, an assay that could quantify and relate direct evidence reporting the subcellular localisation of siRNA to its pharmacological effect was developed (Figure 1 and Figure 2). To this end, both HEK293GFP-LacZ::RFP and MCF-7 cell lines were used as a reporter system for RNA interference. Then, having gathered direct evidence for siRNA cytosolic translocation, pharmacological data was gathered that could be used to relate siRNA subcellular distribution to siRNA activity.
To build a phenotypic assay for siRNA activity using the HEK293GFP-LacZ::RFP cells, an understanding of the transgene sequence coding for the target mRNA was needed. To this end, PCR amplicons spanning the transgene were sequenced (Figure S2 (panel a)) and Tables S1-S4) and the nucleotide sequence then translated into a protein sequence in silico to control for codon optimisation and used to identify the specific GFP, LacZ and RFP variants present (Figure S2 (panels b-e)) i.e., emerald GFP (EmGFP) E. coli beta-galactosidase chain 1, and the RFP tandem dimeric tomato (TdTom). The transgene sequence was then deposited in Genbank (accession number MH015340.1).
Having ascertained the sequence of the transgene, siRNA sequences were identified that could silence the transgenic mRNA transcripts and consequently reduce GFP, LacZ and RFP protein expression. This was confirmed using a commercial GFP-reporter control siRNA after both Nucleofection® and PA::LFn-PKR mediated transfection (Figure S1 (panels a-f)), measured using: X-gal hydrolysis (Figure S1 (panel a and f)), Western immunoblotting (Figure S1 (panel b)) and RT-qPCR (Figure S1 (panel c and d)). These data offer indirect evidence that PA::LFn-PKR was mediating the cytosolic delivery of siRNA, supporting the finding previously published for HeLa, THP-1, and Vero cells [4]. Gene silencing was observed 48h after Nucleofection® with 25nM siRNA (29%±0.8% expression relative to the control (±SD; n=3, p<0.0001)) (Figure S1 (panel a)) and 48.9%±1.5 expression relative to the control (±SD; n=3, p=0.0001)) after treatment with 100nM siRNA and PA::LFn-PKR (Figure S1 (panel b)). When RTqPCR was used to monitor gene expression, after delta delta CT analysis (Figure S1, panel c), 0.36±0.13 (±SD; n=3) expression was reported after the nucleofection of 100nM of GFP specific siRNA. When PA and LFn-PKR were used 0.4±0.07 (±SD, n=9) expression of the control transgene was reported (Figure S1 (panel d)). Gene knockdown was (qualitatively) visible when the cells were visualised by confocal microscopy after transfection (Figure S1 (panel d)). Gene silencing relative to a sham transfected control (Figure S1 (panel e, row i)), reports a qualitative reduction in both green and red signal was observed after transfection by Nucleofection® (Figure S1 (panel e row ii)) or PA::LFn-PKR (Figure S1 (panel e, row iii)) using identical detector gain settings across samples. This evidence was again observed when enzymatic activity was used to monitor gene expression (Figure S1, panel f). Here, after transfection using PA and LFn-PKR and 100 nM of GFP siRNA 79.95±9.78% (±SD, n=3) inhibition was documented.
Direct evidence for PA::LFn-PKR mediated siRNA cytosolic delivery was also gathered using radiolabelled siRNA (Table 1) and the subsequent subcellular fractionation of two distinct cell lines (HEK293GFP-LacZ::RFP (SC008) and MCF-7). Scintillation counting the subcellular fractions of treated cells provided direct evidence of PA::LFn-PKR-mediated 32P-labelled siRNAs’ cytosolic delivery in both cell lines cells (Figure 1 (panels a-c)). Figure 1 (panel a) records 78±2% (±SD, n=3) cell associated radioactivity to be in the cytosol of HEK293 cells 24h after being incubated with 100nM siRNA delivered using the aATx system. Transfection was performed with the 32P-labelled siRNA (GFP reporter control) described in Table 1, using three concentrations of siRNA and a control without PA or LFn-PKR (Figure 1 (panels a and b)). The distribution of cell associated radioactivity was reported (Figure 1 (panel a)), although the control data should be interpreted with care and after considering the varying uptake (mass) associated with the different levels of specific activity (Figure 1 (panel b)). The distribution (%) of cell associated siRNA provides a relative overview of the enrichment of siRNA within the subcellular compartments, yet the absolute siRNA mass/compartment was also important to consider. This observation explains why the control shows a high percentage of siRNA in the cytosol (Figure 1 (panel a)), although the mass of the siRNA within the cytosol was very low (after a 100nM dose) (Figure 1 (panel b)). What was striking was that after transfection with PA::LFn-PKR, there was an increase in cytosolic siRNA even when accounting for the different mass of siRNA internalised as a function of dose (Figure 1 (panel b)) and that this enrichment was statistically significant (p=0.0007) relative to the control. Representative marker enrichment patterns indicated that the fractionation was successful (Figure S3) as there was no detectable cytosolic marker (LDH) visible in the membrane fraction, and no membrane marker (TfR) visible in the cytosolic fraction. The presence of EEA1 in both fractions acted as a loading control for both HeLa and MCF7 cells.
Figure 1 also relates the translocation of 32P-labelled siRNA mass and, in turn, the number of siRNA molecules into the cytosol (Figure 1 (panels a-c) and Table 1), to an RT-qPCR (Figure 2, (panel a)) and Western analysis (Figure 2 (panel b)) profile. Consequently, it was possible to derive that a dose of 50nM of siRNA reduced STAT3 gene expression to 53.2±8.12% (±SD; n=3) of the control (Figure 2 (panel b)), delivering approximately 1.3x10¹³ siRNA molecules in the cytosol/cell. A dose of 100nM siRNA resulted in 35.9±14.2% (±SD; n=3) expression of STAT3 (Figure 2 (panel d)) after 3.9x10¹³ siRNA molecules were detected in the cytosol.
A comparison of the efficiency of cytosolic siRNA delivery by various transfection systems was also undertaken. Figure 1 (panel c) documents the cytosolic enrichment of 32P-labelled siRNA and Figure 2 (panel a) documents siRNA activity by RTq-PCR and Western immunoblotting. Approximately 77±2.5% (±SD; n=3) of the cell associated siRNA was documented in the cytosol after transfection using PA::LFn-PKR and 100nM 32P-labelled siRNA, relative to 56±1.7% (±SD; n=3) after transfection of 100nM 32P-labelled siRNA using Oligofectamine or 45±3.2% (±SD; n=3) using Lipofectamine 2000. Figure 2 (panel b) relates this distribution to a reduction in mRNA level. Significant knockdown was observed after transfection with PA::LFn-PKR and by Nucleofection. These data were further verified by Western analysis, where a reduction in target gene expression was documented relative to a housekeeper (GAPDH) after using 100nM siRNA with PA::LFn-PKR (Figure 2 (panel b)). Here, treatment with 100mM siRNA delivered using PA::LFn-PKR resulted in 36±14.17% (±SD, n=3) of STAT3 gene expression. Representative subcellular marker enrichment across the PNS, cytosol and membrane fractions demonstrated that there was no detectable cytosol marker in the membrane fraction and no detectable membrane marker in the cytosol fraction (Figure S3 (panels a & b)).
Having ascertained that siRNA was being translocated into the cytosol using both direct and indirect assays within multiple cell lines, the role of ILVs during PA-mediated transfection of siRNA was investigated. Given that after the hydrolysis of PA83 to PA63 needed to form homo-heptamers or homo-octamers, and the insertion of the PA63 pre-pore into the membrane to form the PA63 pore, the possibility that this event was destabilising the limiting membrane of endocytic vesicles, rather than the PA multimer acting as a translocase, was investigated. This was done using two different types of translocase substrate. The first mimicked the wild-type translocation of LF and required the use of an LF truncation (i.e., the first 255 N-terminal amino acids) fused-in-frame to diphtheria toxin a chain (DTA). Figure 3 (panel a) assayed the toxicity of LFn-DTA (without PA) over time, and over the microgram concentration range. Over a microgram concentration range, little variance from the control population viability was documented 24, 48 and 72h post-treatment. Figure 3 (panel b) reports the effect of adding various concentrations of PA protein to sub-lethal concentrations of LFn-DTA. The presence of the PA reduced cell viability to below 10% of the control population at every PA concentration measured, down to a PA concentration of 25µg/mL. If this PA concentration was reduced further to 5µg/mL and concentrations of LFn-DTA to 50ng/mL (Figure 3 (panel c)) a less than 10% cell viability was also documented. The LFn-DTA protein was characterised by Western immunodetection using a 6His-specific antibody shown (Figure 3 (panel d)). This was due to the lack of a reliable LFn specific antibody. The next step in characterising the effect of WGA and hypertonic sucrose upon ILV formation (Figure 3 (panel e)). Here, Vero cells were observed after the cells were fixed in cold methanol, and immunolabelled with antibodies specific for lysosome associated membrane protein (LAMP) 1 and 2. ILVs were clearly visible in the inset as membrane inside membrane delineated vesicles, and specific examples have been marked with arrows (Figure 3 (panel d)). Figure 3 (panel f) gives a qualitative indication of the effects of both sucrose and WGA upon ILV formation, and this was quantified (Figure 3 (panel f)).
To quantify the number of ILVs, ImageJ (NCBI, NIH, US) was used to analyse cell populations which were visualised using the LSM880 confocal microscope (and an appropriate threshold was set). A free hand outline was drawn around control (no treatment), WGA treated, and sucrose treated cells. The “Analyse particle” command was used to distinguish individual LAMP1&2-stained vesicles and classify each as a discrete entity. Vesicles were outlined, counted and measured. The results were represented as a percentage relative to an untreated control (Figure 3 (panel f)). WGA treated cells showed a reduction in ILV formation of 28.5±14.8% (±SD; n=10) while sucrose treated cells demonstrated a decrease in ILV formation of 45.4±13.7 (±SD; n=10), both calculations were relative to the untreated cells stained with LAMP1&2 specific antibodies 100±10.0% (±SD; n=10).
The effect of WGA, hyperosmotic sucrose and wortmannin upon PA translocation were assayed and documented (Figure 4). Figure 4 (panels a and b) detail the effect of increasing concentrations of WGA upon LFn-DTA or LFn-PKR::siRNA PA translocase activity (respectively). Here, a WGA concentration-dependent increase in translocase inhibition was documented when the activity of both cargo types was examined.
Figure 4 (panel a) records a cell viability of 14.8±0.45% (±SD, n=3) of the control population when the cells are treated with no WGA and 5µg/mL PA and 10µg/mL LFn-DTA. If 10µg/mL WGA, 5µg/mL PA and 10µg/mL of LFn-DTA were added to the culture cell culture, a viability of 83.3±3.8% (±SD, n=3) control viability was recorded. Figure 4 (panel b) records the effect of WGA on PA and LFn-PKR mediated transfection. Here, 11.5±0.03% (±SD, n=3) expression of LacZ was recorded when uninhibited transfection with PA and LFn-PKR was used. This stands in contrast to 86.7±0.6% (±SD, n=3) control expression when 25µg/mL WGA was added to the cell culture, and PA::LFn-PKR::siRNA reagent (Figure 4 (panel b)).
Figure 4 (panel c) records cell viability after treating the cells with 200 mM sucrose (plus 5µg/mL of PA83 and 10µg/mL of LFn-DTA), which resulted in cell viability of 82.7±0.4 (±SD, n=3). This stands in contrast to cells treated only with a similar concentration of PA and LFn-DTA (16.1±0.01% (±SD, n-3) viability) when no sucrose was used. Figure 4 (panel d) records LacZ expression / µg cell protein. Here, knockdown in the absence of sucrose LacZ expression was recorded as being 11.3±5.1% (±SD, n=3) of the control. After treatment with 200mM sucrose, expression was recorded to be 86.1±7.76 (±SD, n=3).
When the effects of wortmannin were examined, PA and LFn-DTA at the same concentrations as before left 27.7±1.9% (±SD, n=3) control cells alive (Figure 4 (panel f)). This was in contrast to cells treated with 200nM wortmannin, which maintained a viability 97.4±2.1% (±SD, n=3) control when treated with a similar amount of PA and LFn-DTA. Figure 4 (panel f) records the expression of LacZ in relation to transfection using PA and LFn-DTA and wortmannin. Here, the control cells subject to siRNA transfection expressed 32.7±4.74% (±SD, n=3) control lacZ. Under similar transfection conditions and with the addition of 100nM wortmannin 85.3±11.7% (±SD, n=3) control LacZ expression was recorded.
One interpretation of these data might be that the WGA, which has the capacity to crosslink membrane, was reinforcing the limiting membrane of endosomes, leading to a reduction in the probability of a breach (i.e., reducing endosomolysis). This possibility was countered by increasing the luminal osmotic pressure of the endosomes using hyperosmotic sucrose, which has also been used to reduce ILV formation. The effect of hyperosmotic sucrose upon LFn-DTA translocation and LFn-PKR::siRNA translocation was documented (Figure 4 (panels c and d)) respectively. Rather than a bolus release of translocase cargo indicative of a failure of endosomal limiting membrane integrity, as might be expected if cargo release was simply bypassing the PA pore and being released as a result of endosomolysis, a sucrose concentration-dependent inhibition of cargo activity was reported. This indicated that the limiting membrane of the endosomes remained intact and that ILV formation was critical for the cytosolic translocation of both LFn-DTA and LFn-PKR::siRNA. Finally, the effects of wortmannin upon translocase activity was investigated and again a reduction in cargo activity was reported that was wortmannin concentration-dependent (Figure 4 (panels e and f)). This indicates that endocytic fusion events involving the early endosome were also critical to cargo translocation as might be predicted. Figure 5 captures these data as a cartoon and relates the activity of the translocase cargo to the various ILV inhibitors assayed.
4. Discussion
The use of a membrane delineated intermediaries such as an ILV to protect the limiting membrane of a late endocytic structure from rupturing, whilst increasing the available surface area of membrane to mediate translocation, remains unique to ATx. Toxins such as streptolysin O (SLO) have been found within populations of ILVs. However, this localisation is not intrinsic to the translocation of an A chain into the cytosol, but more likely a defence against the unregulated egress of cytosol through a pore within the plasma membrane [22]. SLO ILV localisation is thought to be driven by the ubiquitylation of a cytosolic portion of the toxin, and ubiquitin (Ub) is known to serve as a signalling system that marks the ubiquitinylated target for endolysosomal destruction [24]. In addition to SLO, there is evidence for the ubiquitylation of the cytosolic portion of ATXR1 and 2 [25] but not PA [23]. The pH-driven receptor disassociation and membrane insertion of the PA multimer and the lack of ubiquitylation (the cytosolic portion of PA has been reported to be masked from ubiquitylation by palmitoylation) [23] which may, in part, account for the prolonged residence time of the PA pore with the EEA1 positive (early endosomal) structures previously reported [4] also offering (1) a depot effect for the extended translocation of material, in addition to (2) exosome loading [24,26]. Toxins that compromise the limiting membranes of endosomes have also been reported to deliver siRNA to the cytosol and these include attenuated diphtheria toxin [27]. This highlights the growing awareness for the need for endosomal escape, although this approach may be self-limiting, as the escape of protons from the endosome lumen may limit subsequent endosomal maturation, transport and fusion events (reviewed in [28]). The acidic pH of the endosomal lumen has been reported to drive the Brownian ratcheting [11] or helix compression [29] of PA translocase substrates and facilitate molten globular cargo transition, allowing passage over the phenylalanine clamp at the base of the PA oligomer vestibule, as well as driving pre-pore to pore transition [11]. As most of the PA pore has been reported to be embedded within ILVs [10] there remains the potential for the decoupling of cargo membrane translocation from the membrane-lytic toxicity associated with non-viral delivery technologies such as poly(ethylamine imine) [30] or poly(L-lysine) [31].
After establishing that a pharmacological response was recorded after using PA83, LFn-GAL4 and LFn-PKR to deliver ASOs and siRNA respectively [4], many questions remained about the role of the cation selective PA translocase, which has been reported to require cargo molten globular transition to pass through the PA phenylalanine clamp [11]. This clamp has been reported to have a diameter of 6Å, [11] which is too small to allow the passage of siRNA (a polyanion with a diameter of ~20Å [32] and would require the unfolding of the RNA binding domain of LFn-PKR and the disassociation of the siRNA from the LFn-PKR dimer. This could be interpreted to mean that 1) the PA pore was not only operating as a cation selective but also an anion selective pore, 2) could radially dilate meaning the phenylalanine clamp’s diameter of 6Å was that of the pore in a resting state, or 3) that the PA pore was not being used as a translocase and the insertion of the PA pore transmembrane domain was stressing the limiting membrane to the point of endosomolysis. This ultimately begs the question, did the cargo go through the PA translocase into the lumen of an ILV, which then underwent back-fusion with the limiting membrane of the multivesicular body/late endosome?
To understand these observations this study asked: can siRNA cargo be detected directly in the cytosol as opposed to indirectly, and could this event be quantified? This was addressed using 32P-labelled siRNA which was detected in nuclei, membrane, and cytosolic fractions of lysed cells subject to increasing relative centrifugal fields. This method of differential centrifugation had been adapted from that of DuDuve [33] and previously published [4,21]. Here, the fractionation was characterised by Western immunoblotting. As all the readily detectable cytosolic marker (lactate dehydrogenase (LDH)) [21] was within the cytosolic fraction and not the membrane fraction, and the membrane marker (transferrin receptor (TfR)) [34] was detected within the membrane fraction rather than the cytosolic fraction, the fractionation scheme was accepted as generating reliable separation and enrichment of the cytosolic and membrane compartments. Previously controls were reported showing a requirement for heat and PA for the cytosolic translocation of either LFn-PKR or LFn-GAL4 demonstrating the integrity of vesicles within the membrane compartment [4,21].
Up to 80% of the cell associated radioactivity (siRNA) was calculated to be in the cytosol after delivery using PA::LFn-PKR, and these data were interpreted as direct evidence of the cytosolic translocation of the siRNA (Figure 1). This conclusion was reinforced by data recording the downregulation of an overexpressed enzyme (LacZ) when examined by 1) assaying beta-galactosidase activity, 2) using RT-qPCR to interrogate mRNA, or 3) by Western immunoblotting to measure protein levels after transfection with both nucleofection and PA::LFn-PKR (Figure S1).
A quantitative comparison of this transfection system with others characterised in the literature was difficult, as a variety of both in vitro but mainly in vivo data sets have been reported. Further distributions are often reported as a dose (%) rather than a distribution based upon a cell-associated label. Whilst there is merit in both approaches, here, in vitro data that denoted intracellular distribution was adopted rather than a scheme that would also measure cell or organ targeting. Given the efficiency of siRNA capture in an in vitro system and the propensity to manipulate this data by altering the volume of culture fluid and concentration of label added to the system, it was decided to normalise these data to cell associated signal, asking: what was the subcellular distribution of the captured siRNA? Consequently, comparisons with the conclusions drawn after in vivo studies [35] using colloidal gold as a delivery vehicle and using GalNAc, where cytosolic distributions range from 1-2% to 0.01% (respectively) remain difficult [36]. Given the proposed mechanism of GalNAc modulating subcellular distribution, this inefficiency is not surprising. Regardless, these papers are still informative and may guide the next stage of this investigation, where in vivo activity may be assessed. Several studies examine the subcellular distribution of nucleic acid drugs in vitro using typically lipid-based delivery vehicles, reporting data with similar distributions to those reported here. The intracellular delivery of FITC-ladled-siRNA was documented [37] in KB cells and 90% was reported in the cytosol using HDL mimicking nanoparticles. Here, 68±0.3% of the siRNA delivered using Lipofectamine was reported to be cytosolic (Figure 1 (panel c)). A similar study [38] reported that a lipid mediated delivery system resulted in 50-100 000 siRNA molecules in the cytosol of HeLa cells using quantitative confocal microscopy. It was reported that Lipofectamine and cell penetrating peptides resulted in 60-70% cytosolic distribution of siRNA to the cytosol of ECV-304 cells [39]. The distributions calculated herein, with Lipofectamine being 68±0.3% enriched in the cytosol after a dose of 50nM (Figure 2 (panel a)), are comparable with the aforementioned study [37], lending further credibility of the data obtained using PA and LFn-PKR.
Having acquired a substantial body of evidence supporting the idea that PA::LFn-PKR can mediate the cytosolic translocation of siRNA (Figures 1, 2, 4 & S1, [4,8]), the next question addressed the regulation of membrane trafficking responsible for this phenomenon. To this end, two assays were developed to monitor the pharmacological activity of both a well-characterised translocase substrate (LFn-Diphtheria toxin a chain) [8,12] and LFn-PKR::siRNA [4] in the presence of either inhibitors of either ILV formation or endocytic fusion events. The first assay used here had been previously characterised and uses the fusion protein LFn-DTA which, without an exogenous transporter, can’t access its cytosolic target (elongation factor 2a) [12]. In the presence of >5µg/mL of PA, 10µg/mL of LFn-DTA is measurably toxic over 48h when measured using MTT [8].
It was hypothesised that three endocytic inhibitors would impact upon PA’s ability to act as a translocase by either inhibiting ILV formation or disrupting membrane traffic to the late endosome. WGA is known to crosslink membrane and, at higher concentrations give rise to expanded late endocytic structures [14]. This observation led to the conjecture that the expansion of vesicle size and driven by membrane crosslinking, would inhibit ILV formation. Upon microscopic examination of WGA treated cells, a reduced level of internal membrane within late endocytic structures was documented supporting this conjecture (Figure 3 (panels e-f)) validating the use of these phenomena to examine the role of PA in LFn-PKR::siRNA membrane translocation. Similarly, hyperosmotic sucrose has been reported to also cause expanded late endocytic structures (sucrosomes) with dramatically reduced levels of internal membrane and this treatment has been found to interfere with the lysosome regeneration cycle [18]. Electron micrographs of sucrose filled endosomes from NRK cells have also revealed a scarcity of internal membranes (indicative of ILVs biogenesis) within late endosomes [17].
When these two inhibitors were used to treat cells, a significant, concentration-dependent reduction in pharmacological activity of either PA::LFn-DTA or PA::LFn-PKR::siRNA was recorded (Figure 4). This value was similar to the data characterising the effect of the downregulation of ALiX during LF PA translocation [10] and indicates that ILVs form a critical part of the machinery needed for the PA translocase to move LFn-DTA and LFn-PKR::siRNA to the cytosol efficiently. These data suggest the possibility of an endosomolytic effect accounting for translocase cargo release. Given that WGA may reinforce the limiting membrane and possibly reduce the opportunity for PA to become embedded in the membrane, the treatment with hyperosmotic sucrose might be expected to further stress the membrane, enhancing the opportunity for the release of luminal content if membrane integrity was compromised. This is the opposite to the effect the data described here i.e., the inhibitors reduce pharmacological activity rather than enhance it by further stressing the integrity of the endosomal membrane (Figure 4 (panels c and d)). Whilst it was possible that hyperosmotic sucrose was also inhibiting fusion to the LE, this inhibition of fusion was not apparent within populations of WGA treated cells, where unlabelled gaps in the existing limiting membrane containing fluorescent WGA have been documented and are indicative of fresh membrane fusing to the LE already containing WGA [14]. Wortmannin, whilst not directly impacting upon ILV formation, indicates that endocytic vesicle fusion to early endosomes was also necessary for PA::LFn-DTA and PA::LFn-PKR::siRNA activity.
5. Conclusions
Evidence of siRNA translocation across the PA pore was gathered both indirectly and directly by looking at the subcellular distribution of radiolabelled siRNA and by measuring the activity of the siRNA in relation to the expression level of its target. Evidence for the requirement of PA and the involvement of ILVs during this translocation process was also recorded. This makes the probability of an endosomolytic event being responsible for the cytosolic translocation of the siRNA unlikely, framing this first in class delivery technology as unique in its use of an intermediary compartment during the cytosolic delivery of siRNA. should discuss the results and how they can be interpreted from the perspective of previous studies and of the working hypotheses. The findings and their implications should be discussed in the broadest context possible. Future research directions may also be highlighted.
6. Patents
This work relates to patents: WO2014203008 and WO2020030923 owned by Greenwich University Enterprises Ltd.
Supplementary Materials
The following supporting information can be downloaded at: Preprints.org, Supplemental Figure S1: The characterisation of gene silencing in HEK293Gfp-LacZ:Rfp (SC008) cells; Supplemental Figure S2: The characterisation of HEK293 SC008 cells and Supplemental Figure S3: Characterisation of subcellular fractionation in HEK293 and MCF-7 cells.) Supplemental Table S1 & S2: detail the primers used to sequencing the SC008 transgene as well as the amplicons generated for the sequencing. Supplemental Tables S3 & S4: detail the sequencing primers and reactions used for the SC008 transgene.
Author Contributions
NH BF and HA contributed the work defining the subcellular distribution using radiolabelled siRNA and developed and executed the X-gal assay. MF supported the generating of this assay. JM helped TG, NY, NH BF and HA analyse the RTq-PCR assays. NT and TG helped NM and HA run and analyse MTT assays. VT provided critique and supplied PA and LFn-PKR. SR conceived, supervised this work and wrote this manuscript with critique for all authors. NY and TG also helped make and characterise recombinant PA and LFn-PKR. All other assays were performed by NH, HA or BF.
Funding
Please add: “This research received no external funding”
Data Availability Statement
Data will be made available upon request.
Acknowledgments
BKLF would like to acknowledge GUEL for supporting her PhD. NAMM and HKSA would like to acknowledge MSA and The University of Greenwich for funding their PhDs.
Conflicts of Interest
“The authors declare no conflicts of interest.”
Abbreviations
The following abbreviations are used in this manuscript: Antisense Oligonucleotide (ASO), Anthrax Toxin (ATx), Antisense oligonucleotides (ASO), Diphtheria toxin a chain (DTA), Early endosome (EE), Emerald GFP (EmGFP), Intraluminal Vesicles (ILV), Late endosome (LE), Lethal factor (N-terminal) (LFn), LFn fused-in-frame with DTA (LFn-DTA), LFn fused-in-frame with PKR (LFn-PKR), Green fluorescent protein (GFP), Multivesicular body (MVB), Phosphoinositide 3-kinases (PI3 kinase), Protective antigen (PA) of 83 KDa (PA83), Protective antigen of 63 KDa (PA63), Plasma Membrane (PM), Post-nuclear Supernatant (PNS) , Red fluorescent protein (RFP), RNA binding domain of protein kinase R (PKR), Small interfering (si) RNA, Tandem Dimeric Tomato (TdTom), Wheatgerm agglutinin (WGA).
References
- Kerr, J.R.; Schneider, C.R.; Recchia, G.; et al. Correlates of intended COVID-19 vaccine acceptance across time and countries: results from a series of cross-sectional surveys. BMJ Open 2021, 11, e048025. [Google Scholar] [CrossRef] [PubMed]
- Jo, S.J.; Chae, S.U.; Lee, C.B.; Bae, S.K. Clinical Pharmacokinetics of Approved RNA Therapeutics. Int. J. Mol. Sci. 2023, 24, 746. [Google Scholar] [CrossRef] [PubMed]
- Lorenzer, C.; Dirin, M.; Winkler, A.-M.; Baumann, V.; Winkler, J. Going beyond the liver: Progress and challenges of targeted delivery of siRNA therapeutics. J. Control. Release 2015, 203, 1–15. [Google Scholar] [CrossRef] [PubMed]
- Dyer, P.; Shepherd, T.; Gollings, A.; Shorter, S.; Gorringe-Pattrick, M.; Tang, C.; Cattoz, B.; Baillie, L.; Griffiths, P.; Richardson, S. Disarmed anthrax toxin delivers antisense oligonucleotides and siRNA with high efficiency and low toxicity. J. Control. Release 2015, 220, 316–328. [Google Scholar] [CrossRef]
- Hirschenberger, M.; Stadler, N.; Fellermann, M.; Sparrer, K.M.J.; Kirchhoff, F.; Barth, H.; Papatheodorou, P. CRISPA: A Non-viral, Transient Cas9 Delivery System Based on Reengineered Anthrax Toxin. Front. Pharmacol. 2021, 12, 770283. [Google Scholar] [CrossRef]
- Verdurmen, W.P.R.; Luginbühl, M.; Honegger, A.; Plückthun, A. Efficient cell-specific uptake of binding proteins into the cytoplasm through engineered modular transport systems. J. Control. Release 2015, 200, 13–22. [Google Scholar] [CrossRef]
- Liao, X.; Rabideau, A.E.; Pentelute, B.L. Delivery of antibody mimics into mammalian cells via anthrax toxin protective antigen. ChemBioChem 2014, 15, 2458–2466. [Google Scholar] [CrossRef]
- Feron, B.K.L.; Gomez, T.; Youens, N.C.; et al. Antiviral siRNA Delivered Using Attenuated, Anthrax Toxin Protects Cells from the Cytopathic Effects of Zika Virus. Virus Genes 2025, in press. [Google Scholar] [CrossRef]
- Eden, E.R.; Huang, F.; Sorkin, A.; Futter, C.E. The role of EGF receptor ubiquitination in regulating its intracellular traffic. Traffic 2011, 13, 329–337. [Google Scholar] [CrossRef]
- Abrami, L.; Lindsay, M.; Parton, R.G.; Leppla, S.H.; van der Goot, F.G. Membrane insertion of anthrax protective antigen and cytoplasmic delivery of lethal factor occur at different stages of the endocytic pathway. J. Cell Biol. 2004, 166, 645–651. [Google Scholar] [CrossRef]
- Jiang, J.; Pentelute, B.; Collier, J.; Zhou, Z.H. Atomic Structure of Anthrax protective antigen pore elucidates toxin translocation. Nature 2015, 521, 545–549. [Google Scholar] [CrossRef]
- Milne, J.C.; Blanke, S.R.; Hanna, P.C.; Collier, R.J. Protective antigen-binding domain of anthrax lethal factor mediates translocation of a heterologous protein fused to its amino- or carboxy-terminus. Mol. Microbiol. 1995, 15, 661–666. [Google Scholar] [CrossRef] [PubMed]
- Muraki, M.; Ishimura, M.; Harata, K. Interactions of wheat-germ agglutinin with GlcNAcβ, 6Gal sequence. Biochim. Biophys. Acta 2002, 1569, 10–20. [Google Scholar] [CrossRef]
- Shorter, S.; Pettit, M.W.P.; Dyer, P.D.R.; et al. Green Fluorescent Protein (GFP): is seeing believing and is that enough? J. Drug Target. 2017, 25, 1–26. [Google Scholar] [CrossRef]
- Richardson, S.C.W.; Winistorfer, S.C.; Poupon, V.; Luzio, J.P.; Piper, R.C. Mammalian Late Vacuole Protein Sorting Orthologues Participate in Early Endosomal Fusion and Interact with the Cytoskeleton. Mol. Biol. Cell 2004, 15, 1197–1210. [Google Scholar] [CrossRef]
- Patki, V.; Virbasius, J.; Lane, W.S.; Toh, B.H.; Shpetner, H.S.; Corvera, S. Identification of an early endosomal protein regulated by phosphatidylinositol 3-kinase (wortmannin). Proc. Natl. Acad. Sci. USA 1997, 94, 7326–7330. [Google Scholar] [CrossRef]
- Bright, N.A.; Reaves, B.J.; Mullock, B.M.; Luzio, J.P. Dense core lysosomes can fuse with late endosomes and are re-formed from the resultant hybrid organelles. J. Cell Sci. 1997, 110, 2027–2040. [Google Scholar] [CrossRef]
- Sava, I.; Davis, L.J.; Gray, S.R.; Bright, N.; Luzio, J.P. Reversible assembly and disassembly of V-ATPase during the lysosome regeneration cycle. Mol. Biol. Cell 2024, 35, 1–15. [Google Scholar] [CrossRef]
- Babst, M. MVB Vesicle Formation: ESCRT-Dependent, ESCRT-Independent and Everything in Between. Curr. Opin. Cell Biol. 2011, 23, 452–457. [Google Scholar] [CrossRef] [PubMed]
- Richardson, S.C.W.; Wallom, K.L.; Ferguson, E.L.; Deacon, S.P.E.; et al. The use of fluorescence microscopy to define polymer localisation to the late endocytic compartments in cells that are targets for drug delivery. J. Control. Release 2008, 127, 1–11. [Google Scholar] [CrossRef] [PubMed]
- Richardson, S.C.W.; Patrick, N.G.; Lavignac, N.; et al. Intracellular fate of bioresponsive poly(amidoamine)s in vitro and in vivo. J. Control. Release 2010, 142, 78–88. [Google Scholar] [CrossRef] [PubMed]
- Corrotte, M.; Fernandes, M.C.; Tam, C.; Andrews, N.W. Toxin Pores Endocytosed During Plasma Membrane Repair Traffic into the Lumen of MVBs for Degradation. Traffic 2011, 13, 483–494. [Google Scholar] [CrossRef]
- Abrami, L.; Leppla, S.H.; van der Goot, F.G. Receptor palmitoylation and ubiquitination regulate anthrax toxin endocytosis. J. Cell Biol. 2006, 172, 309–320. [Google Scholar] [CrossRef]
- Abrami, L.; Brandi, L.; Moayeri, M.; Brown, M.J.; et al. Hijacking multivesicular bodies enables long-term and exosome-mediated long-distance action of anthrax toxin. Cell Rep. 2013, 5, 986–996. [Google Scholar] [CrossRef] [PubMed]
- Sergeeva, O.; van der Goot, F. Converging physiological roles of the anthrax toxin receptors. F1000Research 2019, 8, 1415. [Google Scholar] [CrossRef] [PubMed]
- Feron; Richardson. WO2020030923 - Method for Preparing Liposomes. PCT/GB2019/052239, 2019.
- Arnold, A.E.; Smith, L.J.; Beilhartz, G.L.; Bahlmann, L.C.; et al. Attenuated diphtheria toxin mediates siRNA delivery. Sci. Adv. 2020, 6, eaaz4848. [Google Scholar] [CrossRef]
- Huotari, J.; Helenius, A. Endosome maturation. EMBO J. 2011, 30, 3481–3500. [Google Scholar] [CrossRef]
- Brown, M.J.; Thoren, K.L.; Krantz, B.A. Role of the α Clamp in the Protein Translocation Mechanism of Anthrax Toxin. J. Mol. Biol. 2015, 427, 3340–3349. [Google Scholar] [CrossRef]
- Moghimi, S.M.; Symonds, P.; Murray, J.C.; Hunter, C.; Debska, G.; Szewczyk, A. A two-stage poly(ethylenimine)-mediated cytotoxicity: implications for gene transfer/therapy. Mol. Ther. 2005, 11, 990–995. [Google Scholar] [CrossRef]
- Richardson, S.C.W.; Kolbe, H.V.J.; Duncan, R. Potential of low molecular mass chitosan as a DNA delivery system: biocompatibility, body distribution and ability to complex and protect DNA. Int. J. Pharm. 1999, 178, 231–243. [Google Scholar] [CrossRef]
- Sinden, R.R.; Pearson, C.E.; Potaman, V.N.; Ussery, D.W. DNA: Structure and Function: In Advances in Genome Biology; JAI Press: Greenwich, CT, USA, 1998. [Google Scholar] [CrossRef]
- Beaufay, H.; de Duve, C. The hexosephosphatase system. VI. Attempted fractionation of microsomes containing glucose-6-phosphatase. Bull. Soc. Chim. Biol. 1954, 36, 1551–1568. [Google Scholar]
- Zerial, M.; Melancon, P.; Schneider, C.; Garoff, H. The transmembrane segment of the human transferrin receptor functions as a signal peptide. EMBO J. 1986, 5, 1543–1550. [Google Scholar] [CrossRef] [PubMed]
- Gilleron, J.; Querbes, W.; Zeigerer, A.; Borodovsky, A.; et al. Image-based analysis of lipid nanoparticle–mediated siRNA delivery, intracellular trafficking and endosomal escape. Nat. Biotechnol. 2013, 31, 638–646. [Google Scholar] [CrossRef] [PubMed]
- Dowdy, S.F. Overcoming cellular barriers for RNA therapeutics. Nat. Biotechnol. 2017, 35, 222–229. [Google Scholar] [CrossRef] [PubMed]
- Yang, M.; Jin, H.; Chen, J.; Ding, L.; et al. Efficient Cytosolic Delivery of siRNA Using HDL- Mimicking Nanoparticles. Small 2011, 7, 568–573. [Google Scholar] [CrossRef]
- Hedlund, H.; Du Rietz, H.; Johansson, J.; Zedan, W.; Huang, L.; Wallin, J.; Wittrup, A. Absolute quantification and single-cell dose-response of cytosolic siRNA delivery. Nat. Commun. 2021, 14, 1–75. [Google Scholar] [CrossRef]
- Detzer, A.; Overhoff, M.; Wünsche, W.; Rompf, M.; Turner, J.J.; Ivanova, G.D.; Gait, M.J.; Sczakiel, G. Increased RNAi is related to intracellular release of siRNA via a covalently attached signal peptide. RNA 2009, 15, 627–636. [Google Scholar] [CrossRef]
Figure 1.
Subcellular 32P-Labelled-siRNA Delivery. Panel (a) documents the subcellular distribution of GFP specific, 32P-Labeled-siRNA Delivered using PA::LFn-PKR to HEK293EmGFP-LacZ::RFPCells After 24h (n=3±SD The transfection protocol was carried out as previously described (Dyer et al., 2015) and the subcellular fractionation was performed by separating whole cell lysate into nuclei and PNS by sedimentation at 1500 x g for 2min., at 4oC and then separating the PNS into membrane and crude cytosol fractions by sedimentation at 200 000xg for 60min., at 4oC. For context, cell associated 32P was also documented at each dose of siRNA as this helps explain the non-specific distribution of signal at lower siRNA doses (panel (b)). Panel c shows the subcellular distribution of 32P-labelled siRNA after transfection with PA83::LFn-PKR, Oligofectamine and Lipofectamine 2000 using the stated doses of siRNA. Panel a, statistics: Nuclei: control vs 70nM p= 0.0002 ***, control vs 100nM p= 0.0004 ***, Membrane: control vs 50nM p= 0.0043 **, control vs 70nM p= 0.0045 **, control vs 100nM p= 0.0003 ***, Cytosol: control vs 50nM p= 0.0067 **, control vs 70nM p=<0.0001****, control vs 100nM p= 0.0007 ***, Panel b, control cells: control vs 50nM p= 0.0132 *, control vs 70nM p= 0.0297 *, control vs 100nM p= 0.0003 ***. Panel c, PA::LFn-PKR Membrane, control vs 50nM p= 0.0007 ***, control vs 70nM p= 0.0003 ***, control vs 100nM p=<0.0001 ****, PA::LFn-PKR Cytosol, control vs 50nM p=<0.0001 ****, control vs 70nM p=<0.0001 ****, control vs 100nM p=<0.0001 ****, Oligofectamine membrane, control vs 50nM p= 0.0139 *, control vs 100nM p=<0.0001 ****, Oligofectamine Cytosol, control vs 100nM p=<0.0001 ****, Lipofectamine 2000 membrane, control vs 50nM p= 0.0006 ***, control vs 100nM p= 0.0003 ***, Lipofectamine 2000 cytosol, control vs 50nM p= 0.0001 ***, control vs 100nM p= 0.0448 *.
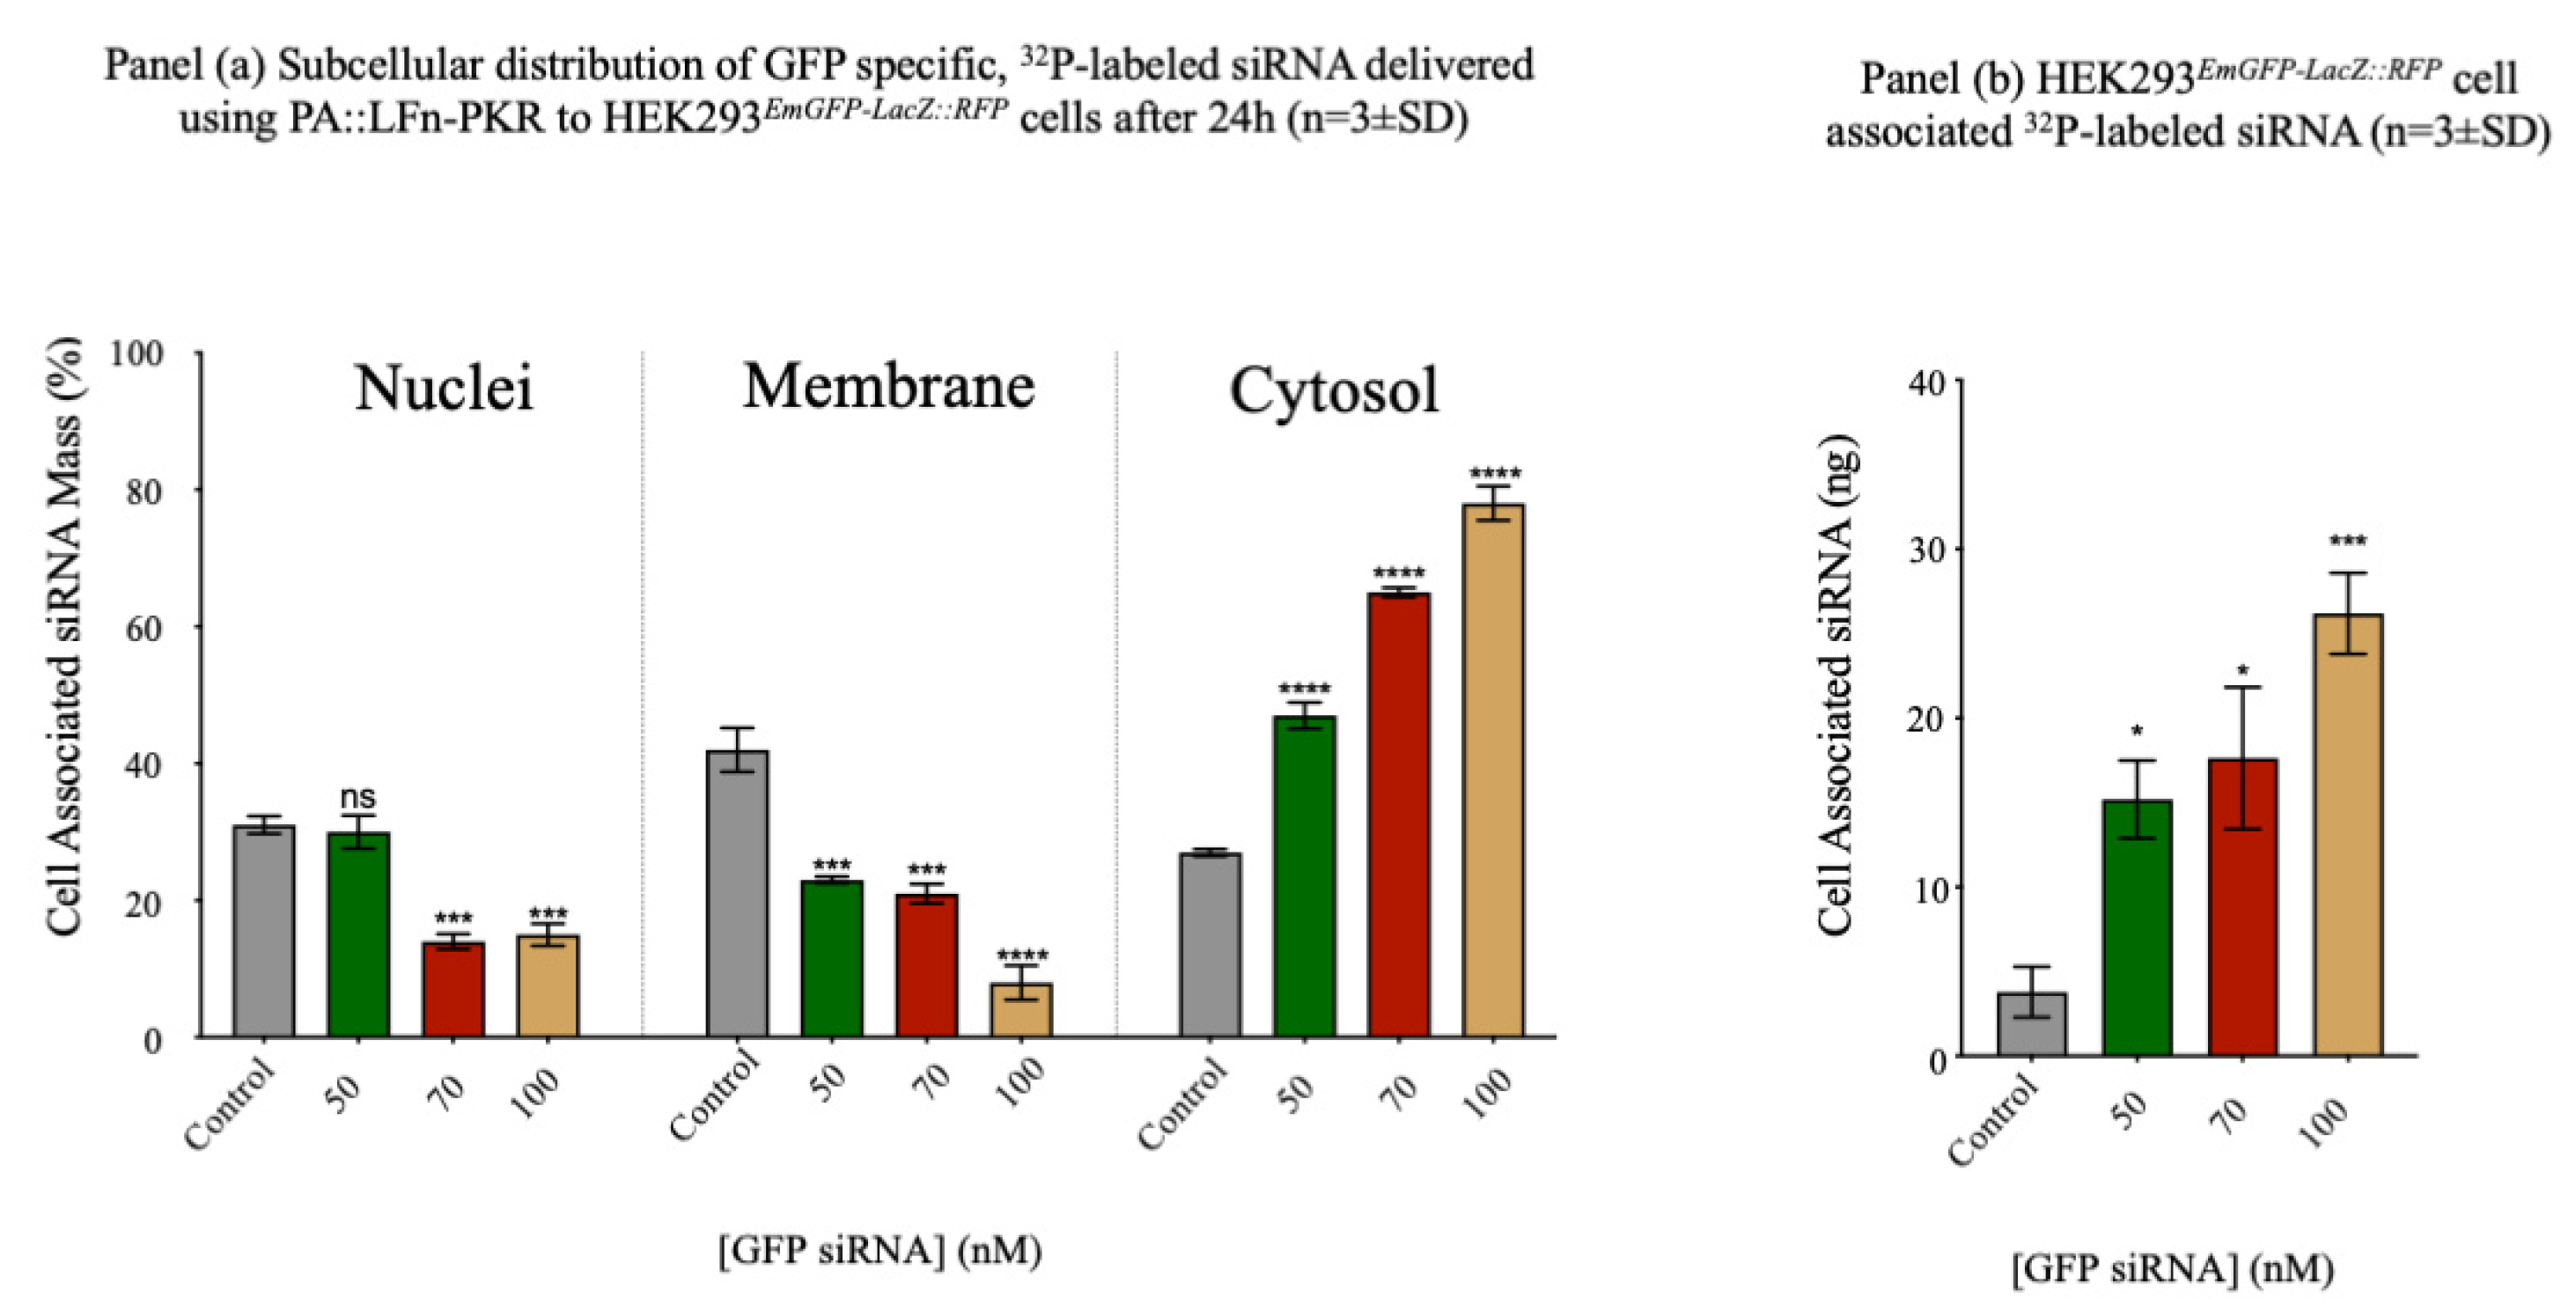
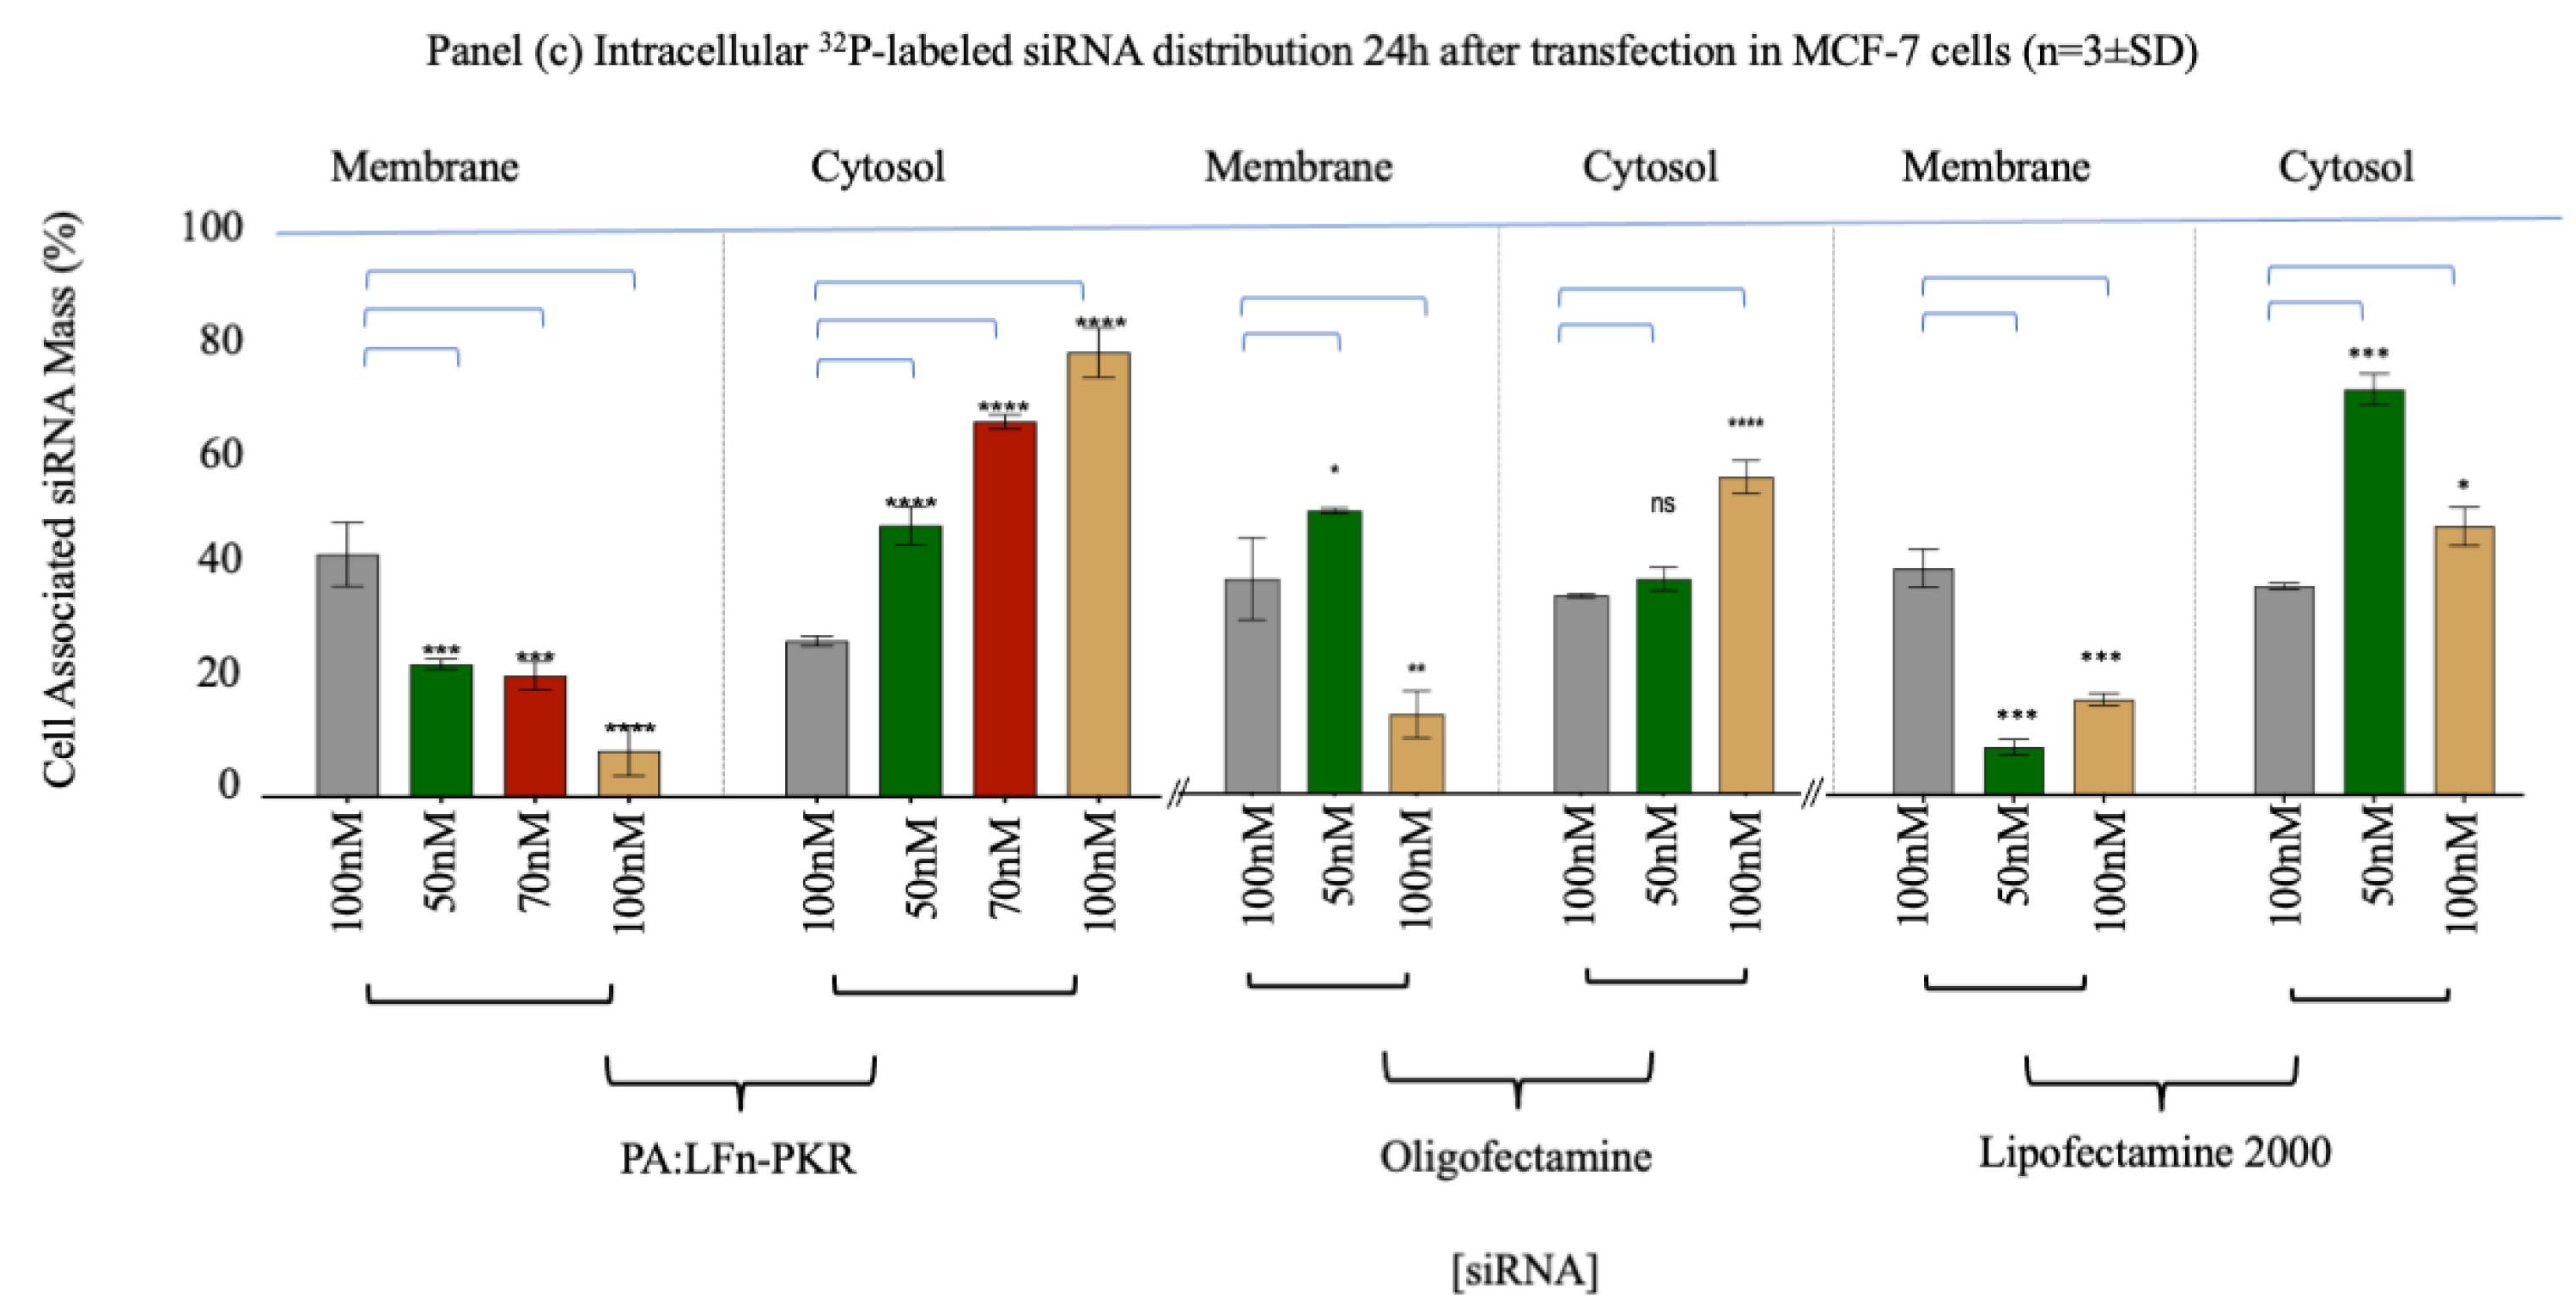
Figure 2.
Characterisation of gene silencing. Panel (a) documents the target knockdown using an anti-STAT3 siRNA after 24h by RT-qPCR in MCF7 cells (n=3±SD) after transfection using a variety of methods including PA83::LFn-PKR, Oligofectamine, Lipofectamine 2000 and Nucleofection using RT-qPCR. Panel (b) documents Gene silencing in MCF7 cells using a STAT3 specific siRNA using Western blotting to monitor STAT3 expression levels relative to a housekeeper (GAPDH). Inset is a representative blot. Statistics: Panel b, control vs 50nM p=0.0028 **, control vs 100nM p=0.0004 ***.
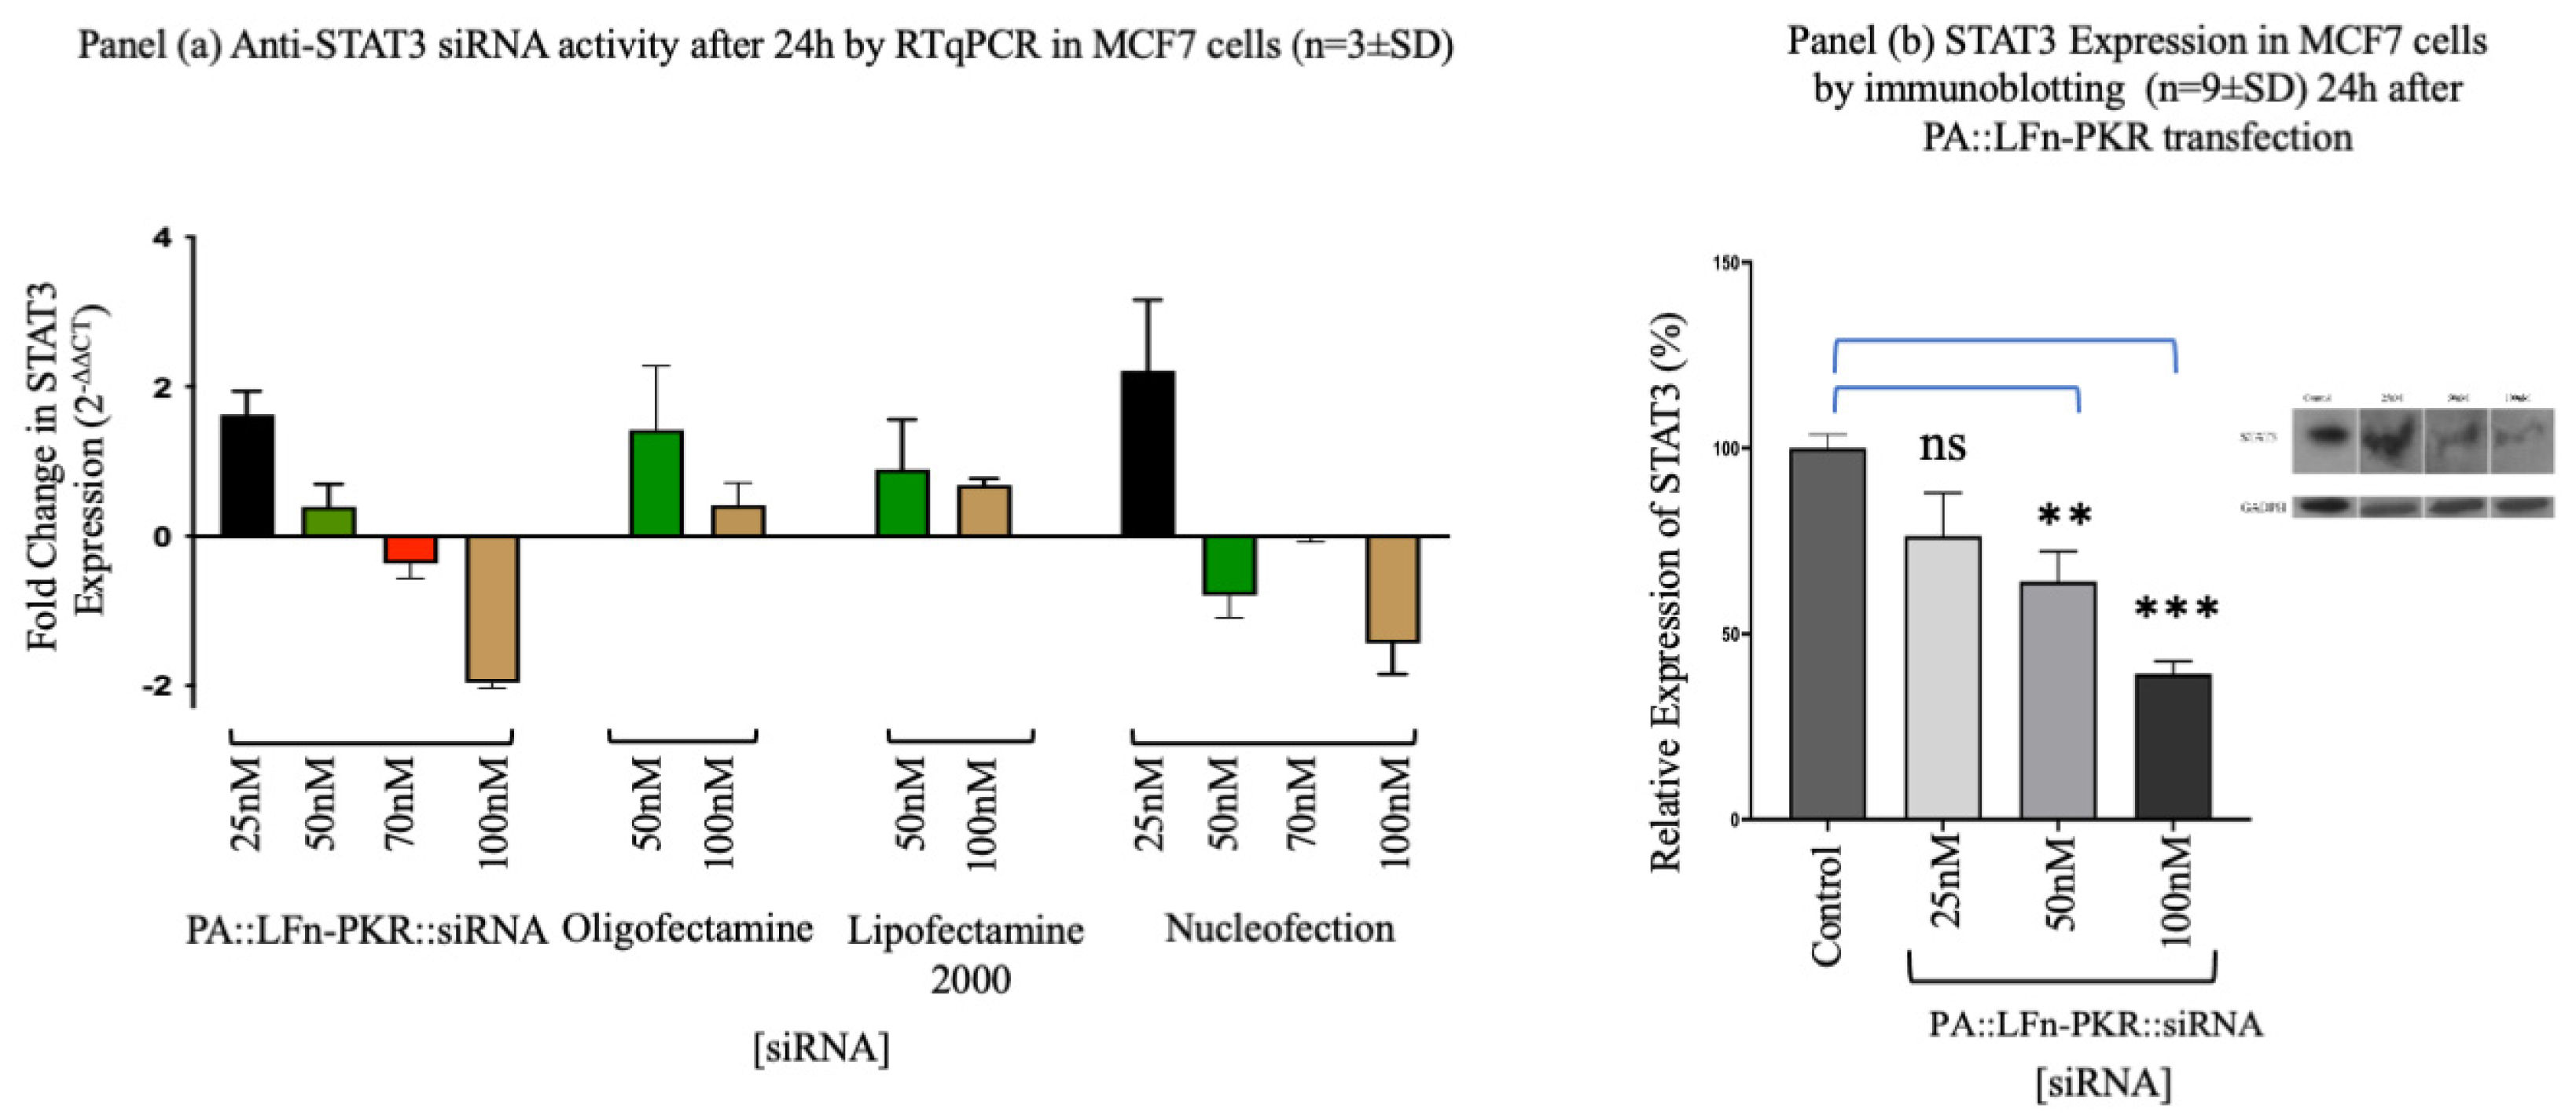
Figure 3.
Assaying aATx Cytosolic Delivery via ILVs. Panel (a) characterises the toxicity profile of LFn-DTA over time in HeLa cells without PA. Panel (b) characterises the toxicity profile of LFn-DTA at a concentration of 10µg/mL and varying amounts of PA after 48h. Panel (c) documents the toxicity profile of varying amounts of LFn-DTA with 5µg/mL of PA83. Inset is a Western blot of the recombinant LFn-DTA used after detection with a 6His specific monoclonal primary antibody and HRP-labelled anti-mouse secondary antibody (panel d). Panel (e) characterises intraluminal vesicles within the late endocytic (LAMP+ve) late endocytic compartment of Vero cells. Panel (f) is representative of the reduction in ILVs in Vero cells after treatment with WGA or sucrose when examined using imunostained cells by confocal microscopy. This disparity is quantified (panel (f)) after treatment with either WGA or sucrose.
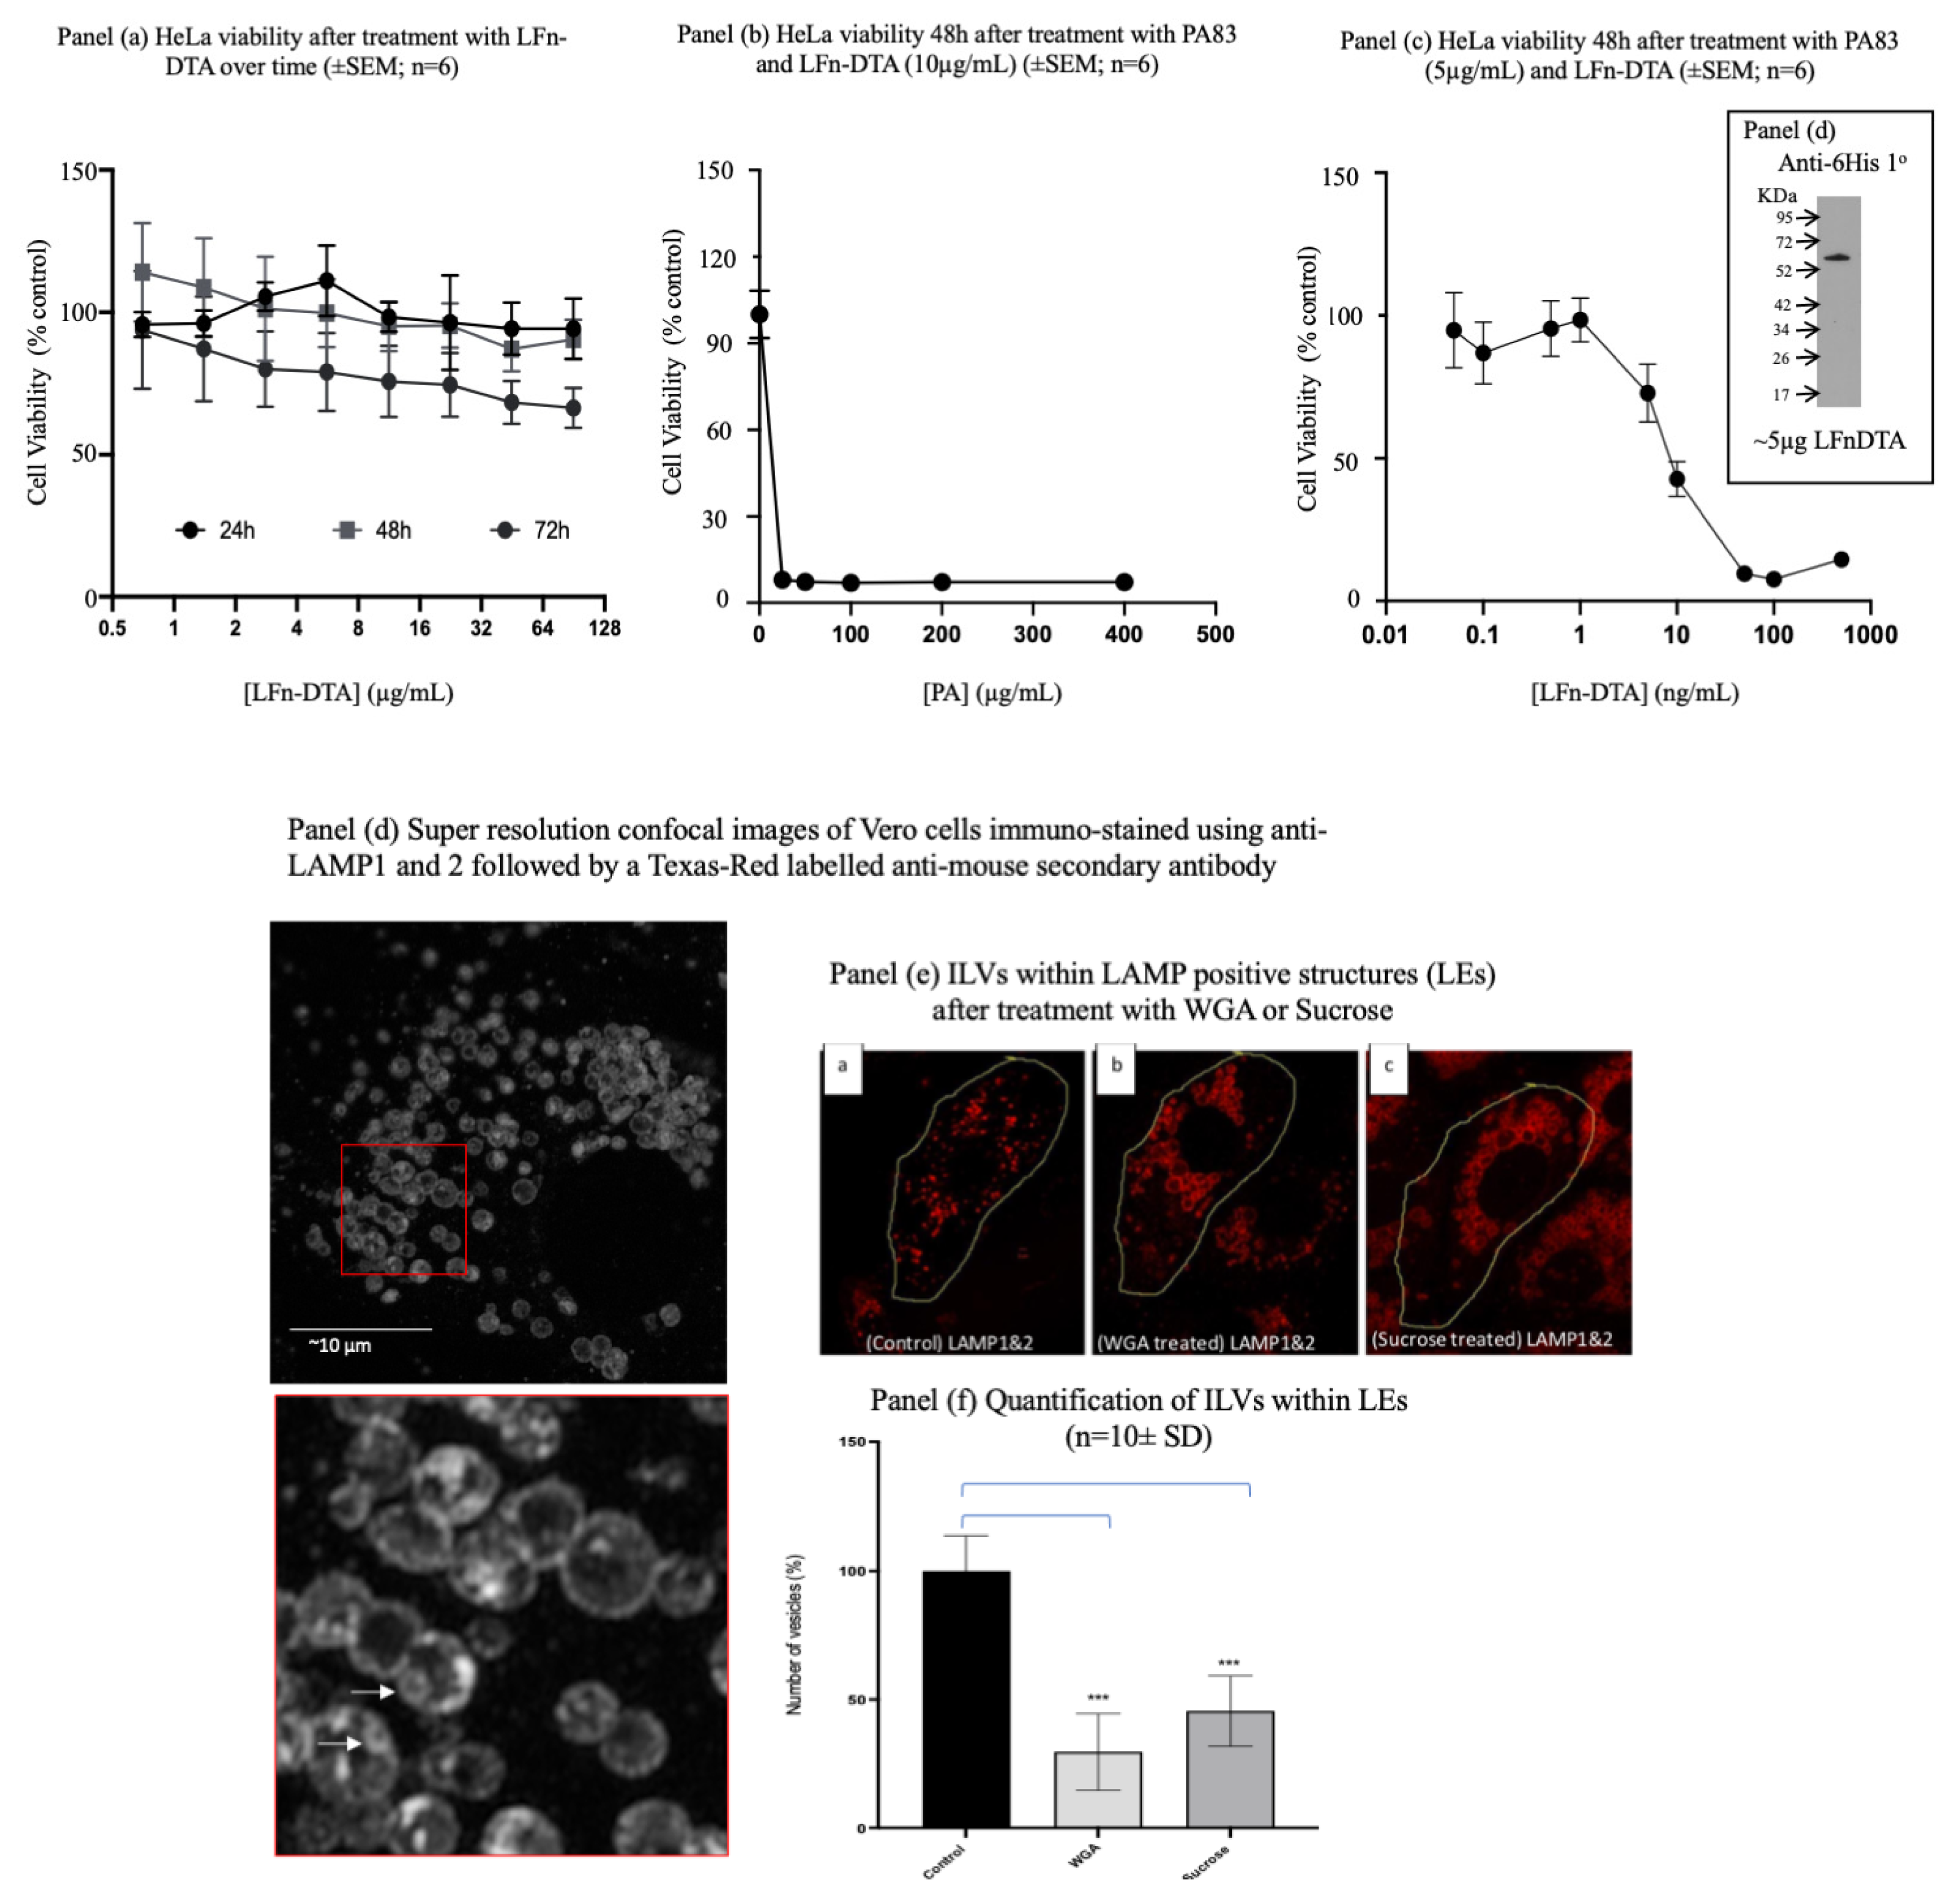
Figure 4.
Assaying the effect of ILV inhibitors upon aATx mediated cytosolic delivery. Here panel (a) records the effect of increasing concentrations of WGA upon PA::LFn-DTA intoxication of HEK293 SC008 cells. As increasing amounts of WGA are added to the assay a significant a reduction in LFn-DTA mediated intoxication was documented. Similar to panel (a), panel (b) documents statistically lower levels of PA::LFn-PKR::siRNA activity in the presence of WGA. When a different inhibitor of ILV biogenesis was used (hypotonic sucrose) a similar result was observed. Panel (c) documents a statistically significant reduction in PA83::LFn-DTA mediated toxicity when increasing concentrations of sucrose are incubated with the cells whereas panel (d) records a sucrose concentration-dependent reduction in siRNA activity. Finally, a more general inhibitor of endocytosis (wortmannin) was also examined and incubated with cells in the presence of PA83 and LFn-DTA. As might be predicted there was also a statistically significant reduction in PA83::LFn-DTA intoxication after treatment with increasing concentrations of wortmannin. Panel (f) examines the effect of wortmannin upon PA83::LFn-PKR::siRNA gene silencing activity. Similar to panel (e) a reduction in gene silencing was recorded at 100nM and 200nM concentrations of wortmannin. Statistics: LFn-DTA assay. 0µg WGA vs 3µg WGA p= 0.0003 ***, 5µg WGA p= 0.0014 **, 10µg WGA p= 0.0029 **, 25µg WGA p= 0.0041 **, 50µg WGA p= 0.0007 ***. Transfection assay: 0µg WGA vs: 3µg WGA p= 0.0216 *, 5µg WGA p= 0.0031 **, 10µg WGA p= 0.0054 **, 25µg WGA p <0.00001 ****, 50µg WGA p=0.0044 **. Sucrose LFn-DTA assay; 0mM sucrose vs: 25mM sucrose p= 0.0001 ***, 50mM sucrose p= 0.0003 ***, 100mM sucrose p <0.0001 ****, 200mM sucrose p < 0.0001 ****. Sucrose transfection assay: 0mM sucrose vs: 100mM sucrose p= 0.0108 *, 200mM sucrose p= 0.0019 **. Wortmannin assay: 0nM wortmannin vs: 25nM wortmannin p= 0.0001 ***, 50nM wortmannin p= 0.0012 **, 100nM wortmannin p< 0001 ****, 200nM wortmannin p< 0001 ****, 300nM wortmannin p< 0001 ****. Transfection assay: 0mM wortmannin vs: 100nM wortmannin p= 0.0130 *, 200nM wortmannin p= 0.0181 *.
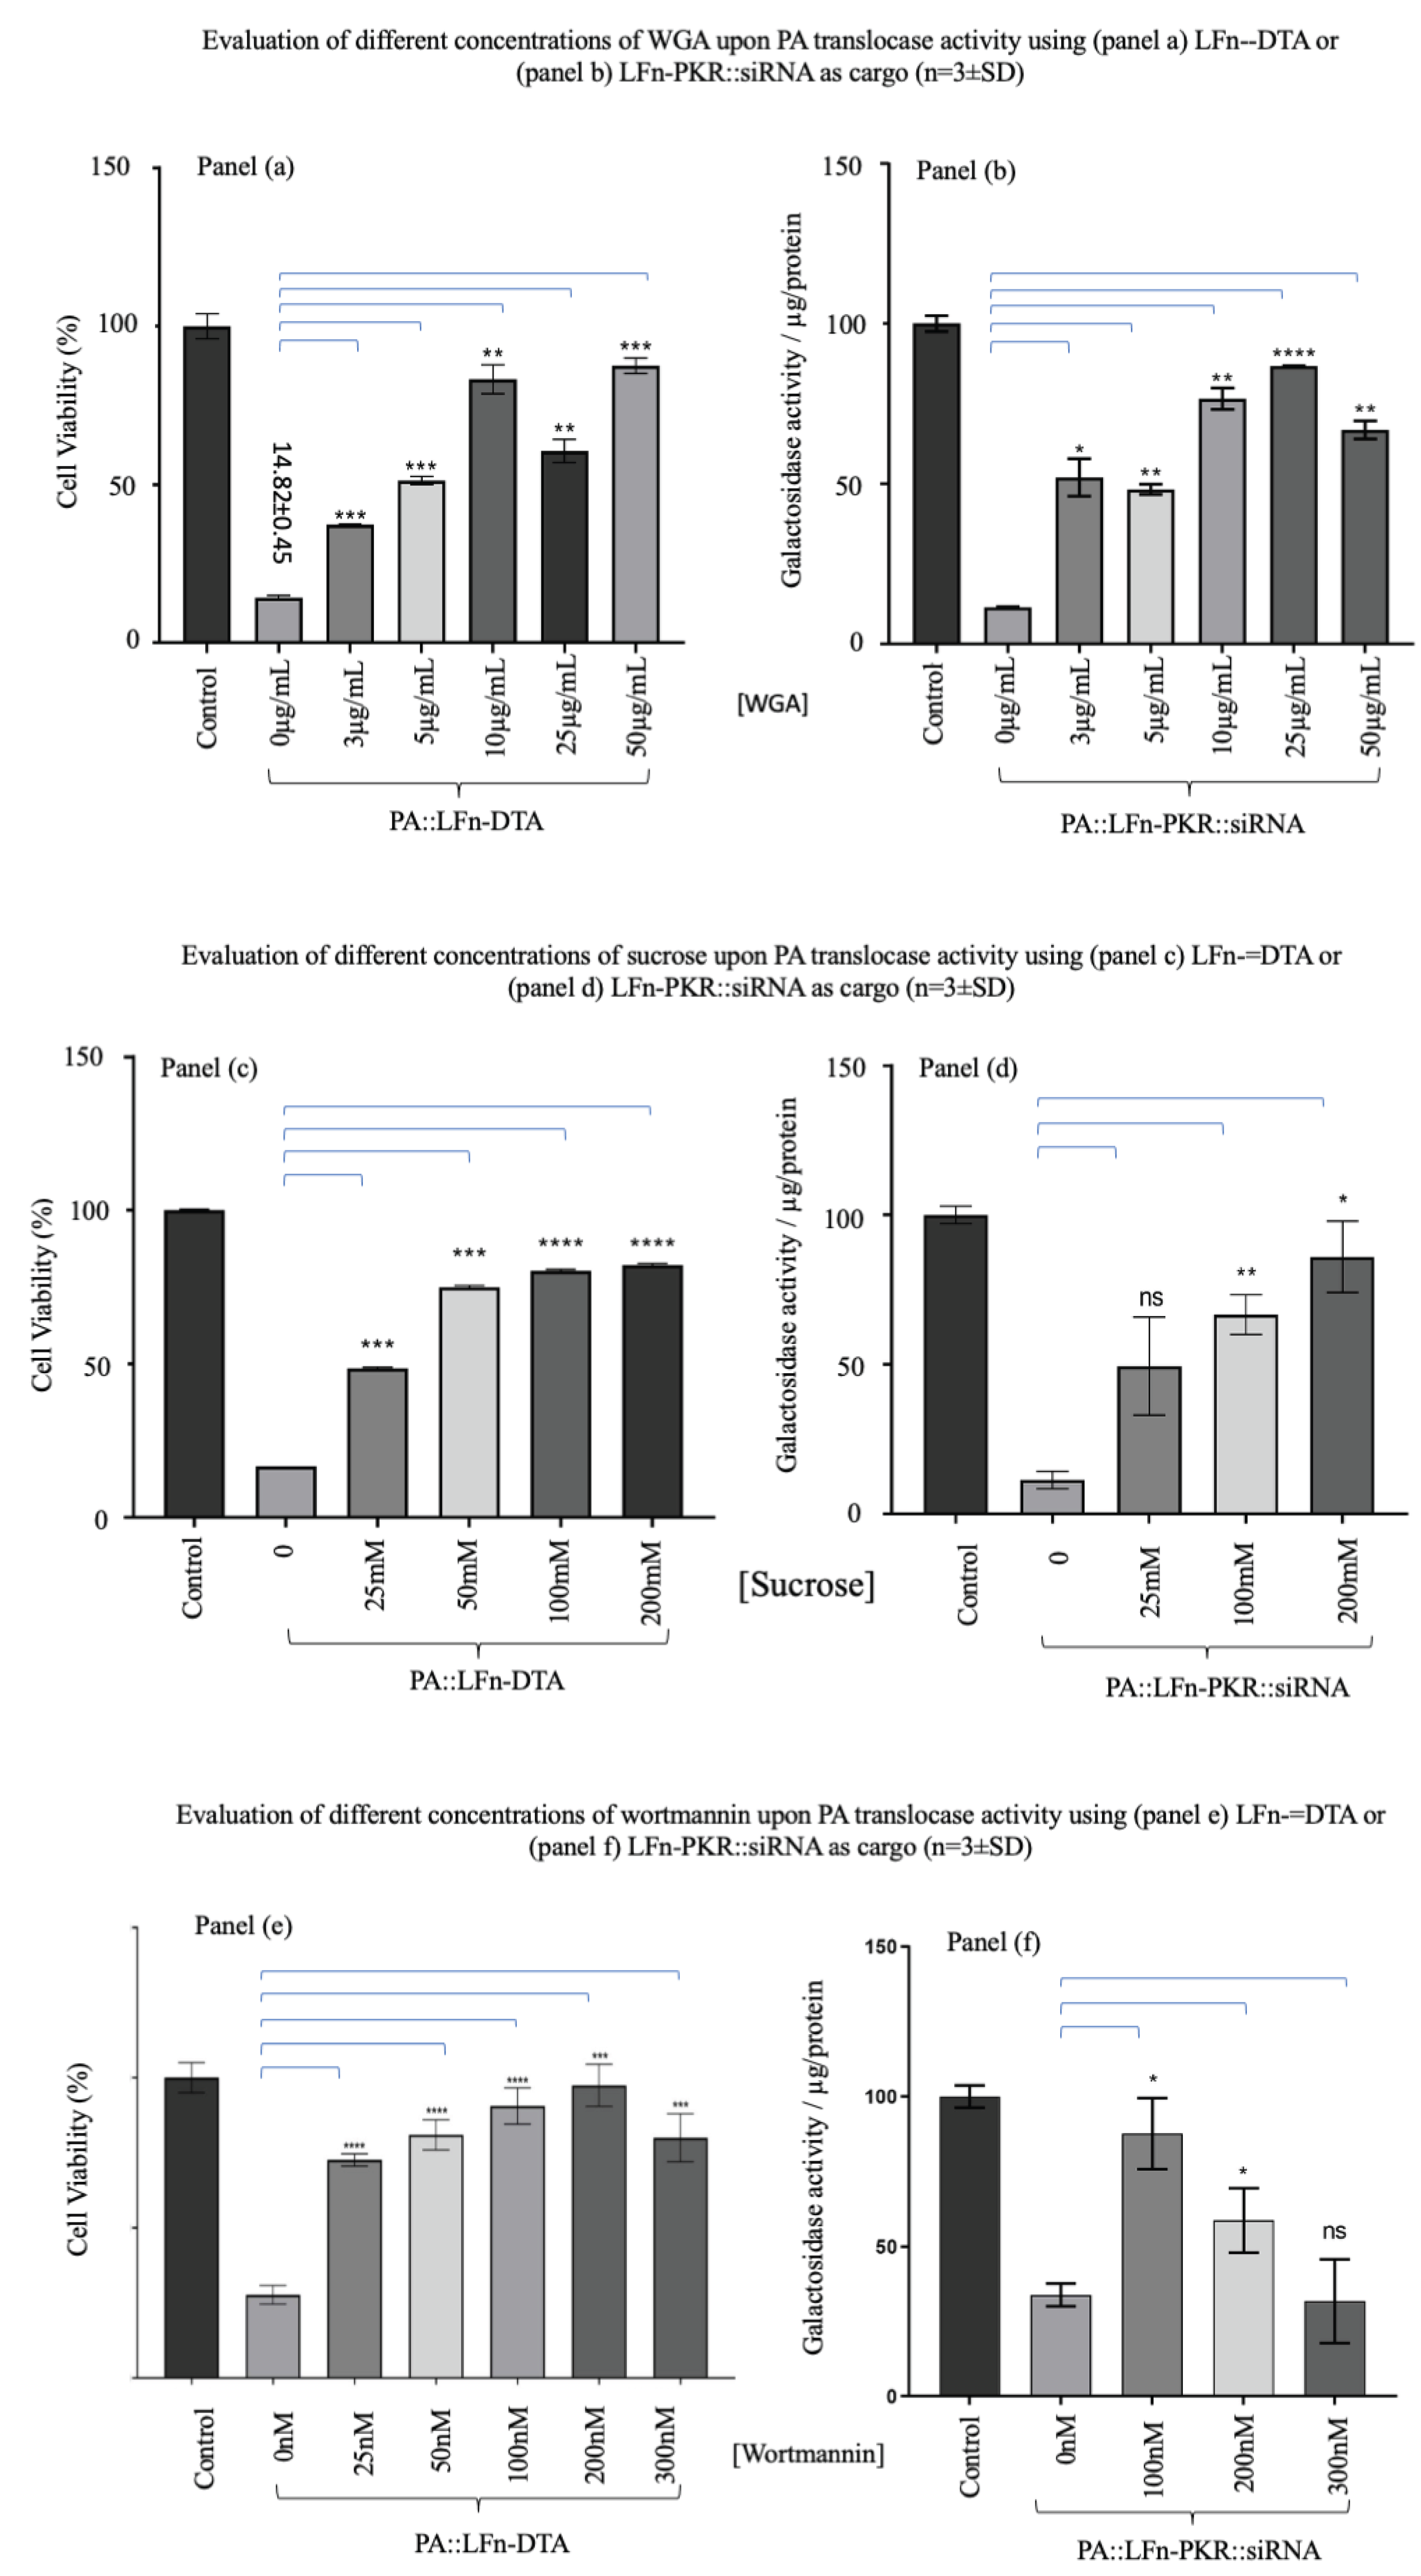
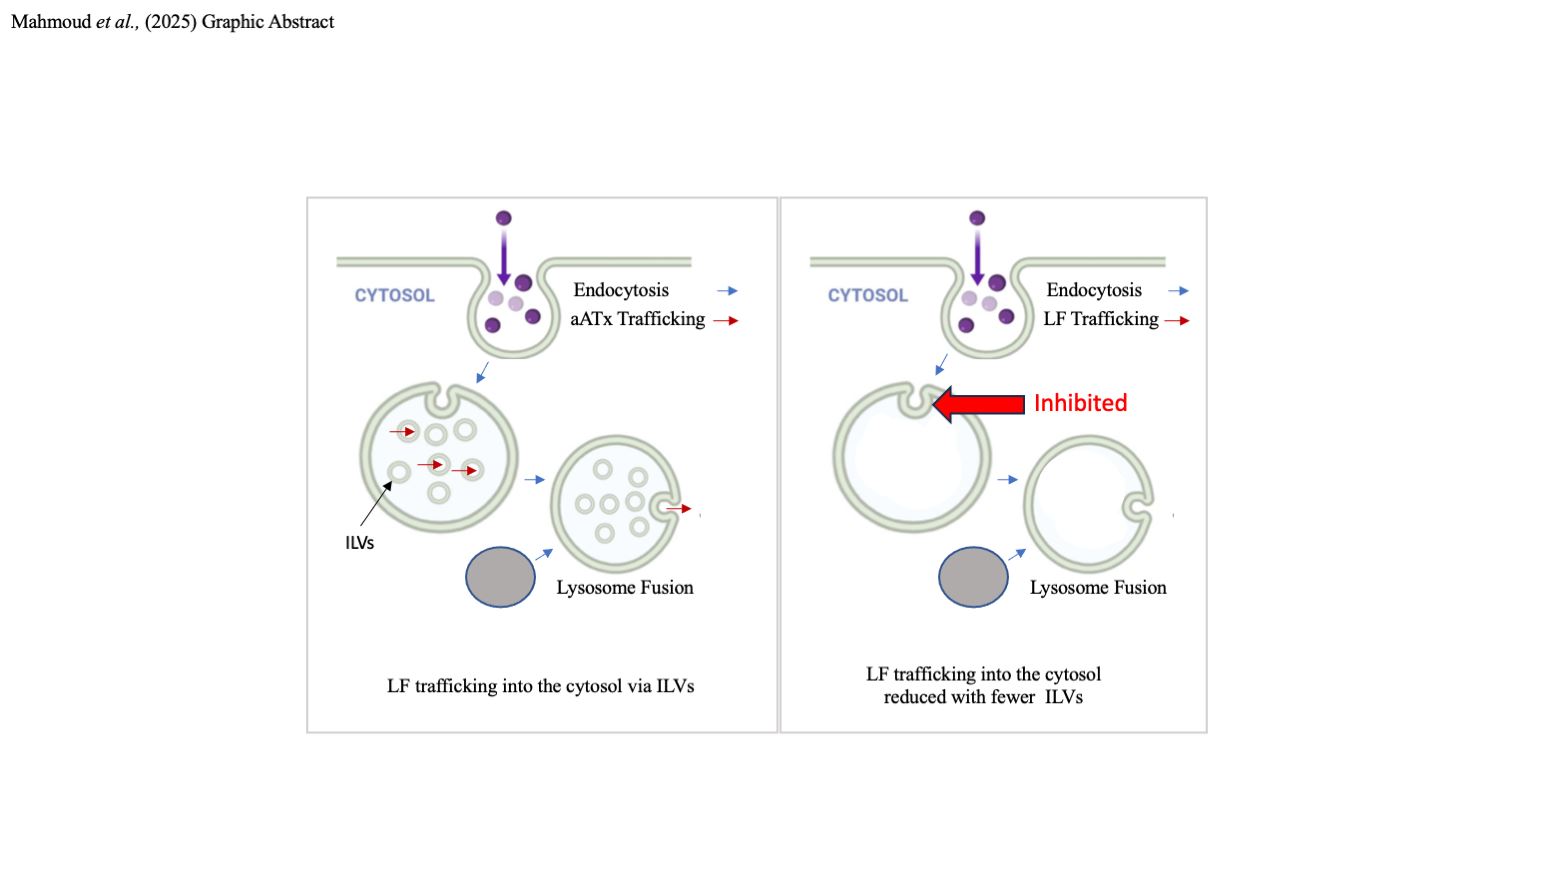
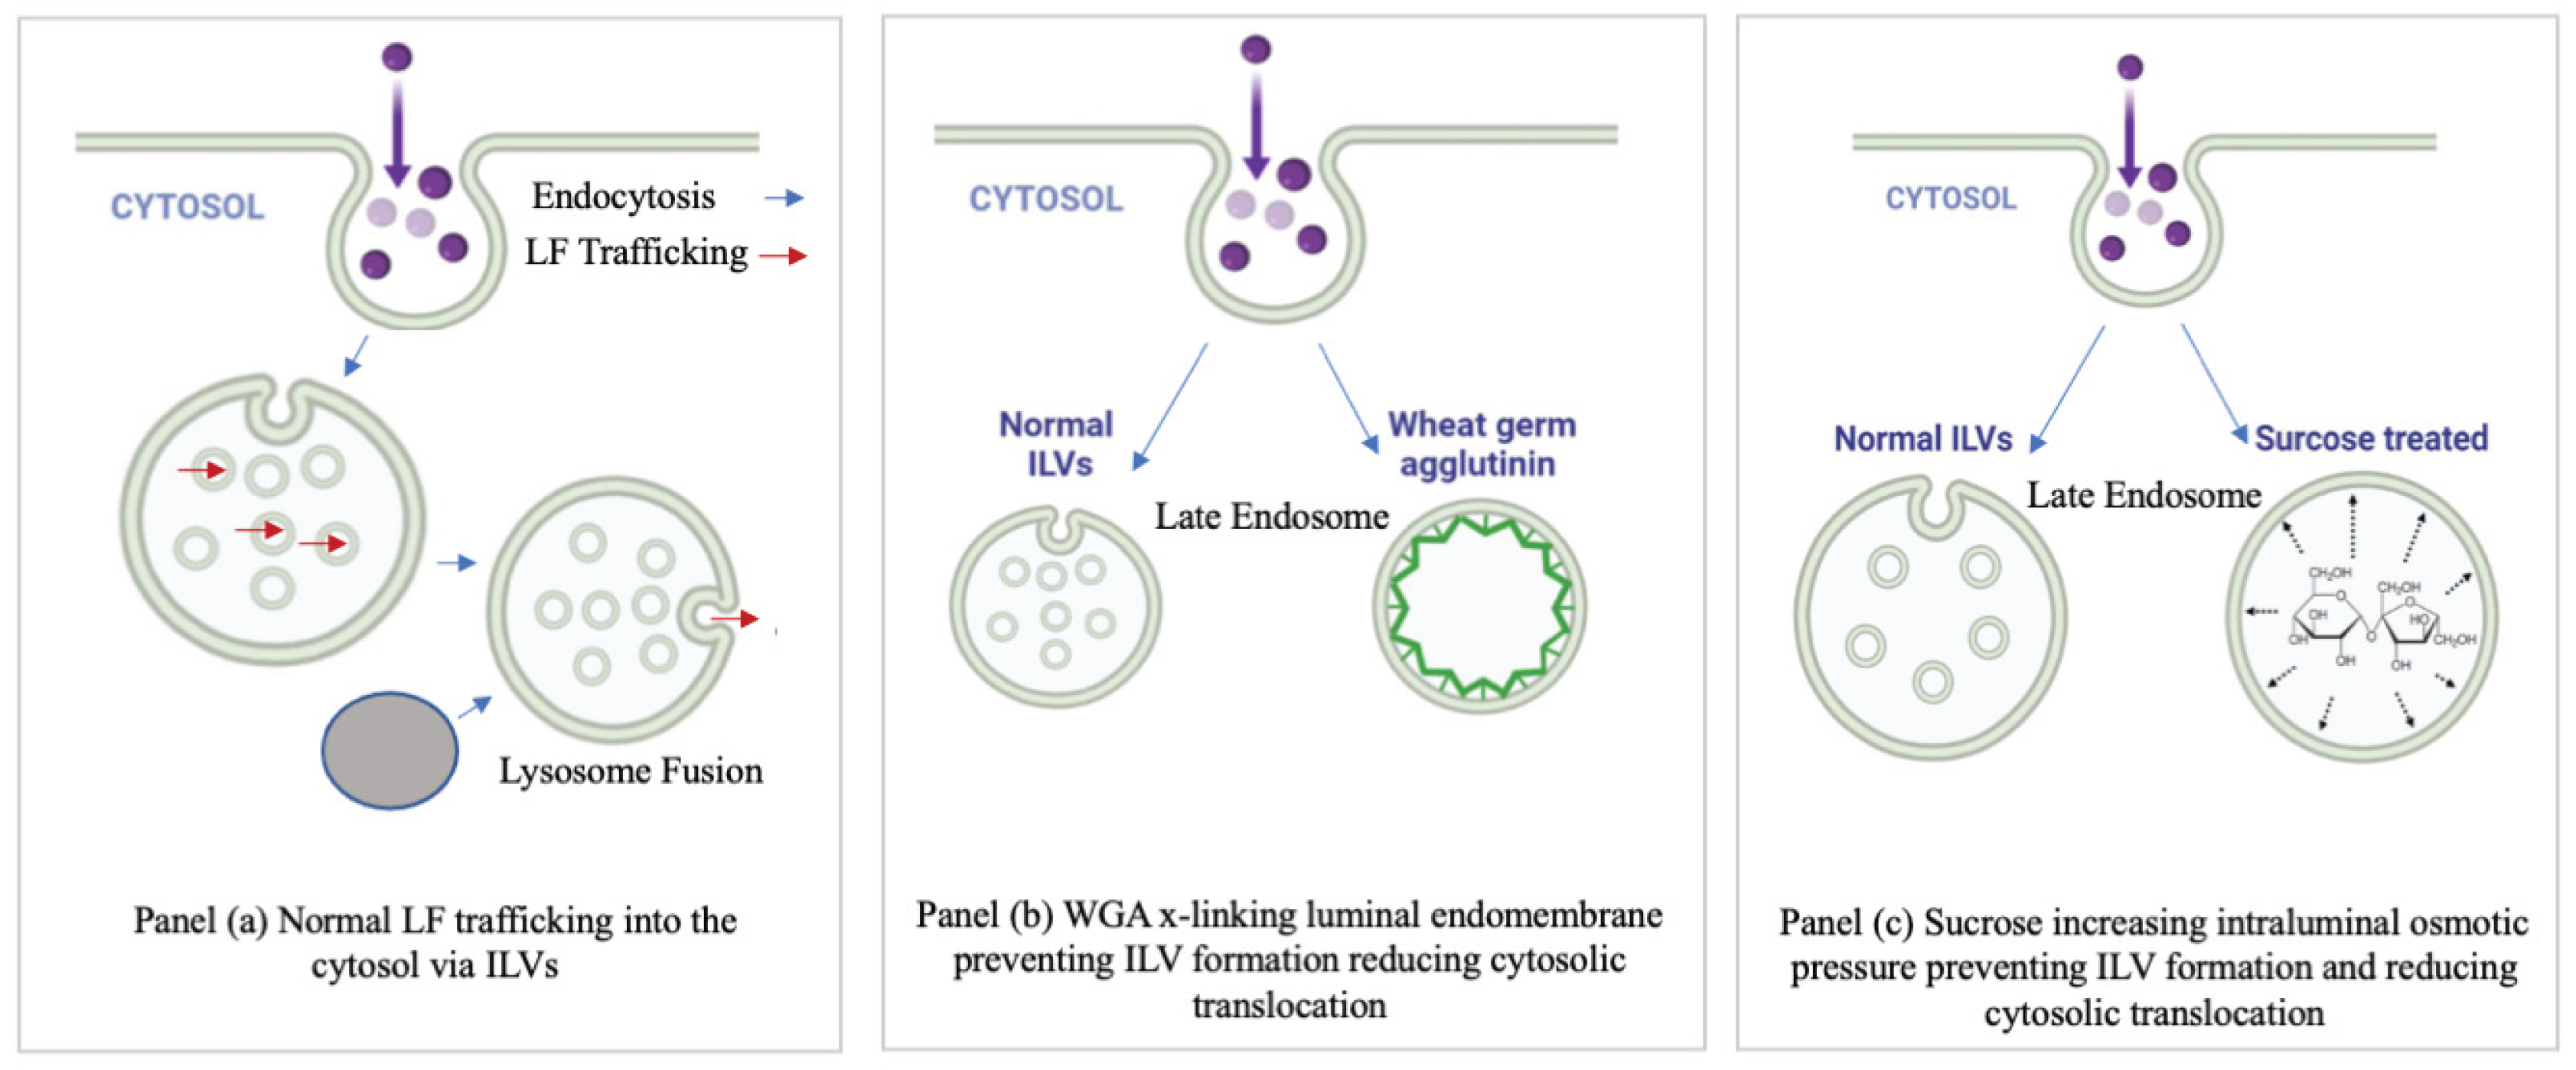
Figure 5.
Proposed mode of inhibitor action. This is a cartoon depicting the proposed mode of inhibition of PA pore translocation in the instance of: no treatment (panel a), (panel (b) WGA and (panel (c)) hypertonic sucrose. This model is based on the published model of ATx lethal toxin pore translocation (Abrami et al., 2004).
Disclaimer/Publisher’s Note: The statements, opinions and data contained in all publications are solely those of the individual author(s) and contributor(s) and not of MDPI and/or the editor(s). MDPI and/or the editor(s) disclaim responsibility for any injury to people or property resulting from any ideas, methods, instructions or products referred to in the content. |
© 2025 by the authors. Licensee MDPI, Basel, Switzerland. This article is an open access article distributed under the terms and conditions of the Creative Commons Attribution (CC BY) license (http://creativecommons.org/licenses/by/4.0/).
Copyright: This open access article is published under a Creative Commons CC BY 4.0 license, which permit the free download, distribution, and reuse, provided that the author and preprint are cited in any reuse.


