
Submitted:
30 October 2025
Posted:
31 October 2025
You are already at the latest version
Abstract
Indoor air quality (IAQ) plays a crucial role in the health, comfort, and productivity of building occupants. In the context of increasing particulate matter (PM 2.5 and PM 10) pollution, this study aimed to analyse the impact of ventilation and filtration systems on particulate concentrations in various indoor environments, including schools, offices, residential buildings, and sports facilities. A comprehensive literature review was conducted, which included experimental and simulation studies, as well as real-world measurement data obtained from sensors monitoring PM, CO2, VOCs, temperature, and humidity. The results indicate that the effectiveness of the filtration systems and proper adjustment of airflow significantly reduce the concentration of PM 2.5 and PM 10, with filters of at least 65 % efficiency (MERV-11 and higher) providing the greatest improvement in air quality. The findings also confirm the significant influence of building location and outdoor conditions (e.g., dust storms, heating season) on measured concentrations. The conclusions highlight the need to implement integrated online IAQ monitoring, develop intelligent ventilation systems, and introduce biodegradable and energy-efficient filtration solutions adapted to the specific characteristics of different types of buildings.
Keywords:
particulate matter
; AQI (Air Quality Index)
; air purification
; office buildings
1. Introduction
The PM 10 and PM 2.5 particles are becoming increasingly important in the context of public health and air quality. It is worth paying attention not only to outdoor pollution but also to the pollutants present indoors. Indoor air can be even more polluted than outdoor air. The impact of these fine particles on human health should not be ignored; they can cause respiratory problems and other diseases. Awareness of the hazards associated with PM 10 and PM 2.5 is the first step toward protecting human health and comfort at work.
PM 10 particles have a diameter of up to 10 micrometres and can penetrate the respiratory tract. PM 2.5, on the other hand, are even smaller particles that can penetrate the lungs and enter the bloodstream. In office environments, pollutants often accumulate from office equipment, building materials, and even furniture [1].
The quality of indoor air is of key importance for human health. Improper indoor air parameters can lead to health problems such as allergies, asthma, or other respiratory diseases. To support the World Health Organisation (WHO), studies on the effects of PM 2.5 and PM 10 particles on human health were carried out. PM 2.5 was found to be significantly associated with all-cause mortality, including deaths due to cardiovascular disease (ischemic heart disease), cerebrovascular disease, respiratory diseases, lower respiratory tract infections, and lung cancer. It was also found that PM 10 contributes to some of these diseases as well [1,2,3,4]. Furthermore, studies have shown that air pollution, including PM 2.5 and PM 10 particles, can increase the spread of deadly diseases such as COVID-19 [5].
Increasing evidence indicates that HEPA filtration (high efficiency particulate air filtration) can reduce PM 2.5 concentrations in indoor environments and provide benefits to cardiovascular health by reducing exposure to particulate matter [6,7,8,9]. Reduction of indoor pollutant concentrations is also influenced by the use of air purifiers and advanced air conditioning systems [10,11,12,13,14,15]. Considering that people spend approximately 90% of their time indoors [16,17], interventions aimed at lowering PM 2.5 concentrations in indoor environments may be an effective way to reduce overall exposure to particulate matter.
The purpose of this article is to review current scientific knowledge on PM (particulate matter) concentrations in indoor environments. This article focusses on discussing the available literature on emission sources, concentration levels, and applied methods to reduce the pollution of particulate matter indoors. Analysis also helps identify research gaps that can serve as a basis for future studies and complement existing scientific projects in this field.
This article provides an important contribution to the development of scientific knowledge on indoor air quality, focussing on the concentrations of PM 2.5 and PM 10 in various types of buildings, residential, educational, sports, office, and historical buildings. The novelty of this work lies in its comprehensive and interdisciplinary approach that combines aspects of environmental engineering, public health, measurement technologies, and technical solutions aimed at improving air quality. The paper summarises and organises research results from various countries, showing differences in emission sources and concentration levels, and identifying contextual factors, such as location, seasonality, type of ventilation, and user activity, that significantly affect pollution levels.
The contribution of this work to science is expressed through the identification of research gaps and the need for further analysis, particularly with respect to the relationship between long-term PM concentration measurements and their real impact on human health and performance. The review of available measurement methods, along with the assessment of their capabilities and limitations, provides added value to both the scientific and engineering communities. The article also highlights the role of innovative solutions in reducing particulate concentrations, such as the use of biodegradable filters and green walls, indicating the directions in which applied research can be developed.
The importance of this article for science comes from its holistic approach to the problem of particulate matter in indoor air. It not only synthesises existing knowledge, but also provides a foundation for developing recommendations for designers, engineers, and decision makers responsible for creating healthy indoor environments. It also serves as a starting point for further studies on the effects of particulates on sensitive groups, such as children and office workers, and on the effectiveness of innovative air quality improvement technologies.
Therefore, this paper is an important contribution to the ongoing discussion on sustainable construction and public health, and its interdisciplinary character strengthens its scientific value.
2. Methodology
This study includes scientific papers on the concentration of particulate matter in indoor environments. The review covers publications that discuss the impact of PM concentrations on human health, applied measurement technologies, and strategies to reduce high levels of particulate matter indoors. Studies based solely on Indoor Air Quality (IAQ) modelling were excluded from the analysis. Publications that exclusively address particulate matter in outdoor environments were also excluded.
The literature search was conducted in major scientific databases, such as Web of Science and Scopus. The selection of databases was based on their interdisciplinary nature and broad thematic coverage in the fields of environmental engineering, indoor comfort, and ventilation systems. The search strategy relied on the use of keyword combinations related to the main research topics, in this case: indoor environment, particulate matter, PM 2.5, and PM 10. Additional criteria included information on the measurement devices used and the methods applied to reduce particulate matter concentrations. The selection process involved analysing the titles and abstracts, followed by full - text evaluation for studies that met the inclusion criteria. Publications that did not meet the thematic requirements were excluded.
The publications collected were systematically analysed to create tables and summaries. Finally, the data from selected papers were organised and grouped into thematic categories. The results were also presented in descriptive form, which allowed the identification of research gaps and the determination of main directions for future studies.
3. Results
3.1. Particulate Matter PM 2.5 and PM 10 in Indoor Environments
3.1.1. Air Pollution Concentration and Its Impact on Human Health
WHO has shown that poor air quality contributes to chronic respiratory diseases among urban residents [1]. There is a clear relationship between staying in indoor environments with polluted air and mortality. Fine particles PM 2.5 (≤2.5 m aerodynamic diameter) are currently recognised as the main risk indicator in the IAQ indices [18,19]. These compounds penetrate the human body and can cause lung damage. Studies conducted in various cities around the world have examined the correlation between PM 2.5 concentration and chronic obstructive pulmonary disease (COPD). In Massachusetts (USA), individuals diagnosed with lung disease were shown to be exposed to low levels of PM 2.5, resulting in reduced lung function [19,20]. In cities such as Helsinki, Athens, Amsterdam, Birmingham, New York, and Seattle, research did not confirm a direct correlation between PM 2.5 concentration and lung diseases [19,21,22]. However, in Mexico City, a significant increase in coughing and sputum production was observed with each 10 µg·m-3 increase in personal exposure to PM 2.5 [19,23].
The Environmental Protection Agency (EPA) regulates both outdoor and indoor air quality. According to the EPA, indoor pollution levels can be up to 100 times higher than outdoors and are classified as one of the top five environmental threats to public health. There is a strong correlation between air quality and human health, which is why obtaining a complete history of environmental exposure from patients is crucial [24,25]. Health problems resulting from poor indoor air quality are difficult to diagnose and may affect a person’s health even years after exposure. More research is needed to address the growing number of new pollutants and their possible side effects. It is also important to better define the effects of volatile organic compounds (VOCs) and the impact of poor indoor air quality on healthcare costs [26].
3.1.2. Air Pollution Concentration in Residential Buildings
A year-long study of PM 2.5 concentrations in both outdoor and indoor air was conducted in the city of Larissa, Greece [19]. Indoor air monitoring was performed in residential buildings located near intersections and in suburban areas. Lung function was assessed using measurements of maximum expiratory flow (PEF) and symptoms such as wheezing and coughing, which worsened over periods longer than 14 days. The monitoring network consisted of ten GreenYourAir Device 1178/PM 2.5 sensors installed inside and outside the buildings. The results were recorded every three minutes for 24-hour cycles, collecting more than five million measurements. The study was carried out between November 15, 2021, and November 15, 2022. The results showed that the average annual indoor PM 2.5 concentration was 63.89 µg·m-3 [19], which is approximately 13 times higher than the standard limit. Indoor PM2.5 levels were higher near fireplaces (459 µg·m-3) [19] or in areas affected by tobacco smoke. In homes using biomass for heating, PM2.5 concentrations reached 225 µg·m-3 [19]. A negative effect of PM 2.5 on PEF was recorded, attributed to the chemical composition of the particles produced during biomass combustion. Lung function also deteriorated during the fall. Exposure to PM 2.5 in home microenvironments was significantly associated with wheezing. The study coincided with the COVID-19 pandemic, which may explain the weak correlation between the increase in PM 2.5 and the incidence of lung disease [19].
Park et al. [27] studied how the type of water (for example, tap, mineral, filtered, distilled) and the humidification method (ultrasonic vs. natural humidifiers) affect the concentration of PM 2.5 in domestic environments - specifically the ‘white dust’ generated by humidifiers. The experiment was carried out in a room of 3.8 m × 2.95 m × 2.8 m in South Korea. Before the test, room temperature was maintained at 24 °C, air conditioning filters were removed, humidity was reduced below 40 %, and the baseline dust concentration was kept below 10 µg·m-3 using an air purifier. The study showed that ultrasonic humidifiers strongly disperse minerals from the water, generating very high concentrations of PM 2.5. In small rooms, PM 2.5 levels reached 350 µg·m-3 [27]. Using distilled water almost completely eliminated the problem. Evaporative humidifiers naturally did not generate white dust regardless of water type [27].
In Jiaotong University dormitories in central Beijing, indoor air quality was measured using Qingping Air Monitor Lite and Sampler ARA N-FRM devices [28]. Each dorm room (15 m2) was occupied by one student. National PM 2.5 measurements were taken using reference instruments, such as tapered element oscillating microbalances (TEOM). The results showed that PM 2.5 concentrations at night were significantly lower than daytime levels, which closely matched outdoor conditions. The highest concentrations occurred during meal preparation in adjacent rooms. During the absence of the student, the CO2/PM 2.5 ratio ranged from 30 to 45 ppm·m3·µg-1 [28]. The office rooms on the 14th floor, far from pollution sources, had PM 2.5 levels about three times lower than nearby outdoor monitoring stations 3 km away. In winter, with closed windows, indoor PM 2.5 levels were around 11 µg·m-3, three times lower than outdoors. When the windows were opened, the concentrations increased. In dormitory rooms, PM 2.5 levels during the heating season were 17 µg·m-3 [28], again lower than outdoor levels. Cafeteria emissions during lunch hours were a significant source of PM 2.5 [28].
Kadiri et al. [29] studied 73 households of elderly asthma patients in Lowell, Massachusetts (USA), to determine PM 2.5 and NO2 levels in homes with gas stoves. Measurements were taken for 5 to 7 days between December 2020 and July 2022, along with environmental and survey data. The mean indoor PM 2.5 concentration was 16.2 µg·m-3 [29].
Indoor levels were significantly higher than outdoor levels (for both NO2 in all seasons and PM 2.5 in all except summer). The study showed that the use of the stove (p = 0.71) and the type of stove (p = 0.3) did not significantly influence the levels of PM 2.5, both p-values were much higher than the usual 0.05 threshold, indicating that there was no statistical significance [29].
Significant influencing factors included [29]:
- -
- frequent use of an air fresheners (6-7 days a week) (p = 0.0016),
- -
- living near a gas station (< 0.5 miles) (p = 0.01),
- -
- season - lower PM 2.5 in summer than in winter (p = 0.03).
High indoor concentrations despite low outdoor levels indicated that internal sources were the main contributors to PM 2.5 exposure. Higher winter concentrations were attributed to poor ventilation and intensive heating use. Frequent use of air fresheners increased PM 2.5 and may aggravate asthma symptoms. The kitchen hoods, which are often recirculating, did not reduce the concentrations. The study did not include ventilation systems, apartment size, or cooking methods, which can affect short-term emissions. Gravimetric filters and personal pumps collected aerosol samples throughout the period and then weighed them in laboratories. Sensors recorded stove vibrations and heat, allowing an estimate of active cooking time. Temperature and relative humidity were also monitored. Outdoor NO2 and PM 2.5 levels were obtained from the US EPA monitoring station in Chelmsford, MA, approximately 8 km away [29].
Tham [30] reviewed IAQ studies from 1986 to 2016, synthesising the findings on pollutants (gases, particulates, VOCs), their sources, mechanisms of action, health and cognitive effects, and technical solutions. The review showed how the focus of the research evolved over time: early work (1980s–1990s) emphasised PM 10 and pollutants from tobacco smoke and combustion of domestic fuels. After 1995, the focus shifted to PM 2.5 and ultrafine particles (UFP < 0.1 µm), linked to new toxicological findings. In the 2000s, studies examined secondary particle formation from reactions between ozone and terpenes in cleaning agents and building materials. The review confirmed that indoor PM concentrations are strongly influenced by outdoor infiltration, determined mainly by the air exchange rate (ACH). At the same time, indoor sources (cooking, candles, cleaning) can cause short-term spikes that exceed outdoor levels. Therefore, health risk assessments must consider both infiltration and specific indoor emissions. Numerous epidemiological and experimental studies confirmed the links between PM exposure and respiratory symptoms (cough, wheezing, asthma) [30,31], as well as sick building syndrome (SBS) and building-related diseases (BRI). In the past decade, researchers have also focused on cognitive effects and productivity. Indoor air is not just ‘diluted outdoor air’, it is an active reactive environment. Airtight buildings, reduced ventilation, and new materials improve energy efficiency, but often worsen IAQ. The integration of ventilation, filtration, and air purification strategies in modern and renovated buildings is crucial. Measurement methods evolved from gravimetric filters and photometers to optical particle counters (OPC), scanning mobility particle sizers (SMPS), and real-time chemical analysis techniques such as PTR-MS [30].
- -
- between 1986 and 1995, research focused mainly on PM 10,
- -
- from the mid-1990s, the emphasis shifted to PM 2.5 (20–80 µg·m-3) and ultrafine particles (103–105 particles·cm-3),
- -
- after 2006, the studies also included secondary organic aerosols; typical levels of PM 2.5 decreased (10–50 µg·m-3), and UFP stabilised at 103–104 particles·cm-3.
3.1.3. Air Pollution Concentration in Public-Use Buildings
Today, indoor air quality is extremely important because people spend about 90% of their time in buildings [2]. Sensitive groups include children and adolescents who are subject to compulsory education and spend approximately 30 % of their time in educational facilities. Air pollution, especially the presence of PM 2.5 particle matter, has a significant impact on the health and cognitive abilities of students. The main causes of IAQ problems in school environments are inadequate ventilation and biological, as well as chemical pollutants present in indoor spaces [32,33].
A study on the concentration of particulate matter was carried out in one of the schools located near the Red Sea in Eilat [33]. The building was constructed in 1967. The measurements were carried out throughout May 2023. During this period, a climatic phenomenon, a sandstorm, also occurred. The indoor air quality parameters monitored included temperature (T), relative humidity (RH), carbon dioxide (CO2), and fine particulate matter (PM 2.5). Measurements were taken on four floors, in classrooms with varying numbers of students, located in different parts of the school. The basic constant parameters during which air quality was measured were as follows: air temperature ranged from 17 °C to 33 °C during occupancy hours (8:00 - 14:00), and relative humidity ranged between 20 % and 60 %. The appearance of the sandstorm significantly contributed to the increase in PM 2.5 concentrations within classrooms. This indicates a direct relationship between the indoor environment and the prevailing outdoor meteorological conditions. The results of air pollution measurements, including concentrations of PM 2.5 particle matter, are shown in Figure 2, which presents variations in temperature, relative humidity, PM 2.5, and CO2 levels [33].
In Figure 2, the variations of the measured parameters are presented: temperature (A), relative humidity (B), PM 2.5 particulate matter (C), and carbon dioxide concentration CO2 (D), over a specific time period - in this case, from the 130th to the 160th day of 2023 [33].
The sandstorm influenced both the temperature and the PM 2.5 concentration values, as shown in Figure 2. The concentration increased by approximately 16 %, which confirms the impact of outdoor environmental conditions on the indoor environment [33].
In Figure 3, the values of individual air parameters under extreme conditions (after the sandstorm) are shown as orange bars, and in reference to standard conditions as navy blue bars [33].
In 2023, the average annual concentration of PM 10 measured by the station of the Israeli Ministry of Environmental Protection was 39.9 µg·m-3 [33], with a standard deviation of 26.8 µg·m-3 [33], which is significantly higher than the WHO recommended value of 15 µg·m-3 [33,34]. After analysing the measurements, the ratio of PM 2.5 to PM 10 under normal conditions remained stable; therefore, the annual average concentration of PM 2.5 inside the building was estimated at 10 µg·m-3. This value is double the annual limit recommended by the WHO for PM 2.5, which is 5 µg·m-3 [33,34]. The study also showed that the location of the classroom influenced the concentration of PM 2.5, the highest levels were recorded in the classrooms located on the upper floors [33].
A study was also conducted in a Portuguese secondary school located in the municipality of Ponte de Sor, Portalegre district [35], to determine the correlation between the well-being of teachers and indoor air pollution. The school building was renovated in 2010, when a ventilation and air conditioning system was installed, and new windows (which cannot be opened manually) were installed. Using commercially available sensors, measurements were taken for CO2, VOCs, fine particulate matter (PM 2.5 and PM 10), temperature (T) and relative humidity (RH). The following sensors were used: SCD30 for CO2 (range 400 - 10,000 ppm, accuracy ±30 ppm); MiCS-VZ-89TE for VOC detection (range 0–1000 ppb in isobutylene); HPMA115S0 for monitoring PM 2.5 and PM 10 (range 0–1000 µg·m-3, accuracy 15 %); and SHT31 for temperature and humidity (accuracy ±0.3 °C for T and ±2 % for RH). Measurements were carried out in May 2023 in nine classrooms. Before measurements were taken, teachers completed questionnaires about their subjective well-being. The total mean concentration of PM 2.5 was 19.6 ± 11.6 µg·m-3 [35], ranging from 4.2 ± 0.0 µg·m-3 [35] (class B2, seventh monitored classroom) to 78.0 ± 14.5 µg·m-3 [35] (class C2, twenty-fourth monitored classroom). Taking into account the global WHO guideline of 5 µg·m-3, only 2 % of the measured values were below this threshold [34,35]. For PM 10, the values were 0 ± 17.4 µg·m-3 [35], ranging from 3.5 ± 1.3 µg·m-3 [35] (room B2, seventh classroom) to 96.1 ± 2.9 µg·m-3 [35] (room C3, twentieth classroom). These are average levels below the legal limit of Portugal of 50 µg·m-3 [35,36], with a general mean of around 30 µg·m-3. Regarding teacher perception, the study indicated that the only environmental parameter significantly associated with perceived IAQ was air temperature [35].
To further improve our understanding of indoor air quality, a study was conducted to assess air parameters in schools equipped with green roof systems [37]. The primary school examined is located in Nea Smyrni, a southern suburb of Athens, Greece, near the port of Piraeus. The building was constructed in 1954, renovated in 2000, and equipped with a green roof system in 2008. The roof covers an area of 374 m2, contains lightweight soil 150 mm thick, and is planted with low vegetation. The school uses natural ventilation (based on gravity). PM concentrations were measured in both the green roof area and the classroom located directly below it. The outdoor PM 10 concentration ranged from 21.88 to 72.02 µg·m-3 [37], while indoor PM 10 levels ranged from 21.11 to 50.92 µg·m-3 [37]. The study showed that particulate concentrations depend on seasonal variations, higher levels were recorded in winter due to heating activities. In this case, no correlation was found between the concentrations of PM 2.5 and PM 10. Wind speed was found to have a negative effect on PM 10 levels: the lower the wind speed, the higher the PM 10 concentration. The main sources of pollution were traffic and heating from nearby residential buildings. Based on the results, it was concluded that the implementation of a green roof system had no significant impact on indoor air quality in this case [37].
Children up to 7 years of age represent a social group particularly vulnerable to the effects of air pollution due to the ongoing development of their respiratory systems. Due to the increased risk, a study was carried out in four kindergartens located in the Gliwice region, a typical industrial area in Upper Silesia. Additionally, the kindergartens were located in areas of different characteristics: two in rural zones and two in urban zones [38]:
- -
- SU-1 (Sikornik district - urban area 1),
- -
- PU-2 (Pszczyńska Street - urban area 2) - kindergarten located 50 m from a street,
- -
- R-3 (village of Przezchlebie - rural area 3),
- -
- SR-4 (village of Świętoszowice - rural area 4) - kindergarten located 50 m from the A1 highway.
Indoor and outdoor PM fractions were collected according to the reference procedure PN-EN 12341: 2014 [38,39]. However, it should be noted that this standard was withdrawn on January 29, 2024. The study was conducted from December 9, 2013, to March 14, 2014. The highest indoor PM concentrations were recorded in the kindergarten SR-4 (rural area near the highway), while the lowest were found in the kindergarten SU-1 (urban residential area). In general, PM levels were higher in rural areas (although the differences were not statistically significant: p = 0.10-0.51) [38]. In classrooms occupied by older children (group I), PM concentrations were significantly higher (p < 0.03 for PM 2.5, PM 10, TSP; p = 0.08 for PM 1), probably due to increased physical activity [38]. Based on the study results presented in [38], a summary table was prepared showing the mean concentrations of PM (µg·m-3) inside the classrooms during activities (N = 48 samples).
Based on data from Table 1, it can be concluded that in kindergartens with natural ventilation, airborne particulate matter concentrations (PM 1, PM 2.5, PM 10, TSP) were higher, especially in classrooms for older children and in rural areas with heavy traffic (near the highway) [38].
To improve indoor air quality, Swedish kindergartens were equipped with mechanical ventilation systems, which reduced PM 2.5 concentrations to values ranging from 3.2 to 9.3 µg·m-3 [38]. Another important factor was the level of activity of the children. PM 2.5 concentrations were higher among the older groups of children and the lowest among the youngest groups, particularly during naptime. Future research should focus on identifying correlations between pollutant concentrations and health symptoms in kindergartens, as well as their impact on children’s attendance [38].
Between February 1, 2023, and January 31, 2024, a study was conducted to monitor indoor air quality in three areas of the orthopaedic department in a hospital in Târgu Mureș, Romania [40]: emergency room (ER / admissions), outpatient clinic and patient ward. The aim was to compare the concentrations of key pollutants between these areas, assess seasonal variations, and assess the effectiveness of air purifiers in the ER zone. The study did not involve human subjects. PM 2.5 concentrations were measured using the light scattering method. A set of sensors per zone was installed, mounted at a height of approximately 1.2 m. The building was equipped with a central heating system, maintaining indoor parameters at: temperature 18-24 °C, relative humidity 35-45 %, and air velocity below 0.25 m·s-1. The study compared pollutant emissions in the ER area with and without an air purifier (AlecoAir P80 Traditio, capacity 650 m3·h-1). The highest annual concentrations of PM 2.5 between the zones were as follows: in the ER equal to 75.4 µg·m-3, in the outpatient clinic equal to 30.5 µg·m-3, and in the patient room equal to 15.25 µg·m-3. Lower concentrations of particulate matter in the ER were recorded in summer and fall compared to spring and winter. Due to the use of air purifiers, a reduction in PM 2.5 concentration was statistically significant (p = 0.014). The purifiers effectively reduced PM 2.5 levels [40,41]. According to reference thresholds based on WHO guidelines, PM 2.5 and CO2 concentrations in the ER zone repeatedly exceeded acceptable limits [40].
Kuo et al. [42] conducted research in six private fitness centres in Taichung, Taiwan. In the study, the authors designated individual fitness facilities with abbreviations: FL5 and FL4 - fitness centres located in different residential buildings in the Fengle district (Taichung), respectively, on the 5th and 4th floors, and EF - a fitness centre located in the East Fengle area. For the measurements, Aerocet-831 devices were used to determine concentrations of PM 1, PM 2.5, PM 4, and PM 10. The instruments were placed in the main user activity zones, 0.5 m from the exercise equipment and 3 m from the doors. Measurements were taken for 3 to 10 hours during the day [42].
Based on the results obtained in the fitness centres [42], Table 2 compares the air quality standards established by the Environmental Protection Agency (EPA) with the actual measurements from the facilities. Table 3 presents the correlation coefficients (R) between the selected parameters. Figure 4 illustrates the measured concentrations of PM 2.5 and PM 10 in individual fitness centres compared to established standards [42].
- -
- PM 2.5 concentrations exceed the standard limit (35 µg·m-3) in all fitness centres, particularly in FL5 and FL4.
- -
- PM 10 concentrations also exceed the allowed level (75 µg·m-3) in most facilities, especially in FL5 (102.6 µg·m-3) and FL4 (96.4 µg·m-3).
Based on the research conducted [42], it was found that decorations and interior furnishings alone do not determine air quality - their impact depends on the type of materials used, the efficiency of the ventilation system and the age of the building. Synthetic grass flooring and training mats tend to accumulate dust; therefore, their use should be reconsidered [42].
Another sports facility where particulate matter concentrations were measured was a sports hall in Warsaw [43]. The authors simultaneously measured particulate fractions inside the hall and outdoors during two 20-day series: one during the non - heating season (May to June 2017) and the other during the heating season (October to November 2017). The study compared the concentration levels and origins of PM indoors and outdoors at different times of the day and year. An analysis was also performed to determine the particle size distribution, assess the usefulness of automatic (optical) measurements compared to the reference method, and estimate daily inhalation doses of respirable dust (PM 4) for students, physical education teachers, and athletes. The following particulate fractions were analysed: PM 1, PM 2.5, PM 4, PM 10, and TSP (PM 100). Optical DustTrak 8534 monitors were used indoors and DustTrak 8533 monitors outdoors, with 1-minute readings [44]. In winter, the average concentrations of nearly all fractions were higher (both indoors and outdoors) than in summer.
- -
- hall, summer: PM 1 = 29 µg·m-3, PM 2.5 = 30 µg·m-3, PM 4 = 31 µg·m-3, PM 10 = 18 µg·m-3, TSP = 40 µg·m-3,
- -
- outdoor area, summer: PM 1 = 22 µg·m-3, PM 2.5 = 23 µg·m-3, PM 4 = 24 µg·m-3, PM 10 = 13 µg·m-3, TSP = 27 µg·m-3,
- -
- hall, winter: PM 1 = 38 µg·m-3, PM 2.5 = 39 µg·m-3, PM 4 = 40 µg·m-3, PM 10 = 33 µg·m-3, TSP = 45 µg·m-3,
- -
- outdoor area, winter: PM 1 = 56 µg·m-3, PM 2.5 = 52 µg·m-3, PM 4 = 52 µg·m-3, PM 10 = 31 µg·m-3, TSP = 29 µg·m-3.
During the summer, internal sources dominated, mainly due to exerciser movement, the resuspension of settled dust, and air circulation between indoor areas. On the contrary, during winter, the influence of outdoor air increased, with fine particles entering the building from municipal heating systems. The study [44] also presented the daily inhalation dose - the amount of particulate matter entering the lungs during one day. Daily doses of PM 4 were calculated for students, physical education teachers, and athletes. The average daily doses of respirable particles (PM 4) were determined using the deterministic approach developed by the US Environmental Protection Agency (US EPA) [43,45].
The highest doses of respirable particles were recorded among athletes, reaching 473 µg·d-1 [43] during the heating season. This results from prolonged exposure time and a higher inhalation rate (InhR). To assess relative exposure, the doses expressed in microgrammes were also recalculated per kilogramme of body weight per day. The average body weight was assumed to be 50.6 kg for children and 71.6 kg for adults [43]. The highest relative doses (per kilogramme of body weight) were found in students - children breathe more intensely during physical activity, and their lower body mass means that the particulate load per kilogramme is higher than in adults. During the heating season, the doses were 3-4 times higher than in the non-heating period, confirming the significant impact of the external pollution background (transport of PM from the outside to the indoor air) [43].
Air quality was also assessed in office spaces within bank buildings [46]. These facilities were located at Jalan Rakyat, Brickfields, Kuala Lumpur; Jalan Tangsi, Kuala Lumpur; Jalan Bukit, Bandar Kajang, Selangor; Seksyen 9, Shah Alam, Selangor; Subang Jaya, Selangor; and Precinct 8, Putrajaya. Measurements were carried out from August 2018 to January 2019, between 9:00 a.m. and 4:00 p.m. The total hazard ratio (THR) is a statistical measure used in the analysis to evaluate the risk of exposure to air pollutants. It represents the overall measure of the exposure of workers to various airborne contaminants. To calculate the Hazard Ratio (HR) for each pollutant and the Total Hazard Ratio for each bank (THR Bank), the equations (1) and (2) were applied [47,48,49].
where:
Cl - average measured concentration, µg·m-3
RfCl - reference concentration, µg·m-3
The study was carried out in bank vaults [46]. The highest average PM 10 concentration was recorded at 35.12 µg·m-3, while the maximum temporary PM 10 concentration reached 60 µg·m-3. The highest average PM 2.5 level was 53.05 µg·m-3, and the maximum temporary PM 2.5 concentration was 59.00 µg·m-3. The concentrations of PM 10 were below the standard threshold of 150 µg·m-3, but the concentrations of PM 2.5 exceeded the standard limit of 25 µg·m-3. Four banks showed indoor-to-outdoor (I/O) ratios close to unity, indicating a significant influence of outdoor sources on indoor PM 10 concentrations.
Wenner et al. [50] investigated how fine particulate matter (PM 2.5) concentrations vary with height in high-rise buildings (Chicago) both indoors and outdoors. The purpose of the study was to evaluate the extent to which outdoor pollution infiltrates indoor spaces and how the height of the building influences this process. Eight PurpleAir sensors were used in the study, four outdoor PA-II and four indoor PA-I (Touch version), which measured PM 2.5 as well as temperature, humidity, and barometric pressure. PurpleAir sensors were selected because their data are integrated with experimental air quality maps developed by the U.S. Environmental Protection Agency (EPA) and the U.S. Forest Service. Previous research had already evaluated the performance of PurpleAir monitors, and newly developed correction factors can be applied to adjust reported PM 2.5 values to better match Federal Equivalent Method (FEM) measurements [51,52,53,54]. Measurements were carried out from April 8 to May 7, 2023. The sensors were placed on the 1st, 4th, 6th, and 9th floors of an office building in the Edgewater district of Chicago, and an additional outdoor sensor was mounted on the 14th floor of a nearby residential building (approximately 800 m away) [50].
The study results indicated that [734750]:
- -
- above the fourth floor, the concentrations decreased by approximately 0.11 µg·m-3 per metre,
- -
- indoor PM 2.5 concentrations increased slightly with height: on average by +0.02 µg·m-3 per metre, from 5.3 µg·m-3 (1st floor) to 5.8 µg·m-3 (9th floor),
- -
- outdoor concentrations varied throughout the day,
- -
- indoor concentrations remained relatively stable, except for an increase in the morning on the ninth floor between 9:00 am and 3:00 pm, probably related to office activities.
The study did not account for seasonal variation, location differences, or comparisons with other buildings [50].
Wu et al. [55] examined how PM 2.5 (particles ≤ 2.5 µm) and CO2 concentrations affect occupant satisfaction and cognitive performance during mental work. The study was carried out in a simulated conference room located at the College of Civil Engineering and Architecture and the Centre for Balance Architecture at Zhejiang University in Hangzhou, China. The indoor environment had thermal and acoustic conditions typical of local office settings: temperature 24–26 °C, relative humidity 40-60 %, illumination 300 lux, and noise level 40 dB. Controlled increases in PM 2.5 concentration were applied, with exposure levels set at 10, 25, 35, 50, and 75 µg·m-3 [55]. PM 2.5 was measured using a nephelometer calibrated against a DustTrak II monitor. Participants rated their satisfaction with air quality and the general environment through questionnaires, while cognitive performance was evaluated through four tasks that evaluated comprehension, memory, perception, and visual attention. The results showed that at low CO2 concentrations (450-700 ppm), each increase of 1 µg·m-3 in PM 2.5 corresponded to a +0.5 % increase in dissatisfaction [55]; at high levels of CO2 (720-900 ppm), the same increase of 1 µg·m-3 in PM 2.5 resulted in a +1.1 % increase in dissatisfaction [55]. The precision of performance in tasks that evaluate comprehension, memory, perception, and visual attention decreased as PM 2.5 increased (p < 0.05). When PM 2.5 concentrations increased from 10 to 75 µg·m-3, visual attention decreased from 104 % to 96 % [55]. The α coefficient (change in productivity per change in PM 2.5) was –0.10 % [55], which means that each 1 µg·m-3 increase in PM 2.5 reduced cognitive productivity by approximately 0.10 %. The authors emphasise the need for longer and more extensive experiments in realistic office environments, taking into account different demographic groups (age, health status, workplace characteristics) [55].
3.1.4. Concentration of Air Pollution in Historical Buildings
The issue of concentrations of particulate matter concentrations (PM 2.5 and PM 10) was investigated by a long-term study carried out inside the Potala Palace Museum in Tibet, China [56]. The analysis used X-ray fluorescence (XRF). These studies demonstrated that the concentration of PM 1-10 particulate matter outside the building was lower than inside the museum rooms. The particles were classified into four categories: soil dust carried indoors by tourists, incense ash, pollutants resulting from human activity, and ore particles. In such environments, these particles can combine with chemical contaminants, which, when deposited in historical books, lead to damage to cultural artefacts. The following dust analysis methods were applied: chemical mass balance model (CMB), enrichment factor method (EF), factor analysis model (FA), isotopic tracer method, and positive matrix factorisation model (PMF). These techniques are commonly used internationally to identify sources of airborne particulate matter. Studies have been carried out in numerous museums around the world, demonstrating the harmful effects of particulate matter on historical artefacts. These investigations and their results are summarised in Table 5 [56].
The studies carried out, summarised in Table 5, considered numerous external factors that influence indoor air quality, including geographical location and altitude above sea level. In the investigation, tourists played an important role, as their presence contributed to an increase in the concentration of particulate matter within historic buildings. Therefore, the PM 10 concentration depends on the tourist season.
3.1.5. Concentration of Air Pollution in the Indoor Environment - Summary
The review of the literature indicates that the concentrations of particulate matter PM 2.5 and PM 10 in indoor environments significantly exceed the levels recommended by the WHO, particularly in residential, educational, office and historical buildings. In residential dwellings, the main sources of particulate emissions are cooking and biomass combustion. In educational facilities, especially in preschools and schools, particulate concentrations often exceed standards several times, and an additional factor that increases PM levels is the physical activity of the children. In office and sports buildings, both indoor sources (equipment, finishing materials, and intensive movement) and infiltration of outdoor air play a critical role. In heritage buildings, high particulate concentrations not only pose health risks to the occupants but also contribute to the degradation of historical artefacts.
Despite the broad evidence base, a major issue remains the lack of consistent, long-term, and multi-site studies that comprehensively assess seasonal variability, the impact of local emission sources, and the relationship between pollution levels and health outcomes in sensitive populations. Most existing research consists of short-term measurement campaigns or case studies, which limits the generalisability of the findings. The interrelationships between microclimatic parameters (temperature, humidity, ventilation) and the dynamics of PM concentrations indoors remain unexplored.
The most significant research gap is the absence of integrated analyses combining environmental parameters (PM 2.5, PM 10, CO2, VOCs, humidity, temperature) with a simultaneous assessment of personal exposure and the effectiveness of technical interventions, including long-term evaluations of mechanical ventilation systems, air purifiers, and innovative solutions such as green walls and biodegradable filters. Future research should focus on continuous (on-line) monitoring of indoor air quality across various building types and on the development of sustainable PM reduction technologies that take into account each energy efficiency with occupant comfort.
In the context of office buildings, a particularly evident research gap concerns the optimal selection and use of air purifiers. Although numerous studies confirm the effectiveness of portable filtration devices in reducing PM 2.5 and PM 10 concentrations, clear guidelines are lacking regarding their optimal placement, integration with ventilation systems, and adjustment of operational parameters to the specific conditions of office environments.
3.2. Measurement Methodology for Airborne Particulate Matter PM 2.5 and PM 10
The Air Quality Index (AQI) is understood as a numerical value calculated based on the measurement of pollutants such as ozone (O3), nitrogen dioxide (NO2), carbon monoxide (CO), and particulate matter (PM 10 and PM 2.5). This index has also begun to be used to assess indoor air quality. To determine air quality, the AQI is expressed on a scale from 0 to 500, where 0 indicates ideal air quality, while 500 represents air quality hazardous to human health [64].
Currently, air quality sensors are used that rely on optical particle counting technology. The use of optical particle counting in air quality monitoring offers numerous advantages; however, the lack of standardisation in proprietary algorithms results in differences in measurement results. This means that two sensors operating in the same environment may produce different results. Factors that influence this include uncertainties in aerosol calibration characteristics, the way to develop or test the algorithm, and procedures for estimating the mass concentration from particle counts. One such device is the Plantower PMS 5003 [47,65].
Various measurement instruments are applied in air quality monitoring and research. In their study [3], the authors used the following devices to measure the concentrations of PM 2.5 and PM 10 [3]:
- -
- PCE-PQC 34 Air Quality Monitor – The device operates with advanced particle counting technology, enabling measurement of particulate concentrations with diameters of < 10 μm (PM 10), < 5 μm (PM 5), < 2.5 μm (PM 2.5) and < 1 μm (PM 1), with a flow rate of 2.83 l·min-1 and a detection range of 0.3 to 25 μm. Calibration is carried out according to technical specifications. Precise calculations of the mass of the particle in µg·m-3 are enabled by its high sensitivity and integrated mass concentration mode. To ensure high accuracy, the device uses a long-life laser diode.
- -
- inBiot (MICA) and Kaiterra devices – These sensors are commercially available and certified under RESET and WELL standards. They operate using laser scattering technology for particulate measurement and are based on proprietary algorithms. The technical parameters of these devices are presented in Table 5.
Based on laboratory research [3], it was found that sensors with the technical parameters listed in Table 5 tend to underestimate concentration values, with errors ranging from 38 % to 65 %. However, for smaller particles, the recorded concentrations were consistent with those obtained by the reference sensor (REF). The comparison of the measurement results of commercial sensors widely available is presented in Figure 5.
Figure 5 and Figure 6 present the measurement results (for PM 2.5 and PM 10, respectively) obtained from the inBiot (MICA) sensors (INB01, INB02) and the Kaiterra sensors (KAI01, KAI02), compared to the REF reference sensor. Kaiterra sensors were found to be more accurate than the inBiot (MICA) devices.
For PM 10 particles, measurement underestimation was also observed. The errors for inBiot (MICA) sensors ranged from 52 % to 73 %, while for Kaiterra sensors, they ranged from 0.3 % to 45 %. These relationships are illustrated in Figure 6 [3].
Another sensor used to measure PM 2.5 concentrations in indoor air is the Canāree A1 sensor. It is used to measure pressure, temperature, relative humidity, CO2, BVOCs, and particulate matter (ranging from PM 1 to PM 10) [65].
PurpleAir sensors are also used in air quality monitoring [64,66]. These devices employ optical particle sensors manufactured by Plantower. The sensors contain one or two lasers with a wavelength of approximately 650 nm, which scatter aerosols introduced into the monitor housing by a small fan. The design allows for independent measurement of indoor and outdoor air quality. The Plantower PMS-5003 device is typically used outdoors, while the PA-I model, equipped with a single PMS-1003 sensor, is designed for indoor applications. These sensors operate on the basis of proprietary algorithms, but they allow long-term estimation (from months to years) of PM 2.5 concentrations originating from indoor sources [64,66].
An increasing number of innovative devices are being developed to enable precise air quality assessment. One such instrument is the Q-Air device, which collects, processes, stores, and visualises measurement data. The device is equipped with integrated sensors that determine the location and simultaneously measure the concentrations of particulate matter (PM 10 and PM 2.5), as well as the gaseous components present in airflow, carbon monoxide (CO), nitrogen dioxide (NO2), and ozone (O3). It also records environmental parameters such as temperature and humidity. Measurements are collected by an ESP32 microprocessor and the analysed results are published to a cloud server (Blynk) via the MQTT communication protocol. A dedicated mobile application has been developed for the device. Figure 7 shows the Q-Air measurement device and its components [64]. The complete unit has dimensions of 6 cm × 6 cm × 8 cm.
The literature review does not allow for a definitive indication of the best measurement device or method. Sensors used for particulate matter concentration measurements, while also enabling the measurement of additional parameters, include the following:
- -
- TSI SidePak AM510 – personal dust monitor (PM 2.5, PM 10).
- -
- TSI DustTrak II/DRX – portable dust monitor (PM 1, PM 2.5, PM 4, PM 10).
- -
- GrayWolf AdvancedSense Pro – multifunctional IAQ monitor (PM, VOCs, CO2, T, RH).
- -
- PCE-PQC 34 – reference particle counter (PM 1, PM 2.5, PM 4, PM 10).
- -
- PurpleAir – networked optical PM sensor (PM 1, PM 2.5, PM 10).
- -
- inBiot MICA – IAQ monitor (CO2, PM, VOCs, T, RH).
- -
- Kaiterra – IAQ monitor (CO2, PM 2.5, VOCs, T, RH).
- -
- Canāree A1 – personal IAQ sensor (PM, VOCs, CO2, T, RH).
- -
- Q-Air – IAQ device (PM, CO2, CH2O, VOCs, T, RH).
Table 6 presents a comparison of measurement devices along with their technical specifications. The data collected demonstrate the wide range of possibilities available to researchers.
The most commonly used PM concentration analysers in scientific studies described in the literature are:
- -
- TSI DustTrak, SidePak, PCE-PQC 34, PurpleAir,
- -
- DustTrak/SidePak – controlled studies (schools, fitness centres),
- -
- PurpleAir – epidemiological and population studies.
3.3. Methods for Reducing the Concentration of Particulate Matter PM 2.5 and PM 10
In the context of air quality, PM 10 and PM 2.5 are two key indicators that should draw our special attention. Reducing PM 10 and PM 2.5 levels is an important topic in the context of improving air quality, and ventilation plays a significant role in this process. Proper ventilation not only allows for the exchange of polluted indoor air, but also contributes to reducing the concentration of fine particulate matter that is harmful to health [1,3].
In the case of mechanical exhaust ventilation, the velocity of air decreases with distance from the exhaust outlet. This results in reduced pollution capture. A study [77] was carried out to improve pollutant capture by generating additional swirling ventilation airflows. A vortex exhaust ventilation system was found to generate sufficient air velocity to capture pollutants at greater distances (≥ 600 mm) than a conventional mechanical exhaust system. Vortex exhaust ventilation was shown to reduce PM 10 concentration in the air by 18.7 % [77].
An experimental method to reduce PM 2.5 levels in indoor air is a ventilation system integrated with sensors that monitor carbon dioxide (CO2), total volatile organic compounds (TVOC), formaldehyde, relative humidity (RH), temperature (T), fine particles (PM 2.5), and nitrogen dioxide (NO2). This system includes mechanical exhaust ventilation with humidity control (MEV-rh) and combined mechanical exhaust control of CO2 and humidity (MEV-rb). The study showed an improvement in indoor air quality, with a 20 % reduction in average CO2 concentration and a 5 % reduction in PM 2.5 levels [78].
A study [10] was conducted at a school in Stockton, California, where a filtration system was implemented to reduce PM 2.5 concentrations by using portable air purifiers and upgraded filters in the mechanical ventilation system. The effectiveness of air filtration strategies was evaluated based on their ability to reduce PM 2.5 concentrations. HealthPro Plus Air Purifiers by IQAir (Goldach) were used, with six airflow settings of 70, 130, 220, 290, 340, and 510 m3·h-1, equipped with HEPA filters [10,79]. The ventilation system was fitted with MERV-13 filters designed to capture 85 % of particulate matter [10,80]. The MERV-13 HVAC filters and air purifiers, individually and in combination, showed particle filtration efficiency ranging from 14 to 56 %. As a result, the average PM 2.5 concentration in classrooms was below the EPA annual standard of 9 µg·m-3. In one classroom, the average PM 2.5 concentration was below the WHO annual indoor standard of 5 µg·m-3. In rooms equipped with air purifiers, PM 2.5 concentrations further decreased overnight [10,34].
An integrated system of mechanical ventilation, air conditioning, and dehumidification can significantly contribute to the removal of indoor air pollutants. To carry out the study, an environmental chamber was constructed according to the GB/T 18801-2022 standard [11,81]. The chamber consists of an inner chamber and an outer chamber. The inner chamber has dimensions of 6.1 m × 3.00 m × 3.20 m. The outer temperature controlled chamber measured 7.95 m × 4.00 m × 3.20 m. The inner chamber was equipped with an air conditioner, mechanical ventilation, and an air purifier arranged as shown in Figure 8.
To simulate the heat gains from the windows and doors, heating cables were installed. Four thermal manikins were used for the experiment, generating a total heat output of 240 W. An air conditioner (Figure 8) with a capacity of 2.6 kW was installed on the chamber wall at a height of 2.4 m. The air-outlet angle of the air conditioner was set at 39°, with a supply air velocity of 2.33 m·s-1. Mechanical ventilation supplied 120 m3·h-1 of air through 24 cm × 24 cm inlet and outlet openings located on one side of the chamber, as shown in Figure 8. The air purifier delivered 36 m3·h-1 of purified air. The manufacturer reported a purification efficiency of 98 % for PM 2.5 particle matter. The air velocity at the purifier outlet was 4 m·s-1. The purifier was factory equipped with a top air outlet and a side air inlet. In the experiment, the purifier achieved a supply air velocity of 3.85 m·s-1 and an air discharge angle of 35 °. It was placed directly opposite the air conditioner. The initial particle concentration in the chamber was 300 µg·m-3. For mechanical ventilation, the air supply velocity was 1.5 m·s-1. When the air purifier operated alone, air pollution decreased by 15 µg·m-3 [11] in 46 minutes. According to the study, for more effective performance, the purifier should be placed near occupied work areas. When the air conditioner was also activated, air pollution decreased faster. The air cleaning time was reduced by 15.2 % [11]. However, the positioning of the devices proved to be a key factor. The devices must be installed opposite each other, as otherwise their air streams interfere with each other. By applying a general supply–exhaust ventilation system, a dilution effect of pollutants was achieved, reducing air purification time by 32.6 % [11].
Based on a study conducted in a senior residential building in Detroit [12], the effectiveness of portable air purifiers (PAFs) of the HEPA type (LE) and True HEPA (HE) was evaluated in reducing the main indoor sources of PM 2.5 and limiting the infiltration of pollutants. Participants (40 individuals, with a mean age of 67 years) were randomly assigned to three different three-day intervention periods [12]:
- -
- ‘sham’ period (air purifiers operated but without filters),
- -
- period with LE filter (low-efficiency HEPA-type),
- -
- period with HE filter (true HEPA, high efficiency).
The main indoor sources of PM 2.5 were identified as follows [12]:
- -
- organic pollutants mainly from domestic activities such as cooking (45 %),
- -
- resuspension and infiltration of pollutants related to traffic and waste combustion products (14 %),
- -
- secondary aerosols (13 %),
- -
- tobacco smoke (7 %),
- -
- urban dust (2 %),
- -
- unidentified sources (19 %).
In the study [12], two types of portable air purifiers were compared with a device operating in “sham” mode (purifier on, but without a filter). The LE (Low Efficiency HEPA-type) purifier used a HEPA-like filter with reduced filtration efficiency, while the HE (True HEPA) purifier was equipped with a genuine HEPA filter, capable of removing ≥ 99.97 % of 0.3 µm particles. The study showed that both types of filters effectively reduced PM 2.5 concentrations indoors. During the ‘sham’ period, the mean concentration was 17.5 µg·m3; with the LE filter, it decreased to 8.4 µg·m-3, and with the HE filter, to 7.0 µg·m-3. Furthermore, infiltration of outdoor pollutants decreased from 79 % during the ‘sham’ period to 61 % with the LE filter and 51 % with the HE filter.
A study carried out in a kindergarten in Daejeon [13] (South Korea) aimed to determine optimal operational scenarios for mechanical ventilation and air purifier operation that would simultaneously reduce levels of CO2 and PM 2.5 without increasing the inflow of outdoor pollutants. The study was carried out during the winter (January to March 2023) in two classrooms, each measuring 57.42 m2. Outdoor PM 2.5 concentrations in winter were higher than in other seasons [82], which could lead to increased indoor levels due to the infiltration of pollutants from outside [83]. PM 2.5 was monitored using an optical particle counter (OPC, Grimm). A simulation scenario was created with a ventilation system operating at 345 m3·h-1 equipped with a standard filter and an air purifier with an airflow rate of 210 m3·h-1. Analysis showed that the simulated PM 2.5 concentration was 20 % [13] higher than the measured value. This indicated that the numerical model predicted additional particle accumulation because ventilation introduced outdoor pollutants, while the weak filter and low-efficiency purifier failed to effectively remove them. The next scenario involved ventilation at 345 m3·h-1 with a standard filter and an air purifier with higher airflow (480 m3·h-1). The concentration of PM 2.5 was approximately 16 % [13] lower than in the actual measurements. The more efficient air purifier effectively reduced the levels of particulate matter even when the ventilation system introduced them from the outside. The role of the air purifier is crucial, but its efficiency alone cannot solve the problem if the ventilation filter is not effective enough. The third scenario included ventilation with a 345 m3·h-1 airflow equipped with a MERV-13 filter (75 % efficiency) and an air purifier with moderate airflow (210 m3·h-1). PM 2.5 levels were reduced by more than 50 % [13] compared to actual measurements. On days with high outdoor concentrations (up to 26.5 µg·m-3 [13]), indoor levels remained below 15 µg·m-3, consistent with WHO guidelines [34]. Scenario 3 demonstrated that the most effective solution combines adequate ventilation with high-efficiency filtration (MERV-13) and air purifier support. The model did not account for the influence of physical activity of the children. A properly designed ventilation system combined with air purifiers ensures fresh air and low levels of particulate matter [13].
In Seoul subway stations, a study [84] aimed to improve air quality, with the goal of achieving by 2024 that PM 10 and PM 2.5 particulate matter concentrations should not exceed 50 µg·m-3 and 30 µg·m-3 indoors, respectively [84]. Previous measurements indicated that the average values were significantly higher 111 µg·m-3 for PM 10 and 58 µg·m-3 for PM 2.5 [84]. It was decided to examine how changes in the layout of air conditioning diffusers and improved filtration could affect particle distribution across different stations zones. Three simulation scenarios were developed. In Scenario A, the diffusers were evenly distributed throughout the central sections of the ceiling of the waiting room. This was a typical configuration found in many subway stations, a relatively simple and symmetrical top-down air supply layout. The centrally supplied air was intended to spread evenly throughout the space. However, in practice, it did not create an effective barrier near entrances, escalators, or platform screen doors (PSDs). The average concentration of PM 10 was approximately 33.5 µg·m-3, and PM 2.5 was approximately 12 µg·m-3 [84]. Although the values met general standards, local exceedances were observed near the entrances and PSDs. Scenario B involved placing diffusers along the walls. The diffusers were mainly located near exterior entrances, corridors leading to platforms, and PSDs. This configuration functioned as an ‘air curtain’. A stream of clean air blowing from the walls limited the inflow of polluted air from tunnels and areas of the ground level. Air flow had a clearly directional character, creating protective zones at critical points. A reduction of 10.5 % in PM 10 and 5 % in PM 2.5 was recorded compared to Scenario A [84]. The improvement in decomposition was significant even with the same filtration efficiency (70 %). The most significant improvement occurred near entrances and escalators, where pollutants were most often infiltrated. Scenario C involved concentrating the diffusers in the central area. In this variant, most of the diffusers are concentrated in the central part of the room. A ‘clean air core’ was created in the centre of the space. Air was delivered mainly to the central zone of the hall, while areas near the walls and entrances were less protected. As a result, polluted air could freely flow into the interior. This phenomenon led to the mixing of air masses and a faster spread of particles. Increases of 9 % in PM 10 and 18 % in PM 2.5 were recorded compared to Scenario A [84]. Not only filter efficiency, but also diffuser location geometry determines air quality in the subway. Even with 70 % filtration, a significant improvement can be achieved (Scenario B) if the air is directed to where the pollutants actually flow [84]. Lee et al. [85] developed high-efficiency electrostatic filters for air conditioners in subway stations, which improved both air quality and energy efficiency.
A study aimed at improving indoor air quality was conducted in an office environment in Taiwan [14], located in a subtropical region characterised by high humidity and temperature. Ventilation and climate control were provided by a central air conditioning system. 86 % of employees reported symptoms of sick building syndrome, such as headaches and concentration problems. For the purpose of the study, multifunctional sensors were installed to measure temperature, relative humidity, and particulate matter concentrations (PM 2.5, PM 10, TSP). The sensor locations included two workstations and an area near the photocopier, identified as a potential pollution source. Eight cost-effective and easily implementable interventions were proposed [14]:
- -
- introduction of forced ventilation,
- -
- restoration of the air exchange system,
- -
- cleaning of air conditioning filters,
- -
- installation of air diffusers in the ceiling equipped with air filters,
- -
- removal of sealed office grilles,
- -
- replacement of heavy carpets with better ventilated flooring materials.
After implementing the proposed measures, the air quality (PM) in the workstation area improved. For PM 2.5, the improvement index increased from 0.05 (before) to 1.5 (after interventions); for TSP (total particulate matter) from 0.91 to 3.54; and for PM 10 from 2.45 to 4.02 [14].
In residential buildings in Seoul, an analysis was conducted to examine the impact of two parameters of ventilation and filtration systems, airflow rate and filter efficiency, on PM 2.5 particulate matter concentration. Twenty-four simulation scenarios were developed, combining four airflow rates (100, 200, 400, and 600 m3·h-1) with three levels of filter efficiency: 35 % (MERV-9), 65 % (MERV-11), and 95 % (MERV-16). Four combinations of pollution conditions were considered [15]:
- -
- LL – low outdoor and low indoor levels,
- -
- HL – high outdoor and low indoor levels,
- -
- LH – low outdoor and high indoor levels,
- -
- HH – high levels both outdoors and indoors.
The results showed that for the HH scenario, a reduction in PM 2.5 concentration was achieved with a high airflow rate (600 m3·h-1) and high filtration efficiency (95 %). In turn, low airflow combined with equally high efficiency also resulted in a significant improvement. On the basis of the simulations, the use of low-efficiency filters combined with high airflow rates was found to be inadvisable. This configuration led to a rapid increase in PM 2.5 concentration as outdoor pollution levels rose. For the LH scenario, a high airflow rate was the key factor, regardless of the efficiency of the filter. For the HL scenario, effective strategies included combining high airflow with a high quality filter or using low airflow with high - efficiency filters (≥ 0.65). In the LL scenario, a noticeable improvement occurred when filters with at least 65 % efficiency were used; air quality continued to improve as airflow increased. When low-quality filters (< 65 %) are used, ventilation should be limited, as it can deteriorate indoor air quality by introducing pollutants from outside [15].
Based on data obtained from the literature [15], the research results were analysed and Table 7 was prepared, presenting the percentage reduction of PM 2.5 depending on airflow rate, filter efficiency, and simulation scenario.
Filtration systems are used to reduce the concentration of particulate matter. According to research [86], the efficiency of the materials used in the filters is constantly being improved. The new filtration materials that are the most commonly used include electret materials, nanomaterials, fiberglass, and PTFE-based materials [86].
Li et al. [87] demonstrated that a very thin layer of PTFE (Teflon) nanofibers, produced by electrospinning onto a PTFE microfiber substrate, forms a composite filter membrane (CPFMs) that combines high PM capture efficiency with breathability and hydrophobicity (resistance to water and dirt). The study aimed to compare a ‘bare’ PTFE microfiber substrate with the same substrate coated with PTFE nanofibers and to evaluate aerosol filtration efficiency (PM 2.5 and PM 7.25). The filtration efficiency (DEHS) for PM 2.5 was 44.778 % for the substrate alone, compared to 98.905 % for the composite. The thin nanofiber layer significantly increased filtration efficiency without compromising breathability.
Studies [88] were conducted on the use of electrostatic precipitators (ESP) as air cleaner devices for indoor environments. ESPs use an electrostatic field to charge airborne particles via corona discharge at a conductive electrode. The charged particles are then attracted to an oppositely charged collecting electrode. This method effectively removes particulates while generating minimal airflow resistance. However, more studies are needed on the by-products generated by ESPs (such as ozone and aldehydes), their amounts, and their potential health impacts [89]. ESPs achieve very high efficiency (95 to 98 % [90]) in particulate removal while maintaining low pressure drop and energy efficiency. Particles within the size range of 0.2 to 0.35 μm are more difficult to remove compared to those between 0.35 and 8.7 μm [90]. The efficiency of ESP reached approximately 85 % for PM 2.5 under optimal conditions (airflow 4.5 m3·h-1, voltage +12 kV), with a very low ozone level of 17 ppb [88].
Filtration systems reduce particulate matter concentrations in the air, but often use environmentally harmful, non-biodegradable materials. To advance this field, research is being conducted on the technical properties of filters with Pickering emulsion [91] or made from cellulose pulp extracted from banana pseudostems [92]. A filter with a basis weight of 160 g·m-2 was developed [92]. This is a biodegradable biopolymer-based filter. It is also recyclable. It was produced through two main processes: alkaline treatment and bleaching. The filtration method is based on particle separation through retention on a porous surface. In the context of biomass use, woody biomass filters achieved particle retention efficiencies ranging from 70 % to 97 % [93,94]. For banana pulp filters, bleached versions showed capture efficiencies of approximately 90 % for PM 10 and PM 2.5 particles [92].
An innovative method currently being studied for the reduction of PM 2.5 is the use of so-called green walls. Plants naturally filter air through various phytoremediation mechanisms, including phytoextraction (phytoaccumulation), phytostabilization (phytoimmobilization), phytovolatilization, phytodegradation (phytotransformation), and phytofiltration [93,94]. The study [94] was carried out in a closed air conditioned room equipped with two green walls, each measuring 140 cm by 210 cm, as shown in Figure 9. The room was also equipped with 39 sensors. PM 2.5 concentrations were measured using devices equipped with Sensirion® SP30 sensors, TSI QUEST® Technologies EVM Series Environmental Monitor Systems, and Comon Invent® Sensirion® units.
The diffusion of pollutants into the room was achieved using a spraying system. After introducing the particles, their concentrations between 10:47 and 11:08 were 377 µg·m-3, 134 µg·m-3, and 148 µg·m-3, respectively. At 00:00 on October 28, 2023, the concentrations had decreased to 12, 8, 10, and 0 µg·m-3, respectively [94].
Recent studies confirm that an effective reduction in particulate matter concentrations (PM 2.5 and PM 10) in indoor environments requires an integrated approach that combines technical solutions with organisational measures. The most commonly used method is mechanical ventilation with heat recovery, which, when combined with high-quality filtration (HEPA and activated carbon filters), allows for a significant reduction in airborne particle concentrations. Air purifiers serve as a complementary solution.
In public and educational spaces, multistage filtration air conditioning systems are increasingly being used. In residential buildings, mobile solutions such as compact air purifiers and air quality sensors integrated with smart building systems are gaining popularity. Additionally, research is being conducted on biodegradable filters (for example, made from cellulose pulp obtained from banana pseudostems) and green walls, which use plant biological processes to help reduce particulate matter and volatile organic compounds.
However, there is still a lack of systematic and long-term analyses of the effectiveness of these technologies in different types of buildings and climatic conditions. The impact of innovative solutions (such as green walls, biomass-based filter materials, and photocatalytic systems) under real operating conditions remains also inadequately understood. It is also necessary to develop methods that integrate PM concentration reduction with the improvement of other air quality parameters, such as humidity. Future research should focus on integrating online sensors with ventilation and air purification systems, enabling dynamic adjustment of device operation parameters to current pollution levels, and developing passive technologies such as self-cleaning surfaces and plant-based systems with proven efficiency.
The review of the literature identifies a significant research gap on the use of mobile air purifiers in office environments. Studies confirm the effectiveness of portable devices in reducing particulate matter concentrations (PM 2.5 and PM 10), but clear guidelines are still lacking regarding:
- -
- the optimal placement of air purifiers within office spaces,
- -
- the integration of air purifiers with existing ventilation systems,
- -
- and adjustment of operating parameters to the specific conditions of office environments (including the number of occupants, the type of furniture, and the characteristics of airflow).
In practice, this means that devices are often selected in a simplified way based on the manufacturer’s declared CADR (Clean Air Delivery Rate), the size of the room specified in the technical specifications, and the type of filters used (most commonly HEPA H13/H14 combined with carbon filters). Such an approach does not always ensure effective performance under real conditions, where factors such as furniture arrangement, internal emission sources, outdoor air infiltration, and building location play an important role.
4. Conclusions
A review of the literature clearly indicates that indoor concentrations of particulate matter (PM 2.5 and PM 10) often exceed the WHO guidelines and that indoor sources such as cooking, biomass burning, tobacco smoke, and human activity may be more significant than outdoor pollution infiltration. Children and the elderly are particularly vulnerable, as confirmed by studies conducted in educational, residential, and sports facilities. PM 2.5 and PM 10 particulate matter represent one of the most serious threats to indoor air quality and human health. In residential and office buildings, additional factors that determine exposure levels include outdoor air infiltration and seasonality related to the heating period. In historical buildings, this issue becomes even more important, as particulate matter contributes not only to adverse health effects, but also to the degradation of cultural heritage.
Currently applied technical solutions, such as mechanical ventilation with high-efficiency filtration (HEPA), air purifiers, and advanced air conditioning systems, demonstrate high efficiency in reducing PM 2.5 concentrations. Research is also being carried out on innovative methods, including biodegradable filters made from cellulose-based materials and green wall systems that can act as natural biofilters. However, clear and long-term analyses confirming their effectiveness under real operating conditions are still lacking.
It should be noted that many office buildings accommodate people who spend an average of eight hours a day inside, thus being exposed to elevated concentrations of particulate matter in polluted air. Despite the importance of this issue for employee health, relatively few scientific publications analyse the effectiveness of indoor air quality improvement methods specifically in office environments. In many cases, office buildings cannot undergo costly upgrades to ventilation systems or major structural modifications to install new systems. In such situations, portable air purifiers become a valuable and practical non-invasive solution. When properly selected and placed, these devices provide an effective method for reducing PM 2.5 and PM 10 concentrations while allowing flexible implementation without interference with existing technical infrastructure.
Identification of this problem allows one to identify several key directions for future research. Long-term and multicentre programmes for indoor air quality monitoring are required, taking into account seasonality and the diversity of building types. Studies should be conducted on the relationship between indoor particulate exposure and respiratory, cardiovascular, and cognitive disorders. A comprehensive assessment of the economic and environmental effectiveness of new technologies, such as biodegradable filters and passive green systems, is also necessary. There is still a lack of solutions that integrate particulate matter reduction with the control of other key air quality parameters, such as CO2 concentration and relative humidity.
In summary, improving indoor air quality requires a holistic approach that combines technological solutions, modern building design, user awareness, and coherent regulatory frameworks. The continued development of interdisciplinary research on indoor air quality and the implementation of sustainable PM reduction strategies are key to reducing the global health burden associated with exposure to particulate matter.
References
- Chen J., Hoek G. Long-term exposure to PM and all-cause and cause-specific mortality: A systematic review and meta-analysis. Environment International, 2020, 143, 105974. [CrossRef]
- Wesseling J., de Ruiter H., Blokhuis C., Drukker D., Weijers E., Volten H., Vonk J., Gast L., Voogt M., Zandveld P., van Ratingen S., Tielemans E. Development and implementation of a platform for public information on air quality, sensor measurements, and citizen science, Atmosphere, 2019, 10(8), 445. [CrossRef]
- Aguado A., Rodríguez-Sufuentes S., Verdugo F.; Rodríguez-López A., Figols M., Dalheimer J., Gómez-López A., González-Colom R., Badyda A., Fermoso J. Verification and usability of indoor air quality monitoring tools in the framework of health-related studies, Air, 2025, 3(1), 3. [CrossRef]
- Leikauf G.D., Kim S.-H., Jang A.-S. Mechanisms of ultrafine particle-induced respiratory health effects, Experimental and Molecular Medicine, 2020, 52(3), pp.: 329–337. [CrossRef]
- Nair A.N., Anand P., George A., Mondal N. A review of strategies and their effectiveness in reducing indoor airborne transmission and improving indoor air quality, Environmental Research, 2022, 216, 113579. [CrossRef]
- Chen R., Zhao A., Chen H., Zhao Z., Cai J., Wang C., Yang C., Li H., Xu X., Ha S., Li T., Kan H. Cardiopulmonary Benefits of Reducing Indoor Particles of Outdoor Origin: A Randomized, Double-Blind Crossover Trial of Air Purifiers, Journal of the American College of Cardiology, 2015, 65(21), pp.: 2279–2287. [CrossRef]
- Allen R.W., Carlsten C., Karlen B., Leckie S., van Eeden S., Vedal S., Wong I., Brauer M. An air filter itervention study of endothelial function among healthy adults in a woodsmoke-impacted community, American Journal of Respiratory and Critical Care Medicine, 2011, 183(9), pp.: 1222–1230. [CrossRef]
- Bräuner E.V., Forchhammer L., Møller P., Barregard L. Gunnarsen L., Afshari A., Wåhlin P., Glasius M., Dragsted L.O., Basu, S., Raaschou-Nielsen O., Loft S. Indoor particles affect vascular function in the aged. An air filtration-based intervention study, American Journal of Respiratory and Critical Care Medicine, 2008, 177(4), pp.: 419–425. [CrossRef]
- Haryanto B. Air Pollution—A Comprehensive Perspective, Ed.; IntechOpen, 2012, London, UK.
- Thompson McK., Castorina R., Chen W., Moore D., Peerless K., Hurley S. Effectiveness of air filtration in reducing PM2.5 exposures at a school in a community heavily impacted by air pollution, Atmosphere, 2024, 15(8), 901. [CrossRef]
- Jia L., Ge J., Wang Z., Jin W., Wang C., Dong Z., Wang C., Wang R. Synergistic impact on indoor air quality: The combined use of air conditioners, air purifiers, and fresh air systems, Buildings, 2024, 14(6), 1562. [CrossRef]
- Klaver Z.M., Crane R.C, Ziemba R.A., Bard R.L., Adar S.A., Brook R.D., Morishita M. Reduction of outdoor and indoor PM2.5 source contributions via portable air filtration systems in a senior residential facility in Detroit, Michigan, Toxics, 2023, 11(12), 1019. [CrossRef]
- Lee D., Kim Y., Hong K.-J., LeeG., Kim H.-J., Shin D., Han B. Strategies for effective management of indoor air quality in a kindergarten: CO2 and fine particulate matter concentrations, Toxics, 2023, 11(11), 931. [CrossRef]
- Sung W.-P., Chen T.-Y., Liu C.-H. Strategy for improving the indoor environment of office spaces in subtropical cities, Buildings, 2022, 12(4), 412. [CrossRef]
- Kim J.-H., Yeo M.-S. Effect of flow rate and filter efficiency on indoor PM2.5 in ventilation and filtration control, Atmosphere, 2020, 11(10), 1061. [CrossRef]
- Matz C.J., Stieb D.M., Davis K., Egyed M., Rose A., Chou B., Brion O. Effects of age, season, gender and urban-rural status on time-activity: Canadian human activity pattern survey 2 (CHAPS 2). International Journal of Environmental Research and Public Health, 2014, 11(2), pp.: 2108–2124. [CrossRef]
- Report of Indoor Air Quality, United States Environmental Protection Agency, 2025.
- Jiang X.Q., Mei X.D., Feng D. Air pollution and chronic airway diseases: What should people know and do? Journal of Thoracic Disease, 2016, 8(1). [CrossRef]
- Xydi I., Saharidis G., Kalantzis G., Pantazopoulos I., Gourgoulianis K.I., Kotsiou O.S. Assessing the impact of spatial and temporal variability in fine particulate matter pollution on respiratory health outcomes in asthma and COPD patients, Journal of Personalized Medicine, 2024, 14(8), 833. [CrossRef]
- Hart J.E., Grady S.T., Laden F., Coull B.A., Koutrakis P., Schwartz J.D., Moy M.L., Garshick E. Effects of indoor and ambient black carbon and PM2.5 on pulmonary function among individuals with COPD, Environmental Health Perspectives, 2018, 126(12). [CrossRef]
- de Hartog J.J., Ayres J.G., Karakatsani A., Analitis A., Brink H.T., Hameri K., Harrison R., Katsouyanni K., Kotronarou A., Kavouras I., Meddings C., Pekkanen J., Hoek G. Lung function and indicators of exposure to indoor and outdoor particulate matter among asthma and COPD patients. Occuppational and Environmental Medicine, 2010, 67(1). [CrossRef]
- Hsu S.O., Ito K., Lippmann M. Effects of thoracic and fine PM and their components on heart rate and pulmonary function in COPD patients. Journal of Exposure Science and Environmental Epidemiology, 2011, 21, pp.: 464–472. [CrossRef]
- Cortez-Lugo M., Ramírez-Aguilar M., Pérez-Padilla R., Sansores-Martínez R., Ramírez-Venegas A., Barraza-Villarreal A. Effect of personal exposure to PM2.5 on respiratory health in a Mexican panel of patients with COPD, International Journal of Environmental Research and Public Health, 2015, 12(9), pp.: 10635–10647. [CrossRef]
- Li Z., Wen Q., Zhang R. Sources, health effects and control strategies of indoor fine particulate matter (PM2.5): A review. Science of the Total Environment, 2017, 586, pp.: 610–622. [CrossRef]
- Zhang L., Ou C., Magana-Arachchi D., Vithanage M., Vanka K.S., Palanisami T., Masakorala K., Wijesekara H., Yan Y., Bolan N., Kirkham M.B. Indoor particulate matter in urban households: sources, pathways, characteristics, health effects, and exposure mitigation, International Journal of Environmental Research and Public Health, 2021, 18(21), 11055. [CrossRef]
- Seguel J.M., Merrill R., Seguel D., Campagna A.C. Indoor air quality, American Journal of Lifestyle Medicine, 2016, 11(4), pp.: 284–295. [CrossRef]
- Park Ś., Seo J., Lee Ś. Distribution characteristics of indoor PM2.5 concentration based on the water type and humidification method, International Journal of Environmental Research and Public Health, 2020, 17(22), 8638. [CrossRef]
- Wang Q., Ao R., Chen H., Li J., Wei L., Wang Z. Characteristics of PM2.5 and CO2 concentrations in typical functional areas of a University campus in Beijing based on low-cost sensor monitoring, Atmosphere 2024, 15(9), 1044. [CrossRef]
- Kadiri K., Turcotte D., Gore R., Bello A., Woskie S.R. Determinants of indoor NO2 and PM2.5 concentration in senior housing with gas stoves, Toxic, 2024, 12(12), 901. [CrossRef]
- Tham K.W. Indoor air quality and its effects on humans—A review of challenges and developments in the last 30 years, Energy and Buildings, 2016, 130, pp.: 637–650. [CrossRef]
- Šedivá T., Štefánik D. The Seasonality of PM and NO2 Concentrations in Slovakia and a Comparison with Chemical-Transport Model. 2024, 15(10), 1203. [CrossRef]
- Järvi K., Vornanen-Winqvist C., Mikkola R., Kurnitski J., Salonen H. Online questionnaire as a tool to assess symptoms and perceived indoor air quality in a school environment, Atmosphere, 2018, 9(7), 270. [CrossRef]
- Kochavi S.A., Kira O., Gal E. Real-time monitoring of environmental parameters in schools to improve indoor resilience under extreme events, Smart Cities 2025, 8(1), 7. [CrossRef]
- World Health Organization, WHO global air quality guidelines: particulate matter (PM2.5 and PM10), ozone, nitrogen dioxide, sulfur dioxide and carbon monoxid, 2021.
- Canha N., Correia C., Mendez S., Gamelas C.A., Felizardo M. Monitoring indoor air quality in classrooms using low-cost sensors: Does the perception of teachers match reality?, Atmosphere 2024, 15(12), 1450. [CrossRef]
- Portaria n.o 138-G/2021. Portaria n.o 138-G/2021—Requisitos Para a Avaliação Da Qualidade Do Ar Interior Nos Edifícios de Comércio e Serviços. Diário República, 2021, 1, 128.
- Barmparesos N., Saraga D., Karavoltsos S., Maggos T., Assimakopoulos V.D. Sakellari A., Bairachtari K., Assimakopoulos M.N. Chemical composition and source apportionment of PM10 in a green-roof primary school building, Applied Sciences, 2020, 10(23), 8464. [CrossRef]
- Mainka A., Zajusz-Zubek E. Indoor air quality in urban and rural preschools in upper Silesia, Poland: Particulate matter and carbon dioxide, Enviromental Research and Public Helth, 2015, 12(7), pp.: 7697-7711. [CrossRef]
- PN-EN 12341:2024-01 Ambient air - Standard gravimetric measurement method for the determination of the PM 10 or PM 2.5 mass concentration of suspended particulate matter.
- Moldovan F., Moldovan Ł. Indoor air quality in an orthopedic hospital from Romania, Toxic; 2024, 12(11), 815. [CrossRef]
- Chen R., Zhang X., Wang P., Xie K., Jian J., Zhang Y., Zhang J., Yuan Y., Na P., Yi, M., Xu J. Transparent thermoplastic polyurethane air filters for efficient electrostatic capture of particulate matter pollutants, Nanotechnology, 2019, 30, 015703. [CrossRef]
- Kuo P-Y., Chen C.-Y., Wu T.-Y. Influence of interior decorations on indoor air quality in fitness centers, Engineering Proceedings, 2023, 55(1), 56. [CrossRef]
- Bralewska K., Rogula-Kozłowska W., Bralewski A. Size-segregated particulate matter in a selected sports facility in Poland, Sustainability, 2019, 11(24), 6911. [CrossRef]
- Chang L.T.-C., Leys J., Heidenreich S., Koen T. Determining aerosol type using a multichannel DustTrak DRX, Journal of Aerosol Science, 2018, 126, pp.: 68–84. [CrossRef]
- U.S. Environmental Protection Agency, Exposure Factors Handbook, EPA, Washington, DC, USA, 2011.
- Saidin H., Razak A.A., Mohamad M.F., Ul-Saufie A.Z., Zaki S.A., Othman N. Hazard evaluation of indoor air quality in bank offices, Buildings, 2023, 13(3), 798. [CrossRef]
- Wallace L. Cracking the code-Matching a proprietary algorithm for a low-cost sensor measuring PM1 and PM2.5. Science of Total Environment, 2023, 893, 164874. [CrossRef]
- https://tsi.com/discontinued-products/sidepak-personal-aerosol-monitor-am510.
- https://tsi.com/products/aerosol-and-dust-monitors/aerosol-and-dust-monitors/dusttrak%E2%84%A2-ii-aerosol-monitor-8532.
- Wenner M.M, Ries-Roncalli A., Whalen M.C.R., Jing P. The relationship between indoor and outdoor fine particulate matter in a high-rise building in Chicago monitored by PurpleAir sensors, Sensors, 2024, 24(8), 2493. [CrossRef]
- Magi B.I., Cupini C., Francis J., Green M., Hauser C. Evaluation of PM2.5 measured in an urban setting using a low-cost optical particle counter and a Federal Equivalent Method Beta Attenuation Monitor. Aerosol Science of Technology, 2020, 54, pp.: 147–159. [CrossRef]
- Malings C., Tanzer R., Hauryliuk A., Saha P.K., Robinson A.L., Presto A.A., Subramanian R. Fine particle mass monitoring with low-cost sensors: Corrections and long-term performance evaluation, Aerosol Science and Technology, 2020, 54, pp.: 160–174. [CrossRef]
- Mehadi A., Moosmüller H., Campbell D.E., Ham W., Schweizer D., Tarnay L., Hunter J. Laboratory and field evaluation of real-time and near real-time PM2.5 smoke monitors. Journal of the Air and Waste Management Association, 2020, 70(2), pp.: 158–179. [CrossRef]
- Barkjohn K.K., Gantt B., Clements A.L. Development and application of a United States wide correction for PM2.5 data collected with the PurpleAir sensor, Atmospheric Measurement Techniques, 2021, 14(6), pp.: 4617–4637. [CrossRef]
- Wu J., Weng J., Xia B., Zhao Y., Song Q. The synergistic effect of PM2.5 and CO2 concentrations on occupant satisfaction and work productivity in a meeting room, International Journal of Environmental Research and Public Health, 2021, 18(8), 4109. [CrossRef]
- Zhang G., Li W., Cheng Q., Zhou Z., Wang Q,, Peng Z. Source identification and characterization of indoor particulate matter in Potala Palace museum, Buildings, 2023, 13(9), 2138. [CrossRef]
- Daher N., Ruprecht A., Invernizzi G., de Marco C., Miller-Schulze J., Heo J.B., Shafer M.M., Schauer J.J., Sioutas C. Chemical characterization and source apportionment of fine and coarse particulate matter inside the refectory of Santa Maria Delle Grazie church, home of Leonardo Da Vinci’s “Last Supper”, Environmental Science and Technology, 2011, 45(24), pp.: 10344-10353. [CrossRef]
- Masková L., Smolík J., Travnickova T., Havlica J., Ondráčková L., Ondráček J. Contribution of visitors to the indoor PM in the National Library in Prague, Czech Republic, Aerosol Air Quality Research, 2016, 16, pp.; 1713–1721. [CrossRef]
- Wang L., Xiu G. Chen Y., Xu F., Wu L., Zhang D. Characterizing particulate pollutants in an Enclosed Museum in Shanghai, China, Aerosol and Air Quality Research, 2015, 15, pp.: 319–328. [CrossRef]
- de Bock L.A., van Grieken R.E., Camuffo D., Grime G.W. Microanalysis of museum aerosols to elucidate the soiling of paintings: Case of the Correr Museum, Venice, Italy, Environmental Science and Technology, 1996, 30(11), pp.: 3341– 3350. [CrossRef]
- Gysels K., Deutsch F., van Grieken R. Characterisation of particulate matter in the Royal Museum of Fine Arts, Antwerp, Belgium, Atmospheric Environment, 2002, 36(25), pp.: 4103–4113. [CrossRef]
- Hu T., Lee S., Cao J., Chow J.C., Watson J.G., Ho K., Ho W., Rong B., An Z. Characterization of winter airborne particles at Emperor Qin’s Terra- cotta Museum, China, Science of the Total Environment, 2009, 407(20), pp.: 5319–5327. [CrossRef]
- Krupińska B., Worobiec A., Rotondo G.G., Novaković V., Kontozova V. Ro C.-U., van Grieken R., de Wael K. Assessment of the air quality (NO2, SO2, O3 and particulate matter) in the Plantin-Moretus Museum/Print Room in Antwerp, Belgium, in different seasons of the year, Microchemical Journal, 2012, 102, pp.: 49–53. [CrossRef]
- Nuñez J.G.C., Negrette O.A.C., Sáenz K.J.B., Sáenz C.G.D. Design and implementation of an indoor and outdoor air quality measurement device for the detection and monitoring of gases with hazardous health effects, Engineering Proceedings, 2025, 83(1), 13. [CrossRef]
- Abulude F.O., Gbotoso A.O., Ademilua S.O. Indoor air measurements with a low- cost air quality sensor: A preliminary report, Engineering Proceedings, 2023, 48(1), 31. [CrossRef]
- Wallace L., Ott W. Long-term indoor-outdoor PM2.5 measurements using PurpleAir Sensors: An improved method of calculating indoor-generated and outdoor-infiltrated contributions to potential indoor exposure, Sensors, 2023, 23(3), 1160. [CrossRef]
- https://graywolfsensing.com/iaq-graywolf-update/.
- https://www.reichelt.com/de/en/shop/product/pce-pqc_34eu_particle_counter-413117.
- https://www2.purpleair.com/products/purpleair-pa-ii?variant=40067691774049.
- https://www.inbiot.es.
- https://www.kaiterra.com.
- https://pierasystems.com.
- https://smartairfilters.com.
- https://www.mouser.pl/.
- https://metone.com.
- https://tsi.com/products/aerosol-and-dust-monitors/aerosol-and-dust-monitors/dusttrak%E2%84%A2-drx-aerosol-monitor-8533ep.
- Song Y.W., Kim S.E., Park J.-C. Indoor air pollutant (PM 10, CO2) reduction using a vortex exhaust ventilation system in a mock-up room, Buildings, 2025, 15(1), 144. [CrossRef]
- Lopes M.B., Kanama N., Poirier B., Guyot G., Ondarts M., Gonze E., Mendes N., A numerical and experimental study to compare different IAQ-based smart ventilation techniques, Buildings, 2024, 14(11), 3555. [CrossRef]
- https://www.iqair.com/.
- ASHRAE Standard 52.2, Performance and Recommendations.
- Chinese Standard GB/T 18801-2022, Air Cleaner.
- Lee M. An analysis on the concentration characteristics of PM2.5 in Seoul, Korea from 2005 to 2012. Asia-Pacific Journal of Atmospheric Science, 2014, 50(1), pp.: 585–594. [CrossRef]
- Martins N.R., da Graça G.C. Impact of outdoor PM2.5 on natural ventilation usability in California’s nondomestic buildings, Applied Energy, 2017, 189, pp.: 711–724. [CrossRef]
- Kim S.-G., Sung G., Yook S.-J., Kim M., Park D. Reducing PM10 and PM2.5 concentrations in a subway station by changing the diffuser arrangement, Toxics, 2022, 10(9), 537. [CrossRef]
- Lee H., Sung J.-H., Kim M., Kim Y.-S., Lee Y., Kim Y.-J., Han B., Kim H.-J. Development of electrostatic-precipitator-type air conditioner for reduction of fine particulate matter in subway. IEEE Transaction on Industry Applications, 2022, 58(3), pp.: 3992–3998. [CrossRef]
- Sun F., Zhang X., Xue T., Cheng P., Yu T. The performance testing and analysis of common new filter materials: A case of four filter materials, Materials, 2024, 17(12), 2802. [CrossRef]
- Li X., Wang X.X., Yue T.-T., Xu Y., Zhao M.-L., Yu M., Ramakrishna S., Long Y.-Z. Waterproof-breathable PTFE nano- and microfiber membrane as high efficiency PM2.5 filter, Polymers, 2019, 11(4), 590. [CrossRef]
- Pirhadi M., Mousavi A., Sioutas C. Evaluation of a high flow rate electrostatic precipitator (ESP) as a particulate matter (PM) collector for toxicity studies, Science of the Total Environment, 2020, 739, 140060. [CrossRef]
- Afshari A., Ekberg L., Forejt L., Mo J., Rahimi S., Siegel J., Chen W., Wargocki P., Zurami S., Zhang J. Electrostatic precipitators as an indoor air cleaner - A literature review, Sustainability, 2020, 12(21), 8774. [CrossRef]
- Sokolovskij E., Kilikevičius A., Chlebnikovas A., Matijošius J., Vainorius D. Innovative electrostatic precipitator solutions for efficient removal of fine particulate matter: Enhancing performance and energy efficiency, Machines, 2024, 12(11), 761. [CrossRef]
- Fan X., Wang Y., Zhong W.-H., Pan S. Hierarchically Structured All-Biomass Air Filters with High Filtration Efficiency and Low Air Pressure Drop Based on Pickering Emulsion. ACS Applied Materials and Interfaces, 2019, 11, issue 15, pp. 14266–14274. [CrossRef]
- Martín-Cruz Y., Bordón P., Pulido-Melián E., Saura-Cayuela T., Monzón M. Development of cellulose air filters for capturing fine and ultrafine particles through the valorization of banana cultivation biomass waste, Environments, 2024, 11(3), 50. [CrossRef]
- Lee H., Jun Z., Zahra Z. Phytoremediation: The sustainable strategy for improving indoor and outdoor air quality, Environments, 2021, 8(11), 118. [CrossRef]
- Falzone C., Jupsin H., el Jarroudi M., Romain A.-C. Advancing methodologies for investigating PM2.5 removal using green wall system, Plants, 2024, 13(12), 1633. [CrossRef]
Figure 1.
Evolution of typical indoor particulate matter levels (1986–2016) [30].
Figure 1.
Evolution of typical indoor particulate matter levels (1986–2016) [30].
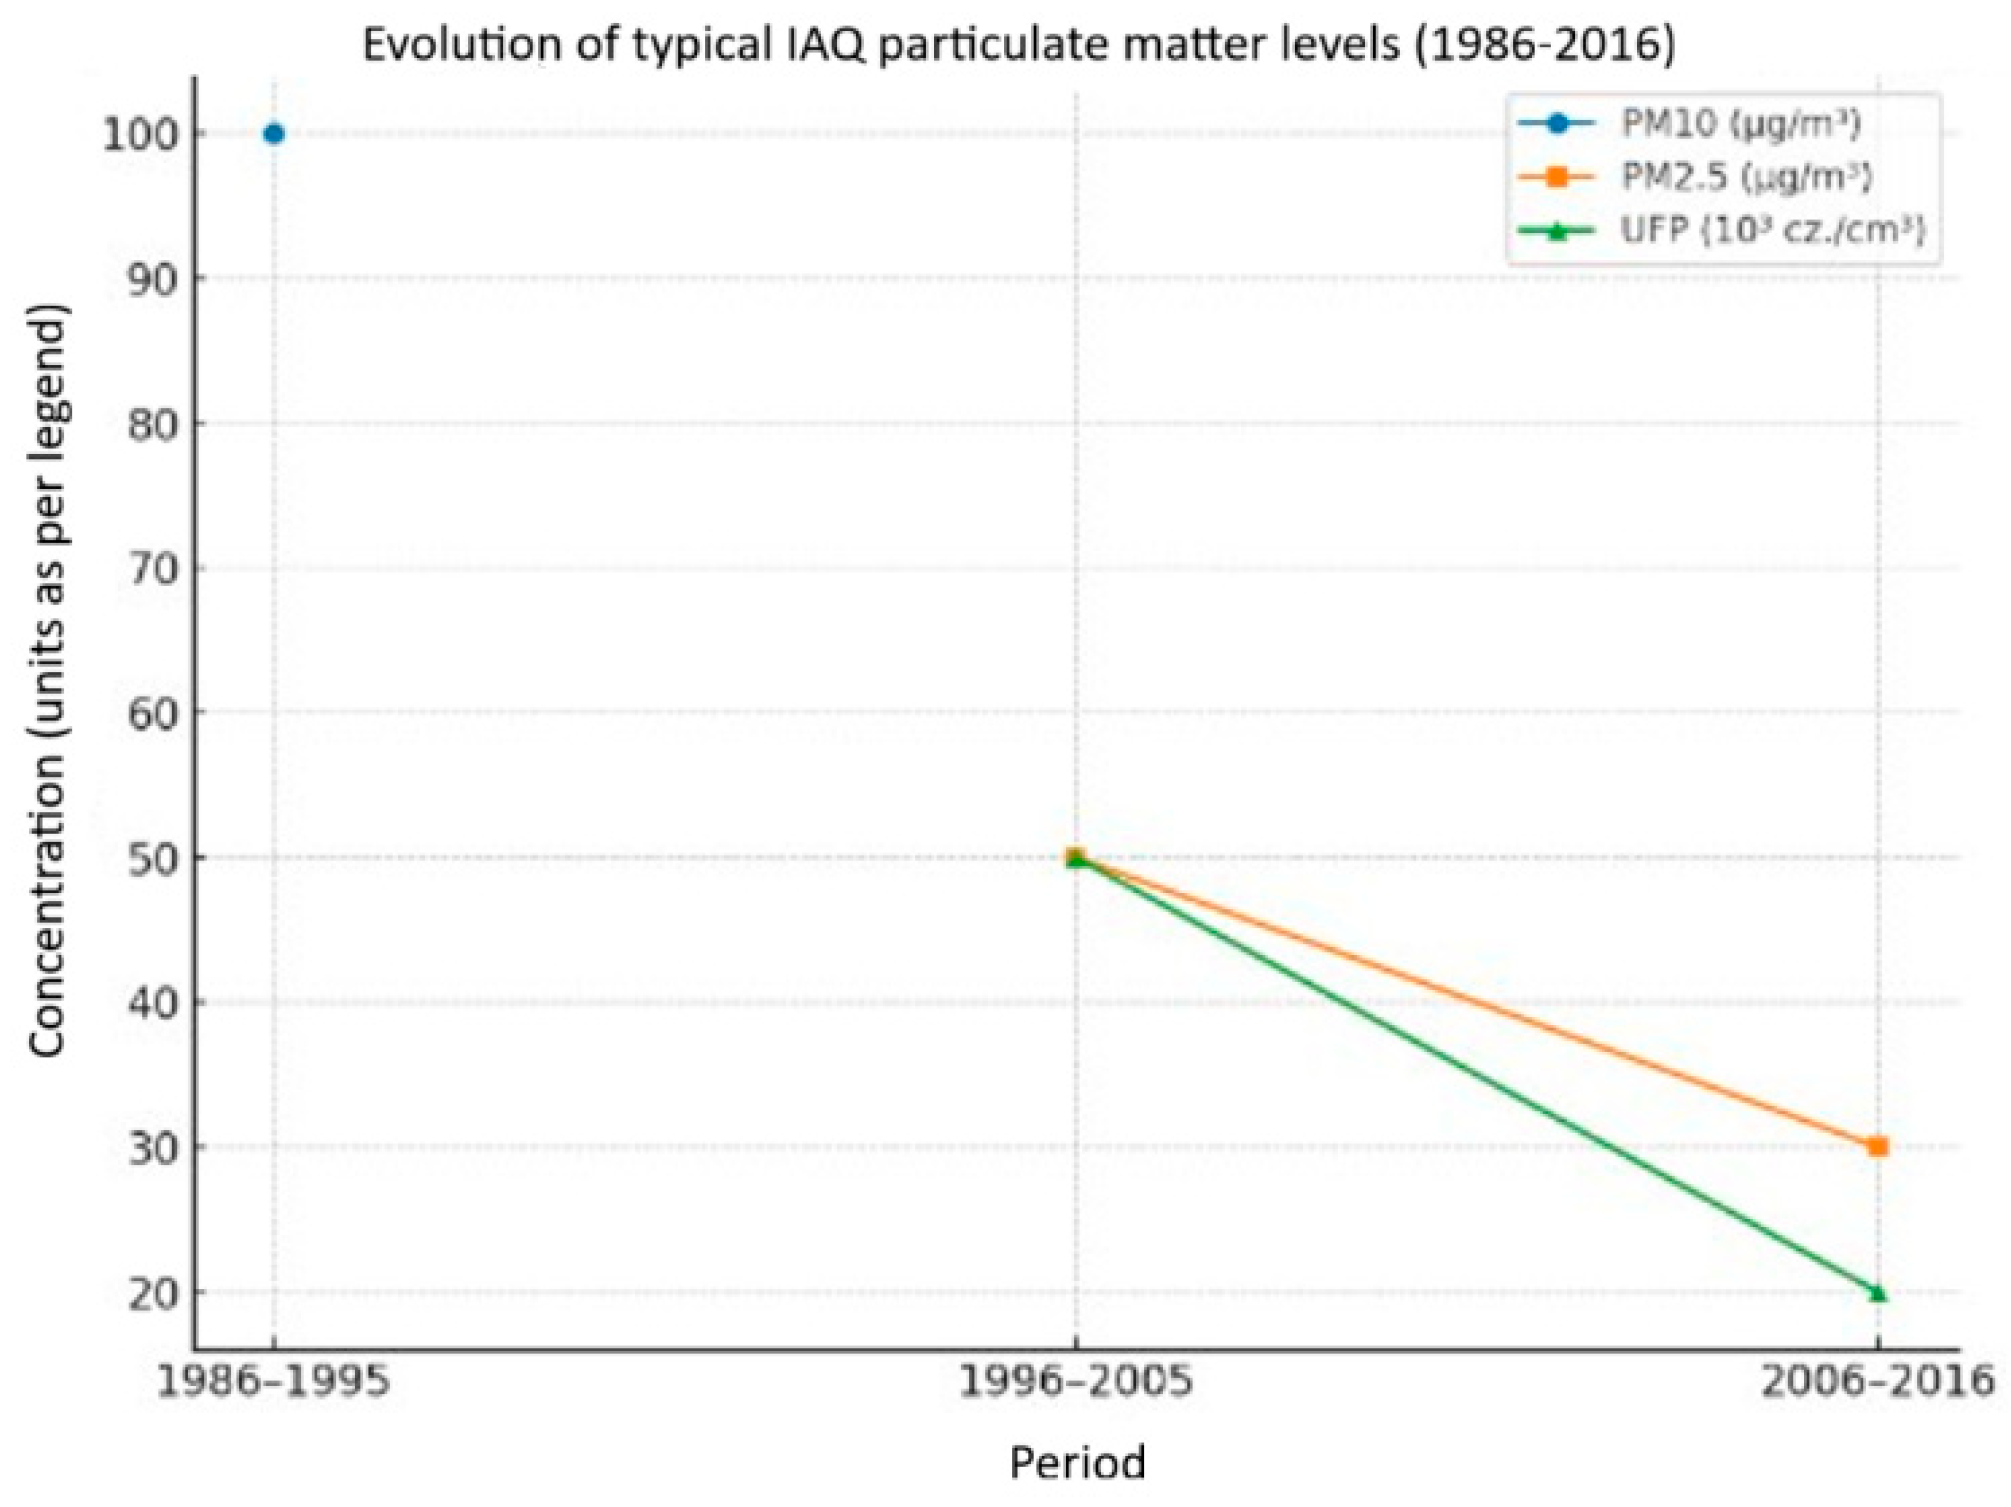
Figure 2.
Changes in temperature (A), relative humidity (B), PM 2.5 (C), and CO2 (D) in the period 130 to 160 days of 2023 [33].
Figure 2.
Changes in temperature (A), relative humidity (B), PM 2.5 (C), and CO2 (D) in the period 130 to 160 days of 2023 [33].
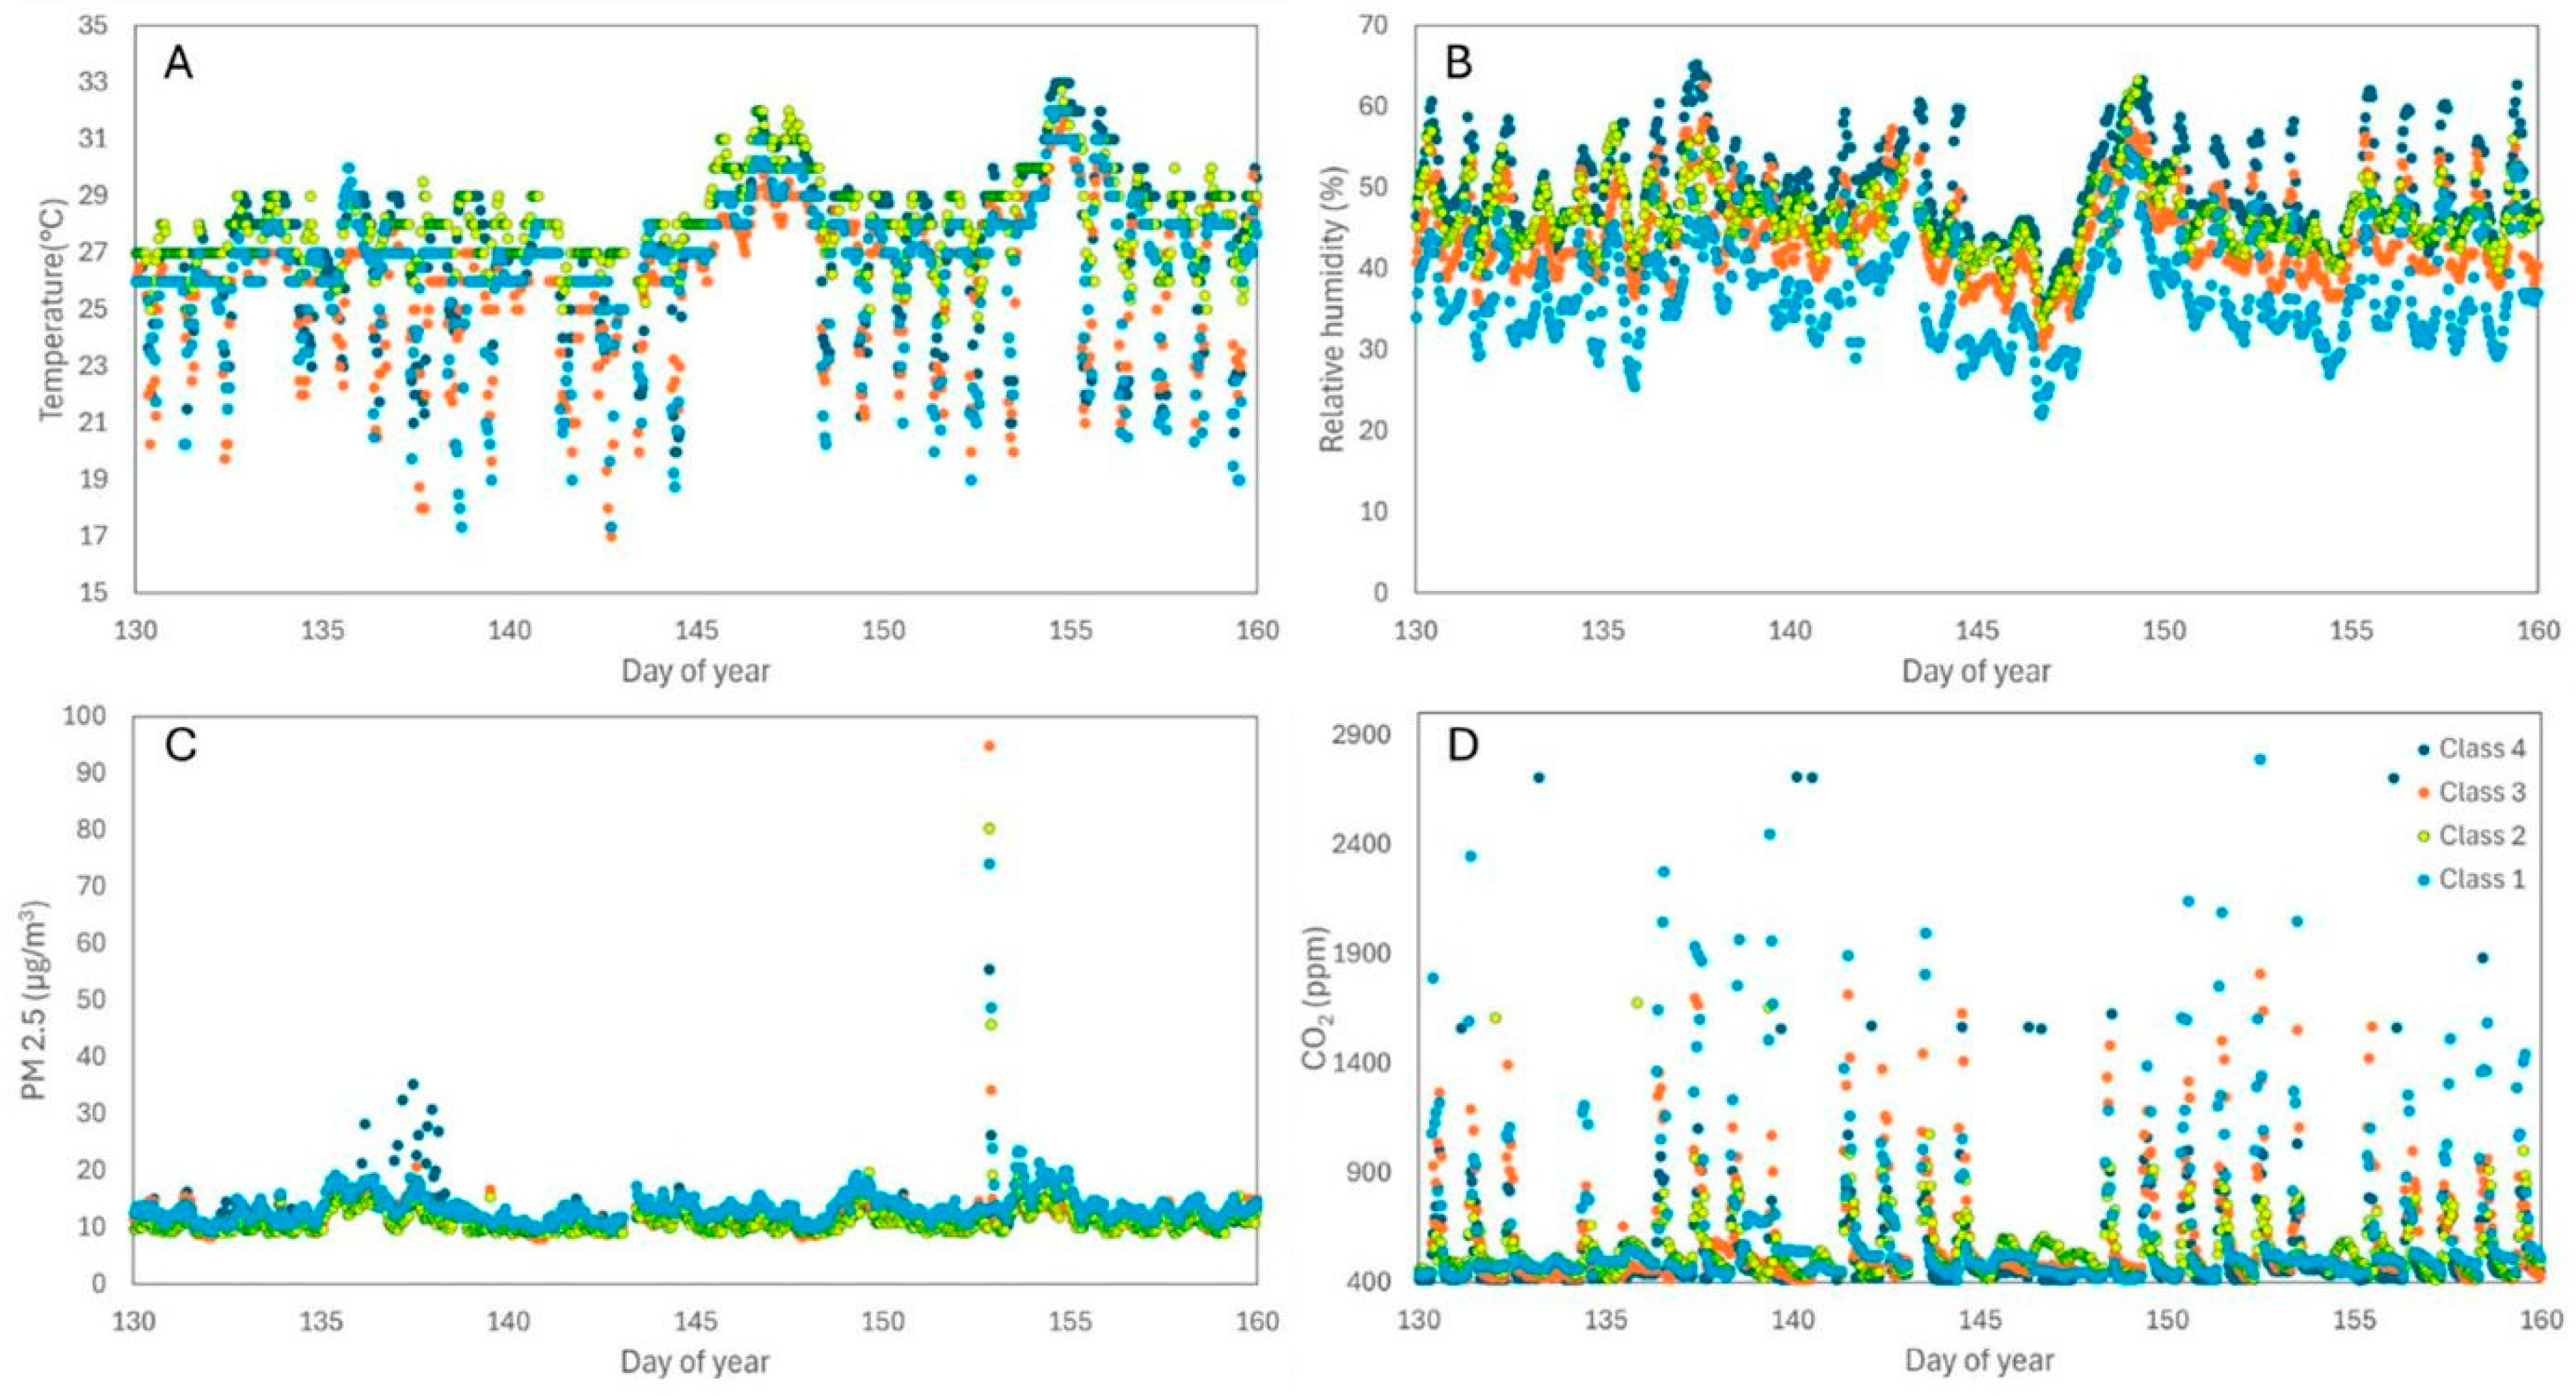
Figure 3.
Daily mean values (8:00 - 14:00) of temperature (A), relative humidity (B), PM 2.5 (C), and CO2 (D) in normal and extreme conditions [33].
Figure 3.
Daily mean values (8:00 - 14:00) of temperature (A), relative humidity (B), PM 2.5 (C), and CO2 (D) in normal and extreme conditions [33].
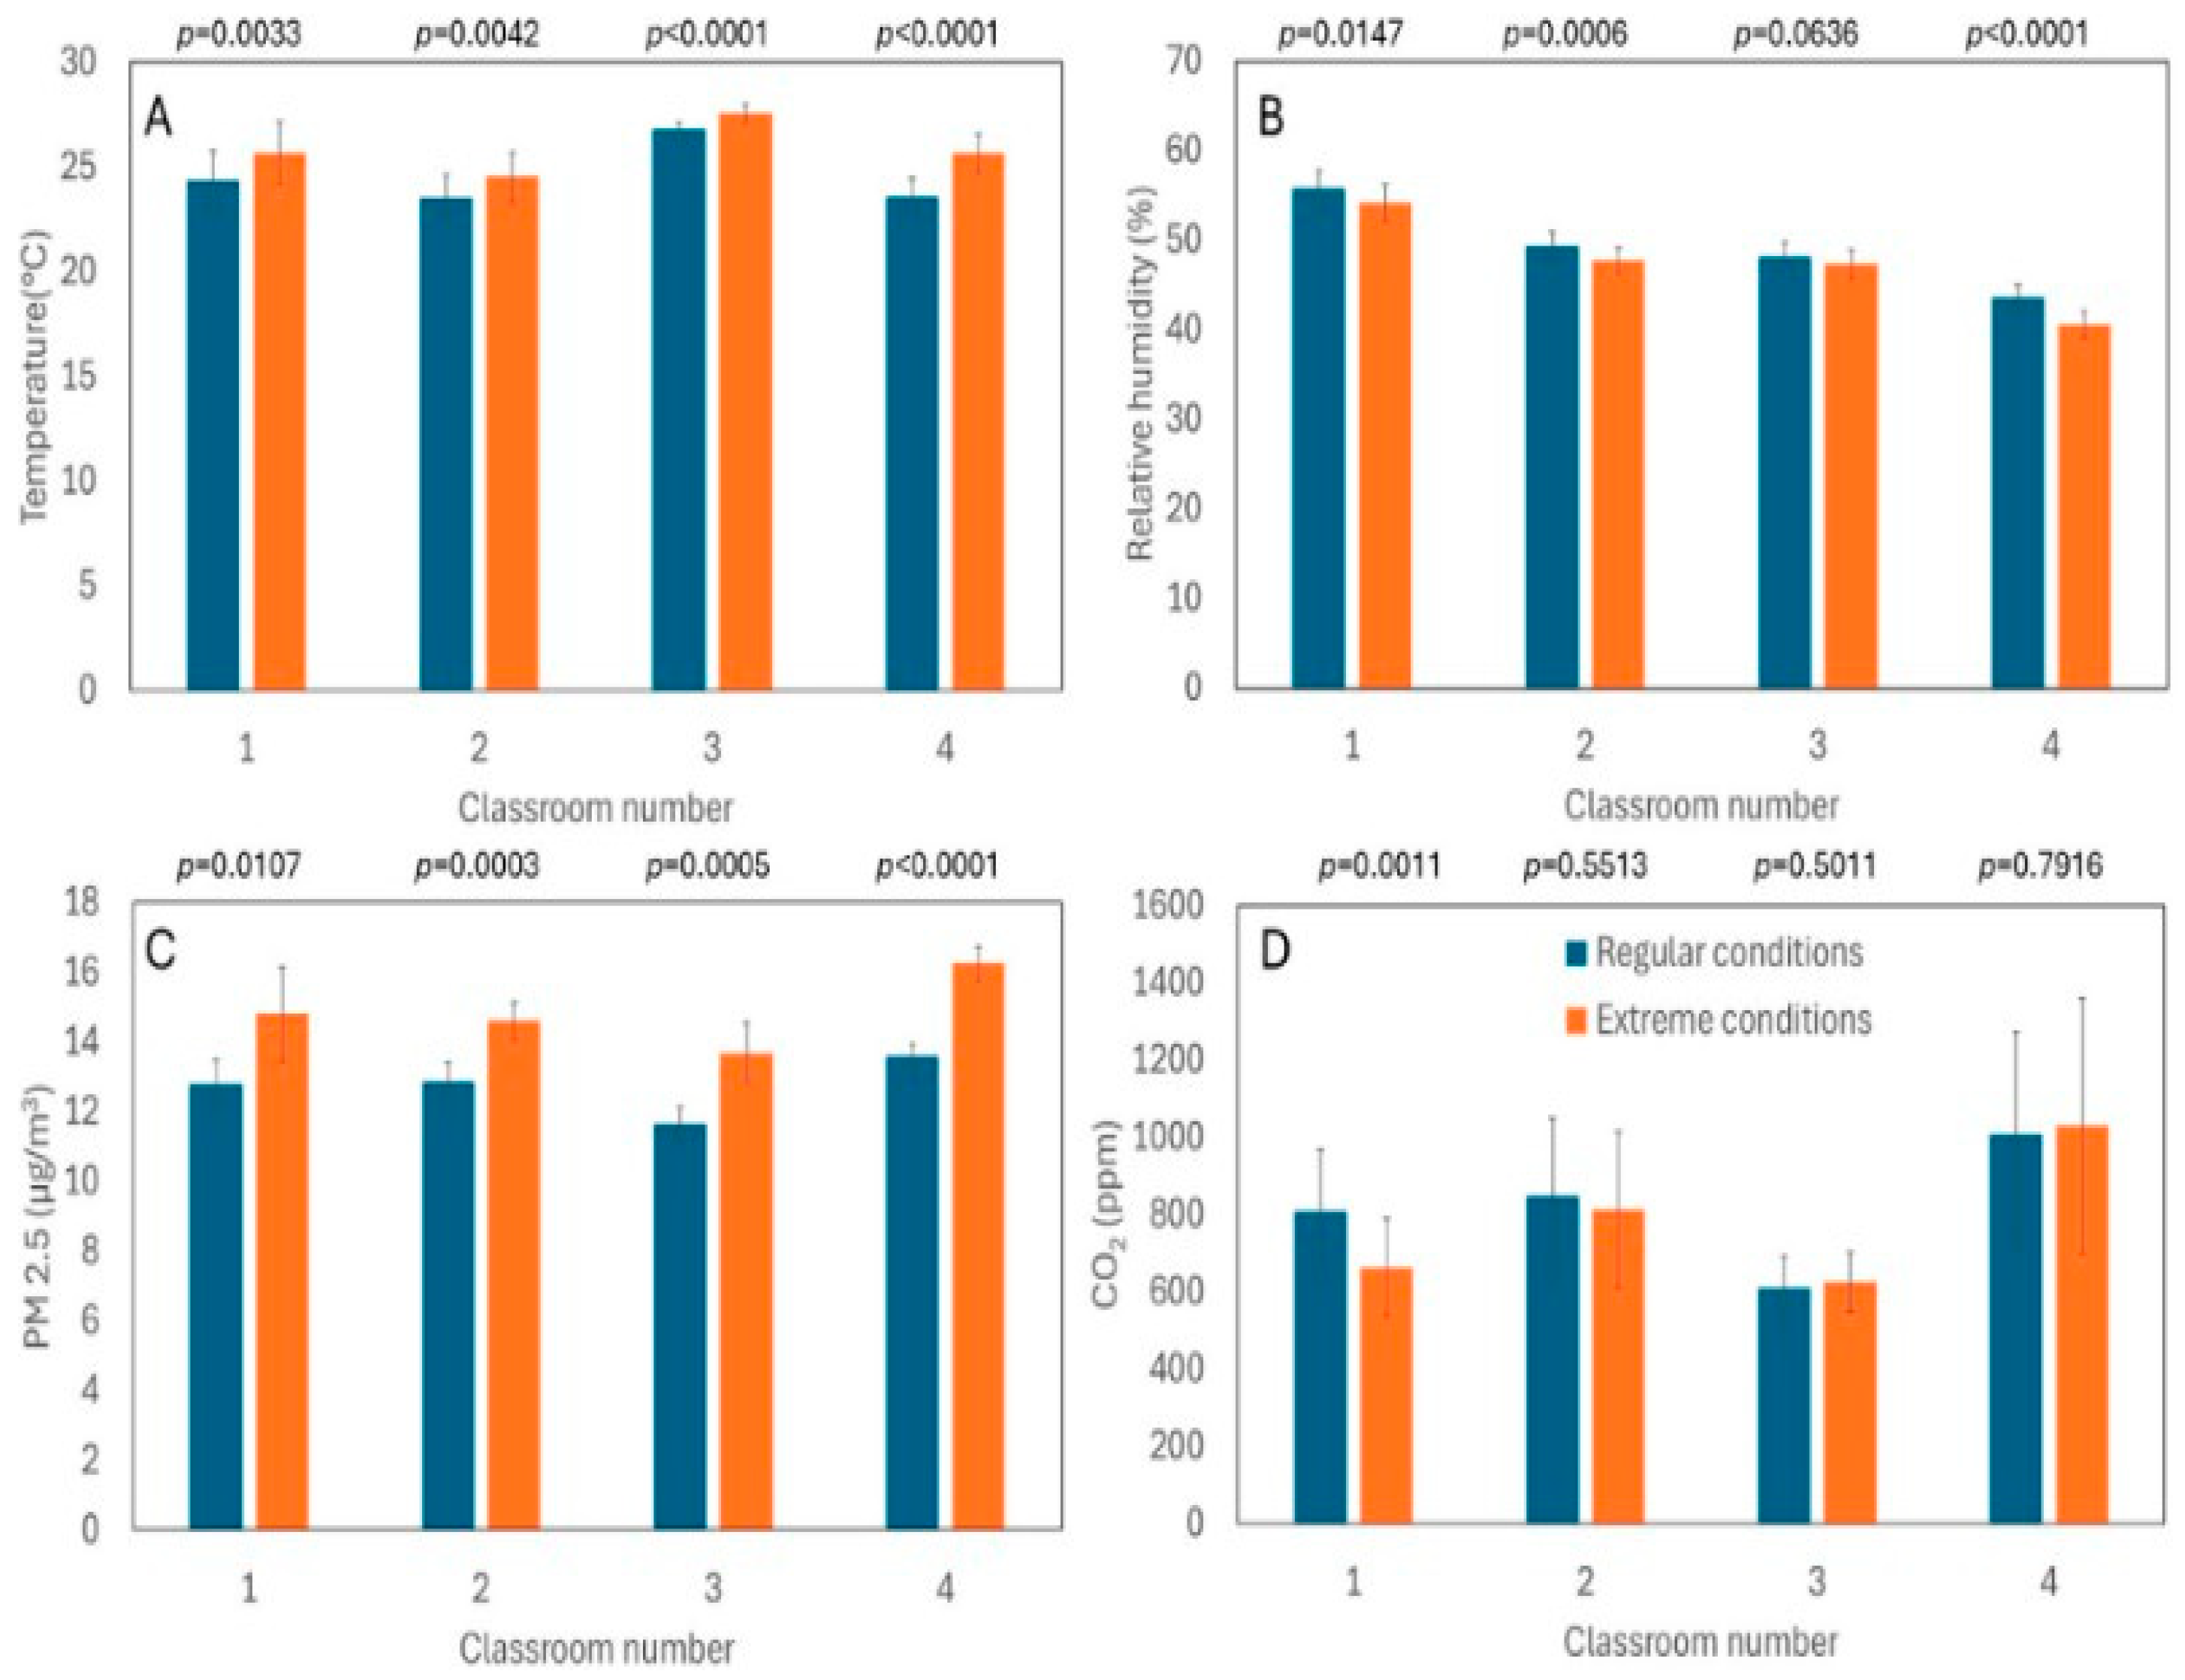
Figure 4.
Comparison of PM 2.5 and PM 10 concentrations in fitness centres [based on 42].
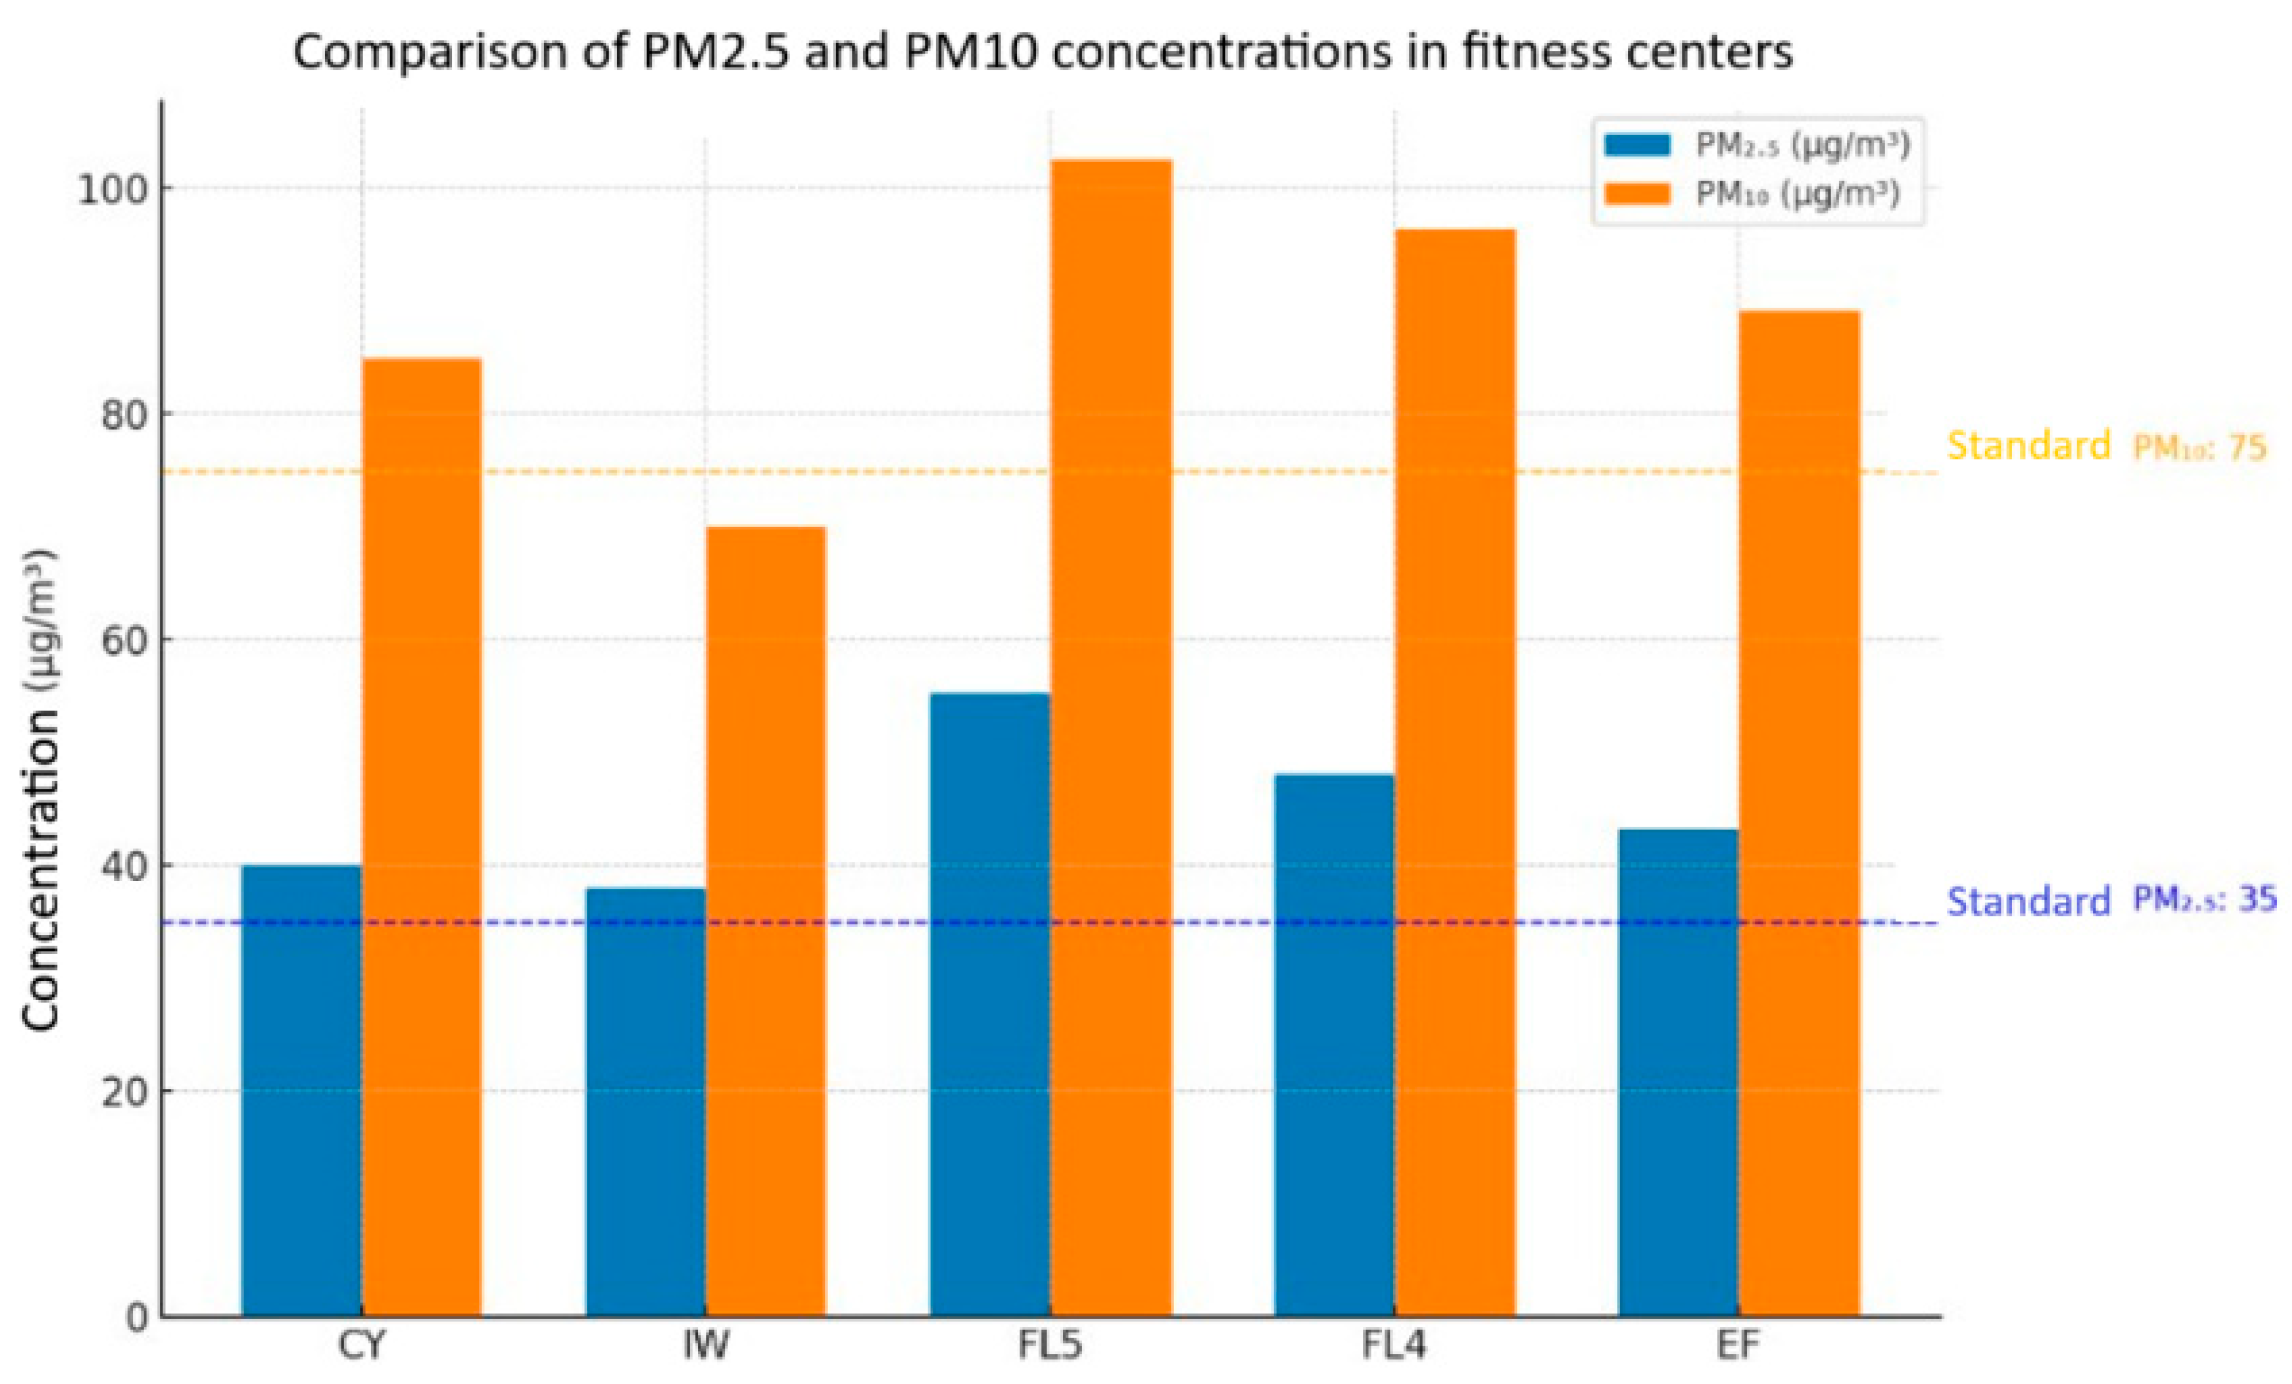
Figure 5.
PM2.5 concentration chart measured with the commercially available sensors INB01, INB02, KAI01, KAI02 compared to the reference sensor (REF) [3].
Figure 5.
PM2.5 concentration chart measured with the commercially available sensors INB01, INB02, KAI01, KAI02 compared to the reference sensor (REF) [3].
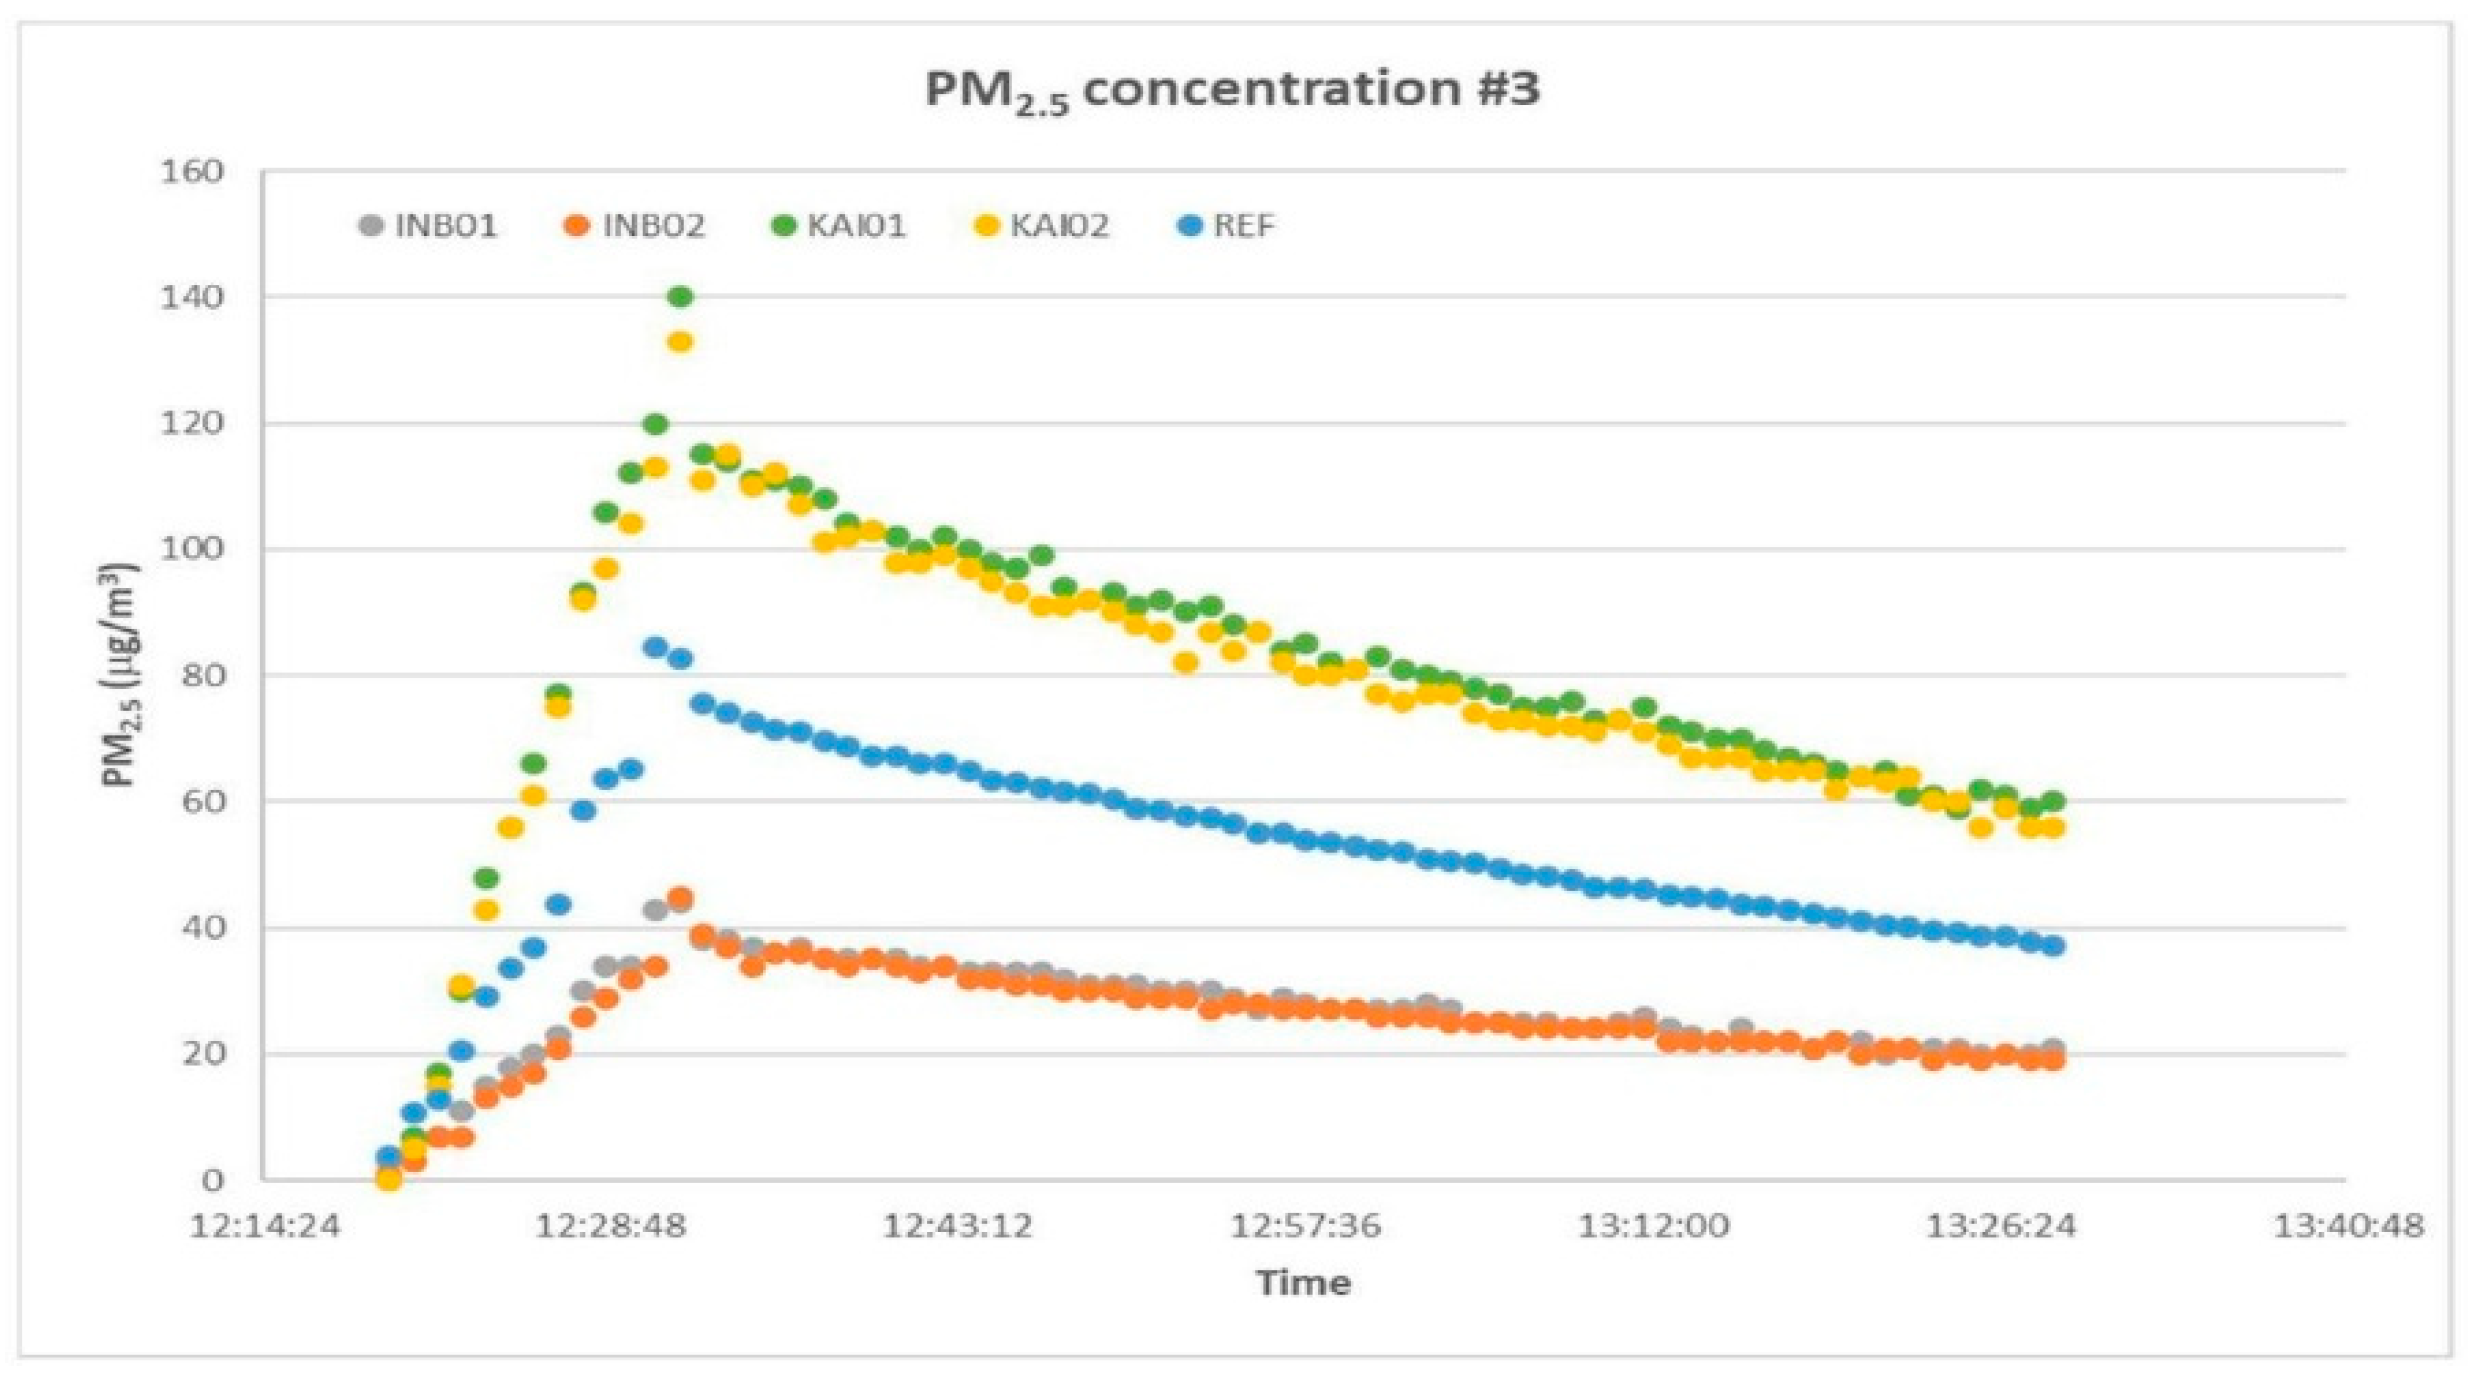
Figure 6.
Graph of PM 10 particle concentration measured by sensors widely available on the market INB01, INB02, KAI01, KAI02 compared to the reference sensor (REF) [3].
Figure 6.
Graph of PM 10 particle concentration measured by sensors widely available on the market INB01, INB02, KAI01, KAI02 compared to the reference sensor (REF) [3].
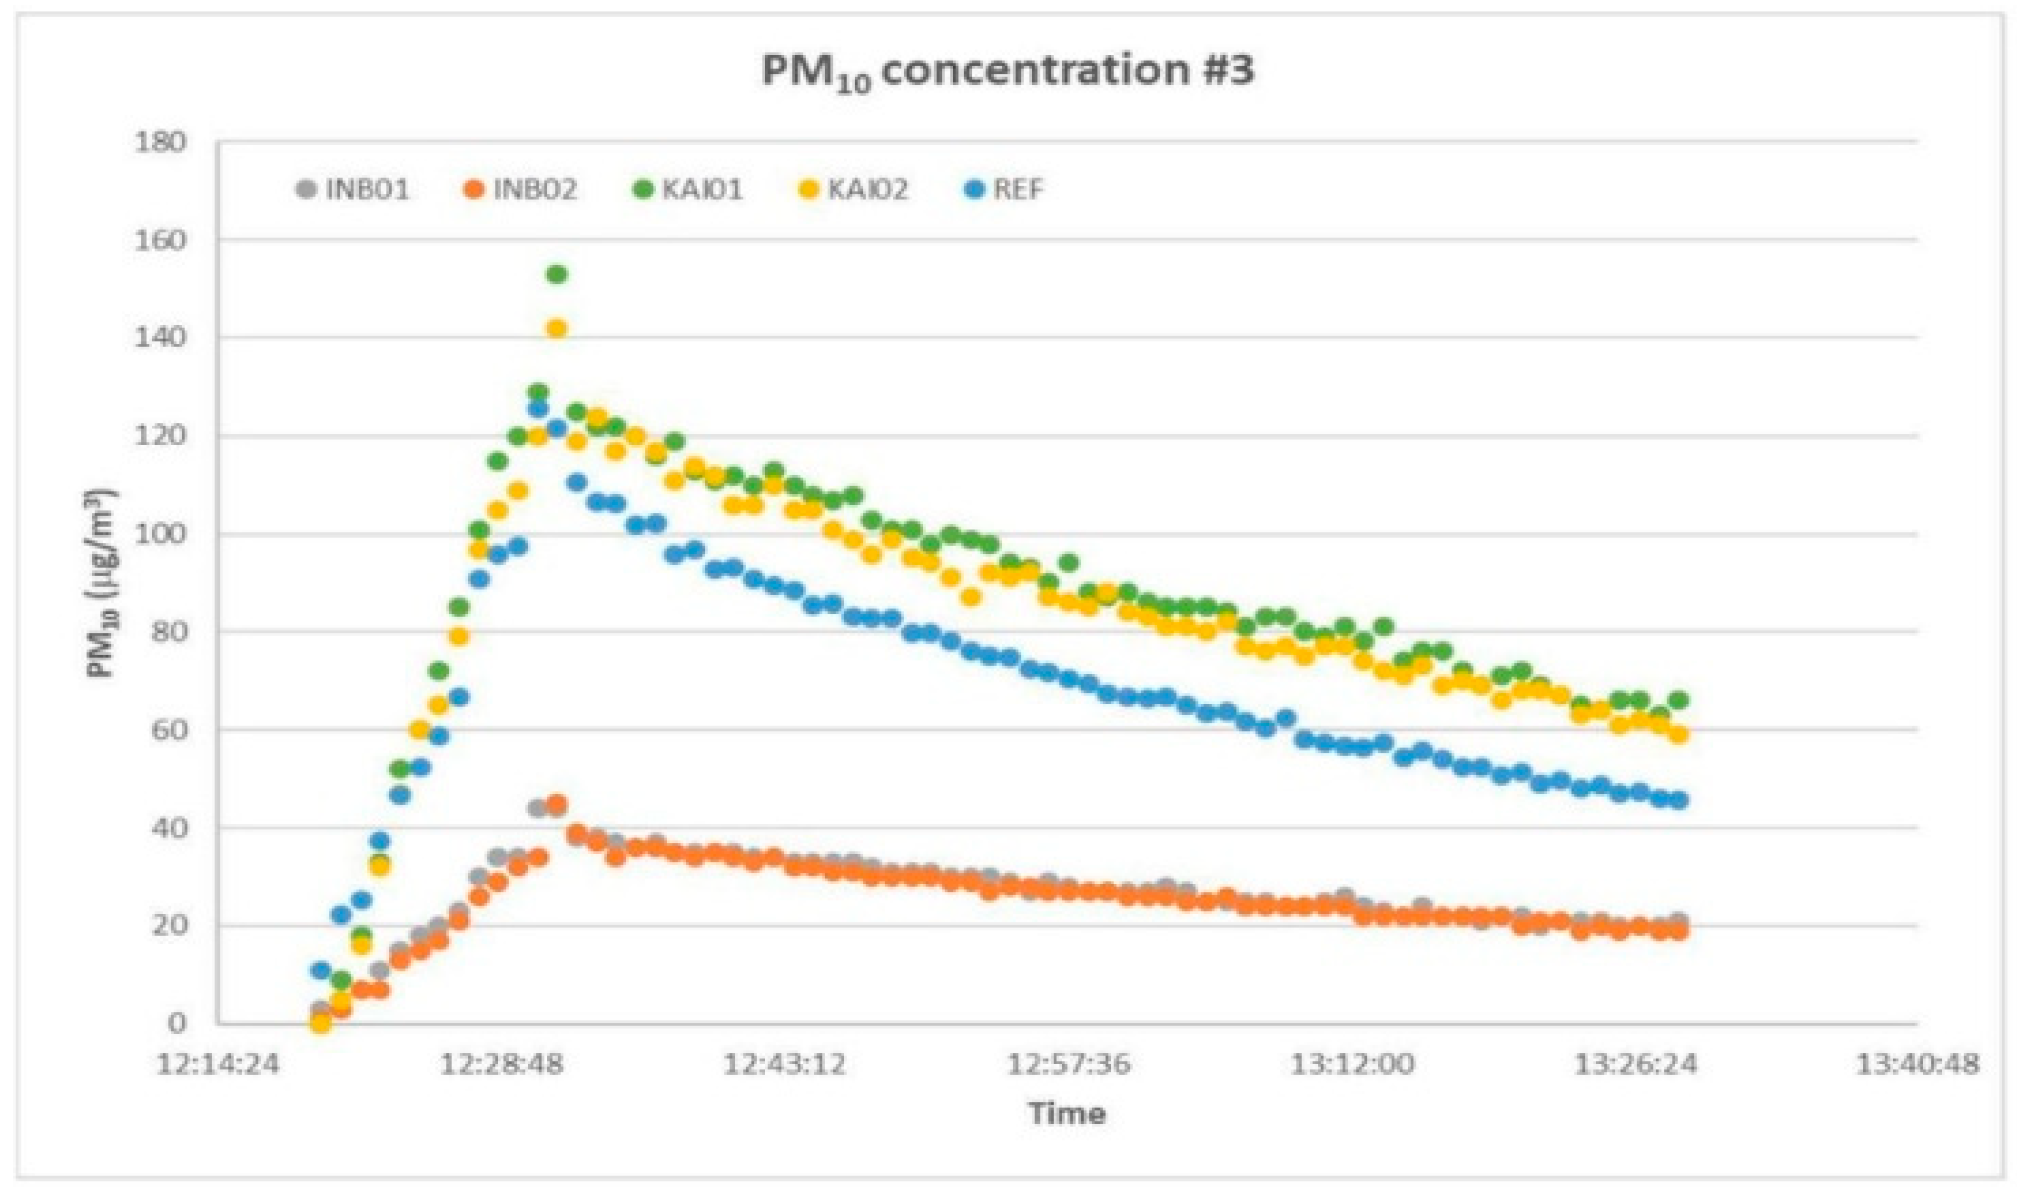
Figure 7.
Q-Air device: (a) assembled unit, (b) components of the device [64].
Figure 7.
Q-Air device: (a) assembled unit, (b) components of the device [64].
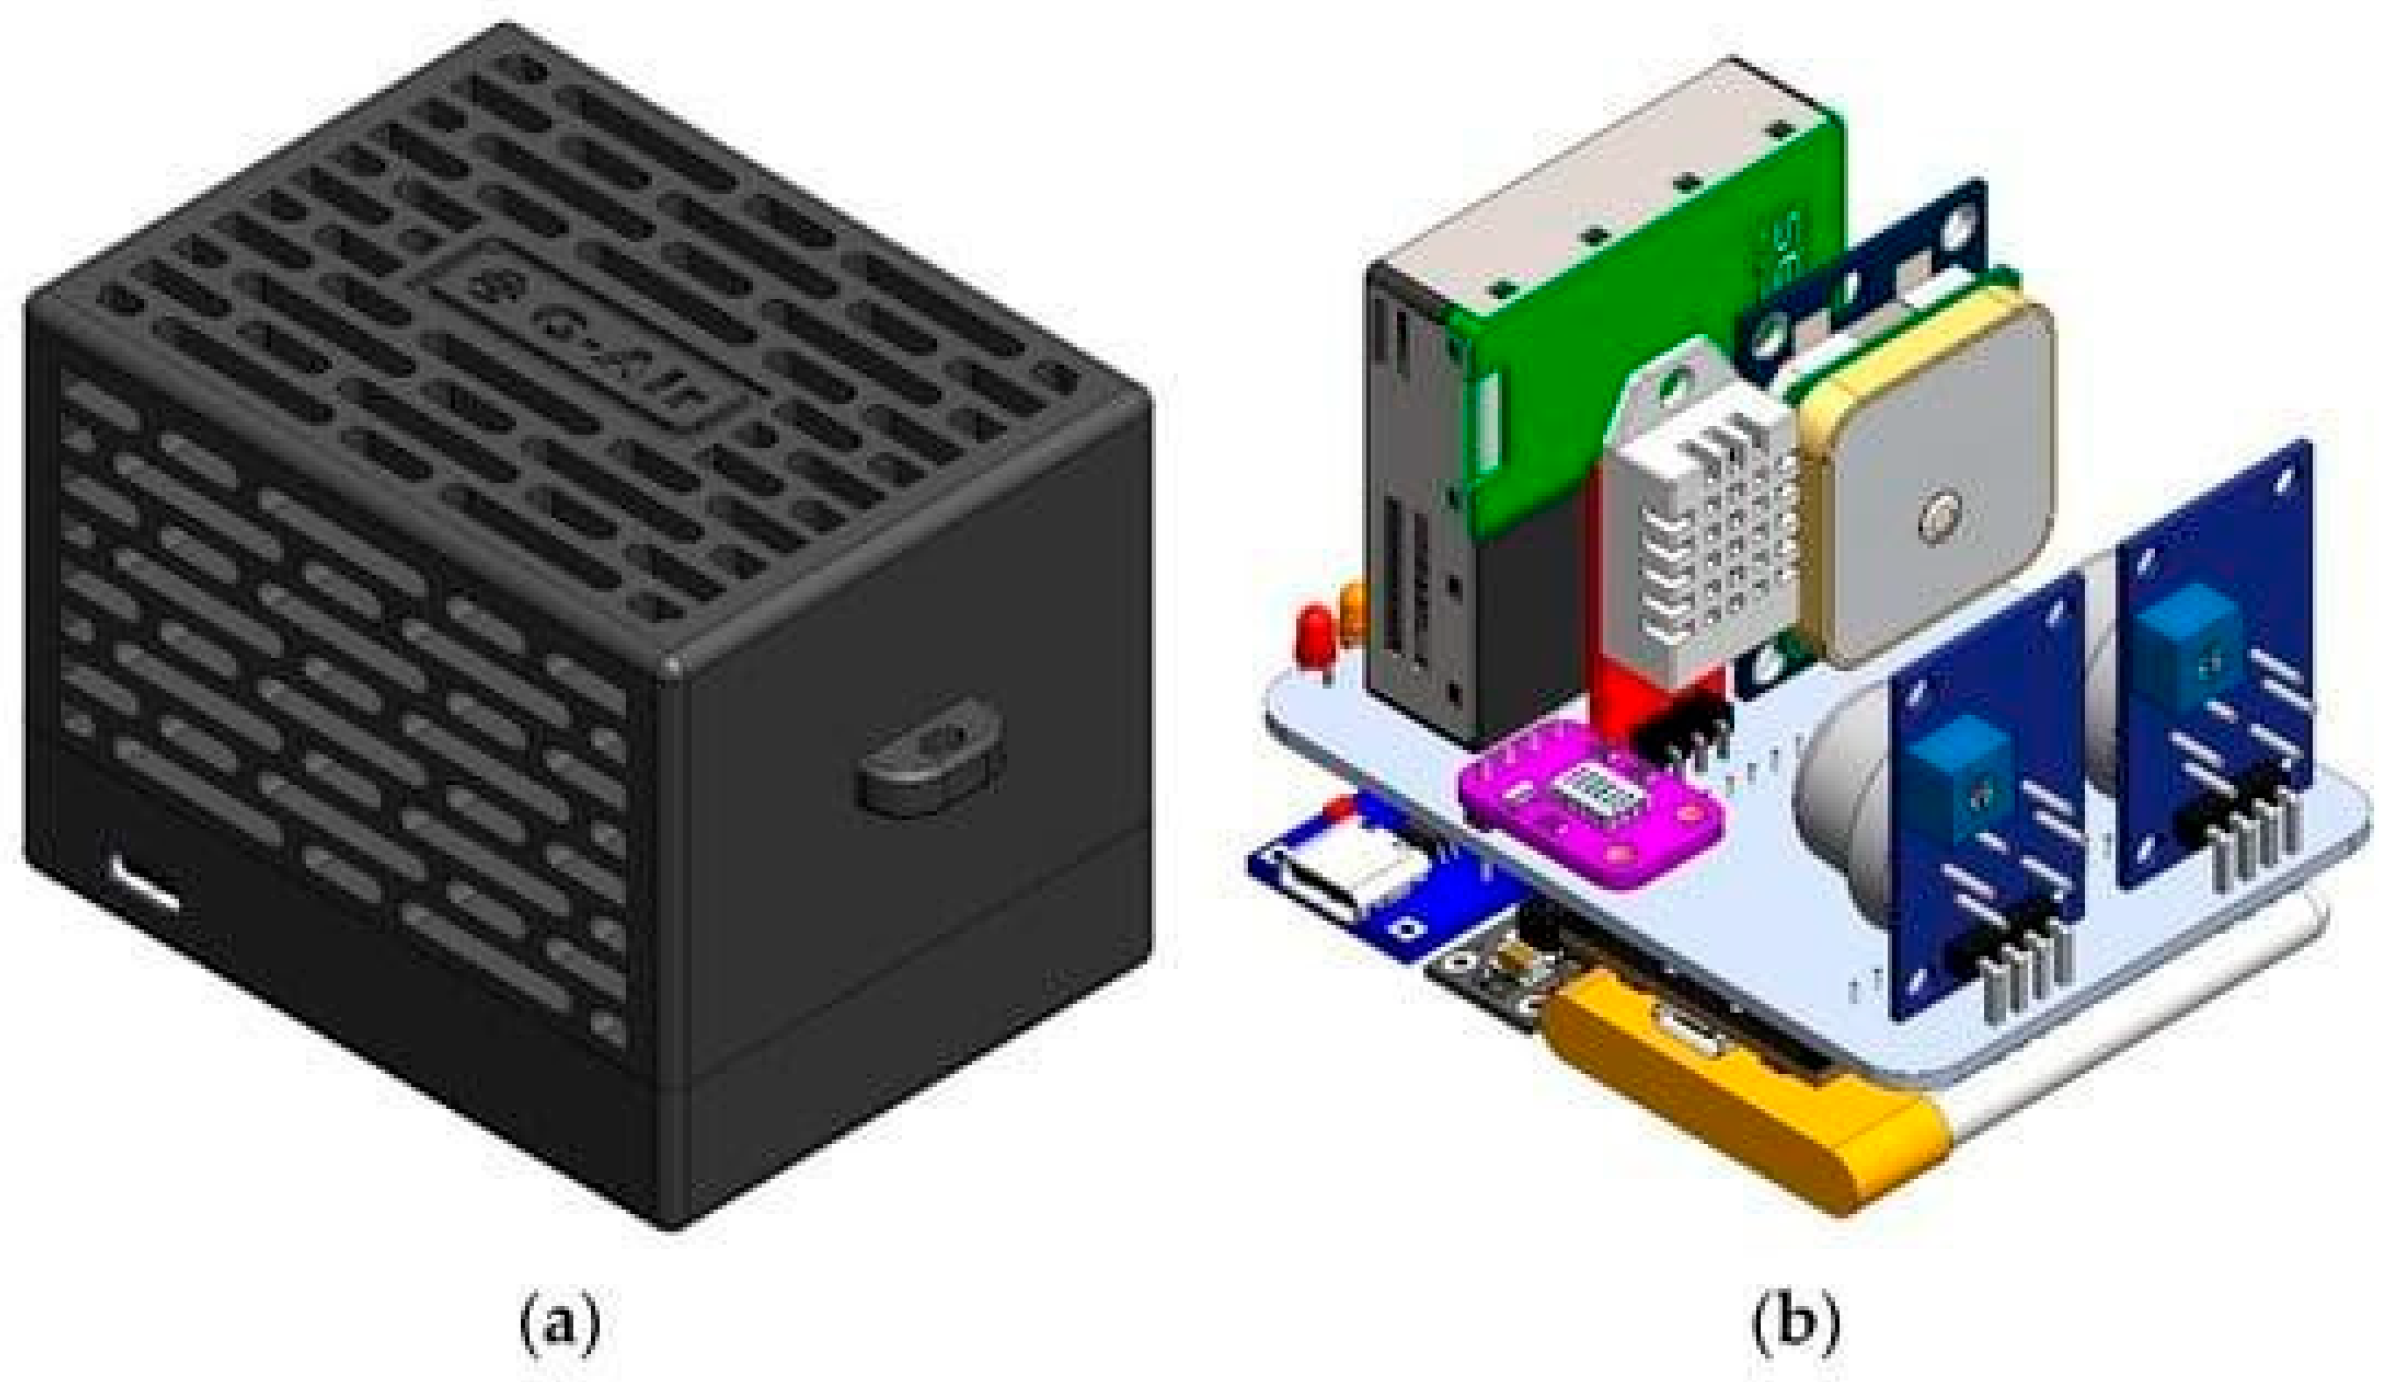
Figure 8.
Experimental chamber: (a) schematic of the experimental setup; (b) real interior view of the chamber [11].
Figure 8.
Experimental chamber: (a) schematic of the experimental setup; (b) real interior view of the chamber [11].
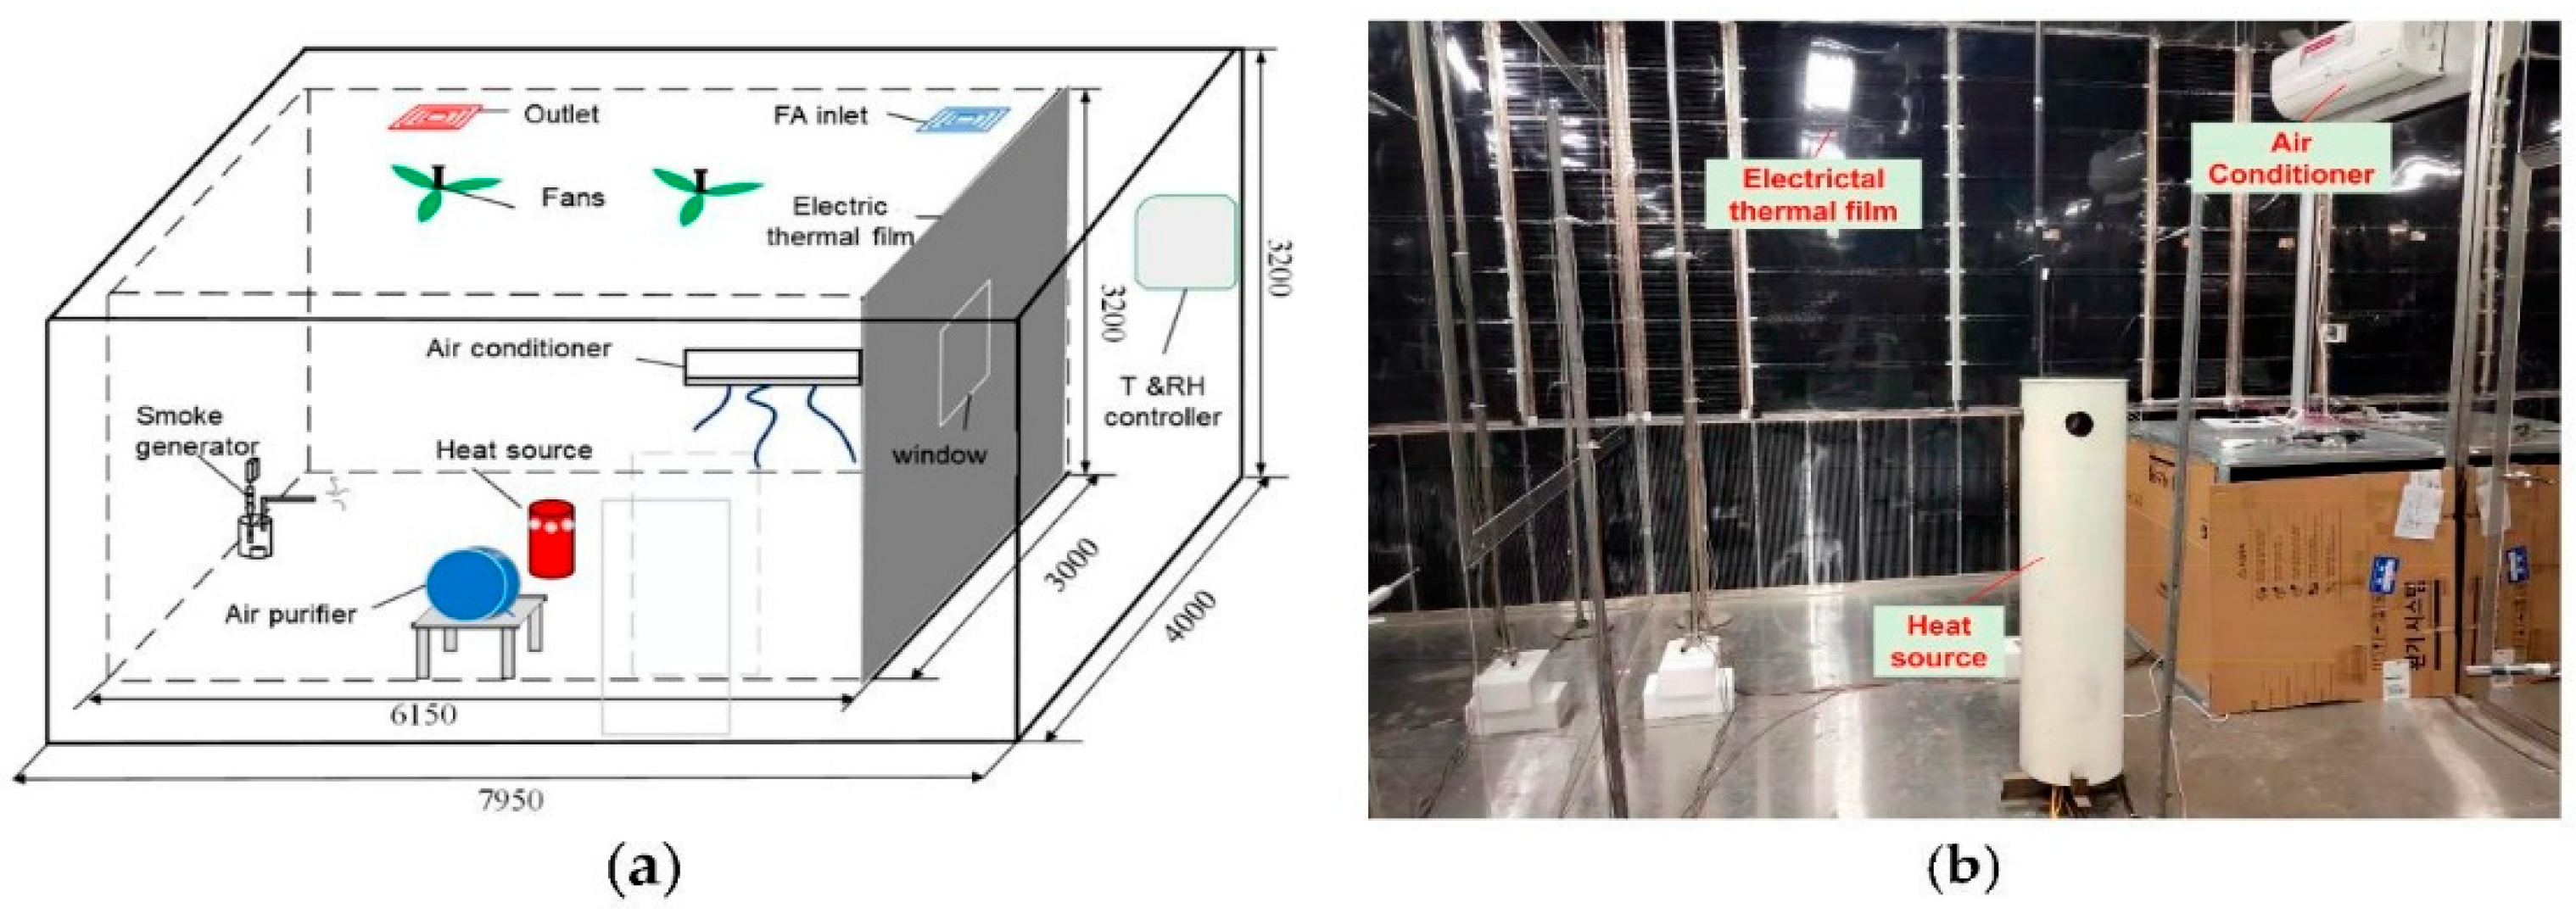
Figure 9.
Green wall located in the experimental cabin [93].
Figure 9.
Green wall located in the experimental cabin [93].
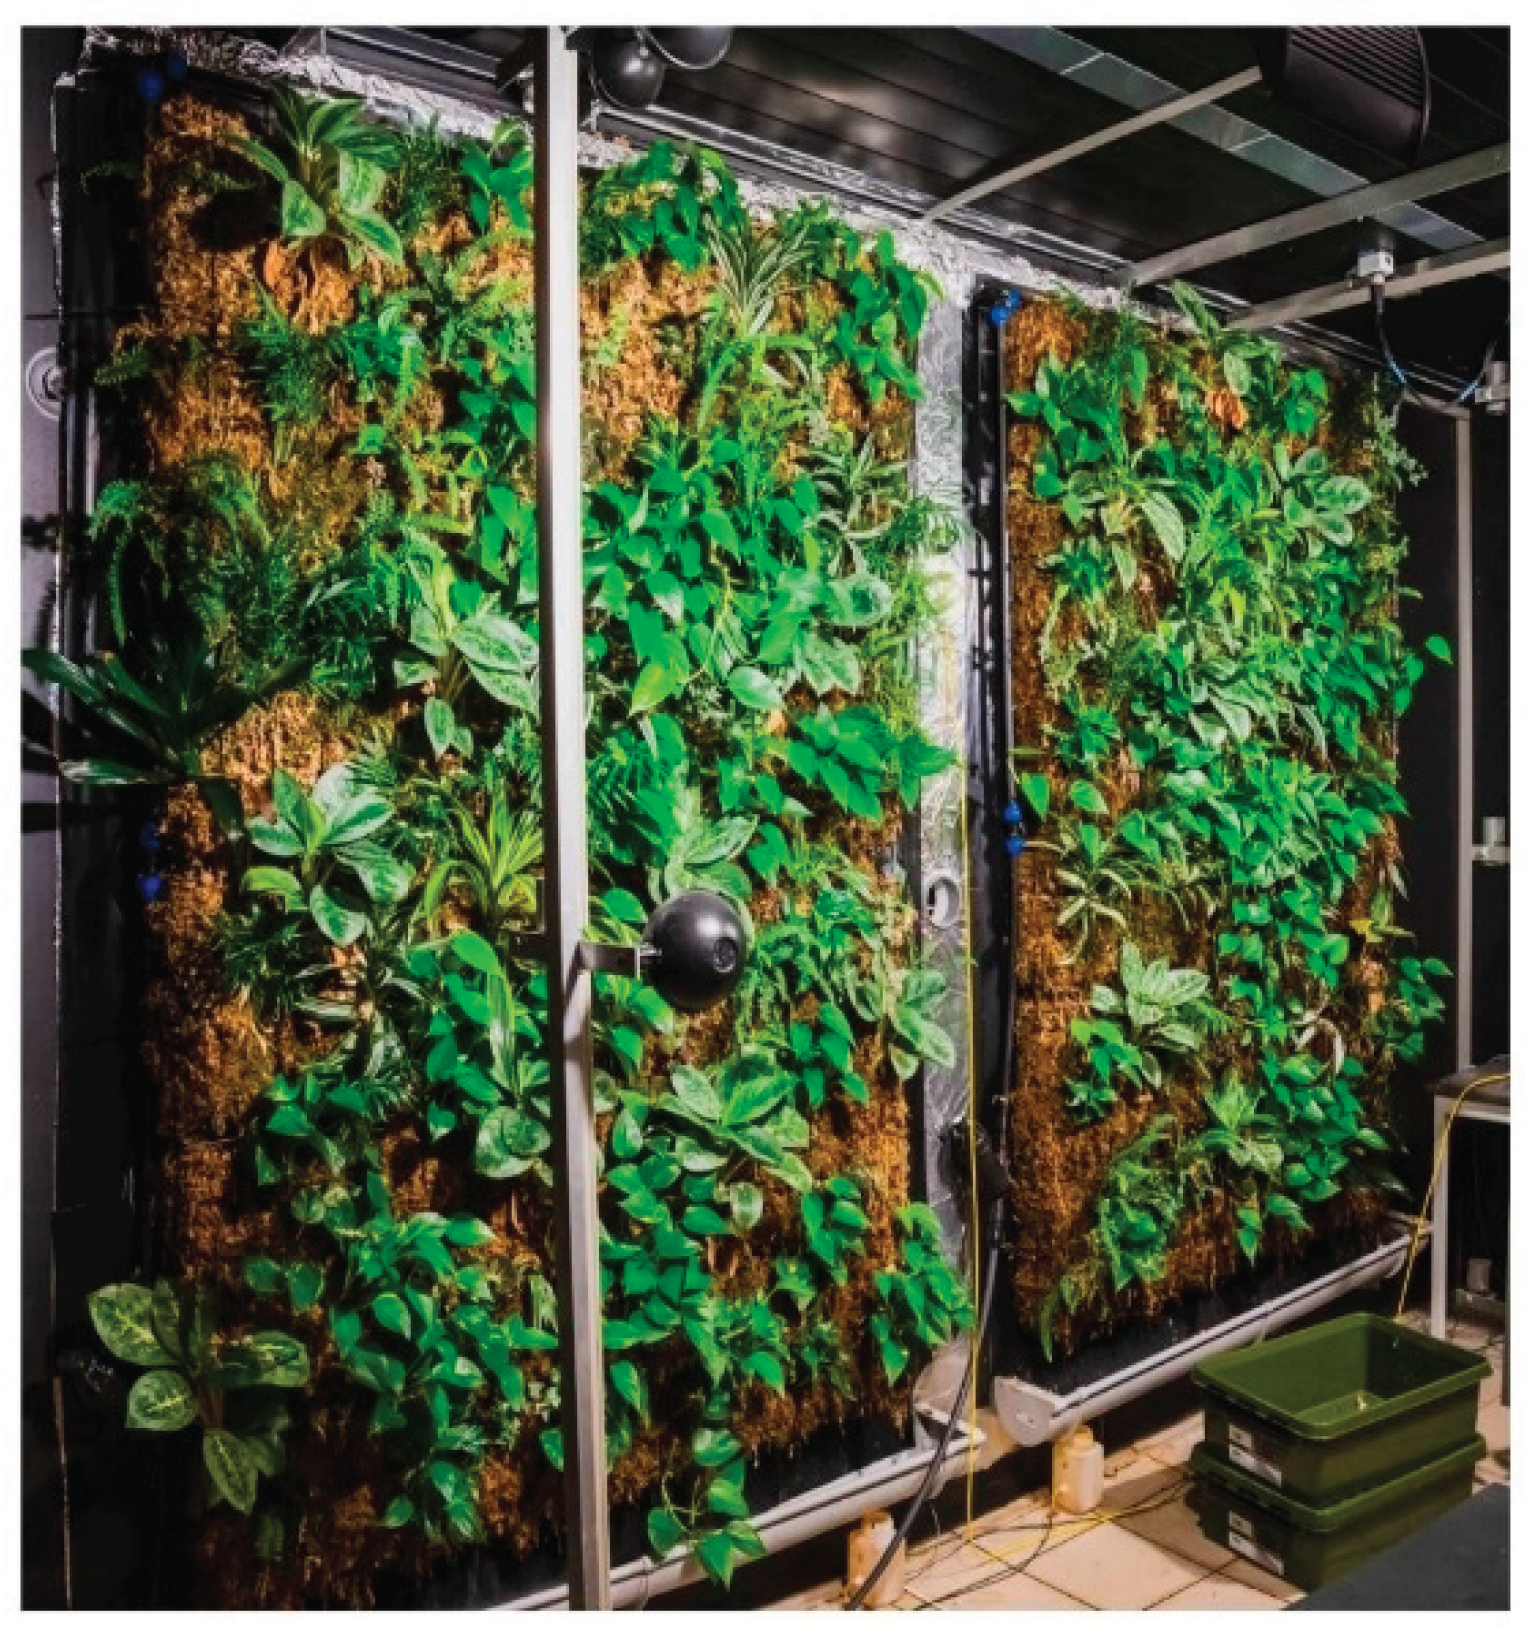

Table 1.
Indoor air PM concentrations [based on 38]. (TSP total concentration).
| Location / Group |
PM 1 (µg·m-3) |
PM 2.5 (µg·m-3) |
PM 10 (µg·m-3) |
TSP (µg·m-3) |
| SU-1 (I) - older | 51.21 | 70.59 | 117.57 | 134.43 |
| SU-1 (II) - younger | 25.97 | 41.17 | 68.26 | 73.05 |
| PU-2 (I) | 78.89 | 106.06 | 149.81 | 163.81 |
| PU-2 (II) | 33.70 | 49.06 | 79.92 | 96.78 |
| PR-3 (I) | 83.64 | 102.05 | 135.93 | 147.54 |
| PR-3 (II) | 78.13 | 80.94 | 104.90 | 124.24 |
| SR-4 (I) | 102.11 | 125.69 | 166.12 | 184.24 |
| SR-4 (II) | 49.04 | 67.65 | 81.49 | 91.19 |
| Average - urban area | ~47.4 | ~66.7 | ~103.9 | ~117.0 |
| Average - rural area | ~78.2 | ~94.1 | ~122.1 | ~136.8 |
Table 2.
Air quality standards according to the EPA (Taiwan) and measured results from fitness centres [based on 42].
Table 2.
Air quality standards according to the EPA (Taiwan) and measured results from fitness centres [based on 42].
| Parameter | EPA Standard (Taiwan) |
Range of results in the fitness centers surveyed |
Exceedings |
| CO2 | ≤ 1000 ppm | 776 ppm | FL5 - 776 ppm |
| CH2O | ≤ 0,08 ppm | 0,20-1,36 ppm | All fitness centres |
| VOCs | ≤ 0,56 ppm | 0,6-1,21 ppm | FL4 |
| PM 2.5 | ≤ 35 µg·m-3 | 30,6-55,3 µg·m-3 | FL5 - 55,3 µg·m-3; FL4 - 48,1 µg·m-3; EF - 42,3 µg·m-3; |
| PM 10 | ≤ 75 µg·m-3 | 70,8-102,6 µg·m-3 | FL5 -102,6 µg·m-3; FL4 - 96,4 µg·m-3; EF -89,23 µg·m-3; |
| CO | ≤ 9 ppm | 0-2 ppm | No exceedances |
| O3 | ≤ 0,06 ppm | 0 ppm | No exceedances |
Table 3.
Correlations between parameters [based on 42].
| Dependence | R (correlation coefficient) |
| Temperature - CH2O/CO2/VOCs | 0.3-0.7 (moderate) |
| Humidity - CH2O/CO2/VOCs | 0.3-0.7 (moderate) |
| CH2O - VOCs | > 0.7 (strong) |
| CO2 - VOCs | > 0.7 (strong) |
| CH2O - CO2 | > 0.7 (strong) |
| PM 2.5/ PM 10 - Temperature | 0.3-0.5 (moderate) |
| O3 - other parameters | 0 (no correlation) |
Table 4.
Numerical results (average daily doses of PM 4) [based on 43].
| Group |
Heating season (µg·d-1) |
Off season (µg·d-1) |
Heating season (µg·kg-1·d-1) |
Off season (µg·kg-1·d-1) |
| Students | 337 | 92 | 6,7 | 2 |
| Teachers | 377 | 118 | 5,3 | 1,6 |
| Sportsman | 473 | 145 | 6,6 | 1,8 |
Table 5.
Summary of research on particulate matter in air inside historic buildings around the world.
Table 5.
Summary of research on particulate matter in air inside historic buildings around the world.
| No. | City | Object | Type of study | Study results |
| 1. | China [56] |
Potala Palace Museum in Tibet | X-ray fluorescence analysis (XRF) | Studies have shown that the concentration of PM 1-10 particulate matter outdoors was lower than indoors. Airborne particles were classified into four categories: soil dust brought in by outdoor tourists, incense ash, human-induced pollution, and ores. |
| 2. | Milan [57] |
The refectory of the Church of Santa Maria Delle Grazie, which houses Leonardo da Vinci's "The Last Supper" | chemical mass balance model |
11.2 % of the particles came from gasoline cars, urban soil and wood smoke |
| 3. | Czech Republic [58] |
The Baroque Library Hall of the National Library in Prague | chemical mass balance model |
Tourists contribute to 35 % of indoor particulate matter |
| 4. | China [59] |
Museum in the Shanghai CBD | chemical mass balance model |
The coarse particles were mainly soot aggregates and minerals, while the fine particles were mainly soot aggregates. Ca, Si, Al, Na, C, O, S, and Mg were enriched in the coarse particles, and S was mainly enriched in the fine particles. |
| 5. | Italy [60] |
The Correa Museum in Piazza SAN Marco in Venice | electron probe X-ray microanalysis and scanning electron microscopy with energy-dispersive X-ray measurement (SEM-EDX) | Calcium-rich particles, aluminosilicates, and organic materials were the most dominant particles. Calcium-rich solid particles (from poor wall condition) |
| 6. | Belgium [61] |
Royal Art Gallery of Antwerp | chemical mass balance model |
In winter, construction activities were the main source of Ca- and Ca-Si-rich particles. Sea salt was also present in the atmosphere. In summer, Ca concentrations were low, while S concentrations were abundant. |
| 7. | China [62] |
Museum of the Terracotta Warriors and Horses of Emperor Qin | electron microscopy and energy-dispersive X-ray spectrometry (SEM-EDX) | Most of the airborne particles in the museum consisted of soil dust, sulphur-containing particles, and low-sulphur particles such as soot aggregates and biogenic particles - tourists contribute to indoor airborne particulate matter |
| 8. | Belgium [63] |
Plantin-Moretus Museum/Printing Workshop Antwerp | energy-dispersive X-ray fluorescence (EDXRF) and electron probe microanalyzer (EPMA) methods | The results show that in the fine fraction, the proportion of C-rich particles ranged from 35 % to 80 %, while in the coarse fraction these values ranged from 25 % to 45 %. |
Table 5.
Technical specifications of indoor air quality monitoring devices [3].
Table 5.
Technical specifications of indoor air quality monitoring devices [3].
| Device | MICA (inBiot) | Sensedge Mini (Kaiterra) |
| Measured parameters | CO2, PM 1, PM 2.5, PM 4, PM 10, Formaldehyde, TVOC, Temperature, RH |
CO2, PM 2.5, PM 10, TVOC, Temperature, RH |
| Measurement accuracy PM | ±5 µg·m-3 + ±5% (0–100 µg·m-3); ±10% (100–1000 µg·m-3) |
±3 µg·m-3 (0–30 µg·m-3); ±10% (30–1000 µg·m-3) |
| Measurement technology | laser scattering technology | laser scattering technology |
| Technical certificates | RESET, WELL | RESET, WELL |
| Cost (€) | 500 | 750 |
Table 6.
Comparison of measurement devices used for the assessment of PM concentration, including technical data.
Table 6.
Comparison of measurement devices used for the assessment of PM concentration, including technical data.
| No. | Device | Sensor type | Measured parameters | Typical applications |
Accuracy/role in research |
Measurement range |
| 1 | TSI SidePak AM510 [48] |
Portable dust monitor | PM 2.5, PM 10 | Personal exposure, sports, schools | High, mobile | 0,001–20 mg·m-3 (1–20 000 µg·m-3) |
| 2 | TSI DustTrak II/DRX [49] |
Laser dust monitor | PM 1, PM 2.5, PM 4, PM 10 | Laboratories, epidemiology, fitness |
Very high, reference |
0,001–150 mg·m-3 (II), 0,001–400 mg·m-3 (DRX) |
| 3 | GrayWolf AdvancedSense [67] |
IAQ – multi-parameter | PM, VOCs, CO2, T, RH | Comprehensive IAQ research | Very high | up to 100 000 µg·m-3 (depending on the module) |
| 4 | PCE-PQC 34 [68] |
Particle counter | PM 1, PM 2.5, PM 4, PM 10, number of particles | Scientific research, reference | Very high | 0,3–25 µm (size range, mass dependent mode) |
|
5 |
PurpleAir [69] |
Optical PM sensor | PM 1, PM 2.5, PM 10 | Citizen science networks, global monitoring | Average (compensated by quantity) | 0–1000 µg·m-3 |
| 6 | inBiot MICA [70] |
IAQ | CO2, PM 2.5, PM 10, VOCs, T, RH | Schools, offices, education | Good, implementation | 0–1000 µg·m-3 |
| 7 | Kaiterra [71] |
IAQ | CO2, PM 2.5, VOCs, T, RH | Offices, homes, schools | Popular, easy to use | 0–1000 µg·m-3 |
| 8 | Canāree A1 [72] |
Personal IAQ | PM 2.5, PM 10, VOCs, CO2, T, RH | Individual monitoring | Good, unique mobility | 0–6000 µg·m-3 |
| 9 | GreenYourAir Device 1178/PM2.5 [19] |
PM network sensor | PM 2.5 | Fieldwork (Greece) | Average | Measurement every 3 minutes, long-term |
| 10 | Qingping Air Monitor Lite [28,73] |
IAQ sensor | PM 2.5, CO2, T, RH | Academician (Beijing) | Satisfactory | 0–1000 µg·m-3 |
| 11 | Sampler ARA N-FRM [28] |
Reference sampler | PM 2.5 | Reference studies | Very high (reference) |
Reference method |
| 12 | HPMA115S0 [35,74] |
Sensor PM | PM 2.5, PM 10 | Schools (Portugal) | Average (15%) | 0–1000 µg·m-3 |
| 13 | Aerocet-831 [42,75] |
Portable meter | PM 1, PM 2.5, PM 4, PM 10 | Fitness Centers (Taiwan) | Average | 0 – 1,000 µg·m-3 |
| 14 | DustTrak 8533/8534 [43,44,76] |
Laser dust monitor | PM 1, PM 2.5, PM 4, PM 10, TSP | Sports halls | Very high | 0.001 to 150 µg·m-3 - 1 minute readings |
| 15 | Personal pump + gravimetric filtres [29] |
Gravimetric | PM 2.5 | Epidemiological studies (USA) | Very high (reference) |
Gravimetric method |
| 16 | XRF + CMB, EF, FA, PMF [56] |
Analytical methods | Chemical composition PM 2.5 i PM 10 | Identification of sources in museums | Very high | Composition analysis |
Table 7.
Percentage values of PM 2.5 concentration reduction depending on air flow, filter efficiency, and simulation scenario [based on 15].
Table 7.
Percentage values of PM 2.5 concentration reduction depending on air flow, filter efficiency, and simulation scenario [based on 15].
|
Flow (m3·h-1) |
Filter efficiency (%) |
Scenario |
PM 2.5 reduction (%) |
| 100 | 35 | LL | 7 |
| 100 | 65 | HL | 15 |
| 100 | 95 | LH | 20 |
| 100 | 95 | HH | 22 |
| 600 | 35 | LL | 29 |
| 600 | 65 | HL | 32 |
| 600 | 95 | LH | 35 |
| 600 | 95 | HH | 38 |
Disclaimer/Publisher’s Note: The statements, opinions and data contained in all publications are solely those of the individual author(s) and contributor(s) and not of MDPI and/or the editor(s). MDPI and/or the editor(s) disclaim responsibility for any injury to people or property resulting from any ideas, methods, instructions or products referred to in the content. |
© 2025 by the authors. Licensee MDPI, Basel, Switzerland. This article is an open access article distributed under the terms and conditions of the Creative Commons Attribution (CC BY) license (http://creativecommons.org/licenses/by/4.0/).
Copyright: This open access article is published under a Creative Commons CC BY 4.0 license, which permit the free download, distribution, and reuse, provided that the author and preprint are cited in any reuse.


