
Submitted:
30 October 2025
Posted:
30 October 2025
You are already at the latest version
Abstract
The aim of this study was to analyse the economic conditions of the beekeeping sector in Poland between 2019 and 2024, with particular emphasis on production costs, price formation mechanisms, the foreign trade balance, and the structure of honey supply. The analysis was based on data from public institutions, beekeeping organisations, in-dividual beekeepers, and the authors’ own research and analyses. The results indicate a clear increase in domestic honey production, which reached 31 thousand tonnes in 2024, confirming the growing potential of the sector. Poland is among the largest honey producers in the European Union. The market structure is dominated by direct sales; however, as production scale increases, wholesale channels become more important. Apiary size remains a key factor influencing unit costs and profitability – commercial apiaries benefit from economies of scale, while smaller operations have limited in-vestment capacity. During the analysed period, the sector faced significant cost pres-sures driven by high inflation and rising prices of beekeeping production inputs. The market analysis shows increasing competitive pressure, particularly in the wholesale segment, intensified by low-priced imported honey. The oversupply of popular honey types reduces profitability and weakens beekeepers’ bargaining position. The future development of the sector should focus on increasing the added value of production, diversifying distribution channels, expanding premium segments, and building strong and competitive brands. Ensuring the stability of the sector is crucial not only for the agri-food economy but also for ecosystem balance and food security. In this context, proactive measures and the consideration of appropriate market protection instruments are essential to mitigate the effects of market imbalances and enhance the sector’s re-silience to future economic shocks.
Keywords:
apiculture
; honey market
; production costs
; foreign trade
; Poland
; competitiveness
1. Introduction
The honey market in Poland represents a significant and growing segment of the agri-food sector. Its specific characteristics stem from both natural conditions – such as the seasonality of nectar plant flowering, weather patterns, climate change, and the condition of bee colonies [1,2,3,4,5,6] – and economic factors, including production costs, price levels, supply-demand relations, and foreign trade.
Poland is one of the leading honey producers in the European Union, with nearly 100,000 people engaged in beekeeping and approximately 2.4 million bee colonies. The sector is dominated by small, family-run apiaries [7], which preserve traditional production methods, ensure high product quality, and contribute to the social and environmental functions of rural areas [8]. Alongside them, larger commercial apiaries (over 80 colonies) operate with a more market-oriented approach, strengthening domestic honey supply, professionalizing the industry, and increasing its competitiveness [7].
The structural diversity of the sector affects production costs, producers’ bargaining power, and their position in the value chain. It also entails certain limitations, such as reduced investment capacity and difficulties in achieving economies of scale, which may raise unit production costs and constrain global competitiveness [9,10]. At the same time, this diversity creates opportunities for sectoral development by influencing price formation, supply stability, and integration into international trade.
The authors of this study have conducted extensive research on the Polish beekeeping sector and its market environment [11–26]. Their dual expertise – as researchers and as practitioners managing commercial apiaries – enables a comprehensive analysis of the factors shaping market dynamics, competitiveness, and stability.
In recent years, the Polish honey sector has faced several economic challenges that significantly impact its performance and growth potential. One of the most critical is the influx of cheap, mass-produced honey from non-EU countries, which reshapes competitive conditions, exerts downward pressure on prices, and reduces profitability. This has forced many producers to adopt adaptive strategies, including price adjustments and changes in production scale [7,10,27].
Similar trends are observed across the EU, where domestic production covers only about 60% of demand, making the market heavily reliant on imports. Imported honey, often priced at around €1.4 per kilogram, undercuts European producers and may constitute dumping [28]. Rising production costs – with feed prices increasing by an average of 62% between 2021 and 2023, alongside higher energy, transport, and material costs – further squeeze margins. The situation is compounded by post-pandemic declines in honey consumption and insufficient market controls, allowing substandard products to enter the market.
Contrary to claims of insufficient domestic production [29], growing honey output indicates that Poland is approaching self-sufficiency. However, excessive imports, particularly from non-EU countries, have contributed to oversupply, while per capita honey consumption remains low [30,31]. Although no significant decline has yet been recorded in official statistics, early signs of stagnation are evident, including a slowdown in the establishment of new apiaries – a key growth indicator in the post-EU accession period [7]. These structural shifts reflect both rising competitive pressure and the sector’s need to adapt to changing market realities. At the same time, they present opportunities for innovation, quality improvement, and export growth, which could strengthen Poland’s position in the global honey market [10,29].
Future development will depend on protecting the domestic market, intensifying promotional activities, and highlighting the high quality of Polish honey. Diversification of sales channels – particularly direct sales – and growing consumer interest in natural and regional products [31,32] will be crucial. The anticipated rise in global demand for natural products, including honey [33], and the implementation of the “Breakfast Directive” which enhances labeling transparency and consumer trust [34], also represent important opportunities.
The aim of this study is to analyze the current state and key challenges of the Polish honey market from an economic perspective, focusing on supply and demand factors, production costs, pricing mechanisms, and foreign trade. The study also considers broader macroeconomic influences, such as inflation and consumer purchasing power, which play a decisive role in shaping the sector’s competitiveness and long-term stability.
2. Materials and Methods
The study draws on data collected as part of the authors’ own annual analyses of the beekeeping sector conducted between 2019 and 2024. These data were sourced from a variety of institutional sources and included information obtained from the National Support Centre for Agriculture (KOWR) and the Agency for Restructuring and Modernisation of Agriculture (ARiMR), collected within the framework of interventions in the beekeeping sector and provided annually by regional beekeeping organizations. In addition, supplementary data were gathered from individual beekeepers in 2023 and 2024 (1,467 beekeepers in 2023 and 1,589 in 2024). The beekeeping organizations serving as data sources represented approximately 50,000 beekeepers managing around 1.5 million bee colonies. Additional information was obtained from the Ministry of Agriculture and Rural Development and the Central Statistical Office of Poland (GUS). The dataset was further complemented by market analyses, which included assessments of production cost structures and honey price levels in both wholesale and retail markets. All calculations were based on an exchange rate of 1 EUR = 4.2586 PLN, according to the NBP exchange rate as of 1 October 2025.
3. Results
3.1. Honey Production Potential and Dynamics
Analysis of data from 2019–2024 indicates a clear upward trend in honey production, despite a temporary decline observed in 2020 (Figure 1). Over the study period, total production increased from 18,118.5 tonnes in 2019 to 31,005.1 tonnes in 2024. Both hobbyist and commercial apiaries recorded growth in production volumes, with the per-unit productivity of commercial operations remaining significantly higher throughout the analysed period.
A detailed analysis of the 2024 data indicates a clear regional differentiation in the production potential of the beekeeping sector in Poland (Table 1). The highest honey production was recorded in the Lublin Voivodeship, where it reached 4,870.8 tonnes, confirming the dominant position of this region in the national supply structure. The leading regions also include Wielkopolskie, Warmińsko-mazurskie, Małopolskie and Mazowieckie, which together account for a significant share of the national supply. High production levels are also characteristic of the Dolnośląskie, and Kujawsko-pomorskie regions, which results from both favourable forage conditions and the large number of operating apiaries. In voivodeships with smaller production scales, such as Świętokrzyskie, Opolskie and Podlaskie, honey output is significantly lower, and beekeeping activity usually has a more local character. These regions also show clear differences in productivity between commercial and non-commercial apiaries, reflecting varying levels of production professionalisation.
The collected data indicate that honey production in Poland is concentrated in several main regions, and differences in output levels result from both environmental potential and the scale of beekeeping activity. The noticeable productivity advantage of commercial apiaries indicates the growing role of professional beekeeping in the national honey sector.
3.2. Cost Determinants and Production Efficiency (Main Cost Categories; Cost Changes Over Time)
During the analysed period, a consistent increase in the cost of maintaining a single bee colony in hobbyist apiaries was recorded, with a particularly pronounced growth rate observed after 2021 (Figure 2). This increase affected all major categories of expenditure, indicating rising economic burdens associated with operating small-scale apiaries. The unit cost of honey production in these operations remained higher than in commercial apiaries, reflecting their different cost structure and the absence of economies of scale.
In the case of commercial apiaries, the data also indicate a clear increase in costs throughout the analysed period, with the most dynamic changes occurring after 2021 (Figure 3). At the same time, the unit cost of production remained lower than in non-commercial apiaries, which results from differences in cost structure conditions. Over the analysed years, a reduction in the gap between total costs and unit costs was also observed, reflecting the growing importance of variable costs in the expenditure structure of commercial beekeeping operations.
Using the example of the cost structure per bee colony in 2024, detailed differences between hobbyist (non-commercial) and commercial apiaries are presented (Table 2). In hobbyist apiaries, variable costs dominate, accounting for more than four-fifths of total expenditures and consisting primarily of labour costs, feeding of bee colonies, purchase of queen bees, veterinary treatment, and transportation. Fixed costs are of lesser importance and are mainly limited to the depreciation of hives and beekeeping equipment.
In commercial apiaries, the cost structure is more balanced. The share of fixed costs is significantly higher than in hobbyist apiaries and includes not only the depreciation of hives and equipment but also the depreciation of the beekeeping facility and land lease costs. Among variable costs, labour expenditures are the most significant component, while transportation, electricity, and the purchase of queen bees also represent important cost items.
A comparison of both types of beekeeping activity indicates that larger-scale operations are associated with higher total costs and a greater share of fixed costs, reflecting the investment-oriented nature of commercial apiaries and their different operational model.
3.3. Market Dynamics, Honey Price Formation, and Sales Structure Across Distribution Channels
An analysis was conducted of the price formation of the main honey varieties produced in Poland, aggregated into the following categories: multifloral and rapeseed; acacia, linden, and buckwheat; honeydew from coniferous trees; and heather honey, over the period 2019–2024. The analysis covers three primary distribution channels: direct sales (conducted by beekeepers), wholesale sales (including honey purchasing by intermediaries), and retail sales (carried out by retail outlets).
The prices of multifloral and rapeseed honey in both direct and retail sales showed a clear upward trend. A different pattern was observed in wholesale prices — after an increase in 2019–2022, reaching 3.4 EUR/kg, a decline followed, with prices dropping to 2.5 EUR/kg in 2023–2024. The trade margin systematically increased during the analysed period, rising from 54% in 2019 to 69% in 2024, indicating a widening gap between purchase and selling prices along the distribution chain (Figure 4).
The sales prices of acacia, linden, and buckwheat honey showed clear variation depending on the distribution channel (Figure 5). In the case of retail sales, a consistent price increase was observed throughout the analysed period, reflecting the growing market value of these types of honey and changes in costs at the final stages of the supply chain. Direct sales prices, referring to honey offered by beekeepers directly from apiaries, also exhibited an upward trend, although their growth rate was lower than in retail trade. Wholesale prices were characterised by greater volatility — after an initial increase in the early years of the analysed period, they stabilised and showed a downward trend in the final phase.
The analysed period also recorded a systematic increase in trade margins, particularly evident in the final years of the study, indicating a growing difference between purchase and selling prices in intermediate and retail distribution channels. The price structure across individual distribution channels confirms the differentiated dynamics of the acacia, linden, and buckwheat honey market as well as changes in the distribution of value added along the supply chain.
The sales prices of honeydew honey from coniferous trees were also characterised by significant variation depending on the distribution channel and by fluctuations over time (Figure 6). The highest price levels were recorded in retail sales, where a consistent upward trend was observed throughout the analysed period. Direct sales prices — referring to honey offered to consumers by beekeepers directly from apiaries — also increased, although their growth rate was slightly lower than in retail trade. Wholesale prices showed greater volatility — after a period of growth in the early years of the analysis, a phase of stabilisation followed, and a downward trend was observed in the final stage. These changes were accompanied by a moderate increase in trade margins.
The sales prices of heather honey were significantly higher than those of other honey varieties, which results from its unique properties, limited supply, and high market value (Figure 7). Across all distribution channels, prices remained relatively high, with the highest levels traditionally recorded in retail sales, which showed a clear upward trend throughout the analysed period. Direct sales — referring to honey offered directly to consumers by beekeepers — were also characterised by rising prices, although their growth rate was moderate. Wholesale prices remained considerably lower than retail prices, and their dynamics were more volatile — after an initial increase, a period of stabilisation followed, and in the final phase of the analysis a downward trend was observed. During the analysed period, the trade margin declined, indicating a narrowing difference between purchase and retail prices. This may have resulted both from rising raw material costs at earlier stages of the supply chain and from the need to adjust pricing strategies to changing market and demand conditions. Despite the decrease in margins, the high price level of heather honey was maintained throughout the analysed period, underscoring its importance within the structure of the domestic apicultural products market.
Domestic honey production in Poland is directed primarily towards direct sales. In 2019, direct sales accounted for 87.7% of total honey supply, while the remaining 12.3% was delivered to wholesale buyers. In 2020, its share reached the highest level of the analysed period — 89.4%. In 2021, direct sales remained at the 2019 level, accounting for 87.7% of total honey supply. From 2022 onwards, a slight decline in the share of direct sales was observed, stabilising at around 85%. The same value persisted in 2023, indicating the stability of the market structure. In 2024, the share of direct sales increased slightly to 86%, while wholesale sales accounted for 14% of domestic supply.
3.4. Foreign Trade and Supply Balance (Import and Export Volumes and Directions; Trade Balance)
Foreign trade in the Polish honey market in the years 2019–2024 was characterised by a persistent predominance of imports over exports, resulting in a consistently negative trade balance throughout the analysed period (Table 3). Both the volume and value of exports and imports showed noticeable fluctuations during this time. The initial years of the analysis were marked by a relatively high level of imports compared with exports, which determined a significant difference in the value of foreign trade. The largest trade balance deficit was recorded in 2021, followed by its gradual reduction in subsequent years. From 2022 onwards, a decline in both the volume and value of exports and imports was observed, with imports remaining at a higher level than exports. During the analysed period, the unit price of honey in foreign trade also changed. The export price showed an upward trend and reached a significantly higher level in the second half of the period than at the beginning, while the unit price of imported honey remained stable and significantly lower than the export price.
As a result, Poland remained a net importer of honey throughout the analysed period, and the trade balance stayed negative regardless of changes in trade volumes and unit prices of exports and imports.
Foreign trade included exchanges with both European Union countries (Intra-EU) and non-EU countries (Extra-EU) (Table 4). During the analysed period, EU markets remained the dominant export destination, accounting for the vast majority of honey exported abroad in terms of both volume and value. Exports to EU countries showed fluctuations over time, reaching their highest values in the first half of the analysed period before gradually declining. Exports to non-EU countries were significantly smaller in quantitative terms, although their unit value was considerably higher than that of intra-EU deliveries.
On the import side, the geographical structure was the opposite — imports of honey from outside the European Union dominated, representing the majority of total import volume throughout the analysed period. Imports from third countries remained relatively stable, and their unit price was lower than that of supplies from EU countries. In contrast, imports from EU member states were smaller in scale and exhibited greater fluctuations over time.
Unit prices of honey in foreign trade varied depending on the direction of trade. Exports to non-EU countries achieved higher unit values than intra-EU exports, while imports from third countries were characterised by the lowest unit prices in the analysed period. These differences persisted throughout the study period, reflecting the diversified geographical structure of honey trade.
The geographical structure of honey imports to Poland in 2024 was characterised by a high degree of concentration, with a clear dominance of two main suppliers — China and Ukraine — which together accounted for the vast majority of total import volume (Figure 8). Imports from China were characterised by the lowest unit price among all sources, reflecting their quantitative and cost-related specificity. Ukraine ranked second in terms of importance in the import structure, and its supplies were characterised by a slightly higher unit value.
A smaller share of imports originated from European Union member states such as Lithuania, Romania, Bulgaria, Hungary, and Spain. Honey imported from these countries was generally characterised by a higher unit price than that imported from China and Ukraine, indicating different quality or structural characteristics of the deliveries. Small quantities of honey also came from third countries, including Vietnam, while other sources had marginal significance in the overall import structure, accounting for only a small percentage of the imported product.
The geographical structure of honey exports from Poland in 2024 showed considerable diversification, with a dominant share of markets in European Union member states (Figure 9). The most important destination for Polish honey was Germany, which accounted for the largest share of total exports while maintaining a relatively high unit price. Italy also held a significant position, ranking second in terms of export share, although its unit price was lower than that of exports to the German market.
Other European countries, such as Greece, Spain, France, Bulgaria, and Romania, also played an important role in the export structure. Although their shares were smaller, they remained significant in aggregate terms. Exports to non-EU markets, including the United Kingdom and the United States, were characterised by distinctly higher unit prices, which distinguished these destinations from the others. Other export destinations had limited significance in the geographical structure of exports, accounting for only a small share of the total volume.
3.5. Supply Structure: Domestic Production and Honey Trade Balance
Honey supply on the domestic market in Poland showed a clear upward trend in the years 2019–2024 (Table 5). The total amount of honey available on the market increased from 31.1 thousand tonnes in 2019 to 45.4 thousand tonnes in 2024. The volume of supply was shaped by both domestic production and foreign trade, with imports playing a significant role, as they exceeded exports throughout the analysed period and constituted an important source of supply.
The persistent predominance of imports over exports contributed to the gradual increase in the amount of honey available on the domestic market. During the analysed period, honey supply per capita also increased — from 0.8 kg in 2019 to 1.2 kg in 2024 — indicating a growing quantity of the product available per person.
4. Discussion
The interpretation of the results allows for an in-depth analysis of the economic conditions shaping the beekeeping sector in Poland, as well as the identification of its main challenges and development opportunities in a changing market environment.
Analysis of data from 2019–2024 shows a clear increase in domestic honey production, which reached about 31,000 tonnes in 2024. This trend confirms the growing potential of the sector and the increasing importance of beekeeping in Polish agriculture and the agri-food economy. Poland is currently among the largest honey producers in the European Union – alongside Romania, Germany, Hungary, and Spain – and its share in total EU production continues to grow [27,35].
A key feature of the Polish market remains the dominance of direct sales, which account for most of the domestic supply and represent the main distribution channel for honey. This model, based on direct producer-consumer relationships, allows beekeepers to achieve higher margins and maintain greater control over pricing [10]. However, as production volumes grow, wholesale trade is becoming increasingly important. For larger beekeeping operations, which cannot sell all their output through direct sales, wholesale channels often become a major or even dominant means of distribution. Differences in sales strategies reflect structural differences within the sector – including apiary size, organization, and access to buyers. It is worth noting that 24% of honey consumers purchase it in supermarkets [30].
Apiary size remains one of the most important factors influencing the economic performance of beekeeping operations. Larger apiaries benefit from economies of scale – they produce more, use equipment more efficiently, and reduce unit production costs. Smaller operations, although more flexible and with easier access to direct sales, have limited investment capacity [7]. The profitability threshold depends on many factors, such as the organizational model, access to nectar sources, and the sales channels used. The type of beekeeping operation is also important – migratory apiaries, by producing higher-value monofloral honeys, generally achieve higher productivity and income than stationary ones [10]. Profitability is influenced not only by price levels but also by the cost structure. Variable costs – including labour, transport, feeding, and bee treatment – account for the largest share. Unit production costs are lower in commercial apiaries. Between 2021 and 2023, the sector faced strong cost pressures due to high inflation and rising prices of beekeeping production inputs [25,26]. Although inflation decreased in 2024, the cumulative effect of earlier increases kept costs at a high level, limiting profit margins and investment capacity [37].
Since 2022, price conditions in the wholesale segment have deteriorated. A decline in honey purchase prices, combined with an increase in trade margins from 54% to 69%, indicates a shift in added value toward intermediaries and retailers [26]. This weakens beekeepers’ bargaining power and increases pressure on profitability. Large differences between wholesale and retail prices – especially for common honeys such as multifloral and rapeseed – highlight the importance of factors such as production scale, type of beekeeping operation, and sales channels. At current production costs and volumes, profitability is difficult to achieve based on prices offered by honey buyers.
The COVID-19 pandemic had a limited impact on the functioning of the beekeeping sector in Poland. The dominance of family labour and low dependence on external labour allowed most operations to continue without major disruptions. Although honey production in 2020 was the lowest among the years studied, this was not due to restrictions caused by the spread of SARS-CoV-2. Instead, significant winter losses (20.2%) and very unfavourable weather conditions contributed to a decline in honey production in many regions. Additionally, summer nectar flows (e.g., from linden and buckwheat) were poor, further deepening the production decline [24].
The crisis, however, highlighted the importance of well-developed sales channels. Enterprises with extensive distribution networks benefited from increased demand, as 32% of Polish consumers increased their honey consumption during the pandemic [30,36]. At the same time, foreign trade reached a record level, and honey exports were the highest in history. It should be noted, however, that a significant share of honey traded internationally consisted of imported raw material, due to limited domestic supply during that period.
Foreign trade is one of the key factors shaping the sector’s situation. Poland is a net importer of honey, with a large share of imports coming from China and Ukraine, typically at low unit prices. This creates competitive pressure in the wholesale segment and limits opportunities to increase income for domestic producers. At the same time, exports to premium markets such as the United Kingdom and the United States allow higher unit prices and represent an important growth opportunity. Competitive advantages based on quality, standardization, certification, and geographical indication can serve as effective responses to price competition [27].
Within the European Union, the Polish beekeeping sector follows broader market trends. The EU’s self-sufficiency level in honey is around 63%, meaning that imports remain a permanent part of supply [35]. The EU trade balance is negative, and honey from third countries – mainly China and Ukraine – is significantly cheaper, increasing competitive pressure and making it more difficult to pass production costs on to consumers. Another challenge is the concentration of retail trade and the growing bargaining power of large retail chains. Poland has a growing resource base and a strong share of direct sales, but maintaining and strengthening its competitive position depends on increasing the added value of production and better tailoring the offer to diverse demand segments [28,33].
The increase in honey supply per capita reflects the growing scale of total supply, resulting from both higher domestic production and imports. However, this indicator does not directly reflect consumption – some honey remains unsold or is exported. Limited domestic market absorption leads to a structural oversupply, which destabilizes price relationships and increases competitive pressure. Before 2021, the honey market in Poland was more stable, with per-capita supply at 0.7–0.8 kg. After 2021, it exceeded 1 kg, and a population decline of about 900,000 people between 2019 and 2024 further deepened the oversupply problem [38]. This situation was worsened by a post-pandemic decline in consumers’ purchasing power, which limited demand growth despite increasing supply. It is also worth noting that honey – despite its nutritional and health benefits – is not a basic necessity [30].
A common mistake in honey market analyses is equating total supply with consumption, which leads to a misrepresentation of actual demand [28,29,33]. Supply includes both domestic production and the trade balance (imports minus exports), not just the amount actually consumed by consumers. Assessing the market situation is further complicated by the lack of data on stock levels, which can be significant and affect supply-demand dynamics when sales opportunities are limited. The estimated production of around 31,000 tonnes in 2024, combined with relatively low consumption, suggests that domestic supply in the popular honey segment largely meets internal demand. However, a market deficit may occur in the case of monofloral honeys with higher market value, whose supply remains limited in some years.
Thus, the key challenge for the sector is not a shortage of production but a structural oversupply in the popular honey segment, resulting from both increased domestic supply and the inflow of low-priced imported honey. Oversupply leads to price pressure, worsens conditions in the wholesale segment, and reduces the profitability of large beekeeping operations – trends clearly visible in the results since 2022.
Further development of the sector should focus not on simply increasing production volume but on effectively managing existing supply through diversification of distribution channels, development of premium segments, building strong brands, and intensifying marketing activities [27]. Strengthening the sector’s position also requires organizational and institutional measures. Establishing producer groups, developing common quality standards, improving logistics, and conducting joint promotional activities can increase producers’ bargaining power against intermediaries and retail chains [33]. Regulatory measures to improve market transparency and enforce product quality – such as aligning national regulations with the so-called “Breakfast Directive” – are also important [34]. Public support, including sectoral interventions, can further support the modernization of apiaries, improve their competitiveness, and contribute to the sustainable development of the entire sector [7,8].
5. Conclusions
The Polish beekeeping sector has significant production potential and plays an important role in the national economy. However, its further development requires structural and economic adjustments that will support the stabilization of its competitive position amid growing market challenges.
A major problem facing the sector is the oversupply of popular types of honey in a context of limited domestic market absorption and pressure from low-priced imports. This leads to declining production profitability and a weakening of beekeepers’ economic position. Actions aimed at restoring market balance and strengthening the sector’s resilience are therefore necessary.
The long-term competitiveness of the sector will depend on its ability to make better use of existing resources and increase the added value of production. In addition to focusing development strategies on improving quality, better aligning supply with demand structure, and making more effective use of export potential, promotional and educational initiatives are also crucial. These can raise consumer awareness of the health and environmental benefits of honey, which may help boost domestic demand.
The stability of the beekeeping sector has implications that go beyond honey production itself – it directly affects ecosystem functioning, plant pollination processes, and food security. If market factors lead to imbalances, reduced domestic production, and lower profitability, the use of appropriate market protection instruments should be considered. It is crucial to take preventive action to avoid a situation where intervention occurs only at the point of deep crisis, when its consequences are difficult to reverse and far more severe than the short-term benefits resulting from trade in cheaper raw materials.
Author Contributions
Conceptualization, P.S.; methodology, P.S.; software, P.S.; validation, P.S. and D.G.; formal analysis, P.S.; investigation; P.S.; data curation, P.S.; writing—original draft preparation, P.S.; writing—review and editing, P.S. and D.G.; visualisation, P.S.; supervision, D.G.; project administration, P.S.; founding acquisition, P.S. and D.G. All authors have read and agreed to the published version of the manuscript.
Funding
This research was conducted within the framework of a special-purpose subsidy granted in 2025 by the Ministry of Agriculture and Rural Development, Task 8.2: “Preparation of a report on the state of beekeeping in Poland.”
Data Availability Statement
The raw data supporting the conclusions of this article will be made available by the authors upon request.
Conflicts of Interest
The authors declare no conflicts of interest.
References
- Łangowska, A.; Zawilak, M.; Sparks, T.H.; Głazaczow, A.; Tomkins, P.W.; Tryjanowski, P. Long-Term Effect of Temperature on Honey Yield and Honeybee Phenology. Int. J. Biometeorol. 2017, 61, 1125–1132. [CrossRef]
- Van Espen, M.; Williams, J.H.; Alves, F.; Hung, Y.; de Graaf, D.C.; Verbeke, W. Beekeeping in Europe Facing Climate Change: A Mixed Methods Study on Perceived Impacts and the Need to Adapt According to Stakeholders and Beekeepers. Sci. Total Environ. 2023, 888, 164255. [CrossRef]
- Czekońska, K.; Łopuch, S.; Miścicki, S. The Effect of Meteorological and Environmental Variables Affecting Food Collection by Honey Bees. Ecol. Indic. 2023, 156, 111140. [CrossRef]
- Willcox, B.K.; Potts, S.G.; Brown, M.J.F.; et al. Emerging Threats and Opportunities to Managed Bee Species in European Agricultural Systems: A Horizon Scan. Sci. Rep. 2023, 13, 18099. [CrossRef]
- Mazur, E.; Czopowicz, M.; Iller, M.; Gajda, A. A Large-Scale Epidemiological Study on the Prevalence and Risk Factors of Losses of Honey Bee Colonies During Winter Seasons in Poland. Prev. Vet. Med. 2025, 235, 106403. [CrossRef]
- Vincze, C.; Leelőssy, Á.; Zajácz, E.; Mészáros, R. A Review of Short-Term Weather Impacts on Honey Production. Int. J. Biometeorol. 2025, 69, 303–317. [CrossRef]
- Semkiw, P. Polish Beekeeping Twenty Years After Joining the European Union. J. Apic. Sci. 2025, 69(1), 43–58. [CrossRef]
- Jarka, S.; Trajer, M. Support for the Beekeeping Sector in Poland and the European Union. Probl. World Agric. 2018, 18(4), 183–191. [CrossRef]
- Cardillo, C.; Giampaolo, A.; Verrascina, M. Honey Cost: An Experimental Approach for Determining the Production Costs of Honey. Proceedings 2025, 117, 2. [CrossRef]
- Majewski, J. Determinants of Profitability of Beekeeping Production in Poland. Ann. Pol. Assoc. Agric. Agribus. Econ. 2018, 20(5), 105–111.
- Gerula, D.; Węgrzynowicz, P.; Semkiw, P. Analysis of the Beekeeping Sector for the Development of a Three-Year Beekeeping Support Programme in Poland for the Years 2007–2010. Available online: http://www.opisik.pulawy.pl/pdf/analiza.pdf (accessed on 1 October 2025). (In Polish).
- Semkiw, P.; Ochal, J. Analysis of the Beekeeping Sector for the Development of a Three-Year Beekeeping Support Programme in Poland for the Years 2010–2013. Available online: http://www.opisik.pulawy.pl/pdf/analiza1.pdf (accessed on 1 October 2025). (In Polish).
- Semkiw, P.; Skubida, P. Evaluation of the Economical Aspects of Polish Beekeeping. J. Apic. Sci. 2010, 54(2), 5–15.
- Semkiw, P. The Beekeeping Sector in Poland in 2011. Available online: http://www.inhort.pl/files/program_wieloletni/wykaz_publikacji/obszar3/Sektor%20pszczelarski%20w%20Polsce%20w%202011%20roku.pdf (accessed on 1 October 2025). (In Polish).
- Semkiw, P. The Beekeeping Sector in Poland. Ann. Pol. Assoc. Agric. Agribus. Econ. 2011, 13(2), 417–422. (In Polish).
- Semkiw, P. The Beekeeping Sector in Poland in 2012. Available online: http://www.opisik.pulawy.pl/pdf/SP2012.pdf (accessed on 1 October 2025). (In Polish).
- Semkiw, P. The Beekeeping Sector in Poland in 2013. Available online: http://arc.inhort.pl/files/program_wieloletni/wykaz_publikacji/obszar3/3.3_2013_1_Opracowanie.pdf (accessed on 1 October 2025). (In Polish).
- Semkiw, P. The Beekeeping Sector in Poland in 2014. Available online: http://www.inhort.pl/files/program_wieloletni/wykaz_publikacji/obszar3/3.3_Opracowanie_1_2014.pdf (accessed on 1 October 2025). (In Polish).
- Semkiw, P. The Beekeeping Sector in Poland in 2015. Available online: http://www.inhort.pl/files/program_wieloletni/PW_2015_2020_IO/spr_2015/4.3_2015_Opracowanie.pdf (accessed on 1 October 2025). (In Polish).
- Semkiw, P. The Beekeeping Sector in Poland in 2016. Available online: http://arc.inhort.pl/files/program_wieloletni/PW_2015_2020_IO/spr_2016/4.3_2016_Sektor_pszczelarski_w_Polsce.pdf (accessed on 1 October 2025). (In Polish).
- Semkiw, P. The Beekeeping Sector in Poland in 2017. Available online: http://arc.inhort.pl/files/program_wieloletni/PW_2015_2020_IO/spr_2017/4.3_2017_Sektor_pszczelarski.pdf (accessed on 1 October 2025). (In Polish).
- Semkiw, P. The Beekeeping Sector in Poland in 2018. Available online: http://arc.inhort.pl/files/program_wieloletni/PW_2015_2020_IO/spr_2018/Semkiw_2018_Sektor_pszczelarski_zadanie_4.3.pdf (accessed on 1 October 2025). (In Polish).
- Semkiw, P. The Beekeeping Sector in Poland in 2019. Available online: http://www.inhort.pl/files/program_wieloletni/PW_2015_2020_IO/spr_2019/Semkiw_2019_Sektor_pszczelarski_zad.4.3.pdf (accessed on 1 October 2025). (In Polish).
- Semkiw, P. The Beekeeping Sector in Poland in 2020. Available online: http://www.inhort.pl/files/program_wieloletni/PW_2015_2020_IO/spr_2020/4.3_Semkiw_Sektor_pszczelarski_2020.pdf (accessed on 1 October 2025). (In Polish).
- Semkiw, P. The Beekeeping Sector in Poland in 2021. Available online: http://www.inhort.pl/wp-content/uploads/2022/07/Sektor-pszczelarski-w-Polsce-w-2021-roku.pdf (accessed on 1 October 2025). (In Polish).
- Semkiw, P. The Beekeeping Sector in Poland in 2023. Available online: https://www.inhort.pl/wp-content/uploads/2024/07/11.3_Raport_stan_pszczelarstwa_2023.pdf (accessed on 1 October 2025). (In Polish).
- Borowska, A. Changes in Honey Production and Foreign Trade in Poland in the Context of the European Union and the World. Probl. World Agric. 2022, 22(4), 5–25. (In Polish). [CrossRef]
- Bruneau, E.; Adolphe, C.; Delso, S.N.; Spiewok, S.; Rubinigg, M. European Honey Market. Available online: https://app.pollinatorhub.eu/articles/2 (accessed on 5 October 2025).
- Pawłowska-Tyszko, J.; Jarka, S.; Olech, I. Food Self-Sufficiency in the Honey Market in Poland. Sustainability 2024, 16(21), 9373. [CrossRef]
- Kowalczuk, I.; Stangierska, D.; Widera, K.; Fornal-Pieniak, B.; Latocha, P. Determinants of Honey Consumption with Special Reference to the Influence of Nutritional Knowledge and Health Status on Consumption Habits. Appl. Sci. 2023, 13(2), 979. [CrossRef]
- Kowalczuk, I.; Jeżewska-Zychowicz, M.; Trafiałek, J. Conditions of Honey Consumption in Selected Regions of Poland. Acta Sci. Pol. Technol. Aliment. 2017, 16(1), 101–112. [CrossRef]
- Miłek, M.; Bocian, A.; Kleczyńska, E.; Sowa, P.; Dżugan, M. The Comparison of Physicochemical Parameters, Antioxidant Activity and Proteins for the Raw Local Polish Honeys and Imported Honey Blends. Molecules 2021, 26(9), 2423. [CrossRef]
- Pawłowska-Tyszko, J. Honey Production and Foreign Trade in Poland in the Context of European Union Countries. Food Industry 2025, 79(5), 14–18. (In Polish).
- European Parliament and Council of the European Union. Directive (EU) 2024/1438 of the European Parliament and of the Council of 29 April 2024 amending Directives 2001/110/EC, 2001/112/EC, 2001/113/EC and 2001/114/EC as regards honey, fruit juices, jams, jellies, marmalades and sweetened chestnut purée, and certain preserved milks. Official Journal of the European Union, L 2024/1438 (2024). Available online: https://eur-lex.europa.eu/legal-content/EN/TXT/?uri=CELEX%3A32024L1438 (accessed on 5 October 2025).
- European Commission. Honey Market Overview (Autumn 2024). 2024. Available online: https://agriculture.ec.europa.eu/document/download/c04a9774-5ba3-41f5-b256-08396b2888ec_en?filename=market-presentation-honey_autumn2024_en.pdf (accessed on 7 October 2025).
- Maciejczak, M.; Olech, I.; Kalinka, K. Functioning of Selected Beekeeping Farms in Poland During COVID-19 Pandemic. Acta Sci. Pol. Oeconomia 2023, 22(1), 47–54. [CrossRef]
- Statistics Poland (GUS). Yearly Price Indices of Consumer Goods and Services from 1950. Available online: https://stat.gov.pl/download/gfx/portalinformacyjny/pl/defaultstronaopisowa/5239/1/1/rocznewskaznikicentowarowiuslugkonsumpcyjnychod1950roku.csv (accessed on 8 October 2025).
- Statistics Poland (GUS). The Demographic Situation of Poland until 2024. Available online: https://stat.gov.pl/download/gfx/portalinformacyjny/pl/defaultaktualnosci/5468/40/5/1/aneks_tabelaryczny.xlsx (accessed on 8 October 2025).
Figure 1.
Total honey production in Poland in 2019–2024 and its structure by type of apiary.
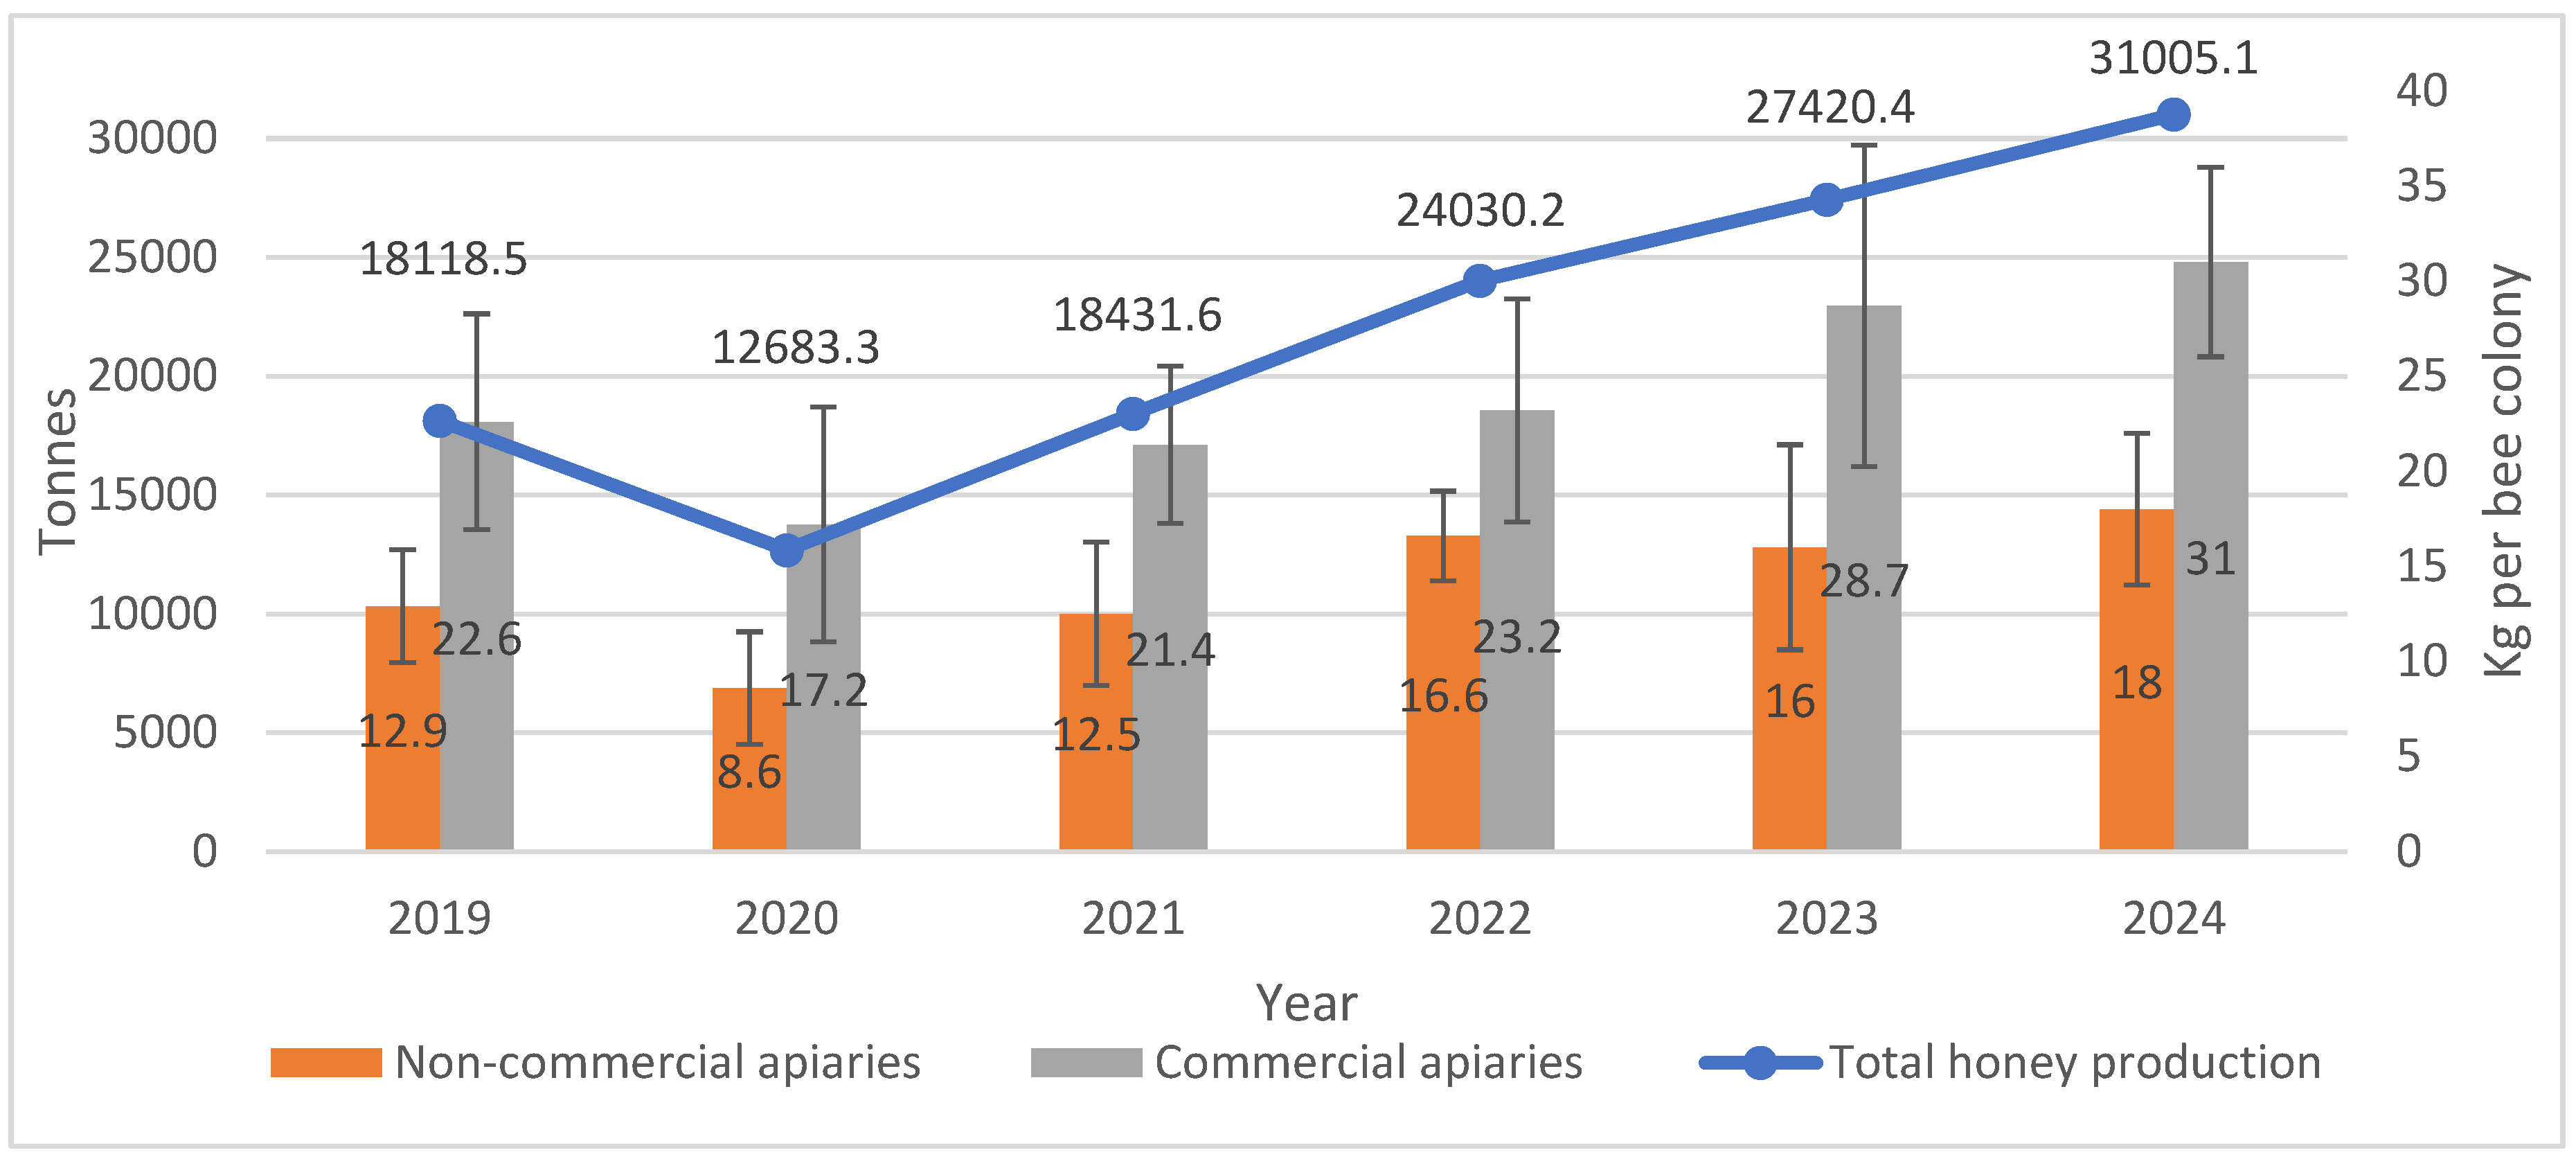
Figure 2.
Changes in the cost of maintaining one bee colony and the unit cost of honey production (1 kg) in non-commercial apiaries between 2019 and 2024.
Figure 2.
Changes in the cost of maintaining one bee colony and the unit cost of honey production (1 kg) in non-commercial apiaries between 2019 and 2024.
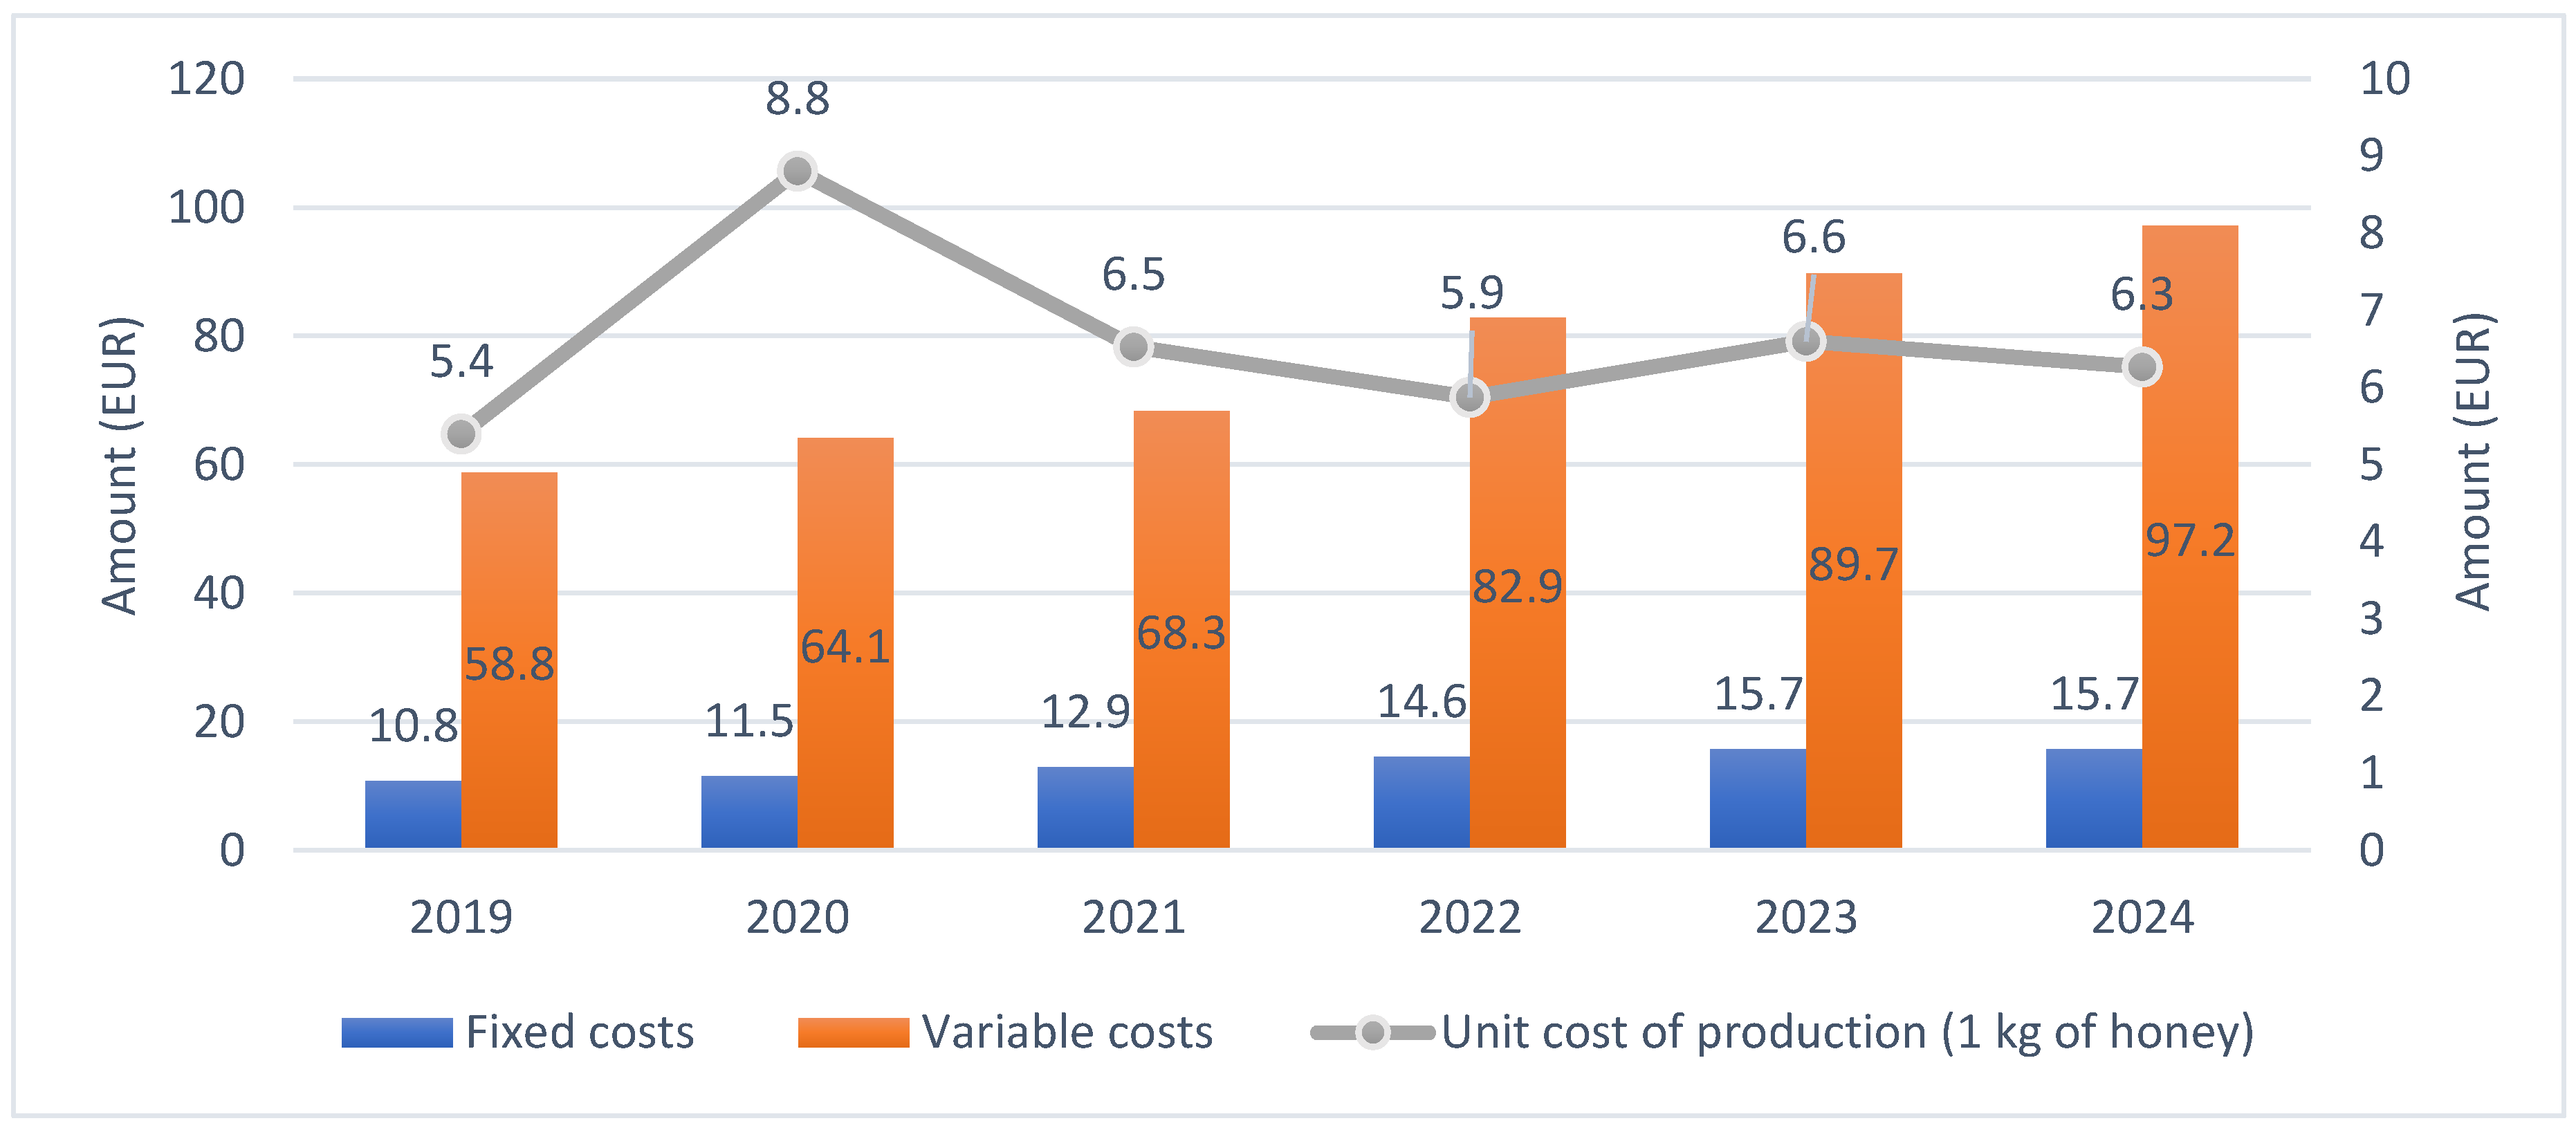
Figure 3.
Changes in the cost of maintaining one bee colony and the unit cost of honey production (1 kg) in commercial apiaries between 2019 and 2024.
Figure 3.
Changes in the cost of maintaining one bee colony and the unit cost of honey production (1 kg) in commercial apiaries between 2019 and 2024.
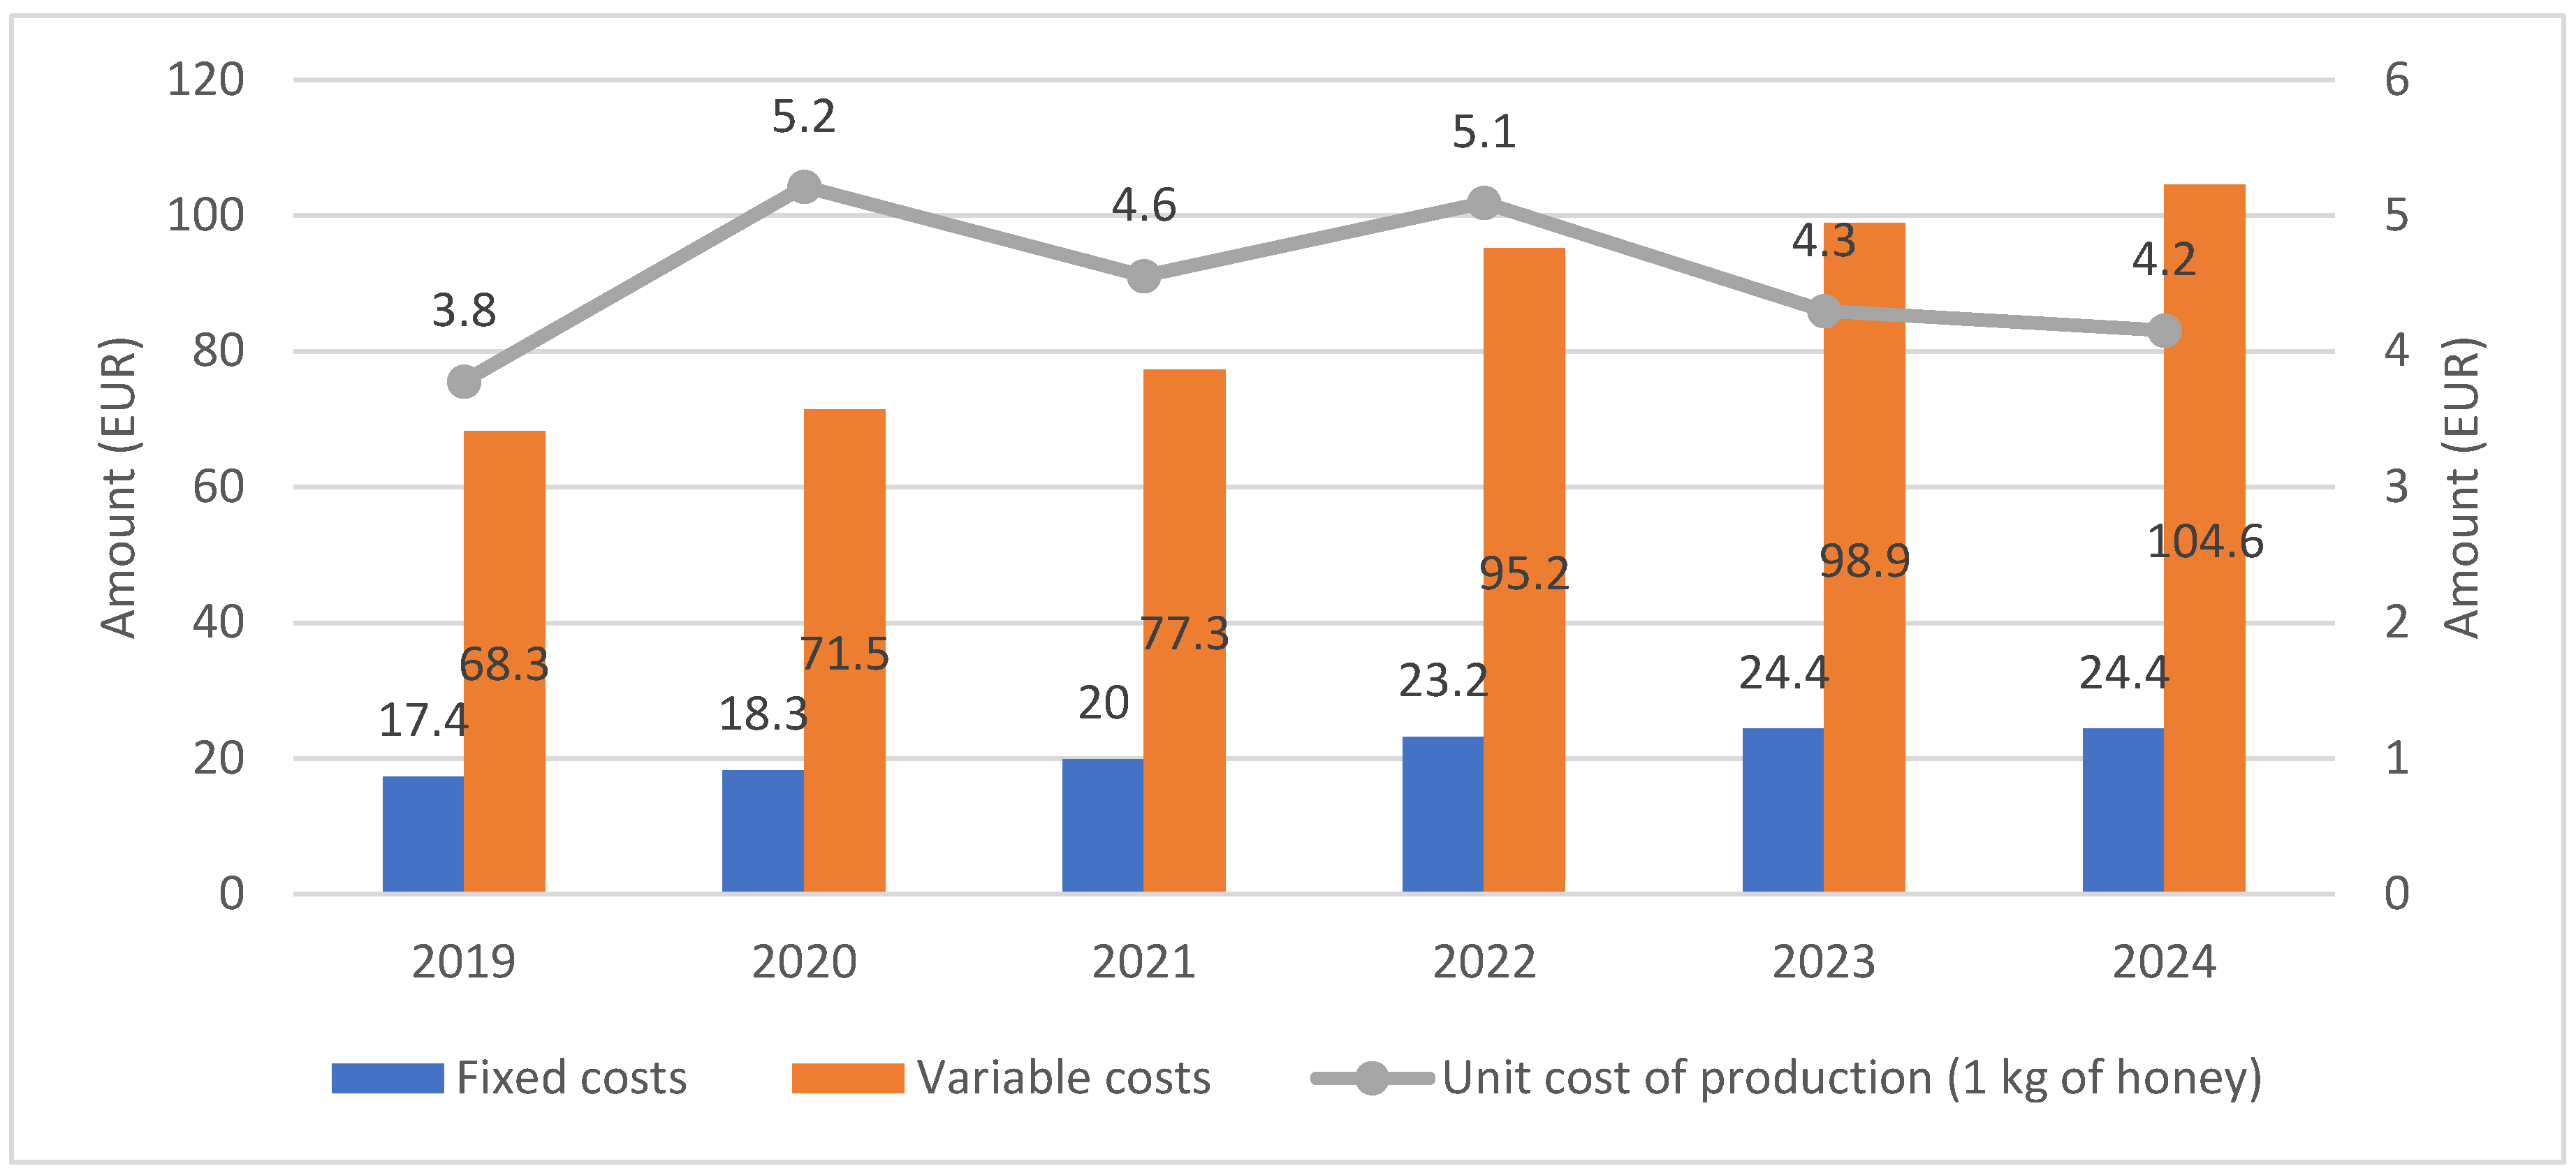
Figure 4.
Sales prices of multifloral and rapeseed honey across different distribution channels and the gross trade margin in 2019–2024.
Figure 4.
Sales prices of multifloral and rapeseed honey across different distribution channels and the gross trade margin in 2019–2024.
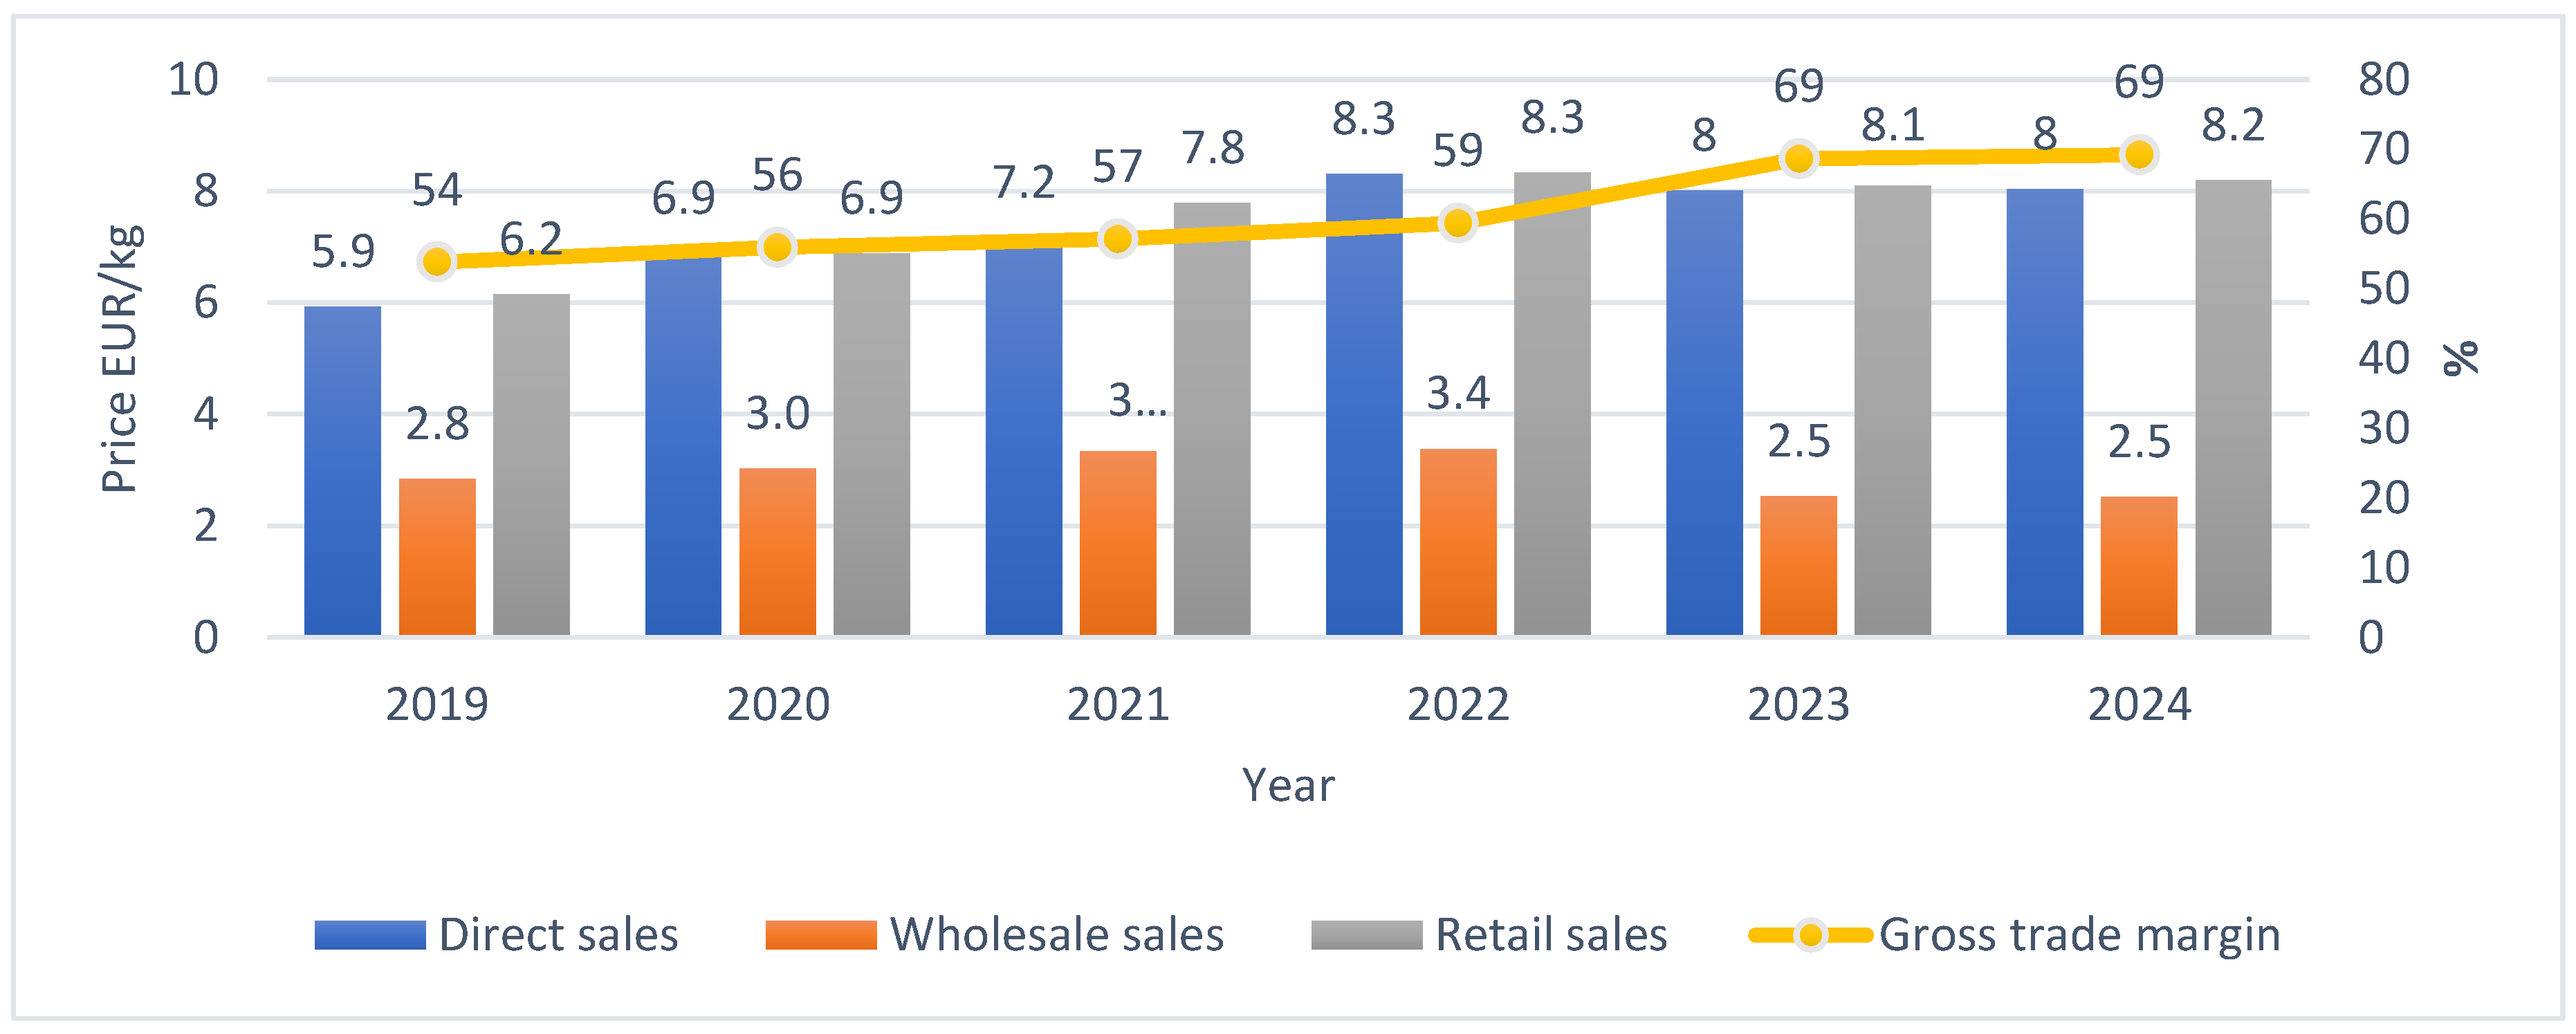
Figure 5.
Sales prices of acacia, linden, and buckwheat honey across different distribution channels and the gross trade margin in 2019–2024.
Figure 5.
Sales prices of acacia, linden, and buckwheat honey across different distribution channels and the gross trade margin in 2019–2024.
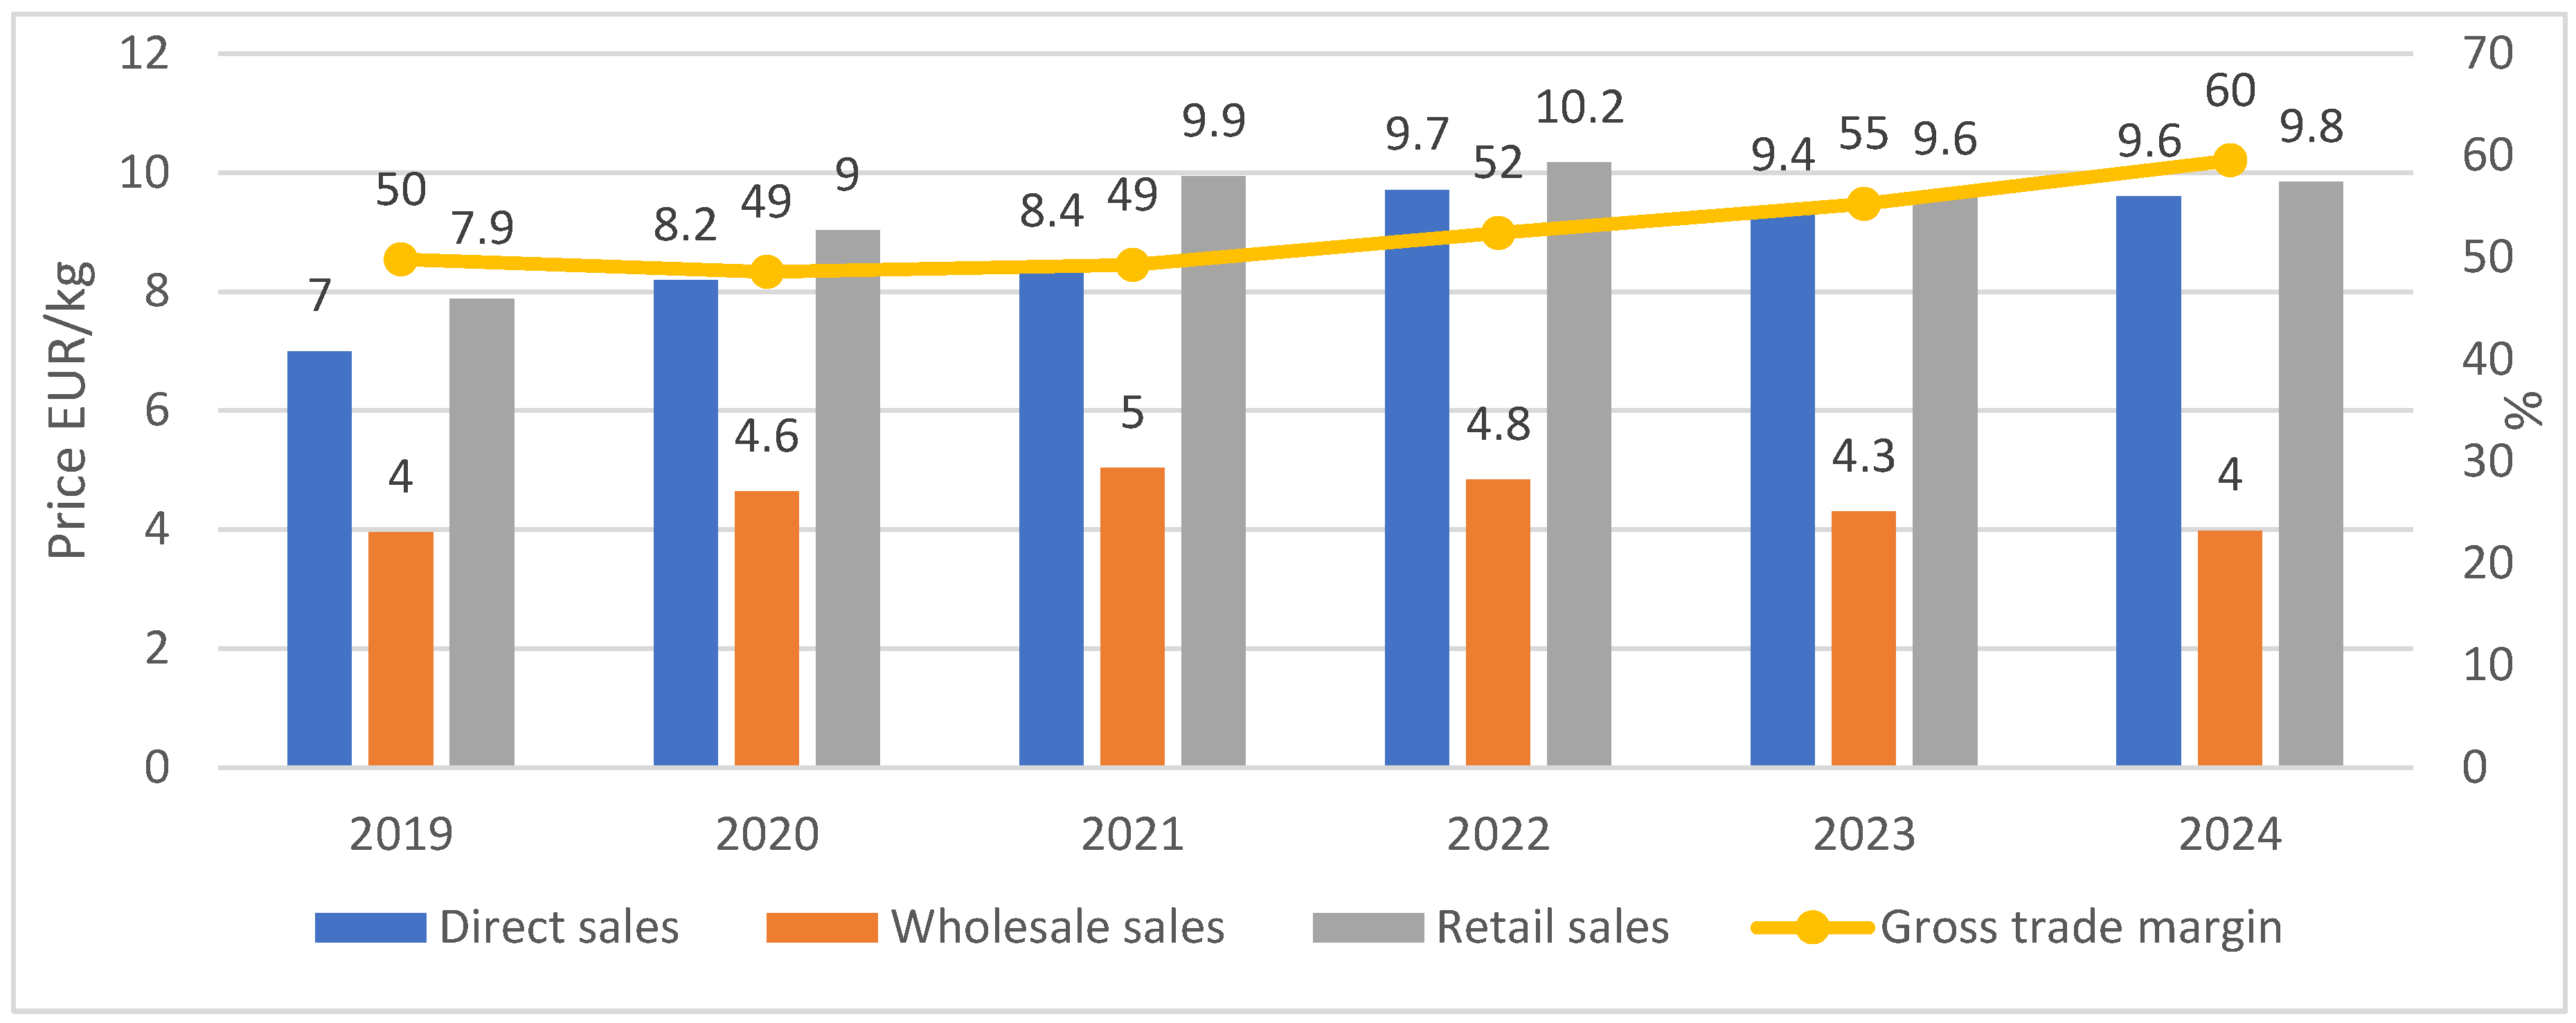
Figure 6.
Sales prices of coniferous honeydew honey across different distribution channels and the gross trade margin in 2019–2024.
Figure 6.
Sales prices of coniferous honeydew honey across different distribution channels and the gross trade margin in 2019–2024.
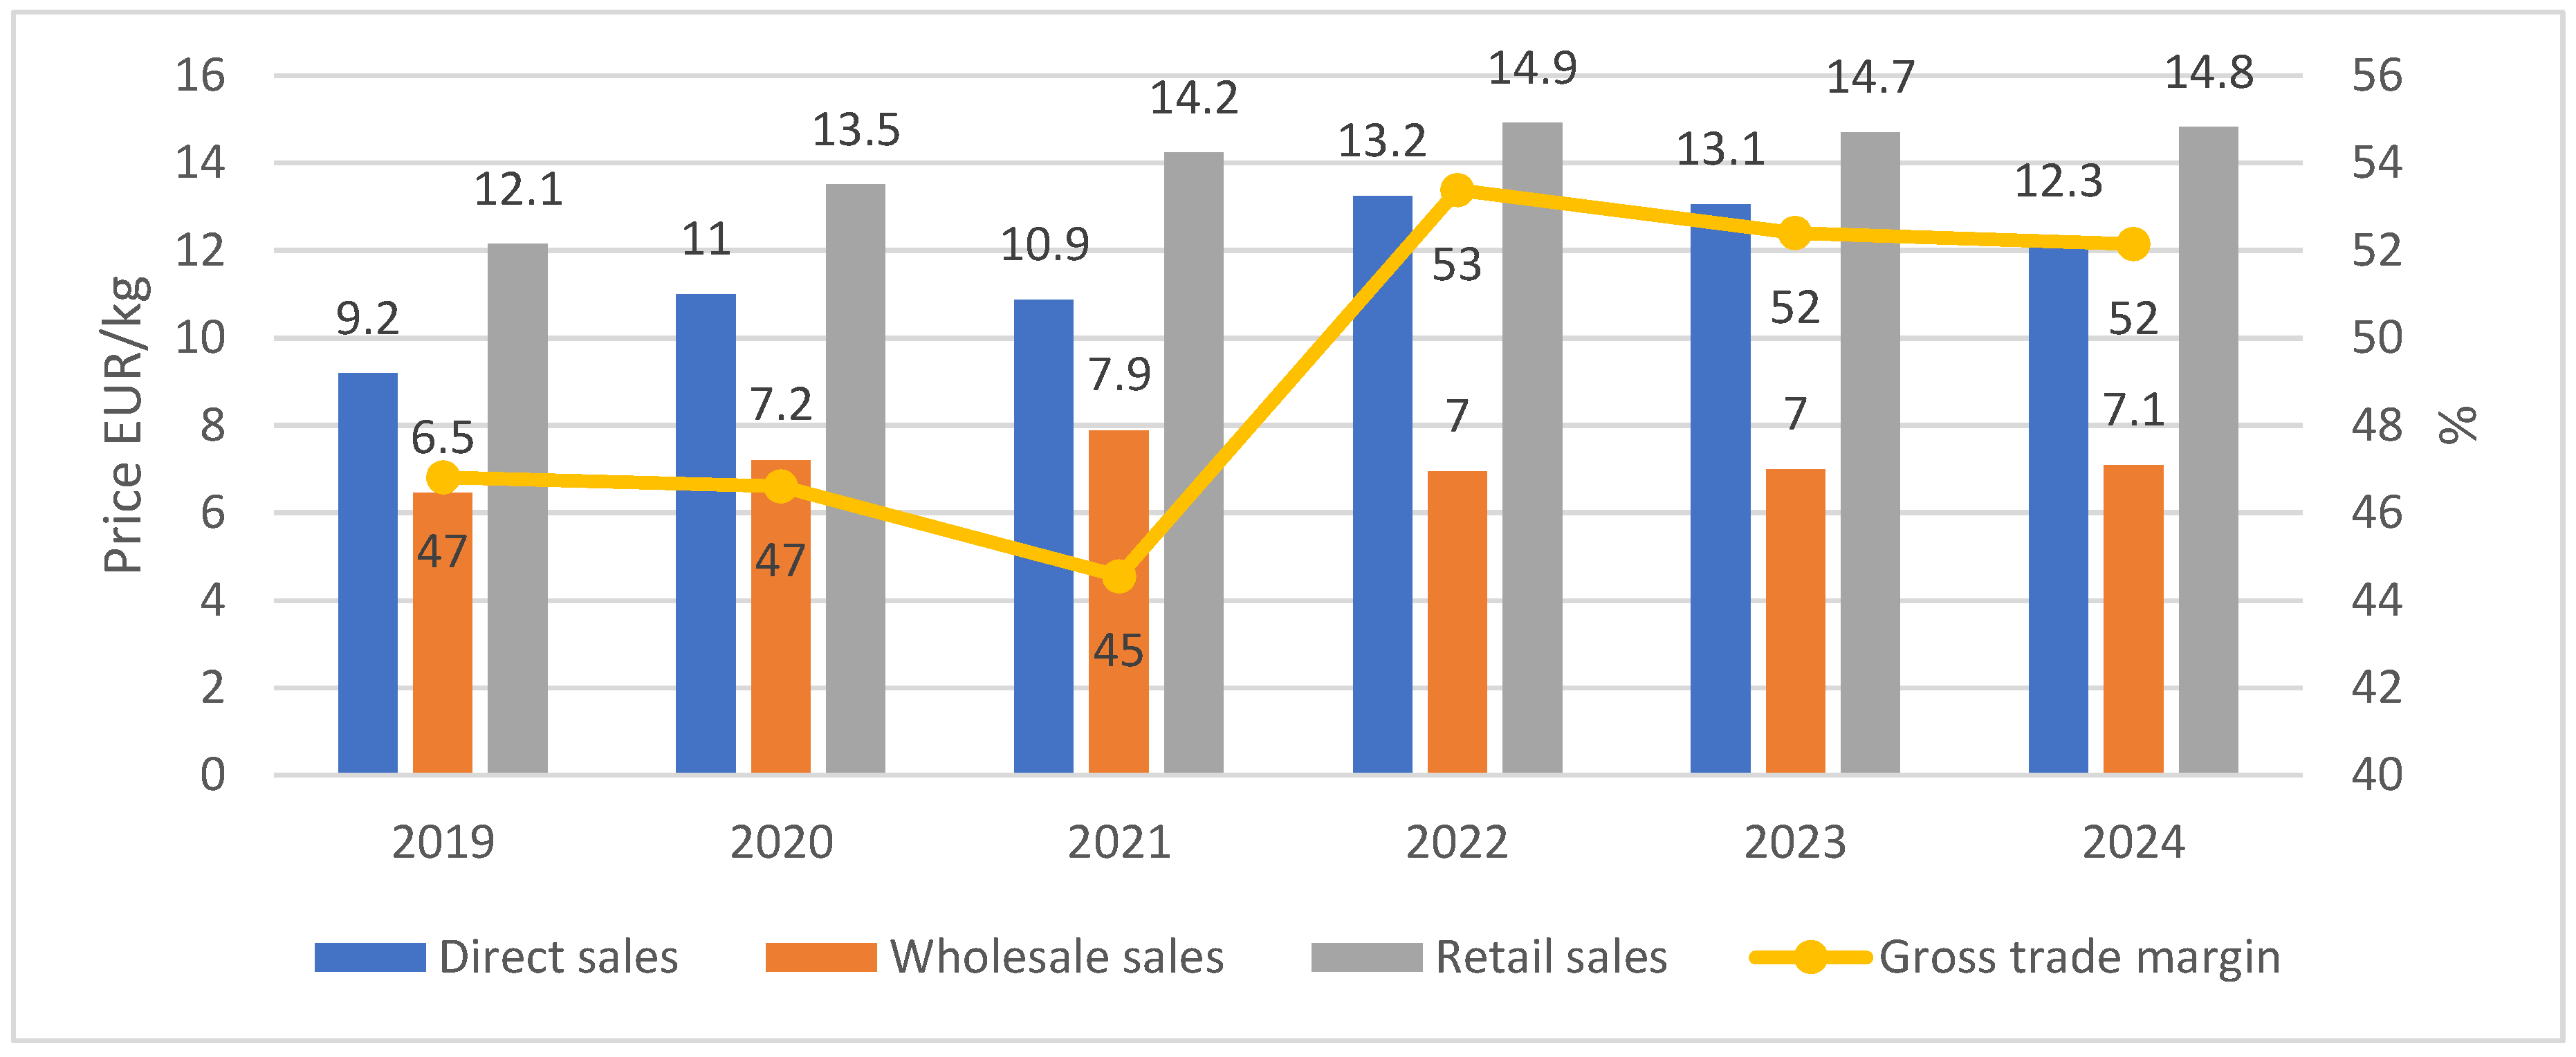
Figure 7.
Sales prices of heather honey across different distribution channels and the gross trade margin in 2019–2024.
Figure 7.
Sales prices of heather honey across different distribution channels and the gross trade margin in 2019–2024.
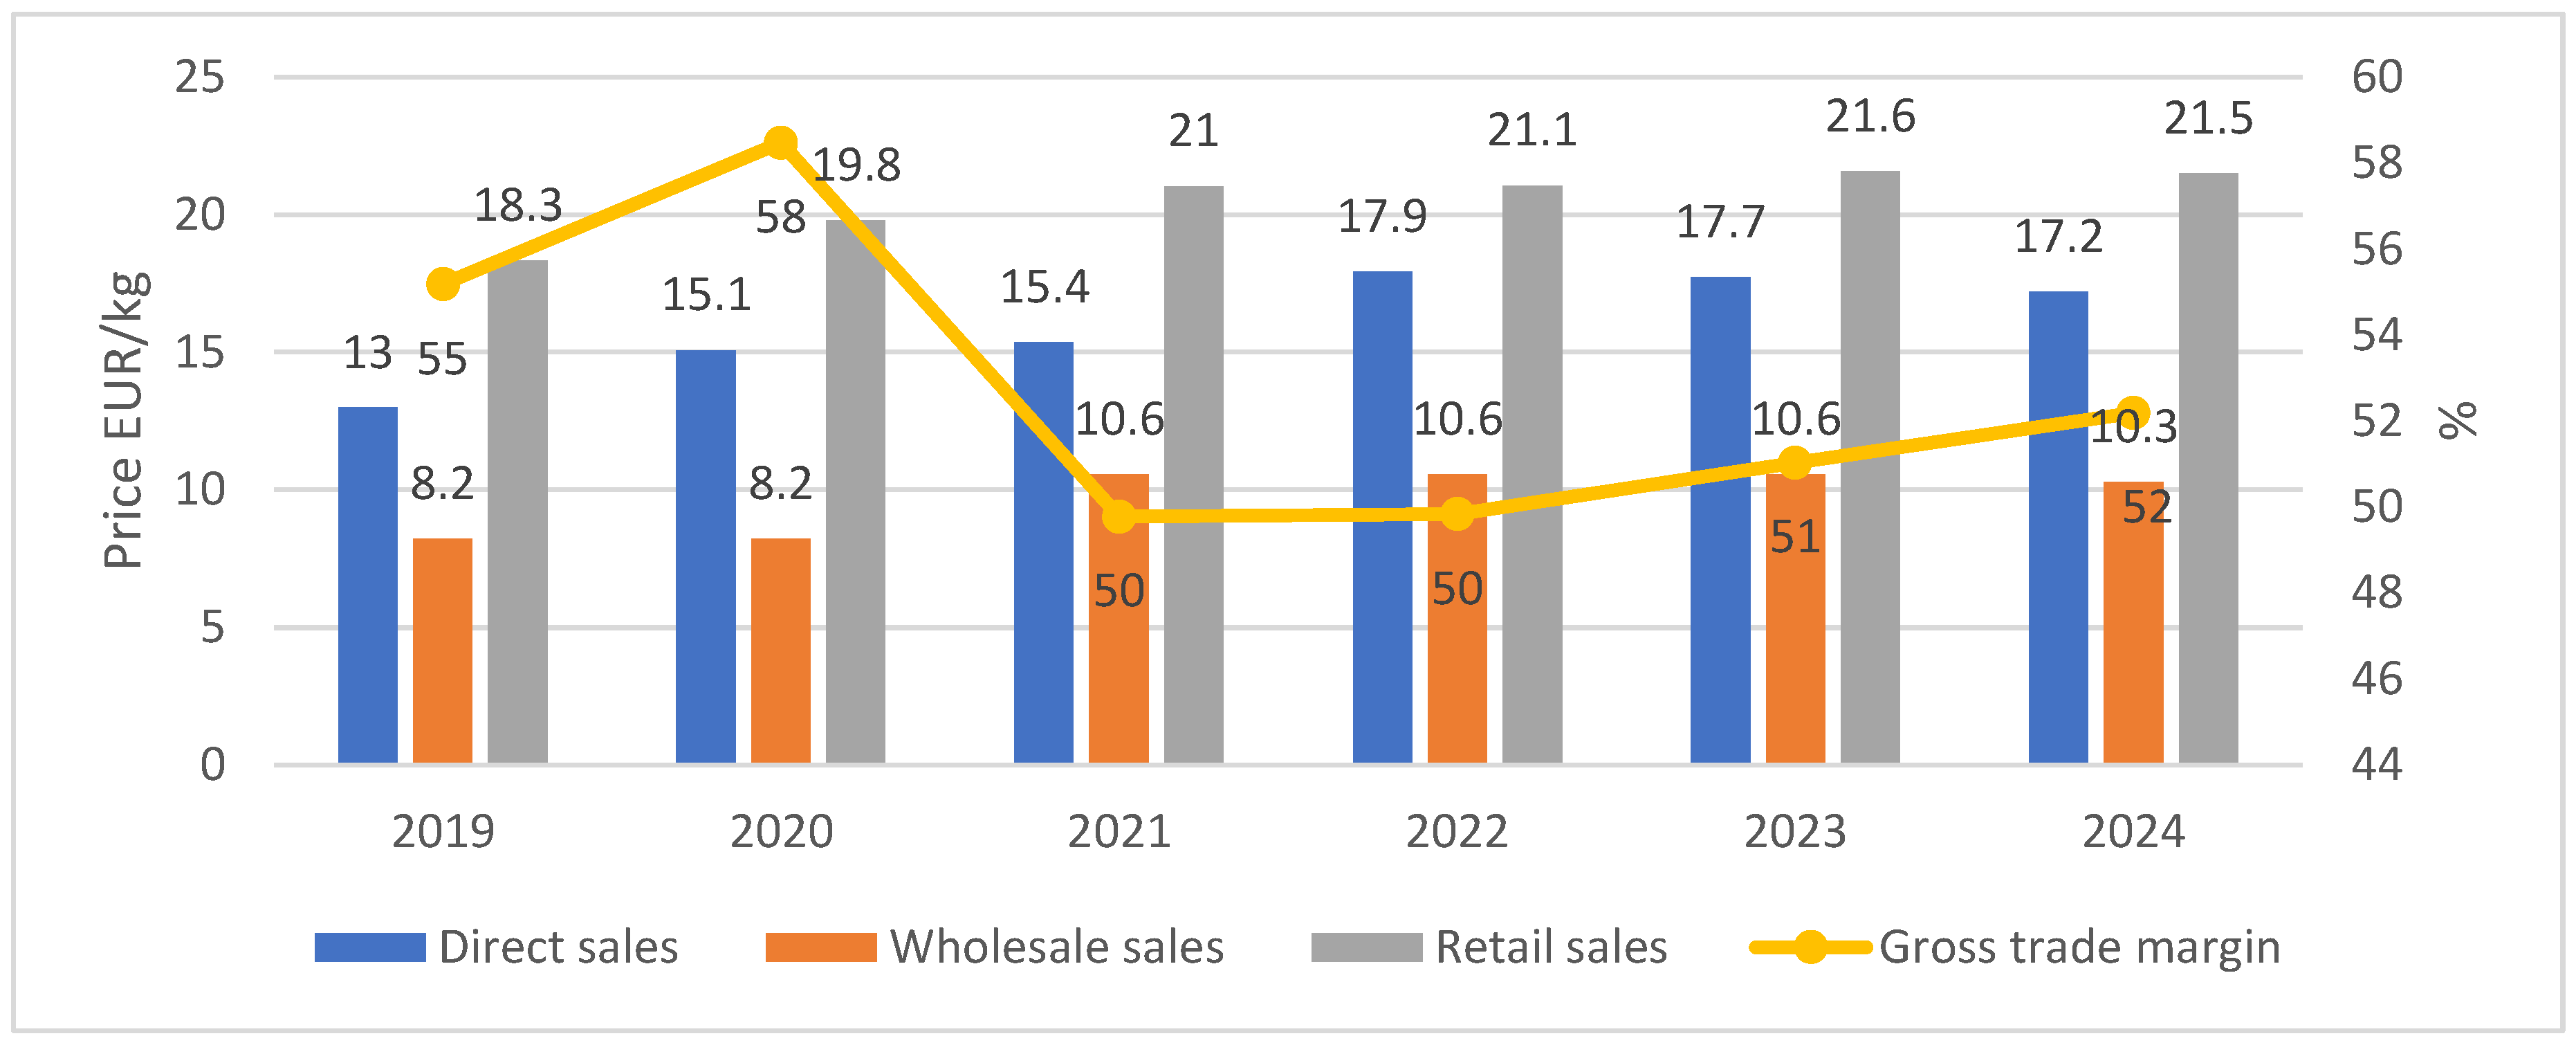
Figure 8.
Geographical structure and unit prices of honey imports to Poland in 2024.
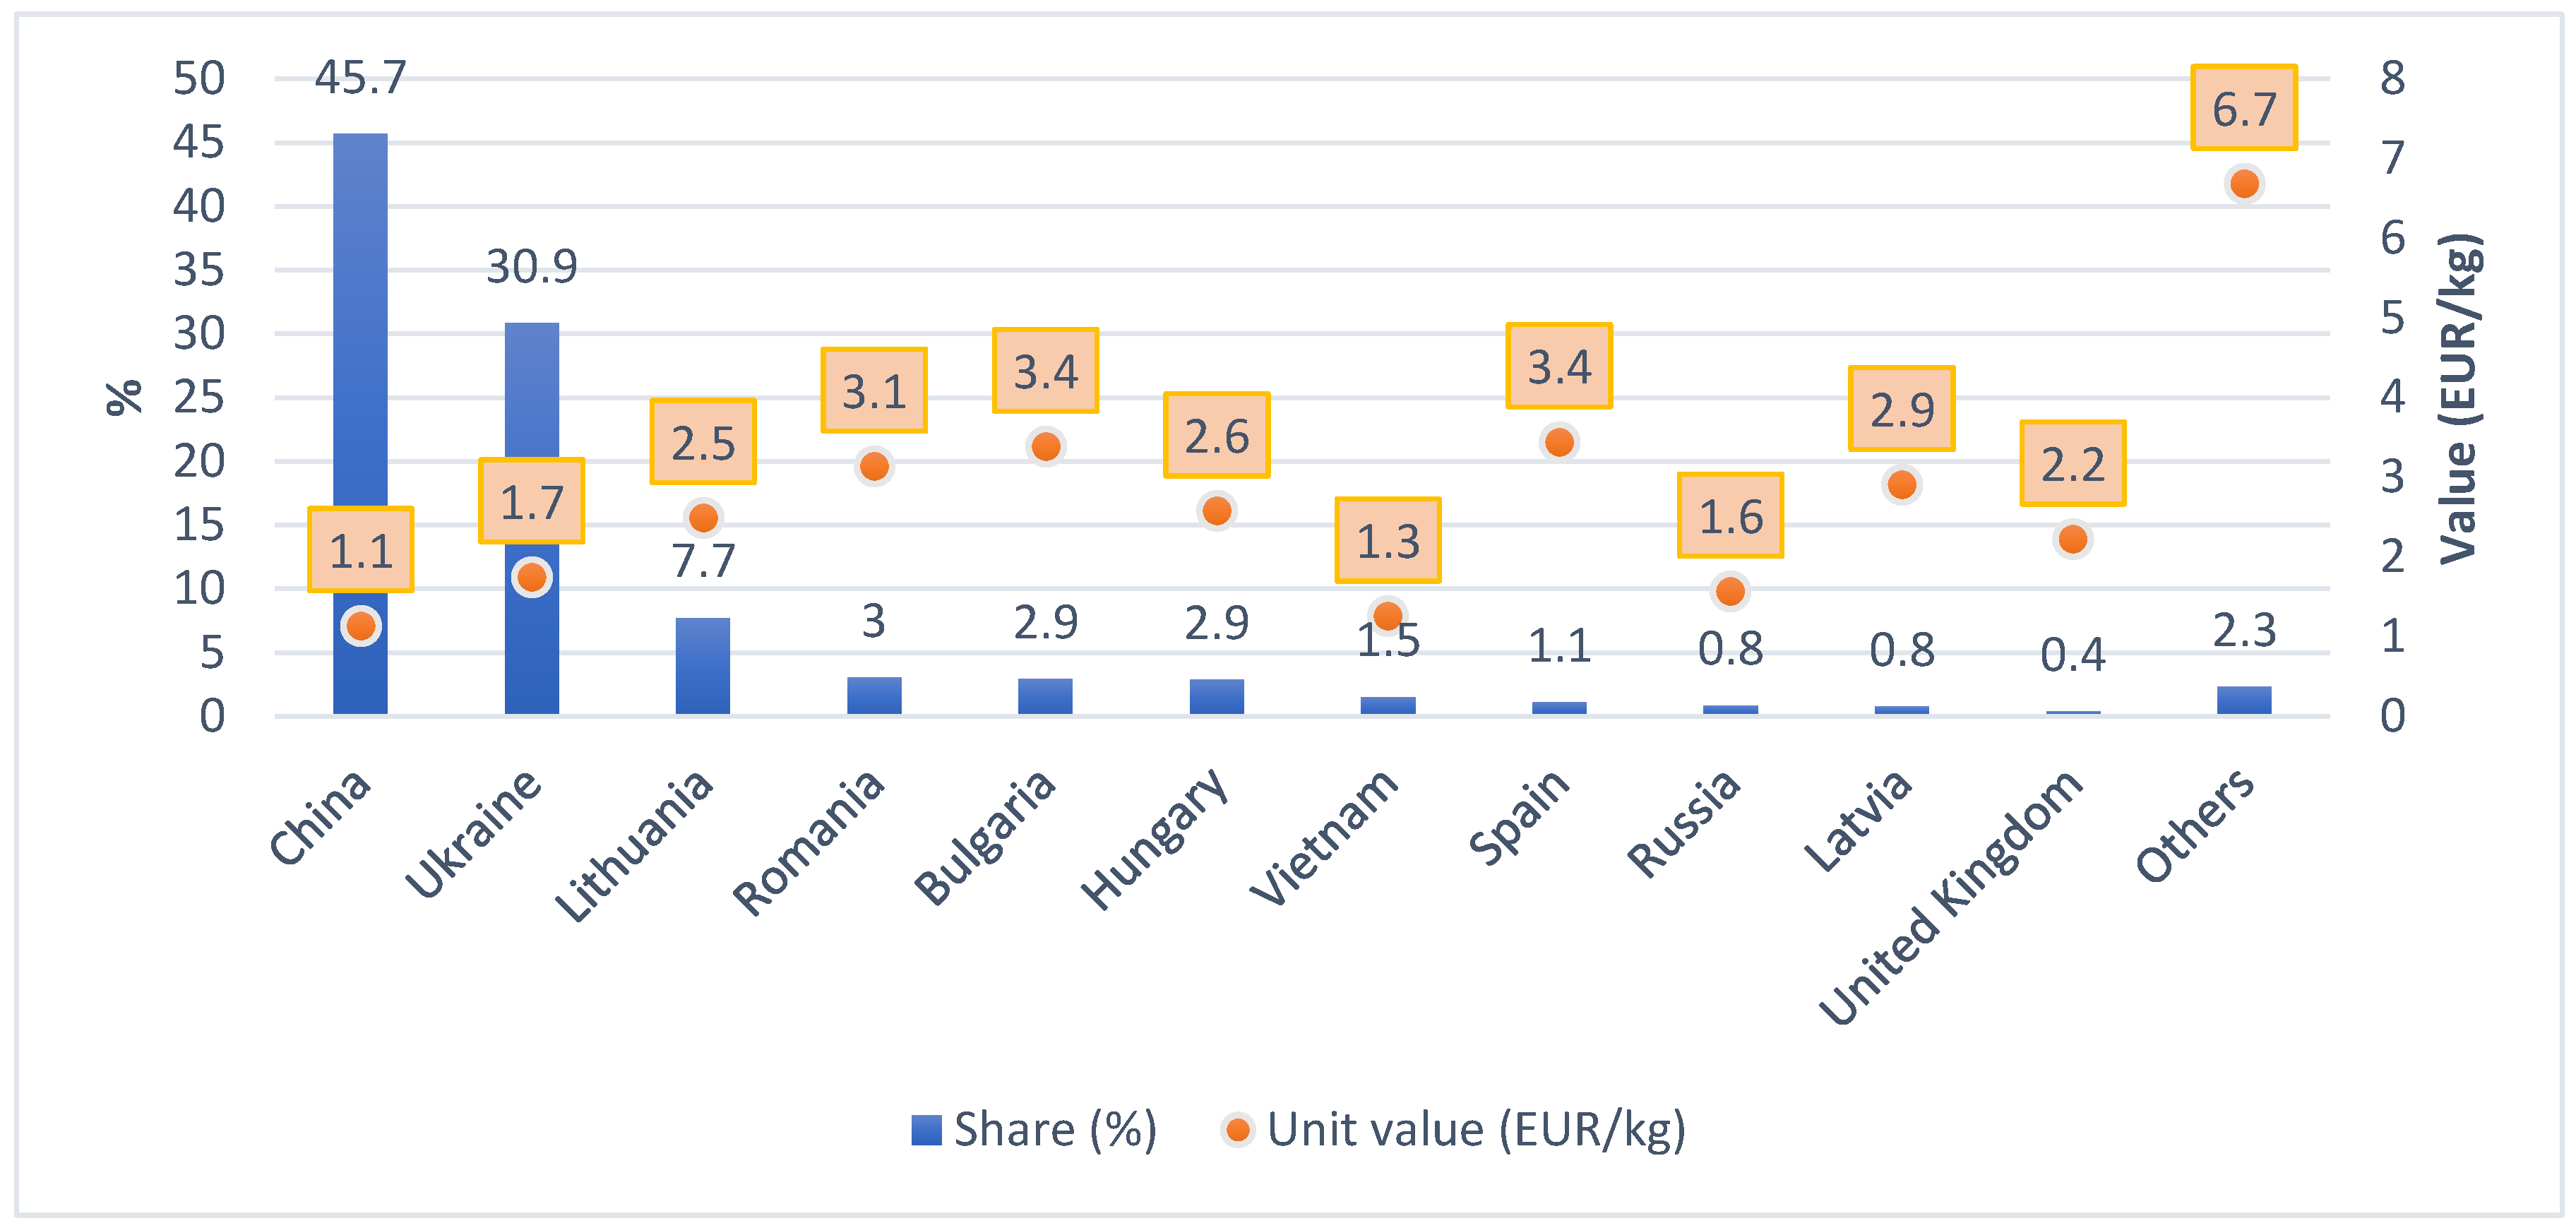
Figure 9.
Geographical structure and unit prices of honey exports from Poland in 2024.
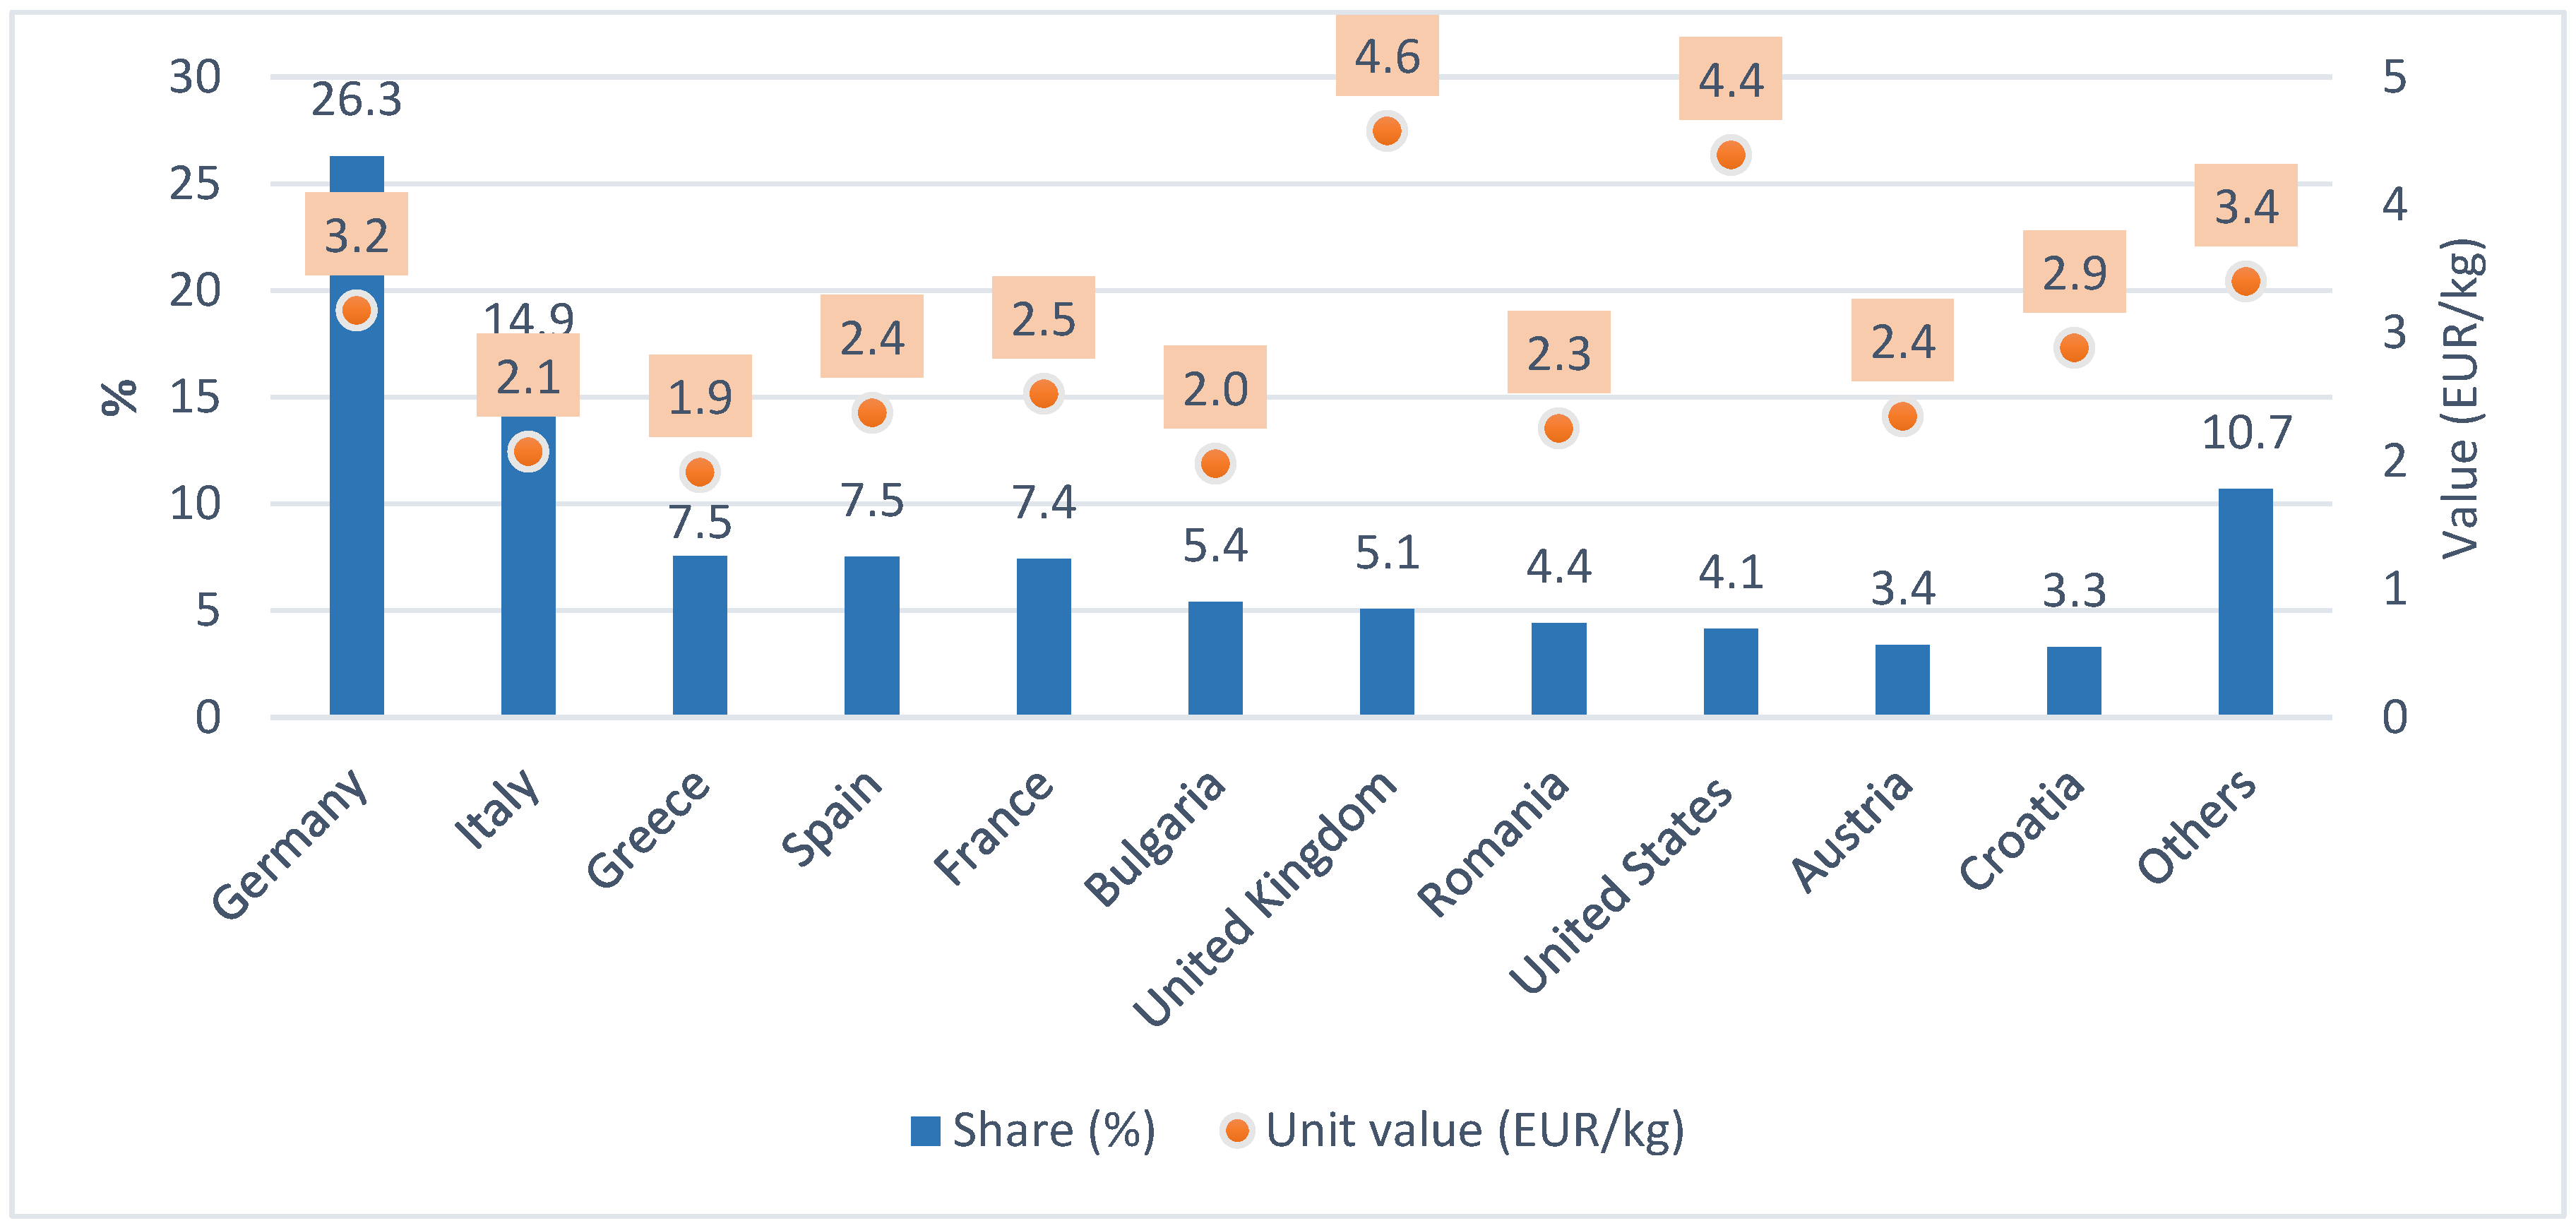

Table 1.
Honey production in Poland by voivodeship in 2024 – yields in non-commercial and commercial apiaries and total production.
Table 1.
Honey production in Poland by voivodeship in 2024 – yields in non-commercial and commercial apiaries and total production.
| Voivodeship | Honey production | ||
|---|---|---|---|
| Non-commercial apiaries (kg per bee colony) | Commercial apiaries (kg per bee colony) | Total honey production (t) | |
| Lubelskie | 22 | 41 | 4870.8 |
| Wielkopolskie | 20 | 25 | 3408.2 |
| Warmińsko - mazurskie | 16 | 25 | 2101.2 |
| Małopolskie | 14 | 21 | 2001.2 |
| Mazowieckie | 17 | 24 | 1971.4 |
| Dolnośląskie | 18 | 27 | 1861.3 |
| Podkarpackie | 14 | 28 | 1855.8 |
| Kujawsko - pomorskie | 26 | 33 | 1852.6 |
| Śląskie | 14 | 28 | 1770.3 |
| Pomorskie | 20 | 25 | 1214.4 |
| Łódzkie | 17 | 25 | 1207.7 |
| Zachodniopomorskie | 18 | 27 | 1235.8 |
| Lubuskie | 25 | 31 | 1194.0 |
| Świętokrzyskie | 12 | 22 | 1026.0 |
| Opolskie | 21 | 28 | 806.5 |
| Podlaskie | 16 | 21 | 581.1 |
| Total 1 | 18 | 31 | 31005.1 |
1 The value also includes data provided by one nationwide beekeeping organization.
Table 2.
Detailed breakdown of the main production costs per one bee colony in 2024 (EUR).
| Breakdown of costs | Type of beekeeping farms | ||||
|---|---|---|---|---|---|
| Non-commercial | Share (%) | Commercial | Share (%) | ||
| Fixed costs | Depreciation – beehive | 12.9 | 11.4 | 12.9 | 10 |
| Depreciation – equipment | 2.8 | 2.5 | 5.6 | 4.4 | |
| Depreciation – processing facility | – | – | 4.7 | 3.6 | |
| Apiary site lease | – | – | 1.2 | 0.9 | |
| Total fixed costs | 15.7 | 13.9 | 24.4 | 18.9 | |
| Variable costs | Feeding | 14.1 | 12.5 | 14.1 | 10.9 |
| Foundation wax | 3.5 | 3.1 | 4.2 | 3.3 | |
| Queen bees | 5.5 | 4.9 | 8.2 | 6.4 | |
| Veterinary treatments | 4.3 | 3.8 | 4.3 | 3.4 | |
| Transport | 4.8 | 4.2 | 15.6 | 12.1 | |
| Electricity | 2.7 | 2.4 | 5.4 | 4.2 | |
| Labour | 59.9 | 53.1 | 48.0 | 37.2 | |
| Materials and other expenses | 2.3 | 2.1 | 4.7 | 3.6 | |
| Total variable costs | 97.2 | 86.1 | 104.6 | 81.1 | |
| Total costs | 112.9 | 100 | 129 | 100 | |
Table 3.
Foreign trade in honey in Poland in 2019–2024 – volume, value, unit value and trade balance.
Table 3.
Foreign trade in honey in Poland in 2019–2024 – volume, value, unit value and trade balance.
| Year | Exports | Imports | Trade balance (exports – imports) | ||||
|---|---|---|---|---|---|---|---|
| Volume (tonnes) | Value (th. EUR) | Unit value (EUR/kg) |
Volume (tonnes) | Value (th. EUR) | Unit value (EUR/kg) |
Value (th. EUR) | |
| 2019 | 16837.2 | 38996.6 | 2.3 | 29802.3 | 56694.0 | 1.9 | -17697.4 |
| 2020 | 24890.7 | 54873.8 | 2.2 | 37453.5 | 69271.1 | 1.8 | -14397.3 |
| 2021 | 18773.1 | 52817.4 | 2.8 | 37614.8 | 77080.5 | 2.0 | -24263.1 |
| 2022 | 15046.7 | 49574.5 | 3.3 | 31842.6 | 67800.1 | 2.1 | -18225.6 |
| 2023 | 13984.1 | 39438.2 | 2.8 | 27202.2 | 52391.1 | 1.9 | -12952.9 |
| 2024 | 12239.0 | 34425.6 | 2.8 | 26585.6 | 47131.1 | 1.8 | -12705.5 |
Table 4.
Foreign trade in honey in Poland by geographical direction (Intra-EU and Extra-EU), 2019–2024 – volume, value and unit value.
Table 4.
Foreign trade in honey in Poland by geographical direction (Intra-EU and Extra-EU), 2019–2024 – volume, value and unit value.
| Honey trade | Trade indicators | Year | ||||||
|---|---|---|---|---|---|---|---|---|
| 2019 | 2020 | 2021 | 2022 | 2023 | 2024 | |||
| Exports | Intra-EU | Volume (tonnes) | 16680.0 | 21216.7 | 17798.7 | 13453.2 | 12788.7 | 10840.5 |
| Value (th. EUR) | 38172.3 | 45776.3 | 48783.2 | 43023.8 | 34044.6 | 28180.9 | ||
| Unit value (EUR/kg) | 2.3 | 2.2 | 2.7 | 3.2 | 2.7 | 2.6 | ||
| Extra-EU | Volume (tonnes) | 157.2 | 3674.1 | 974.4 | 1593.5 | 1195.4 | 1398.5 | |
| Value (th. EUR) | 824.3 | 9097.6 | 4034.2 | 6550.7 | 5393.6 | 6244.7 | ||
| Unit value (EUR/kg) | 5.2 | 2.5 | 4.1 | 4.1 | 4.5 | 4.5 | ||
| Imports | Intra-EU | Volume (tonnes) | 4165.8 | 5252.5 | 4059.0 | 2661.8 | 2456.8 | 4573.8 |
| Value (th. EUR) | 15364.1 | 17696.4 | 16616.7 | 10941.8 | 8518.4 | 15342.9 | ||
| Unit value (EUR/kg) | 3.7 | 3.4 | 4.1 | 4.1 | 3.5 | 3.4 | ||
| Extra-EU | Volume (tonnes) | 25636.5 | 32200.9 | 33555.8 | 29180.7 | 24745.4 | 22011.8 | |
| Value (th. EUR) | 41329.9 | 51574.7 | 60463.8 | 56858.4 | 43872.8 | 31788.2 | ||
| Unit value (EUR/kg) | 1.6 | 1.6 | 1.8 | 1.9 | 1.8 | 1.4 | ||
Table 5.
Honey supply on the domestic market in Poland in 2019–2024.
| Year | Trade balance of honey (imports – exports) (th. tonnes) |
Domestic honey production (th. tonnes) |
Market supply of honey (th. tonnes) |
Population (millions) | Honey supply per capita (kg) |
|---|---|---|---|---|---|
| 2019 | 13.0 | 18.1 | 31.1 | 38.4 | 0.8 |
| 2020 | 12.6 | 12.7 | 25.2 | 38.1 | 0.7 |
| 2021 | 18.8 | 18.4 | 37.3 | 37.9 | 1.0 |
| 2022 | 16.8 | 24.0 | 40.8 | 37.8 | 1.1 |
| 2023 | 13.2 | 27.4 | 40.6 | 37.6 | 1.1 |
| 2024 | 14.3 | 31.0 | 45.4 | 37.5 | 1.2 |
Disclaimer/Publisher’s Note: The statements, opinions and data contained in all publications are solely those of the individual author(s) and contributor(s) and not of MDPI and/or the editor(s). MDPI and/or the editor(s) disclaim responsibility for any injury to people or property resulting from any ideas, methods, instructions or products referred to in the content. |
© 2025 by the authors. Licensee MDPI, Basel, Switzerland. This article is an open access article distributed under the terms and conditions of the Creative Commons Attribution (CC BY) license (http://creativecommons.org/licenses/by/4.0/).
Copyright: This open access article is published under a Creative Commons CC BY 4.0 license, which permit the free download, distribution, and reuse, provided that the author and preprint are cited in any reuse.


