
Submitted:
29 October 2025
Posted:
30 October 2025
You are already at the latest version
Abstract
The widespread dispersion of microplastics (MPs) has been recognized as a pervasive and per-sistent environmental contaminant in worldwide freshwater ecosystems and although relative studies skyrocketed, there are still knowledge gaps from areas like southern Europe. This study assesses the microplastic pollution in seven Greek inland aquatic ecosystems which vary in morphology, trophic status, and anthropogenic pressure. Surface and vertical samples were taken with 200 μm plankton nets. MPs were present in all samples with fibers being the dominant form having an abundance range between 0.60 and 159.7 n/m3, while fragments between 0.08 and 9.17 n/m3. Fibers and fragments had greater abundance in the vertical than in the surface samples. There were no significant abundance differences between lakes and lagoons, and among the sampling sites in each ecosystem. Blue and transparent were the colors that prevailed while most of the fibers and fragments were smaller than 1 mm. Five types of MPs were recorded with PET being the most frequent among fibers. The use of the novel Relative Anthropogenic Pressure (RAP) index resulted in the highest positive correlations between morphometrical and sociological parameters and the microplastic’s abundance reflecting better the impingement of the human populations on the inland aquatic ecosystems.
Keywords:
fibers
; fragments
; abundance
; horizontal
; vertical
; correlation
; size
; color
; lakes
; lagoons
1. Introduction
Plastic pollution has emerged as one of the most widespread anthropogenic environmental challenges of our planet. While their presence in marine ecosystems has been widely documented, inland waters— including rivers, lakes, reservoirs, and estuaries —are now recognized as critical and vulnerable reservoirs of microplastics (MPs), synthetic polymer particles under 5 mm [1]. These contaminants originate from a complex matrix of sources, broadly classified into primary MPs, intentionally manufactured as minute particles (e.g., industrial pellets, cosmetic microbeads), and secondary MPs, resulting from the environmental degradation of larger plastic debris through photochemical, mechanical, and biological processes [2]. The pathways of MPs into inland waters may include wastewater treatment plant effluents, which are a significant source of microfibers from synthetic textiles, surface runoff from urban and agricultural areas, atmospheric deposition, and direct inputs from tourism and recreational activities [3]. After their introduction to the water bodies MPs accumulate and can be retained for decades, undergo weathering, complex cycles of sedimentation, resuspension, and burial, with their fate intricately linked to the system's specific hydrological and ecological conditions [4]. At the same time MPs interact with biota, thereby posing a direct threat to aquatic life and the provisioning of ecosystem services. The ecological impacts are profound and multi-faceted. Ingestion by a wide range of organisms, from planktonic filter-feeders to fish, can lead to physical blockages, false satiation, and the translocation of particles into tissues. Furthermore, MPs act as vectors for hydrophobic organic contaminants and heavy metals and can leach additive chemicals, exacerbating their toxicological potential [5].
Most of the early and ongoing research on freshwater MPs has focused predominantly on the surface water, specifically using plankton nets (e.g., manta trawls) to sample the uppermost layer (usually the first 15-30 cm). This methodological preference has provided a crucial, yet fundamentally two-dimensional, understanding of MP distribution, capturing primarily buoyant particles in the uppermost water layer [6]. However, this approach inherently fails to capture the full complexity of MP dynamics within the aquatic environment. The distribution of MPs throughout the water column is highly dynamic, influenced by seasonal thermal stratification, wind-induced mixing, plankton blooms, and the formation of biofouling communities on particle surfaces, which can alter their buoyancy and drive vertical fluxes [7]. Furthermore, dense polymers (e.g., polyester, PVC) and composite materials may never reach the surface. A growing body of evidence confirms that significant MP loads are found throughout the water column and in benthic sediments, often exceeding surface concentrations [8]. Ignoring the water column leads to a severe underestimation of total MP inventory within a lake and misrepresents the exposure risk for pelagic and migratory organisms. Therefore, there is need for standardized, depth-integrated sampling protocols that capture the full vertical profile of MP contamination to accurately assess its load, fate, and ecological impact in lentic ecosystems [5].
As the field of MP research evolves from initial reconnaissance to more mechanistic understanding, a significant challenge remains in quantitatively linking MP abundance and distribution to specific driving factors. A significant and persistent knowledge gap involves the quantitative correlation of MP abundance with key morphometric and socioeconomic factors of the inland waters. Morphometric parameters of a water body, such as its surface area, volume, mean and maximum depth, shoreline development index, and water retention time, are likely to be critical in determining MP fate [9,10]. Concurrently, socioeconomic factors dictate emission pressures. Watershed-level attributes such as population density, the presence and efficiency of wastewater treatment infrastructure, land use patterns (percentages of urban, agricultural, and natural land), and tourism intensity have been identified as key predictors of MP contamination in several contexts [10]. However, comprehensive studies that systematically analyze the interplay between a suite of morphometric and socioeconomic drivers across a range of different ecosystem types within the same geographic region are exceptionally rare. Understanding these complex correlations is fundamental for developing risk assessment frameworks, creating predictive models to identify pollution hotspots, and informing targeted, cost-effective management and policy interventions.
Geographically, global research on freshwater MPs exhibits a pronounced bias, with extensive studies concentrated in North America, Northern Europe, and East Asia. In contrast, the inland waters of Southern Europe, particularly the Balkan Peninsula, remain a glaring blind spot in the global contamination map [8]. This is a critical omission, as the Mediterranean region is characterized by a confluence of high population density in coastal zones, intense seasonal tourism, and unique climatic conditions that are likely to create distinct MP emission and transport patterns. Transitional ecosystems like coastal lagoons provide numerous ecosystem services. However, despite growing concerns, the occurrence and distribution of MPs in lagoon systems of Mediterranean remain largely unknown [11,12]. Within this understudied region, Greece, with its rich diversity of inland aquatic ecosystems—from deep, oligotrophic lakes to shallow, eutrophic wetlands and biologically productive estuaries—represents a significant data vacuum. Until recently, there weren’t any studies on microplastic pollution in inland water bodies of the country. In 2024, Perraki et al. [13] investigated the MPs abundance and distribution in Erasinos River estuary situated in a highly polluted and industrialized area, and Salmas et al. [14] reported data concerning MPs in a remote alpine lake. Apart from these two reports, there is no information concerning urban lakes with different characteristics. Therefore, a comprehensive, comparative assessment of MPs across a gradient of Greek lakes and estuaries, which vary in morphology, trophic status, and anthropogenic pressure, is entirely lacking, leaving a fragmented understanding of the sources, sinks, and transport mechanisms specific to the Greek environment and hindering the development of regional risk assessments and effective mitigation policies.
Considering the critical knowledge gaps previously described such as the scarcity of data from Southern Europe and Greece, the vertical distribution of MPs, and the lack of correlation with driving factors, this study aims to provide a comprehensive and comparative assessment of microplastic pollution in a range of Greek inland aquatic ecosystems. The specific objectives are to: a) Quantify and characterize the abundance, polymer types, sizes, and colors of microplastics in the surface waters and the water column of seven distinct inland aquatic ecosystems in Greece, including both lakes and lagoons. b) Compare and contrast the distribution patterns across these different ecosystems to identify system-specific contamination signatures. c) Investigate the relationship between microplastic abundance and a suite of key morphometric and sociological factors within the respective areas. By addressing these aims, this research will advance the regional understanding of MP pollution in Southern Europe, provide a more complete, three-dimensional perspective on MP distribution, and establish a foundational model for correlating MP contamination with its environmental and anthropogenic drivers in diverse inland waters.
2. Materials and Methods
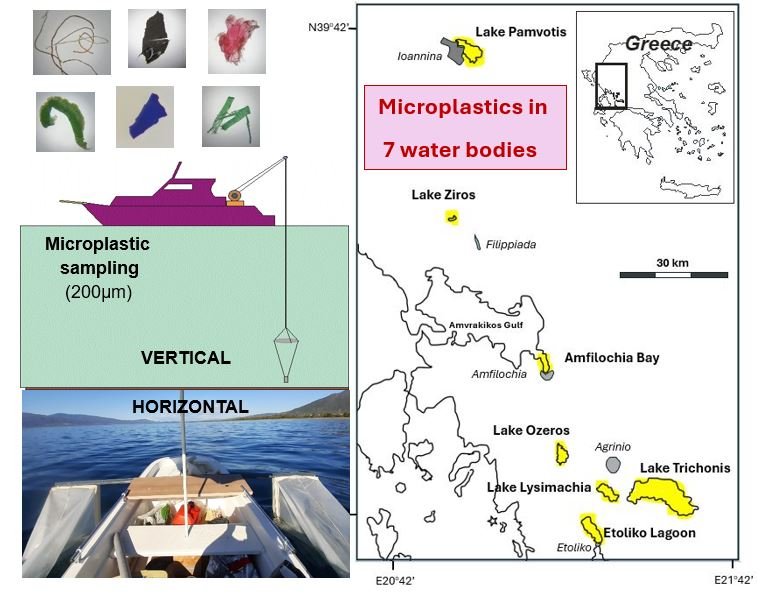
2.1. The Study Area
The present study was conducted in five natural lakes and two coastal lagoons situated in western Greece (Figure 1). These areas have differences concerning their morphometric, trophic and socioeconomic characteristics, as well as the main human activities (Table 1). Lake Trichonis is the largest natural lake in Greece. It is a deep and warm monomictic lake and previous studies have classified it as oligotrophic to mesotrophic [15,16]. There are various surface water supplies (e.g. seasonal streams), as well as groundwater inflows (approx. 30 % of the total annual water inflows), which provide an adequate quantity of water and result in a positive water balance [17]. In the surrounding area there are 23 villages, having an overall population of about 20.000 residents, with most of them occupied with agriculture. The lake has been included in the Natura 2000 network of protected areas. Also, it is very rich in fish species, from which the economically most important Atherina boyeri Risso, 1810 is exploited by professional fishing [18].
Lake Lysimachia is a shallow lake, which has positive water balance due to inflow of water from the nearby Trichonis Lake, with which it is connected by a sluice gate canal. Apart from various seasonal streams entering the lake, there is also an outflow of water to Acheloos River via a canal. Until 2000, the lake was receiving the untreated sewage of the nearby city of Agrinio, thus becoming eutrophic. Nowadays, although the lake is in a better state due to the termination of the incoming of urban waste [19], it continues to receive small amounts of waste from the surrounding agricultural areas.
Lake Ozeros is also a shallow lake, with an area of about 10.1 km2 and a closed drainage basin of 59 km2 [20]. The lake is supplied with water from seasonal streams that occur mainly in the east-southeast part, as well as from the Acheloos River, when it overflows, through a technical canal. The major environmental disturbances of Lake Ozeros are the receiving of agricultural drainage and waste from the nearby operating farms and villages. Fishing is conducted from only a few no professional fishermen.
Lake Pamvotis is a shallow ancient lake in direct contact with the city of Ioannina having a population of 65,000 residents. Hydrologically, the lake is fed by springs and a system of sinkholes drained to three rivers and several torrents, and there is a man-controlled outflow. The intensification of human activities (urban development, industries, growth of population, livestock farming and agriculture) affected dramatically the water quality, leading to eutrophication and depth reduction [21]. Within the lake there is a small island inhabited by almost 200 residents. However, the island is a tourist attraction and is visited by more than 200,000 tourists every year. For their transportation there is a fleet of 14 boats performing more than 7,000 courses per year between the city and the island. There are also a few small fishing ports for several professional fishermen. Finally, the lake is used in several water sports activities, while it is often the center of national and international rowing events.
Lake Ziros is a very small and deep lake (length: 900 m, width: 600 m, depth: 58 m), with a mean depth of 9 m, recharged with karstic springs. The lake is considered mesotrophic, and it is fed by underground springs [22]. It is situated in the middle of a forest and is a highly protected area, being part of the Natura 2000 network. The water is used for irrigation purposes, while the only recreational activity that is allowed in this lake is canoeing.
Aitoliko Lagoon is a semi-enclosed brackish basin situated in the coasts of western Greece, having a maximum depth of 27 m and a mean depth of 12 m. The basin communicates southerly with a typical shallow lagoon (Mesolonghi Lagoon) with mean depth of about 0.5 m which is in direct contact with the city of Mesolonghi in the south. The system is receiving the wastewater treatment plant effluents of the Aitoliko village, as well as effluents from the intensive agriculture in the neighboring area. Aitoliko Lagoon receives fresh water from three main streams as well as from a pumping station, which drains an extended cultivated land of the catchment area [23]. The water column of this basin presents intense anoxic conditions, especially deeper than 7 m, where a thick layer of H2S exists, that occasionally emerges resulting in massive fish deaths [24]. The area has a historical record of such anoxic incidents since 1881.
Amfilochia Bay is situated in the southeastern edge of the Amvrakikos Gulf, which is the largest gulf in Greece. The bay is in direct contact with the city of Amfilochia and receives its urban waste coming into this basin by rainfall. There is a small commercial and fishing port in the bay. Considering the existing information about the entire Amvrakikos Gulf [25], the bay is considered also eutrophic.
2.2. Sampling
The sampling in each of the seven aquatic ecosystems was conducted horizontally and vertically using nylon nets with 200 μm porosity. Three sampling stations were selected for each area, except for Lake Ziros where only two sampling sites were selected due to the small size of the lake. The surface (horizontal) samples were taken using a pair of nets with rectangular openings (50 x 50 cm, gauze length: 160 cm), which were adjusted at 1 m away from both sides of a small boat and placed in such a manner to sample the above 20 cm of surface water. The nets were hauled at a speed of 1.5 knots for a period between 10 and 20 min, regarding the trophic characteristics of each area, to avoid clogging. A Hyrdo-Bios flowmeter was used to estimate the volume of the filtered water. In the vertical sampling, a conical nylon net (50 cm diameter, 160 cm length) was hauled vertically by hand with a speed of about 0.5 m/sec from near bottom to surface. The nets were thoroughly washed with surface water before and after horizontal and vertical sampling. After each haul, the cod end contend of the net was washed into clean 250 ml glass jars, where 4 % borax buffered formaldehyde was added to preserve the zooplankton and other organic material.
2.3. Laboratory Measurements
In the laboratory, each sample was rinsed with distilled water through a small conical sieve (50 μm mesh size) to remove the formaldehyde and then it was transferred to a covered glass vessel. Each sample was examined in glass petri dishes under an Optika SLX-3 stereoscope. All the plastic particles (fibres and fragments) were carefully hand-picked using laboratory tweezers and transferred to glass jars having a solution of 30 % H2O2 for at least 72 hours at room temperature to digest the organic remains in their surface. Measurements of the length of the fibers, and the width of each fragment found in the samples were performed. All fragments were counted and classified according to their shape and color. Photos of all microplastic fragments were taken using a microscope eyepiece camera (Optika CB-5). Data on the abundance of all MPs was calculated considering the total volume filtered and expressed as items per cubic meter (n/m3). Laboratory contamination risks were avoided as far as possible during the sample preparation by cleaning all the materials used for storing, sorting samples and measuring microplastics (i.e., glass plates and steel needles and forceps) and by working in controlled conditions, while wearing cotton lab coats and nitrile gloves. Samples were always kept covered, except during microscopic investigation.
Due to the difficulty of discriminating the transparent plastic fibers from other fiber-like organic material, needles with curved tips were used to exercise pressure in the middle of the fiber, expecting a permanent deformation in the pressing spot. In cases of doubt for some fragments, a needle with candescent tip was used to perform a melting test; particles that melted when heated by touching were considered microplastics [26]. The investigation of fragments revealed four different morphotypes, as follows (Figure 2). 1) ‘hard rounded’: fragments having irregular rounded shape, with smooth or rough surface (Figure 2a). 2) ‘hard flattened’: fragments having flat and hard surface with their thickness being proportionally too small (Figure 2b). 3) ‘soft flattened’: fragments having flat but soft surface with their thickness being proportionally too small (Figure 2c). 4) ‘cable like’: fragments having cable-like shape with much greater length than width, with soft or hard surface being either smooth or rough (Figure 2d).
FT-IR spectra measurements of a number of microplastics that were randomly selected from the samples of all water bodies, were conducted on a FT/IR-6000 JASCO Fourier transform spectrometer using the KBr pellet method. Transmittance spectra were obtained for a total of 64 scans between 4000–400 cm-1 with a spectral resolution of 4 cm-1. A background scan in air was taken prior to each measurement. The different types of common microplastics’ data were identified using a self-generated polymer library (i.e. spectra of reference polymer types provided by industry). The level of certainty when comparing sample spectrum to that of the self-generated library database was set up to 70 % [27].
Data on the microplastics abundance was statistically analyzed using the non-parametric Mann-Whitney (U) test or the Kruskal-Wallis test for comparisons between samples, sampling stations, and the seven aquatic ecosystems. Pearson correlation analysis between the abundance of fibers and fragments, as well as between their abundance and other morphometric and socioecological factors of the seven ecosystems was applied. All the analyses were performed with IBM SPSS 29.
3. Results
3.1. Abundance of Fibers and Fragments
The analysis of 40 horizontal (surface) and 20 vertical samples from seven inland aquatic ecosystems of Greece revealed the presence of microplastics in all the samples, in the forms of fibers or/and fragments. The fibers outnumbered the total MPs reaching a total number of 4693, among which 3554 were recovered from the horizontal and 1139 from the vertical samples. The respective numbers of fragments were 747 and 78. The average abundance of the fibers found in the horizontal samples in the seven aquatic ecosystems fluctuated between 0.60 n/m3 (Standard Error = ± 0.15 n/m3) recorded in Lake Ziros and 19.57 ± 8.61 n/m3 in Lake Pamvotis. The respective values for the fragments were 0.08 ± 0.03 n/m3 in Lake Ozeros and 5.04 ± 1.94 n/m3 in Lake Pamvotis (Figure 3). No fragments were found in Lake Ziros either in the horizontal or the vertical samples. Generally, the abundance of fibers and fragments was greater in the vertical samples than in the horizontal. In particular, the average abundance values of the fibers ranged between 6.27 ± 3.87 n/m3 recorded in Lake Ziros and 159.66 ± 46.54 n/m3 in Lake Pamvotis.
The respective values for the fragments were 2.33 ± 1.06 n/m3 in Lake Ozeros and 9.17 ± 2.70 n/m3 in Lake Pamvotis (Figure 3). Also, the abundance ratio of fibers/fragments was greater in the vertical than in the horizontal samples in all the studied areas. Specifically, the ratio of fibers/fragments in the horizontal samples fluctuated between 3.9 (Lake Pamvotis) and 18.7 (Amfilochia Bay) with an average value of 4.76, in comparison to the vertical samples where the ratio fluctuated between 9.9 (Etoliko Lagoon) and 37.4 (Lysimachia Lake) with an average value of 18.4.
There were no statistically significant differences in the abundance of fibers and fragments between the five lakes and the two lagoons either in the case of the horizontal or the vertical samples (U-test, p > 0.05). Also, no statistically significant differences were found among the abundance of fibers or fragments among the sampling stations in each of the seven ecosystems (Kruskal-Wallis test, p > 0.05). There was positive and statistically significant correlation between the abundance of fibers and fragments (Pearson correlation analysis), both in the horizontal (r2 = 0.781, p < 0.001), and the vertical samples, (r2 = 0.889, p < 0.001).
3.2. Color, Size, Shape and Type of MPs
Nine colors were found in the case of fibers and fragments. Blue was the most frequent color among the fibers recovered from the horizontal samples (34.3 %) and prevailed in all ecosystems except Lake Pamvotis, where black fibers accounted for 23.1 % (Figure 4). In the vertical samples the transparent fibers dominated overall (32.0 %), followed by red (18.2 %) and black (17.3 %). However, differences were found in the color’s frequencies among the seven ecosystems (Figure 4). Transparent was the most frequent color among the fragments recovered from both the horizontal and the vertical samples (36.5 % and 24.1 %, respectively), and followed by blue, with little differences among the seven ecosystems (Figure 4).
The overall length spectrum of fibers ranged between 0.3 and 15 mm, with most of them having lengths between 2-3 mm and accounted for 54.0 % and 55.0 % of their total number in the horizontal and vertical samples, respectively (Figure 5). This was a similar trend for most of the seven ecosystems, except for Lake Trichonis where fibers smaller than 1 mm prevailed in all the samples (Figure 5). Utilizing the measurements of the fragments’ dimensions, their area was estimated as mm2 and it is presented for all the horizontal and vertical samples in Figure 6. The results showed that the area of the fragments varied considerably between 0.01 mm2 and 80.0 mm2. The highest proportion (27.4 %) of the fragments found in the horizontal samples were having an area greater than 4 mm2, while most of the fragments (38.6 %) in the vertical samples had an area smaller than 0.1 mm2 (Figure 6).
The microplastic fragments recovered from the samples varied also in their shape, defined in four distinct morphotypes (Figure 7). Most of the fragments were having the ‘hard flattened’ morphotype (71.5 % and 75.0 % in the horizontal and vertical samples, respectively), followed by the ‘hard rounded’ morphotype (11.8 % and 15,2 %), the ‘cable like’ morphotype (9.3 % and 8.8 %) and the ‘soft flattened’ which accounted for 3.5 % and 4.4 %, respectively. In the case of the horizontal samples, the ‘hard flattened’ morphotype prevailed in all the seven ecosystems, while was the only fragment type in Lake Lysimachia. However, in the vertical samples the ‘hard rounded’ morphotype prevailed in Lake Pamvotis (50.0 %) and presented equal proportions with the ‘hard flattened’ and the ‘cable like’ morphotypes in Lake Lysimachia (Figure 7).
Due to the relatively small number of MPs inspected using FT-IR, comparisons among the seven water bodies were not attempted. The overall analysis revealed the presence of five types of MPs. Among them PET (Polyethylene terephthalate) dominated in the form of fibers and accounted for 84.3 %, while PP (Polypropylene) accounted for 15.7 %. In the case of fragments, PET was also the most common form (39.2 %), followed by PP (27,5 %), while other three types were identified, PA (Polyamide), PVA (Polyvinyl alcohol) and PVC (Polyvinyl chloride) that accounted for 23.5 %, 7.8 % and 2.0 %, respectively.
3.3. Correlation with Morphometrical and Sociological Factors
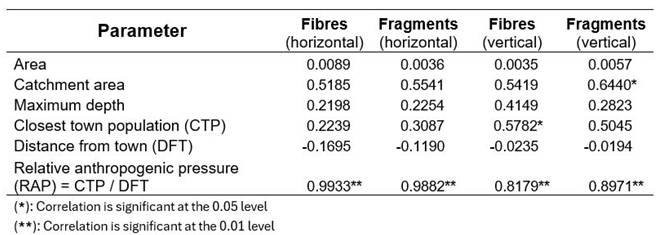
Investigation of the contribution of morphometrical and some sociological characteristics of the seven aquatic ecosystems to the abundance variation of microplastic pollution in the form of fibers and fragments, was attempted. Pearson correlation between the mean abundance of the total microplastics (fibers and fragments) in the horizontal and vertical samples with these elements is presented in Table 2.
The results showed that parameters like the area of the aquatic ecosystems, their catchment area, and the maximum depth did not correlate significantly with any of the microplastics (Pearson correlation coefficient r2, p > 0.05) in all combinations. There was a weak positive correlation (r2 = 0.644, p < 0.05) between the abundance of the fragments from the vertical samples and the catchment area of the ecosystems (Table 2). Also, there was an indication that microplastics correlated with the size of the population of the town closest to the ecosystem (CTP) in the case of fibers found in the vertical samples (r2 = 0.5782, p = 0.047). The distance of the water bodies from the populated areas (DFT) was established as the minimum strait distance from the edges of the closest tow to the edges of the aquatic ecosystem measured using Google Earth Pro. The distance revealed negative correlations in all the combinations of samples and MP forms. Considering that the population size may affect proportionally the abundance of MPs as the distance from the water body diminishes, we propose an index called RAP (Relative Anthropogenic Pressure) that is the fraction of the population size of the closest town (CTP) over the minimum distance from this town (DFT). The RAP was calculated using data of the population size of the closest town provided by the Hellenic Statistical Authority for the population census of 2021, while the minimum distance in the case of towns being in contact with the water body was set to 0.1 km (Table 1). In the case of RAP, the abundance of fibers and fragments from the horizontal and the vertical samples presented their highest correlation values (Table 2).
4. Discussion
One of the main problems in the studies of microplastic pollution in aquatic environments is the lack of a uniform sampling methodology [8]. Generally, there are two types of collecting samples from a water body, the volume-reduced sampling where the volume of the sample is reduced using a filtering device like a net or a sieve during the process, and the bulk sampling where the whole volume of the sample is taken without reducing it. In the first method the filtering device is equipped with a mesh that can range from 20 μm [28] to 500 μm [29], with a mesh size 300–335 μm to be the most used [3,8,12]. In this case, some investigators collected samples with neuston nets (e.g. manta nets) or other types of plankton nets, and others used pumps to collect samples from the water column and concentrated them through sieves [30]. The advantage of the volume-reduced method is that samples can be taken from extended areas both in the horizontal and vertical axis, providing more representative data of the aquatic ecosystem. Thus, in such studies the volume of water sampled is much larger than the bulk method and usually accounts for tens of hundreds of cubic meters in comparison to litters or even mls [8]. The main disadvantage of this method is the underestimation of smaller microplastics [31]. Indeed, in most studies using volume-reduced sampling, water samples have been taken from lakes with nets of a mesh size of approximately 300 μm, which means that the microplastic abundance may be underestimated due to the restriction of mesh pore size [32]. Comparisons of the microplastic abundance acquired using mesh size of 100, 333 and 500 μm showed that mesh size 100 μm can collect 2.5 times more particles compared to 333 μm and 10 times more than 500 μm mesh size [33]. Thus, in studies using this methodology, knowledge is limited to the larger microplastic fraction, and not on smaller particles that could be crucial in the functioning of inland aquatic ecosystems, since these small particles can be ingested by planktonic organisms [34].
On the other hand, the bulk sampling method typically uses stainless-steel buckets or glass bottles with fixed sizes to collect surface water samples with volumes usually in the range of 1 to 30 liters. In this case, taking multiple replicates is highly suggested considering the limited sampling area covered and the high variability of MP spatial distribution [8]. Hence, the lack of representativeness and the high variability due to relevant small sample size are the main disadvantages of this method. Bulk sampling can be applied in all kinds of water bodies but is highly preferable in shallow areas with much vegetation, where towing a net is problematic. Malla-Pradhan et al. [31] reported that bulk sampling and volume-reduced sampling were almost equally implemented during sample collection in a number of reviewed articles. In the present study the volume-reduced method was selected to be applied in open areas of seven inland ecosystems having very little or no vegetation. The mesh size of the nets used was 200 μm, as a compromise between the range of 100 to 333 μm so as not to “lose” much of the microplastic pollution and taking in mind the clogging issues of the net in eutrophic areas. However, the use of this specific net-porosity does not facilitate the comparison of the present results with other areas worldwide. Except for the wide variety of sampling methods, the sample processing and detection techniques of MPs, the majority of which depend heavily on visual identification, implies that errors during sampling, biases, and the elimination of some particles of specific sizes or densities are inevitable, making the comparison and interpretation of the results very difficult [2]. Given that currently no unified methods exist for sampling, pre-treatment and detection of MPs, and therefore, researchers are applying different analysis protocols in different studies which hinder data comparability, there is an urgent need to develop common standards for microplastic sampling, sample handling, analysis, and the presentation of research results [35]. Considering the above interpretation difficulties, it must be pointed that the density values of the microplastic fibers and fragments found in the present study are within the range of other investigations in European lakes [30], and lakes from around the world [3,10] as well as lagoons [12,36]. In comparison with other aquatic ecosystems in Greece, the present abundance values of MPs are much too lower than those reported for the Erasinos River estuary situated in a highly polluted and industrialized area [13], with measurements originated from bulk water sampling. On the other hand, in the study of Salmas et al. [14] conducted in an alpine lake of Greece using a plankton net with almost the same porosity (150 μm) as of the present investigation, the authors found a total abundance of 21 fibers plus fragments per m3, which is within the range of this study.
In most of the studies concerning MPs in inland aquatic ecosystems, the sampling methodology was based on collecting samples from the water surface layers [30], [3,10,37,38]. This means that the only synthetic polymers isolated from the environment were those that had a specific weight lower than that of water [39], and that, consequently, floated on surface waters. Contrary, MPs having specific weights higher than that of water and could therefore be located at greater depths, may have been disregarded [39]. Also, it should be considered that organisms that may potentially ingest microplastics are not restricted only to the surface, which comprises a minimal space in the entire ecosystem, and is characterized by peculiar conditions not ideal for most of aquatic life. Indeed, the present investigation of microplastic pollution not only on the surface, but in the entire water column, revealed that fibers and fragments had greater abundance in the vertical than in the surface samples. Moreover, the significant positive correlations of the MPs abundance among the fibers and fragments in the horizontal and the vertical samples in all aquatic ecosystems may indicate a homogenous distribution of the MPs in the entire environment of each basin. Usually, the surface water contains higher concentrations of microplastics than the water column [3], but this does not apply to all studies. Tamminga and Fischer [40] studied a dimictic lake in Germany and reported that the concentration of fragments decreased with depth, whereas fibres did not show any trend. Yang et al. [41] studied the presence of MPs in different depths and found also that their average abundance was highest in surface water than in the middle and the bottom water samples. Driscoll et al. [42] collected water in horizontal and vertical directions of Yellowstone Lake and revealed that the average number of MPs from surface water was greater than that from vertical water. In contrast, Lenaker et al. [43] did not find significant differences between sampled depths and concluded that polymer density was the critical factor that influenced their vertical distribution. Meng et al. [38] investigated microplastics in three layers of Baiyangdian Lake and found that during the wet period, the vertical distribution of MPs was highest in the surface, followed by the sublayer and sediment layer, while during the depleted period, the abundance distribution exhibited an opposite pattern. Li et al. [44] found that the fiber fraction decreased from the topmost to the bottom while the fragment increased, which is the opposite of the present results. Factors such as vertical flow velocities in the water column, shape, specific surface area, polymer type, and biological interactions significantly influence the vertical abundance of MPs [38]. The existence of vertically stratified samples, in which the MP’s abundance, types and other characteristics was recorded, would have revealed the complete picture of their presence in the entire ecosystem and explain their spatial distribution. This could account for a future challenge and recommendation not only for the present ecosystems, but for worldwide aquatic basins.
Fibers were the dominant shape of MPs in the present study, which is in accordance with the reports concerning most of the lakes worldwide [3,8,31]. Indeed, there are only a few studies reporting that fragments exceeded fibers [9,40,45]. Fibers are also dominant among the other MP shapes in lagoons and estuaries [11,12,46]. Microfibers generated by synthetic fabrics during daily use are currently the main source of microplastics in the environment, with discharged wastewater and precipitation being the primary sources of surface water pollution [37]. Huge quantities of microfibers are released when laundering clothing in washing machines, and these are discharged with wastewater from treatment facilities [30]. Moreover, the atmospheric transportation of fibers is one of the most important sources of pollution, especially in isolated areas [47,48]. Since fibers are present in the air, it is virtually impossible to avoid contamination of the samples completely and consequently this parameter cannot be ignored [49]. In the present study a certain protocol has been followed during the laboratory analyses and handling of the samples in order to avoid contamination from airborne fibers. However, contamination of the samples during the field investigation cannot be excluded, which could have resulted in an overestimation of the fiber abundance in the samples from all aquatic ecosystems.
In most of the studies concerning microplastic pollution the colors of the particles are recorded, and their origination is discussed. In the present investigation, blue was the predominant color among fibers and transparent among the fragments in the surface samples. However, in the vertical samples the transparent fibers prevailed while there was intense variation in the colors of the fragments, probably because of their small numbers in these samples. Salmas et al. [14] reported that fibers were predominantly blue (95 %) whereas fragments were mainly transparent (73 %) in an alpine lake of Greece, while Perraki et al. [13] found that the microplastic particles in the form of fibers and fragments were predominantly blue in color in Erasinos River estuary (Greece). Transparent and blue fibers and fragments were the most common reported in extensive reviews on lake’s microplastics conducted by Pan et al. [37], and Chen et al. [10]. Pol et al. [9] reported the most frequent occurrence of blue colored MPs in 30 lakes of Poland. The prevalence of blue color within microplastics may be due to physical factors. Given that blue plastics cannot effectively absorb UV light, they age faster in the sun, and a higher proportion of bluish microplastics is often found in the environment, especially toward the smallest sizes [50]. The color of microplastics is considered an important parameter which may act as a cue to the organisms that may mistake microplastics for their prey. Miranda et al. [51] investigated the diets of 14 species of freshwater fishes and found that 96 % of the specimens examined had ingested fibers with the predominant colors to be blue (59 %) and black (33 %). Rojas-Luna et al. [52] found also that blue fibers dominated the MPs found in the diet of seven species of freshwater fishes in a tropical lagoon in Colombia. Erdoğan [53] reported that the most frequently observed colors in the gills and gastrointestinal tract of three freshwater fishes from Gelingüllü Reservoir (Türkiye) were blue and black. Colors of plastics may play key roles in the plastic photoaging, microplastic formation, and subsequent environmental effects of microplastics, and therefore the influence of color should be considered in assessing the ecological risk and toxicity of plastics in the environment [50].
The size and shape of microplastics are also highly important parameters because they can affect their ingestion by aquatic organisms. The shapes of microplastic fragments in the aquatic environment are varied, and the literature lacks cohesion regarding the morphological description of these particles [30]. In some studies fibers may account for one of the shapes of MPs [39], while in others they constitute a different category with fragments having variability in their shapes. This lack of consistency in the nomenclature of the different morphotypes of them may be partially due to their source of origin, which could be varied among ecosystems from different geographical regions. Therefore, interpretation of the present results with other studies seems pointless. Regarding the size of the MPs, the present results showed that in the seven aquatic ecosystems most of the fibers were smaller than 1 mm, while most of the fragments had an area of less than 0.05 mm2, being usually smaller than 0.3 mm. This agrees with a consistent global trend towards the dominance of MPs smaller than 1 mm, and often even smaller than 0.5 mm [10]. This prevalence of sub-millimeter particles raises heightened ecological concerns due to their increased potential for ingestion by plankton and other small organisms, facilitating entry into the food web [4]. However, from reviewed studies it was found that the most prevalent size range of microplastic may differ greatly among studies, with the smallest size distribution and composition of microplastics precisely depending on the overall sampling methods [31].
Five types of MPs were found in the present investigation, however, due to the great numbers of particles found in the samples, only a small proportion of them could be identified. Therefore, other MP types may existed and remained undetected, while also interpretation of the results among the seven aquatic ecosystems was not possible. The domination of the polyethylene terephthalate (PET) among the fibers is not unexpected, since the same was reported in various studies ([14,43,48]). Also, several review articles report that polyethylene (PE), polypropylene (PP), and polyethylene terephthalate (PET) are the primary identified polymer types in inland aquatic ecosystems [2,10,37]. Fisheries, agricultural and other production activities are additional sources of MPs, with fishing lines and nets, and agricultural films as the main sources of these pollutants [37]. The presence of polyamide (PA) and polypropylene (PP) indicate that they originate probably from fishing activities and wastewater effluents [54].
The concentration of MPs is not random but is strongly related to a combination of hydrological and morphometric characteristics of the aquatic ecosystems along with the socioeconomic dynamics of their watershed. Understanding these relations is crucial for predicting pollution hotspots and designing effective mitigation strategies. The seven aquatic ecosystems in this study differ in several morphometric and sociological elements, such as their surface area, catchment area, depth, trophic level, the distance from populated areas and the size of population close to them. Also, there is a variation in the human activities within or around these areas that may be involved in their load of microplastic pollution. Generally, there were not remarkable qualitative differences among the seven water bodies, as far as the forms, types, shapes and colors of the MPs are concerned. This qualitative homogeneity could be ought to the relatively small geographic dispersion of these ecosystems, the similar climatic conditions, the lack of heavy industrial activity close to them and the comparable anthropogenic impingement. However, certain quantitative divergences emerged. Lake Pamvotis was the most polluted water body in the present investigation, as it was expected, taking in mind the population of the city of Ioannina in contact with the lake and other human activities like tourism, boat transportation, and water sports that may be responsible for its contamination with microplastics. In the opposite side was Lake Ziros, being in a forest area, away from populated areas and practically with no human intervention, which showed the lowest loads of fibers and the entire absence of fragments. Proximity to sources is a critical factor for MPs pollution in inland waters. Although there are cases of remote lakes and water bodies with a remarkable concentration of MPs despite the absence of surrounding sources [14,55], the most polluted sites are associated with the input from near urban settlements or human activities [10,37]. Tanentzap et al. [56] studied 67 European lakes and found that those that were situated in urban catchments were more exposed to microplastic accumulation, since this is where there is high potential for microplastic emissions, high population density, and high waste production and wastewater discharge. In turn, lakes in forested catchments are less exposed to microplastic accumulation as are those with high biological degradation rates thanks to resident microbial communities that facilitate the degradation of inflowing pollution.
The trophic state is the attribute explored most in lentic water bodies because it is closely related to aquatic pollution and water degradation. The correlation between eutrophication and MPs concentration derives from the fact that MPs can accelerate eutrophication and that domestic sewage is one of the main sources of these particles that enter the water bodies [10]. However, Li et al. [57] investigating 18 lakes in China found that the lake trophic state was not correlated with the microplastic abundance in surface waters. Moreover, Pol et al. [9] investigated 30 lakes in Poland and reported the lack of statistically significant differences between groups of lakes with different trophic states, which was likely due to small differences in trophic level and high regional unification. There was a gradient in the trophic state of the seven aquatic ecosystems in the present study, which, however, seems not to be directly related to the abundance of MPs. Unfortunately, there were no direct or reliable bibliographic measurements concerning the trophic state of each water body to be included in the correlation with the MPs abundance.
There were no considerable differences in the microplastic abundance between lakes and lagoons in the present study. Coastal lagoons are valuable conservation areas and support extensive fishing and aquaculture activities, being economically significant, but at the same time are particularly susceptible to MPs pollution because of their shallow depth, limited water exchange, and elevated anthropogenic pressure [11]. Regarding different water types, the lagoons exhibit notably higher MP abundance, which can be attributed to their frequent hydraulic exchanges that inhibit MP settlement and promote resuspension, resulting in a higher abundance of MPs in the surface water [8]. Recently, El-Alfy et a. [11] and Gündoğdu et al. [12] investigated the presence of microplastics in coastal lagoons of Egypt and Turkey, respectively, and reported much too higher abundance values in comparison to this study. However, as previously mentioned, methodological differences amongst studies of MPs in coastal lagoons were a limiting factor for comparisons [36].
Generally, studies that attempt to correlate microplastic abundance with various parameters on a large geographic scale confront the intense variation in the sampling, handling and detection methods among investigators, that can end up with questionable outcomes. On the other hand, investigations using the same methodology in a number of different aquatic ecosystems can provide more accurate and reliable results concerning the interrelation of MPs with other parameters. The present outcomes of the correlations between the abundance of fibers and fragments and morphometric and sociologic parameters reveal that the area and the maximum depth of the water body are irrespective of the microplastic load. On the other hand, the catchment area and the population size may play a small role in the load of either the fragments or the fibers found in the vertical samples. In contrast, the distance from the closest town is negatively correlated to the microplastic abundance. Population and distance from residential areas are important parameters for characterizing the effects of anthropogenic activity on MP abundance. In their review, Pan et al. [37] reported that the abundance of MPs in lakes is negatively correlated with the depth and area of lakes and distance to populated areas and positively correlated with the surrounding population density. In the present study, these two parameters, population size and distance from the water body, combined in the form of the Relative Anthropogenic Pressure (RAP) which then was correlated to the microplastic abundance. The outcome was a positive correlation that reached the highest values in all the combinations of samples and MP forms. To our knowledge, this approach has not been used in other studies, but this index seems to correspond better to the real effect of a human population which is expected to be proportional to the distance from the aquatic ecosystem. After all, human activities are the main if not the only sources of microplastics and directly determine their distributions in the environment, while their quantitative estimation is practically unachievable. Though, these two parameters are directly measurable and easy to access, since the distance from town can be counted using Goggle Earth, and the town populations are free to access from the country’s authorities. Therefore, the RAP index is suggested to become an additional correlation factor that would be used in other studies.
5. Conclusions
The present investigation is an attempt to provide a comprehensive, comparative assessment of the microplastic pollution across a gradient of five Greek lakes and two coastal lagoons, which vary in morphology, trophic status, and anthropogenic pressure. The results showed that MP particles were present in all samples, with the fibers being the dominant form, both in the surface and within the vertical axis of the seven aquatic ecosystems. Fibers and fragments had greater abundance in the vertical than in the surface samples, pointing out the significance of the investigation of the microplastic pollution not only on the surface but also in the vertical axis, in order to have a better insight into the distribution and fate of the MPs. Methodological variation among the studies of MPs abundance did not permit the direct comparison of the present abundance results with other investigations worldwide. However, comparison among the seven water bodies revealed the absence of significant differences between the lakes and the lagoons, as well as the absence of differences among the sampling sites in each ecosystem. Moreover, the positive correlations of the MPs abundance among the fibers and fragments in the horizontal and the vertical samples of all aquatic ecosystems may indicate a homogenous distribution of the MPs in the entire water body of each ecosystem. Blue and transparent were the colors that prevailed, while, regarding the size of the MPs, the general rule "smaller and fibrous" that holds true on a global scale, is also applied in the present study. The correlations between the abundance of fibers and fragments and morphometric and sociologic parameters reveal that the area and the maximum depth of the water body are irrespective of the microplastic load, while the size of the population and the distance from the closest town showed weak and negative correlations, respectively. When these two last factors combined to give a novel index, such as the Relative Anthropogenic Pressure (RAP), the correlation reached the highest positive values. Thus, we recommend the use of this index in the correlations of the microplastic’s abundance, as it proved more suitable to reflect the impingement of the human populations on the inland aquatic ecosystems.
Author Contributions
The individual contributions of the authors are as follows: George Kehayias (GK): Conceptualization, Supervision, validation, writing—review and editing. Penelope Kanellopoulou (PK): Investigation, data curation, writing—original draft preparation. Achilleas Kechagias (AK): Data curation, writing—review and editing. Aris Giannakas (AG): Data curation, writing—review and editing. Constantinos Salmas (CS): Methodology, writing—review and editing. Theofanis Maimaris (TM): Methodology, data curation, writing—review and editing. Michael Karakassides (MK): Methodology, writing—review and editing. All authors have read and agreed to the published version of the manuscript.
Funding
There was no funding for this research.
Data Availability Statement
The are no supplementary data presented in this study.
Conflicts of Interest
The authors declare no conflict of interest.
References
- Bhowmik, A.; Saha, G. Microplastics in Our Waters: Insights from a Configurative Systematic Review of Water Bodies and Drinking Water Sources. Microplastics 2025, 4, 24. [Google Scholar] [CrossRef]
- Jolaosho, T.L.; Rasaq, M.F.; Omotoye, E.V.; Araomo, O.V.; Adekoya, O.S.; Abolaji, O.Y.; Hungbo, J.J. Microplastics in Freshwater and Marine Ecosystems: Occurrence, Characterization, Sources, Distribution Dynamics, Fate, Transport Processes, Potential Mitigation Strategies, and Policy Interventions. Ecotoxicology and Environmental Safety 2025, 294, 118036. [Google Scholar] [CrossRef] [PubMed]
- Liang, S.; Liu, J.; Bao, M.; Fan, Y.; Kong, M. Microplastics in Lakes: Distribution Patterns and Influencing Factors. Journal of Hazardous Materials 2025, 493, 138339. [Google Scholar] [CrossRef]
- Swain, P.R.; Parida, P.K.; Majhi, P.J.; Behera, B.K.; Das, B.K. Microplastics as Emerging Contaminants: Challenges in Inland Aquatic Food Web. Water 2025, 17, 201. [Google Scholar] [CrossRef]
- Strojny, W.; Gruca-Rokosz, R.; Cieśla, M. Microplastics in Water Resources: Threats and Challenges. Applied Sciences 2025, 15, 4118. [Google Scholar] [CrossRef]
- Razeghi, N.; Hamidian, A.H.; Wu, C.; Zhang, Y.; Yang, M. Microplastic Sampling Techniques in Freshwaters and Sediments: A Review. Environ Chem Lett 2021, 19, 4225–4252. [Google Scholar] [CrossRef] [PubMed]
- Zhang, Z.; Deng, C.; Dong, L.; Liu, L.; Li, H.; Wu, J.; Ye, C. Microplastic Pollution in the Yangtze River Basin: Heterogeneity of Abundances and Characteristics in Different Environments. Environmental Pollution 2021, 287, 117580. [Google Scholar] [CrossRef]
- Zhao, B.; Richardson, R.E.; You, F. Microplastics Monitoring in Freshwater Systems: A Review of Global Efforts, Knowledge Gaps, and Research Priorities. Journal of Hazardous Materials 2024, 477, 135329. [Google Scholar] [CrossRef]
- Pol, W.; Stasińska, E.; Żmijewska, A.; Więcko, A.; Zieliński, P. Litter per Liter – Lakes’ Morphology and Shoreline Urbanization Index as Factors of Microplastic Pollution: Study of 30 Lakes in NE Poland. Science of The Total Environment 2023, 881, 163426. [Google Scholar] [CrossRef]
- Chen, D.; Wang, P.; Liu, S.; Wang, R.; Wu, Y.; Zhu, A.-X.; Deng, C. Global Patterns of Lake Microplastic Pollution: Insights from Regional Human Development Levels. Science of The Total Environment 2024, 954, 176620. [Google Scholar] [CrossRef]
- El-Alfy, M.A.; El-Hamid, H.T.A.; Keshta, A.E.; Elnaggar, A.A.; Darwish, D.H.; Alzeny, A.M.; Abou-Hadied, M.M.; Toubar, M.M.; Shalby, A.; Shabaka, S.H. Assessing Microplastic Pollution Vulnerability in a Protected Coastal Lagoon in the Mediterranean Coast of Egypt Using GIS Modeling. 2025. [Google Scholar] [CrossRef]
- Gündoğdu, S.; Çevik, C.; Terzi, Y.; Gedik, K.; Büyükdeveci, F.; Öztürk, R.Ç. Microplastics in Turkish Coastal Lagoons: Unveiling the Hidden Threat to Wetland Ecosystems. Environmental Pollution 2025, 375, 126351. [Google Scholar] [CrossRef]
- Perraki, M.; Skliros, V.; Mecaj, P.; Vasileiou, E.; Salmas, C.; Papanikolaou, I.; Stamatis, G. Identification of Microplastics Using Μ-Raman Spectroscopy in Surface and Groundwater Bodies of SE Attica, Greece. Water 2024, 16, 843. [Google Scholar] [CrossRef]
- Salmas, C.; Alexopoulos, K.; Papanikolaou, I.; Vasileiou, E.; Perraki, M. Microplastics Identification in Remote Aquatic Environments Using Raman Spectroscopy: A Case Study for Mt. Tymfi’s Alpine Lake. J Raman Spectroscopy 2025, jrs.70007. [Google Scholar] [CrossRef]
- Doulka, E.; Kehayias, G. Spatial and Temporal Distribution of Zooplankton in Lake Trichonis (Greece). Journal of Natural History 2008, 42, 575–595. [Google Scholar] [CrossRef]
- Kehayias, G.; Doulka, E. Trophic State Evaluation of a Large Mediterranean Lake Utilizing Abiotic and Biotic Elements. JEP 2014, 05, 17–28. [Google Scholar] [CrossRef]
- Zacharias, I.; Dimitriou, E.; Koussouris, Th. Integrated Water Management Scenarios for Wetland Protection: Application in Trichonis Lake. Environmental Modelling & Software 2005, 20, 177–185. [Google Scholar] [CrossRef]
- Tsounis, L.; Iliadi, K.; Kehayias, G. Food and Ecology or How Dietary Alterations Can Affect an Aquatic Ecosystem. J. Ethn. Food 2021, 8, 22. [Google Scholar] [CrossRef]
- Chalkia, E.; Kehayias, G. Zooplankton and Environmental Factors of a Recovering Eutrophic Lake (Lysimachia Lake, Western Greece). Biologia 2013, 68, 459–469. [Google Scholar] [CrossRef]
- Chalkia, E.; Kehayias, G. Zooplankton Community Dynamics and Environmental Factors in Lake Ozeros (Greece). Medit. Mar. Sci. 2013, 14, 32. [Google Scholar] [CrossRef]
- Latinopoulos, D.; Koulouri, M.; Kagalou, I. How Historical Land Use/Land Cover Changes Affected Ecosystem Services in Lake Pamvotis, Greece. Human and Ecological Risk Assessment: An International Journal 2021, 27, 1472–1491. [Google Scholar] [CrossRef]
- Kagalou, I.; Psilovikos, A. Assessment of the Typology and the Trophic Status of Two Mediterranean Lake Ecosystems in Northwestern Greece. Water Resour 2014, 41, 335–343. [Google Scholar] [CrossRef]
- Gianni, A.; Str, S.; Zacharias, I. Temporal and Spatial Distribution of Physico-Chemical Parameters in an Anoxic Lagoon, Aitoliko, Greece. 2012. [Google Scholar]
- Gianni, A.; Kehayias, G.; Zacharias, I. Geomorphology Modification and Its Impact to Anoxic Lagoons. Ecological Engineering 2011, 37, 1869–1877. [Google Scholar] [CrossRef]
- Kehayias, G.; Aposporis, M. Zooplankton Variation in Relation to Hydrology in an Enclosed Hypoxic Bay (Amvrakikos Gulf, Greece). Medit. Mar. Sci. 2014, 15, 554. [Google Scholar] [CrossRef]
- Vasilopoulou, G.; Kehayias, G.; Kletou, D.; Kleitou, P.; Triantafyllidis, V.; Zotos, A.; Antoniadis, K.; Rousou, M.; Papadopoulos, V.; Polykarpou, P.; et al. Microplastics Investigation Using Zooplankton Samples from the Coasts of Cyprus (Eastern Mediterranean). Water 2021, 13, 2272. [Google Scholar] [CrossRef]
- Koutsikos, N.; Koi, A.M.; Zeri, C.; Tsangaris, C.; Dimitriou, E.; Kalantzi, O.-I. Exploring Microplastic Pollution in a Mediterranean River: The Role of Introduced Species as Bioindicators. Heliyon 2023, 9, e15069. [Google Scholar] [CrossRef] [PubMed]
- Bharath K, M.; S, S.; Natesan, U.; Ayyamperumal, R.; Kalam S, N.; S, A.; K, S.; C, A. Microplastics as an Emerging Threat to the Freshwater Ecosystems of Veeranam Lake in South India: A Multidimensional Approach. Chemosphere 2021, 264, 128502. [Google Scholar] [CrossRef]
- Celis-Hernandez, O.; Ávila, E.; Rendón-von Osten, J.; Briceño-Vera, E.A.; Borges-Ramírez, M.M.; Gómez-Ponce, A.M.; Capparelli, V.M. Environmental Risk of Microplastics in a Mexican Coastal Lagoon Ecosystem: Anthropogenic Inputs and Its Possible Human Food Risk. Science of The Total Environment 2023, 879, 163095. [Google Scholar] [CrossRef]
- Bowszys, M. MICROPLASTICS IN THE WATERS OF EUROPEAN LAKES AND THEIR POTENTIAL EFFECT ON FOOD WEBS: A REVIEW.
- Malla-Pradhan, R.; Pradhan, B.L.; Phoungthong, K.; Joshi, T.P. Microplastic in Freshwater Environment: A Review on Techniques and Abundance for Microplastic Detection in Lake Water. Trends Sci 2023, 20, 5202. [Google Scholar] [CrossRef]
- Li, T.; Zhang, W.; Yu, H.; Hai, C.; Wang, Y.; Yu, S.; Tsedevdorj, S.-O. Research Status and Prospects of Microplastic Pollution in Lakes. Environ Monit Assess 2023, 195, 485. [Google Scholar] [CrossRef]
- Lindeque, P.K.; Cole, M.; Coppock, R.L.; Lewis, C.N.; Miller, R.Z.; Watts, A.J.R.; Wilson-McNeal, A.; Wright, S.L.; Galloway, T.S. Are We Underestimating Microplastic Abundance in the Marine Environment? A Comparison of Microplastic Capture with Nets of Different Mesh-Size. Environmental Pollution 2020, 265, 114721. [Google Scholar] [CrossRef] [PubMed]
- Rai, M.; Dhanker, R.; Sharma, N.; Kamakshi; Kamble, S.S.; Tiwari, A.; Du, Z.-Y.; Mohamed, H.I. Responses of Natural Plastisphere Community and Zooplankton to Microplastic Pollution: A Review on Novel Remediation Strategies. Arch Microbiol 2025, 207, 136. [Google Scholar] [CrossRef] [PubMed]
- Solayman, H.M.; Robby, M.D.A.; Satriaji, F.V.; Hossain, Md.K.; Kang, K.; Aziz, A.A.; Shiu, R.-F.; Jiang, J.-J. Mapping Global Microplastic Pollution: Integrating Advanced Detection and Monitoring in Aquatic Ecosystems. Marine Pollution Bulletin 2026, 222, 118685. [Google Scholar] [CrossRef]
- Garcés-Ordóñez, O.; Saldarriaga-Vélez, J.F.; Espinosa-Díaz, L.F.; Canals, M.; Sánchez-Vidal, A.; Thiel, M. A Systematic Review on Microplastic Pollution in Water, Sediments, and Organisms from 50 Coastal Lagoons across the Globe. Environmental Pollution 2022, 315, 120366. [Google Scholar] [CrossRef]
- Pan, T.; Liao, H.; Yang, F.; Sun, F.; Guo, Y.; Yang, H.; Feng, D.; Zhou, X.; Wang, Q. Review of Microplastics in Lakes: Sources, Distribution Characteristics, and Environmental Effects. Carbon Res. 2023, 2, 25. [Google Scholar] [CrossRef]
- Meng, X.; Tian, X.; Zhao, R.; Wang, B.; Qi, J.; Zhang, W.; Li, S.; Shan, B. Spatiotemporal and Vertical Distribution Characteristics and Ecological Risks of Microplastics in Typical Shallow Lakes in Northern China. Environmental Pollution 2025, 382, 126773. [Google Scholar] [CrossRef]
- Hidalgo-Ruz, V.; Gutow, L.; Thompson, R.C.; Thiel, M. Microplastics in the Marine Environment: A Review of the Methods Used for Identification and Quantification. Environ. Sci. Technol. 2012, 46, 3060–3075. [Google Scholar] [CrossRef]
- Tamminga, M.; Fischer, E.K. Microplastics in a Deep, Dimictic Lake of the North German Plain with Special Regard to Vertical Distribution Patterns. Environmental Pollution 2020, 267, 115507. [Google Scholar] [CrossRef] [PubMed]
- Yang, R.; Xu, X.; Xue, Y.; Zhang, L.; Guo, J.; Wang, L.; Peng, M.; Zhang, Q.; Zhu, Y. Horizontal and Vertical Distribution of Microplastics in Gehu Lake, China. Water Supply 2022, 22, 8669–8681. [Google Scholar] [CrossRef]
- Driscoll, S.C.; Glassic, H.C.; Guy, C.S.; Koel, T.M. Presence of Microplastics in the Food Web of the Largest High-Elevation Lake in North America. Water 2021, 13, 264. [Google Scholar] [CrossRef]
- Lenaker, P.L.; Baldwin, A.K.; Corsi, S.R.; Mason, S.A.; Reneau, P.C.; Scott, J.W. Vertical Distribution of Microplastics in the Water Column and Surficial Sediment from the Milwaukee River Basin to Lake Michigan. Environ. Sci. Technol. 2019, 53, 12227–12237. [Google Scholar] [CrossRef]
- Li, J.; Liu, Y.; Chen, Q.; Cai, Y.; Liao, Y.; Liu, L.; Tang, Y. Revealing Microplastic Risks in Stratified Water Columns of the East China Sea Offshore. Water Research 2025, 271, 122900. [Google Scholar] [CrossRef]
- Malygina, N.; Mitrofanova, E.; Kuryatnikova, N.; Biryukov, R.; Zolotov, D.; Pershin, D.; Chernykh, D. Microplastic Pollution in the Surface Waters from Plain and Mountainous Lakes in Siberia, Russia. Water 2021, 13, 2287. [Google Scholar] [CrossRef]
- Garcés-Ordóñez, O.; Saldarriaga-Vélez, J.F.; Espinosa-Díaz, L.F.; Canals, M.; Sánchez-Vidal, A.; Thiel, M. A Systematic Review on Microplastic Pollution in Water, Sediments, and Organisms from 50 Coastal Lagoons across the Globe. Environmental Pollution 2022, 315, 120366. [Google Scholar] [CrossRef]
- Evangeliou, N.; Grythe, H.; Klimont, Z.; Heyes, C.; Eckhardt, S.; Lopez-Aparicio, S.; Stohl, A. Atmospheric Transport Is a Major Pathway of Microplastics to Remote Regions. Nat Commun 2020, 11, 3381. [Google Scholar] [CrossRef] [PubMed]
- Padha, S.; Kumar, R.; Dhar, A.; Sharma, P. Microplastic Pollution in Mountain Terrains and Foothills: A Review on Source, Extraction, and Distribution of Microplastics in Remote Areas. Environmental Research 2022, 207, 112232. [Google Scholar] [CrossRef] [PubMed]
- Kaliszewicz, A.; Winczek, M.; Karaban, K.; Kurzydłowski, D.; Górska, M.; Koselak, W.; Romanowski, J. The Contamination of Inland Waters by Microplastic Fibres under Different Anthropogenic Pressure: Preliminary Study in Central Europe (Poland). Waste Manag Res 2020, 38, 1231–1238. [Google Scholar] [CrossRef]
- Zhao, X.; Wang, J.; Yee Leung, K.M.; Wu, F. Color: An Important but Overlooked Factor for Plastic Photoaging and Microplastic Formation. Environ. Sci. Technol. 2022, 56, 9161–9163. [Google Scholar] [CrossRef]
- Miranda, L.M.; Da Silva, T.C.; Pimentel, A.A.; Do Rosário Ramos, K.; Da Silva, L.M.A.; Souza, A.C.F.; De Souza Gama, C. Intake of Microplastics by Fishes in a Floodplain Lake of the Curiaú River (Macapá, Amapá, Brazil). Aquat Sci 2025, 87, 77. [Google Scholar] [CrossRef]
- Rojas-Luna, R.A.; Oquendo-Ruiz, L.; García-Alzate, C.A.; Arana, V.A.; García-Alzate, R.; Trilleras, J. Methods to Characterize Microplastics: Case Study on Freshwater Fishes from a Tropical Lagoon in Colombia. Environ Sci Pollut Res 2024, 31, 64171–64184. [Google Scholar] [CrossRef]
- Erdoğan, Ş. Microplastic Contamination in Freshwater Fish: First Insights from Gelingüllü Reservoir (Türkiye). Water Air Soil Pollut 2025, 236, 386. [Google Scholar] [CrossRef]
- Anagha, P.L.; Viji, N.V.; Devika, D.; Ramasamy, E.V. Distribution and Abundance of Microplastics in the Water Column of Vembanad Lake–A Ramsar Site in Kerala, India. Marine Pollution Bulletin 2023, 194, 115433. [Google Scholar] [CrossRef] [PubMed]
- Pastorino, P.; Anselmi, S.; Esposito, G.; Bertoli, M.; Pizzul, E.; Barceló, D.; Elia, A.C.; Dondo, A.; Prearo, M.; Renzi, M. Microplastics in Biotic and Abiotic Compartments of High-Mountain Lakes from Alps. Ecological Indicators 2023, 150, 110215. [Google Scholar] [CrossRef]
- Tanentzap, A.J.; Cottingham, S.; Fonvielle, J.; Riley, I.; Walker, L.M.; Woodman, S.G.; Kontou, D.; Pichler, C.M.; Reisner, E.; Lebreton, L. Microplastics and Anthropogenic Fibre Concentrations in Lakes Reflect Surrounding Land Use. PLoS Biol 2021, 19, e3001389. [Google Scholar] [CrossRef]
- Li, L.; Geng, S.; Wu, C.; Song, K.; Sun, F.; Visvanathan, C.; Xie, F.; Wang, Q. Microplastics Contamination in Different Trophic State Lakes along the Middle and Lower Reaches of Yangtze River Basin. Environmental Pollution 2019, 254, 112951. [Google Scholar] [CrossRef] [PubMed]
Figure 1.
The map shows the seven aquatic environments (yellow) of the present study, along with the most important cities being near to them (the grey area represents the relative size of the cities).
Figure 1.
The map shows the seven aquatic environments (yellow) of the present study, along with the most important cities being near to them (the grey area represents the relative size of the cities).
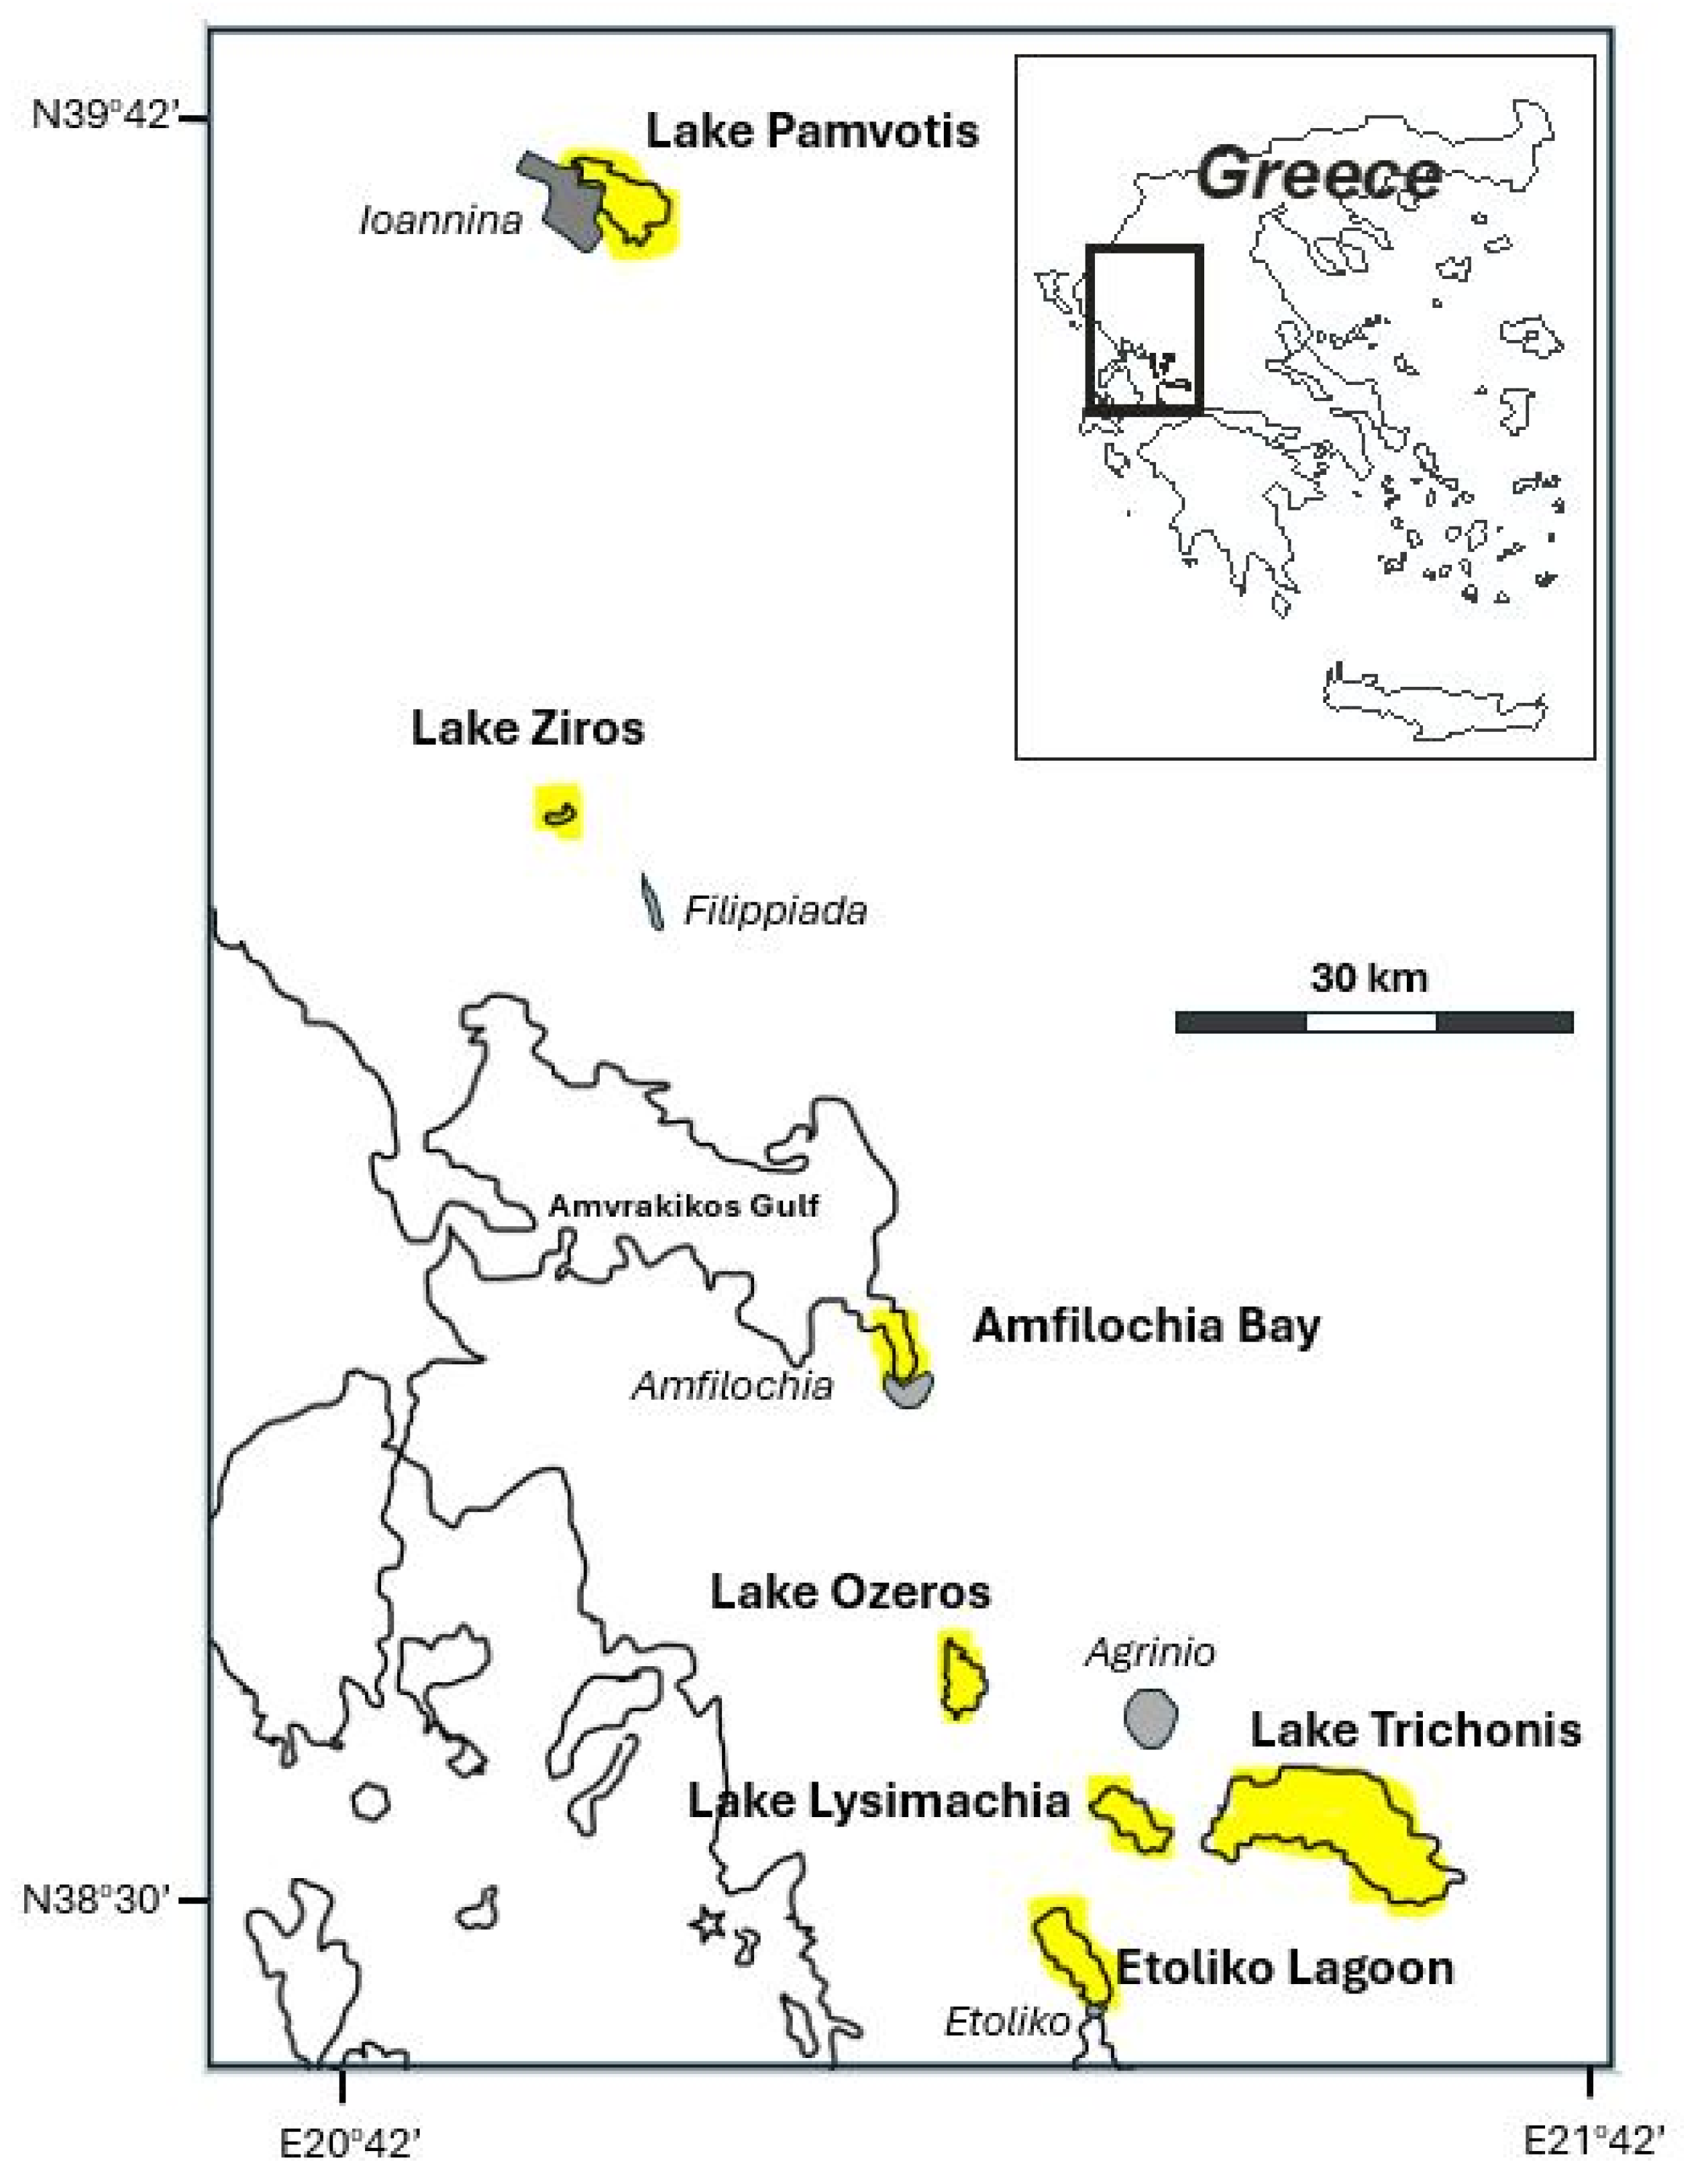
Figure 2.
Typical photos of microplastic fragments that belong to the four morphotypes. (A) ‘hard rounded’, (B) ‘hard flattened’, (C) ‘soft flattened’, (D) ‘cable like’.
Figure 2.
Typical photos of microplastic fragments that belong to the four morphotypes. (A) ‘hard rounded’, (B) ‘hard flattened’, (C) ‘soft flattened’, (D) ‘cable like’.
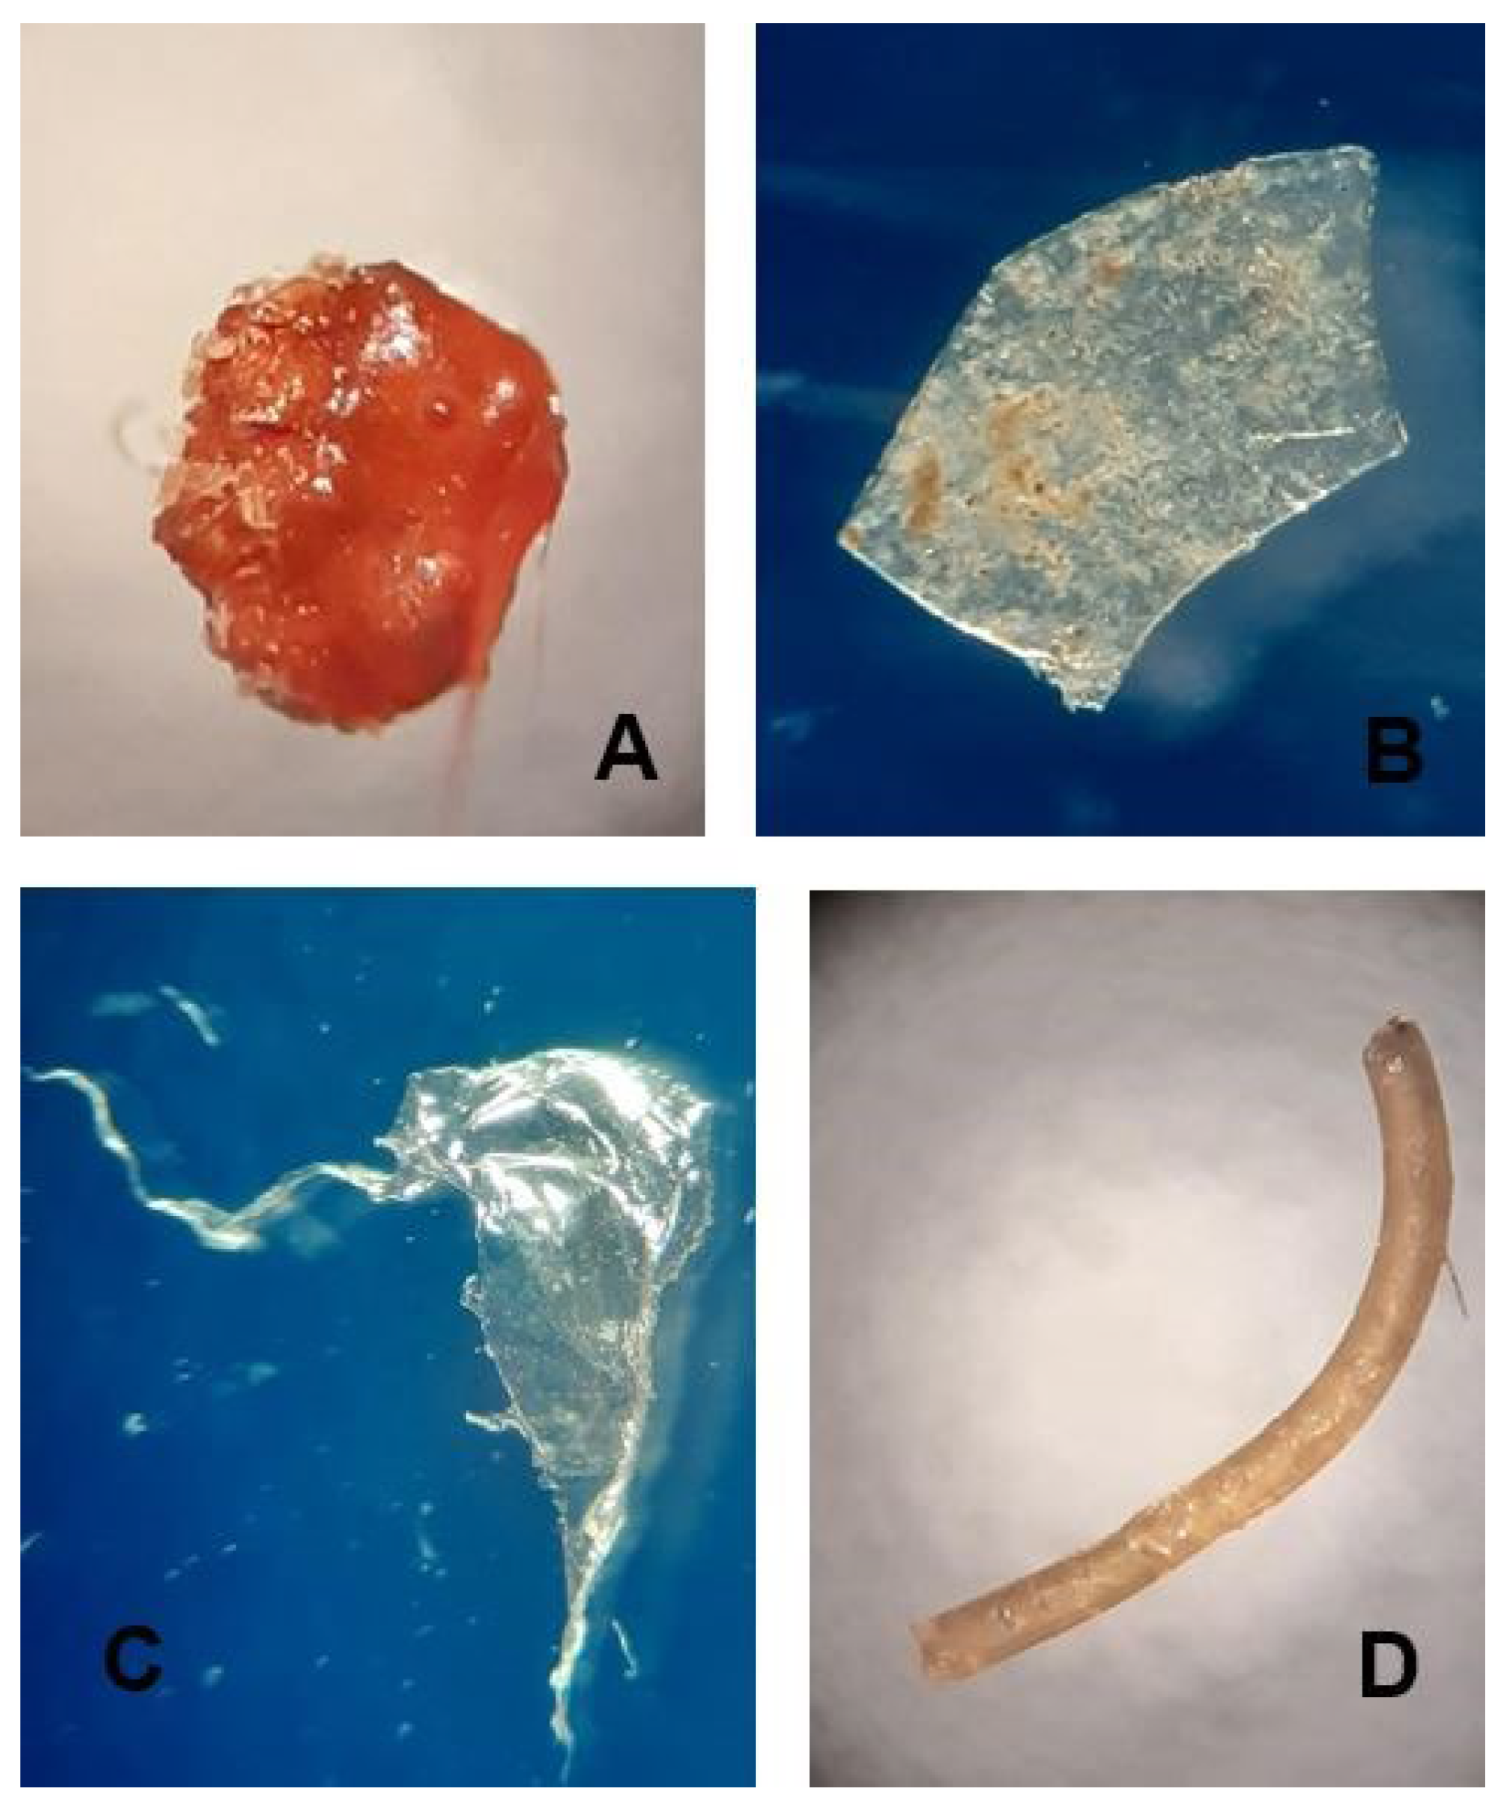
Figure 3.
The average abundance (n/m3) ± Standard Error (as vertical lines) of the microplastic fibers and fragments recovered from the horizontal (up) and vertical (down) samples taken in the seven aquatic ecosystems.
Figure 3.
The average abundance (n/m3) ± Standard Error (as vertical lines) of the microplastic fibers and fragments recovered from the horizontal (up) and vertical (down) samples taken in the seven aquatic ecosystems.
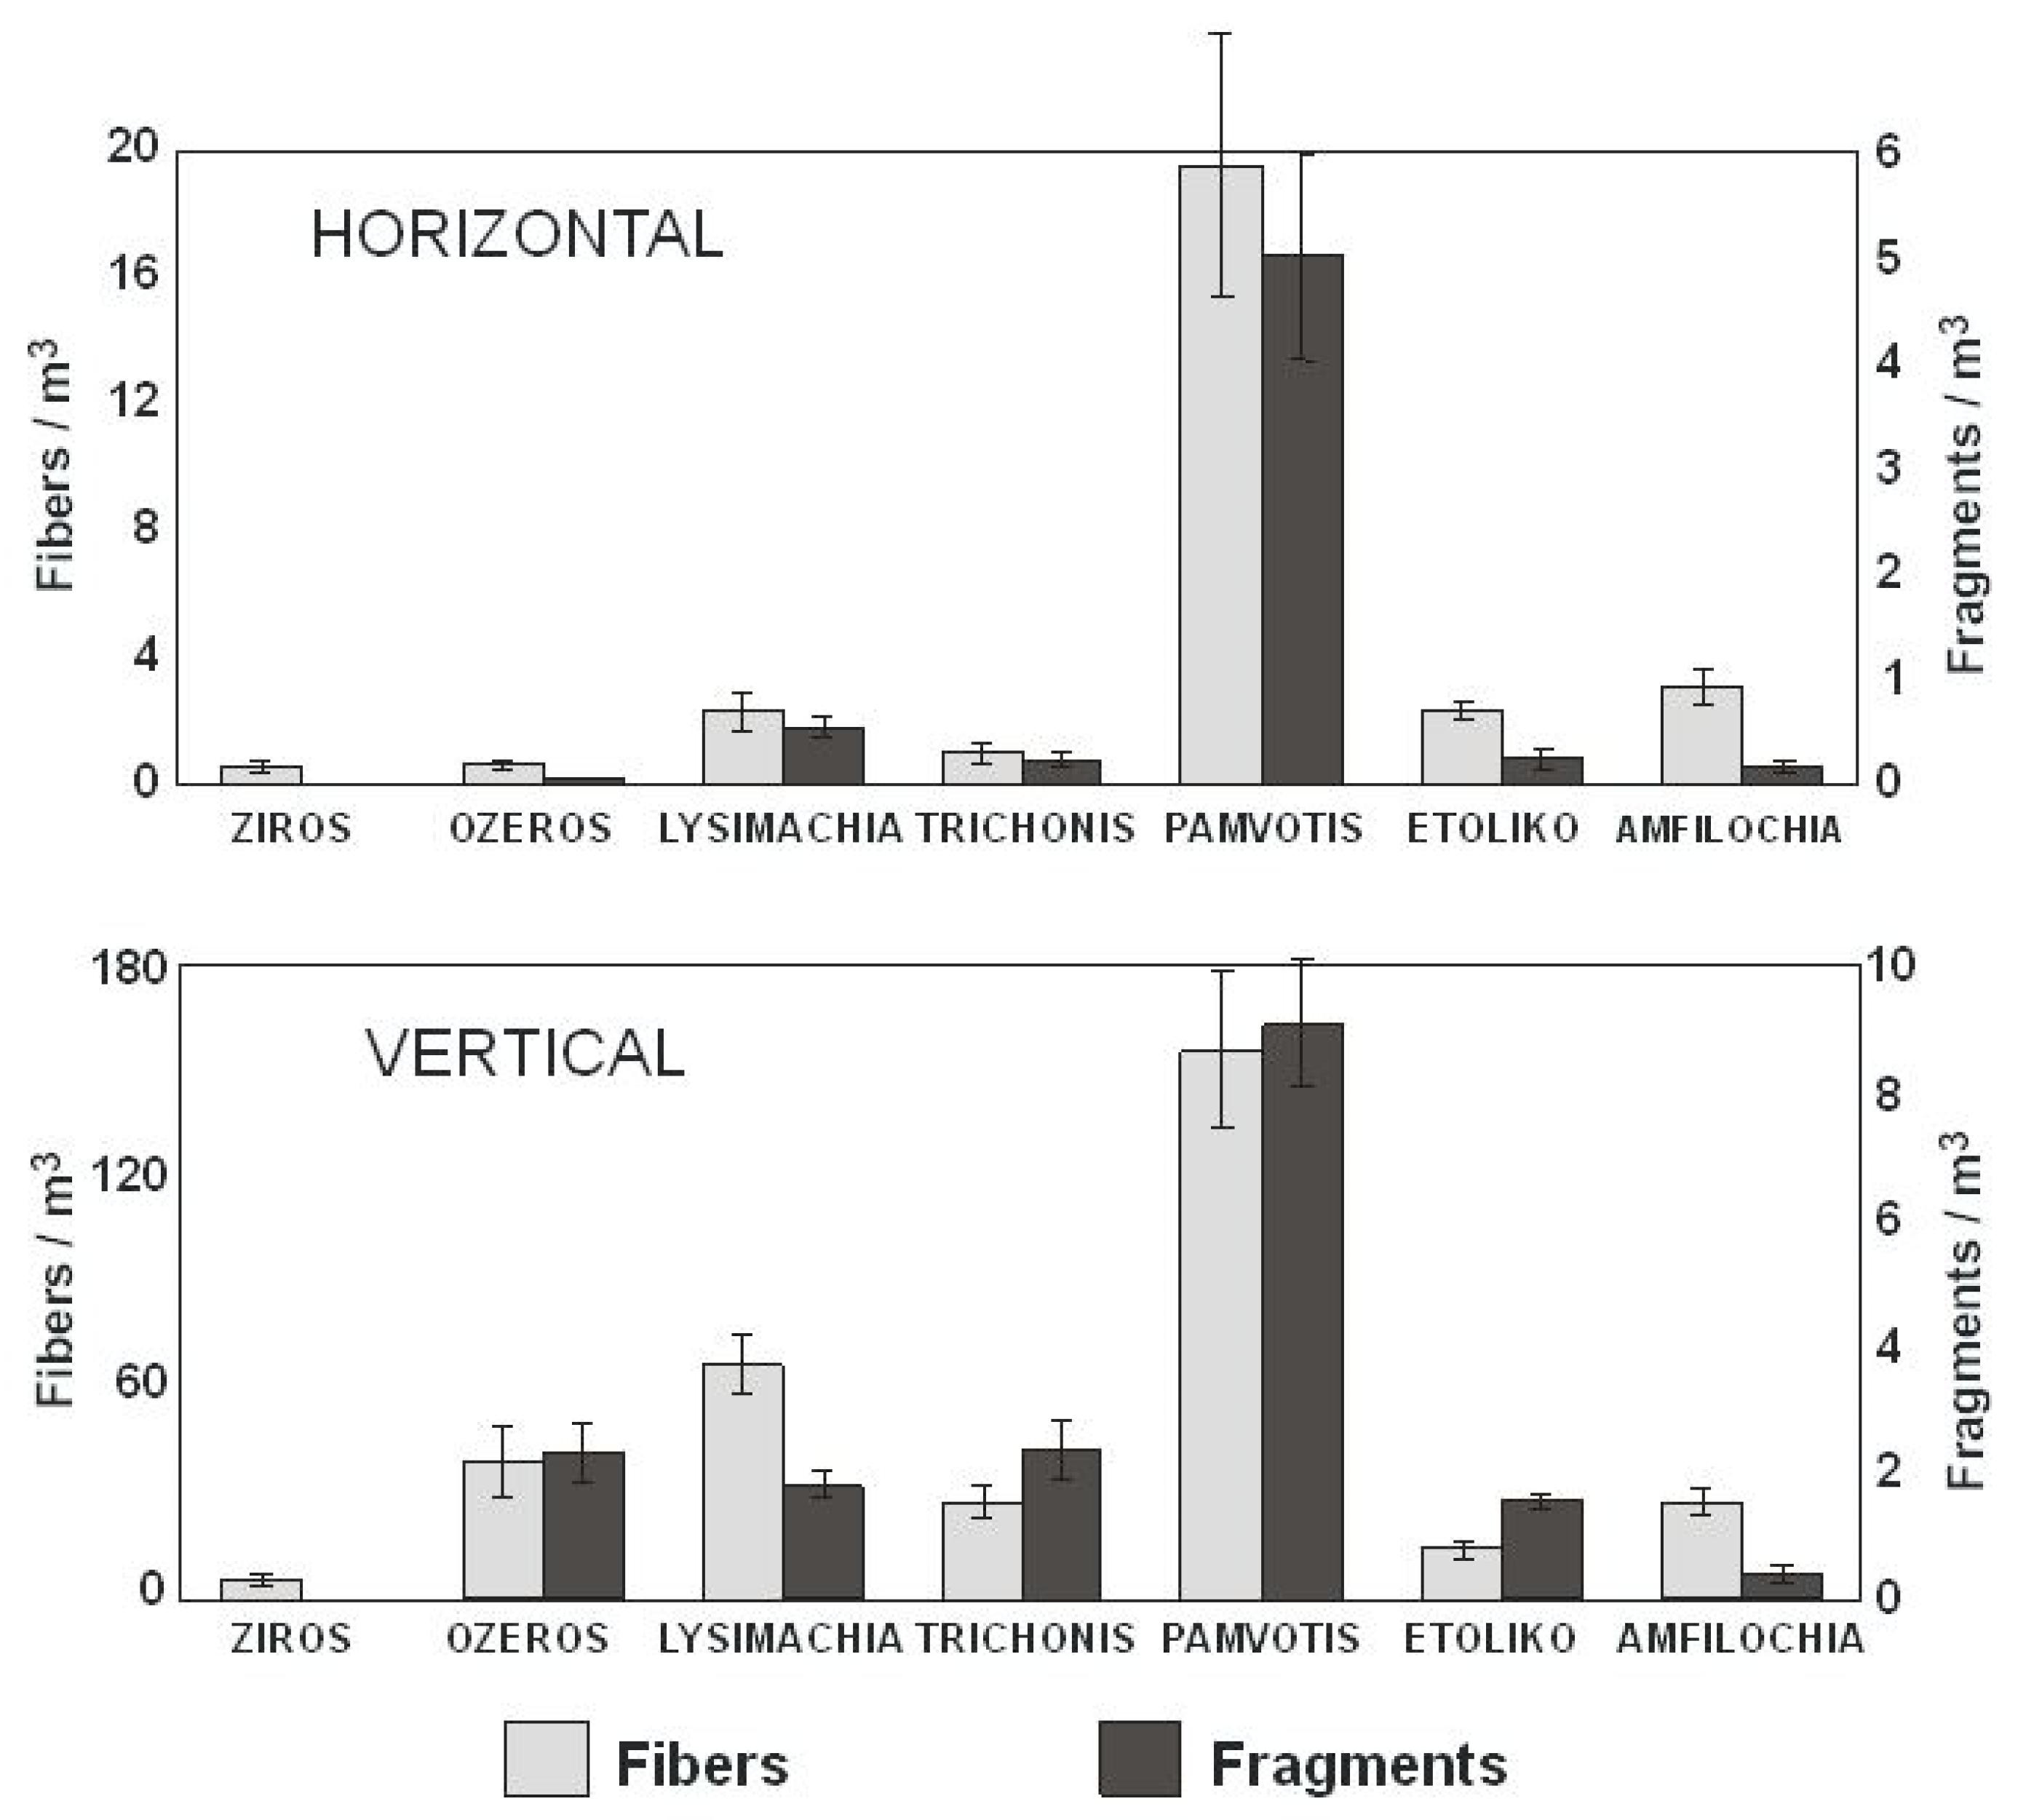
Figure 4.
The percentage (%) distribution of the nine colors among the fibers and fragments recovered from the horizontal and vertical samples in each of the seven aquatic ecosystems.
Figure 4.
The percentage (%) distribution of the nine colors among the fibers and fragments recovered from the horizontal and vertical samples in each of the seven aquatic ecosystems.
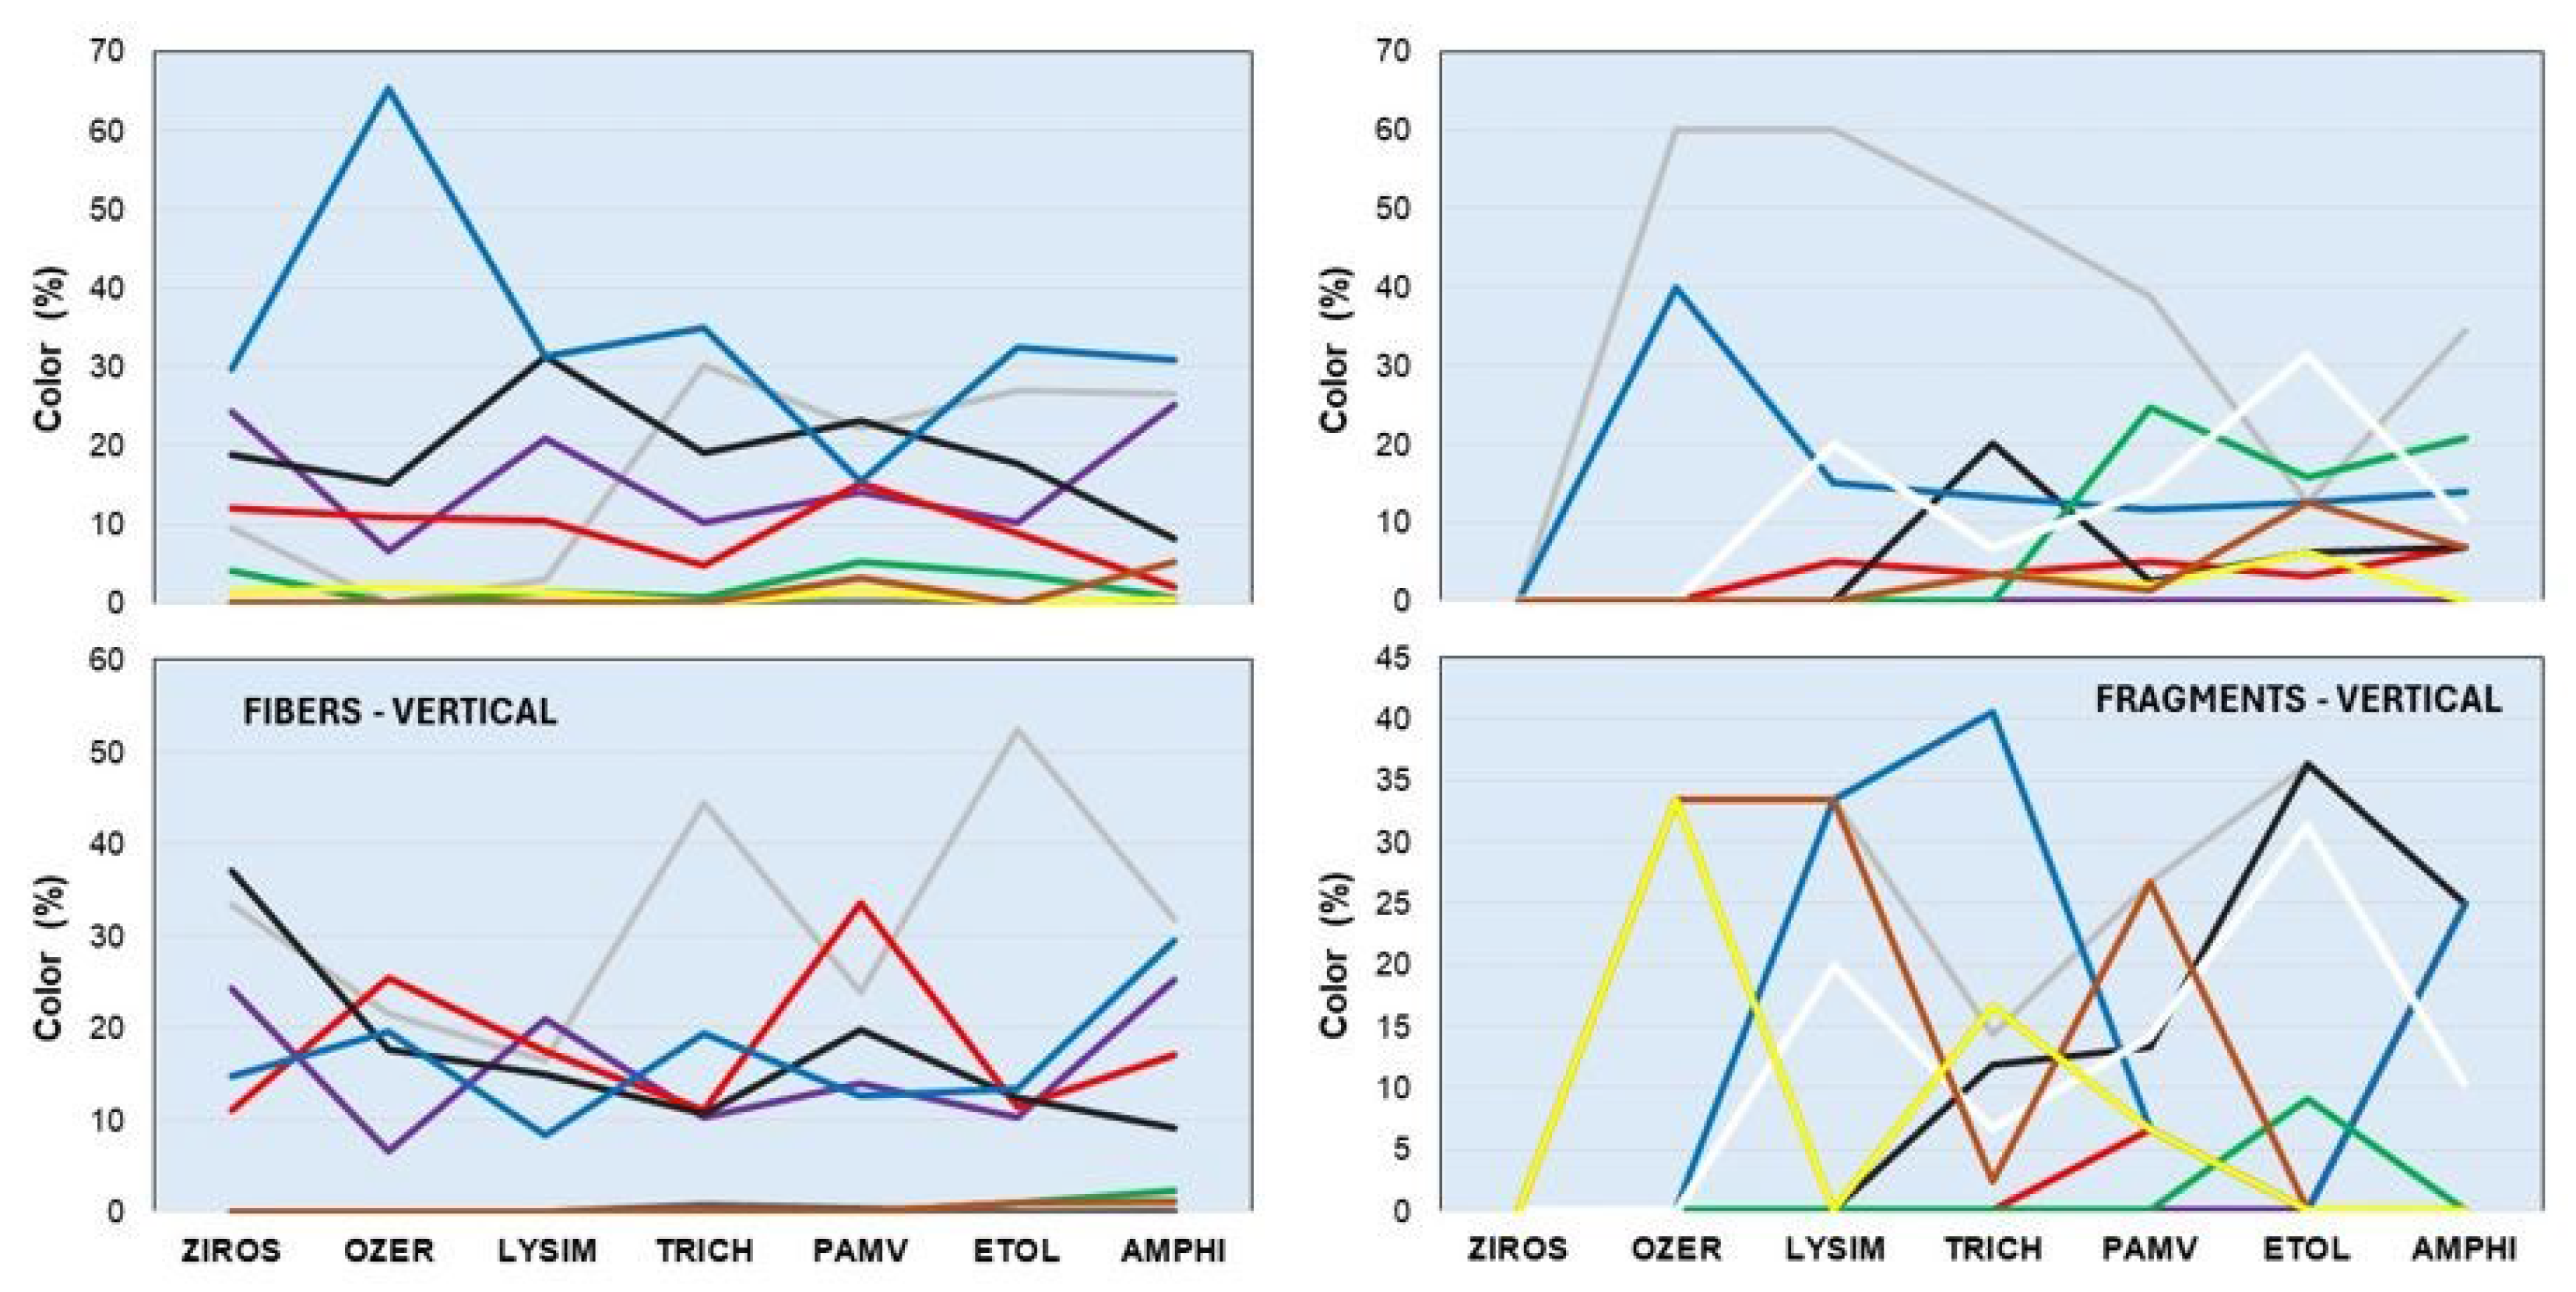
Figure 5.
Length size (mm) distribution of the fibers recovered from the horizontal (up) and vertical (down) samples taken in the seven aquatic ecosystems.
Figure 5.
Length size (mm) distribution of the fibers recovered from the horizontal (up) and vertical (down) samples taken in the seven aquatic ecosystems.
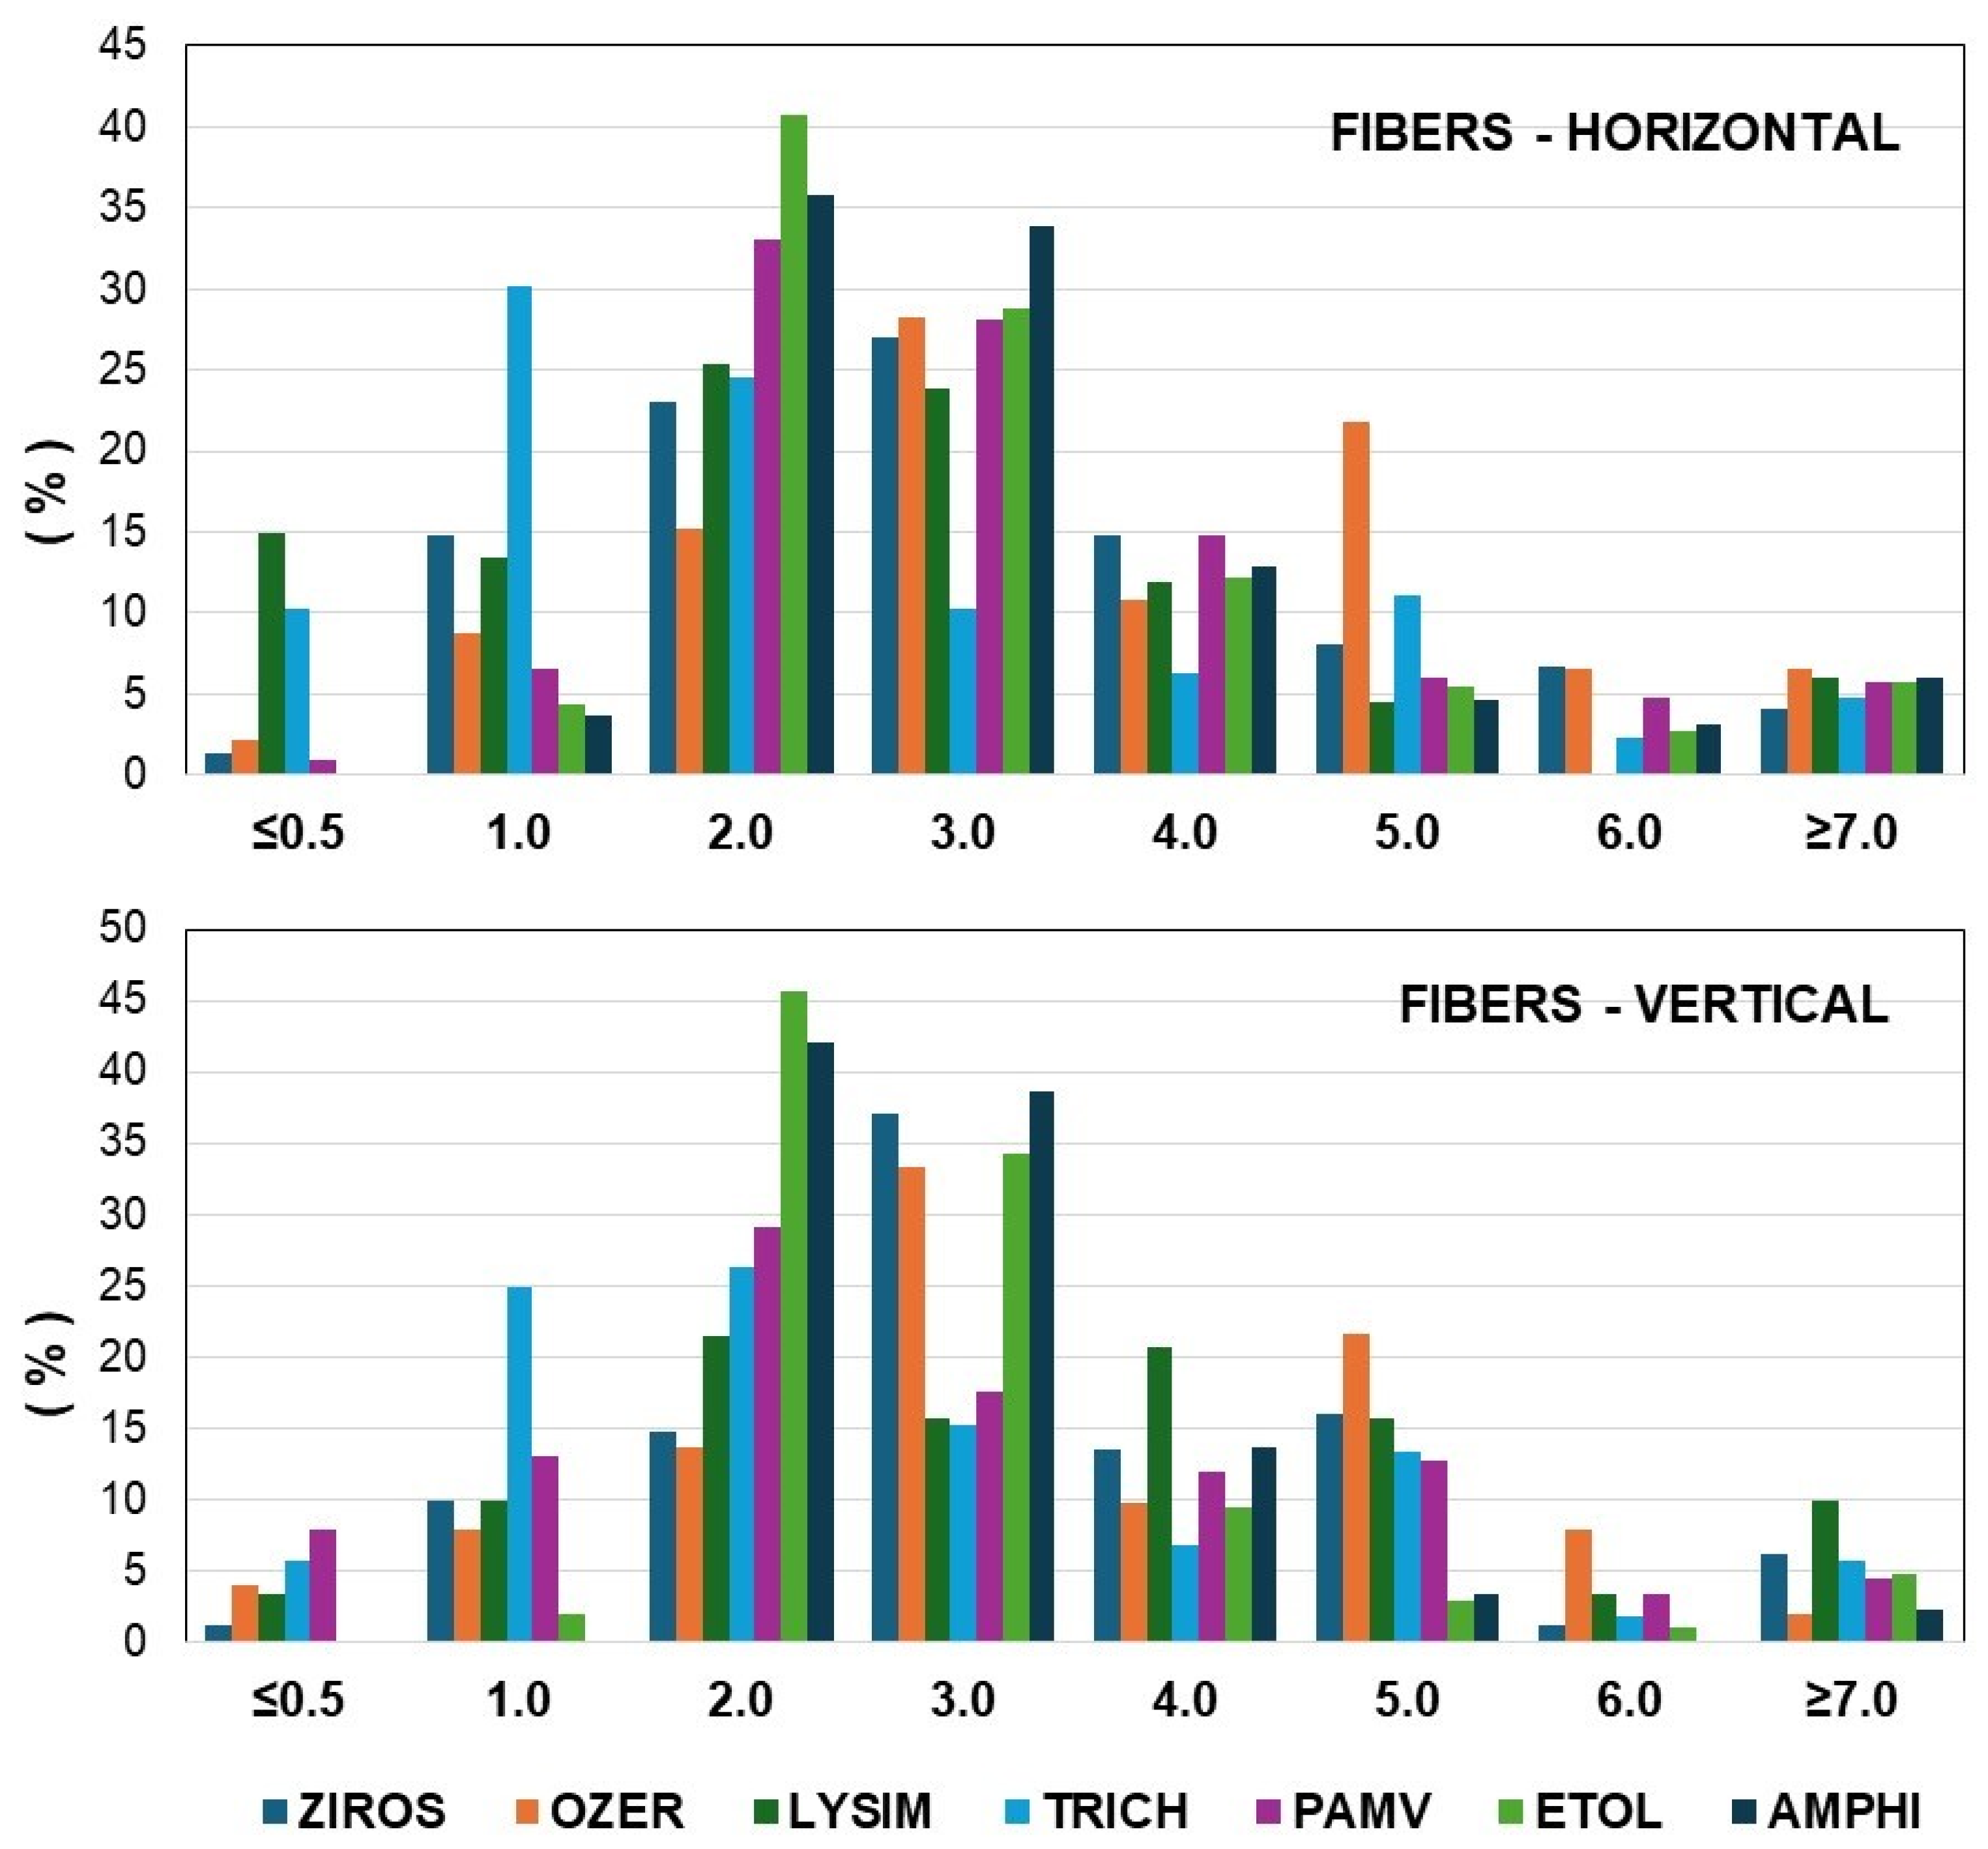
Figure 6.
Size classes distribution (%) of the area (in mm2) covered by the microplastic fragments found in the horizontal and vertical samples taken overall in the seven aquatic ecosystems.
Figure 6.
Size classes distribution (%) of the area (in mm2) covered by the microplastic fragments found in the horizontal and vertical samples taken overall in the seven aquatic ecosystems.
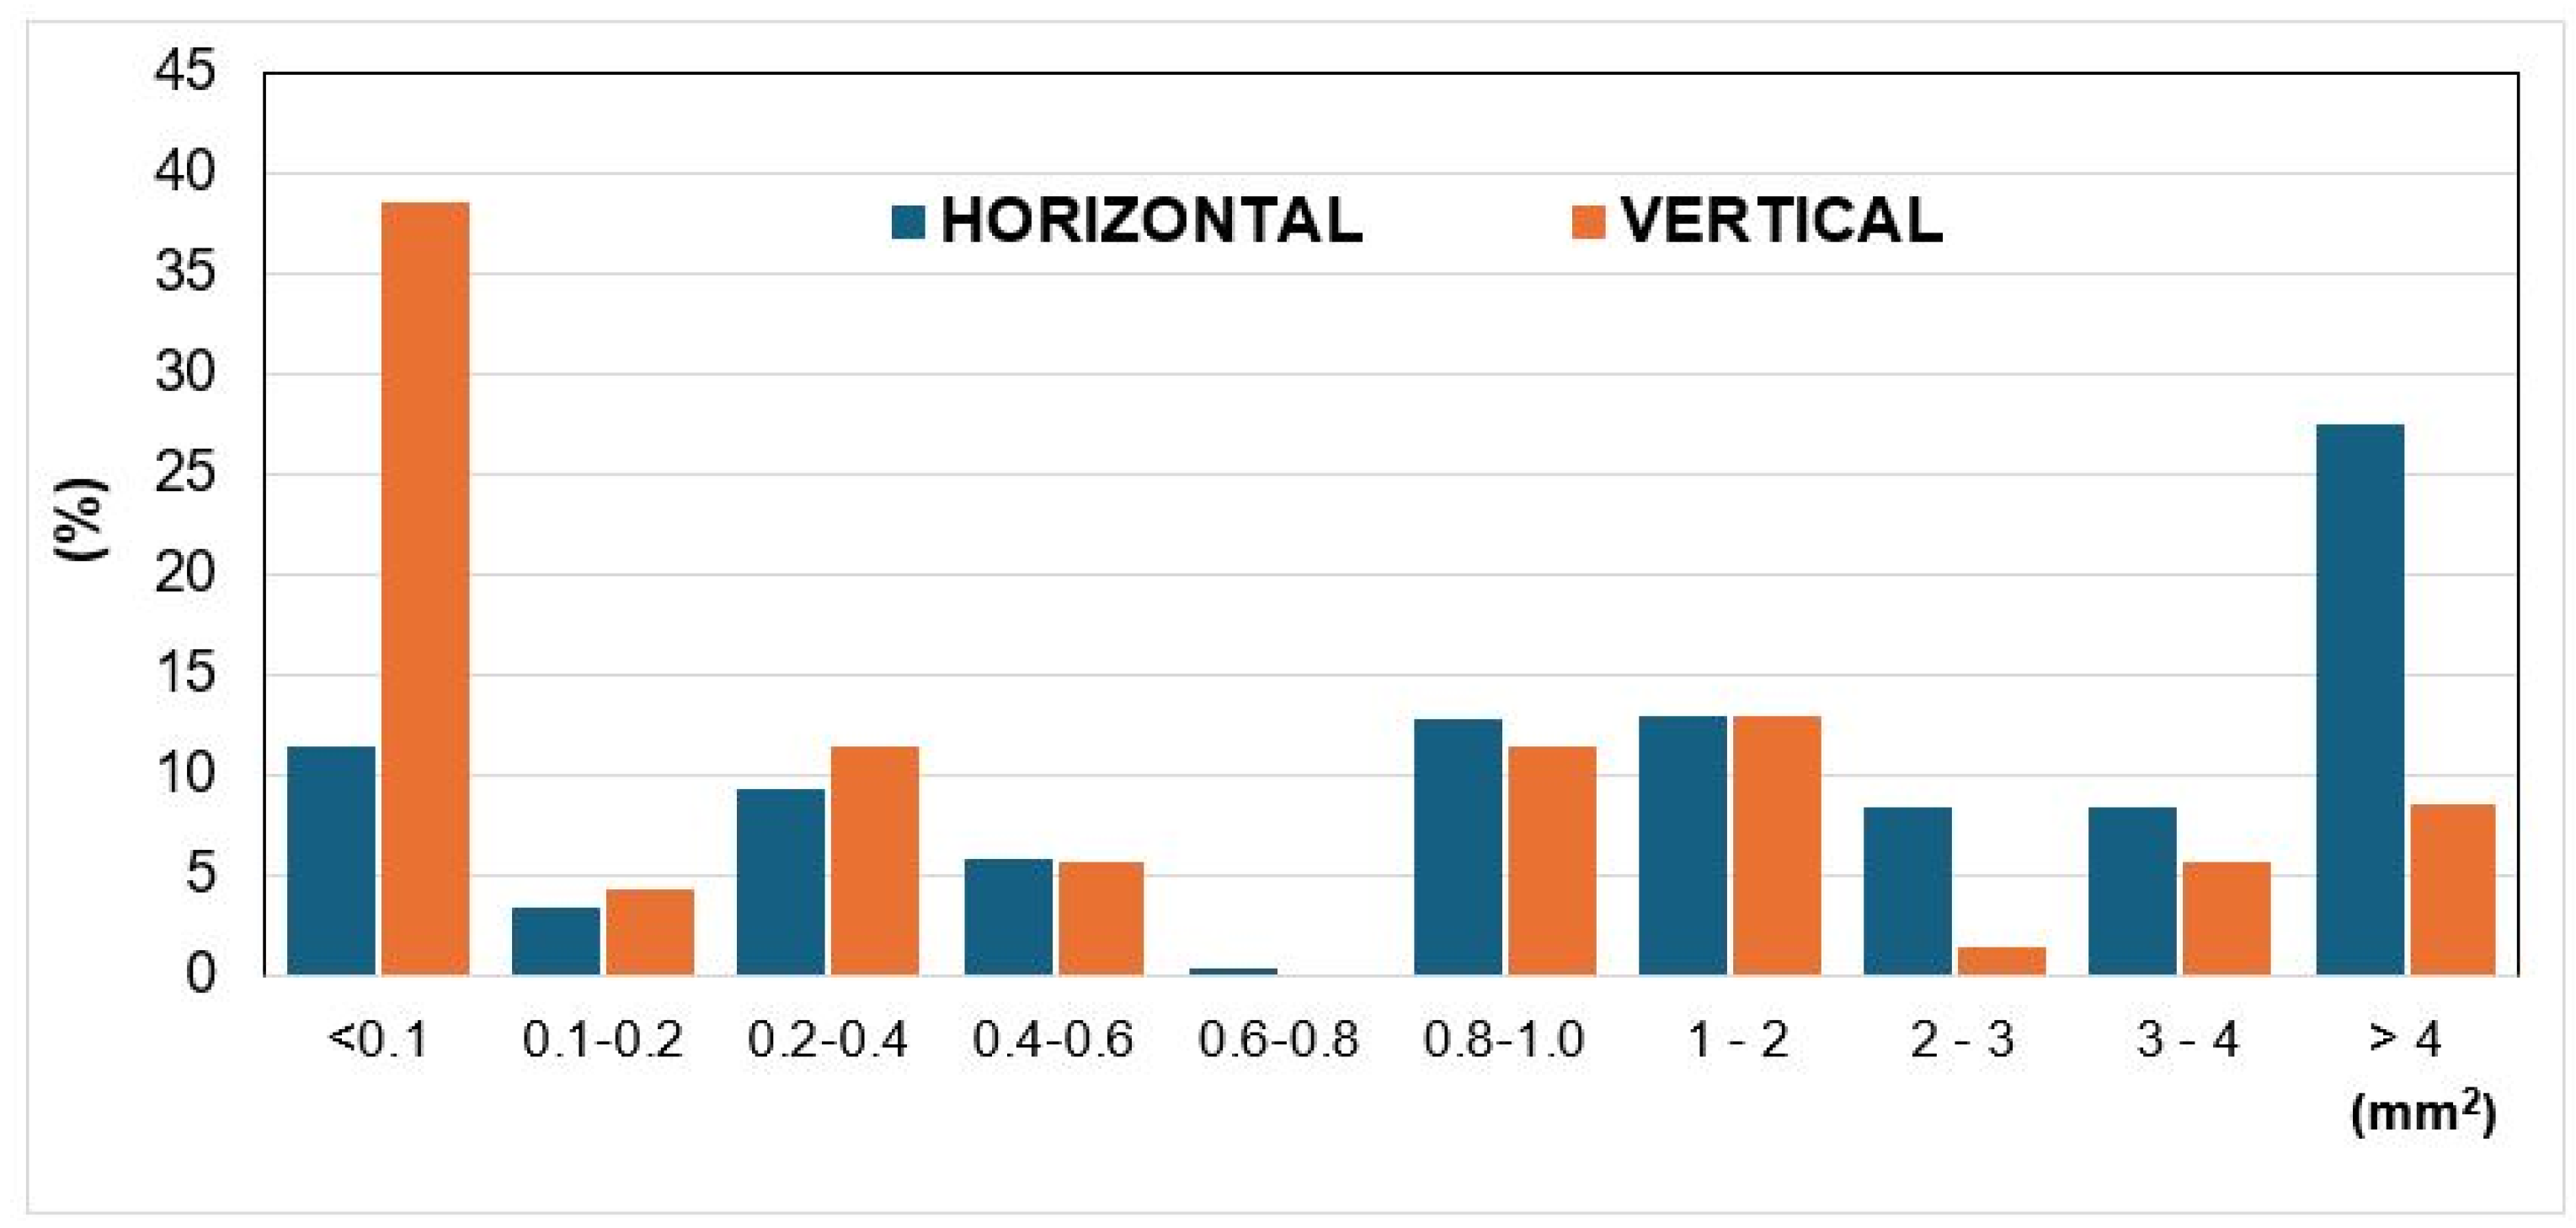
Figure 7.
Proportions (%) of the different morphotypes of microplastic fragments found in the horizontal (up), and vertical (down) samples from each of the seven aquatic ecosystems.
Figure 7.
Proportions (%) of the different morphotypes of microplastic fragments found in the horizontal (up), and vertical (down) samples from each of the seven aquatic ecosystems.
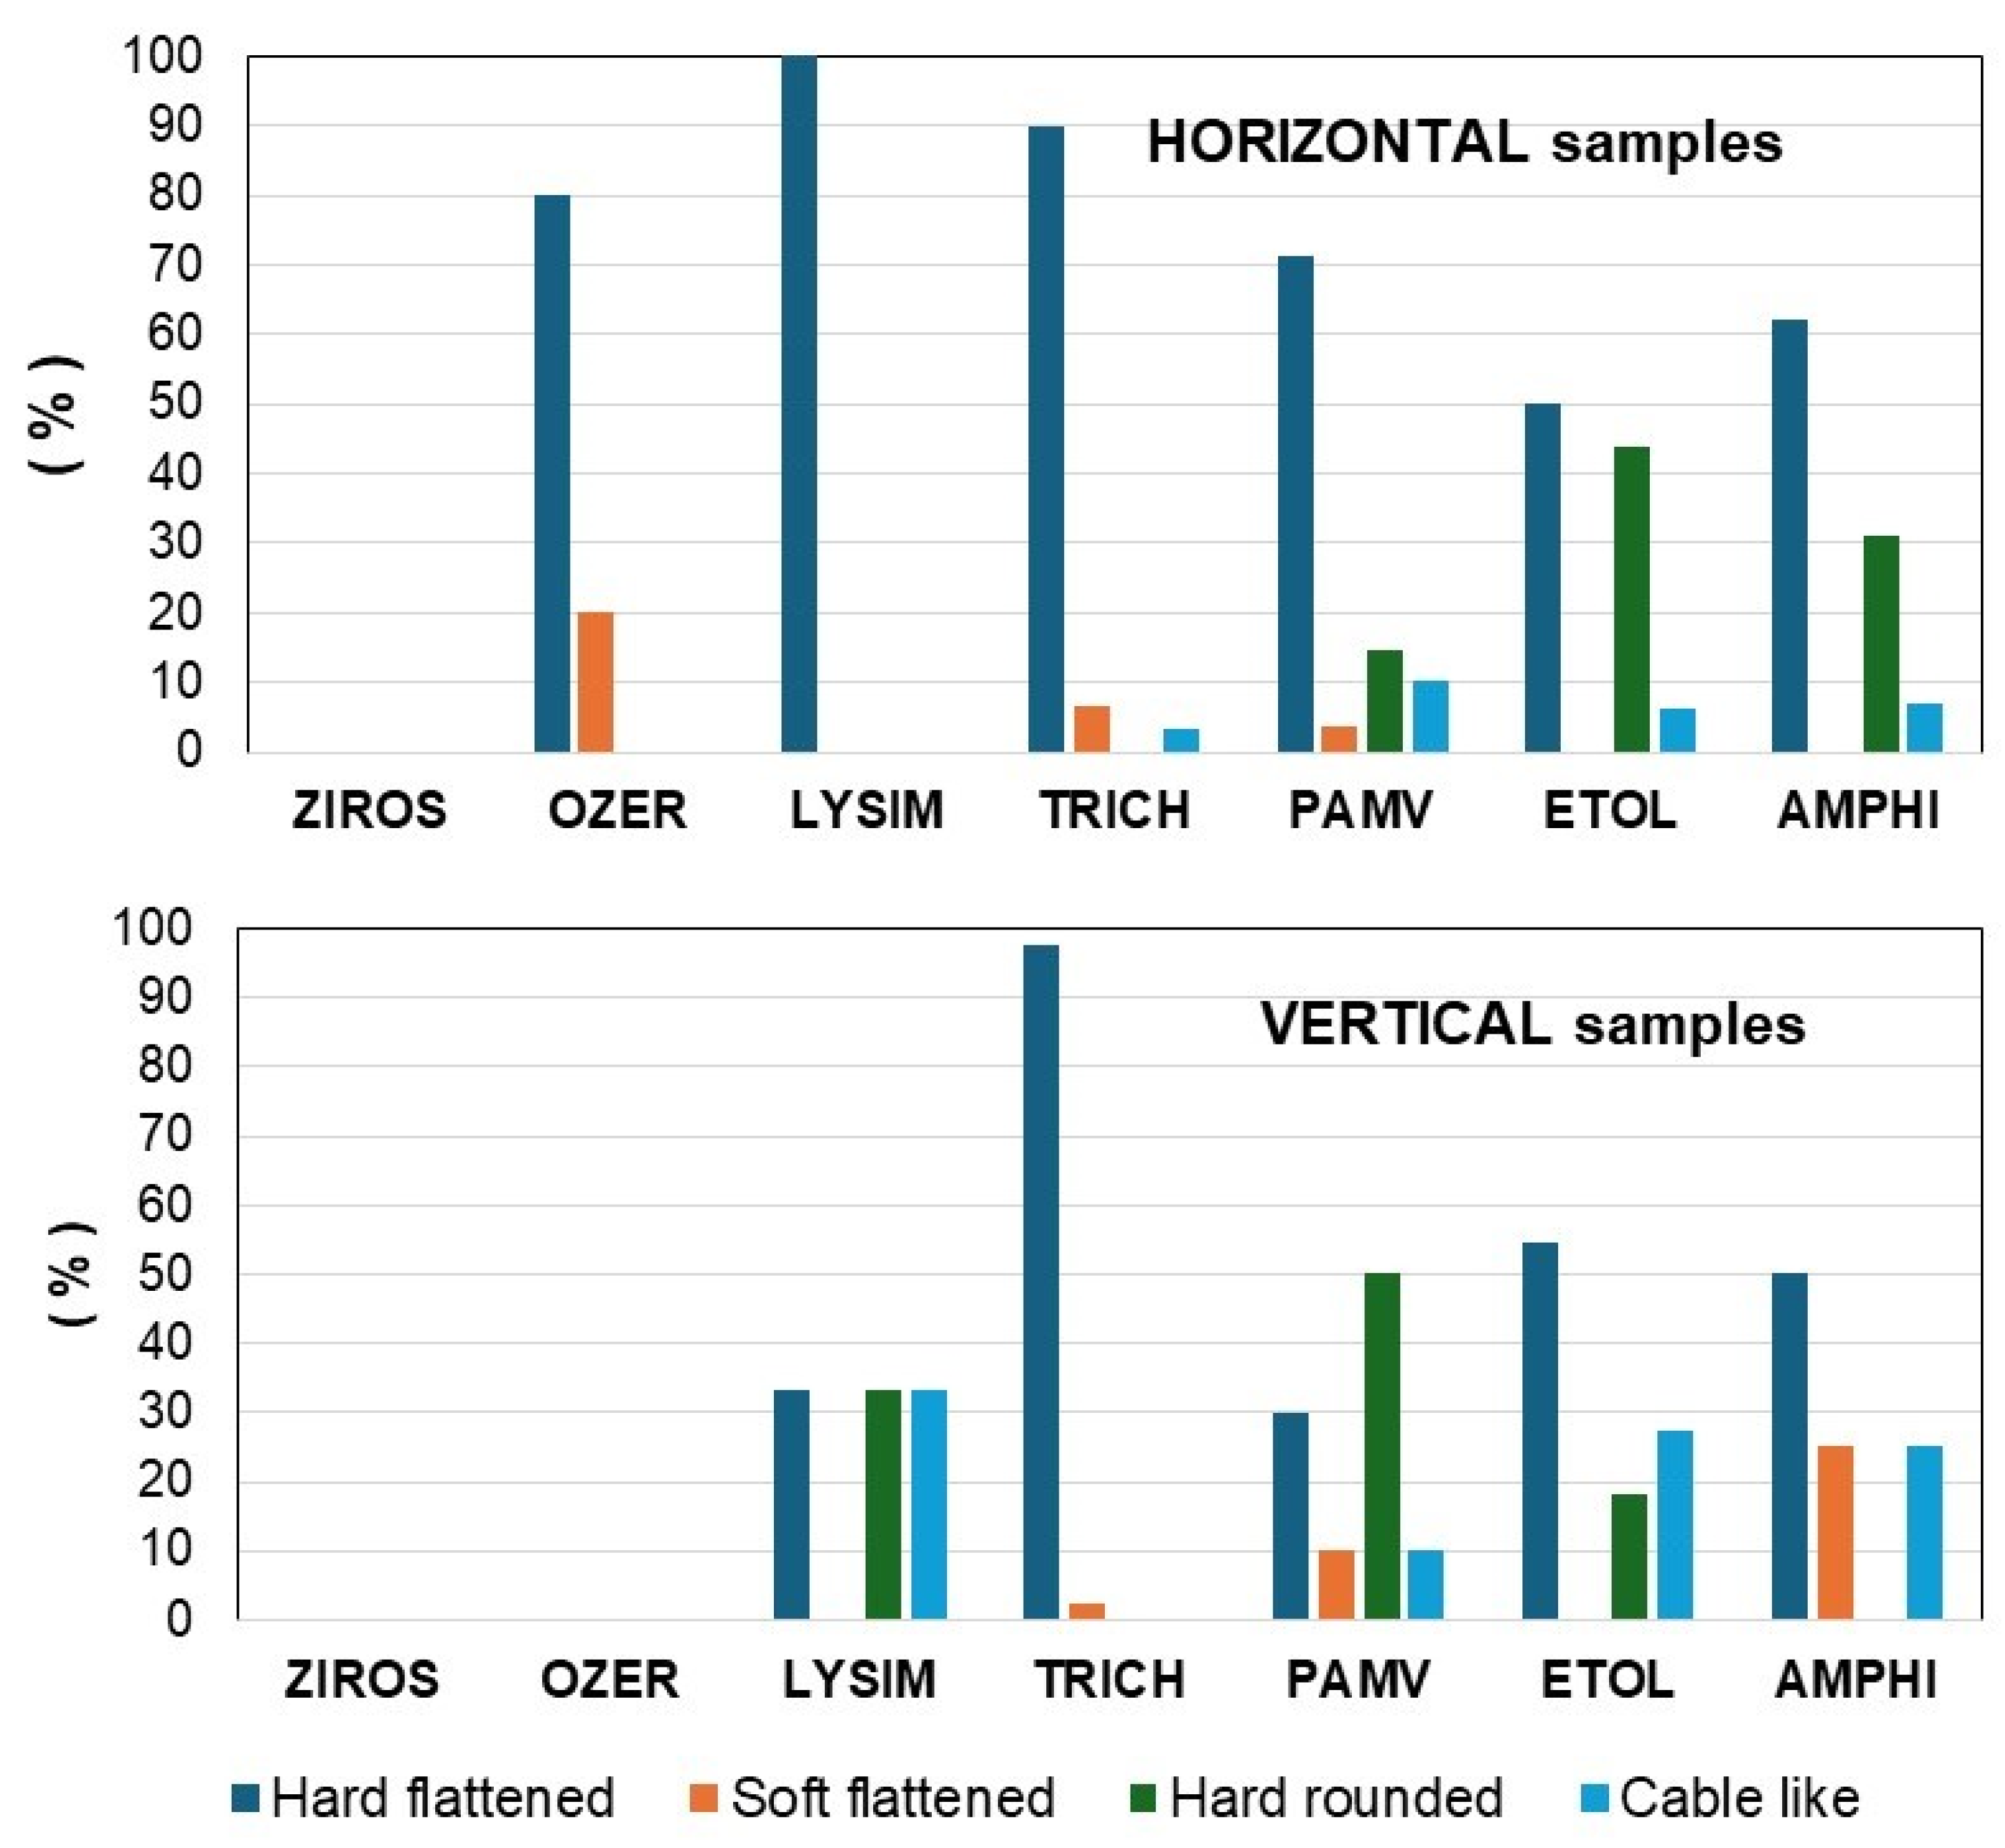

Table 1.
Morphometric and socioecological characteristics of the seven aquatic ecosystems.
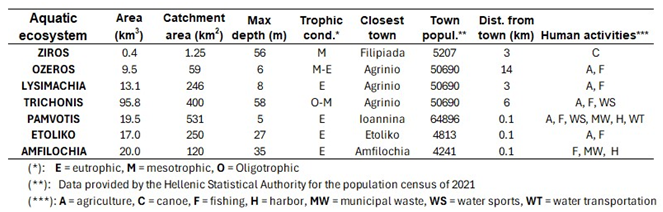
Table 2.
The results of the Pearson correlation (r2) values between the abundance of the microplastics (fibers and fragments) in the horizontal and vertical samples with several parameters.
Table 2.
The results of the Pearson correlation (r2) values between the abundance of the microplastics (fibers and fragments) in the horizontal and vertical samples with several parameters.
Disclaimer/Publisher’s Note: The statements, opinions and data contained in all publications are solely those of the individual author(s) and contributor(s) and not of MDPI and/or the editor(s). MDPI and/or the editor(s) disclaim responsibility for any injury to people or property resulting from any ideas, methods, instructions or products referred to in the content. |
© 2025 by the authors. Licensee MDPI, Basel, Switzerland. This article is an open access article distributed under the terms and conditions of the Creative Commons Attribution (CC BY) license (http://creativecommons.org/licenses/by/4.0/).
Copyright: This open access article is published under a Creative Commons CC BY 4.0 license, which permit the free download, distribution, and reuse, provided that the author and preprint are cited in any reuse.


