
Submitted:
28 October 2025
Posted:
28 October 2025
You are already at the latest version
Abstract
This study proposes an unsupervised anomaly detection method to identify the performance degradation in grid-connected photovoltaic (PV) inverters under multitask operation. Principal Component Analysis (PCA) and One-Class Support Vector Machine (OCSVM) were integrated to build a detection model using routine operational data. The key features include DC input, AC output, AC/DC ratio, and AC power variation, which are reduced to two principal components for anomaly boundary construction. The inverters were flagged as degraded if the AC/DC ratio was <0.96, the power fluctuation exceeded 20%, or the data fell outside the OCSVM-defined boundary. Compared with the Isolation Forest, the proposed method showed higher sensitivity. When applied to a 120 MW PV plant in Taiwan with 1,292 inverters, including 55 PV-STATCOM units at night, the framework detected degradation in 5.4% of them. These results support their use in intelligent monitoring and predictive maintenance.
Keywords:
photovoltaic inverter
; anomaly detection
; unsupervised learning
; PCA
; OCSVM
1. Introduction
The performance of grid-connected photovoltaic (PV) inverters is influenced by a variety of factors, including the PV module characteristics, installation environment, multitask operational profiles (mission profiles), and maintenance practices. These factors collectively complicate the accurate inverter lifetime assessment. Inverter failures can lead to sudden power generation losses and prolonged system downtimes. However, such failures typically do not occur instantaneously but rather evolve from gradual performance degradation due to prolonged exposure to harsh environmental conditions and high operational stress, which is often difficult to detect before it leads to a complete loss of power output.
In large-scale photovoltaic power plants, the number of inverters can reach several thousands, making it a significant challenge to ensure stable and reliable operation. Maintenance costs are substantial, and the root causes of individual inverter failures are often difficult to accurately identify. To address this issue, this study proposes an approach that assesses inverter degradation by monitoring the variation in the AC/DC power ratio and rate of change in the AC output power. Inverters with poor conversion efficiency are unable to maintain stable output, which serves as an effective indicator of performance deterioration.
Bouguerra et al. analyzed the performance indicators of photovoltaic (PV) systems and inverters, revealing that variations in the tilt and azimuth angles of PV modules have a significant impact on the inverter lifespan [1]. These findings suggest that certain angular configurations can help extend the operational life of inverters, whereas module degradation can accelerate inverter ageing. However, this study did not investigate the feasibility of restoring the system reliability by replacing degraded modules. Sangwongwanich et al. incorporated photovoltaic (PV) module degradation into the reliability analysis of inverters, [2] showing that when the annual degradation rate of PV modules reaches 1%, the estimated inverter lifespan may deviate by as much as 54%. These studies highlight the significant impact of PV module aging on the inverter reliability. However, detailed research on inverter performance during the degradation process and the development of early warning mechanisms remains lacking. Spertino et al. presented a large-scale case study covering ten photovoltaic (PV) power plants with diverse inverter configurations, including centralized, string, and multistring systems. The analysis indicates that preventive maintenance can maintain system availability at or above 90% [3]. However, this approach incurs significant costs. For instance, components are often replaced during the warranty period even if no failures have occurred. Wang et al. proposed the use of online condition monitoring to track the status of critical components noninvasively. For example, surface temperature measurements of MOSFETs and secondary ripple signals on the DC-side capacitor are utilized as precursors for potential failure [4]. However, this method did not consider the influence of environmental stress factors.
In terms of the reactive power support role, the IEEE 1547-2018 standard requires distributed energy resources (DER) to provide voltage regulation capability, including the volt–var control mode. In this mode, inverters must adjust their reactive power output in response to voltage variations [5] which may increase the thermal stress on the inverter components and subsequently affect their lifetimes. Moore et al. presents a five-year operational data analysis of a large utility-scale photovoltaic (PV) power plant [6]. The results indicate that approximately 37% of unplanned maintenance events are related to the failure of power electronic components within inverters, highlighting that these components are critical bottlenecks for system stability. However, the study did not further explore the impact of multitask operational profiles on the thermal degradation and inverter lifetime, nor did it incorporate any time-dependent reliability analysis. Vinson et al. reported that accelerated life testing (ALT) of inverters is typically conducted in conjunction with physics-of-failure (PoF) modeling to validate degradation mechanisms [7]. This study proposes a lifetime estimation model that considers the electromigration caused by power cycling and mechanical stress on aluminum wire bonds. Although PoF-based approaches offer more accurate insights into physical failure processes, they often involve high costs and require extensive statistical datasets and dedicated laboratory-testing platforms.
Sangwongwanich et al. employed a Monte Carlo Simulation (MCS) to perform reliability analysis of inverters equipped with fault-tolerant mechanisms [8]. This method effectively predicts failure risks arising from system aging and component degradation. However, a large number of simulations are required to ensure statistical convergence, resulting in high computational overhead. Moreover, its predictive accuracy is highly dependent on the input parameters and lacks physical interpretability at the component level. Therefore, MCS is more suitable for system-level reliability assessments and is recommended to be integrated with physics-of-failure (PoF) models or empirical data to improve accuracy and credibility. Specifically, although accelerated testing offers advantages in terms of time efficiency, it remains a costly and invasive analytical approach that depends heavily on laboratory conditions and component-level modeling. Consequently, their application is mostly limited to reliability-focused studies.
To address these limitations, this study proposes a noninvasive, scalable, and data-driven anomaly detection approach based on unsupervised machine learning. This method targets the performance degradation identification in grid-connected PV inverters operating under multitask conditions. It offers a practical and intelligent diagnostic solution that is suitable for modern PV power systems, enabling effective condition monitoring and predictive maintenance.
The main contributions of this study can be summarized as follows:
- We propose a practical anomaly detection framework for grid-connected PV inverters operating under multitask conditions, including nighttime PV-STATCOM operation, which is rarely addressed in prior studies.
- We integrate physically interpretable indicators (AC/DC power ratio and AC power variation) with an OCSVM boundary in a tri-layer decision scheme, enabling both accurate anomaly detection and engineering interpretability.
- We demonstrate field deployment in a 120 MW utility-scale PV plant and introduce an anomaly-based grouping mechanism that prioritizes inverters for maintenance dispatch, providing actionable decision support for O&M teams.
2. System Architecture and Data Analysis Workflow
This study utilized a 120 MW grid-connected photovoltaic (PV) power plant as the field case study. The plant commenced commercial operation in May 2024 and was equipped with 1,292 identical grid-connected inverters, each rated at 100 kW with an output voltage of 380 V. As illustrated in Figure 1, the inverter output voltage is first stepped up from 380 V to 22.8 kV, and subsequently to 161 kV at the main substation before being integrated into the 161 kV extra-high-voltage (EHV) transmission system. The operational data used in this study were obtained from previous research, while the distribution line parameters of the practical site were adopted from Ref. [9].
To achieve real-time monitoring and intelligent diagnostics, the PV power plant is equipped with multiple Supervisory Control and Data Acquisition (SCADA) systems and communication interfaces, forming a hierarchical data acquisition architecture that enables continuous tracking of the overall operational status [10].
As illustrated in Figure 2, the complete data acquisition and analysis framework covers the entire process from front-end data collection to back-end machine learning modeling. The functions of each subsystem are briefly described as follows.
- Data Acquisition Layer
This layer is responsible for collecting raw operational and environmental data from the photovoltaic (PV) power plants. On the low-voltage AC side, multifunction power meters are installed to measure three-phase voltage, current, output power, frequency, and alarm messages at 5-minute intervals. The recorded data were transmitted to a centralized server for storage. In addition, environmental sensors were deployed across the site to gather external condition data including solar irradiance, ambient temperature, module temperature, and humidity. These measurements served as critical inputs for subsequent performance assessments and anomaly detection.
- Control & Communication Layer
All inverters were connected to a centralized controller via bidirectional communication, enabling both warning and alert functionalities. Time series records of the DC input and AC output data were collected from each inverter to support continuous performance monitoring.
- Data Preprocessing Layer
During analysis, the collected data were first subjected to cleaning, outlier removal, and categorical classification. Specific warning types were labeled accordingly. Field observations revealed that even under identical environmental conditions, certain inverters may exhibit reduced power generation performance or experience early failure owing to differences in stress distribution.
- Feature Extraction and Behavior Analysis
Based on the field maintenance records and historical data, the system extracts the full-time output-to-input power ratio for the selected inverters. This enables the exploration of inverter behavior patterns and their correlation with potential faults over time.
- Machine Learning Analysis Layer
Although PCA and OCSVM have been widely applied in other domains, their integration for multitask inverter operation under nighttime PV-STATCOM mode remains insufficiently explored. This study establishes an anomaly boundary using the OCSVM model to identify and classify inverter-derating behavior. The analysis results provide a basis for predictive maintenance, enabling the early detection of inverter performance degradation and ensuring the overall power-generation efficiency of the PV plant.
3. Dimensionality Reduction and Anomaly Detection Methods
In this study, PCA was integrated with an OCSVM anomaly detection method to construct an anomaly identification model for photovoltaic (PV) inverters. The anomaly detection procedure consists of the following steps.
3.1. Feature Selection and Data Preprocessing
This study utilized data collected during midday periods for analysis under the assumption that solar irradiance remains stable under consistent conditions, and can therefore serve as a reliable reference for estimating the input power. For inverters operating in PV-STATCOM mode at night, the DC power input and AC power output were selected as the primary evaluation indicators. In addition, two derived features, the AC/DC power ratio and AC power variation rate (AC ratio change), were computed to support anomaly detection, thereby improving the data consistency and model robustness. Prior to model training, all numerical features were normalized.
3.2. Dimensionality Reduction
To reduce the complexity arising from simultaneously processing multiple correlated features and enhancing the visualization performance of the anomaly detection model, this study adopted principal component analysis (PCA) to transform the feature space. After dimensionality reduction, two principal components (PC1 and PC2) were retained as core criteria for anomaly identification. The first principal component PC1 can be interpreted as a composite vector indicator representing the overall level of input and output powers. It is constructed with equal weights from the DC power input and AC power output. The mathematical formulation of PC1 is as follows:
3.2.1. Principle of the PC1-Based Detection Indicator
Converting Two Sets of Data into a Feature Vector.
The mean values of the DC and AC powers in a dataset containing n samples are defined as follows:
where
mean value of the DC dataset
sample in the DC dataset
mean value of the AC dataset
sample in the AC dataset
The population standard deviations of the DC and AC datasets for a sample size of n were as follows:
where
, The and represent the original data point in DC.
and AC datasets, respectively.
The standard deviation of the DC dataset
The population standard deviation of the AC dataset
Equal weights are assigned to simplify model interpretability and are subsequently normalized to yield a unit vector.
The first principal component (PC1) was obtained by computing the dot product of the feature vector and unit vector . After standardizing both the features, the final expression of PC1 was calculated as follows:
Both features were standardized before projection to ensure comparability and prevent scale bias, which is essential when combining features with different units or magnitudes. This facilitates downstream tasks such as anomaly scoring and clustering in a lower-dimensional feature space.As indicated in Equation (7), when the inverter simultaneously exhibits low DC and AC power outputs—such as during power derating, module aging, or system faults—the PC1 value will significantly decrease, thus falling into the anomaly region identified by the model.
3.2.2. Principle of the PC2-Based Detection Indicator
The second principal component PC2 also played a crucial role as a supplementary diagnostic indicator. PC2 can be interpreted as a measure of the relative deviation between the output and input power. In the feature space constructed via PCA, PC2 is orthogonal to PC1, allowing it to capture variations not explained by PC1particularly inconsistencies between the DC input and AC output.
Specifically, if a given inverter maintains normal DC input power but exhibits a significantly reduced AC output (e.g., owing to increased internal losses or abnormal conversion efficiency), the corresponding PC2 value deviates markedly from that of the normal operating group. In contrast, if the DC and AC power increase or decrease simultaneously, such variations are primarily reflected in PC1, with minimal change in PC2.Therefore, PC2 is valuable for identifying latent degradation phenomena, especially when the input remains normal, but the output becomes abnormal. These conditions are often indicative of declining conversion efficiency or aging of internal components. In this context, PC2 can be regarded as a latent indicator of the internal inverter deterioration. The mathematical derivation of PC2 is as follows:
PCA, the second principal component PC2, was orthogonal to the first principal component PC1. Let the unit vector associated with PC1 be denoted by , as derived in the previous section. We assumed that the direction vector of PC2 is . To satisfy the orthogonality condition, the inner products of and must be zero:
Substituting this into the unit length condition yields:
Therefore, the unit vector for PC2 is either or Both directions are valid, as they represent the same projection axis with opposite orientation and produce equivalent results in the principal component space. Combining the derivations from Equations (1)–(9), the projection of a data sample onto the PC2 axis is given by:
This expression quantifies the deviation between the normalized DC input and AC output values. A large PC2 magnitude suggests a potential mismatch between the input and output, indicating an internal degradation or conversion inefficiency in the inverter. After combining PC1 and PC2 into a two-dimensional principal component space, a machine learning model such as the OCSVM can be used to establish a boundary that encloses normal samples. Samples located outside this boundary were considered potential anomalies. This approach integrates two complementary sources of variation, effectively reducing the risk of misclassification caused by relying on a single feature, and improving the overall accuracy of anomaly detection.
3.3. Anomaly Detection
This study adopts a One-Class Support Vector Machine (OCSVM) as the core model for anomaly detection. The OCSVM is an unsupervised machine learning technique that can autonomously construct a boundary representing "normal data behavior" without requiring labeled anomaly data, making it particularly suitable for real-world applications where anomaly samples are difficult to obtain [11]. The model employs a kernel function to map the original data into a high-dimensional feature space, wherein it constructs a hyperplane or equivalent spherical boundary to enclose the majority of normal data points. Data points lying outside this boundary were considered anomalous. Following the standard one-class SVM formulation, the decision boundary is obtained by solving the following optimization problem [12,13]:
Subject to constraints
where
is the i-th data sample, represented as , that is, the principal components in the reduced 2D feature space.
is the transformed representation of sample in a high-dimensional feature space, using the kernel function used for hyperplane construction and anomaly classification.
the normal vector of the hyperplane.
offset (bias term) determines the distance between the boundary and origin.
slack variable that controls the allowed margin of error (i.e., data points permitted to lie outside the decision boundary).
parameter that controls the model’s tolerance for anomalies.
maximizes the distance between the separating hyperplane and origin to establish a smooth boundary and enhance the generalization capability of the model.
allows certain data points to deviate from the decision boundary, thereby controlling the sensitivity of the anomaly detection model.
The decision criterion of the model is the decision function value f(x)=-, which can be obtained using the decision_function() method. This value can be interpreted as the distance between a data point and hyperplane. When f(x)≥0, the data point is considered to lie within the boundary, and is thus classified as a normal sample. Conversely, when f(x)<0, point lies outside the boundary and is flagged as a potential anomaly. In this study, parameter v was set to 0.05, indicating that the model allowed up to 5% of the data to be classified as anomalous. This value also reflects the sensitivity of the model to anomalies, and can be adjusted based on practical experience.
3.4. Multi-Criteria Anomaly Detection
In addition to OCSVM-based anomaly detection, two supplementary conditions with clear physical significance were incorporated to enhance the reliability of the anomaly classification. Specifically, a sample is flagged as anomalous if it satisfies either of the following criteria.
3.4.1. Multi-Criteria Anomaly Detection
The AC/DC power ratio was less than 0.96, and a threshold for the AC/DC ratio (< 0.96) was established based on empirical field observations and historical SCADA data analysis. Sensitivity assessments revealed that increasing the threshold beyond 0.97 led to a substantial increase in the number of detected anomalies; however, this also resulted in a higher false-positive rate. Conversely, lowering the threshold below 0.94 causes several known degraded inverters to be overlooked. Accordingly, a threshold of 0.96 was determined to provide an optimal trade-off between detection sensitivity and classification specificity.
3.4.2. The AC Power Ratio Change
The AC power ratio change was < 0.8, and the threshold for the AC power change ratio was set at 0.8 to effectively filter out the natural power fluctuations induced by irradiance variability. Based on continuous observations of inverter data under stable irradiance conditions, abrupt power drops exceeding 20% are uncommon and typically associated with inverter malfunctions or MPPT instability. A sensitivity analysis conducted over a threshold range of 0.75 to 0.85 demonstrated that the 0.8 criterion provides an optimal balance between detection sensitivity and robustness against false positives caused by transient environmental disturbances.
If a data point satisfies any of these criteria, along with the OCSVM result, the Anomaly Level is assigned as follows.
- High Anomaly, if all three conditions are met;
- Medium Anomaly, if two are met;
- Low Anomaly, if only one is satisfied.
3.5. Visualization and Anomaly Grouping
The distribution of data in the principal component space can be visualized using both static and interactive charts to assess the performance degradation of grid-connected photovoltaic inverters under multitask operations. In this study, anomaly indicators were categorized into three levels: high, medium, and low. The frequency of anomalies observed for each inverter can serve as a basis for maintenance decisions. Figure 3 illustrates the overall workflow of the proposed multicriteria anomaly detection and classification scheme.
4. Experimental Results and Discussion
The field-tested photovoltaic (PV) power plant was found to inject approximately 2.8 MVAr of reactive power into the grid during nighttime non-generating periods, as shown inFigure 4. To eliminate this reverse reactive power flow, 55 inverters were activated at night to operate in PV-STATCOM mode. This multitask operational strategy initially proved to be effective and successfully reduced the reverse reactive power flow to approximately 0 MVAr, as shown in Figure 5.
After a period of operation, the utility company reported a reverse reactive power injection of approximately 0.28 MVAr into the grid, as shown in Figure 6. To identify anomalous inverters, the detection dataset was configured to include the DC input and AC output of each inverter recorded at 12:00 p.m. over an eight-day period. The power output variation rate was analyzed under comparable irradiance and temperature–humidity conditions. Subsequently, PCA and OCSVM were combined to perform feature extraction and anomaly detection for inverters operating under multitask conditions. The analysis was conducted using Python 3.13.2 (64-bit), and the results are presented in Figure 7.
In the scatter plot shown in Fig. 7, the three inverters exhibit moderate-to-severe anomalies, with their positions located near the OCSVM decision boundary (indicated by the red dashed line). The corresponding anomaly indicators for these inverters are listed in Table 1.
Explanation of the anomaly detection results is as follows:
- AC/DC Anomaly Indicator: The threshold for this indicator was set at an AC/DC power ratio of less than 0.96. As shown in Table 1, the three inverters exhibit a power conversion efficiency (AC/DC ratio) below the specified threshold, and are located on or beyond the OCSVM decision boundary. Therefore, these units were classified as anomalous units.
- AC Change Anomaly: This indicator is set at an AC ratio change of < 0.8, and is designed to identify abrupt power fluctuations or discontinuities in the output. The threshold was calibrated to accommodate variations caused by rapid weather changes. For example, Inverter A31_23 exhibits a power drop exceeding 20% between consecutive time intervals, indicating a significant anomaly.
- OCSVM Anomaly: The parameter nu = 0.05 is adopted as the tolerance level for the decision boundary, meaning that the model assumes that up to 5% of the data may be anomalous. This parameter serves as a hyperparameter in the OCSVM model to control the trade-off between the anomaly sensitivity and boundary tightness. The dashed red line in Fig. 7 represents the decision boundary established by the OCSVM model enclosing approximately 95% of the data points, which is regarded as the "normal" operational region. If nu is set too low (e.g., nu = 0.01), the model may become overly conservative, potentially failing to detect latent anomalies. Conversely, a larger nu value (e.g., 0.1 to 0.2) may lead to overdetection, mistakenly classifying normal data as anomalous
- It should be noted that this study extracted inverter data at a fixed time (12:00) each day to ensure comparable irradiance conditions and reduce weather-related variability. However, this approach may overlook time-specific anomalies such as short-term thermal derating or MPPT instability during startup or sunset periods. Future studies could incorporate multiple time points or leverage time-series models to capture intraday performance variations and further improve the detection coverage.
The results of this study have been provided to the plant’s operation and maintenance (O&M) personnel for verification and comparison. Based on the anomaly detection results proposed in this study, plant engineers conducted on-site inspections and subsequently performed the corresponding maintenance and adjustments. No further incidents of reverse reactive power injection were observed according to the SCADA records provided by the utility company, as shown in Figure 8.
To validate the anomaly detection performance of the proposed OCSVM model, this study conducted a comparative analysis with another widely used unsupervised learning method: the Isolation Forest (IF) method. The results are shown in Figure 9. The x-axis represents the classification results from the Isolation Forest model and the y-axis represents those from the OCSVM model. The classification was based on features projected via Principal Component Analysis PCA. The dataset included 440 samples collected over eight consecutive days from 55 inverters. In the scatter plot, the upper-left and lower-right quadrants indicate agreement between both models in identifying "normal" and "anomalous" samples, respectively. In contrast, the upper-right and lower-left quadrants represent the disagreements between the two models. The experimental results demonstrated an overall agreement of 96.1% between the two methods. Notably, the OCSVM model exhibited higher sensitivity in detecting early stage efficiency degradation and localized deviations, as evidenced by its ability to identify borderline samples that were otherwise classified as normal by the Isolation Forest. This characteristic underscores the potential advantage of the model in the early fault detection of PV inverters, because subtle performance shifts often serve as precursors to inverter failure.
5. Conclusion
This study employed an unsupervised machine learning approach to evaluate the operational status of PV inverters. A boundary for normal operational data was established by applying PCA for dimensionality reduction and combining it with the OCSVM model. Two additional indicators, the AC/DC power ratio and the rate of change in the AC output, were incorporated to form a tri-layered anomaly detection scheme, thereby enhancing the diagnostic accuracy. The proposed method was implemented in a large-scale photovoltaic (PV) power plant located in Tainan, Taiwan, with an installed capacity of 120 MW and 1,292 inverters. Among the 55 inverters operating under multitask nighttime conditions, the model successfully identified three units that exhibited performance degradation, corresponding to an anomaly detection rate of approximately 5%. These findings highlight the practical applicability and potential of our proposed method.
Traditional preventive maintenance and scheduled replacement strategies can effectively maintain high system availability—often exceeding 90%—but they require frequent manual intervention and involve considerable, recurring O&M expenditures [14]. Walker et al. further pointed out that, to prevent prolonged downtime and revenue losses caused by premature inverter failures, plant operators must prepare dedicated maintenance reserve funds to accommodate early equipment replacement [15]. In contrast, the data-driven approach proposed in this study provides a cost-effective and non-intrusive alternative, utilizing existing SCADA monitoring data for analysis without the need for additional hardware installations or premature component replacement.
Furthermore, an anomaly-based grouping mechanism was adopted to classify inverters with higher anomaly frequency and severity into a “high-anomaly group,” which provides actionable early warnings for maintenance personnel. Overall, the proposed method offers several advantages.
- Noninvasive: Diagnosis is performed using existing SCADA monitoring data without requiring additional hardware.
- Enhanced reliability: By integrating multiple anomaly detection criteria, this method increases the credibility of the classification outcomes.
- High scalability: This framework can be extended to various inverter models and adapted to various anomaly types and prediction tasks.
This study confirms the feasibility and practical value of applying machine learning to inverter anomaly detection. Although the research primarily focused on inverters operating under multitask conditions, the proposed method can be extended to identify anomalies across all the inverters within the plant. Compared with existing hardware-based diagnostic techniques, this approach offers a low-cost, non-intrusive, and scalable alternative for effectively detecting early stage inverter degradation.
Future work will extend the proposed framework toward grid-level asset monitoring by integrating partial discharge (PD) detection technology for extra-high-voltage (EHV) power cables in large-scale photovoltaic (PV) plants. This integration aims to establish a real-time alarm mechanism for early fault identification and to prevent potential 161 kV cable failures, thereby reducing economic losses and further enhancing system reliability.
Acknowledgments
The authors would like to thank Taiwan Power Company for supplying the SCADA data used in this study.
References
- Bouguerra:, S.; Yaiche, M.R.; Gassab, O.; Sangwongwanich, A.; Blaabjerg, F. The Impact of PV Panel Positioning and Degradation on the PV Inverter Lifetime and Reliability. IEEE J. Emerg. Sel. Top. Power Electron. 2021, 9, 3114–3126. [Google Scholar] [CrossRef]
- Sangwongwanich, A.; Yang, Y.; Sera, D.; Blaabjerg, F. Lifetime Evaluation of Grid-Connected PV Inverters Considering Panel Degradation Rates and Installation Sites. IEEE Trans. Power Electron. 2018, 33, 1225–1236. [Google Scholar] [CrossRef]
- Spertino, F.; Chiodo, E.; Ciocia, A.; Malgaroli, G.; Ratclif, A. Maintenance Activity, Reliability, Availability, and Related Energy Losses in Ten Operating Photovoltaic Systems up to 1. 8 MW. IEEE Trans. Ind. Appl. 2021, 57, 83–93. [Google Scholar] [CrossRef]
- Wang, W. ; A Non-Invasive Online Condition Monitoring Method for Both SiC MOSFET and DC-Link Capacitor in a Single-Phase Inverter. In Proceedings of the 2021 Global Reliability and Prognostics and Health Management (PHM-Nanjing), Nanjing, China, 22–24 Oct 2021; pp. 1–5. [Google Scholar] [CrossRef]
- Flicker, J.; Johnson, J.; Reno, M.J.; Azzolini, J.A.; Hacke, P.; Thiagarajan, R. Inverter Reliability Estimation for Advanced Inverter Functionality. In Proceedings of the 2022 IEEE 49th Photovoltaic Specialists Conference (PVSC), Philadelphia, PA, USA, 5–10 June 2022; pp. 183–189. [Google Scholar] [CrossRef]
- Moore, L.M.; Post, H.N. Five Years of Operating Experience at a Large, Utility-Scale Photovoltaic Generating Plant. Prog. Photovolt. Res. Appl. 2008, 16, 249–259. [Google Scholar] [CrossRef]
- Vinson, W.; Iradukunda, A.; Huitink, D.; Lee, J.-P.; Kwon, M.; Oh, C.-Y. Combined Electromigration and Strain Accelerated Failure Test Development for Al Wire Bonds and Reliability Analysis of Grid-Tied Solar Inverter. In Proceedings of the 2021 20th IEEE Intersociety Conference on Thermal and Thermomechanical Phenomena in Electronic Systems (iTherm), San Diego, CA, USA, 1–4 June 2021; pp. 772–779. [Google Scholar] [CrossRef]
- Sangwongwanich, A.; Blaabjerg, F. Monte Carlo Simulation with Incremental Damage for Reliability Assessment of Power Electronics. IEEE Trans. Power Electron. 2021, 36, 7366–7371. [Google Scholar] [CrossRef]
- Liu, Y.-M.; Kuo, C.-C.; Chen, H.-C. Nighttime Reactive Power Optimization for Large-Scale PV Plants: Minimizing Compensation Equipment Investment. Appl. Sci. 2025, 15, 10748. [Google Scholar] [CrossRef]
- Liu, Y.-M.; Kuo, C.-C.; Chen, H.-C. A Hybrid GA–Digital Twin Strategy for Real-Time Nighttime Reactive Power Compensation in Utility-Scale PV Plants. Appl. Sci. 2025, 15, 11282. [Google Scholar] [CrossRef]
- Roy, S.; Tufail, S.; Tariq, M.; Sarwat, A. Photovoltaic Inverter Failure Mechanism Estimation Using Unsupervised Machine Learning and Reliability Assessment. IEEE Trans. Reliab. 2024, 73, 1418–1432. [Google Scholar] [CrossRef]
- Fragoso, V.; Scheirer, W.; Hespanha, J.; Turk, M. One-Class Slab Support Vector Machine. In Proceedings of the 23rd International Conference on Pattern Recognition (ICPR), Cancun, Mexico, 4–8 December 2016; pp. 420–425. [Google Scholar] [CrossRef]
- Que, Z.; Lin, C.-J. One-Class SVM Probabilistic Outputs. IEEE Trans. Neural Netw. Learn. Syst. 2025, 36, 6244–6256. [Google Scholar] [CrossRef] [PubMed]
- Orosz, T.; Rassõlkin, A.; Arsénio, P.; Poór, P.; Valme, D.; Sleisz, Á. Current Challenges in Operation, Performance, and Maintenance of Photovoltaic Panels. Energies 2024, 17, 1306. [Google Scholar] [CrossRef]
- Walker, A.; Lockhart, E.; Desai, J.; Ardani, K.; Klise, G.; Lavrova, O.; Tansy, T.; Deot, J.; Fox, B.; Pochiraju, A. Model of Operation and Maintenance Costs for Photovoltaic Systems; National Renewable Energy Laboratory (NREL): Golden, CO, USA, 2020; Available online: https://www.nrel.gov/docs/fy20osti/74840.pdf (accessed on 28 October 2025).
Figure 1.
Figure 1. Single-line diagram of the 120 MW photovoltaic power plant.
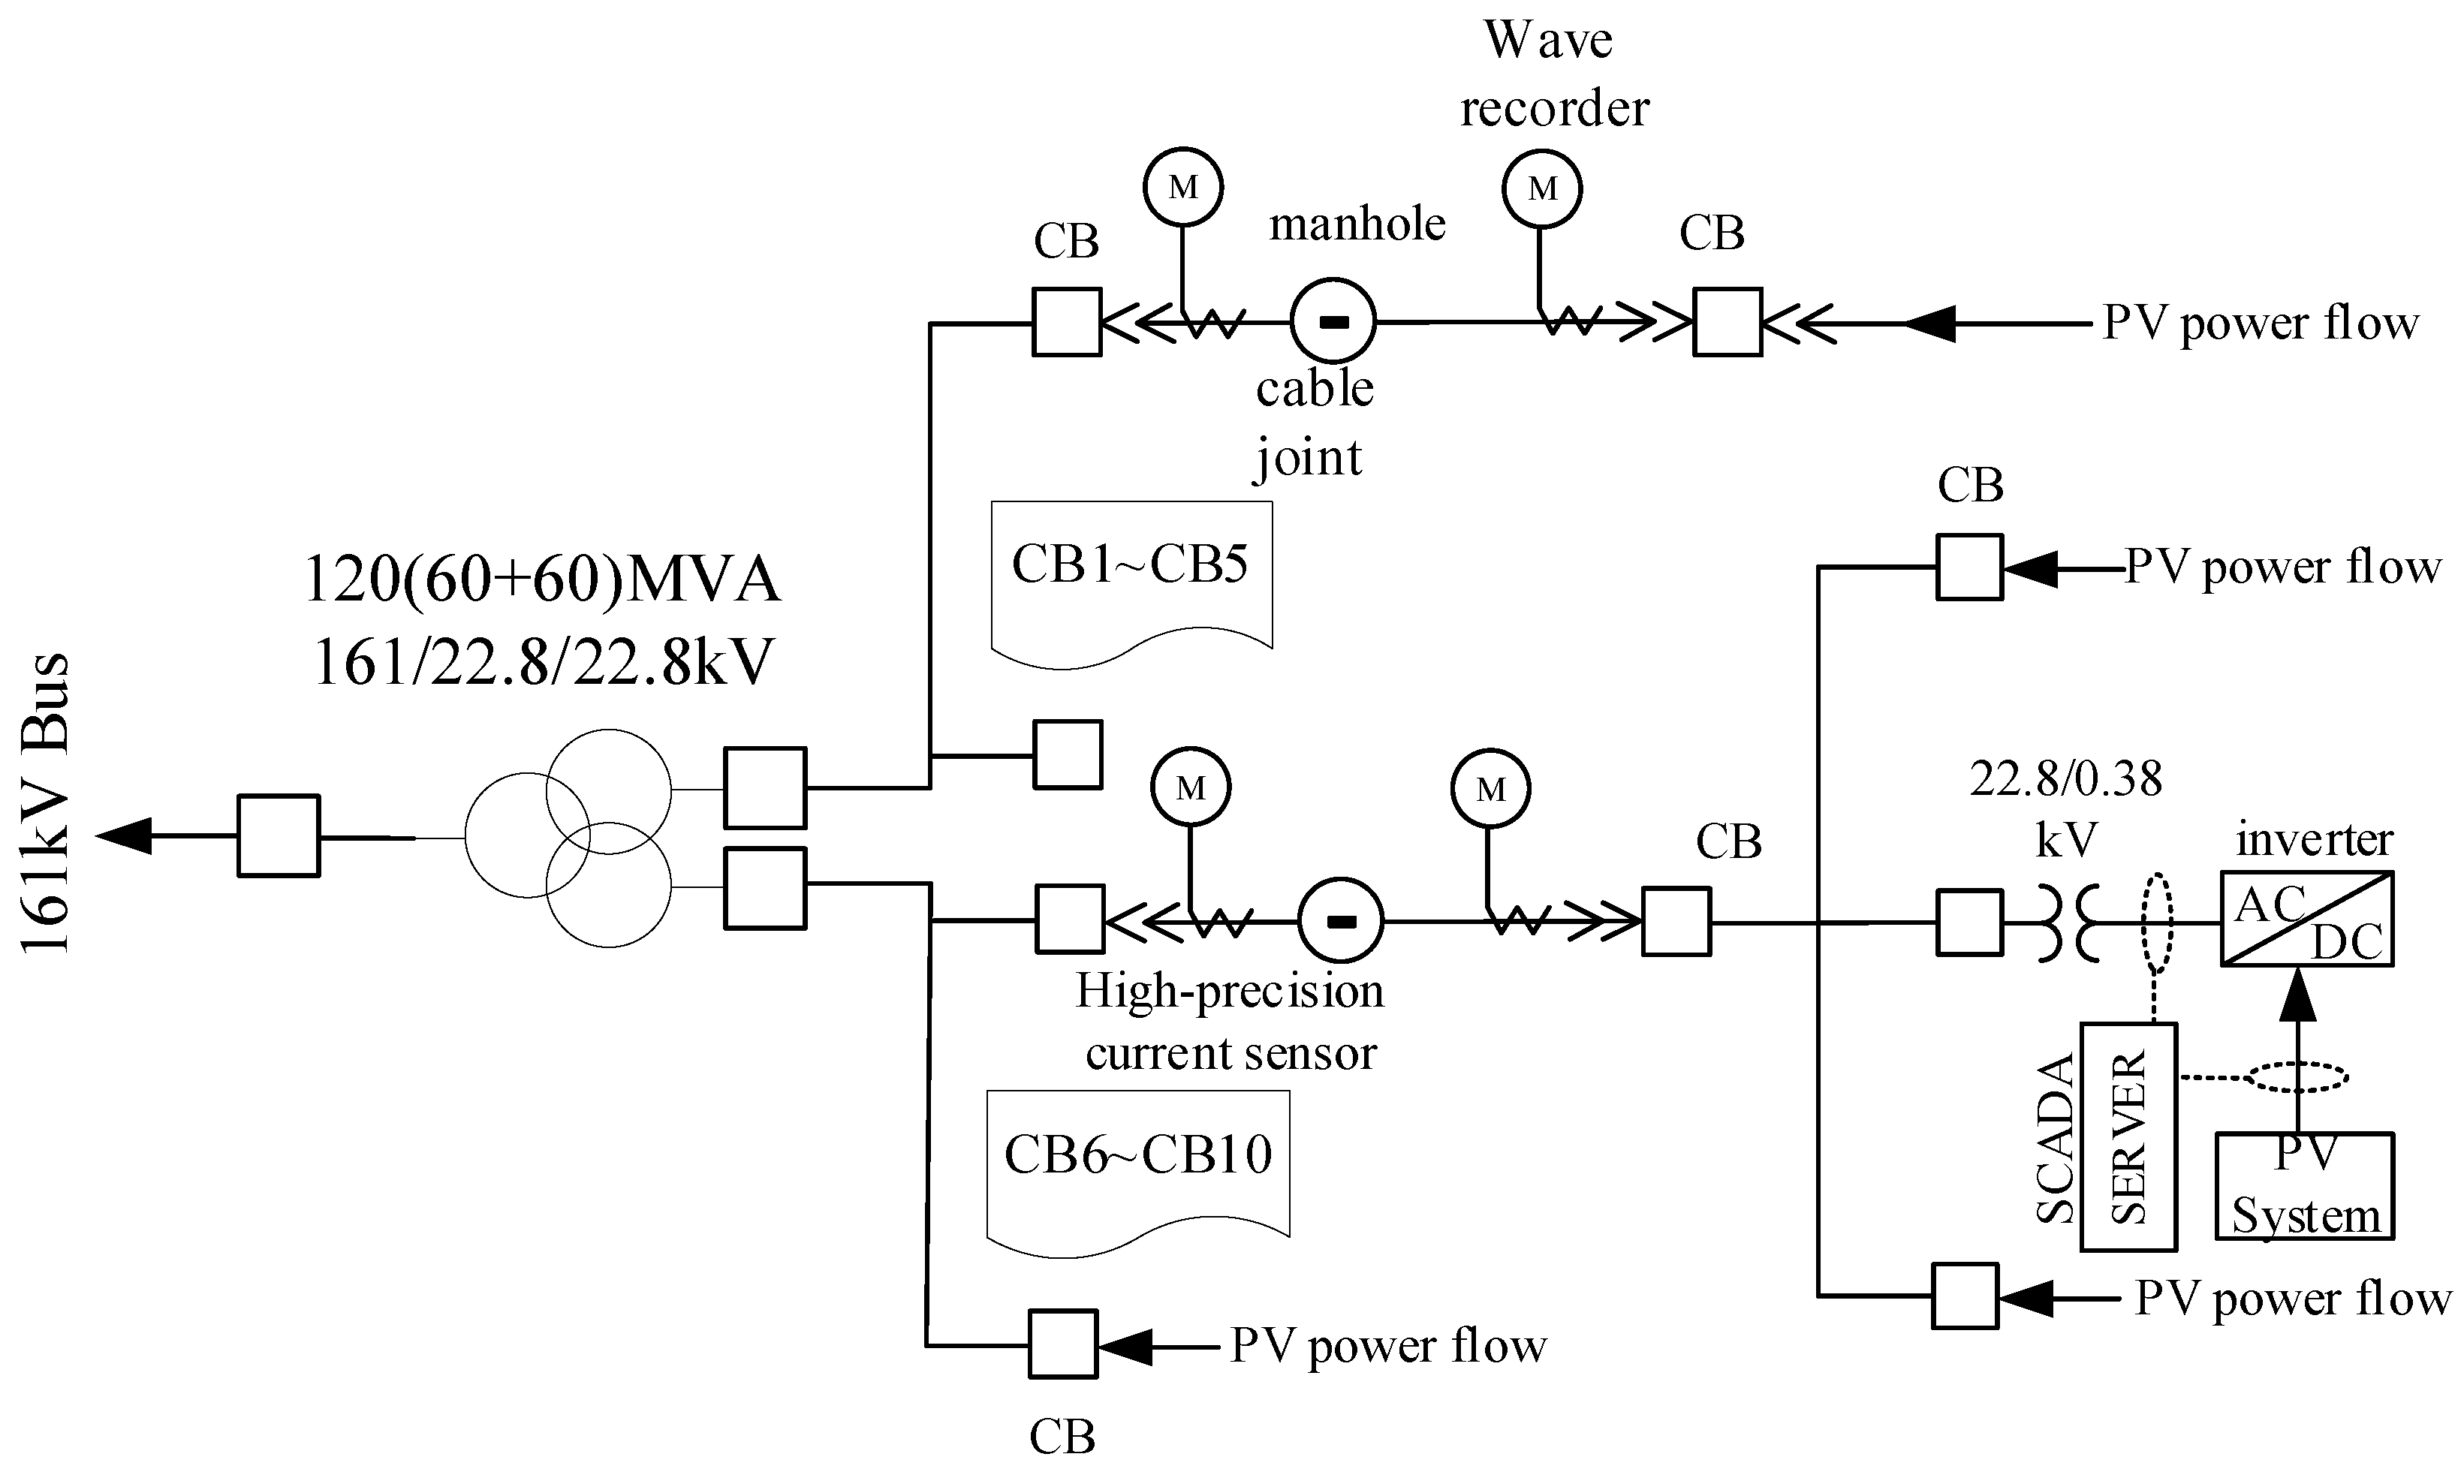
Figure 2.
Figure 2. Data collection and processing workflow.
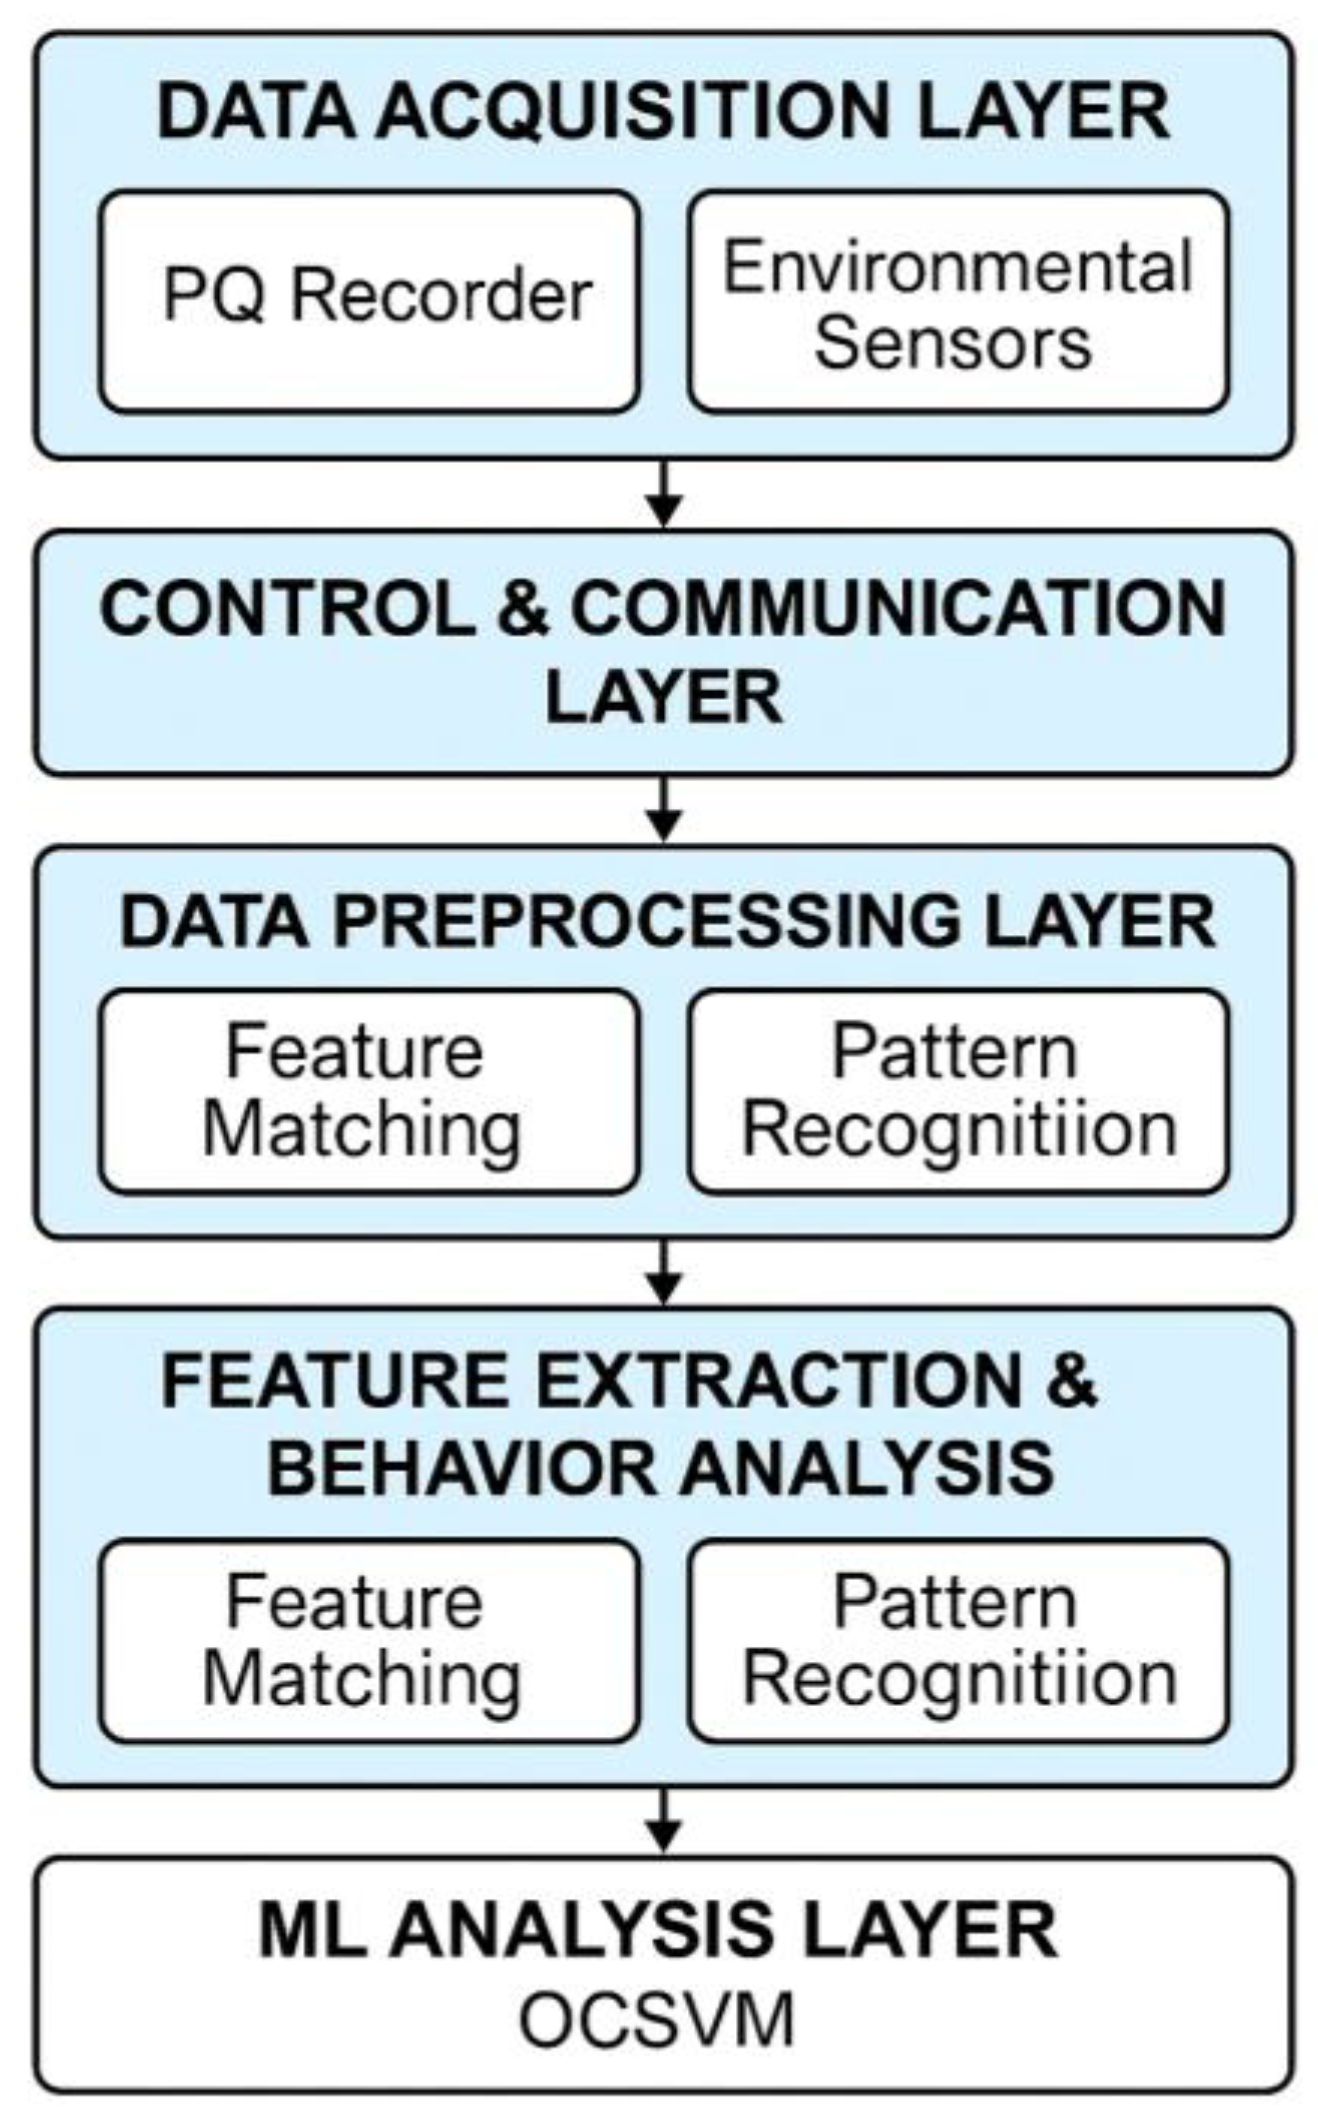
Figure 3.
Overall workflow of the multi-criteria anomaly detection framework.
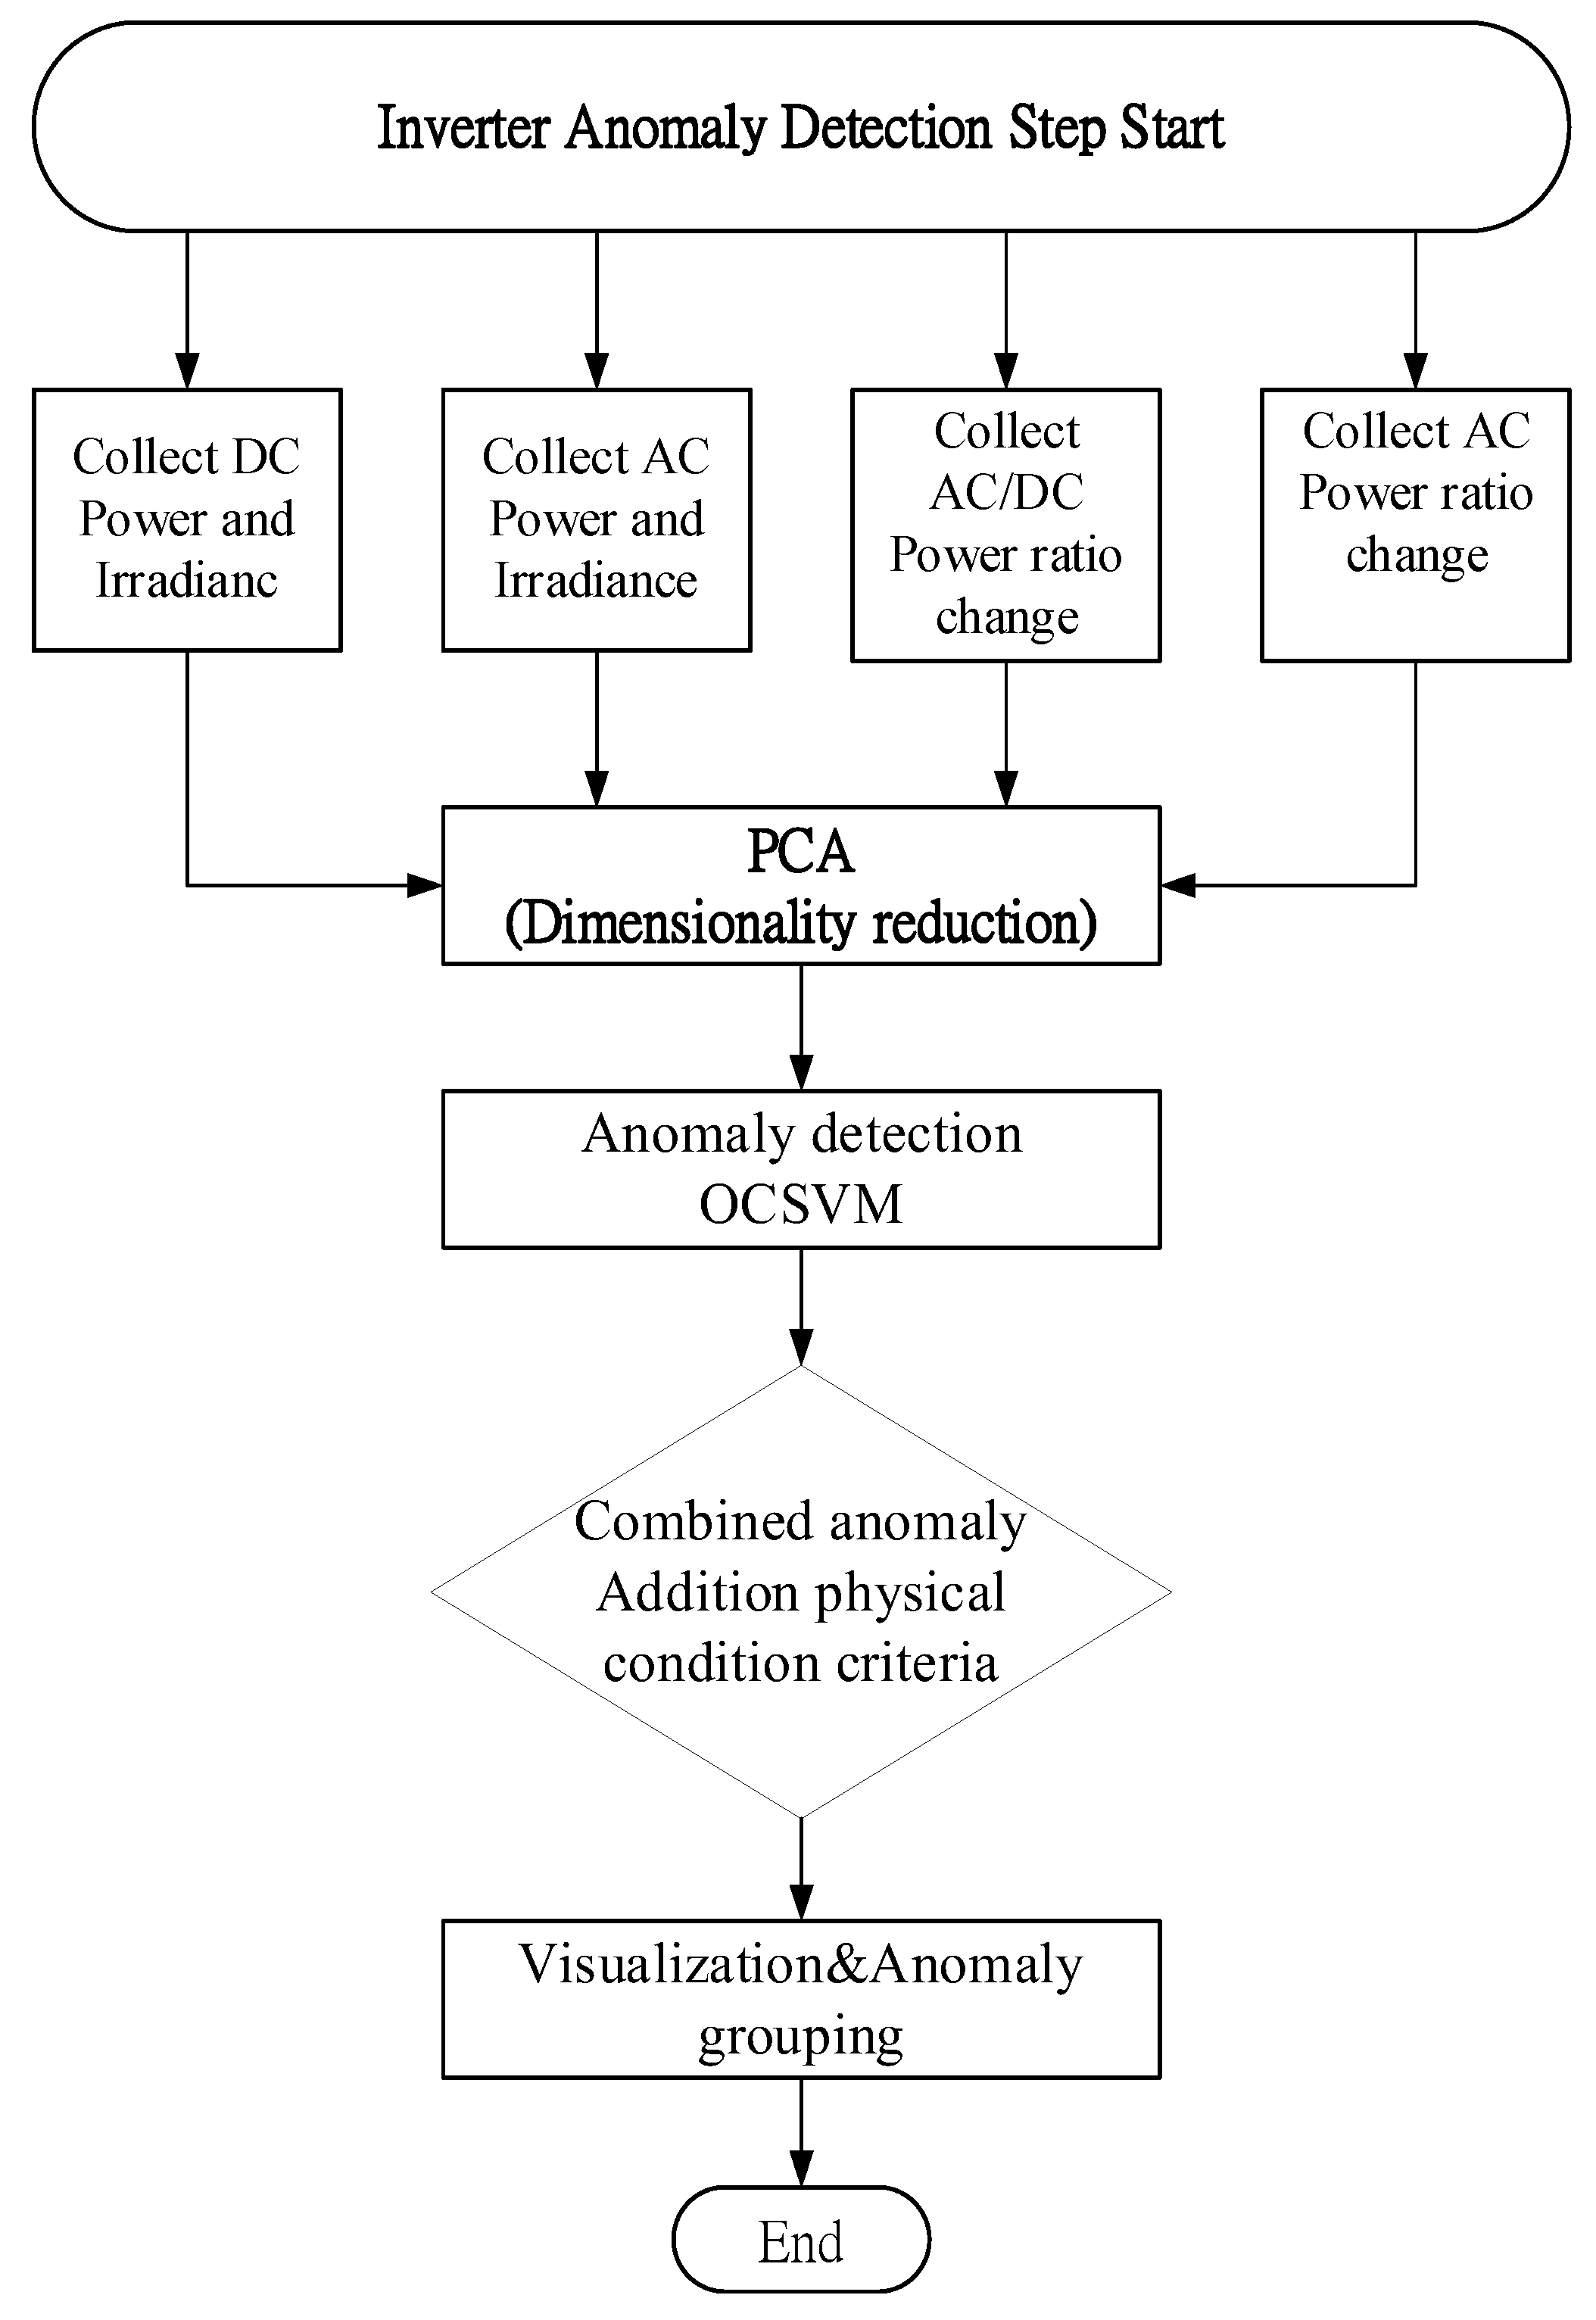
Figure 4.
reverse reactive power injected into the utility grid (data source: Taipower SCADA).
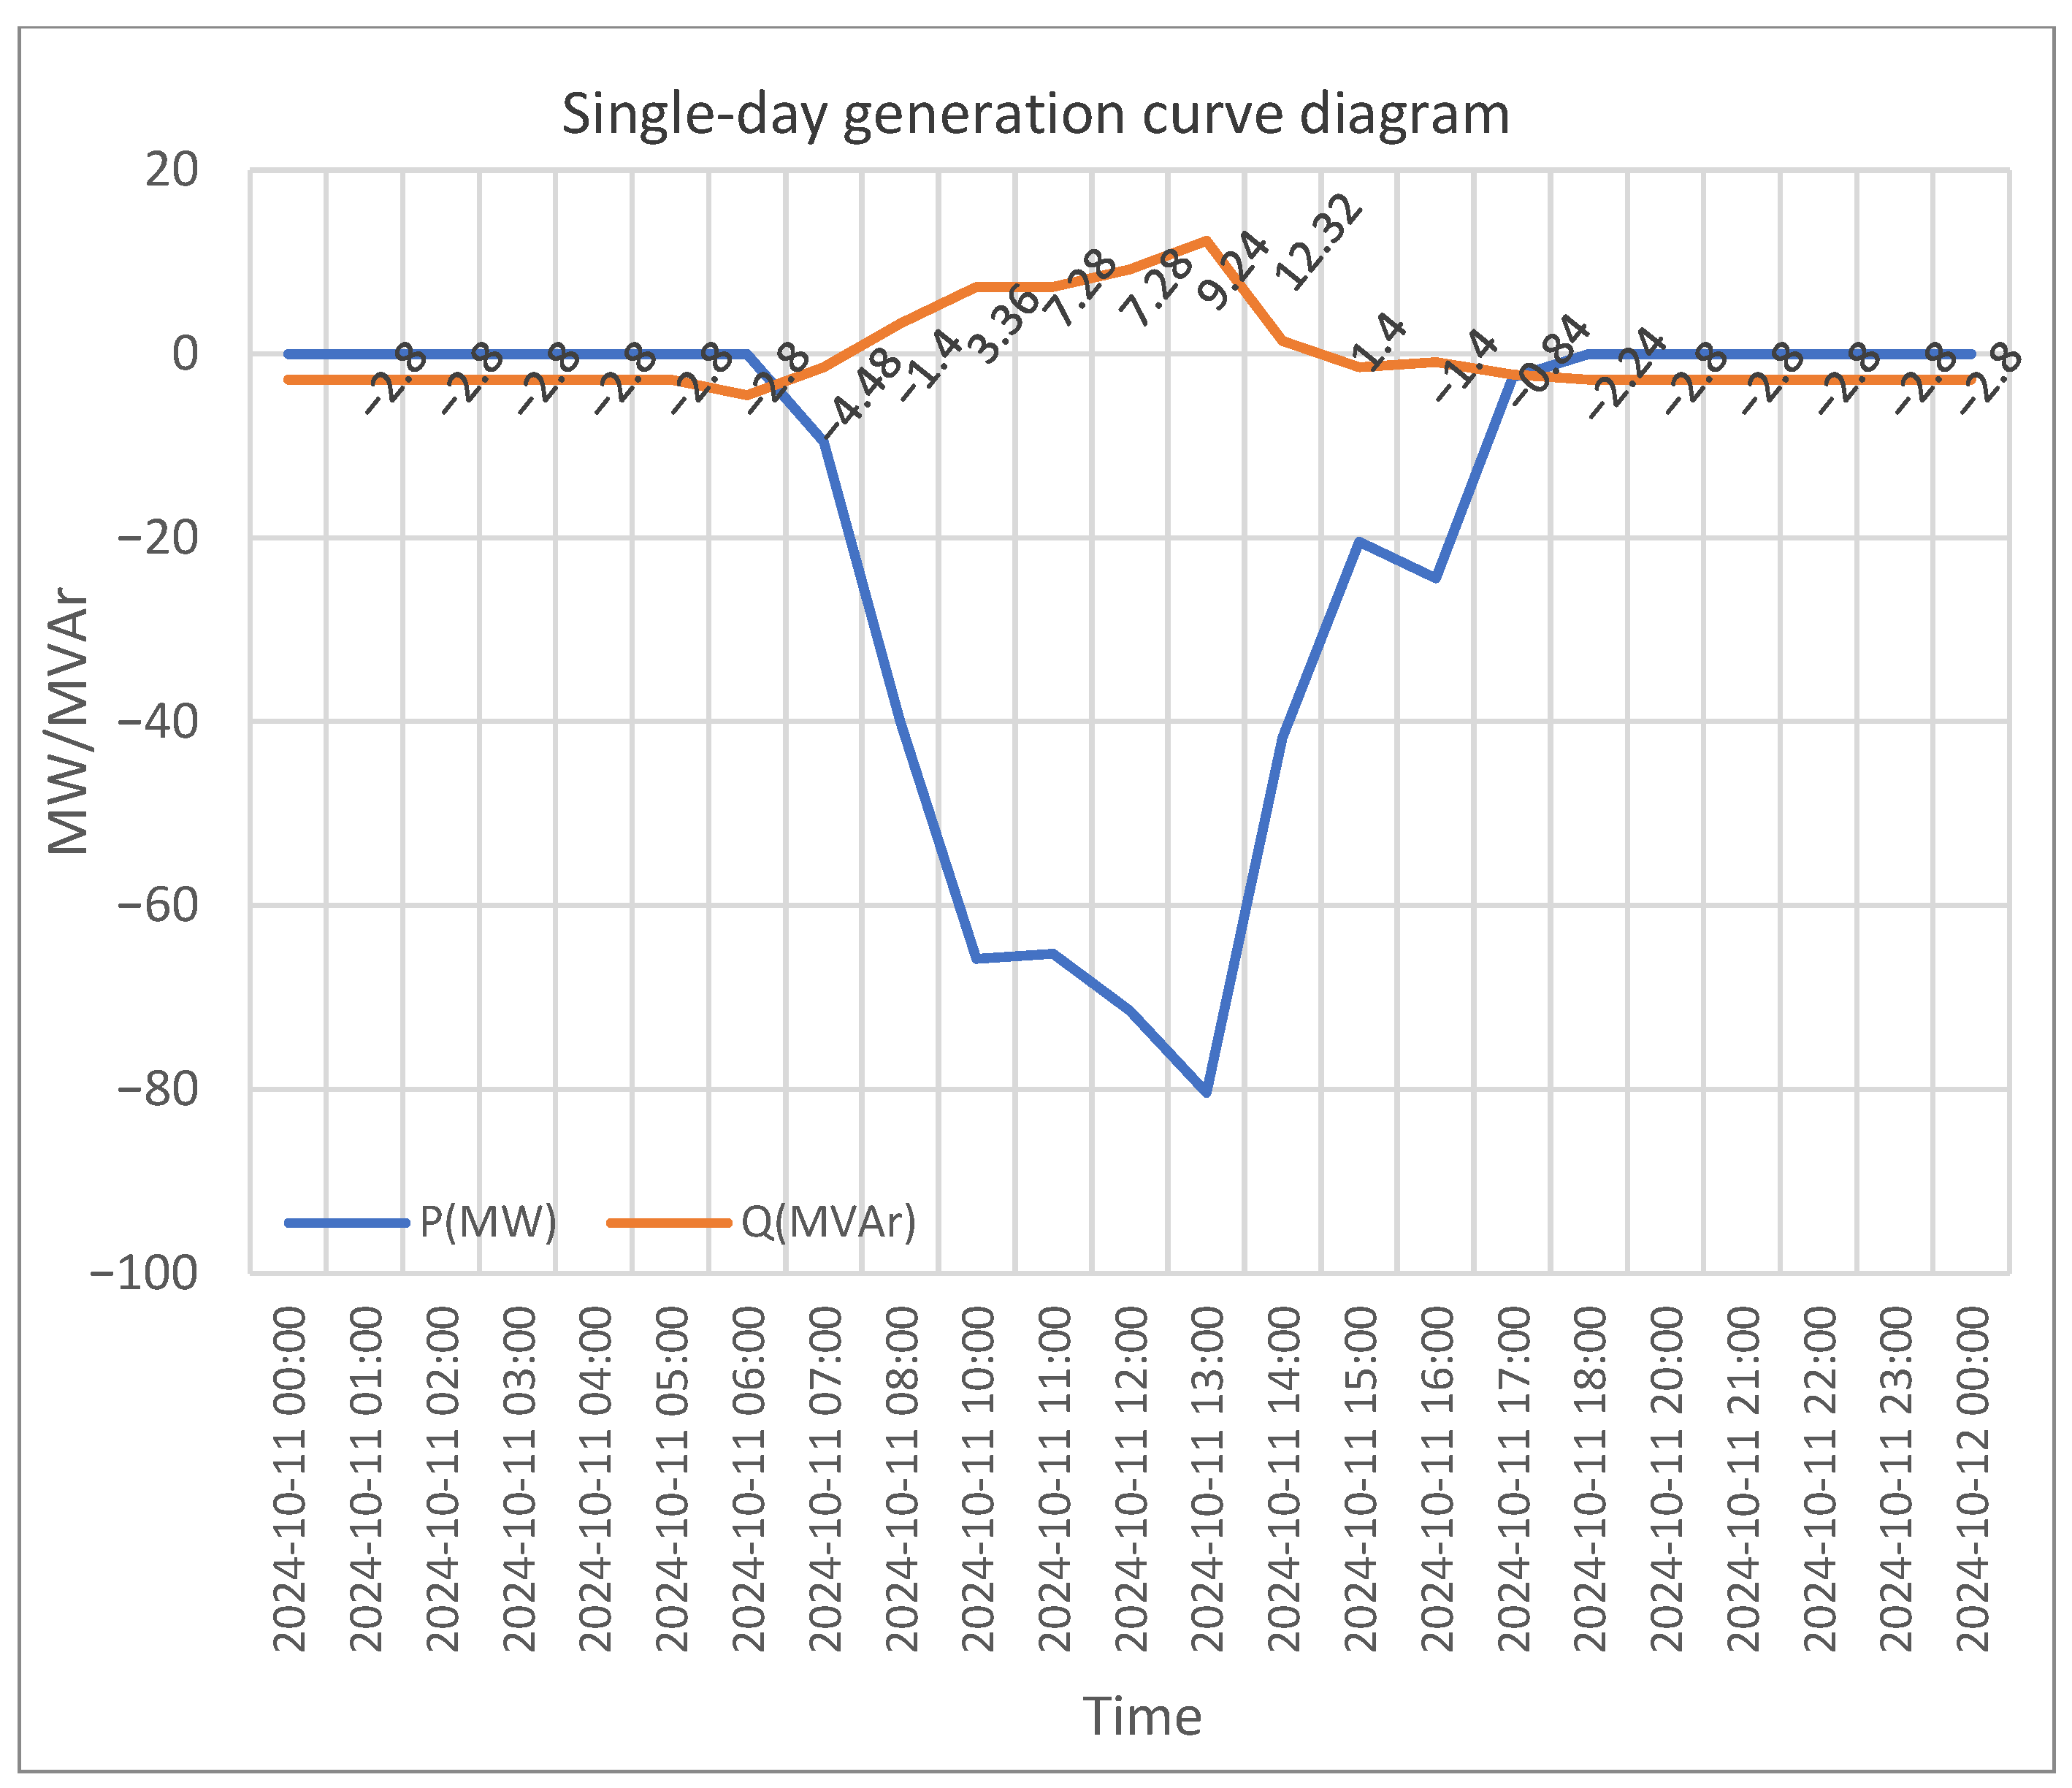
Figure 5.
Improved Curve of Reverse Reactive Power Injection (data source: Taipower SCADA).
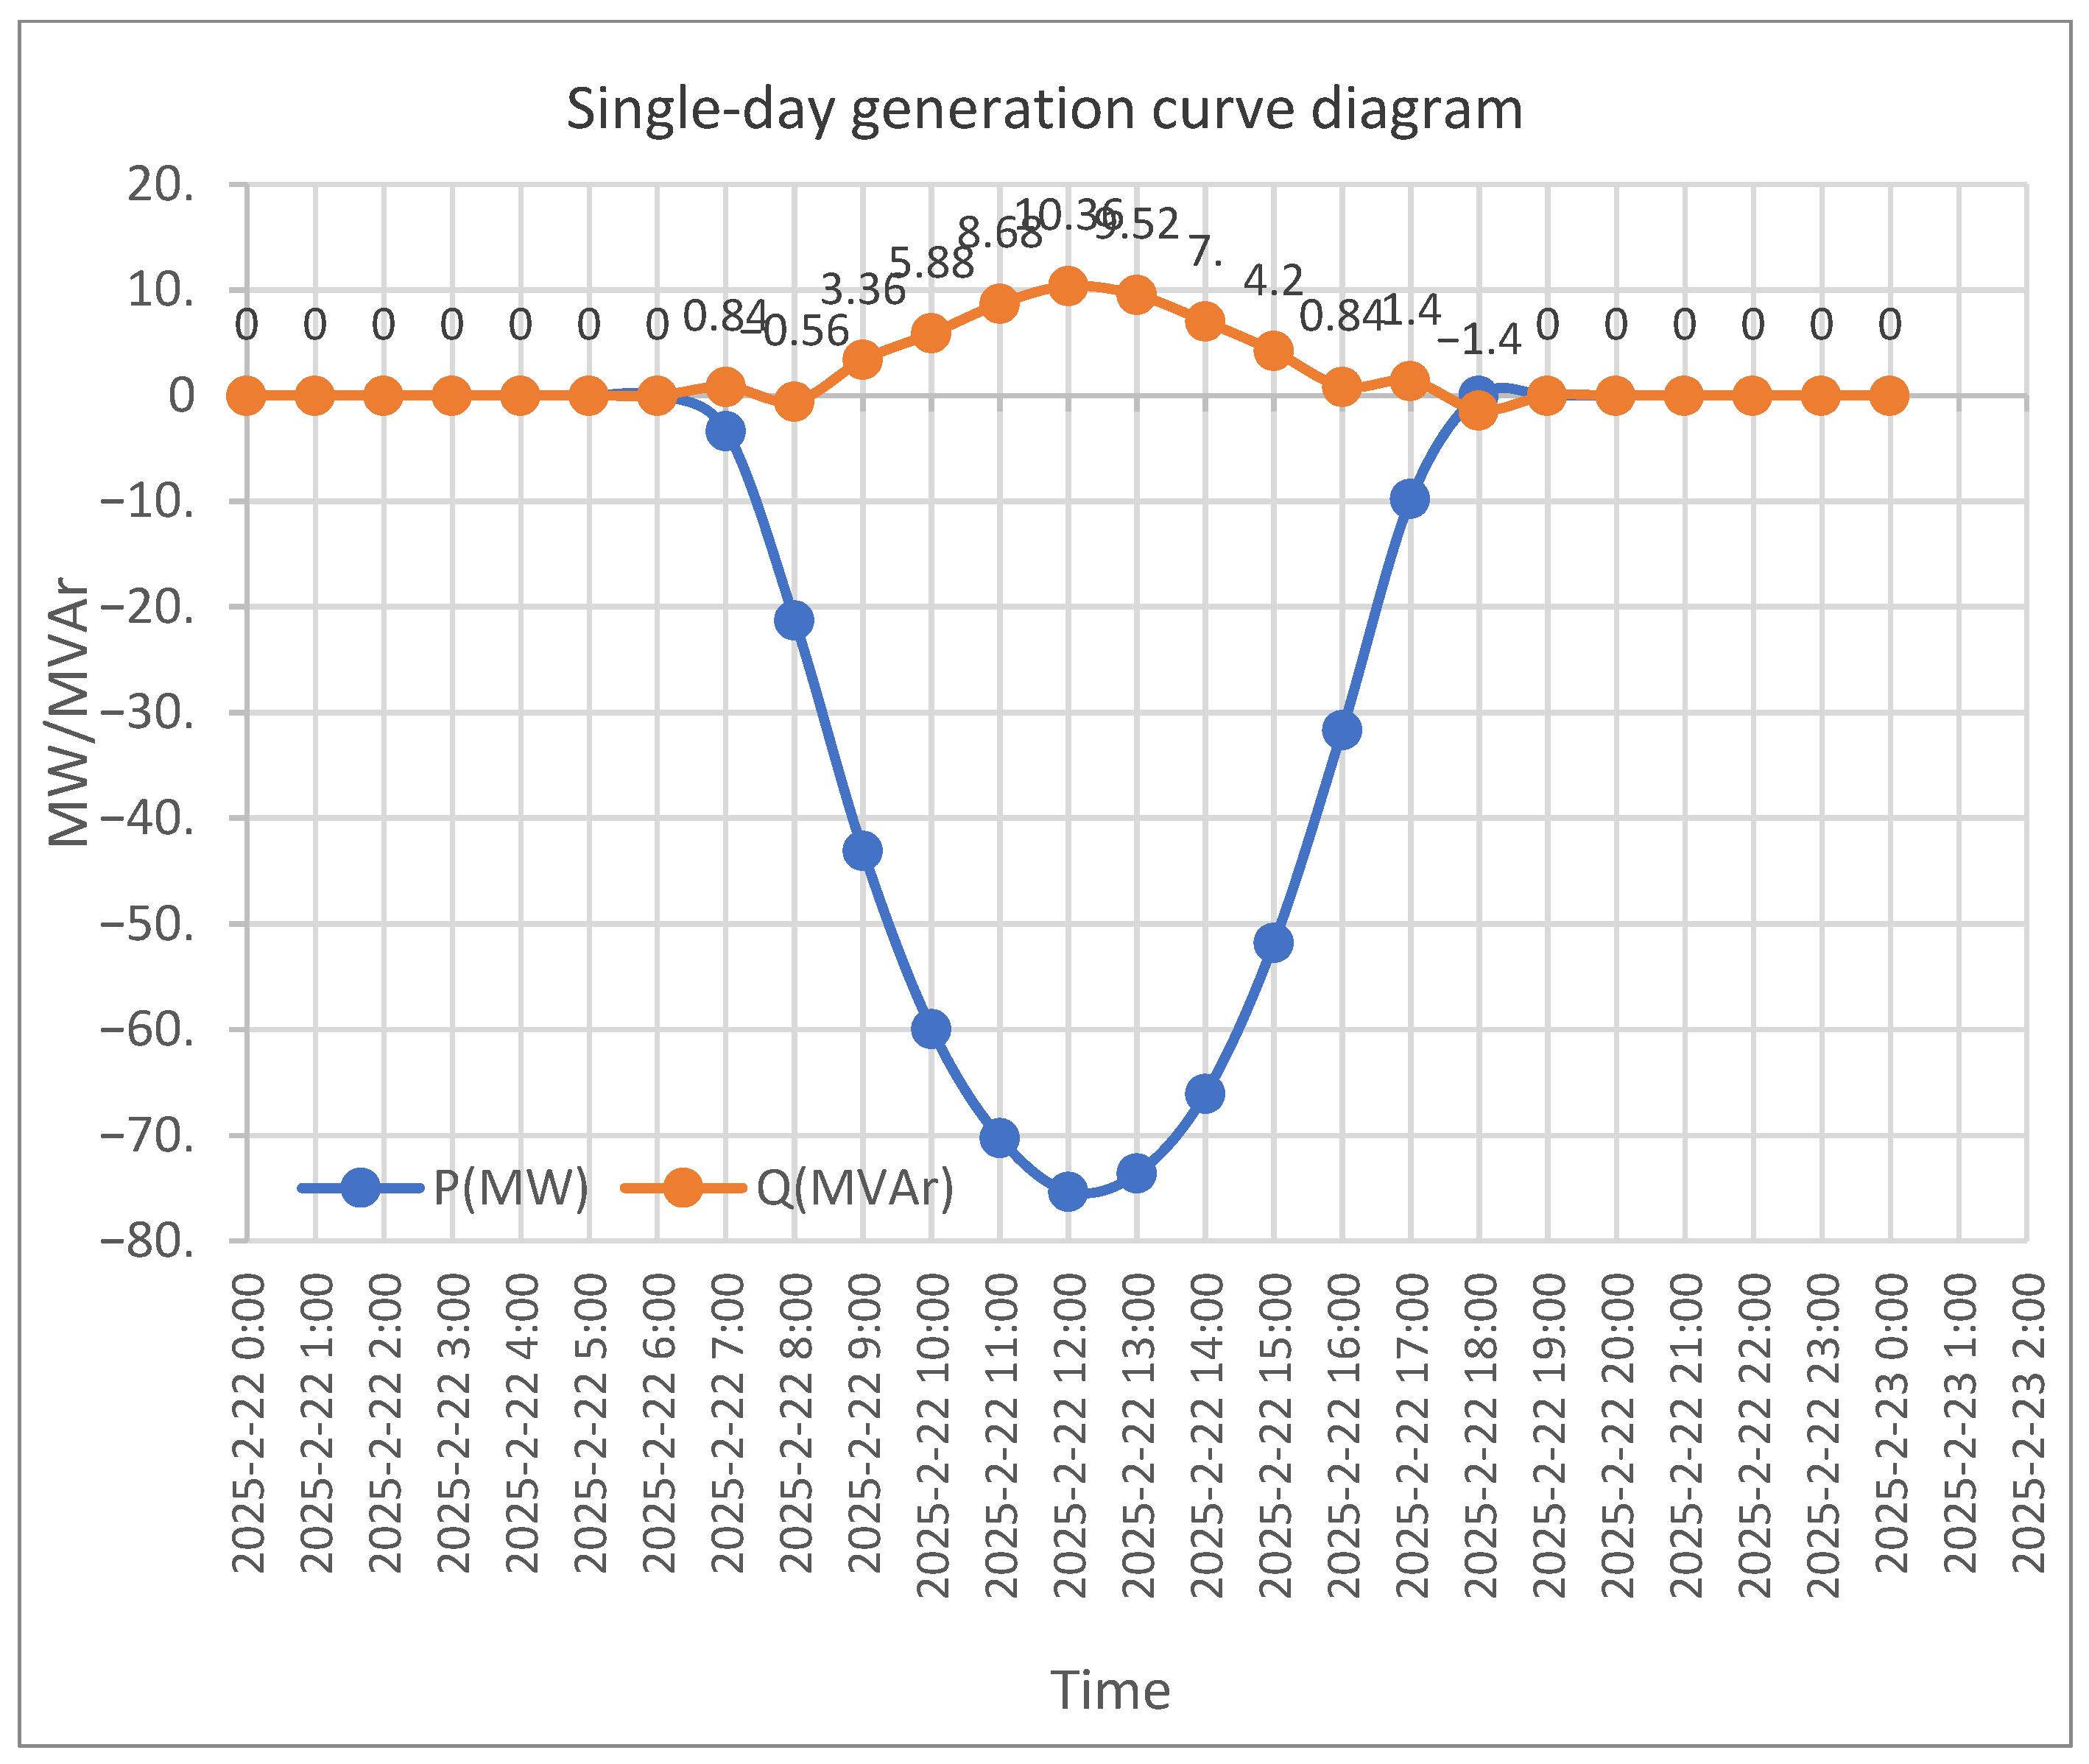
Figure 6.
Figure 6. Reactive Power Backfeeding of 0.28 MVAr (data source: Taipower SCADA).
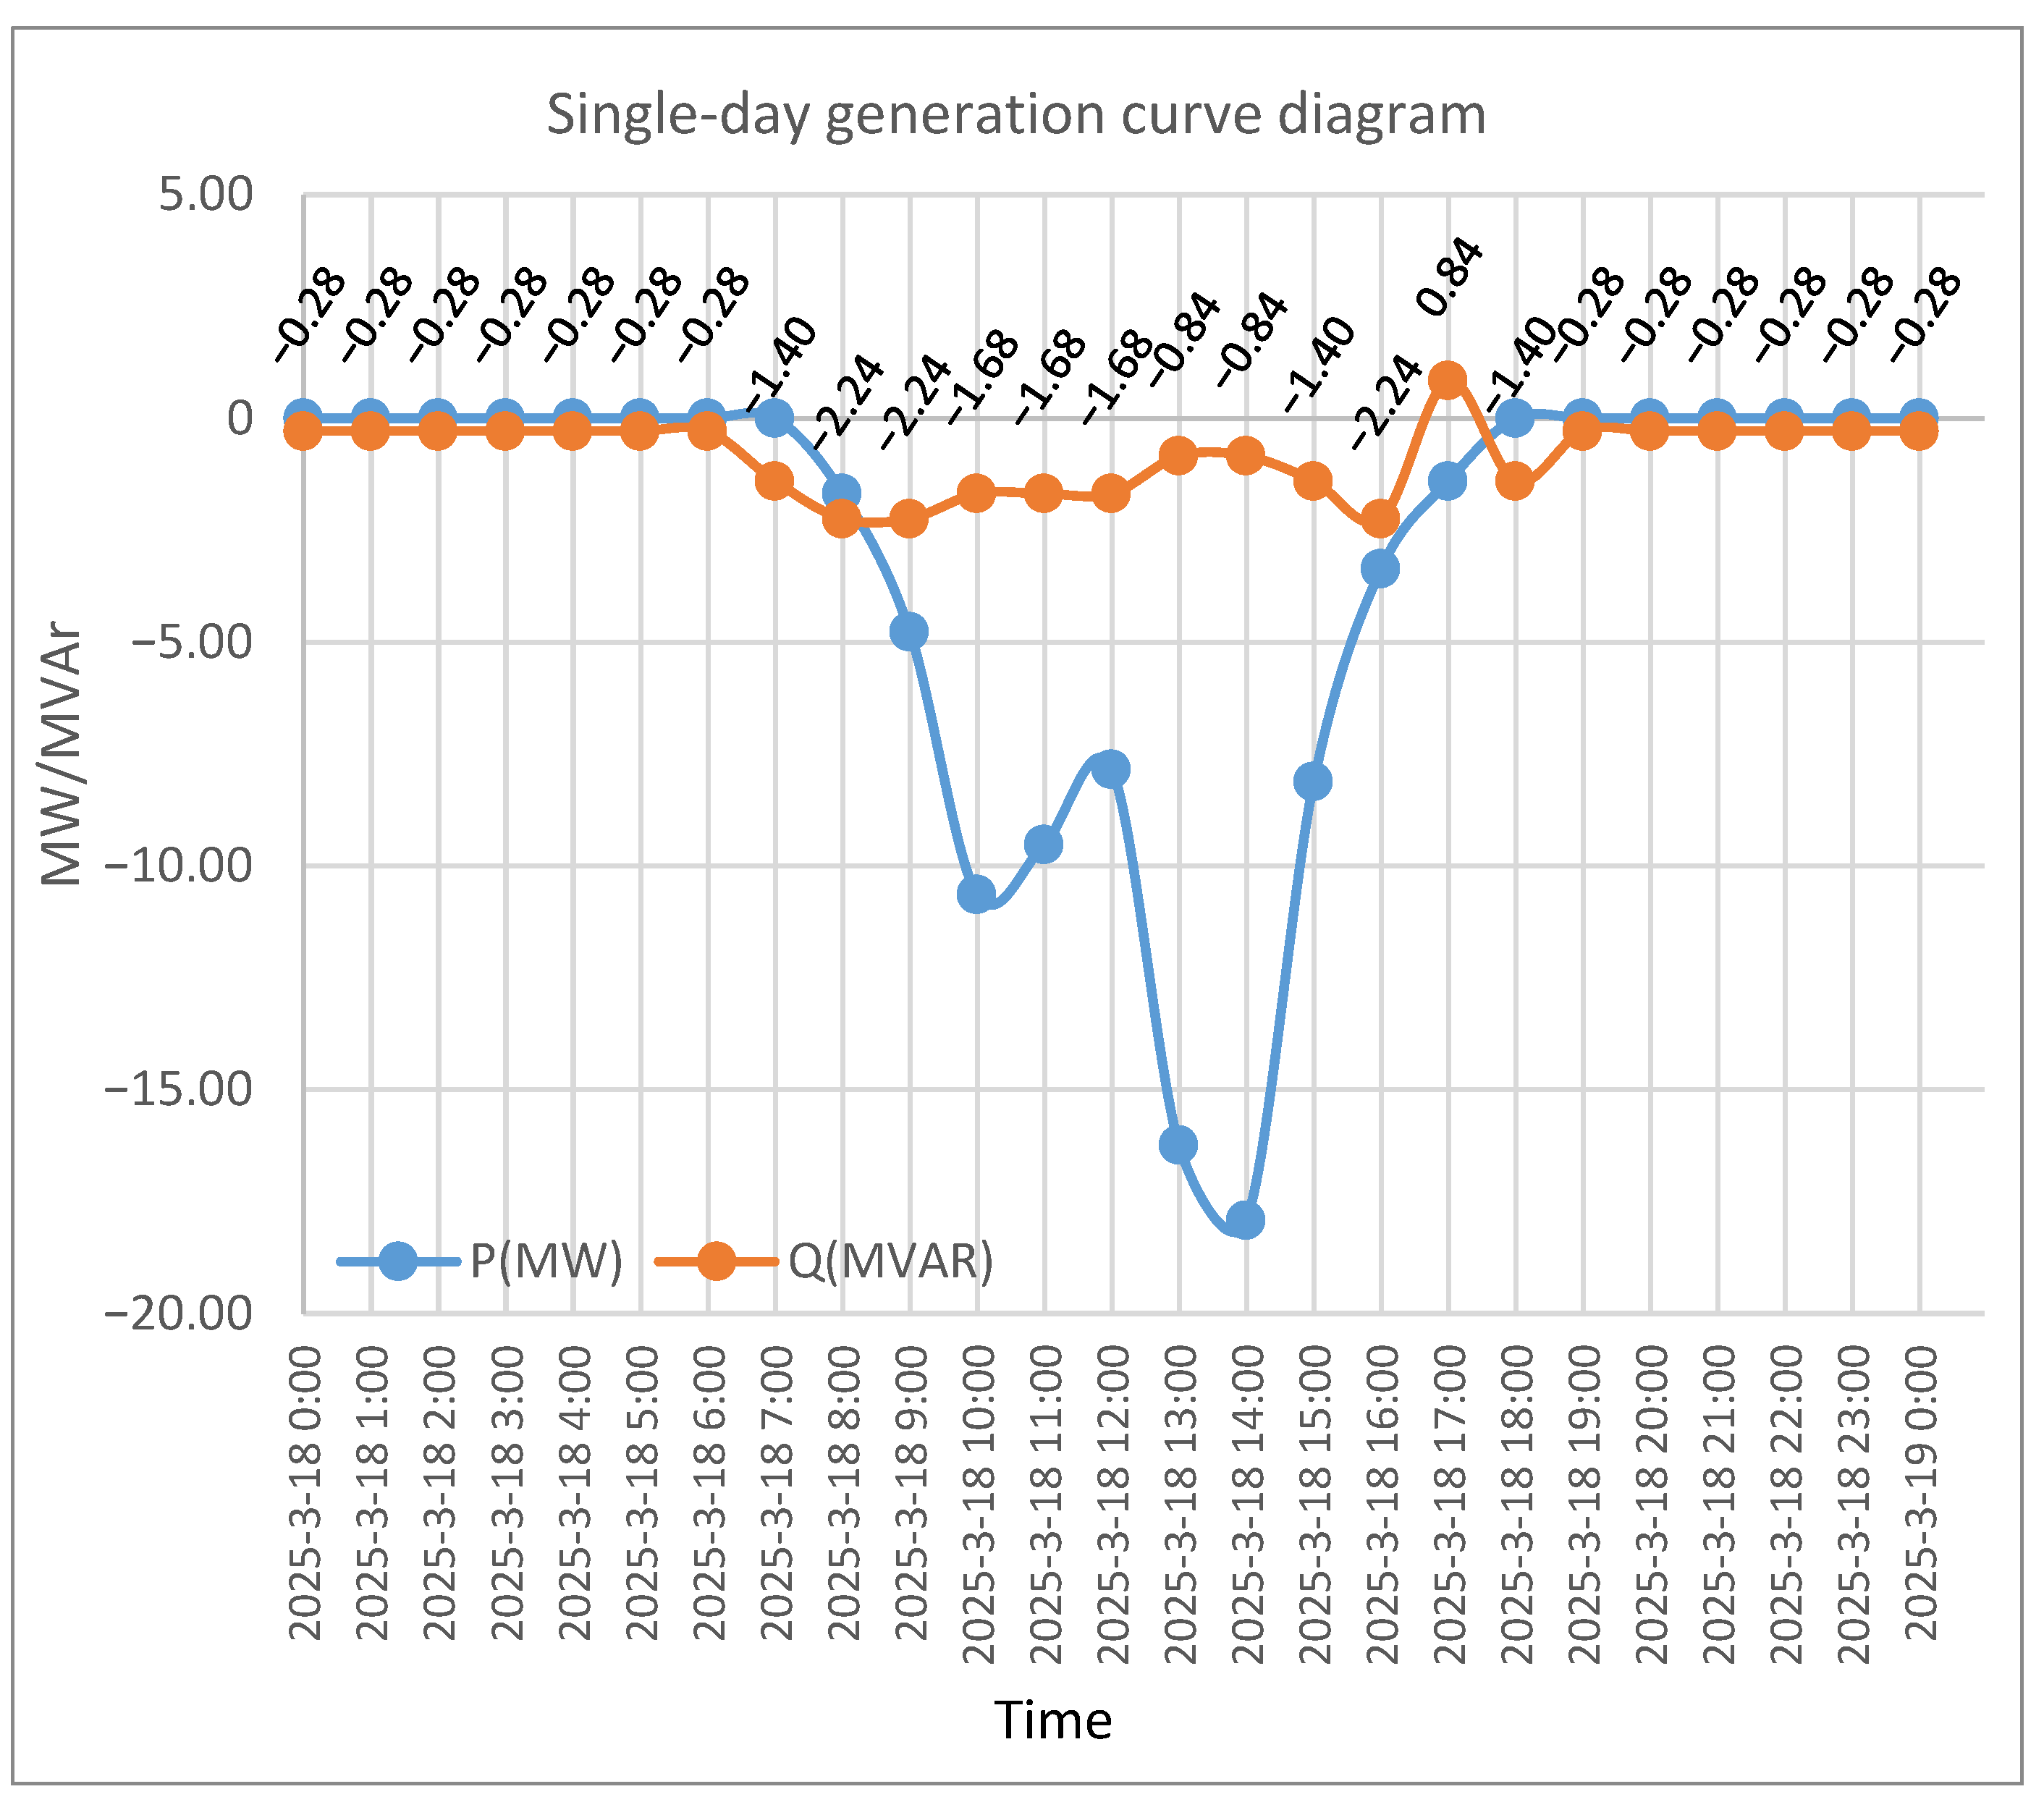
Figure 7.
Figure 7. Inverter Anomaly Detection Scatter Plot.
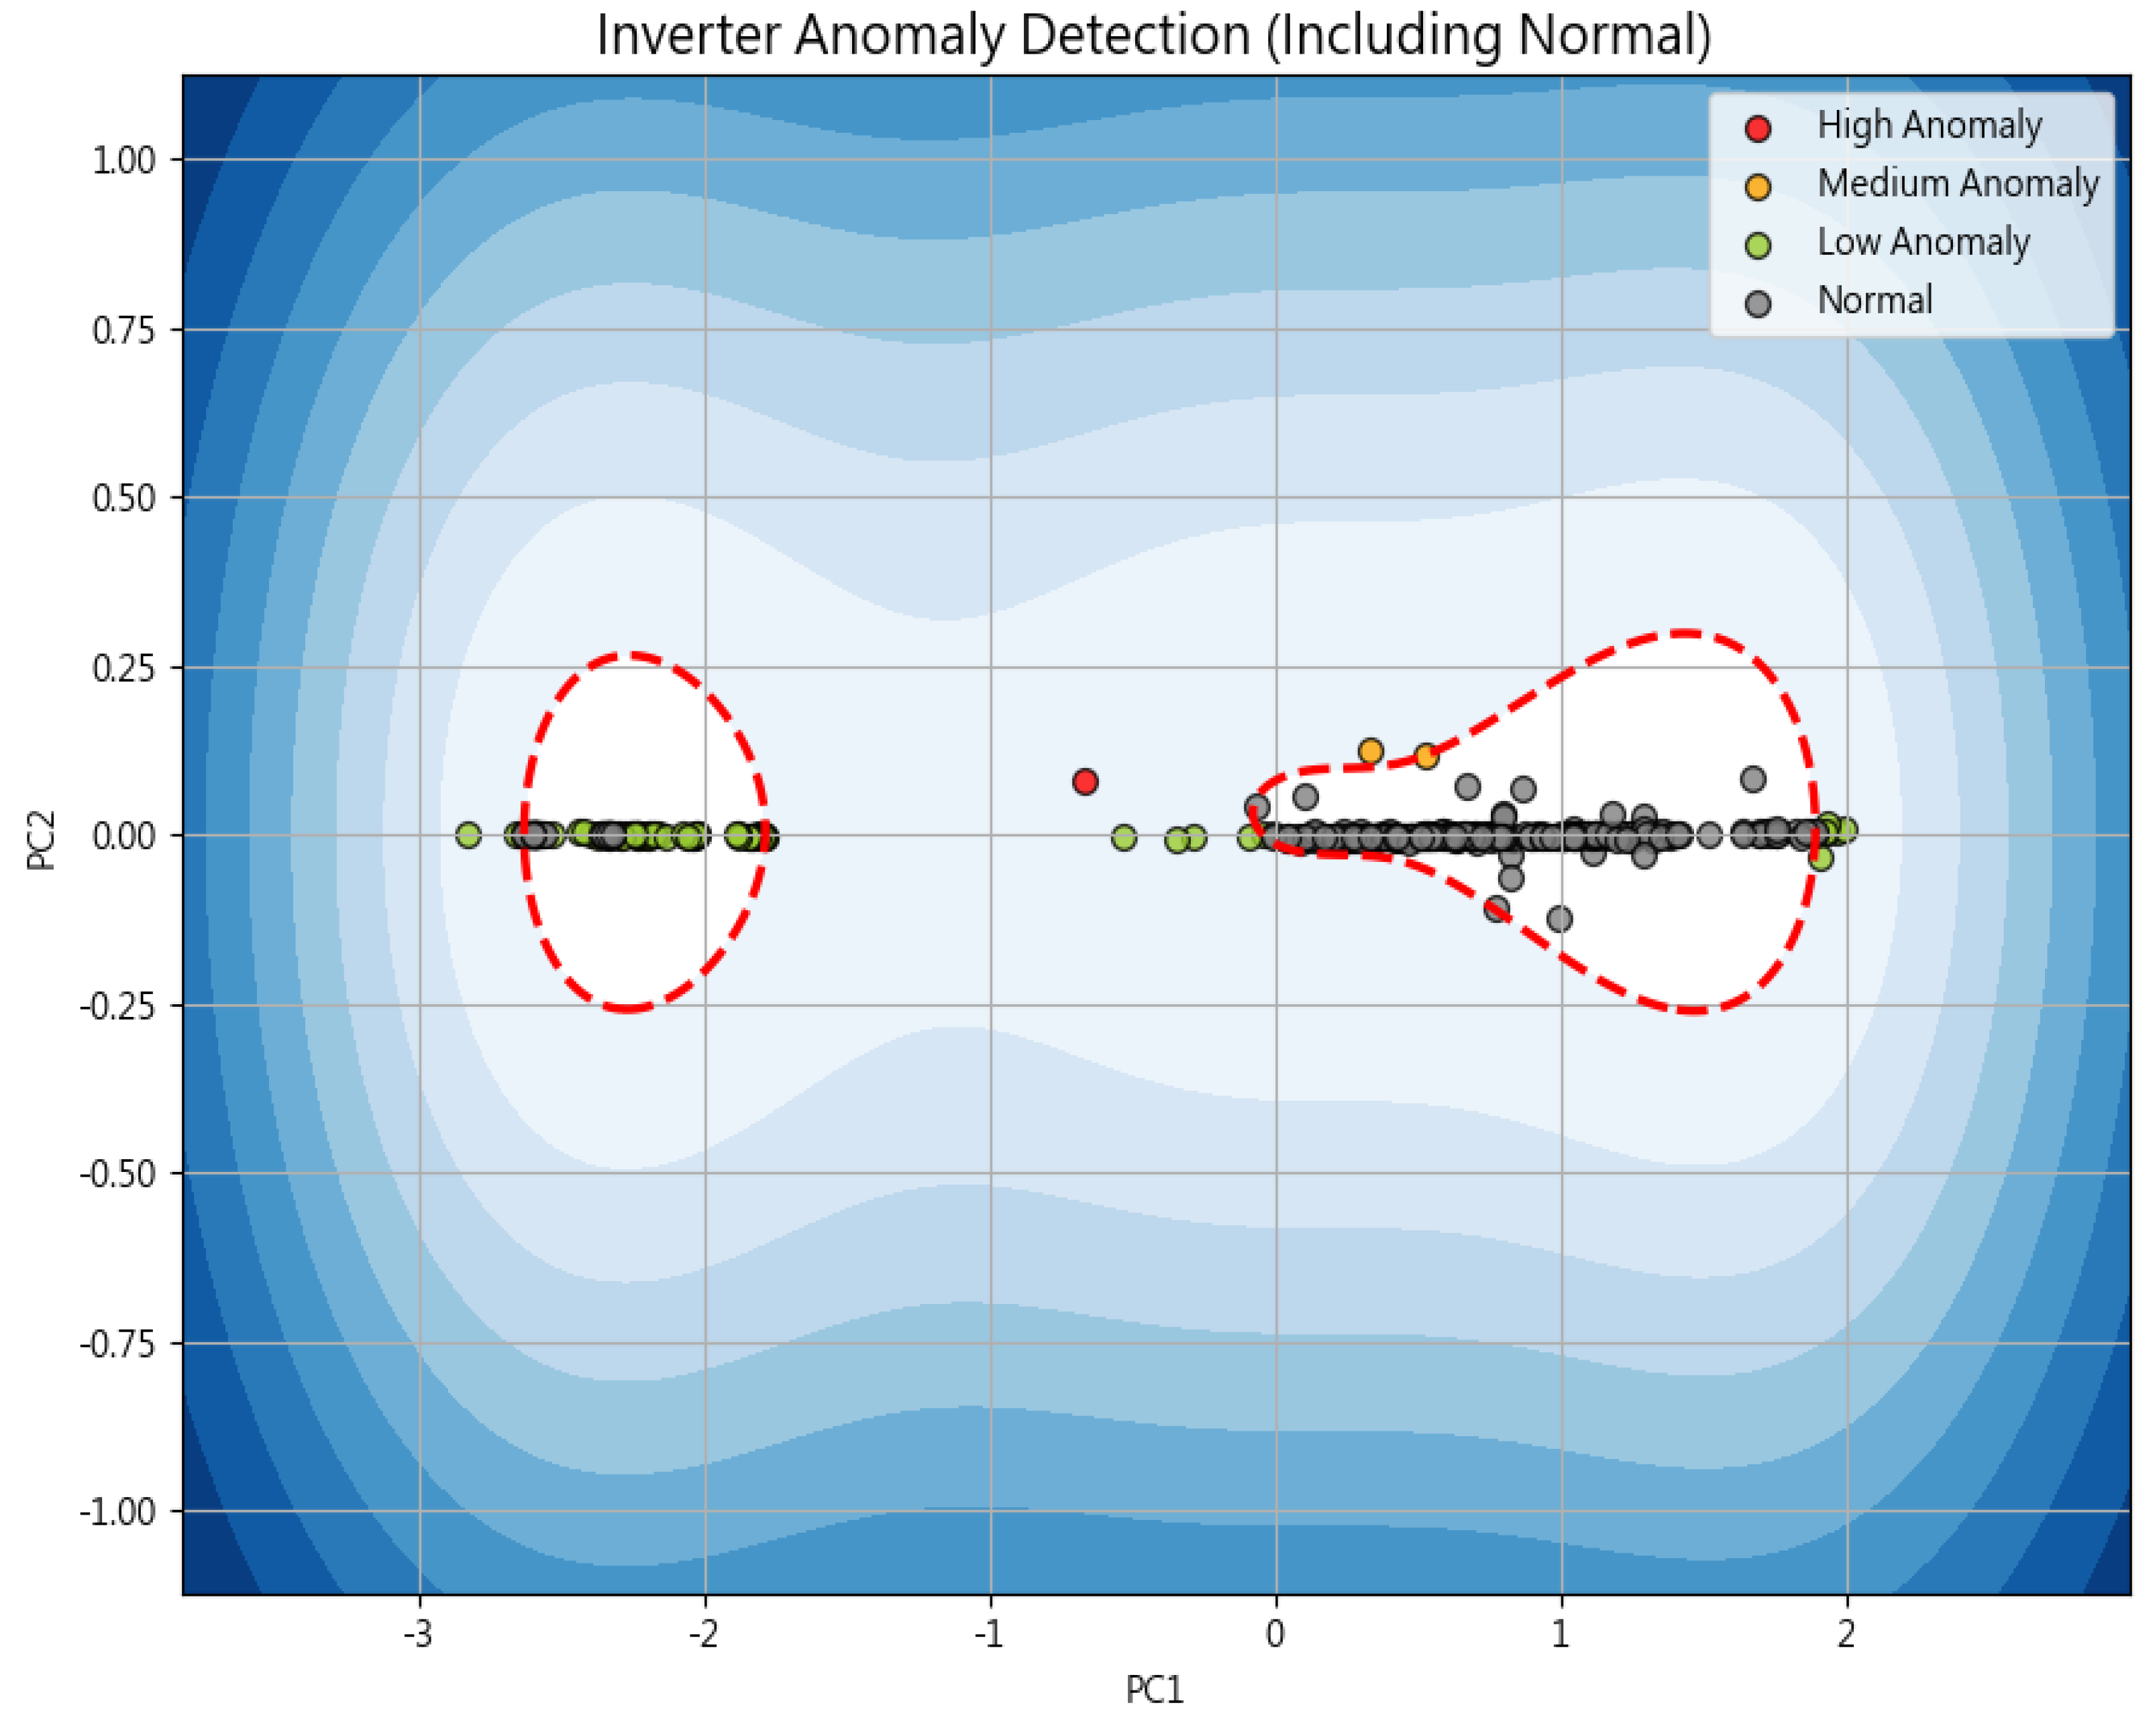
Figure 8.
Improved Reactive Power Curve (data source: Taipower SCADA).
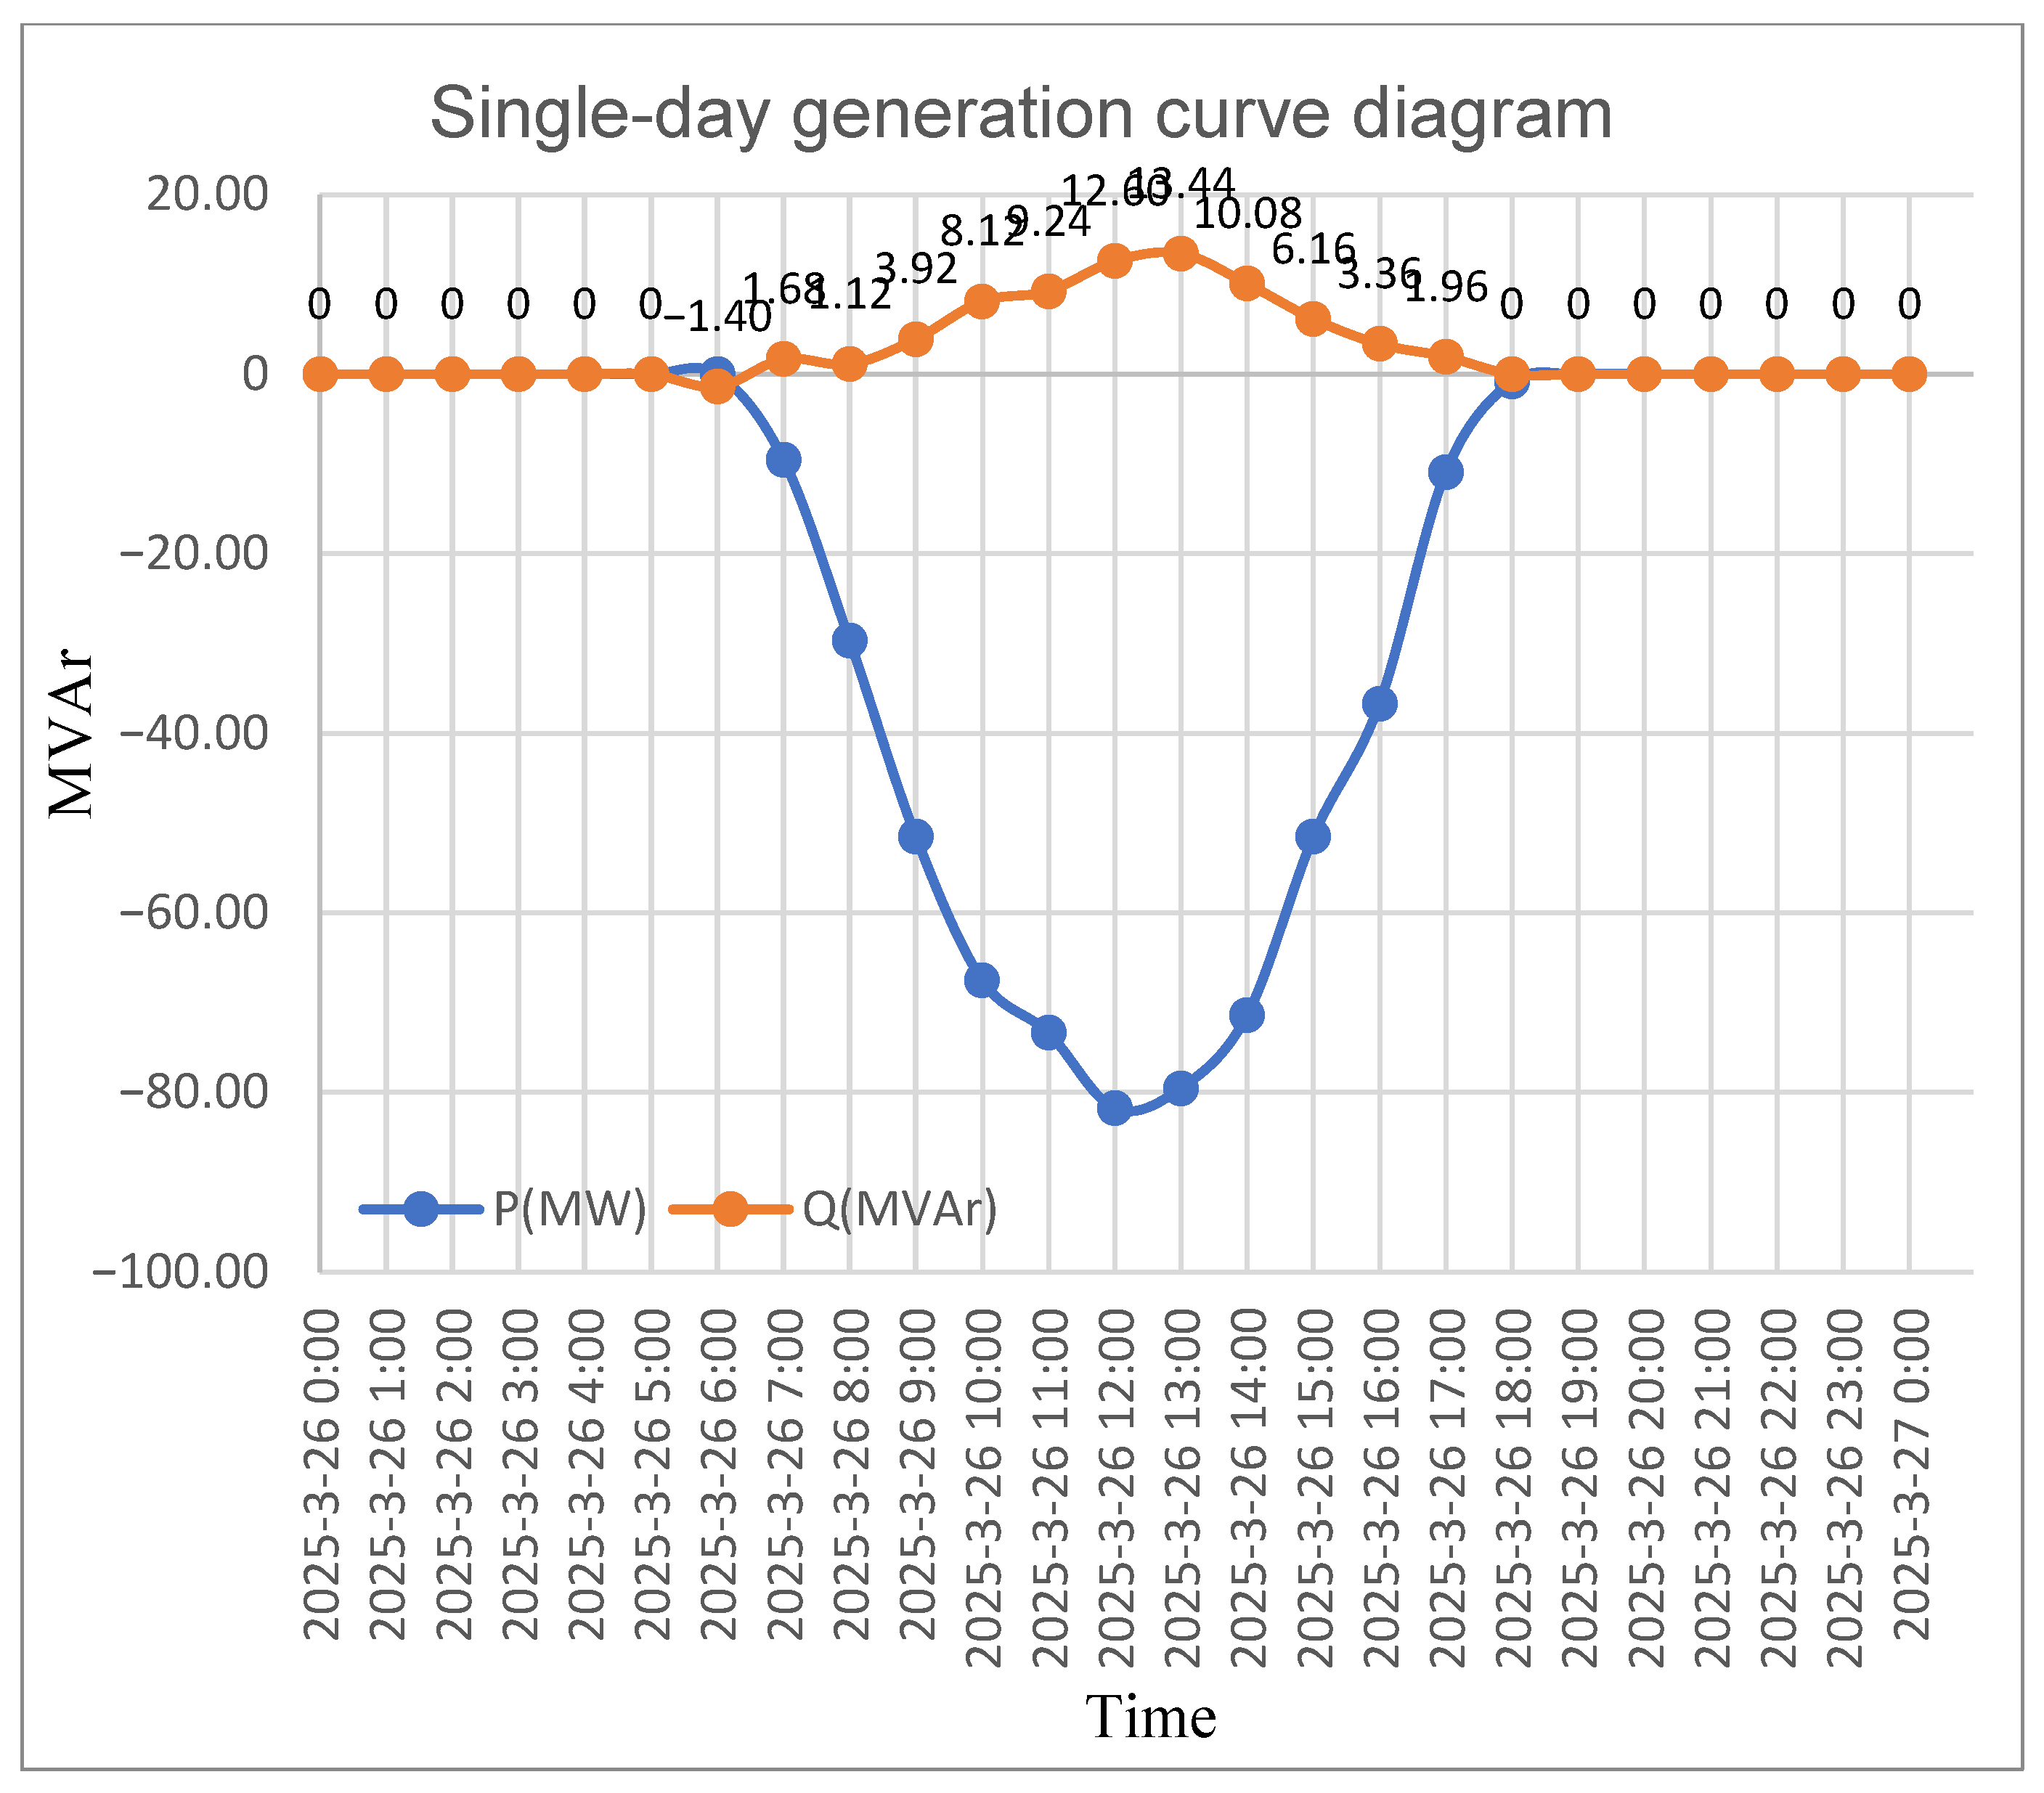
Figure 9.
Comparison of Anomaly Detection Results between OCSVM and Isolation Forest.
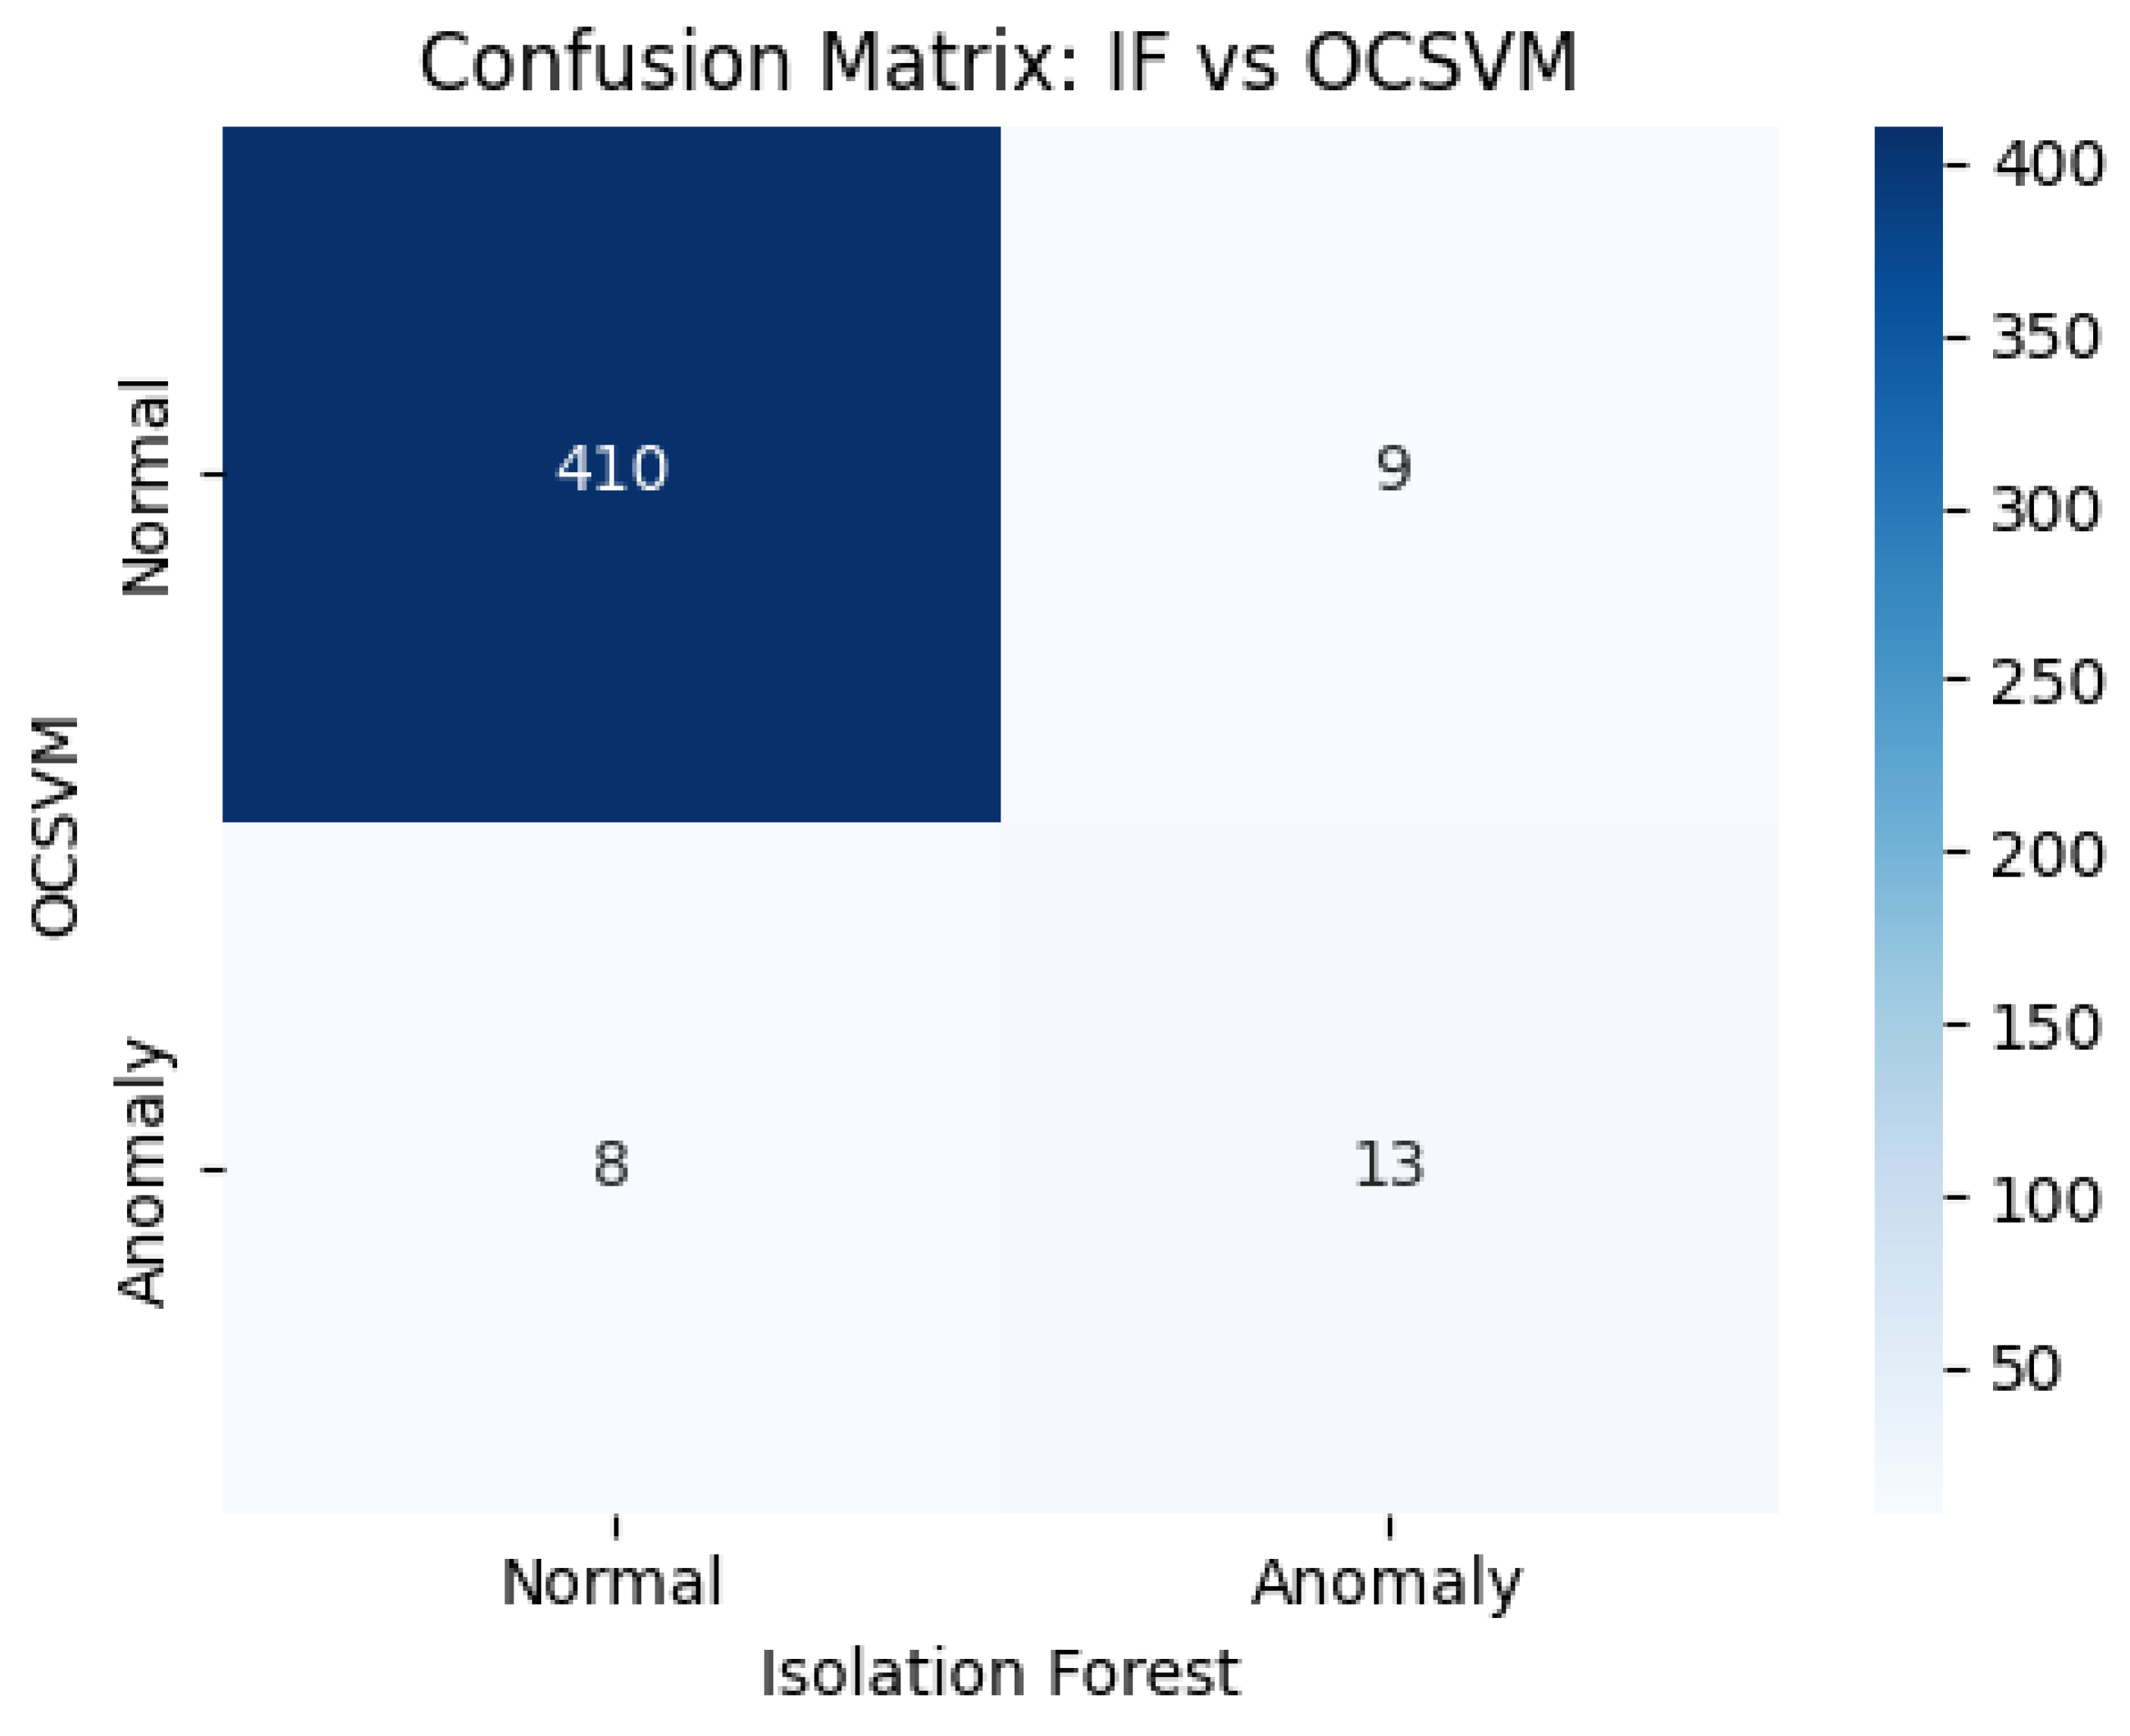

Table 1.
Detected anomalies in multitask PV-STATCOM inverters using the proposed PCA–OCSVM framework.
Table 1.
Detected anomalies in multitask PV-STATCOM inverters using the proposed PCA–OCSVM framework.
| Inverter id |
DC_Power kW |
AC_Power kW |
AC_Voltage V |
AC_DC Ratio |
AC_Ratio Change |
AC_Change Anomaly |
PC1 | PC2 | OCSVM Anomaly |
AC_DC Anomaly |
Anomaly Level |
| A27_12 | 70.13 | 66.7 | 382.2 | 0.951 | 1.020 | FALSE | 0.526 | 0.118 | TRUE | TRUE | Medium |
| A27_16 | 68.22 | 64.69 | 378.3 | 0.948 | 0.970 | FALSE | 0.338 | 0.125 | TRUE | TRUE | Medium |
| A31_23 | 57.1 | 54.74 | 383.4 | 0.959 | 0.775 | TRUE | -0.670 | 0.079 | TRUE | TRUE | High |
Disclaimer/Publisher’s Note: The statements, opinions and data contained in all publications are solely those of the individual author(s) and contributor(s) and not of MDPI and/or the editor(s). MDPI and/or the editor(s) disclaim responsibility for any injury to people or property resulting from any ideas, methods, instructions or products referred to in the content. |
© 2025 by the authors. Licensee MDPI, Basel, Switzerland. This article is an open access article distributed under the terms and conditions of the Creative Commons Attribution (CC BY) license (http://creativecommons.org/licenses/by/4.0/).
Copyright: This open access article is published under a Creative Commons CC BY 4.0 license, which permit the free download, distribution, and reuse, provided that the author and preprint are cited in any reuse.


