
Submitted:
27 October 2025
Posted:
29 October 2025
You are already at the latest version
Abstract
Bidirectional electric vehicle (EV) charging represents an opportunity to leverage EVs as flexible energy assets within the power system. By enabling controlled power flow in both directions, bidirectional charging unlocks a wide range of grid services, thereby enhancing grid stability as the energy sector decarbonizes. This paper presents a comprehensive experimental evaluation of bidirectional charging systems (EVCS), focusing on response dynamics and controllability delays critical for grid services. Tests were conducted with a real ISO 15118-20-enabled EV and an EV emulator across configurations, using the Watt & Well 20 kW bidirectional charging bay. The study compares CCS2 and CHAdeMO protocols under varying configuration conditions. Results show that modern chargers achieve sub-second responsiveness, with local communication delays typically below 0.4 seconds and ramping times around 0.5 s. However, power flow reversals introduce an additional delay of approximately 1 s. These updated controllability metrics are essential for validating bidirectional charging in time-critical applications such as primary frequency regulation. The findings highlight the influence of voltage level and modular configuration on dynamic performance, underscoring the need to integrate external control path delays for full-stack validation. This work provides a foundation for modeling and deploying bidirectional EVCS in fast-response grid services.
Keywords:
Vehicle-to-Grid (V2G)
; electric vehicle charging
; CHAdeMO
; CCS2
; response dynamics
; charging infrastructure
; grid services
; bidirectional charging
1. Introduction
The global automotive landscape is experiencing a rapid and transformative shift towards electric vehicles (EVs), driven by environmental concerns [1] and technological advancements [2]. The decarbonization of the energy grid is increasingly recognized as vital, with electric vehicles playing a crucial role in this transition [3]. EVs are often stationary for significant periods of time [4], which represents an opportunity to use their batteries as flexible energy resources when connected to the grid [5,6].
Bidirectional charging is essential for realizing this potential, allowing EVs to contribute to the grid beyond merely fulfilling transportation needs. The functionality extends valuable flexible consumer services [7,8] beyond flexibly charging the energy need for transportation [9]. This research specifically focuses on understanding and mitigating control delays within state-of-the-art bidirectional charging systems.
The integration of EVs into grid services requires a sophisticated control architecture, illustrated in Figure 1. External controllers—such as transmission system operators (TSOs), distribution system operators (DSOs), home energy management systems (HEMS), aggregators, virtual power plants (VPPs), or balancing responsible parties (BRPs)—monitor grid conditions and issue control signals to the electric vehicle charging system (EVCS), which consists of an EV paired with an EVSE, through the charging infrastructure. Acting on real-time measurements requires a fast communication path from the moment the measurement takes place to the moment the action is performed. This requires optimization in all parts of the control loop [10]. Ecosystem architectures which integrates communication between the necessary market participants are currently being developed within projects such as Coalition of the Willing on Bidirectional Charging [11], EU Sustainable Transport Forum [12], International Energy Agency (IEA) task 53—Interoperability of Bidirectional Charging (INBID) [13]. This integrates both the physical measurements and the simplified action flow, as shown in Figure 1, along with monetary and data flows. In this paper, the focus will be on the reaction time of the EVCS to a power setpoint change initiated by an external entity. As shown in Figure 2, the fundamental component of an interoperable infrastructure is the hardware of the combined EVCS.
Bidirectional charging transforms an EV into a versatile energy asset, extending the energy limitations of EVs beyond the coverage of driving needs [14]. A range of applications, from local energy optimization to grid-scale support, have been investigated with both unidirectional [8] and bidirectional [15,16] technology. In Vehicle-to-Grid (V2G) applications, a fleet of electric vehicles can collectively support the stability and efficiency of the electrical grid. This includes providing frequency services to balance supply and demand, such as frequency regulation, offering voltage support to maintain grid quality, and alleviating network stress through congestion management techniques like peak shaving. In contrast, vehicle-to-home/building (V2H, V2B) applications focus on local energy optimization behind the meter. These allow an EV owner to increase the self-consumption of renewable generation on-site or to perform price arbitrage by storing inexpensive off-peak energy and discharging it to power a home or building during high-cost periods.
Depending on the specific use case, the functional requirements of EVs and EVSE must progressively increase. Figure 2 illustrates a development framework outlining the essential steps toward full V2G integration, ranging from basic hardware readiness to complete interoperability with third-party systems. This progression includes hardware capabilities, communication protocols, grid compliance, and interoperability testing. Intermediate stages may already support applications such as Vehicle-to-Load (V2L) and Vehicle-to-Home (V2H), serving as foundational milestones toward comprehensive grid interaction.
Different applications impose distinct response requirements on bidirectional chargers [17,18]. In the DK-2 zone, ancillary services require power adjustment within 1.3 s for FFR, and for FCR-D, a reaction within 2.5 s and 86% of the bid power within 7.5 s. In DK-1, connected to continental Europe, FCR-D requirements are slightly relaxed: initial response within 2 s, 50% within 15 s, and full activation in 30 s [19]. Figure 3 illustrates how faster EVCS response broadens the range of feasible use cases and enhances economic potential. This study evaluates the responsiveness of bidirectional systems to enable broader service participation.
Europe is moving towards standardization with the ‘Combo 2’ combined charging system (CCS2) plug [20,21] and ISO 15118–20 for bidirectional charging [22]. The ISO 15118 standard family defines the communication interface between an Electric Vehicle Communication Controller (EVCC) and a Supply Equipment Communication Controller (SECC), enabling intelligent charging. ISO 15118–1 [23] outlines general use cases, including bidirectional power transfer (BPT), and covers all (open systems interconnection) OSI layers. ISO 15118–2 [24], covering layers 3–7, specifies application-level protocols but omits BPT support. ISO 15118–3 [25] addresses layers 1–2, using Power Line Communication over the Control Pilot pin. The recently released ISO 15118–20 [26] is an updated second generation of Part 2 that adds BPT functionality to the stack. This technical specification diverges from the early bidirectional implementations using CHAdeMO, which in Denmark to this day provides frequency support via normal frequency containment reserve (FCR-N) [27]. This standardization effort, supported by initiatives like the Coalition of the Willing on Bidirectional Charging, the EU Sustainable Transport Forum, D4E, CharIn and IEA Task 53, aims to ensure interoperability and widespread adoption of bidirectional charging technology. Interoperability in the entire ecosystem for EV charging, including bidirectional, is a key goal for a sustainable controllable mass of EVs [28,29]. This paper evaluates the response time of bidirectional hardware compliant with ISO 15118–20, focusing on grid-related performance parameters. The objective is to validate the consistency of the three foundational steps illustrated in Figure 2, thereby advancing toward full interoperability.
This study investigates the dynamic performance of ISO 15118–20 DC chargers to evaluate their applicability to grid services, with a specific focus on:
- Characterizing control delays and response times for various power transitions.
- Observe and characterize EVCS behavior during power flow reversal (PFR) as a fundamental operational aspect of bidirectional chargers.
- Provide black box parameters for further (aggregation) modelling studies.
- Comparison of CCS performance with existing and historic CHAdeMO implementations.
Understanding these characteristics is crucial for evaluating the technology’s capability to deliver fast-response grid services and for designing effective aggregation strategies.
This paper is organized as follows: Section 2 provides an extended background on bidirectional charging standards with CCS2 and CHAdeMO. Section 3 outlines the experimental setup and methodology used to evaluate EVCS response dynamics. Section 4 presents the results, including time-series analyses and key performance indicators across configurations. Section 5 discusses the implications of the findings, including communication delays, ramping behavior, and PFRs. Finally, Section 6 concludes the paper and suggests directions for future research.
2. Extended Background
To contextualize the research objectives, this section provides a background on the fundamental differences of the two bidirectional charging standards mentioned above. Focus will be given to the dynamic communication between the EVCC and the SECC, which allows real-time control capabilities essential for grid service applications.
2.1. CCS2 and ISO 15118–20 DC
ISO 15118–20 defines a client-server communication model for DC charging, where the EVCC acts as the client and the SECC, part of the EVSE, serves as the server. Before initiating active power transfer, several prerequisites must be fulfilled: a secure transport layer security (TLS) 1.3 session, successful session setup, authorization, and completion of DC_ChargeParameterDiscovery and PowerDelivery(Start). Once these steps are completed and the contactors are closed, the system enters dynamic DC mode. In this mode, the SECC is granted more control authority, allowing it to respond to external grid signals while maintaining coordination with the EV. The EVCC cyclically sends DC_ChargeLoopReq messages every 100–500 ms, containing its current status, target values, and operational limits. The SECC responds with DC_ChargeLoopRes, which includes its status, allowed limits, and the proposed EVSETarget.
When an external controller issues a new setpoint, the SECC first validates and stages it based on grid constraints, connector ratings, and ramping policies. This setpoint is not directly applied to the power modules. Instead, the SECC awaits the next cyclic request from the EVCC. Upon receiving it, the SECC embeds the new target in its response. The EVCC then checks feasibility—consulting battery management and thermal systems—and either accepts or rejects the target. If accepted, the SECC applies ramping constraints (e.g., respecting ramping rates) before forwarding the setpoint to the power modules. The modules report actuals and tracking status, and further adjustments may be negotiated through continued message exchange. Figure 4 illustrates this communication flow, emphasizing the layered validation and synchronization required for safe and flexible power transfer in dynamic mode.
2.2. CHAdeMO DC
CHAdeMO has proven its reliability in bidirectional applications through extensive testing and successful real-world deployments [30]. It consistently delivers grid services like frequency regulation and peak shaving [14], with studies such as Zehinno’s confirming its strong performance [31].
CHAdeMO communication operates over the controller area network (CAN) protocol, enabling real-time data exchange between the EV and the EVSE during DC charging. The protocol has the EVSE acting as the controller and the EV as the follower. During an active charging session, the EV continuously sends status messages to the EVSE. Based on this feedback, the EVSE dynamically adjusts the output current and voltage to optimize charging performance and ensure safety.
A cyclic exchange of CAN frames, typically every 100 ms, regulates the power in real-time. The EVSE sends a charging command frame specifying the desired current and voltage, and the EV responds with a charging status frame that confirms whether it can meet the request or requires an adjustment. This loop allows for fine-grained control of the charging power, enabling features like power ramping, thermal management, and state-of-charge-based modulation. For bidirectional power flow, the same communication structure is used to reverse the power flow, with the EVSE requesting discharge parameters and the EV confirming its capability and readiness.
3. Testing Method
To evaluate the dynamic response of a bidirectional EVCS under various control scenarios, a series of controlled experiments were conducted using the Watt & Well bidirectional DC charger in grid-following BPT mode with AC/DC conversion happening off-board. The setup includes two 11 kW Bidirectional Modular Power Unit (BMPU) modules from Watt & Well configured via the peripheral expander board (EVIX) to support both CCS2 with 15118–20 and CHAdeMO protocols. The Keysight Charging Discovery System (CDS) and SL1800A Regenerative DC Emulator were used to emulate an electric vehicle, allowing precise control over battery voltage and communication behavior. Figure 5 shows the physical test setup as deployed during the experiments.
3.1. KPIs for Testing
This paper highlights the power response of a bidirectional EVCS to externally issued setpoint changes entering the system boundary. For fast services, anticipating the delay between issuing a command and observing the response is essential. Figure 6 presents key performance indicators (KPIs) that support detailed modeling, characterize the system’s dynamic behavior, and identify opportunities for improvement within the EVCS.
The KPIs are defined below to measure the system’s performance.
- Communication and Control Delay (): This measures the time from when the system provides a command across the EVCS boundary in Figure 1 until the grid connection of the EVCS shows the first reactions. This parameter signifies the time it takes for the charger to process the setpoint signal and conduct internal coordination between components.
- Converter Ramping Time (): Describes the time required for the charger’s converter to reach the desired output from the previous current . The characteristics of the employed power electronics influence this parameter.
- Converter Ramping Rate (): The rate at which power changes during the ramping phase, used to compare different values. For the sake of simplicity, are used interchangeably where is the battery voltage.
- Total Reaction Time (): The combined time of and , representing the overall delay from when a setpoint is issued until the power output stabilizes.
The response is decomposed into a delay component () and a ramp component (), each stemming from distinct subsystems. Optimizing involves improving communication protocols and high-level control logic, whereas depends on the low-level control of converter hardware. This separation enables targeted optimization and supports linear modeling of EVCS behavior. The delay reflects protocol-dependent communication latency and control system safety margins, whereas hardware dynamics govern the ramp time. This decomposition provides a practical approximation for further analytical modeling.
3.2. Test Procedure
To quantitatively evaluate the KPIs defined in Section 3.1, a standardized test procedure was developed and executed. The test sequence for each run, illustrated in Figure 7, was explicitly designed to generate a comprehensive dataset covering the charger’s dynamic behavior. Drawing inspiration from prior research on CHAdeMO dynamics by Zecchino et al. [31], the sequence is structured to assess performance across various critical scenarios, including simple step changes in the current setpoint, and power flow reversal (PFR) events. A priming period for the run ensures that the previous power flow direction of each step is known. Preliminary tests showed that a 5-second interval between setpoint changes was sufficient to stabilize the current.
Three independent runs were performed for each configuration, ensuring repeatability and identifying potential outliers. The configuration encompassed a range of operational modes and hardware setups to analyze the flexibility and performance of the system under different conditions. It is important to note that while the EV simulator, CDS, allowed for the precise manipulation of voltage to mimic specific battery behaviors, the tests involving real Electric Vehicles (EVs) were subject to the vehicle’s actual battery voltage.
Figure 7 illustrates the setpoint sequence transmitted to the EVCS during each iteration. It should be noted that the two steps RPT to FPT and FPT to RPT perform a PFR as the power flow direction will be changing. What is not so obvious, is that 0 to RPT_1 is also a PFR as the charger, even though it has no active power flow, remains in a state of forward power transfer (FPT) from the previous step until the set point is actioned.
The tested configurations are:
- CDS–400V-S1–11kW: A single BMPU connected through CCS2 to the CDS, at .
- CDS–400V-P2–22kW: Both BMPUs operating in parallel, connected to the CDS at to achieve charging power up to 22 kW.
- CDS–800V-S2–22kW: Both BMPUs operating in series, connected to the CDS at 800V to evaluate high-voltage DC charging performance.
- CDS–575V-S2–22kW: Both BMPUs in a series configuration, connected to the CDS at an intermediate voltage of 575V.
- CDS–575V-S2–10kW: Both BMPUs in series connected to the CDS at 575V, with the EVSE control limiting power to 10 kW.
- EV9–575V-S2–10kW: A real-world test with both BMPUs in series, connected to a Kia EV9 with and via a CCS2 interface, EVSE limiting power to 10 kW.
- LEAF–385V-S1–11kW: A CHAdeMO protocol test using a single BMPU connected to a Nissan Leaf, with and .
was measured before the test runs and assumed constant throughout the 70-second testing period. Based on calculations following the methodology in [32], the voltage deviation due to charging currents is expected to remain within , and the state of charge (SOC) is assumed constant as , as illustrated in Figure 7. The specific hardware components used to realize these test configurations are detailed in the subsequent section.
3.3. Test Setup
The experimental setup consists of three main subsystems: the EVSE (charger), the control system, and the EV. The tests performed revolve around the Watt & Well bidirectional DC charger in multiple configurations connected to both the CDS and different EV, as shown in Figure 8.
The BMPUs are capable of up to 10.5 kW of FPT—charging and 11 kW of reverse power transfer (RPT)—discharging. The converter can operate at up to 500 V DC and up to 30 A of FPT current or 32 A of RPT current [33]. They are connected on the AC side to a 3-phase 400 V grid through a CEE plug, and on the DC side to the EVIX board, which is connected to the EVs through the CCS2 or CHAdeMO connectors. The EVIX board contains contactors modularly configuring the BMPUs in parallel, series or solo connected to either the CCS2 or CHAdeMO DC connections. The power modules are controlled from the electrical vehicle interface (EVI) boards, where A controls the CCS2 connector and B controls the CHAdeMO connector and communicates internally on a CANopen network [34]. The EVI boards are connected to the Raspberry Pi, which runs the sequence described in Figure 7 to send automated signals mimicking the EVI browser graphical user interface (GUI). A PC is further used to provide the initial control of the test, setting power limits, and monitoring the charging process through the provided EVI browser GUI outlined by Sevdari [35].
The KIA EV9, Nissan Leaf, or CDS are then connected to the EVSE. The CDS is a Keysight SL1040A hardware emulator (with the SL1550A EV–EVSE Charging Communication Interface Tester for 15118–20 and SL1800A Regenerative DC Emulator) that mimics the behavior of an EV battery and communicates on the CP line via 15118–20 for these tests. The KIA EV9 and Nissan Leaf are real EVs equipped with CCS2 and CHAdeMO plugs, respectively, and are used to validate the performance of the charger in real-world conditions. The Kia EV9 used for the test was a pre-production version operating with ISO 15118–20.
TLS 1.3 was disabled on both ends during all CCS2 testing, as the required public key infrastructure (PKI) is not yet fully integrated or openly supported by available equipment. While TLS is mandatory for full ISO 15118–20 compliance, its role as a message encryption layer is assumed to have negligible impact on the response dynamics of active power transfer sessions. Although ISO 15118–20 mandates mutual authentication via TLS 1.3 and secure certificate exchange, widespread interoperability is still pending. The PKI ecosystem remains under development, and most OEMs and EVSE manufacturers have yet to implement or expose the necessary certificate management interfaces. [36,37].
3.4. Measurement Setup
The measurement setup was designed to capture both the communication and power flow changes crossing the EVCS boundaries (see Figure 1) in high resolution. For the measurements, a Keysight Oscilloscope is introduced in Figure 9 as the primary measurement device, measuring the DC side current to analyze the direct response of the charging system. The DC current was sampled at 1 kHz, providing high-resolution data of the power flow dynamics. To ensure accurate timing of measurements, the Raspberry Pi sets an output of a general-purpose input/output (GPIO) pin high to trigger the oscilloscope measurement after receiving confirming feedback that the EVI board has received the setpoint change. This approach eliminates potential synchronization uncertainties in the communication chain.
3.5. Post Processing
Post-processing was performed using measurements of GPIO signals and DC currents captured via an oscilloscope. The time points and in Figure 6 were defined as the first and last measurements where the current deviated by more than 5% from the initial () and final () steady-state levels, respectively. Importantly, the absolute deviation was considered, under the assumption that any significant change—regardless of direction—indicates successful communication processing.
4. Results
The results are first presented as time series data from a “representative run” to analyze the dynamics in response to setpoint changes, and then as a broader comparison of the KPIs for the eight different setup configurations chosen.
4.1. Example of Time-Series Analysis of Charging Dynamics
One of the three runs with the CDS and a single BMPU at 400V will now provide general observations on the response dynamics. Figure 10 provides an overview of the raw data from a single test run, showing the GPIO control signal indicating a change in setpoint and the corresponding measured DC current () from the power converters. This comprehensive sequence provides context for the four specific transitions that are isolated and examined in detail in Figure 11. In these figures, the key performance indicators—steady current delay time (), ramp time (), and the total transition time ()—are highlighted to quantify the behavior during each event.
A closer analysis of the transitions reveals a two-stage control response. Upon receiving a new setpoint, the system initiates a coarse adjustment—a distinct, immediate step in current—followed by a series of smaller, discrete steps that gradually reach the target. This stepped ramping behavior indicates internal control logic designed to prioritize responsiveness while avoiding operation in the low-efficiency region below 50% of nominal power [38]. The effect is most evident during transitions from zero power, suggesting the controller is tuned to minimize time spent in inefficient operating zones while maintaining stability.
Interestingly, the dynamics of initiating power transfer from a zero-current state are very similar regardless of direction. The transition to FPT and RPT exhibits comparable response characteristics in Figure 11a,b. This behavior deviates from the typical response observed in AC charging governed by IEC 61851–1 [39], wherein down regulation is faster in modulation. [40]. In this case, the controller treats both commands with equal priority.
However, a significant difference is observed in the communication time () when transitioning between forward and reverse power transfer. As shown in Figure 11c, when a command for RPT follows an FPT phase, there is a substantial of 1.365 s. Conversely, when the command preserves the flow direction, is negligible (Figure 11b,c). This is further supported by the transition shown in Figure 11d, where the initiation of the RPT phase appears to be intentionally delayed. This suggests a hard-coded “safety” or “settling” delay in the control software to ensure that any residual FPT actions have fully ceased before reversing the power flow. Consequently, this safety control can either be found in the KPI from Figure 11c or inherited by the from Figure 11d as the time delay runs simultaneous with the de-powering.
Finally, across all tests, the accuracy and precision at steady state are exceptionally high once the ramping phase is complete. The measured current holds the setpoint with minimal deviation. This high-fidelity internal control is a critical prerequisite for advanced applications and strongly supports the case for using such a charger for grid services, where precise and reliable power modulation is essential.
4.2. KPIs Across Configurations and Step Types
The testing highlights the performance of a modern bidirectional charger with 15118–20 and how the standard compares to CHAdeMO. Tests were performed with varied configurations, either with the CDS replicating various EV battery voltages or with the real EVs (Nissan Leaf on the CHAdeMO and KIA EV9 pre-production software version) to demonstrate real-world applicability. The transitions of power seen in Figure 11 can generally be divided into a steady part and a ramping part , which will now be analyzed in detail separately.
4.2.1. Communication and Control Delays
This section compares the communication and internal control delays of the charger across the seven configurations and eight operational steps. The delays portrayed in Figure 12 show that most are from 0.1 to 0.4 s. Still, specific transitions (0 to RPT_1 and RPT to FPT) show significantly slower results across all configurations.
The transitions are slowest for 0_to_RPT_1 in configurations with a BMPU voltage of 400 V, displaying a 1.4 s delay. This behavior occurs because the EVSE is operating in FPT mode at 0 kW when it receives an RPT command. Before initiating any RPT actions with the converters, the internal control stack enforces a safety measure by first ensuring the system is fully deenergized. Although the system is already at 0 kW, this precaution introduces a delay intended to ensure safe operation during the transition in power flow direction. For the 0 to RPT_1 with a 575 V configuration, the delays are approximately 1.2 s, as the charger performs intermediate actions in the FPT direction (3 A for 0.05 to 0.3 s), triggering the measurements prematurely before transitioning from 0 to the new setpoint in RPT approximately 0.4 s later. This suggests that the intermediate actions observed in the opposite power transfer direction for 575 V reflect a control state that does not influence power flow in configurations where the BMPU operates at 400 V.
To summarize, results show that the average response time is less than 1 s when the power flow direction is unchanged. However, when the direction of the power flow changes, the response times exceed 1 s.
Conclusively, the control of power flow reversals is the most influential factor, as it introduces additional delay, dependent on the voltage level of BMPUs; otherwise, the remains below 0.4 s throughout.
4.2.2. Ramping
The two key ramping KPIs—absolute ramping time () and power ramping rate ()—are shown in Figure 13 and Figure 14. While is included for completeness, the subsequent analysis focuses on as it takes the magnitude of the setpoint change in perspective.
A clear trend emerges in the ramping time data: transitions involving larger current changes (FPR to RPT or vice versa) generally take longer, as expected. However, when considering modular scalability, the system does not behave ideally. For example, configurations such as 11 kW at 400 V, 22 kW at 400 V, and 22 kW at 800 V should theoretically exhibit identical times, as the underlying action performed by each BMPUs is similar. Yet, the data reveals noticeable discrepancies, indicating that the stacking of power modules requires additional actions to be performed. When observing the two 22 kW configurations in Figure 14, the serial stacking (800 V) shows advantages, as the ramping rate is up to 150 % that of a single power module and parallel stacking.
The power ramping rate, illustrated in Figure 14, underscores the impact of the BMPU operating voltage. Systems operating at nominal voltages (400 and 800 V) consistently outperform those at 575 V, which exhibit slower ramping behavior. This reduced responsiveness suggests that optimal performance depends on careful alignment between the power electronics and battery voltage. Notably, the 575 V configuration capped at 10 kW achieved the fastest rate of change during the 0 to RPT_2 transition. However, this isolated result lacks sufficient support from other data points to warrant deeper analysis in this paper. It is also worth noting that the slower observed during the 0 to RPT_1 transition at 575 V reflects a tradeoff with , discussed in the previous section. In this case, the measurement point for was triggered prematurely—0.4 s before the ramping began.
Transitions between FPT and RPT consistently exhibit the slowest ramping rates. The slower control can be attributed to intentional control delays implemented for safe operation, as detailed in Figure 11d with a break of the current ramping at 0 A. The asymmetry between RPT to FPT and FPT to RPT observed in Figure 14 is attributed to a more extended break of the ramping for FPT to RPT steps, but again counteracts the deviations in the observed in Figure 12. This deviation from symmetrical performance may stem from the implementation of the internal control logic, optimized for FPT.
Transitions that ramp down to 0—whether from FPT or RPT—are consistently among the fastest across all configurations, typically completing within 0.25 to 0.53 s. The only notable exception is a 0.9-second ramp observed when two BMPUs operate in parallel. This consistent speed likely stems from the converters’ rapid de-energizing process, which avoids the synchronization and safety delays required during power-up transitions.
To conclude, the longest ramping times are observed in low-voltage, high-power configurations, where the current differential is greatest. These findings underscore the importance of considering both voltage level and control strategy when designing scalable and responsive charging systems.
5. Discussion
To better understand the performance of the EVCS, this section seeks to linearize the temporal response observed in the time series data. The response observed in Figure 11 can be assumed to be piecewise linear, with initial delays caused by communication and control latencies, followed by a ramping phase influenced by configuration and power setpoints. To isolate communication delays and ramping rates, transitions involving power flow reversal (PFR)—as defined in Section 3.2—are excluded from the initial analysis. These PFR transitions deviate significantly from ideal behavior and will be discussed separately. Finally, the difference between the CCS2 and CHAdeMO results will be highlighted and compared to previous research on the same topic.
5.1. Isolating Communication Delay
To determine the pure communication delay, a systematic analysis was performed on the raw measurement data, , which includes both communication and control system latencies. The total measured time, from the dispatch of a control signal to the observed reaction at the converter, encompasses not only the communication between components of the EVSE (Figure 8) but also intentional control delays, which appear to be dependent on the specific type of power transition. To isolate the communication delay (), it is necessary to exclude measurements where control system delays are a significant and variable component, which is seen in PFR transitions.
The remaining measurements, which correspond to transitions that do not involve a PFR, are considered to be representative of the actual communication delay. These filtered data points were then aggregated to compute the mean and coefficient of variation (CV), standard deviation normalized with mean, providing a statistically robust measure of the typical communication latency within the system, provided as in Table 1.
5.2. Converter Ramping Rate
Following the isolation of communication delays, this section focuses on the ramping behavior of the EVCS. The nature of How the power ramping scales is a critical parameter for grid-interactive applications, and understanding its dynamics is essential for accurate modeling and control.
From the data of Figure 14 the performance of the converters alone is summarized into which again excludes the PFR transitions. The converters’ performance is also shown in Table 1 as , and the CCS2 performs 50% better than with the CHAdeMO.
Interestingly, parallel stacking of BMPUs in the 400 V configuration does not lead to a proportional increase in ramping rate. The ramping behavior remains nearly identical to that of a single module, indicating that the ramping rate is not a function of nominal power capacity but rather constrained by shared control logic or communication bottlenecks. This suggests that the system’s ramping capability is limited by factors other than available power hardware, such as internal coordination delays or firmware limitations.
These findings imply that while power scaling through parallelization increases nominal capacity, it does not enhance dynamic response. Therefore, for applications requiring fast power modulation, higher-voltage architectures are preferable.
5.3. Power Flow Reversal Delays
In the previous sections, the additional delays observed for steps including PFR of the converters were neglected. However, the transition from consuming to producing power (or vice versa) is an essential aspect of bidirectional EVSE performance and the results showed a sizeable impact on the dynamics. This performance gap can be attributed to the delay imposed by the multi-layered control stack (Supervisor, Plug Module, Chipset, Power Converter) required for safe and coordinated operation. As the PFR delay is observed in the for 0 to RPT_1 and RPT to FPT, but more pronounced in the for FPT to RPT, we will investigate the overhead PFR time from the complete response time: . With the data availible we can determine the by subtracting of non PFR steps from the three PFR steps:
In Equations (2) and (3) the communication, , is included in both subtractions and thus it is added again as for the given protocol from Table 1. The results of this analysis are summarized in Table 2, which presents the metrics for each configuration. The values indicate the additional time required for the charger to transition between power flow states, highlighting the impact of PFR on overall system responsiveness.
Within the table, the values for are presented for each configuration, showing the time taken to transition between different power flow states. The results indicate that PFR delays, , range from 0 to 1.7 s, depending on the configuration and power level. A horizontal comparison across configurations reveals interesting patterns. For instance, transitions from FPT to RPT appear consistently faster than other transitions.
It is important to note that the observed delays during power flow reversal do not originate from the internal dynamics of the BMPU hardware. According to the BMPU-R2 specification datasheet [33], the total delay from receiving a CANbus message to reaching a new setpoint is at most 750 ms, independent of the magnitude or direction of the setpoint change. This strongly suggests that the additional delay observed during PFR transitions is a system-level phenomenon, primarily governed by the SECC controller and the layered communication logic (Supervisor, Plug Module, Chipset, Power Converter) of the specific charger. This interpretation is further supported by the fact that configurations involving stacked BMPUs—requiring more coordination across modules—exhibit the longest PFR delays, indicating that synchronization and supervisory control overheads are the dominant contributors.
5.4. Comparison with CHAdeMO
Table 1 compares dynamic performance of the Watt & Well charger operated with CCS2 and CHAdeMO, and positions these results against previous studies [31]. Overall, both the modern communication stacks show improvements over the 2018 CHAdeMO 10 kW Magnum Cap V2G system as is reduced from 4 s to approximately 0.4–0.5 s. Similarly, the ramping capability has increased even when considering the higher nominal power of the Watt & Well charger, indicating substantial advances in controller design and implementation. Between the two protocols, CCS2 exhibits less communication-related latency and a faster power ramping capability. Despite the isolated calculations of parameters, the overall transition time is essentially identical, as CCS2 also includes measurements with both power modules spanning a 42 kW range, which both yield a higher change in power and a notably longer PFR interval. This also explains why its communication and conversion advantages do not translate into a shorter total time, .
Looking at the coefficients of variations, it can be observed that there is an overall slightly higher variation in the CCS2, since six different configurations are considered, whereas CHAdeMO only includes one. Communication and delay CVs are near unity for both protocols, reflecting the cyclic communication initiation actions discussed peviously. By contrast, CCS2’s PFR CV (0.312) is substantially lower than CHAdeMO’s (0.679), suggesting tighter cyclic communication between the EVCC and SECC. Still, the dominant trend is clear: modern implementations dramatically outperform early systems, with CCS2 trading faster communication and stronger converter ramps for a longer, but more consistent, PFR phase. Yet, the most notable improvements stem from refined converter control, reflecting the intense research and development efforts in recent years [41].
These findings have important implications for grid-interactive applications. The reduced communication delays and enhanced ramping capabilities of modern EVCS enable more responsive and reliable participation in ancillary services. However, the inherent PFR delays must be carefully considered in system design and operation, as they represent a non-negligible overhead that can impact overall responsiveness. Future work should explore strategies to mitigate PFR delays, potentially through the use of advanced control algorithms or hardware optimizations, to further enhance the dynamic performance of EVCS.
5.5. Discussion of Method
The experimental method provided clear and reproducible insights into EVCS dynamics, but it has limitations that affect interpretation. Most critically, the timing reference relies on the Raspberry Pi pulling a GPIO high only after it receives confirmation that the EVI accepted the setpoint. Consequently, the measured delay represents a lower bound, as the actual communication latency can be higher. Adding round-trip timing measurements at both ends would provide an accurate decomposition of pure communication latency.
The measurements were intentionally focused on the DC side to capture the converters’ direct response. For grid-level implications, however, AC-side current and real-time battery voltage levels should also be recorded. AC measurements quantify auxiliary and conversion losses, and simultaneous voltage logging enables precise power calculations, eliminating the need to assume a constant battery voltage.
Test coverage and protocol comparisons can be strengthened. The current procedure uses a limited set of step sizes and primarily full power transitions. Including a broader range of intermediate setpoints will reveal startup and nonlinear behaviors. Voltage levels significantly affect ramping rates; future experiments should standardize voltage and power caps when comparing CCS2 and CHAdeMO (for example, repeat 400 V and 575 V tests with identical 10 kW limits) to decouple protocol effects from operating point differences. Likewise, evaluating series/parallel BMPU stacking under identical constraints will clarify scaling behaviors.
Finally, the CDS emulator performed closely to a real EV in these tests; however, broader validation across various vehicle types and states of charge is recommended before generalizing the results. Implementing these refinements will enhance accuracy, facilitate fairer protocol comparisons, and enhance the applicability of conclusions for grid services.
6. Conclusions
This paper has presented a detailed experimental analysis of bidirectional electric vehicle charging systems, focusing on the dynamic response characteristics of a Watt & Well charger operating under ISO 15118–20 via CCS2 and CHAdeMO interfaces. The study provides updated and validated measurements of bidirectional charging controllability delays, including communication latency, ramping behavior, and power flow reversal (PFR) overheads. These results significantly advance the understanding of charger responsiveness and offer a refined basis for modeling and validating bidirectional charging systems in time-critical grid applications.
The measured delays—typically below 0.4 s for communication and around 0.5 s for ramping—demonstrate that modern bidirectional chargers are capable of sub-second responsiveness. However, transitions involving a PFR were found to introduce an additional delay of approximately 1 s. These updated controllability metrics are particularly relevant for time-critical services such as primary frequency regulation, where rapid and predictable power modulation is essential. Future work should extend this analysis by integrating external control path delays—including those from aggregators, EMS, and grid operators—which were not considered in this study but are crucial for full-stack validation of grid service readiness.
The comparative evaluation of CCS2 and CHAdeMO implementations reveals that while CCS2 offers lower communication latency and stronger ramping performance, overall transition times remain similar due to protocol-specific control logic and hardware configurations. These findings underscore the importance of standardized testing across voltage levels and power caps to isolate protocol effects from hardware-dependent behavior. Future studies should explore protocol performance under harmonized operating conditions, including intermediate setpoint changes of various nature, to better understand nonlinear control dynamics and optimize system responsiveness. Moreover, the results highlight the influence of battery voltage and converter configuration on dynamic performance. Operating at nominal voltages yields faster ramping and lower delays, while deviations from nominal conditions introduce control overheads. This suggests that future charger designs should prioritize voltage adaptability and modular control strategies to ensure consistent performance across diverse EV platforms. Additionally, testing with a broader range of EV models and states of charge will be essential to validate the generalization of these findings and support the development of scalable, interoperable V2G ecosystems.
Finally, the study confirms that the ISO 15118–20 standard provides a robust framework for enabling bidirectional charging and dynamic grid integration. The refined controllability delays presented here offer a valuable reference for both real-time modeling and system-level validation. As the EV charging ecosystem evolves, future developments should focus on mitigating PFR delays through advanced control algorithms and firmware enhancements. This transition is essential, as the CHAdeMO protocol is being phased out and all modern vehicles now adopt the CCS2 interface. Furthermore, CCS2 combined with ISO 15118–20 is becoming a legal requirement within the EU, reinforcing the urgency of this shift. However, despite the transition, widespread deployment is still pending, as most EVs and chargers have yet to implement the standard and expose applications using the public key infrastructure required for TLS 1.3.
Author Contributions
Conceptualization, K.L.P., K.S. and M.M.; methodology, R.M.K. and K.L.P.; software, R.M.K. and K.L.P.; validation, K.L.P. and K.S.; formal analysis, K.L.P; investigation, R.M.K., K.L.P. and K.S.; resources, K.S.; data curation, K.L.P.; writing—original draft preparation, K.L.P.; writing—review and editing, R.M.K. and M.S.; visualization, K.L.P.; supervision, M.M. and K.S.; project administration, M.M. and K.S.; funding acquisition, M.M. All authors have read and agreed to the published version of the manuscript.
Funding
The work in this paper is supported by the research projects EV4EU (Horizon Europe grant no. 101056765) and FLOW (Horizon Europe grant no. 101056730).
Data Availability Statement
Data available upon request.
Acknowledgments
The authors thank Jan Karens and Robert Italiaander from ElaadNL, Redha Meghnous, and Nadim Sakr from Watt & Well for helping on such a testing campaign. During the preparation of this manuscript, the authors used Copilot GPT-5 to refine the language, improve clarity, and correct grammar. The authors have reviewed and edited the output and take full responsibility for the content of this publication.
Conflicts of Interest
The authors declare no conflict of interest. The funders had no role in the design of the study; in the collection, analyses, or interpretation of data; in the writing of the manuscript; or in the decision to publish the results.
References
- BloombergNEF. Electric Vehicle Outlook. Technical report, BloombergNEF, 2025.
- Muratori, M.; Alexander, M.; Arent, D.; Bazilian, M.; Cazzola, P.; Dede, E.M.; Farrell, J.; Gearhart, C.; Greene, D.; Jenn, A.; et al. The Rise of Electric Vehicles—2020 Status and Future Expectations. Progress in Energy 2021, 3, 022002. [Google Scholar] [CrossRef]
- Waldron, J.; Rodrigues, L.; Gillott, M.; Naylor, S.; Shipman, R. The Role of Electric Vehicle Charging Technologies in the Decarbonisation of the Energy Grid. Energies 2022, 15, 2447. [Google Scholar] [CrossRef]
- Thingvad, A.; Andersen, P.B.; Unterluggauer, T.; Træholt, C.; Marinelli, M. Electrification of Personal Vehicle Travels in Cities - Quantifying the Public Charging Demand. eTransportation 2021, 9, 100125. [Google Scholar] [CrossRef]
- Altin, N.; Sarp, M. Review on Vehicle-to-Grid Systems: The Most Recent Trends and Smart Grid Interaction Technologies. Gazi University Journal of Science 2020, 33, 394–411. [Google Scholar] [CrossRef]
- Gonzalez Venegas, F.; Petit, M.; Perez, Y. Active Integration of Electric Vehicles into Distribution Grids: Barriers and Frameworks for Flexibility Services. Renewable and Sustainable Energy Reviews 2021, 145, 111060. [Google Scholar] [CrossRef]
- García-Villalobos, J.; Zamora, I.; San Martín, J.; Asensio, F.; Aperribay, V. Plug-in Electric Vehicles in Electric Distribution Networks: A Review of Smart Charging Approaches. Renewable and Sustainable Energy Reviews 2014, 38, 717–731. [Google Scholar] [CrossRef]
- Pedersen, K.L.; Striani, S.; Engelhardt, J.; Marinelli, M. Implementation of Priority-Based Scheduling for Electric Vehicles through Local Distributed Control. In Proceedings of the 2024 IEEE PES Innovative Smart Grid Technologies Europe (ISGT EUROPE). IEEE, 2024, pp. 1–5. [CrossRef]
- Rietmann, N.; Hügler, B.; Lieven, T. Forecasting the Trajectory of Electric Vehicle Sales and the Consequences for Worldwide CO2 Emissions. Journal of Cleaner Production 2020, 261, 121038. [Google Scholar] [CrossRef]
- Zunino, P.; Engelhardt, J.; Striani, S.; Pedersen, K.L.; Marinelli, M. Frequency Control in EV Clusters: Experimental Validation and Time Response Analysis of Centralized and Distributed Architectures. In Proceedings of the 2024 IEEE PES Innovative Smart Grid Technologies Europe (ISGT EUROPE). IEEE, 2024, pp. 1–5. [CrossRef]
- Funke, A.; Kaltwasser, A.; Schmitt, L.; Adelhardt, C.; Enggaard, C.E.; Simon, L.; Gaytandjiev, A.; Guttenberg, L.; Subiron, S.; Matta, J.; et al. Joint Report. Technical Report 1, Coalition of the willing on bidirectional charging, 2024.
- European Commission. Directorate General for Mobility and Transport. Mapping of the Discussion Concerning Standards and Protocols for Communication Exchange in the Electromobility Ecosystem.; Publications Office, 2022.
- IEA Task 53 – Interoperability of Bidirectional Charging.
- Thingvad, A.; Calearo, L.; Andersen, P.B.; Marinelli, M.; Neaimeh, M.; Suzuki, K.; Murai, K. Value of V2G Frequency Regulation in Great Britain Considering Real Driving Data. In Proceedings of the 2019 IEEE PES Innovative Smart Grid Technologies Europe (ISGT-Europe). IEEE, 2019, pp. 1–5. [CrossRef]
- O’Malley, C.; Badesa, L.; Teng, F.; Strbac, G. Frequency Response From Aggregated V2G Chargers With Uncertain EV Connections. IEEE Transactions on Power Systems 2022, pp. 1–14. [CrossRef]
- Dagdougui, H.; Ouammi, A.; Dessaint, L.A. Peak Load Reduction in a Smart Building Integrating Microgrid and V2B-Based Demand Response Scheme. IEEE Systems Journal 2019, 13, 3274–3282. [Google Scholar] [CrossRef]
- Mohandes, B.; Moursi, M.S.E.; Hatziargyriou, N.; Khatib, S.E. A Review of Power System Flexibility With High Penetration of Renewables. IEEE Transactions on Power Systems 2019, 34, 3140–3155. [Google Scholar] [CrossRef]
- Hu, J.; Morais, H.; Sousa, T.; Lind, M. Electric Vehicle Fleet Management in Smart Grids: A Review of Services, Optimization and Control Aspects. Renewable and Sustainable Energy Reviews 2016, 56, 1207–1226. [Google Scholar] [CrossRef]
- Energinet. Prequalification of Units and Aggregated Portfolios v. 2.1.3 Feb. 2025.
- IEC 62196-3:2024 - Plugs, Socket-Outlets, Vehicle Connectors and Vehicle Inlets – Conductive Charging of Electric Vehicles – Part 3: Dimensional Compatibility Requirements for DC and AC/DC Pin and Contact-Tube Vehicle Couplers.
- European Parliment. Regulation (EU) 2023/1804 of the European Parliament and of the Council of 13 September 2023 on the Deployment of Alternative Fuels Infrastructure, and Repealing Directive 2014/94/EU.
- European Commission. EC 2025/656 of 2 April 2025 Amending Regulation (EU) 2023/1804 of the European Parliament and of the Council as Regards Standards for Wireless Recharging, Electric Road System, Vehicle-to-Grid Communication and Hydrogen Supply for Road Transport Vehicles.
- ISO 15118-1:2019 - Road Vehicles - Vehicle to Grid Communication Interface - Part 1: General Information and Use-Case Definition.
- ISO 15118-2:2016 - Road Vehicles - Vehicle-to-grid Communication Interface Part 2: Network and Application Protocol Requirements.
- ISO 15118-3:2016 - Road Vehicles – Vehicle to Grid Communication Interface – Part 3: Physical and Data Link Layer Requirements.
- ISO 15118-20:2022 - Road Vehicles – Vehicle to Grid Communication Interface Part 20: 2nd Generation Network Layer and Application Layer Requirements.
- Andersen, P.B.; Hashemi, S.; Sousa, T.; Soerensen, T.M.; Noel, L. Cross-Brand Validation of Grid Services Using V2G-enabled Vehicles in the Parker Project. In Proceedings of the Proceedings of 31st International Electric Vehicles Symposium & Exhibition & International Electric Vehicle Technology Conference 2018. IEEE, 2018.
- Powell, S.; Cezar, G.V.; Min, L.; Azevedo, I.M.L.; Rajagopal, R. Charging Infrastructure Access and Operation to Reduce the Grid Impacts of Deep Electric Vehicle Adoption. Nature Energy 2022, 7, 932–945. [Google Scholar] [CrossRef]
- Zentani, A.; Almaktoof, A.; Kahn, M.T. A Comprehensive Review of Developments in Electric Vehicles Fast Charging Technology. Applied Sciences 2024, 14, 4728. [Google Scholar] [CrossRef]
- Kempton, W.; Tomić, J. Vehicle-to-Grid Power Implementation: From Stabilizing the Grid to Supporting Large-Scale Renewable Energy. Journal of Power Sources 2005, 144, 280–294. [Google Scholar] [CrossRef]
- Zecchino, A.; Thingvad, A.; Andersen, P.B.; Marinelli, M. Test and Modelling of Commercial V2G CHAdeMO Chargers to Assess the Suitability for Grid Services. World Electric Vehicle Journal 2019, 10, 21. [Google Scholar] [CrossRef]
- Marinelli, M.; Calearo, L.; Engelhardt, J.; Rohde, G. Electrical Thermal and Degradation Measurements of the LEAF E-plus 62-kWh Battery Pack. In Proceedings of the 2022 International Conference on Renewable Energies and Smart Technologies (REST). IEEE, 2022, pp. 1–5. [CrossRef]
- Sakr, N. BMPU-R2 Specification Datasheet. Technical report, Watt and Well, 2025.
- Iglesias, R. EVI-Cx-Ax Datasheet. Technical Report (revAI), Watt and Well, 2024.
- Sevdari, K.; Knudsen, R.M.; Fabbri, G.; Pedersen, K.L.; Alami, A.; Marinelli, M. Demonstration of Bidirectional Charging Using ISO 15118-20. In Proceedings of the 38th International Electric Vehicle Symposium and Exhibition, 2025.
- Charging Interface Initiative (CharIN) e.V. Considerations for EV-EVSE Communication: North America Charging Interoperability Task Force Communications \& Security Subgroup. Technical report, CharIN e.V., 2025.
- European Commission, Directorate-General for Mobility and Transport. Terms of Reference: Sub-group on European Union e-Mobility Public Key Infrastructure (PKI) Ecosystem Management{}.
- Sevdari, K.; Calearo, L.; Bakken, B.H.; Andersen, P.B.; Marinelli, M. Experimental Validation of Onboard Electric Vehicle Chargers to Improve the Efficiency of Smart Charging Operation. SSRN Electronic Journal 2023. [CrossRef]
- IEC 61851-1:2019. Electric Vehicle Conductive Charging System - Part 1: General Requirements.
- Sevdari, K.; Striani, S.; Andersen, P.B.; Marinelli, M. Power Modulation and Phase Switching Testing of Smart Charger and Electric Vehicle Pairs. In Proceedings of the 2022 57th International Universities Power Engineering Conference (UPEC). IEEE, 2022, pp. 1–6. [CrossRef]
- Wouters, H.; Martinez, W. Bidirectional Onboard Chargers for Electric Vehicles: State-of-the-Art and Future Trends. IEEE Transactions on Power Electronics 2024, 39, 693–716. [Google Scholar] [CrossRef]
Figure 1.
Control system architecture for EV grid services. The external controller monitors grid conditions and sends setpoint (sp) signals to the EVSE (charger), where the supply equipment charging controller (SECC) will communicate with the electric vehicle charging controller (EVCC) to monitor and manage the power flow.
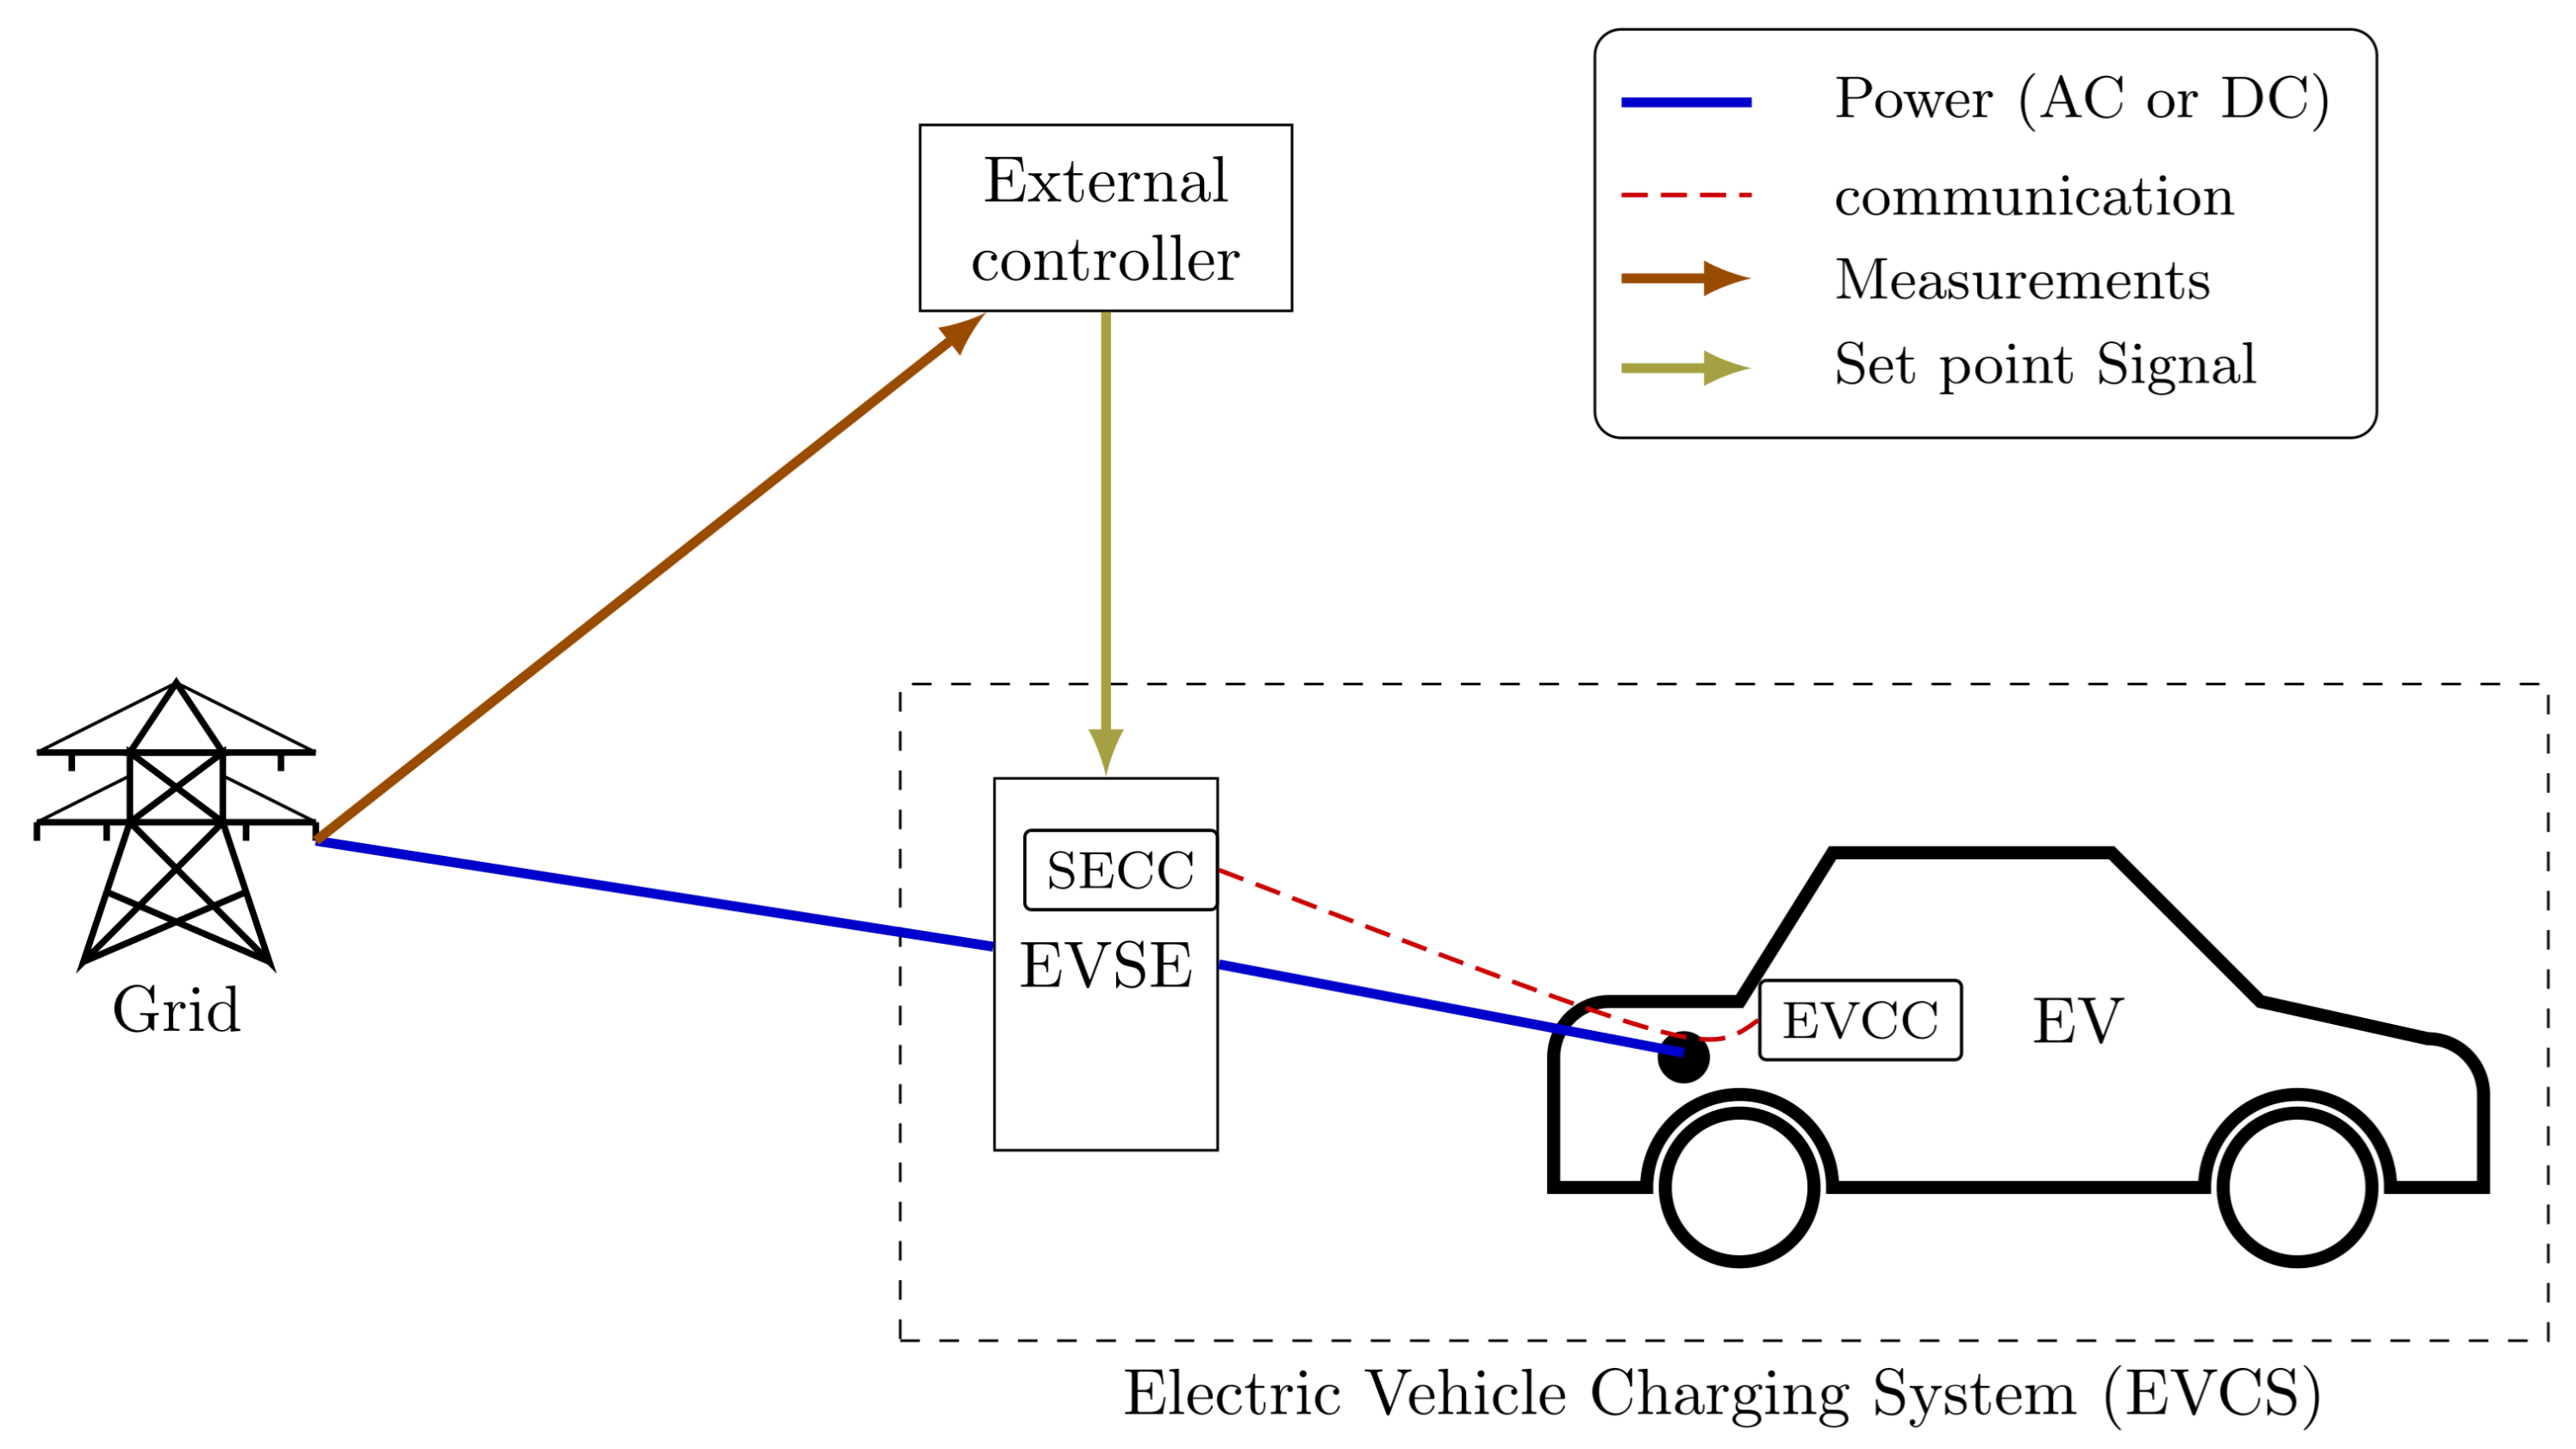
Figure 2.
Bidirectional charging hardware readiness level: The ladder illustrates the progression of products (EVs, EVSEs) from basic hardware capabilities to full interoperability with third-party systems, highlighting the manufactures necessary steps for effective grid integration. This figure applies to both AC and DC charging systems.
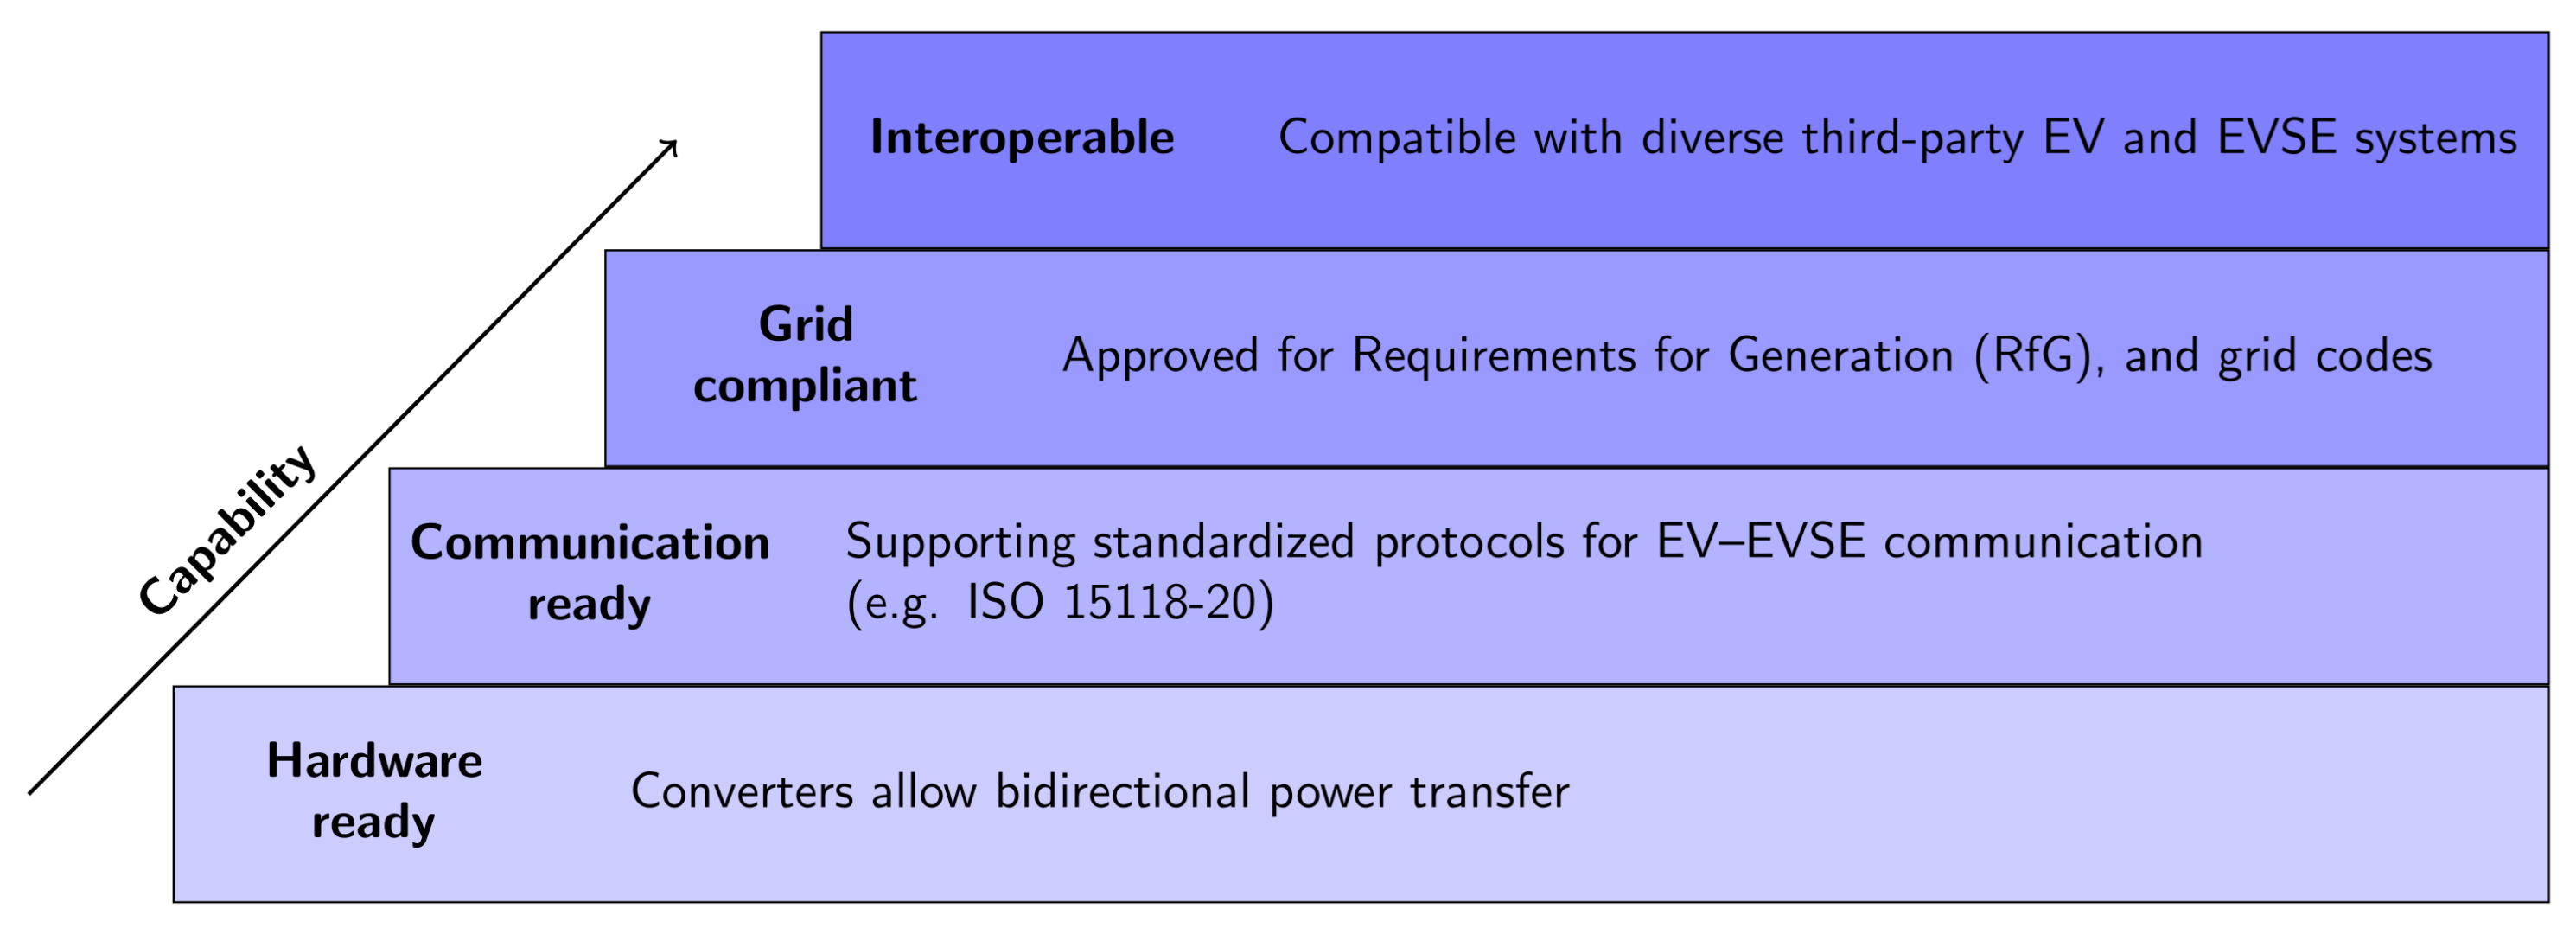
Figure 3.
Time-domain categorization of bidirectional charging services. Fast grid services like frequency regulation require response times in seconds, while energy management services operate on longer timescales.
Figure 3.
Time-domain categorization of bidirectional charging services. Fast grid services like frequency regulation require response times in seconds, while energy management services operate on longer timescales.
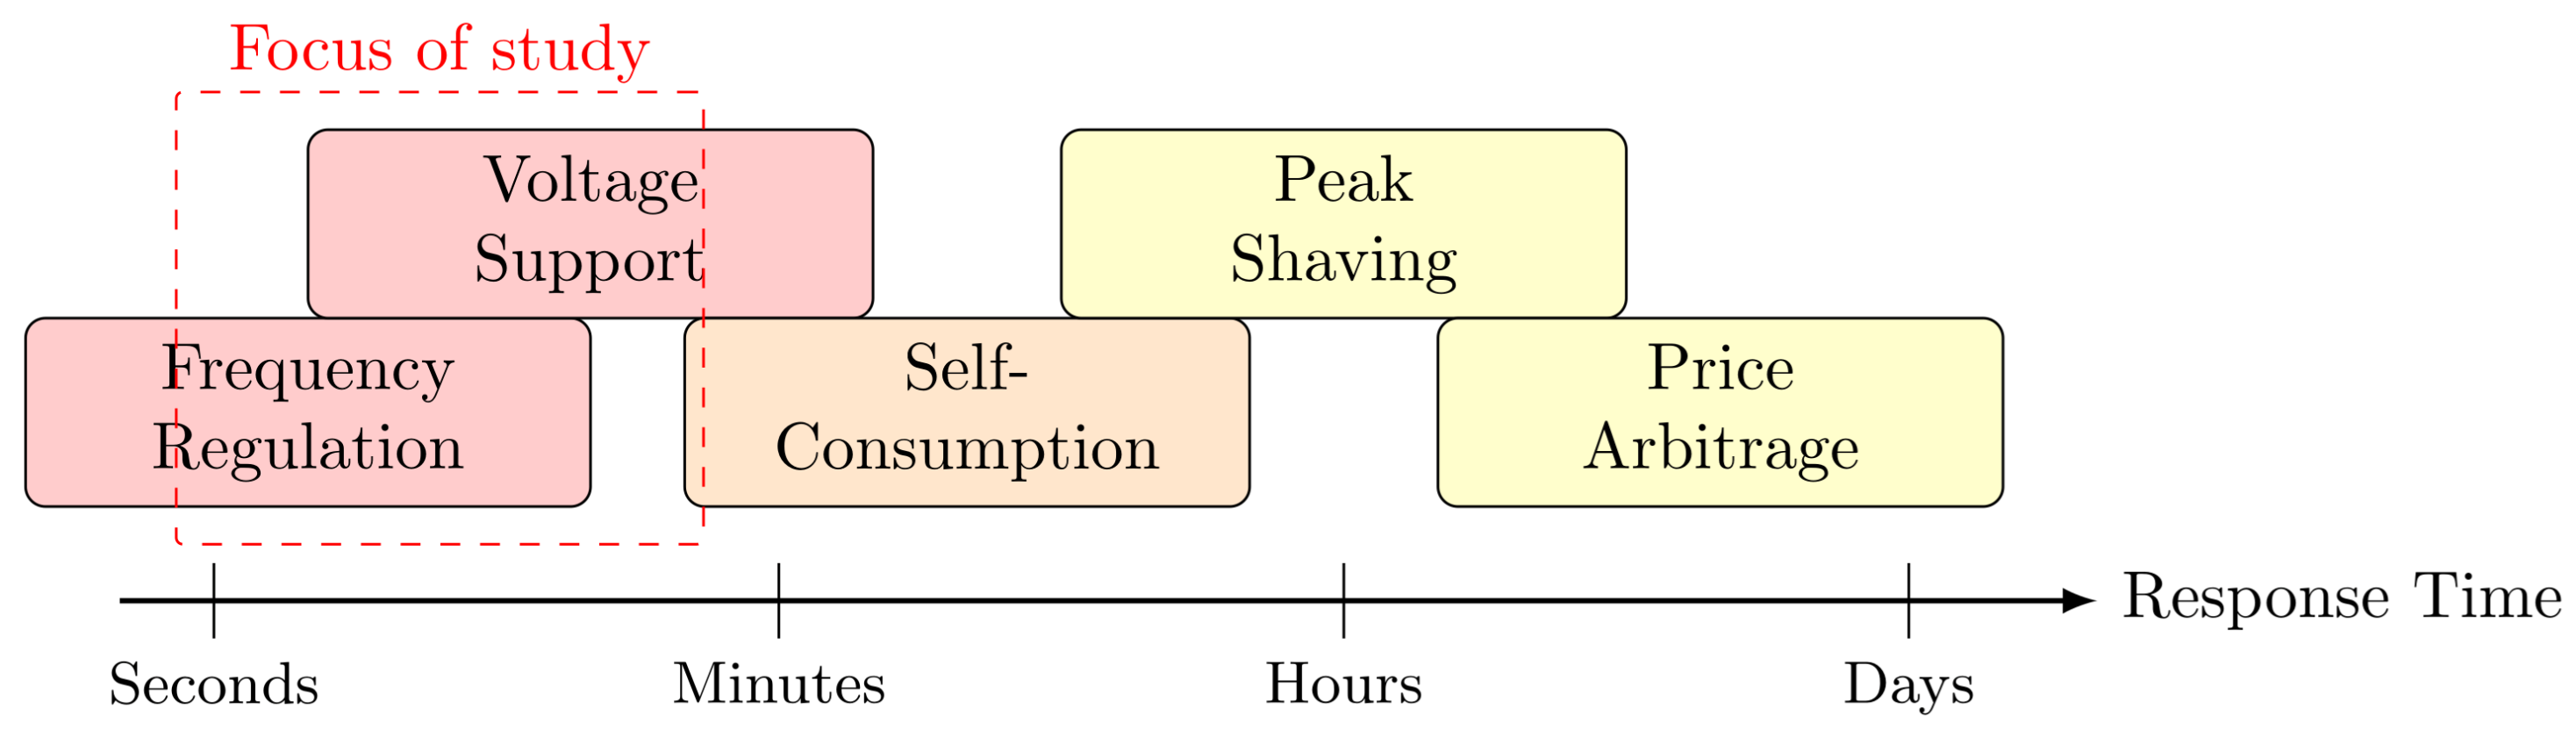
Figure 4.
Communication flow for setpoint change during active DC power transfer (according to [26], Section 8.3). The SECC validates the new setpoint from an external controller and awaits a cyclic request from the EVCC. Upon receiving it, SECC responds with the new target, which the EVCC may accept or reject. If accepted, the SECC forwards the setpoint to the power modules.
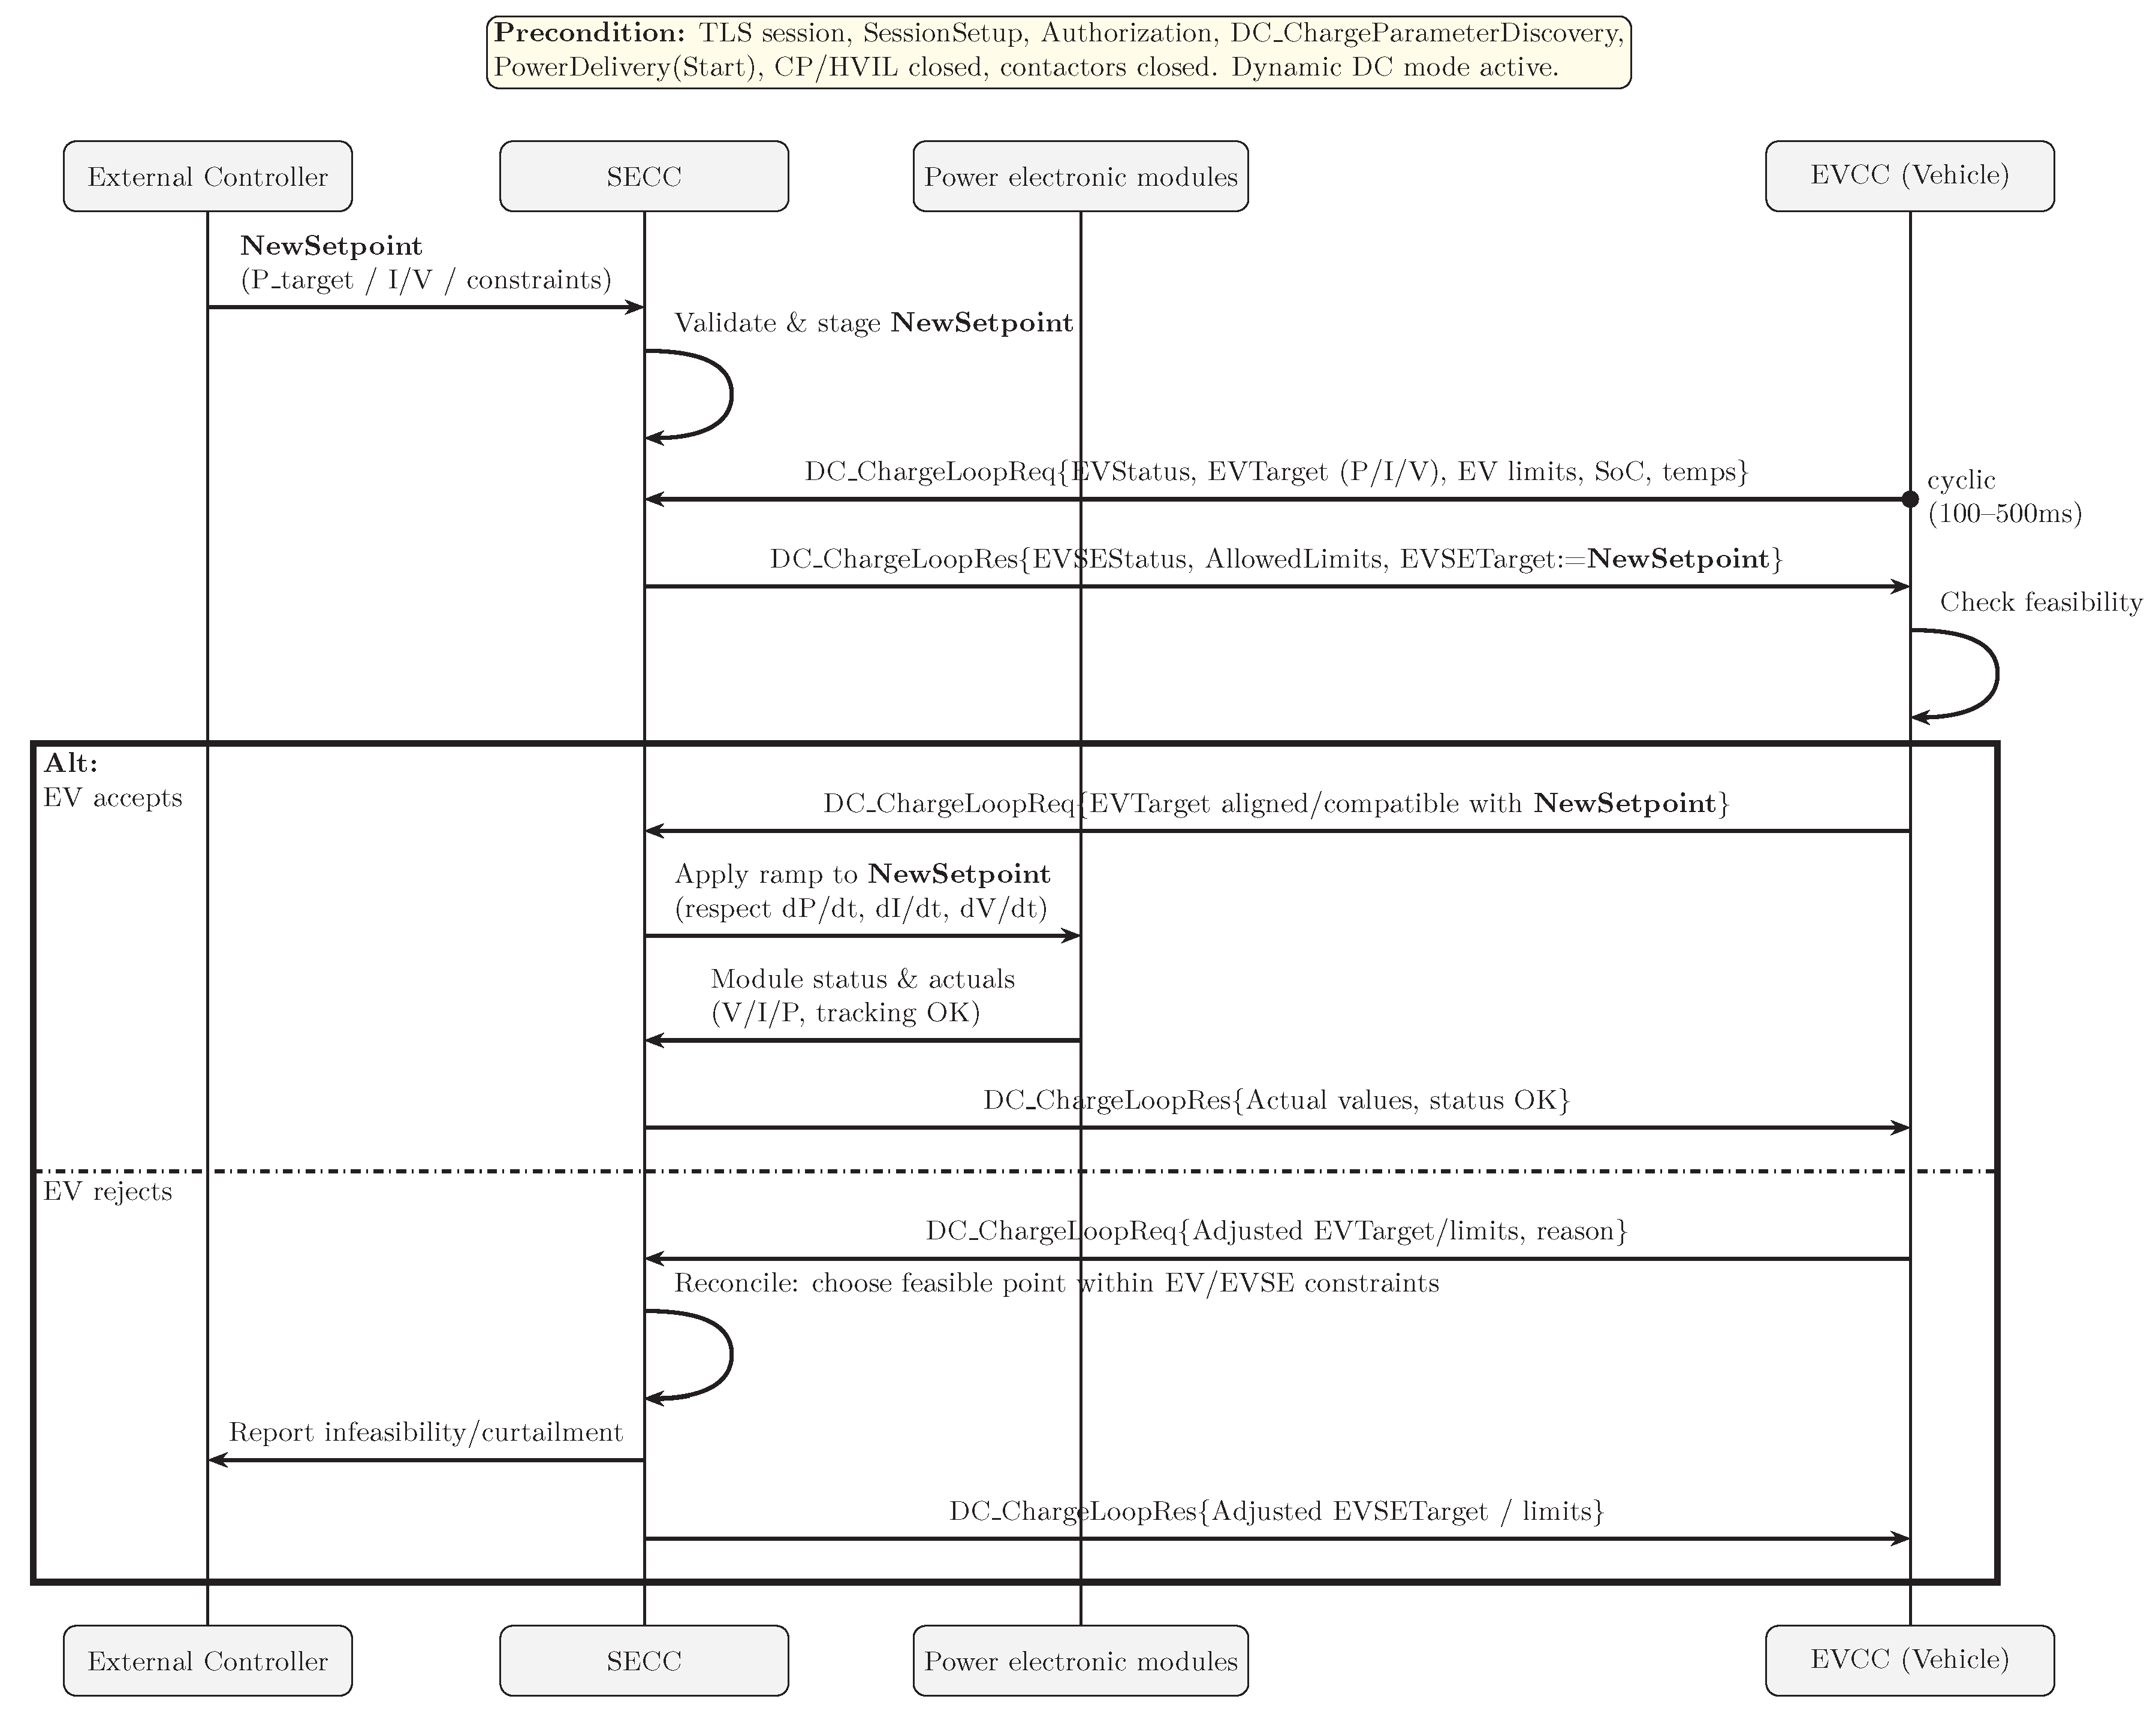
Figure 5.
Photograph of the test setup used in the experiments. The Watt & Well bidirectional EVSE (right) with measurements done internally is connected with the CCS2 cable to the Keysight CDS, which emulates EV behavior and communication.
Figure 5.
Photograph of the test setup used in the experiments. The Watt & Well bidirectional EVSE (right) with measurements done internally is connected with the CCS2 cable to the Keysight CDS, which emulates EV behavior and communication.
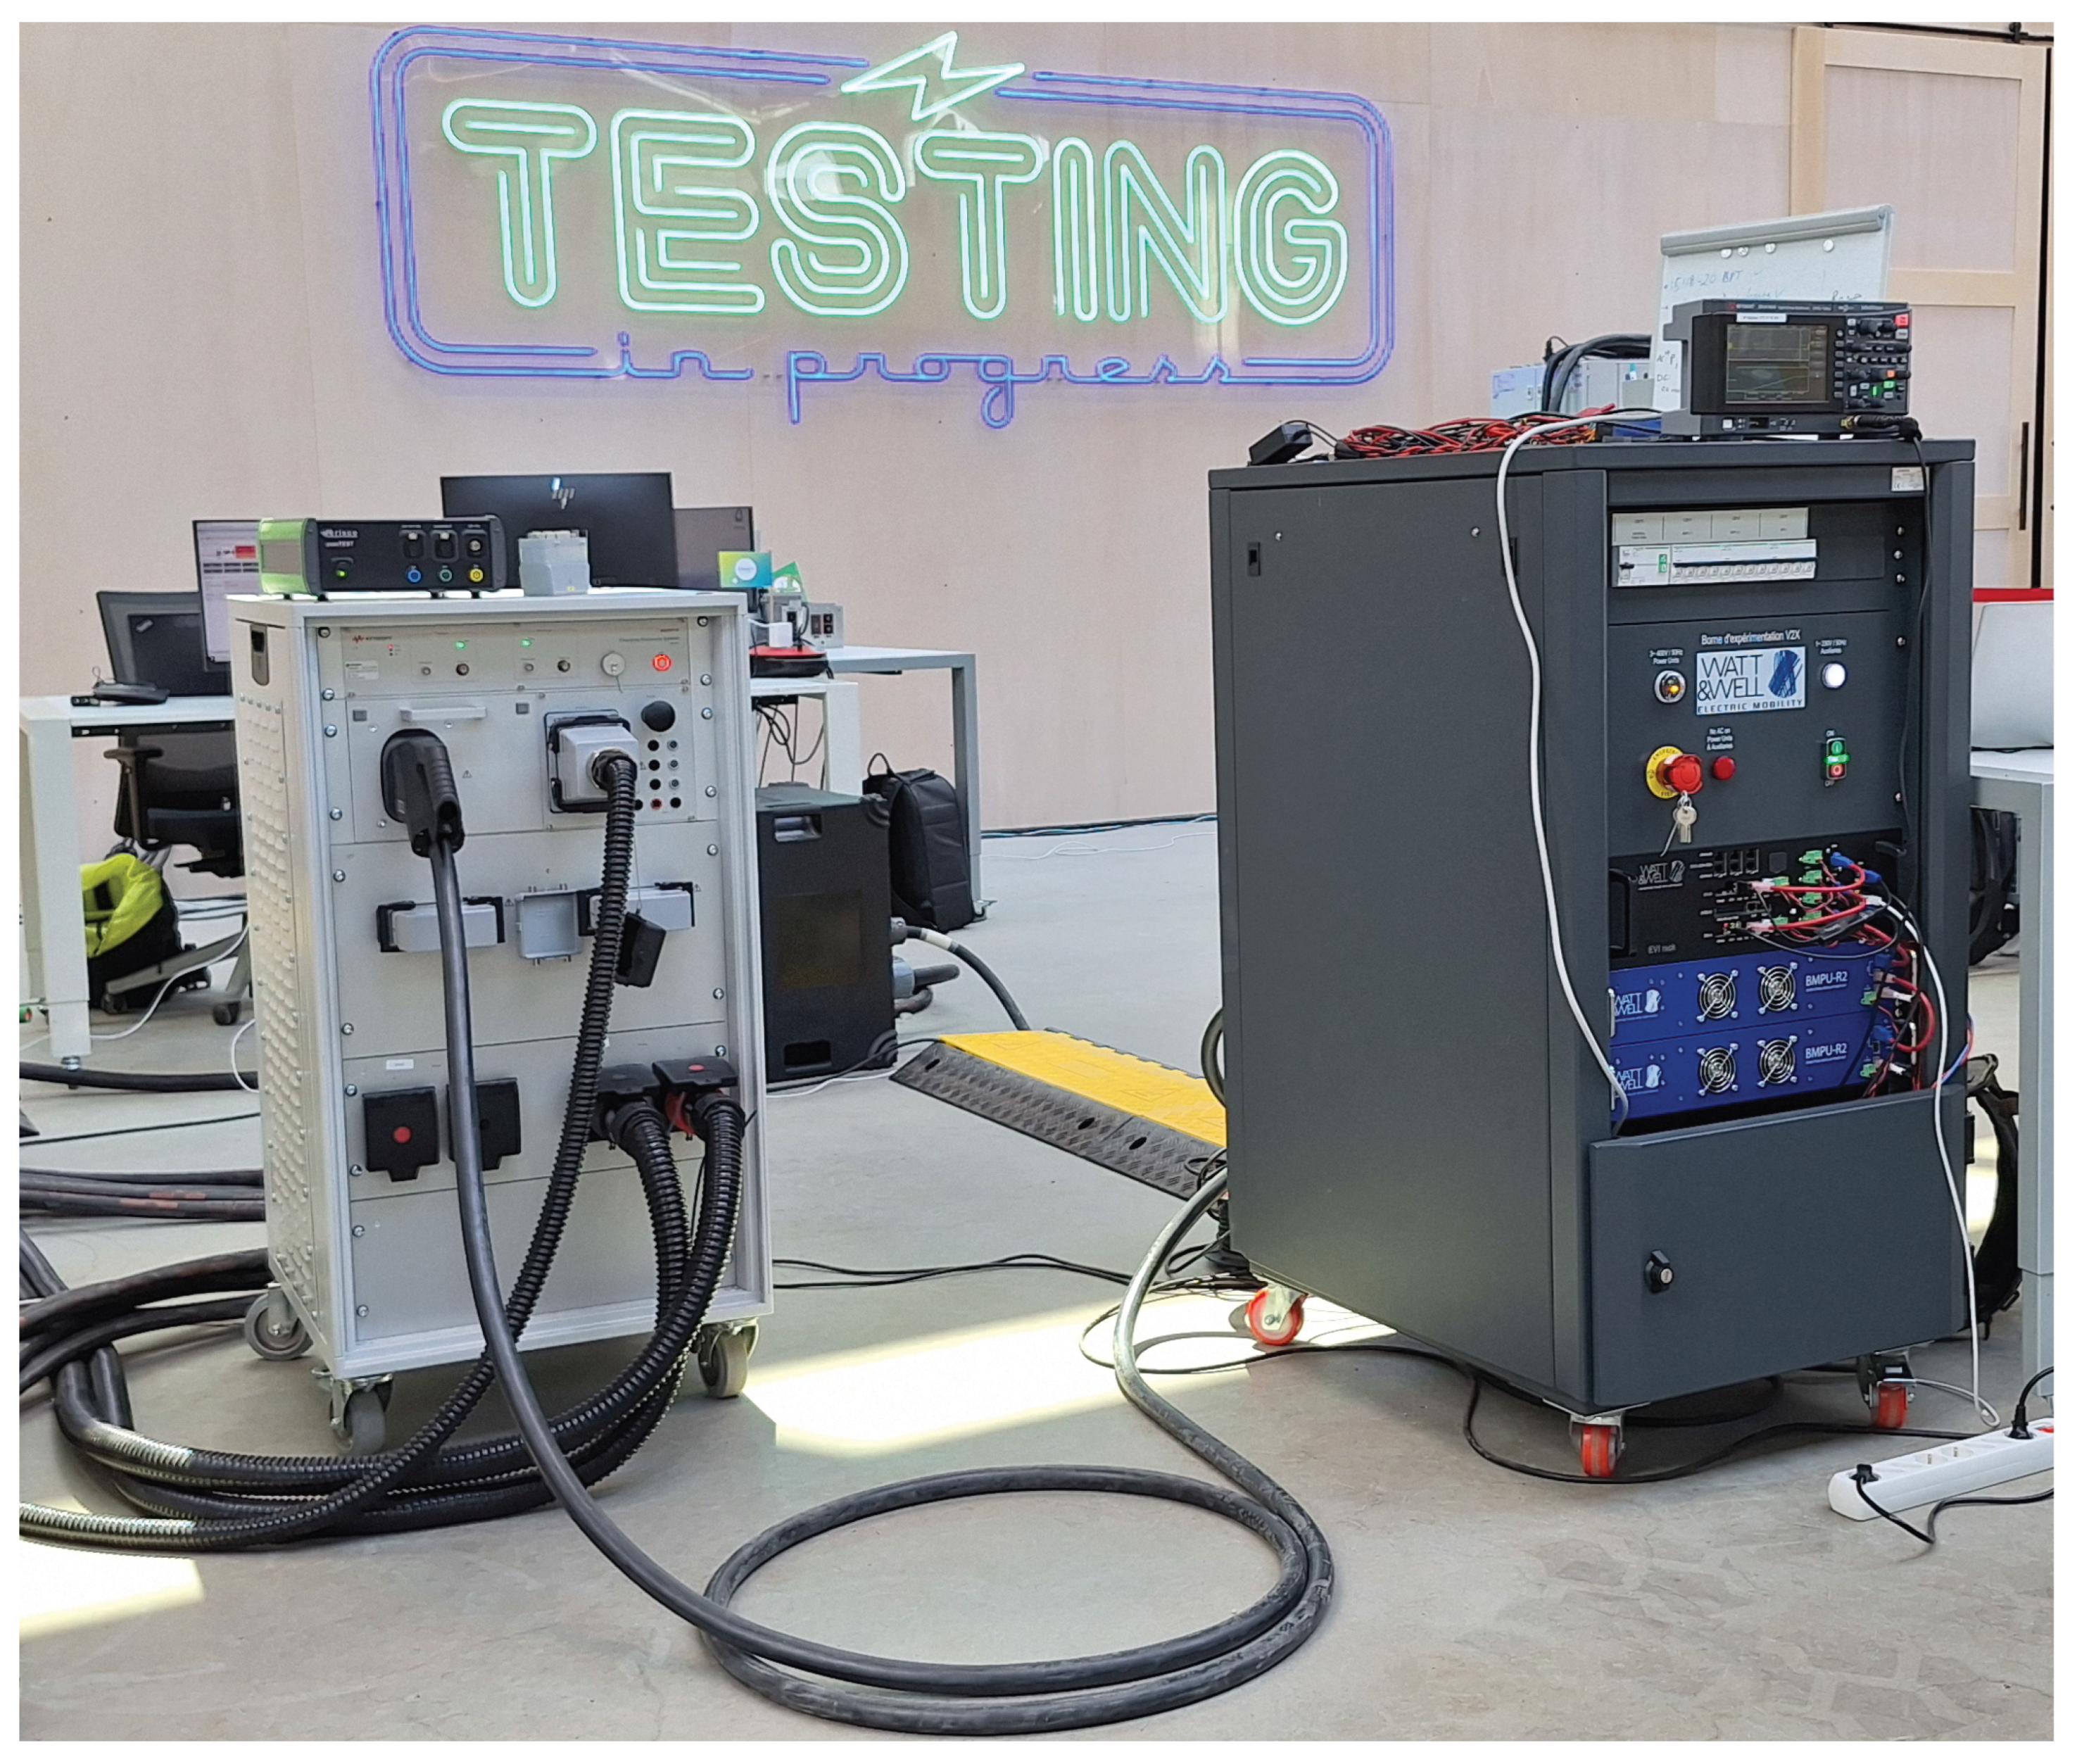
Figure 6.
KPIs for the test sequence, including communication latency, and ramping time from 5% to 95% of the full response.
Figure 6.
KPIs for the test sequence, including communication latency, and ramping time from 5% to 95% of the full response.
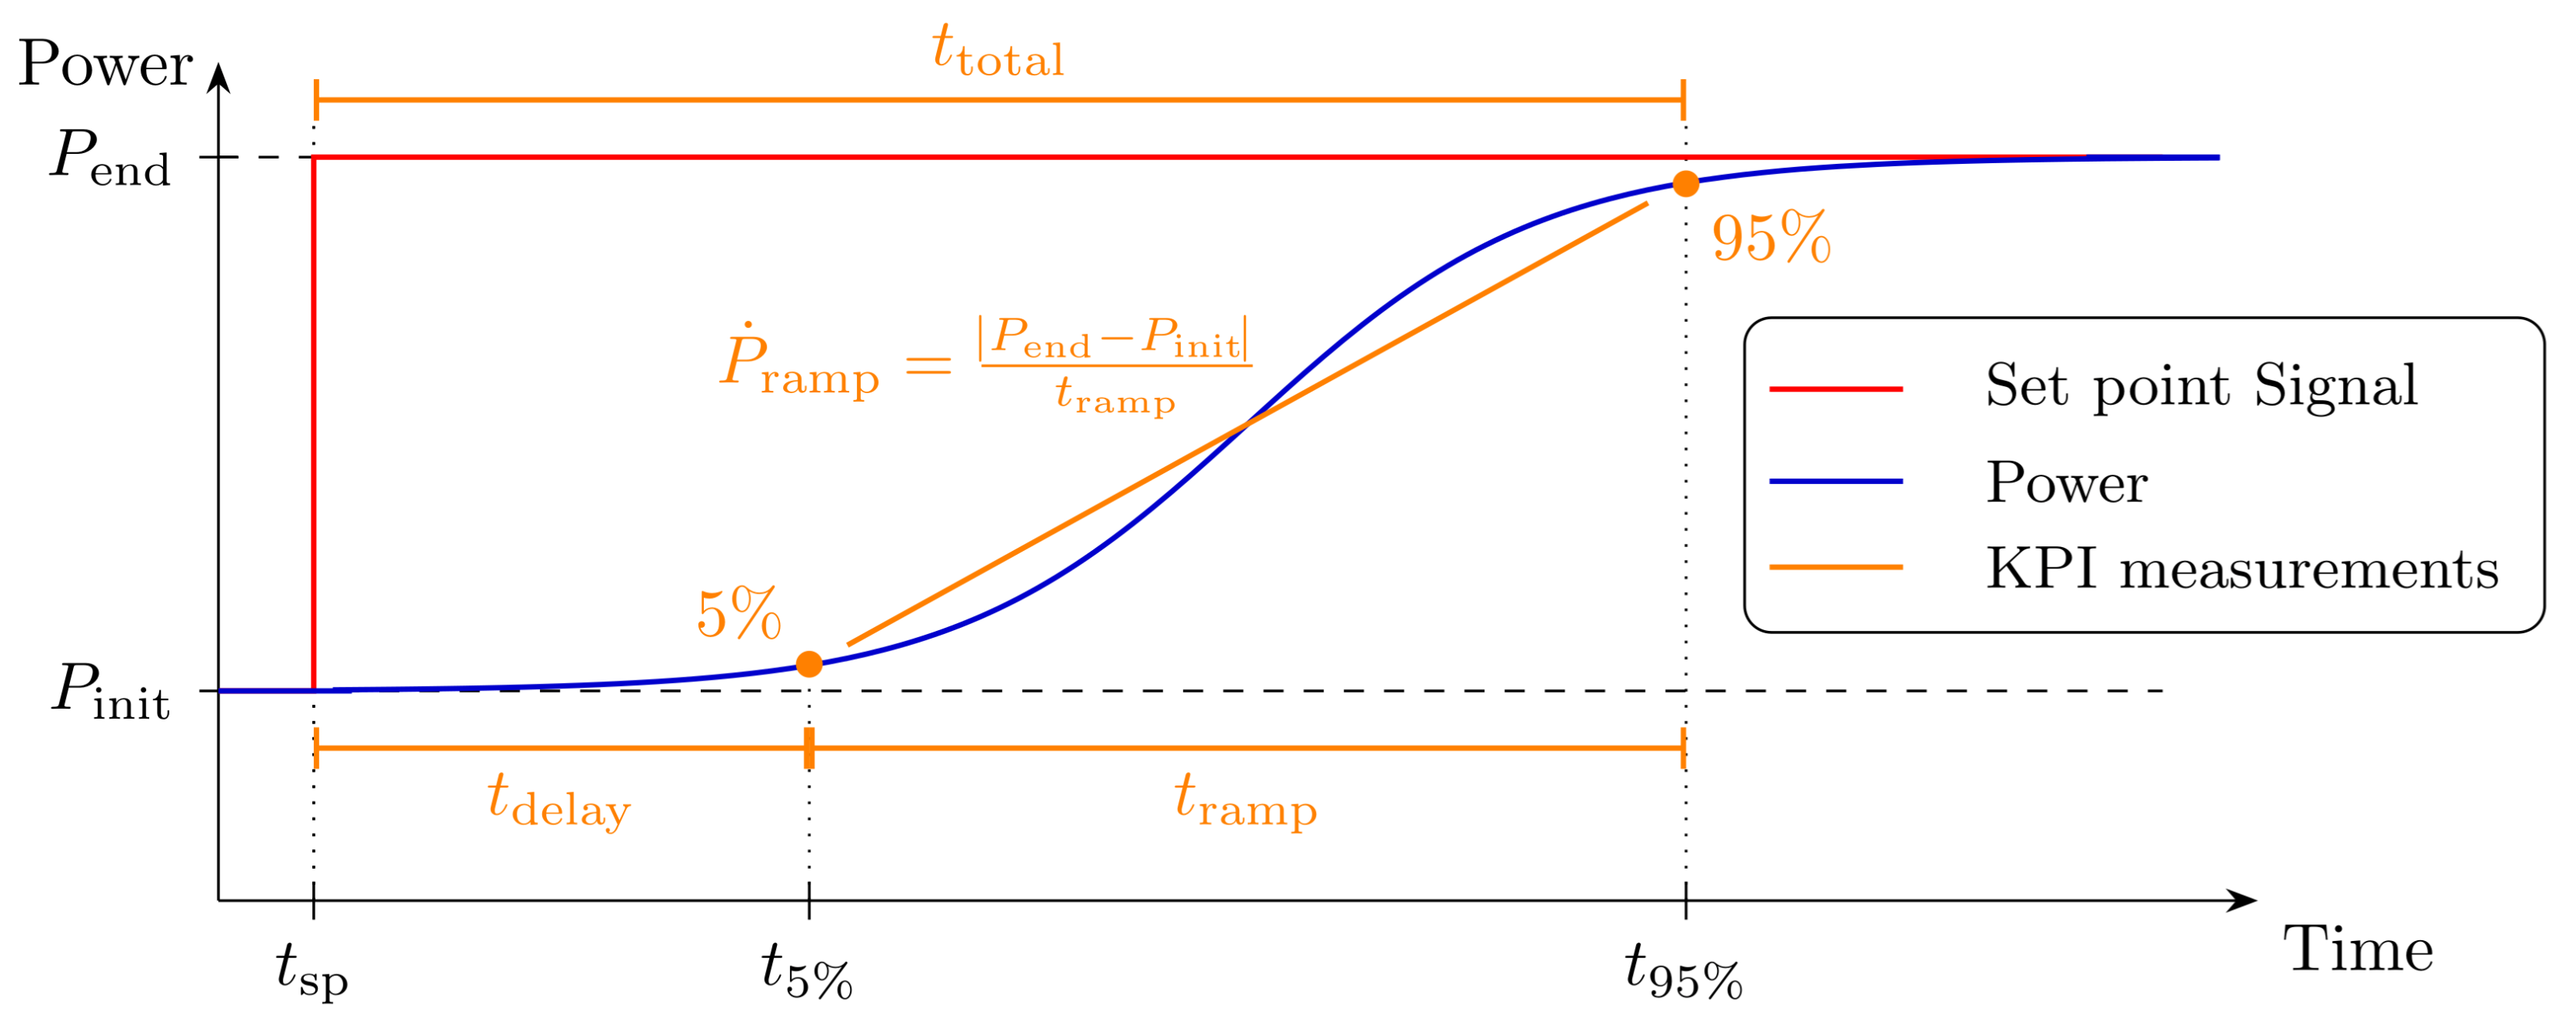
Figure 7.
The timeseries of setpoint changes imposed on the EVCS. The setpoint remains stable at each setpoint for 5 s. The priming ensures consistency of preconditions. Throughout this work, maximum forward power transfer (FPT) and maximum reverse power transfer (RPT) are defined according to the respective system configurations.
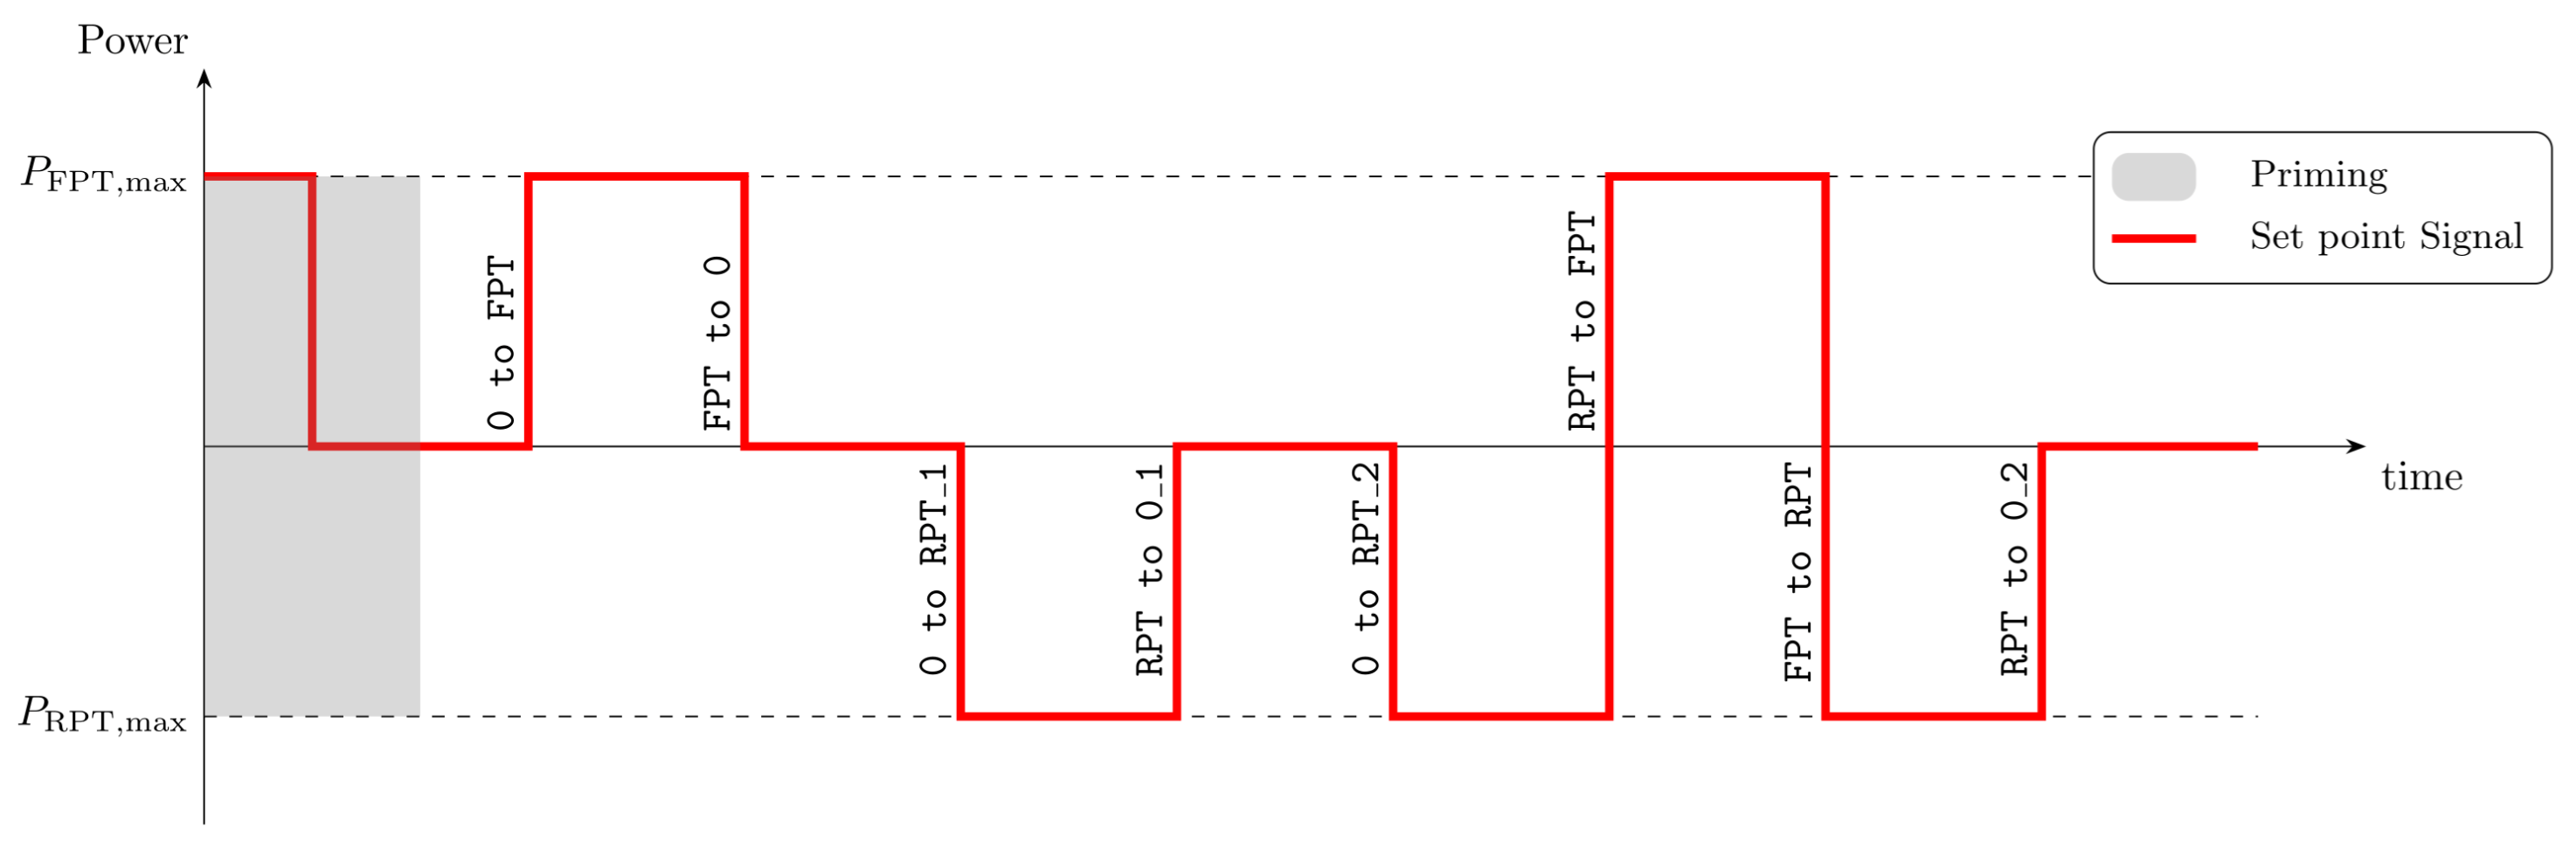
Figure 8.
Hardware setup showing the W&W bidirectional charger with dual BMPU modules, CCS2 and CHAdeMO connectors, and control interfaces. The Raspberry Pi provides setpoint control through the ethernet connection EVSE connected to either CDS, EV9 or Leaf at once.
Figure 8.
Hardware setup showing the W&W bidirectional charger with dual BMPU modules, CCS2 and CHAdeMO connectors, and control interfaces. The Raspberry Pi provides setpoint control through the ethernet connection EVSE connected to either CDS, EV9 or Leaf at once.
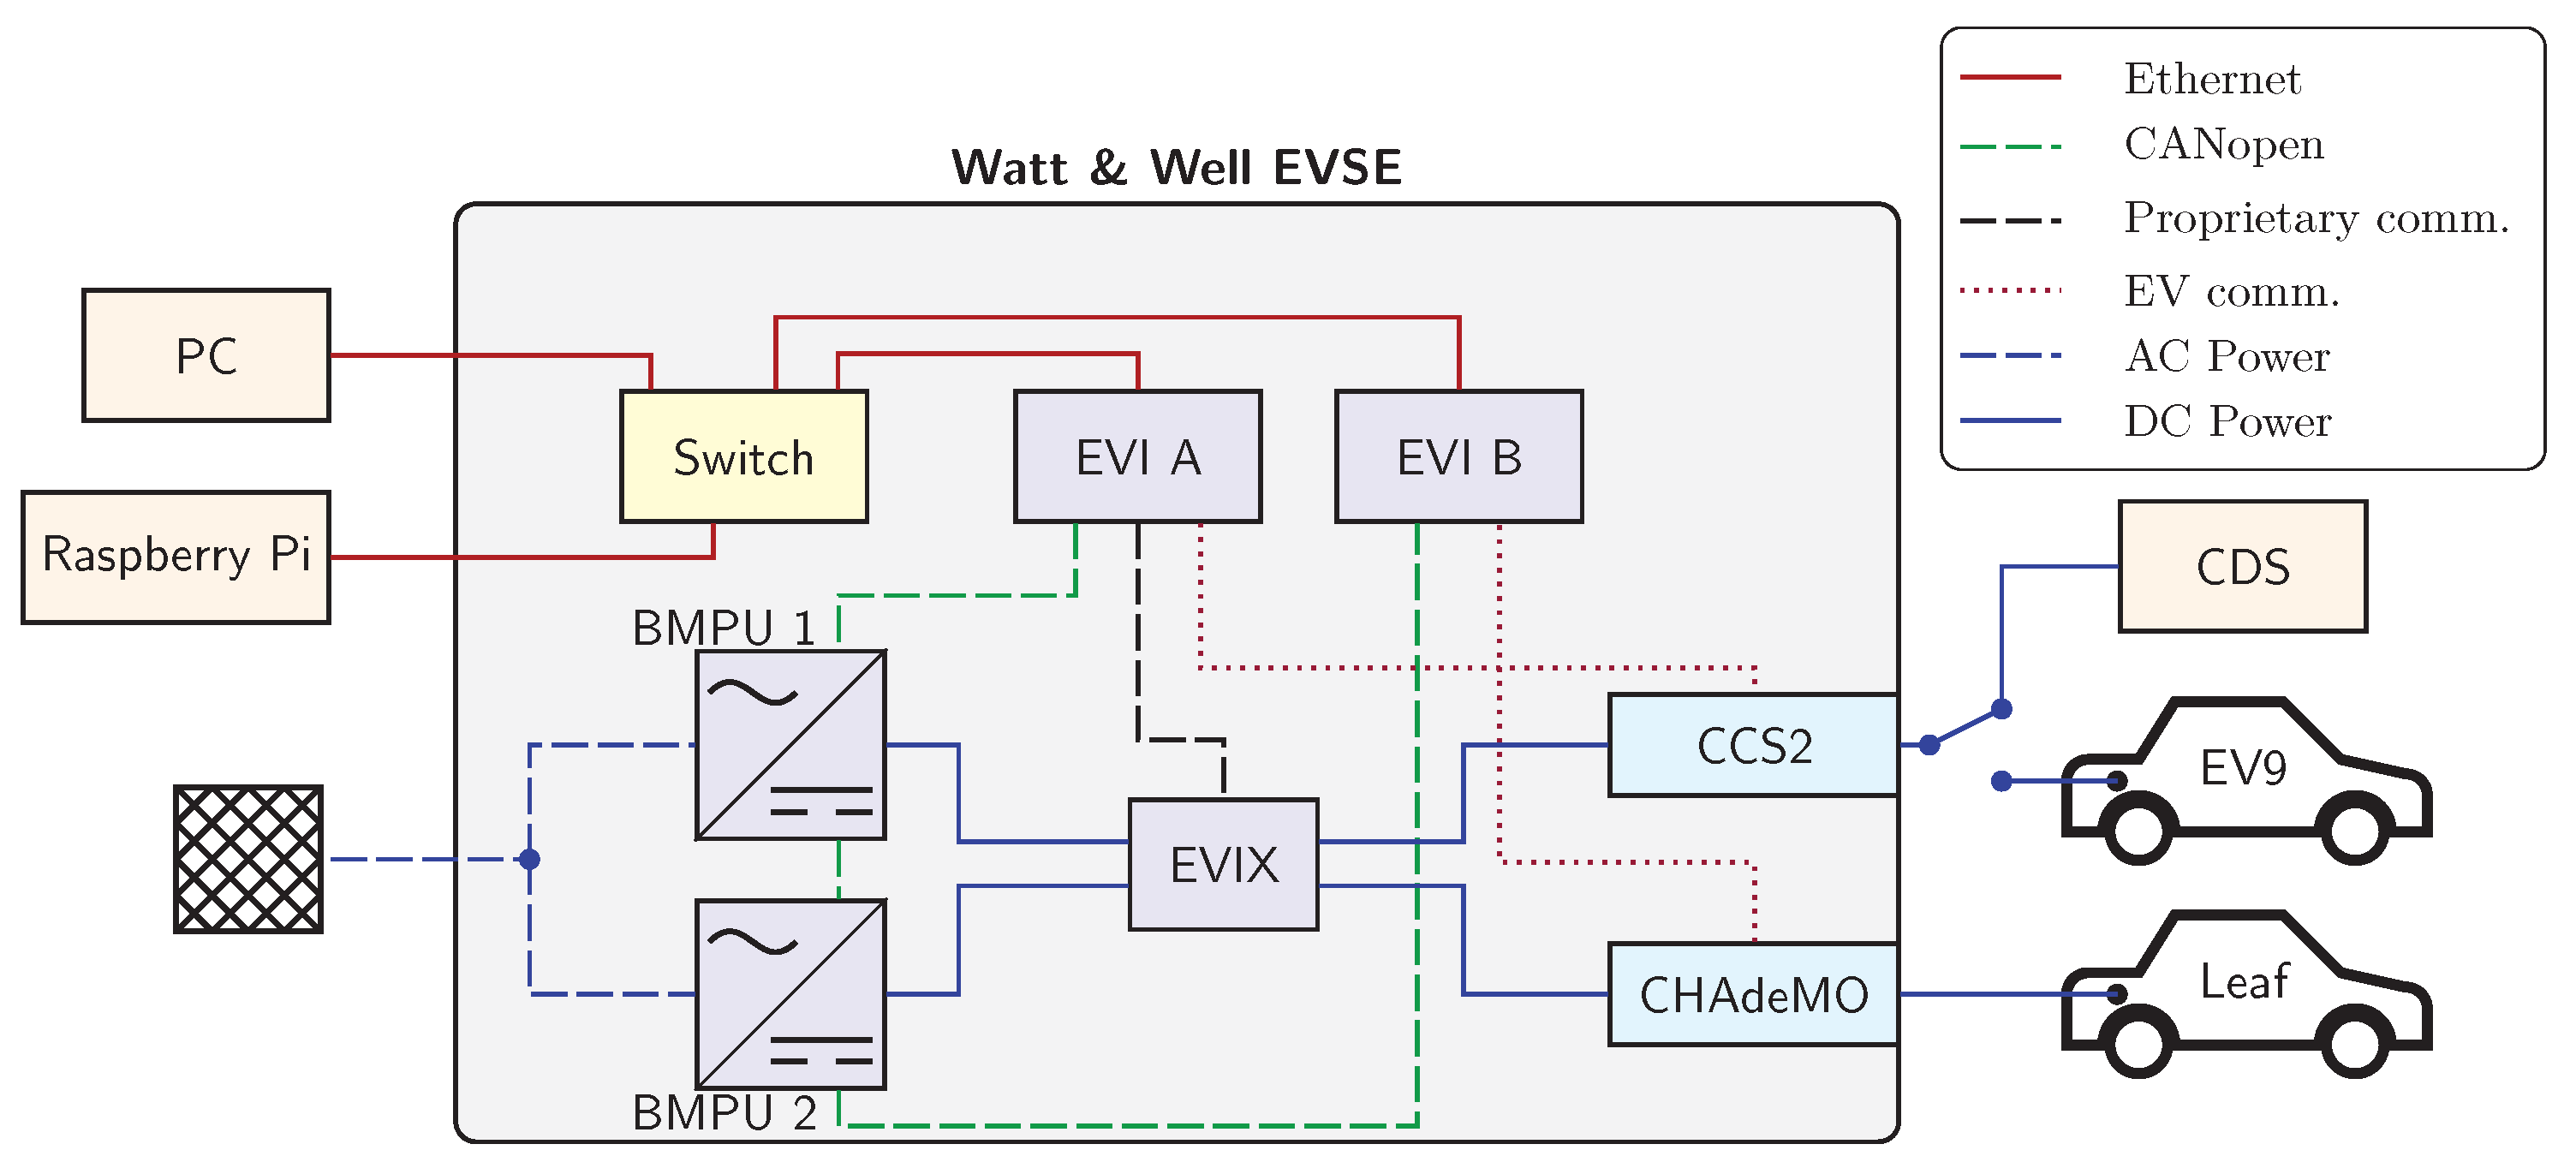
Figure 9.
Measurement setup showing the DC-side power measurements using a KeySight oscilloscope. The Raspberry Pi’s GPIO signal triggers the measurement sequence after confirming receipt of the setpoint by the EVI board. DC current measurements of the combined current from the BMPUs to either CCS2 or CHAdeMO plug.
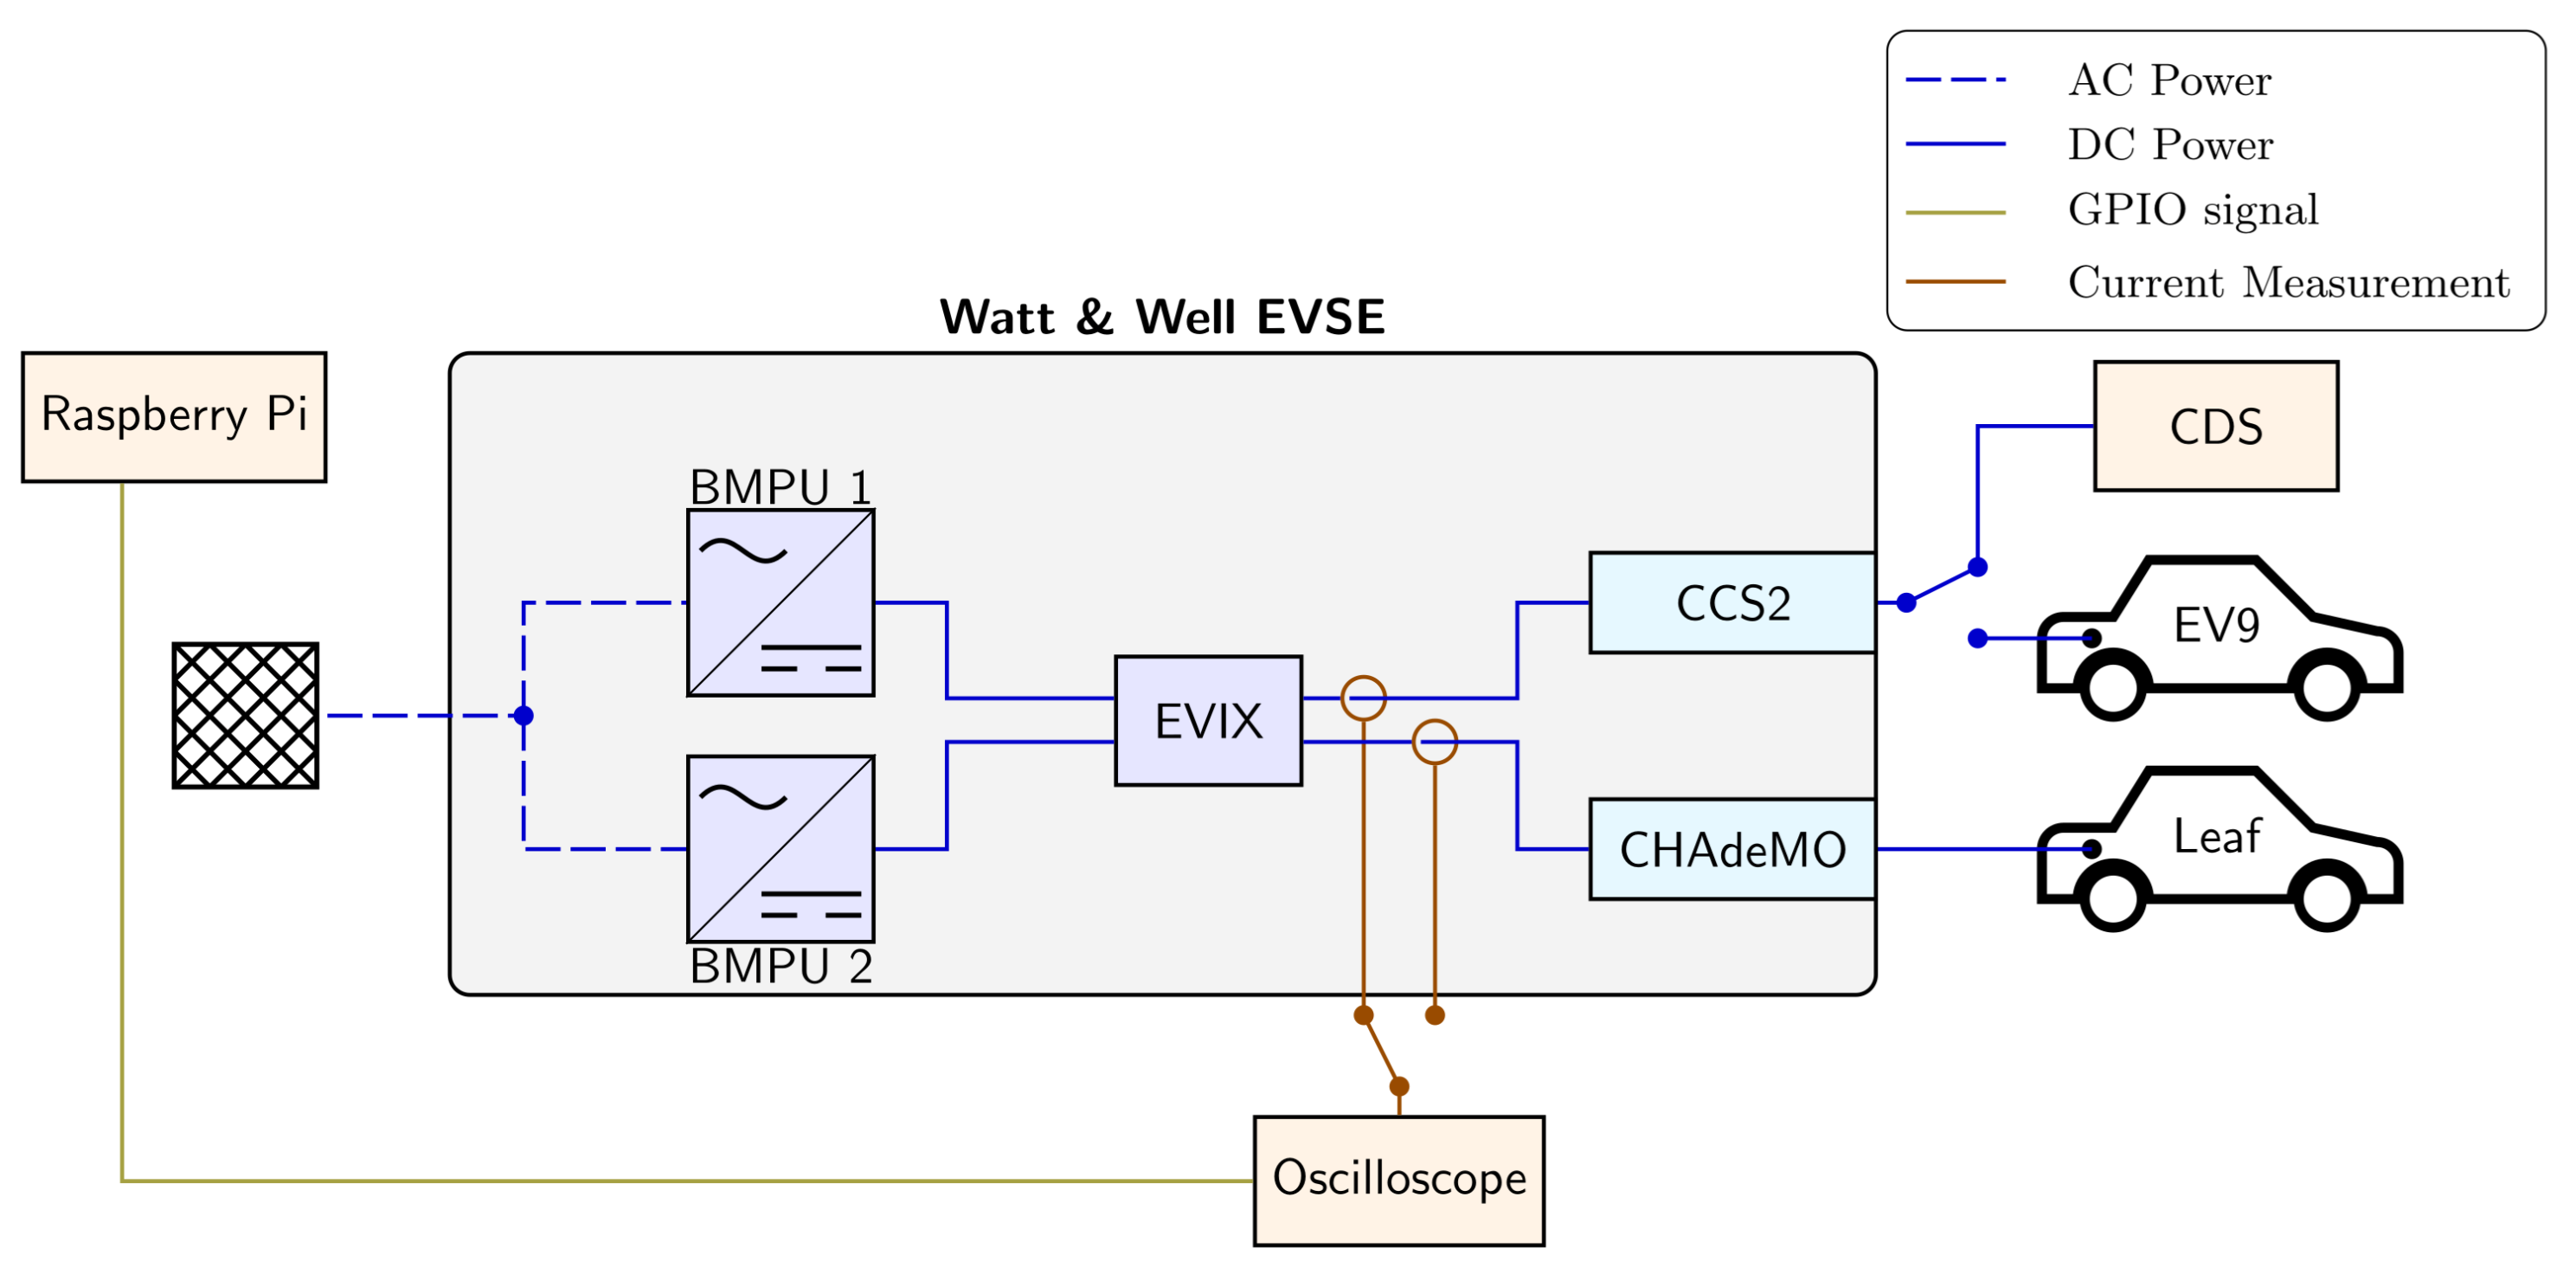
Figure 10.
Full test sequence with eight steps starts with the red signal. The used configuration includes a single BMPU at 400 V connected to the CDS on 15118–20 with CCS2.
Figure 10.
Full test sequence with eight steps starts with the red signal. The used configuration includes a single BMPU at 400 V connected to the CDS on 15118–20 with CCS2.
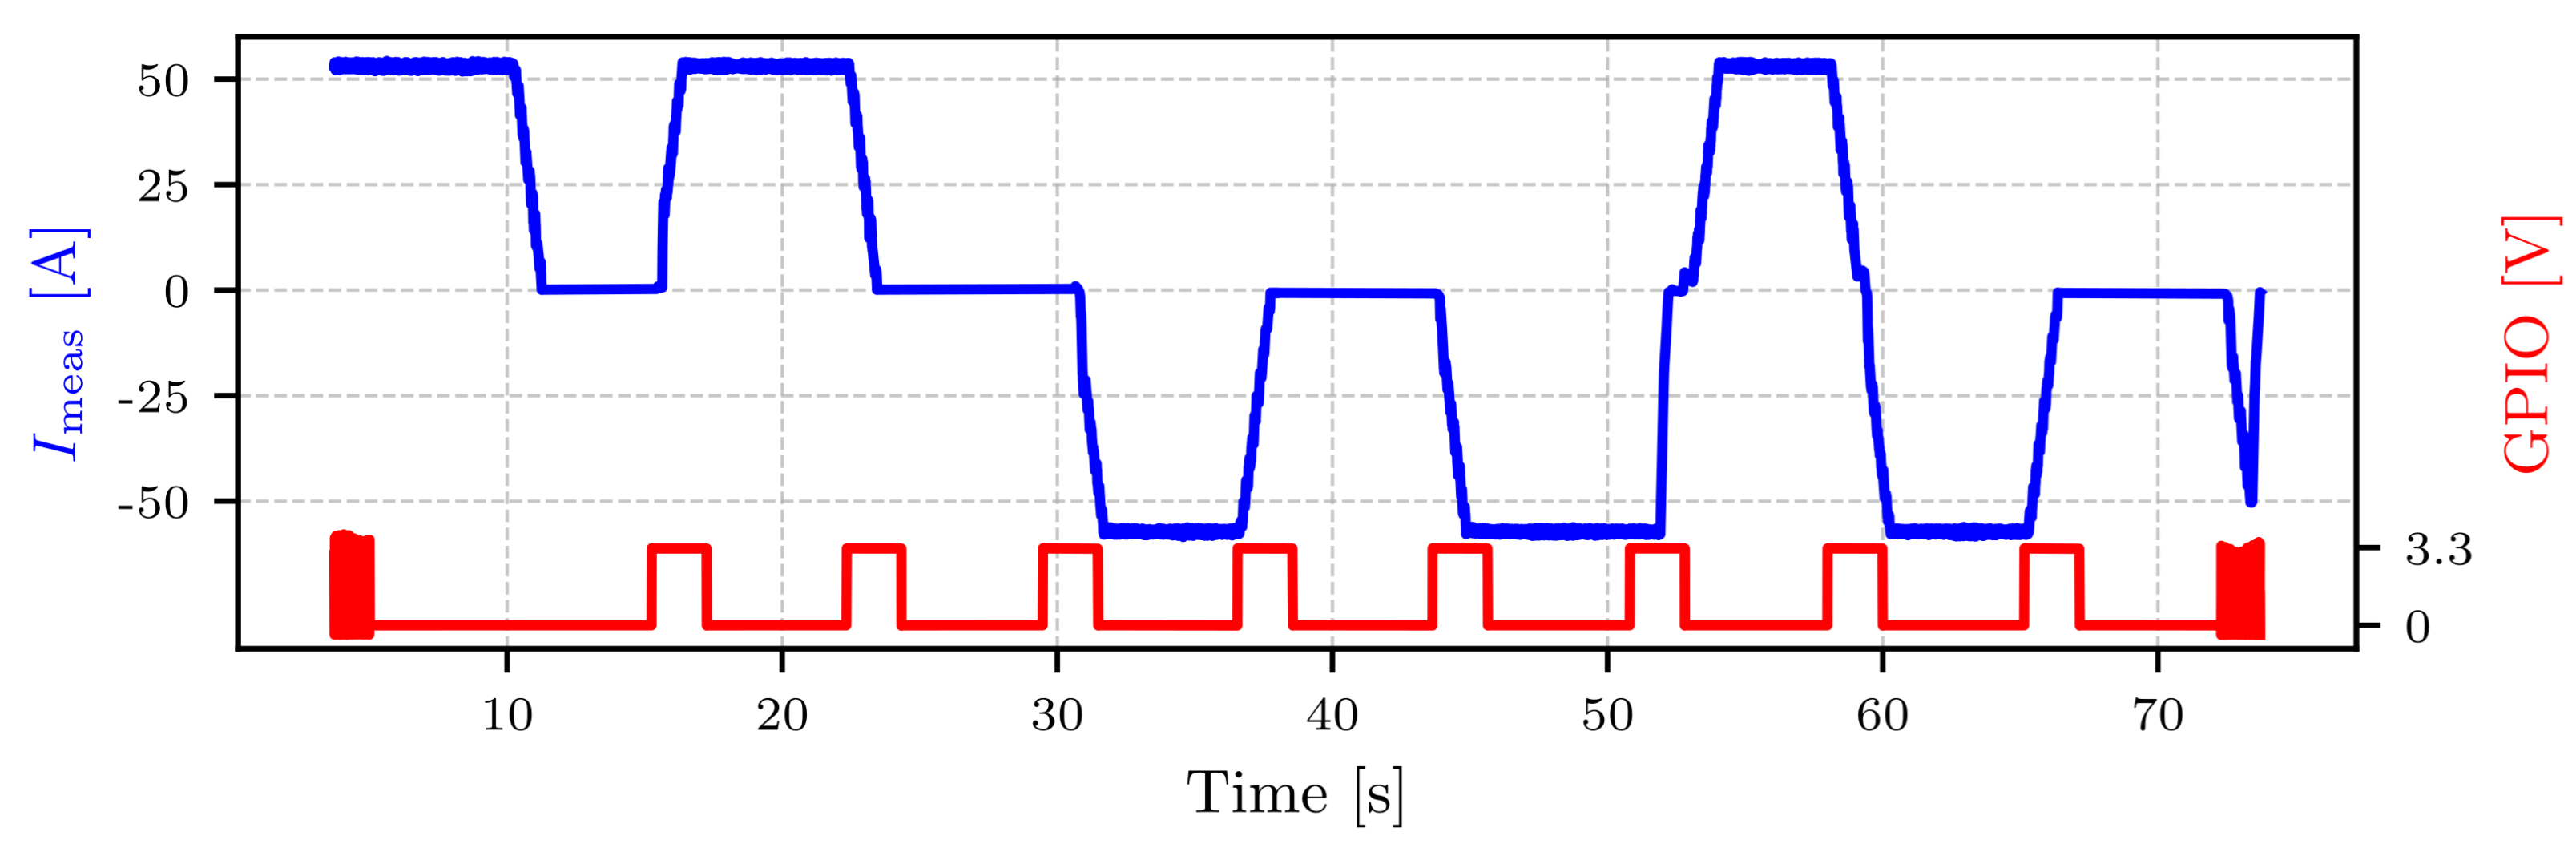
Figure 11.
Focused view of step transitions showing initial delay and ramping behavior for the first run with the configuration of two BMPU in parallel configuration connected to the CDS at 400 V. indicates the setpoint with transition measured by the Oscilloscope. In contrast, the shows the measured power response. The four plots show: (a) 0 to FPT. (b) 0 to RPT (from a state of RPT, with no power flow reversal (PFR)). (c) 0 to RPT (from a state of FPT, and thus includes a PFR). (d) FPT to RPT Direct transition from fully charging to fully discharging.
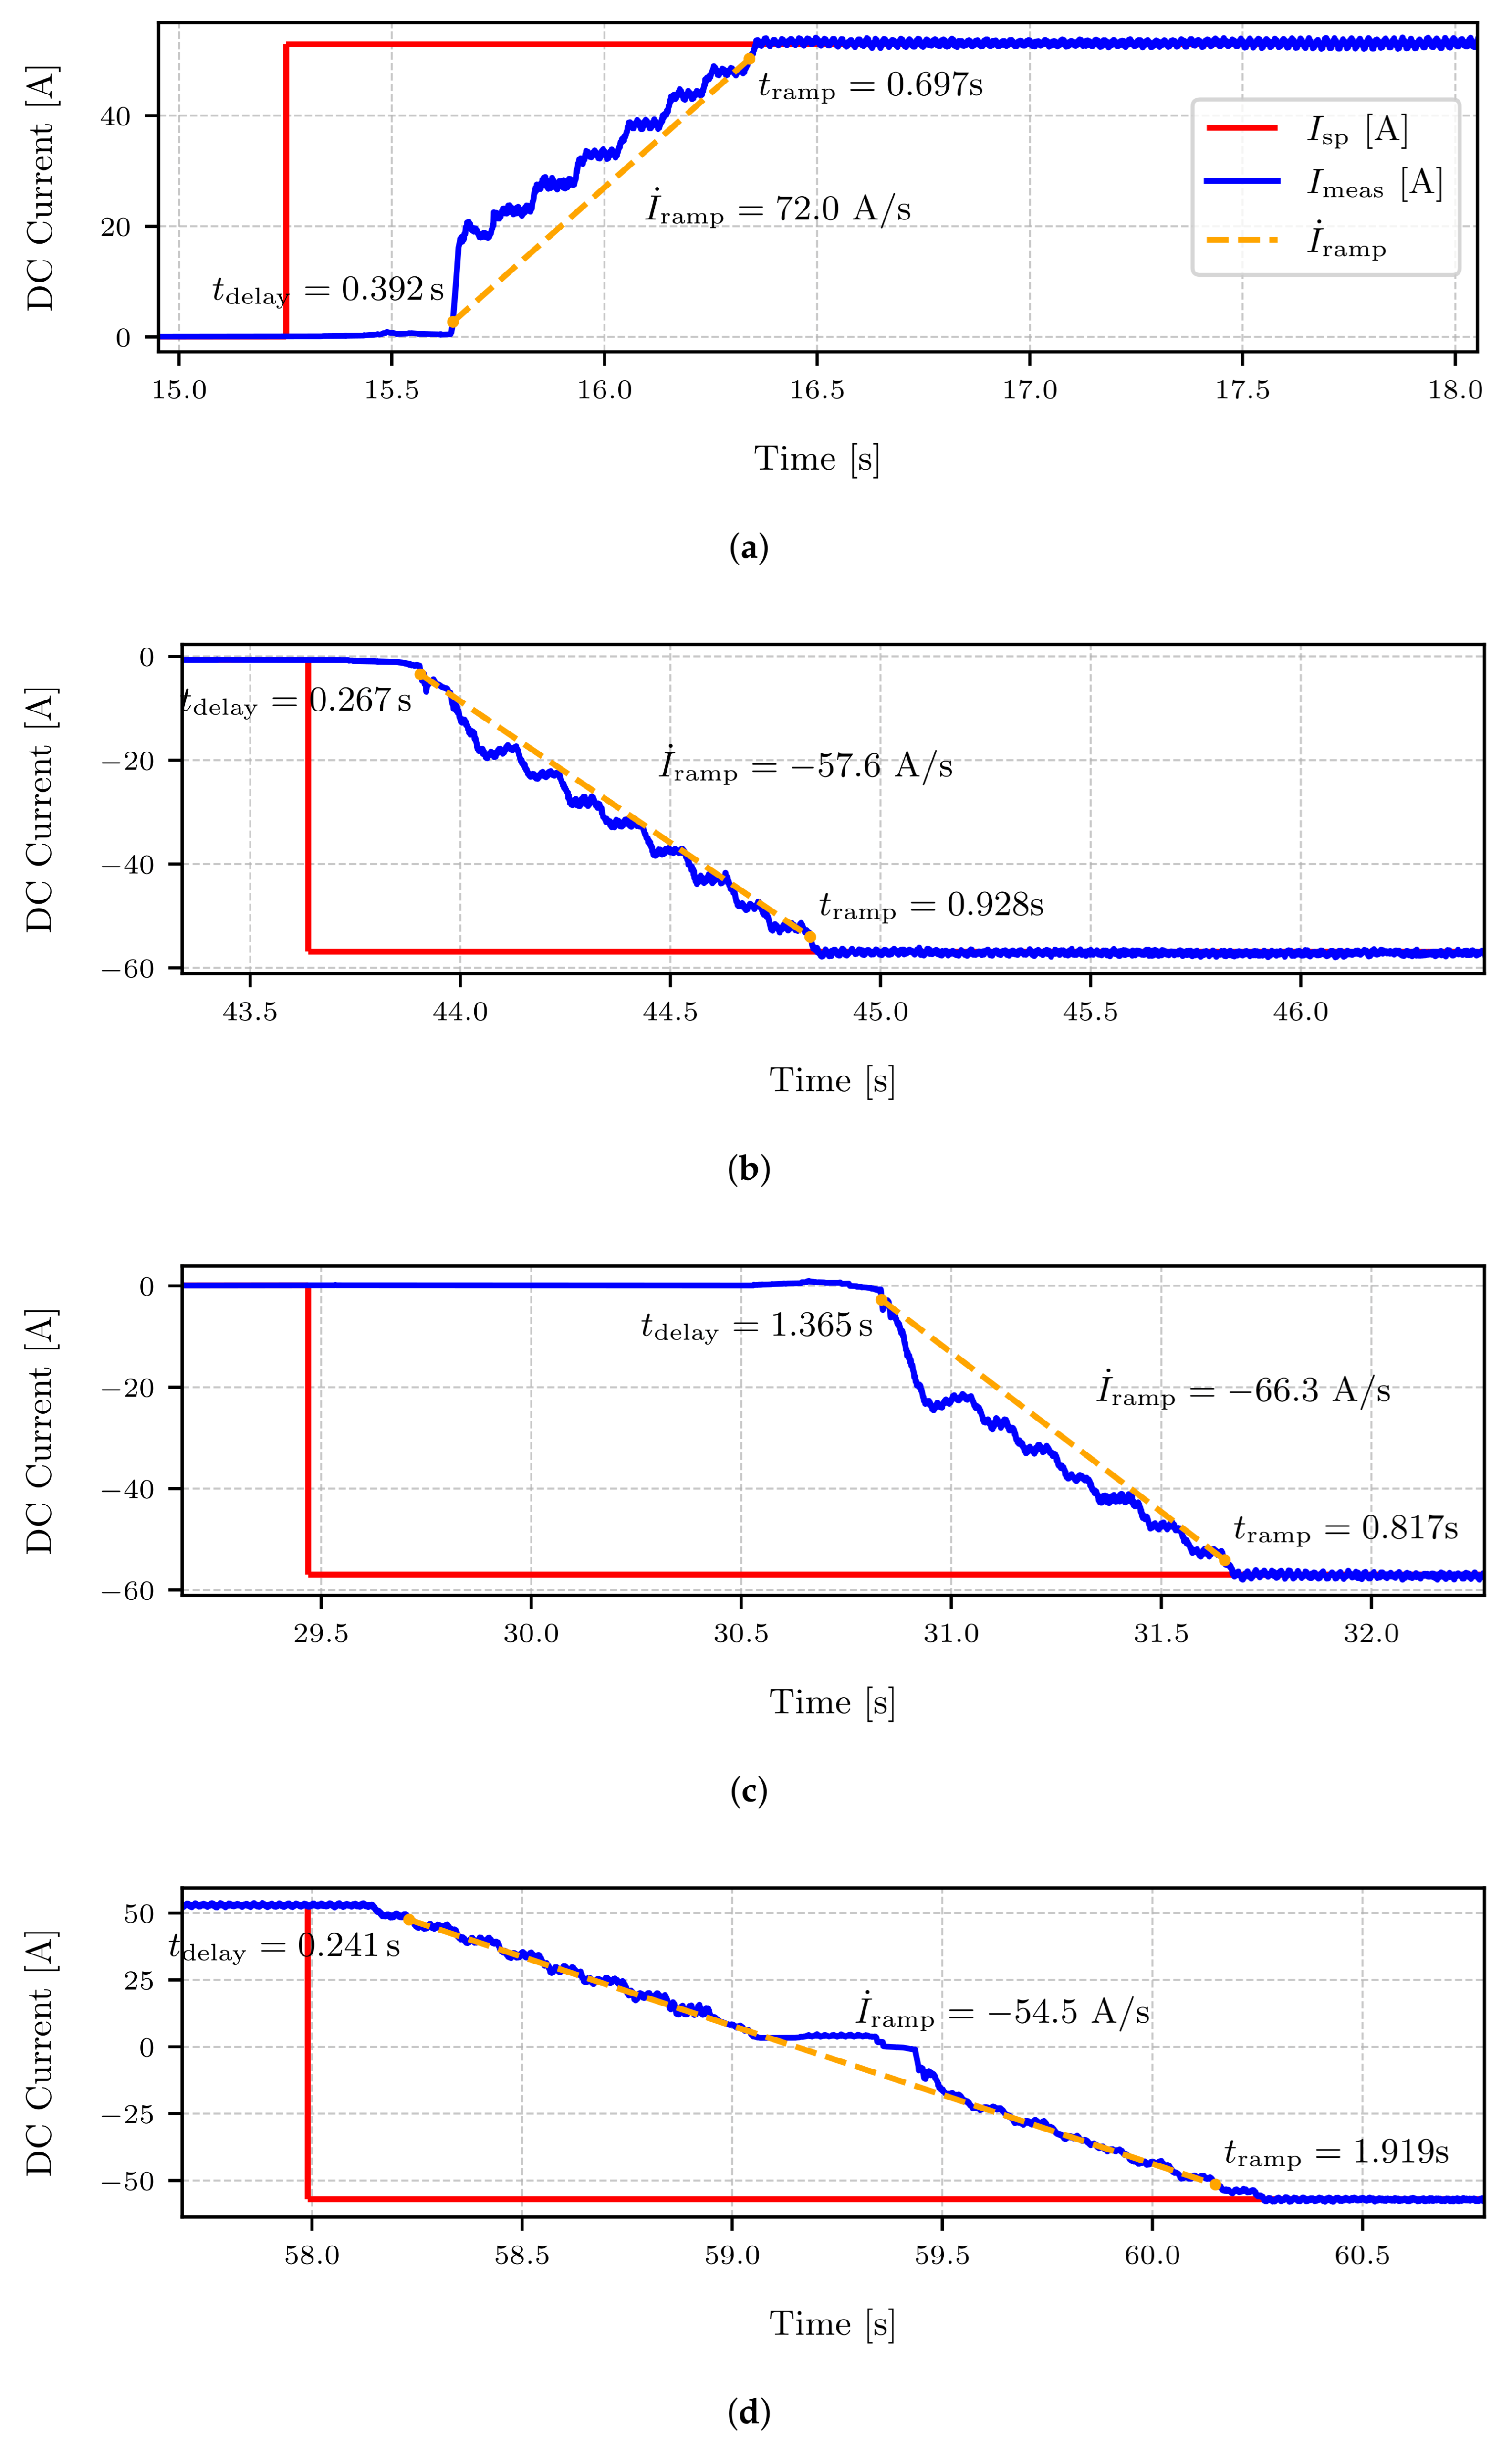
Figure 12.
means of each steps and configuration. The heatmap shows the reaction time of the charger to a setpoint change. The color intensity indicates the mean reaction time in seconds. The results highlight significant differences in response times across configurations, particularly for transitions involving changes in power flow direction.
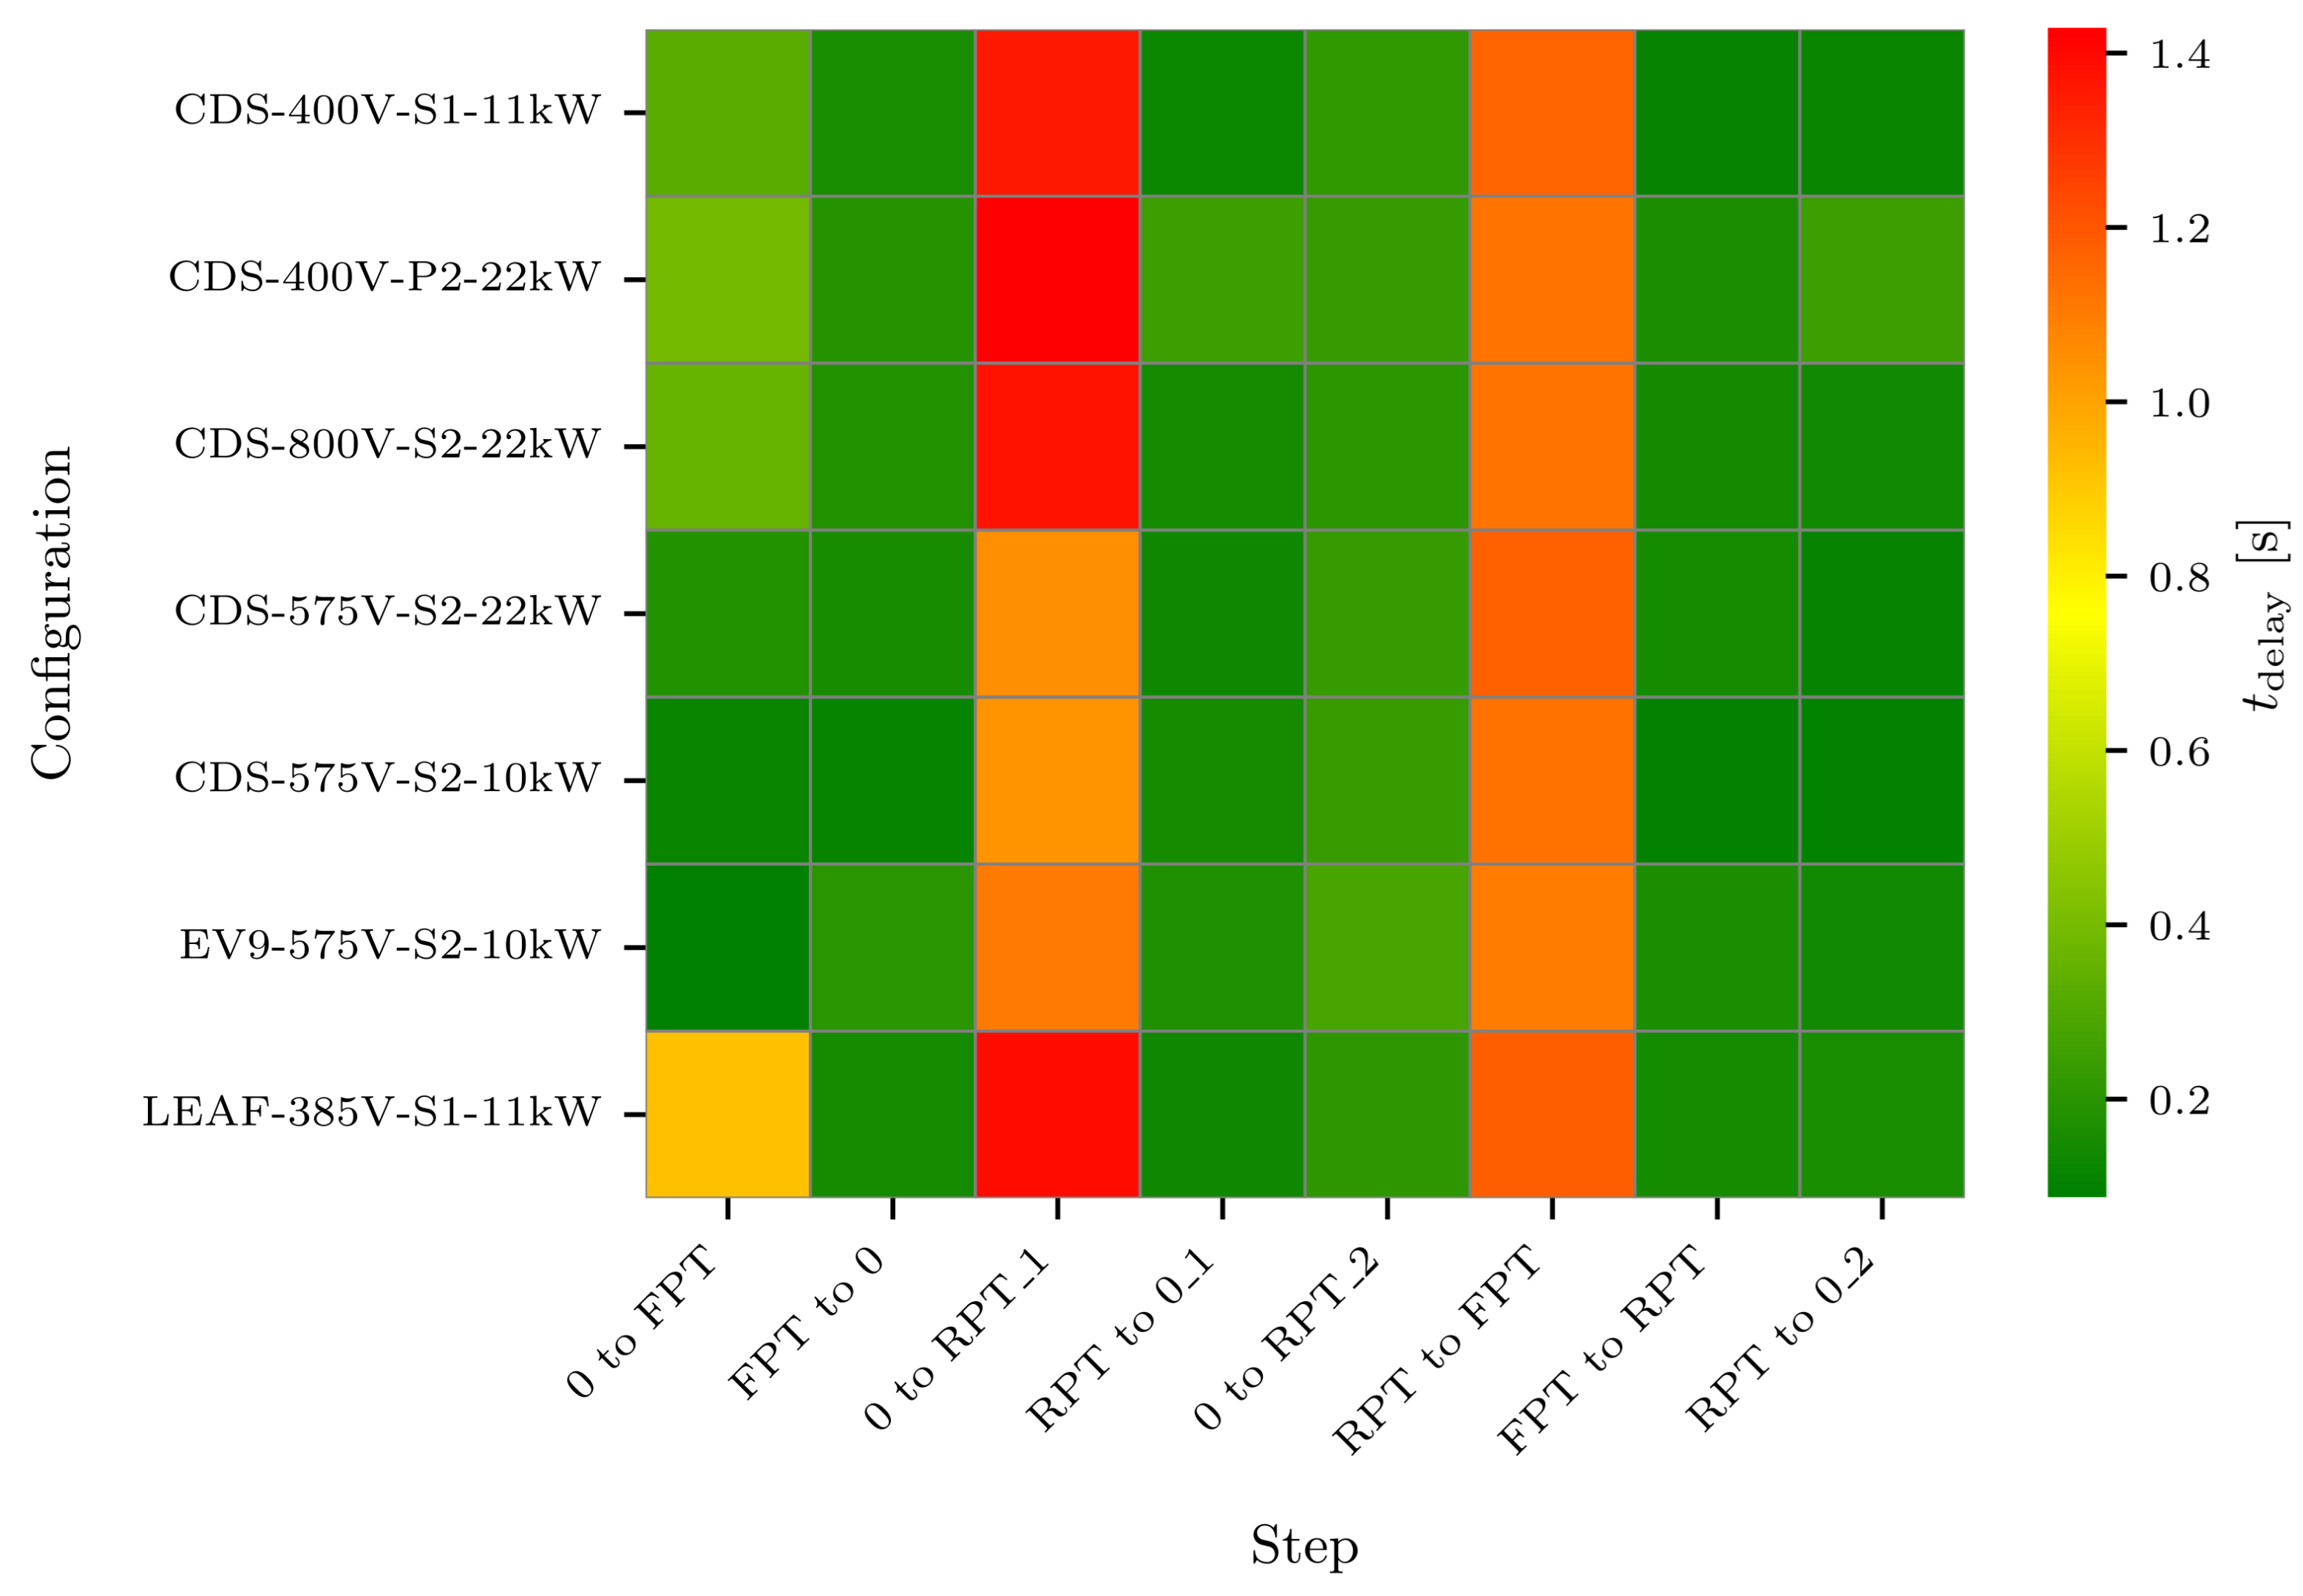
Figure 13.
means of each steps and configuration. The steps of direct change of power flow are obviously longer.
Figure 13.
means of each steps and configuration. The steps of direct change of power flow are obviously longer.
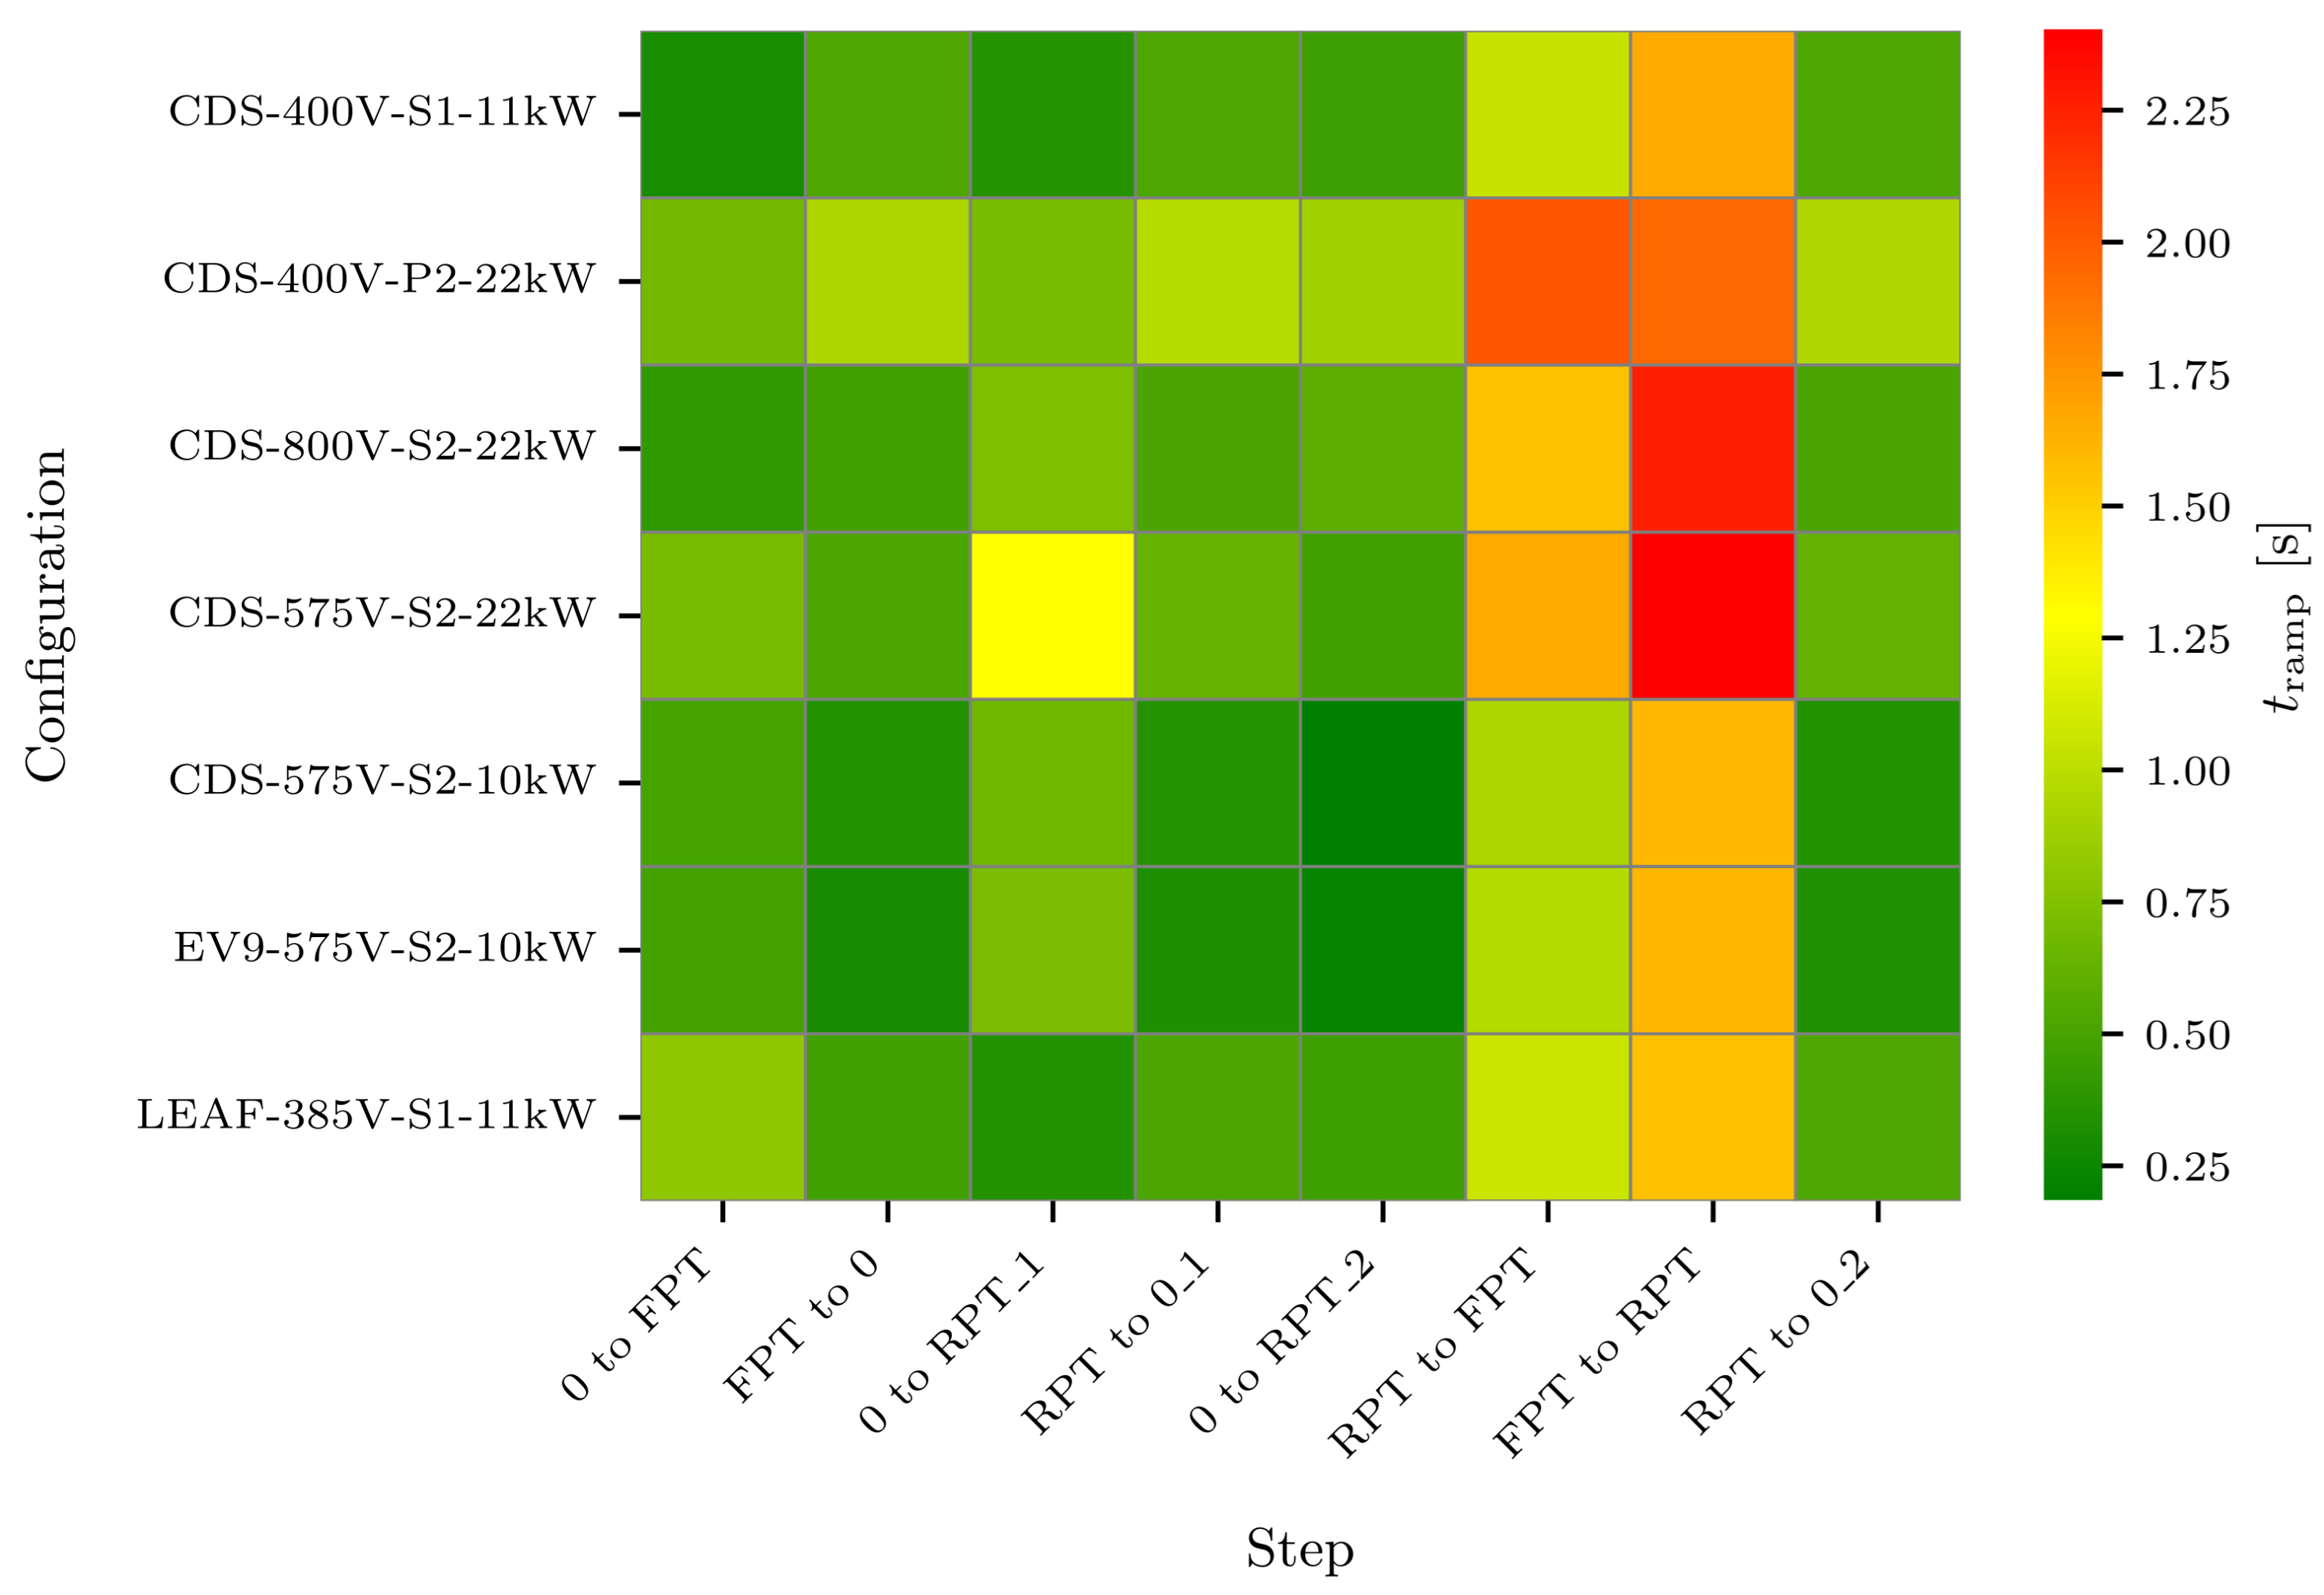
Figure 14.
means of each steps and configuration. The heatmap shows the rate of change of power () during the ramping phase, indicating the EVCS adjusting to new setpoints. The results suggest that operating at nominal voltages yields better performance, while transitions involving changes in power flow direction exhibit slower rates due to additional control delays.
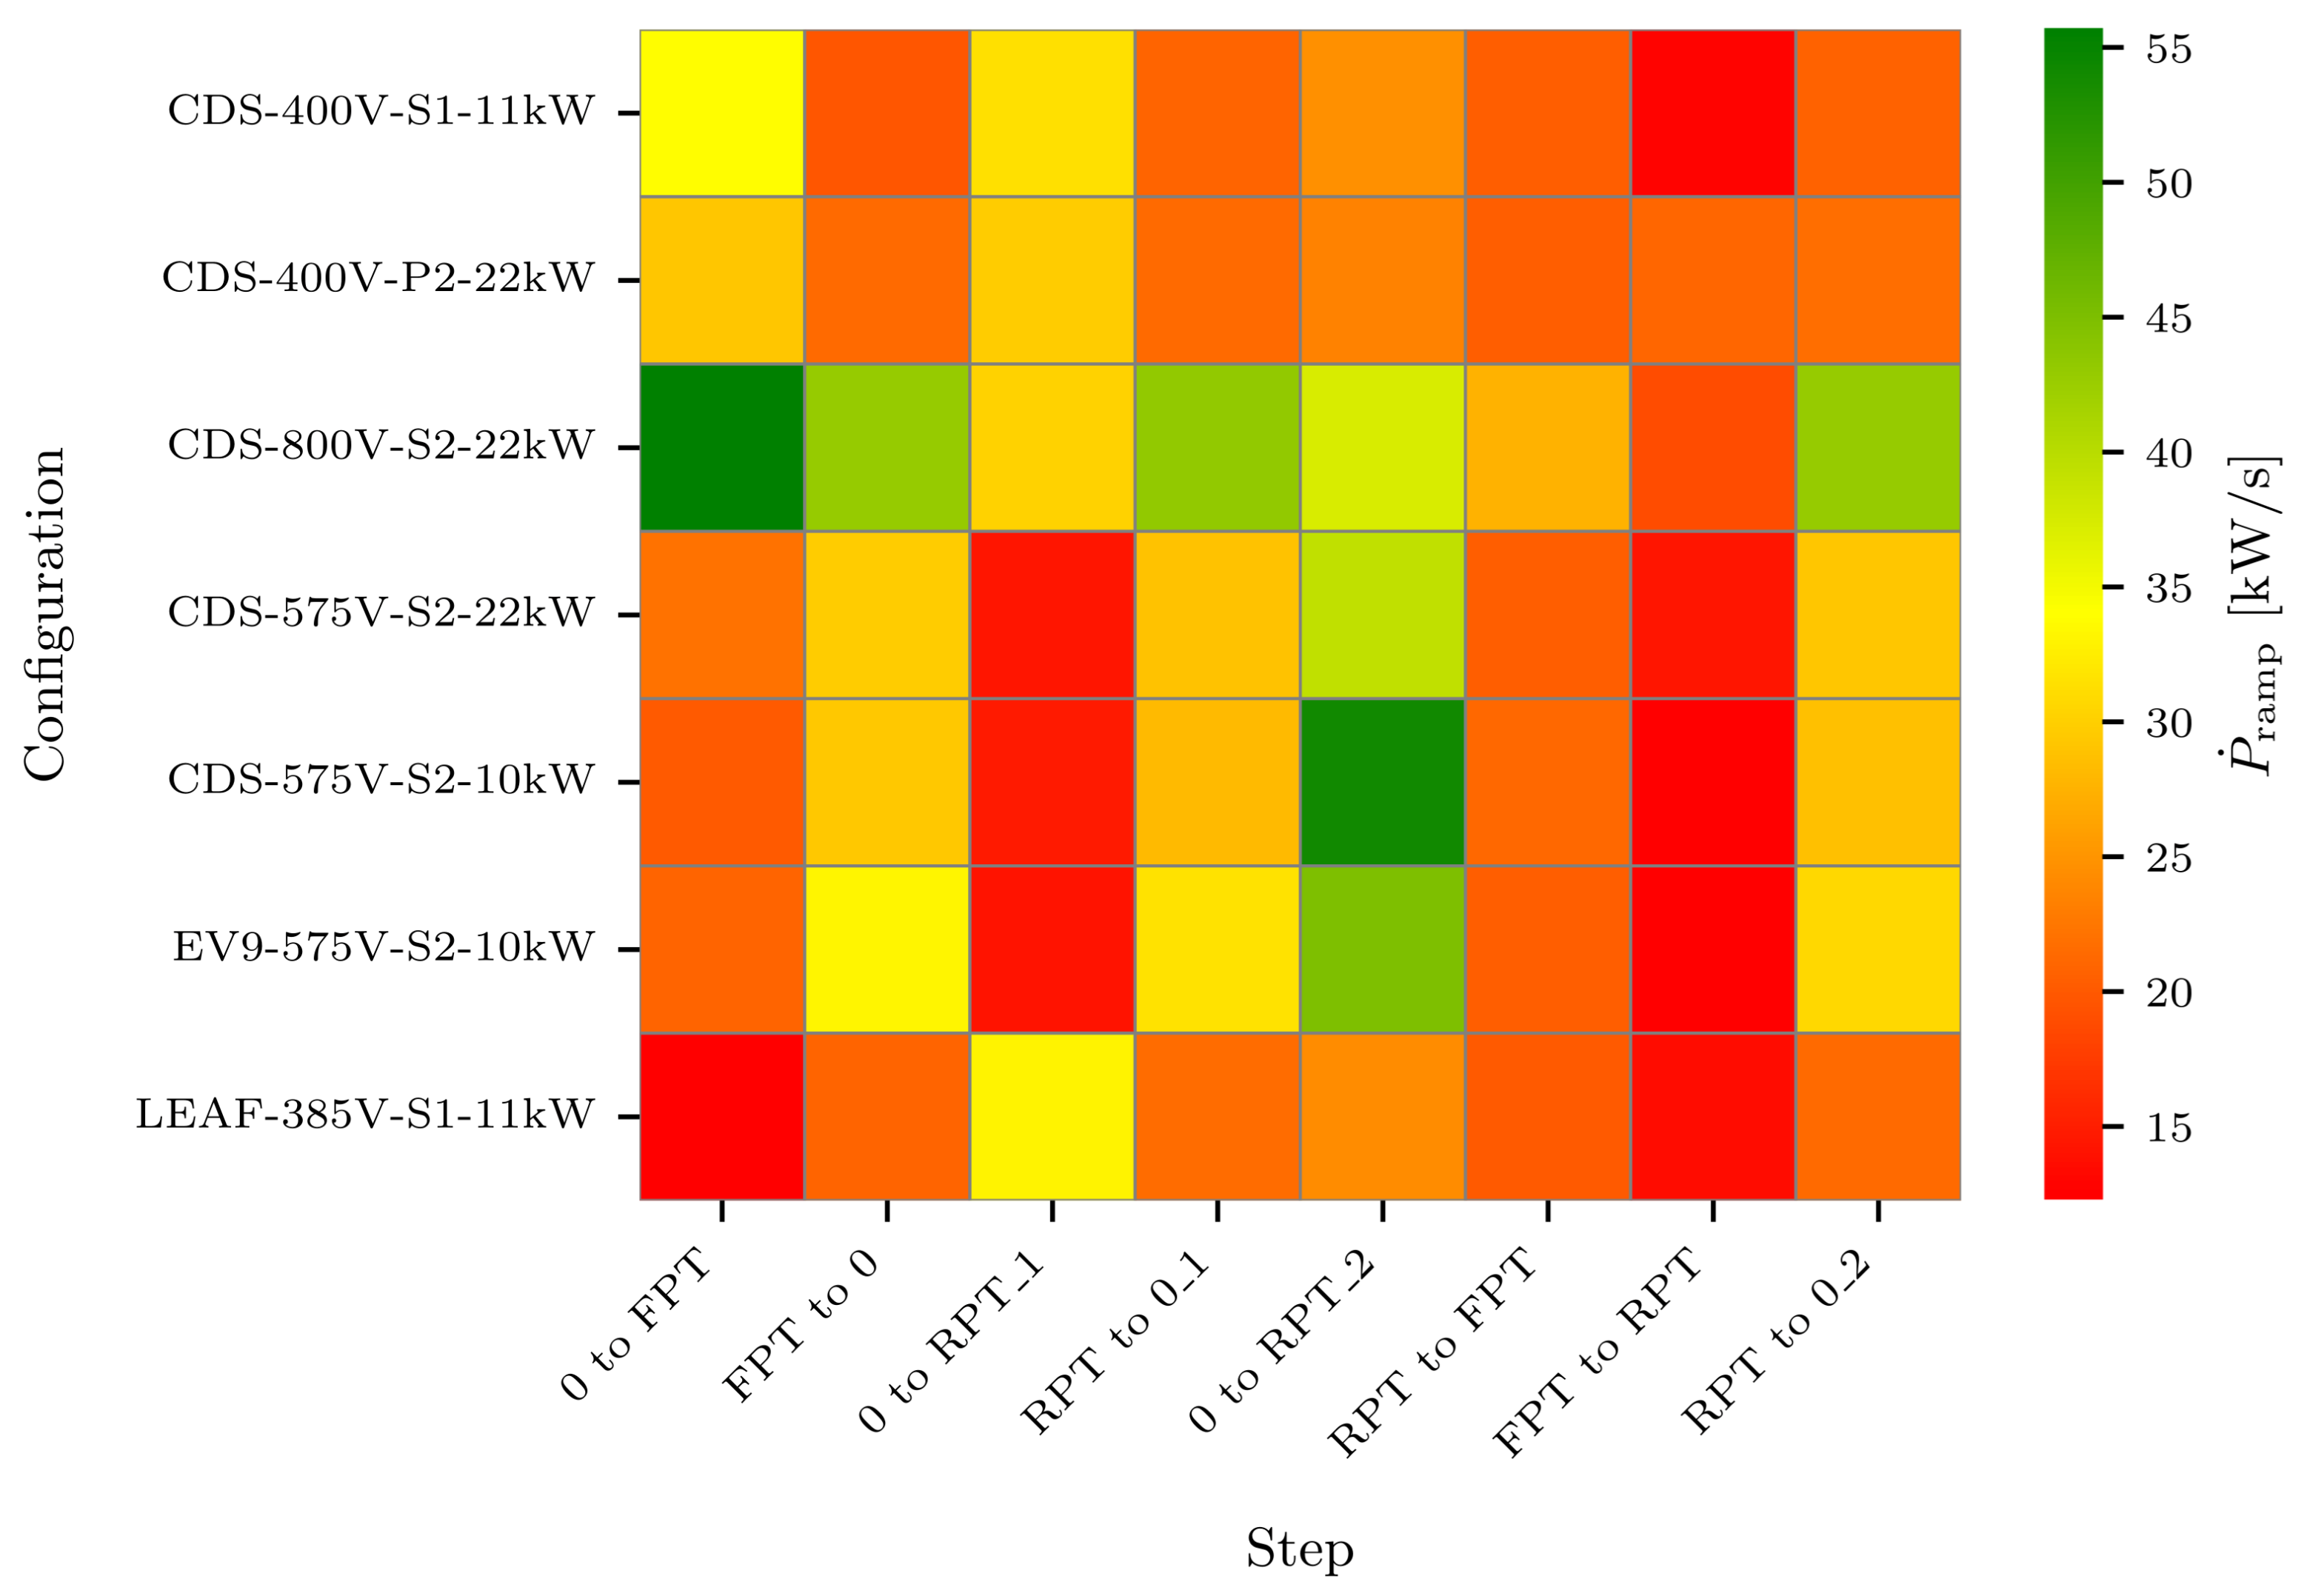

Table 1.
Comparison of CCS2 and CHAdeMO performance parameters. The first four rows present values obtained directly from measurements, while the three rows below show parameters derived from the decomposition into communication delay, power flow reversal (PFR) control, and converter ramp characteristics.
| Parameter | CCS2 | CHAdeMO | Prior study | ||
|---|---|---|---|---|---|
| Mean | CV | Mean | CV | [31] | |
| [s] | 0.43 | 1.039 | 0.535 | 0.999 | 4 |
| [s] | 1.255 | 0.623 | 1.254 | 0.528 | — |
| [A/s] | 49.331 | 0.346 | 54.078 | 0.305 | — |
| [kW/s] | 26.728 | 0.387 | 20.82 | 0.305 | 3.33 |
| (no PFR) [s] | 0.188 | 0.408 | 0.314 | 1.087 | — |
| (no PFR) [kW/s] | 30.916 | 0.326 | 20.036 | 0.227 | — |
| [s] | 1.118 | 0.312 | 0.661 | 0.679 | — |
Table 2.
Additional time, of the three transitions that include a PFR of each configuration tested using Equations(1)–(3) respectively.
Table 2.
Additional time, of the three transitions that include a PFR of each configuration tested using Equations(1)–(3) respectively.
| Configuration | 0 to RPT [s] |
RPT to FPT [s] |
FPT to RPT [s] |
|---|---|---|---|
| CDS-400V-S1-11kW | 1.044 | 1.116 | 0.607 |
| CDS-400V-P2-22kW | 1.027 | 1.018 | 0.064 |
| CDS-800V-S2-22kW | 1.317 | 1.449 | 1.147 |
| CDS-575V-S2-22kW | 1.649 | 1.376 | 1.375 |
| CDS-575V-S2-10kW | 1.29 | 1.14 | 1.024 |
| EV9-575V-S2-10kW | 1.32 | 1.208 | 0.959 |
| LEAF-385V-S1-11kW | 1.064 | 0.178 | 0.741 |
Disclaimer/Publisher’s Note: The statements, opinions and data contained in all publications are solely those of the individual author(s) and contributor(s) and not of MDPI and/or the editor(s). MDPI and/or the editor(s) disclaim responsibility for any injury to people or property resulting from any ideas, methods, instructions or products referred to in the content. |
© 2025 by the authors. Licensee MDPI, Basel, Switzerland. This article is an open access article distributed under the terms and conditions of the Creative Commons Attribution (CC BY) license (http://creativecommons.org/licenses/by/4.0/).
Copyright: This open access article is published under a Creative Commons CC BY 4.0 license, which permit the free download, distribution, and reuse, provided that the author and preprint are cited in any reuse.


