Preprint
Article

This version is not peer-reviewed.

Does the Selected Segment Within a Two-Legged Hopping Trial Alter the Leg Stiffness and Kinetic Performance Values and Their Variability?

A peer-reviewed article of this preprint also exists.

Submitted:

27 October 2025

Posted:

30 October 2025

You are already at the latest version

Abstract

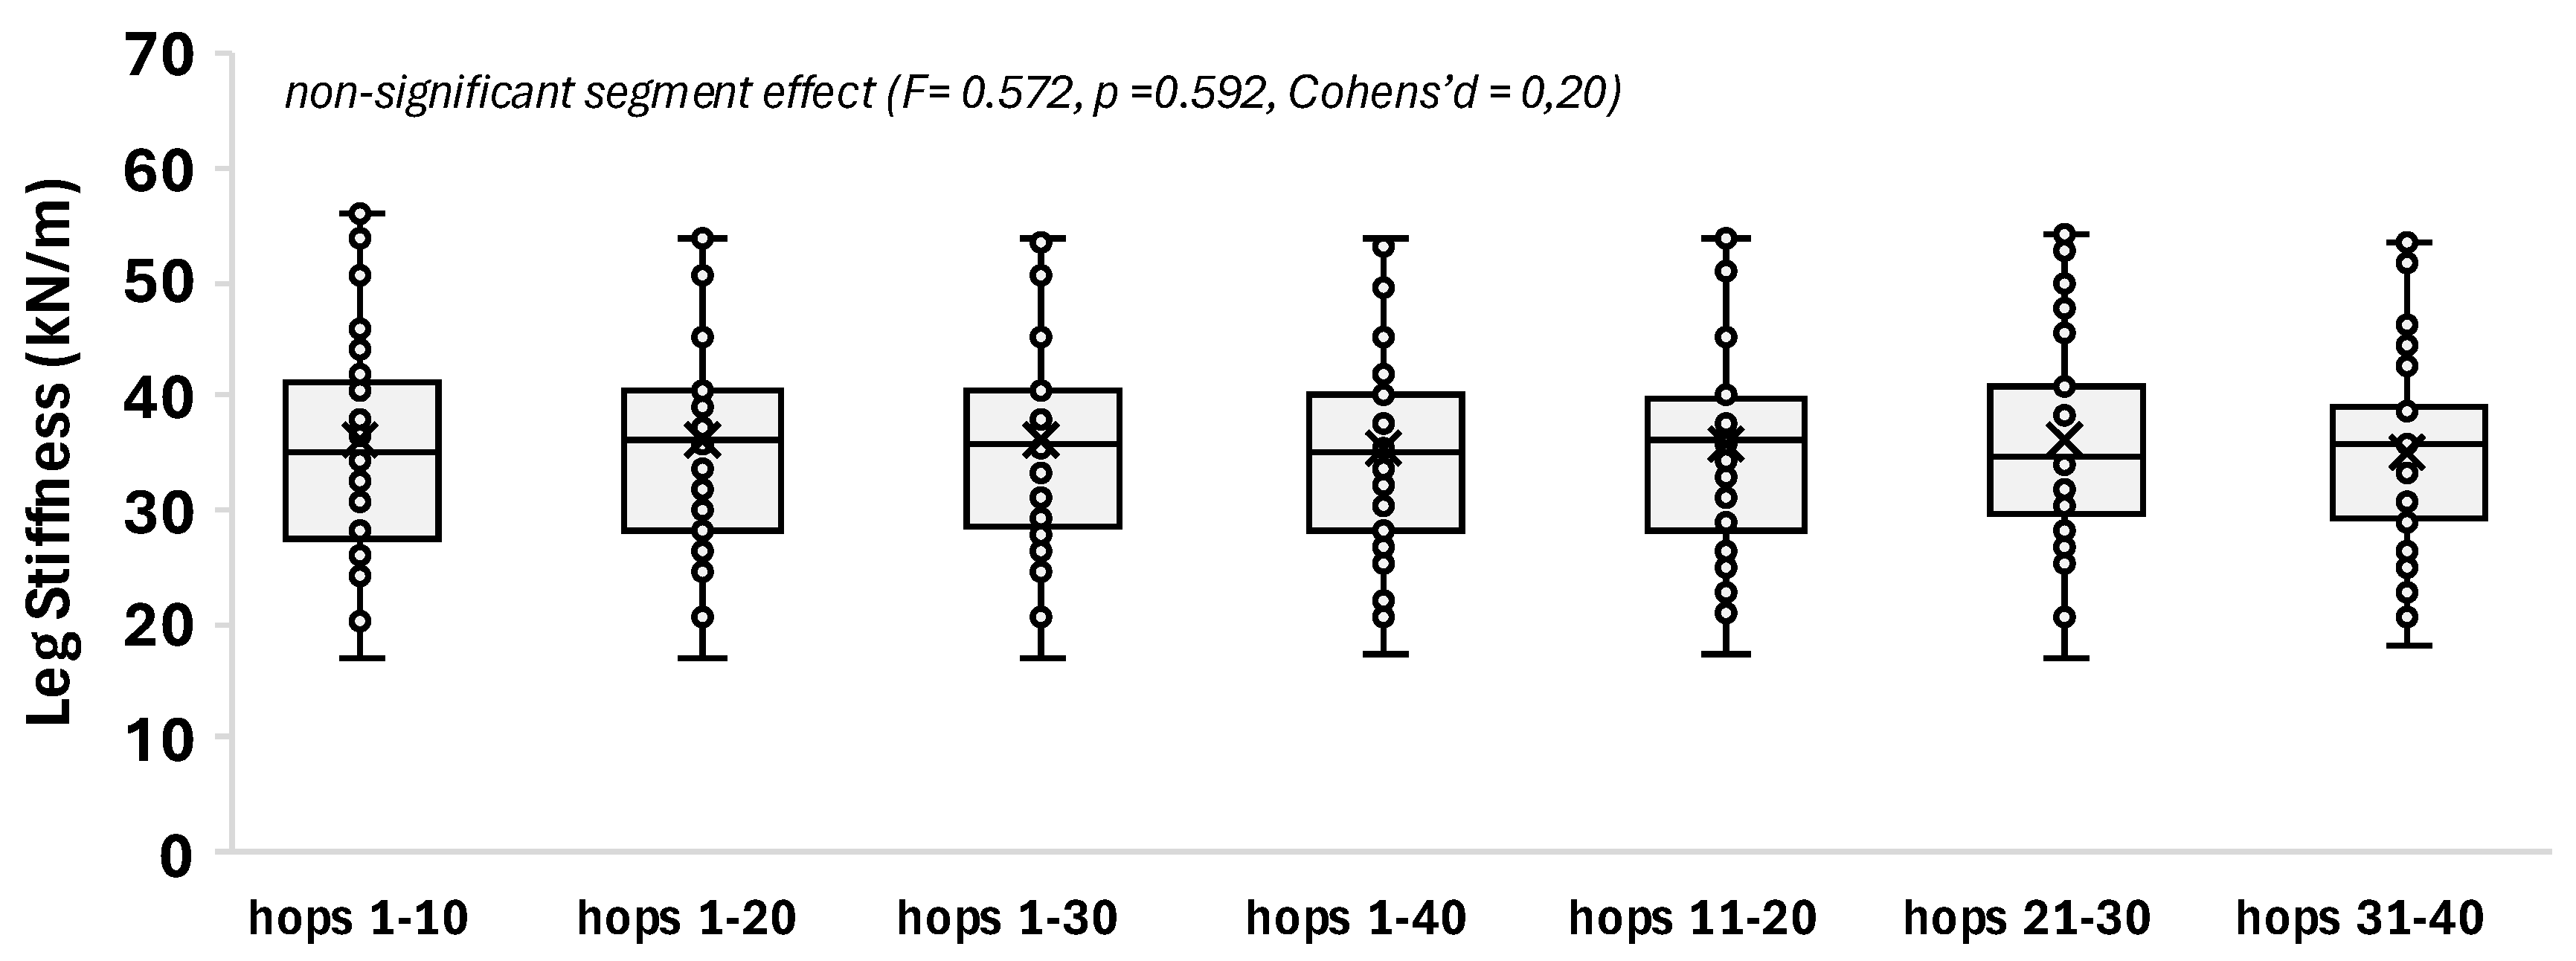
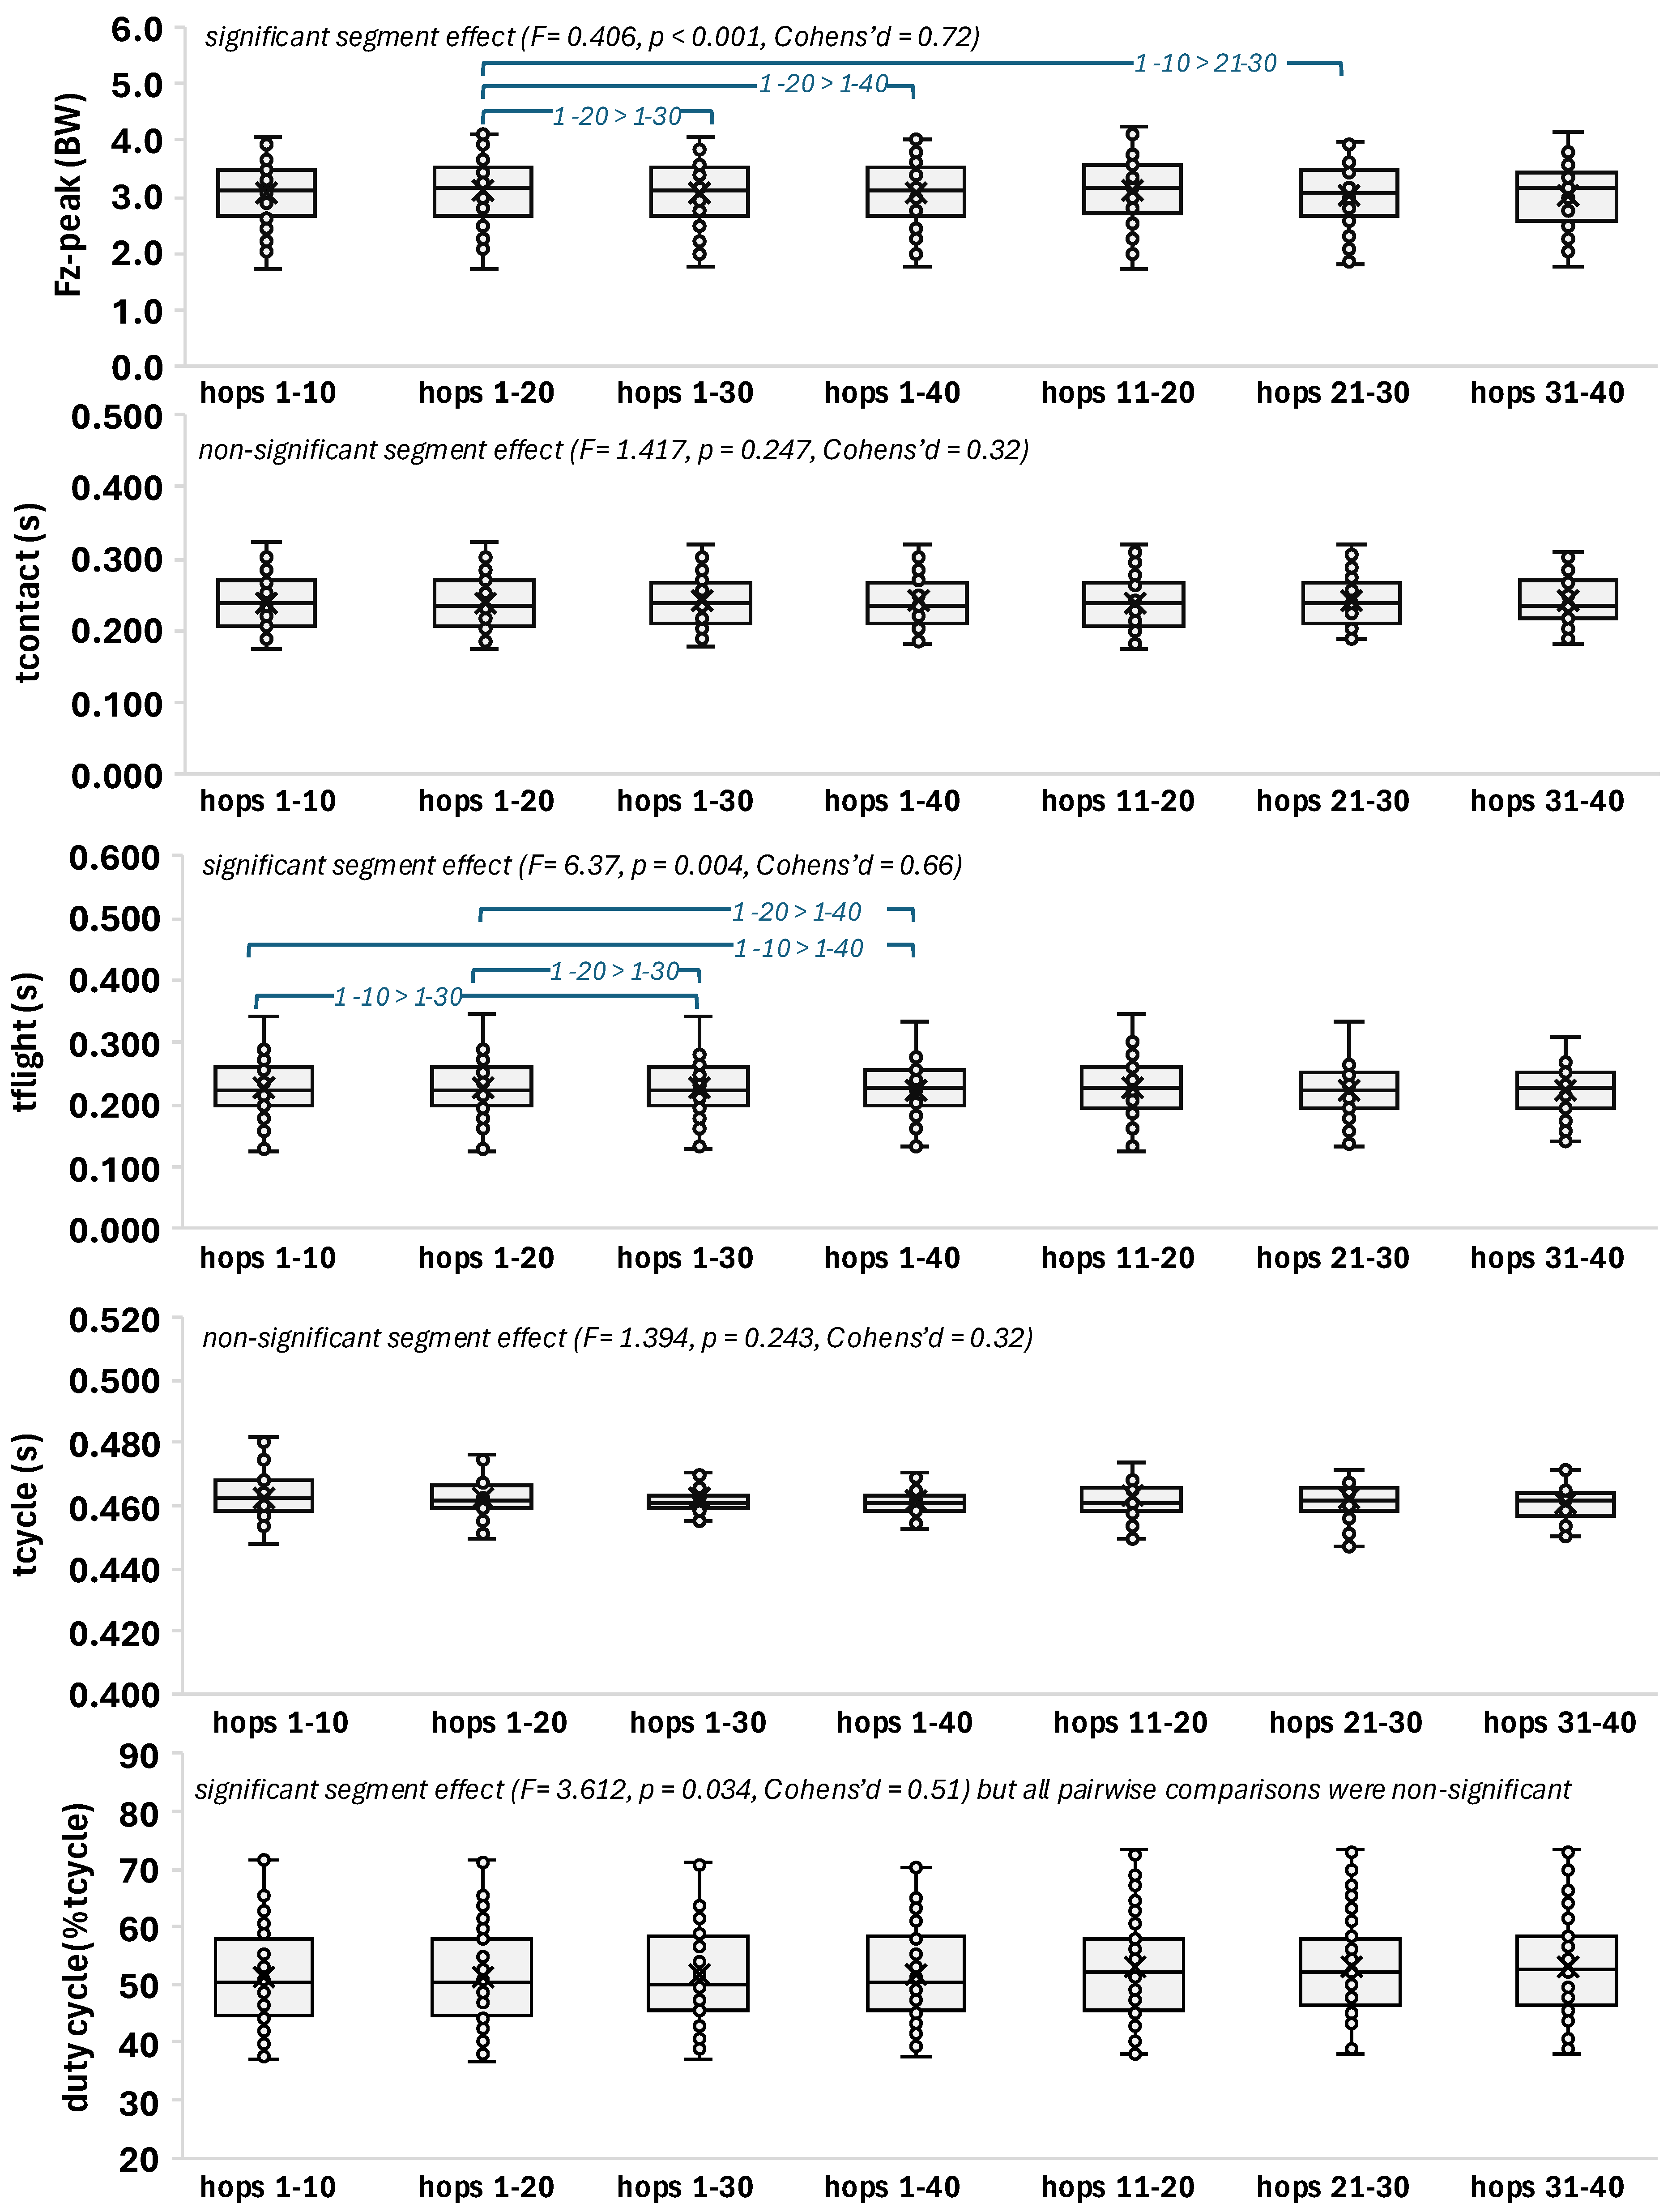
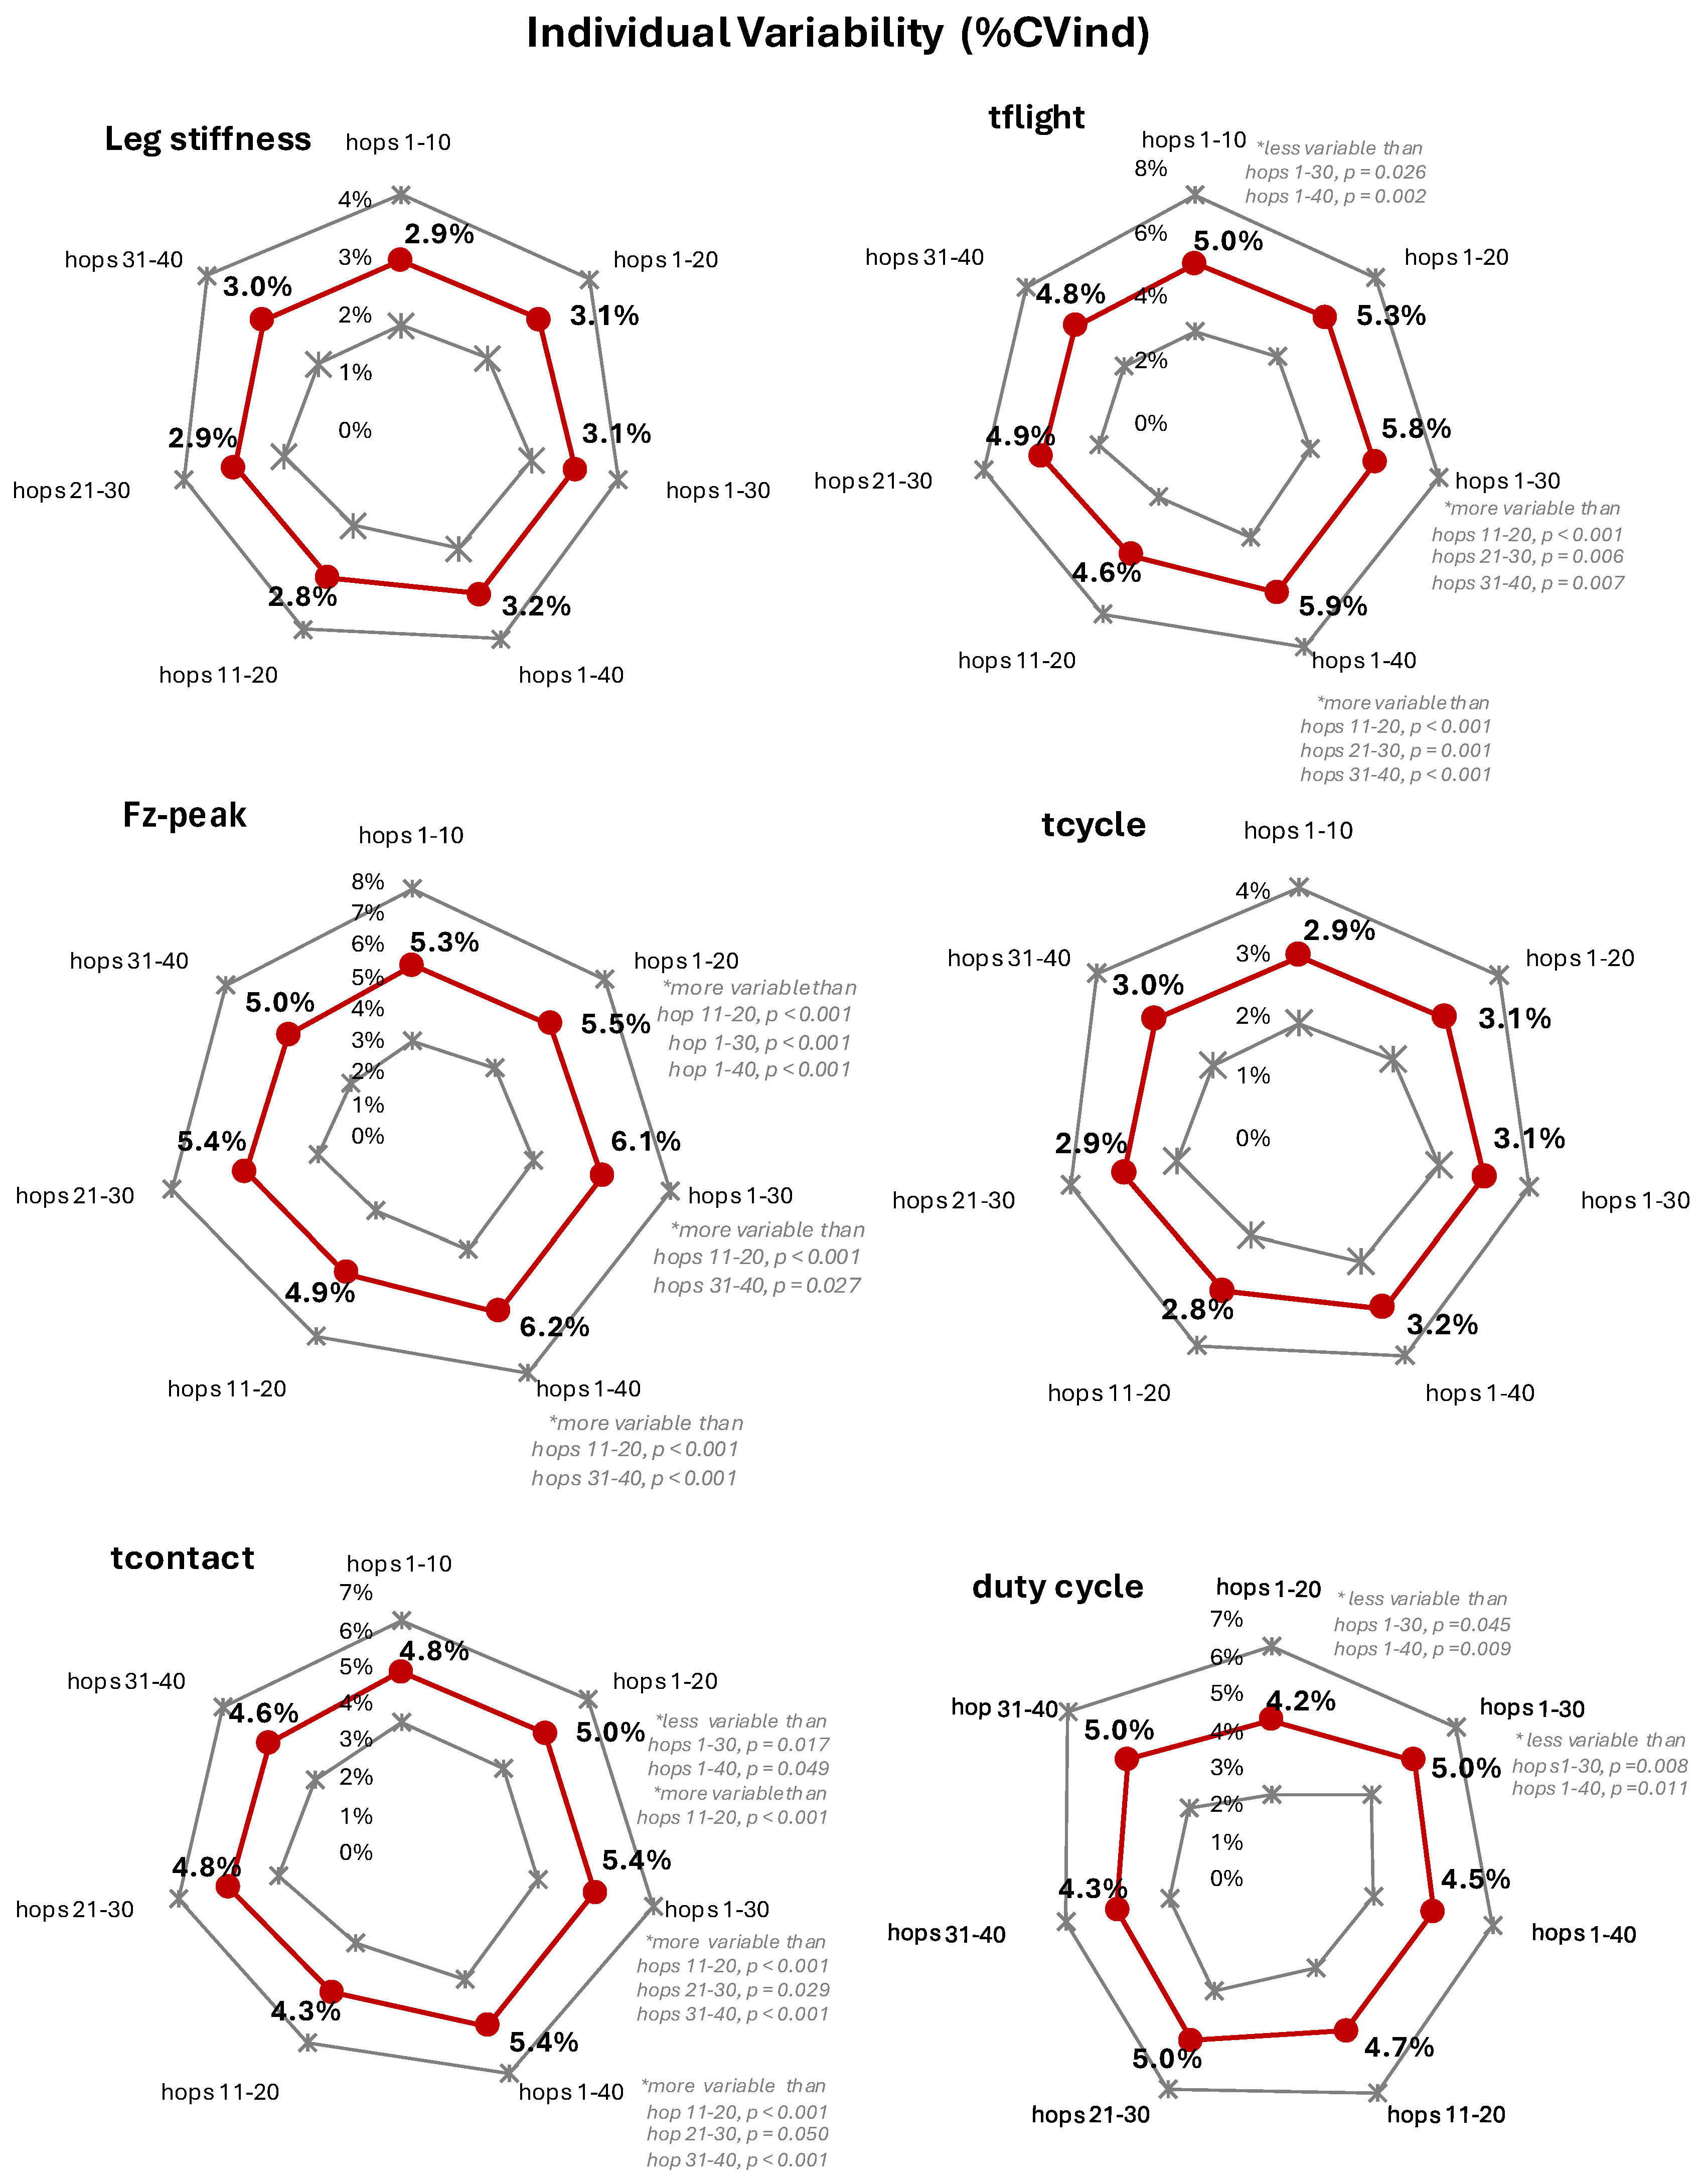
Two-legged hopping is a well-established model for assessing leg stiffness; however, in existing studies, it is unclear whether the trial segment selection affects the results. This study aimed to assess if the selected hopping segment alters the value and individual variability (%CVind) of leg stiffness and kinetic performance metrics. Elite women athletes (42, volleyball, basketball, handball) and 14 non-athletic women performed barefoot two-legged hopping (130 bpm) on a force-plate (Kistler, 9286AA, sampling at 1000Hz). Leg stiffness was estimated from the Fz registration (resonant frequency method). Four cumulative range segments (1–10, 1–20, 1–30, 1–40 hops) and three segments of 10-hop subranges (11–20, 21–30, 31–40) were analyzed (repeated measures one-way Anova, p ≤ 0.05, SPSS v30.0). The hopping segment did not significantly alter the leg stiffness value (segment average 30.6 to 31.2 kN/m) or its %CVind (segment average 3%). The kinetic performance metrics depicted a solid foundation for the extracted leg stiffness value, with %CVind not exceeding 6.2%. The results indicate a data collection of just 15 hops, in continuance reduced to a 10 hops segment (after excluding the first five ones to avoid neuromuscular adaptation) as a robust reference choice.

Keywords: 
;  ;  

1. Introduction

Two-legged hopping in place is a common established protocol for estimating leg stiffness (a biomechanical estimate of how the lower leg resists deformation), due to its repeatable, cyclic nature that imitates a spring-mass system behavior [1,2]. A major research concern is the impact of methodological choices both in data collection as well as in the subsequent data reduction, as those may influence the results accuracy and reliability, and thus the interpretation of the leg stiffness measurements. When applying a two-legged hopping protocol, one should consider the trial duration, defined either by a preset time limit [3,4,5] or by a preset number of hops [6,7,8,9], as well as to ensure the appropriate hopping performance [4,6,7,8,9]. In continuance, one should decide the trial segment that will be used for further analysis through a data reduction procedure, that may employ (a) the exclusion of an initial number of hops to ensure stable performance, (b) the number of critical hops that will be used for calculating the leg stiffness value, in conjunction (c), which will be the ultimate trial segment that the critical hops will be extracted from along the total trial length [4,6,7,8,9,10,11,12].
Despite the wide and well-accepted use of the two-legged hopping protocol for measuring leg stiffness, the descriptions of data collection and data reduction methods demonstrate a vast variety of processes, most often not clearly justified. Although some consistency in criteria remains, this lack of procedural standardization leaves a gap that highlights the importance of establishing the best data reduction technique concerning the leg stiffness value and variability.
Studies with a preset temporal limit.The trial duration variety across studies (either with a preset temporal limit or by a preset number of hops limit) appears to associate with the protocol’s particular perspective, i.e. effect of hopping frequency [3,4,14] or loading condition [4], properties of landing surface [5,13] or landing technique [8].
Overall, the hopping trial durations may be categorized as short (< 30 s) or as long (> 30 up to 60 s). In studies with a preset temporal limit a short trial duration prevails, from just 4 s [4] to 10-15 s [3,5,14] for leg stiffness assessment under different hopping frequencies [3,4,14], different loading conditions [4] or different landing surfaces [5].
Studies with a preset number of hops. The studies where the trial duration was defined by a preset number of hops (rather than a preset temporal duration) mainly aimed the hopping frequency effect, or its interaction, with gender Padua et al. [9, 10 hops], landing technique Lee et al. [8, 15 hops], and bilateral deficit and bilateral asymmetries (either during two- or single-leg hopping performance). Nevertheless, the frequency comparison itself does not forbid the choice of temporally defined trial duration. Thus, the methodological choice was rather arbitrary; it is not clearly known if it might have impacted on the results, and it hinders within-study comparison. Overall, in studies with a present number of hops, this number ranged from 15, 30, and 45, indicating an overall short trial duration from 5 to 15s, with data reduction procedures that resulted in a shorter subset of hops (segments of 5 or 10 hops) that not only varied among studies but also they were not always clearly described.
For example, Padua et al. [9] citing previous studies [10,11], selected (a) the hops that their frequency was within 5% of the designated metronome frequency or the average self-selected hopping rate and (b) the hops that their linear correlation between the vertical center of mass (COM) displacement and vertical ground reaction force during the ground-contact phases of hopping was greater than r = .80. However, the data reduction method of Padua et al. [9] indicates that the 10 hops sub-range used varied in position along the total trial length. Similarly, Lee et al. [8] do not clearly describe the position of the 15-hops segment used in their analysis along the trial length (in addition, the exact trial duration most likely is not explicitly stated, as the data reduction procedure indicates keeping for further analysis 15 consecutive hops after excluding the first and last ones.) Also, Otsuka, et al. [15] reduced their 15-hop data collection in just 5 consecutive hops, from the 6th to the 10th of the total 15-hop without explicitly stating either the 5-hop segment position along the total trial length or their selection criteria. Finally, Maloney et al. [12] like Hobara et al. [6,7,16] and Otsuka et al [15] reduced series of 30 two-legged hops each to just 5 consecutive hops, that is from the 6th to 10th of the total 30 hops, following the criteria of Moresi et al. [17], (that is, the ground contact time of each of the 5 hops should fall within ±5% of the average ground contact time of the 5-hop segment). Yet, considering their statement that all hopping trials met the above criteria, their choice for the 5-hop segment position along the total trial length is not clearly explained.
As shown in the literature, despite the wide and well-accepted use of the two-legged hopping protocol for measuring leg stiffness, the descriptions of data collection and data reduction methods demonstrate a vast variety of processes, often not clearly justified. It is common to use a subset of hops rather than the total of approved hopping cycles. Such hop segment usually comprises 3 to 10, or 15 hops (most commonly 10-15 hops, either consecutive ones or from a dispersed selection). The conceptual convergence implies that a too short or too long hopping segment may influence the leg stiffness outcomes; however, the trial segment labeling as initial, middle, and late emerges relative to the trial duration chosen by the researchers of each study, rather than being objectively and numerically defined based on previous research evidence.
Overall, despite an underlying conceptual similarity in data reduction methods across the leg stiffness studies, little is known about whether the position of the selected hopping segment along the total trial length may indeed affect the magnitude and the individual variability of the leg stiffness and kinetic performance metrics.
The role of individual variability. Temporal stability of kinetic performance—an index of motor control robustness— enables the reproduction of timing patterns with minimal individual variability over time. Crucially, such stability does not imply rigidity; instead, it reveals a flexible system that sustains coordination and energy efficiency under changing conditions. Preferred hopping motor tempo depicts mechanical and energetic economy [1], reinforcing and serving a self-regulating, task-sensitive system that balances motor pattern precision with adaptability [18]. Thus, the requirement to perform in a set rather than the preferred tempo (most often encountered in hopping studies aiming at leg stiffness assessment) may constitute a temporal biomechanical constraint interacting with the effect of trial segment, not only on leg stiffness but also on kinetic performance metrics. Biomechanical constraints (as the set movement tempo) do not necessarily eliminate variability; instead, they may structure it into a form of functional flexibility, enabling the timing system to adapt along trial duration while remaining bounded by the set biomechanical limit [18,19].
Thus, the purpose of this study was to assess whether the selected segment —along the total of a two-legged hopping trial— alters the leg stiffness and kinetic performance values and their variability.

2. Materials and Methods

2.1. Subjects

Forty-two elite female athletes—volleyball (n = 14; 25.3 ± 3.1 years; 74.8 ± 7.8 kg; 180.5 ± 5.9 cm), basketball (n = 14; 27.7 ± 6.3 years; 69.7 ± 11.8 kg; 175.9 ± 8.5 cm), and handball (n = 14; 21.2 ± 3.7 years; 70.1 ± 10.9 kg; 172.7 ± 3.3 cm)—and 14 healthy recreationally active women (26.7 ± 5.0 years; 65.1 ± 9.6 kg; 169.9 ± 7.3 cm) participated in the study. They all reported no lower limb injury within the last 12 months. The research protocol was approved by the School Bioethics Committee and adhered to the Declaration of Helsinki. Individuals had no current or recent musculoskeletal injury, joint pathology or other medical condition that could limit performance of repeated double-legged hops. All participants provided written informed consent prior to participation.

2.2. Experimental Procedures

Each participant was familiarized with the experimental protocol and tested in a single laboratory-based session. After recording body height using a telescopic measuring rod (Secas, DE) and body weight on a calibrated force-plate (Kistler, 9286 AA), each subject performed a light-intensity 5-min warm-up (jogging, typical light stretching for the muscles of the lower extremity, short bouts of two-legged hopping) and practiced the experimental task under supervision and guidance from the examiner. During this specific pre-test familiarization period, the investigator provided corrective feedback designed to ensure that the hopping task was performed appropriately, as described in continuance. The pre-test familiarization hopping tasks (barefoot and shod conditions, both under the metronome cueing) were performed on the force-plate so that the participants were accustomed to the 40 X 60 cm landing area. The familiarization period was followed by 2 min of rest, after which data collection was performed.

2.3. Double-Legged Hopping Task

Each participant hopped barefoot using both legs (2 trials of two-legged hopping, 30 sec each) in the middle of 40 X 60 cm force-pate (Kistler, 9286AA, sampling at 1000Hz, Kistler Measurement, Analysis and Reporting Software v.5.5.1.0.). Hands were kept at midwaist, feet at preferred width and eyes directed forward. Since contact time instructions can influence performance, stiffness as well as stiffness regulation during hopping [20,21], subjects were instructed to hop naturally (minimal secondary movements in other joints other than the ankle), and to land in a similar ankle position to that of take-off (i.e., ankles plantar-flexed). To ensure a linear spring-mass behavior (sinusoidal pattern of the force-time signal) [1,2], each hopping trial was performed at 130 bpm set frequency, indicated audibly to subjects via the Tempo Perfect Metronome v.2.02a Software (available at Google Play, https://play.google.com/store/apps/details?id=com.nchsoftware.tempoperfect). The set 130 bpmfrequency corresponds to 2.17 Hz, the latter near or slightly above the average preferred self-selected hopping frequency stated for females [4, 2.07 ±0.18Hz; 11, 2.31±0.35Hz; 12, 2.8 ± 0.3 Hz; 22, 2.17±0.07 Hz; 23, 2.05 ± 0.12 Hz]. If subjects failed to perform a hopping trial adequately– e.g. landed outside the forceplate area, the trial was disregarded and was repeated after a 2 min of rest.

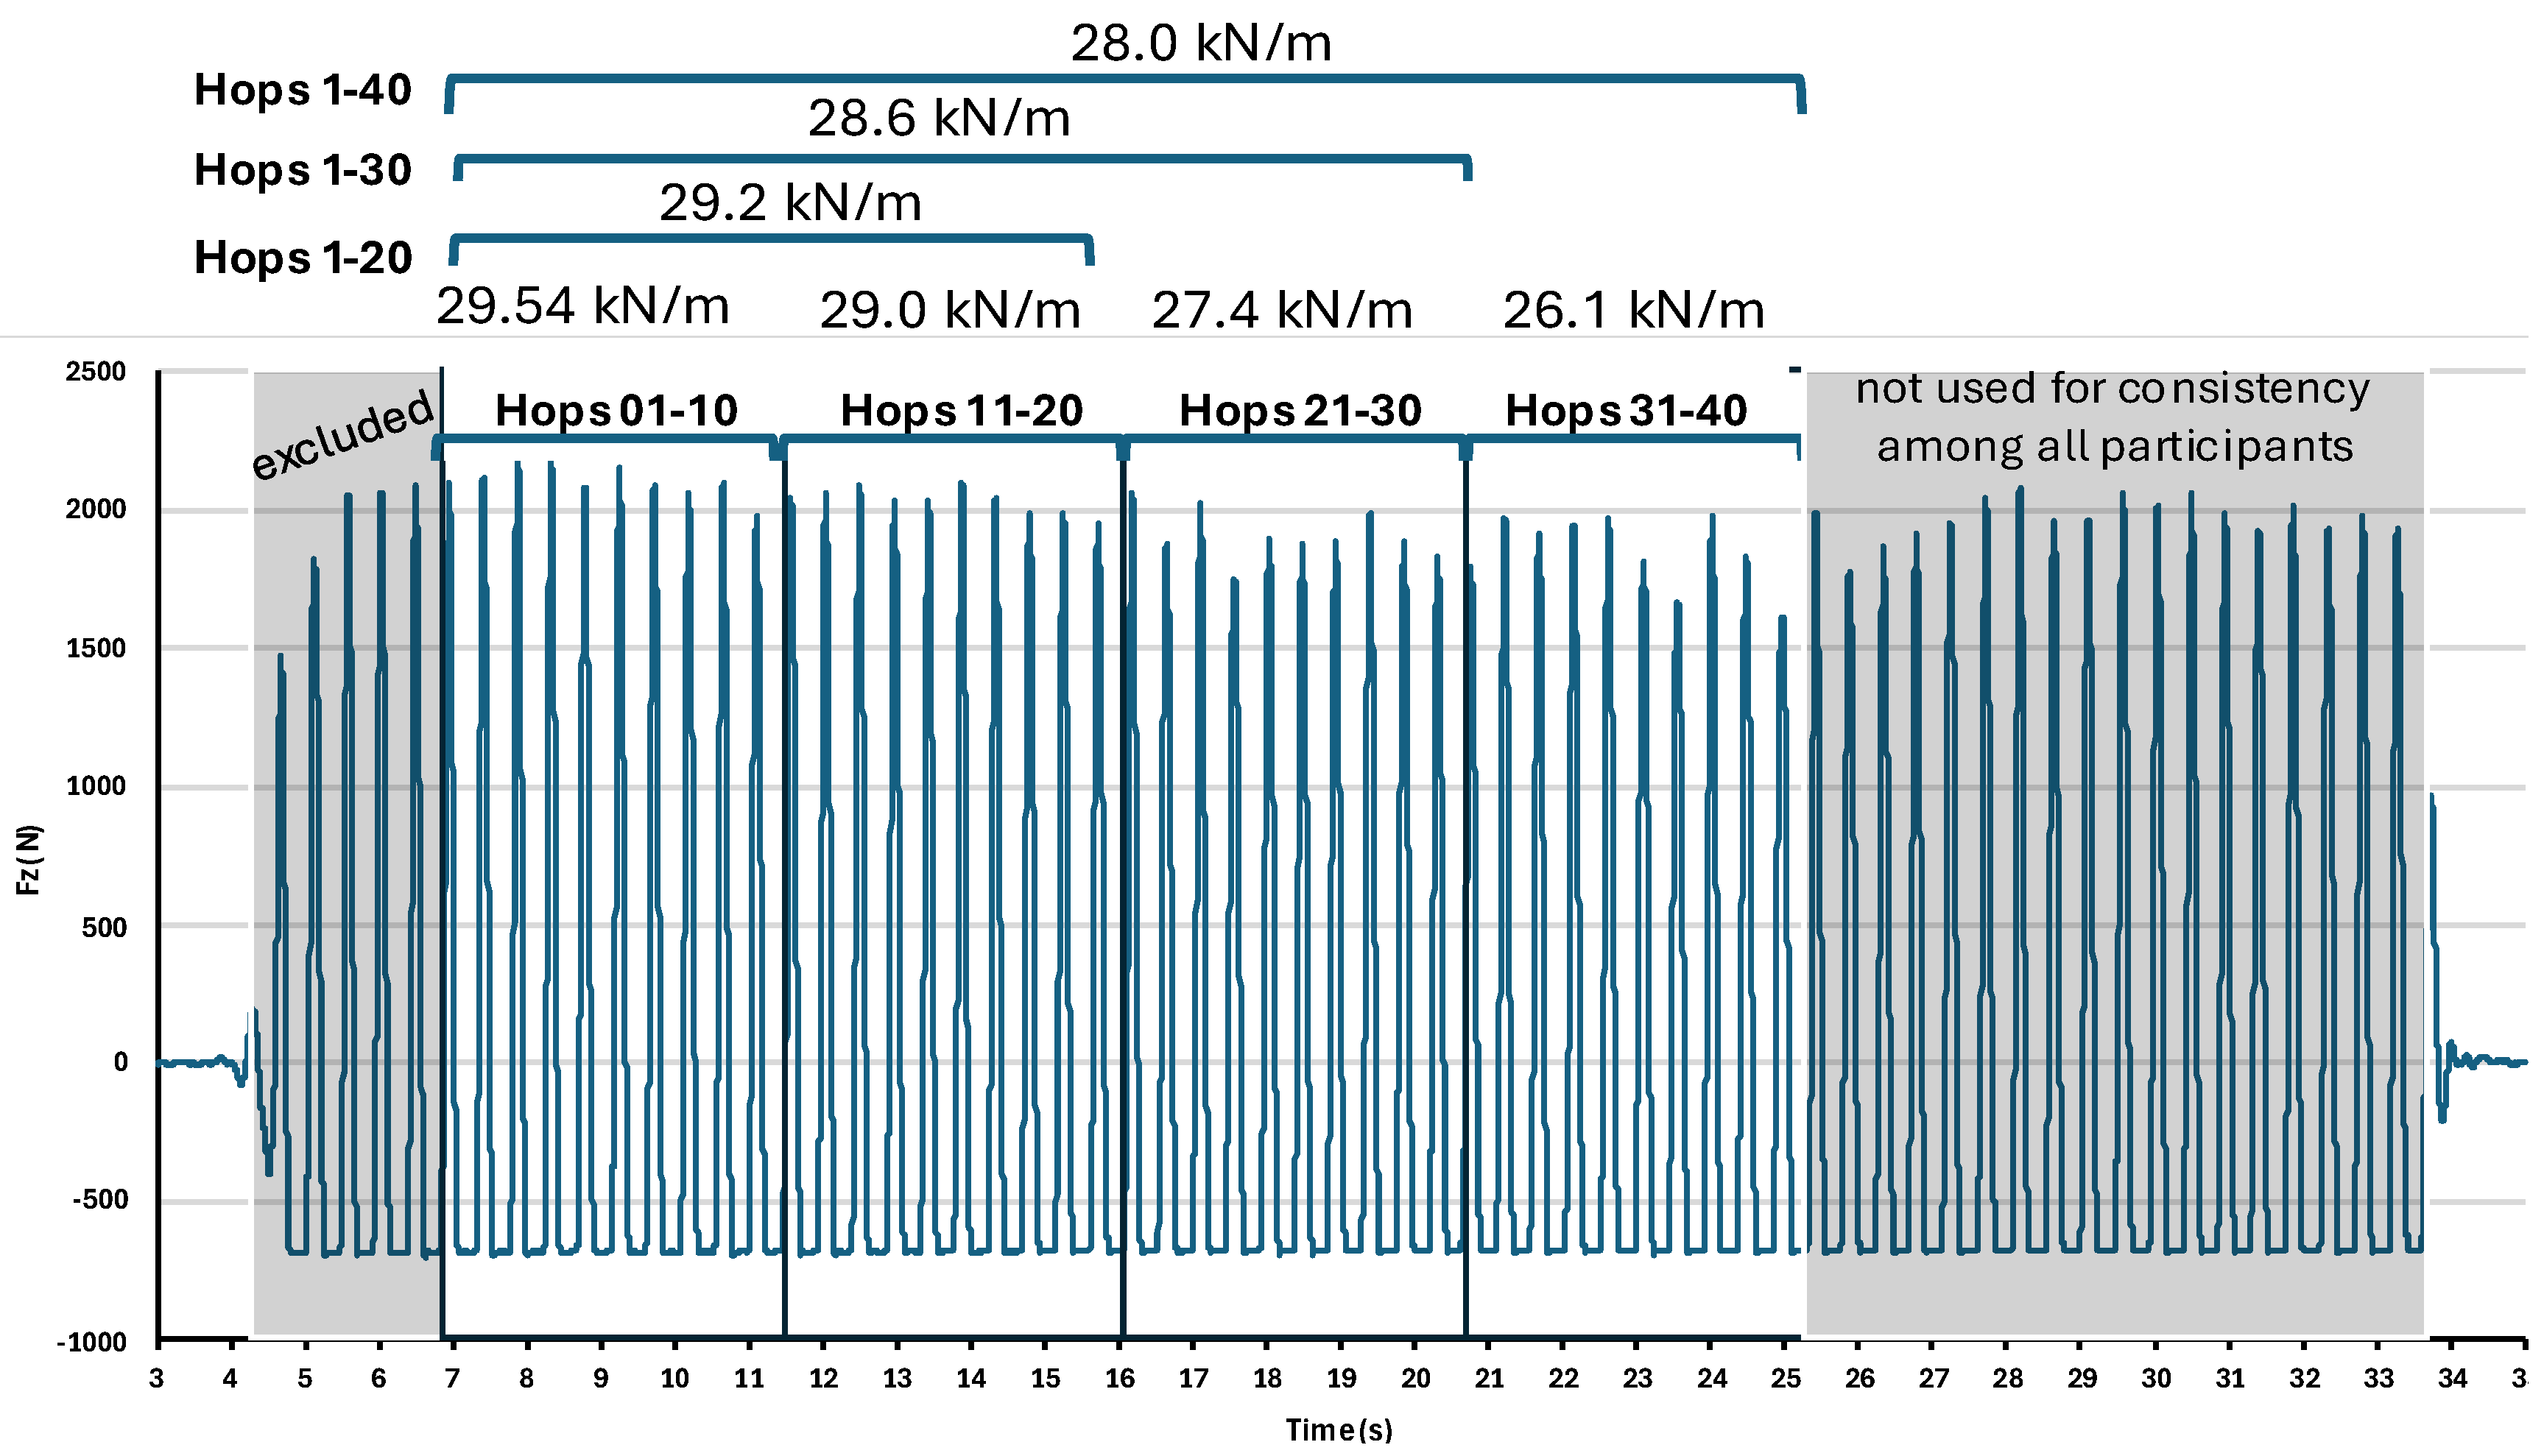
2.4. Hopping Segment Extraction

To avoid the phase of neuromuscular adaptation [21], the first five hops of each trial were excluded, which constitutes a common procedure in previous studies [3,6,7,12,15,16,23]. From the remaining data, four cumulative hopping segments of increasing range were extracted, starting from the 1st hop and ending at the 10th, 20th, 30th, and 40th one. In addition, four consecutive 10-hop sub-ranges were extracted: hops 1st – 10th, 11th – 20th, 21st – 30th, and 31st – 40th (Figure 1). These segmentations allowed for analysis of both cumulative trial windows (increasing trial length) as well as discrete sub-ranges of consecutive hops (same trial length but at different positioning along the total trial).

2.5. Performed Frequency Against the Set Frequency of 130 bpm

One-sample t-test (with 130 bpm as the test value) was applied to examine if participants (per group as well as per the total of participants) adhered successfully to the set metronomic tempo of 130 bpm (SPSS version 30.0, IBM statistics, significance level at a ≤ 0.05). As shown in Table 1, across all trial segments, and both per group as well as for the total of participants, the performed hopping frequency did not differ significantly (p > 0.05) from the 130bpm set hopping frequency. In addition, the performed hopping frequency showed non-significant group differences (Table 1, One Way Anova for independent groups, SPSS version 30.0, IBM statistics, p ≤ 0.05).

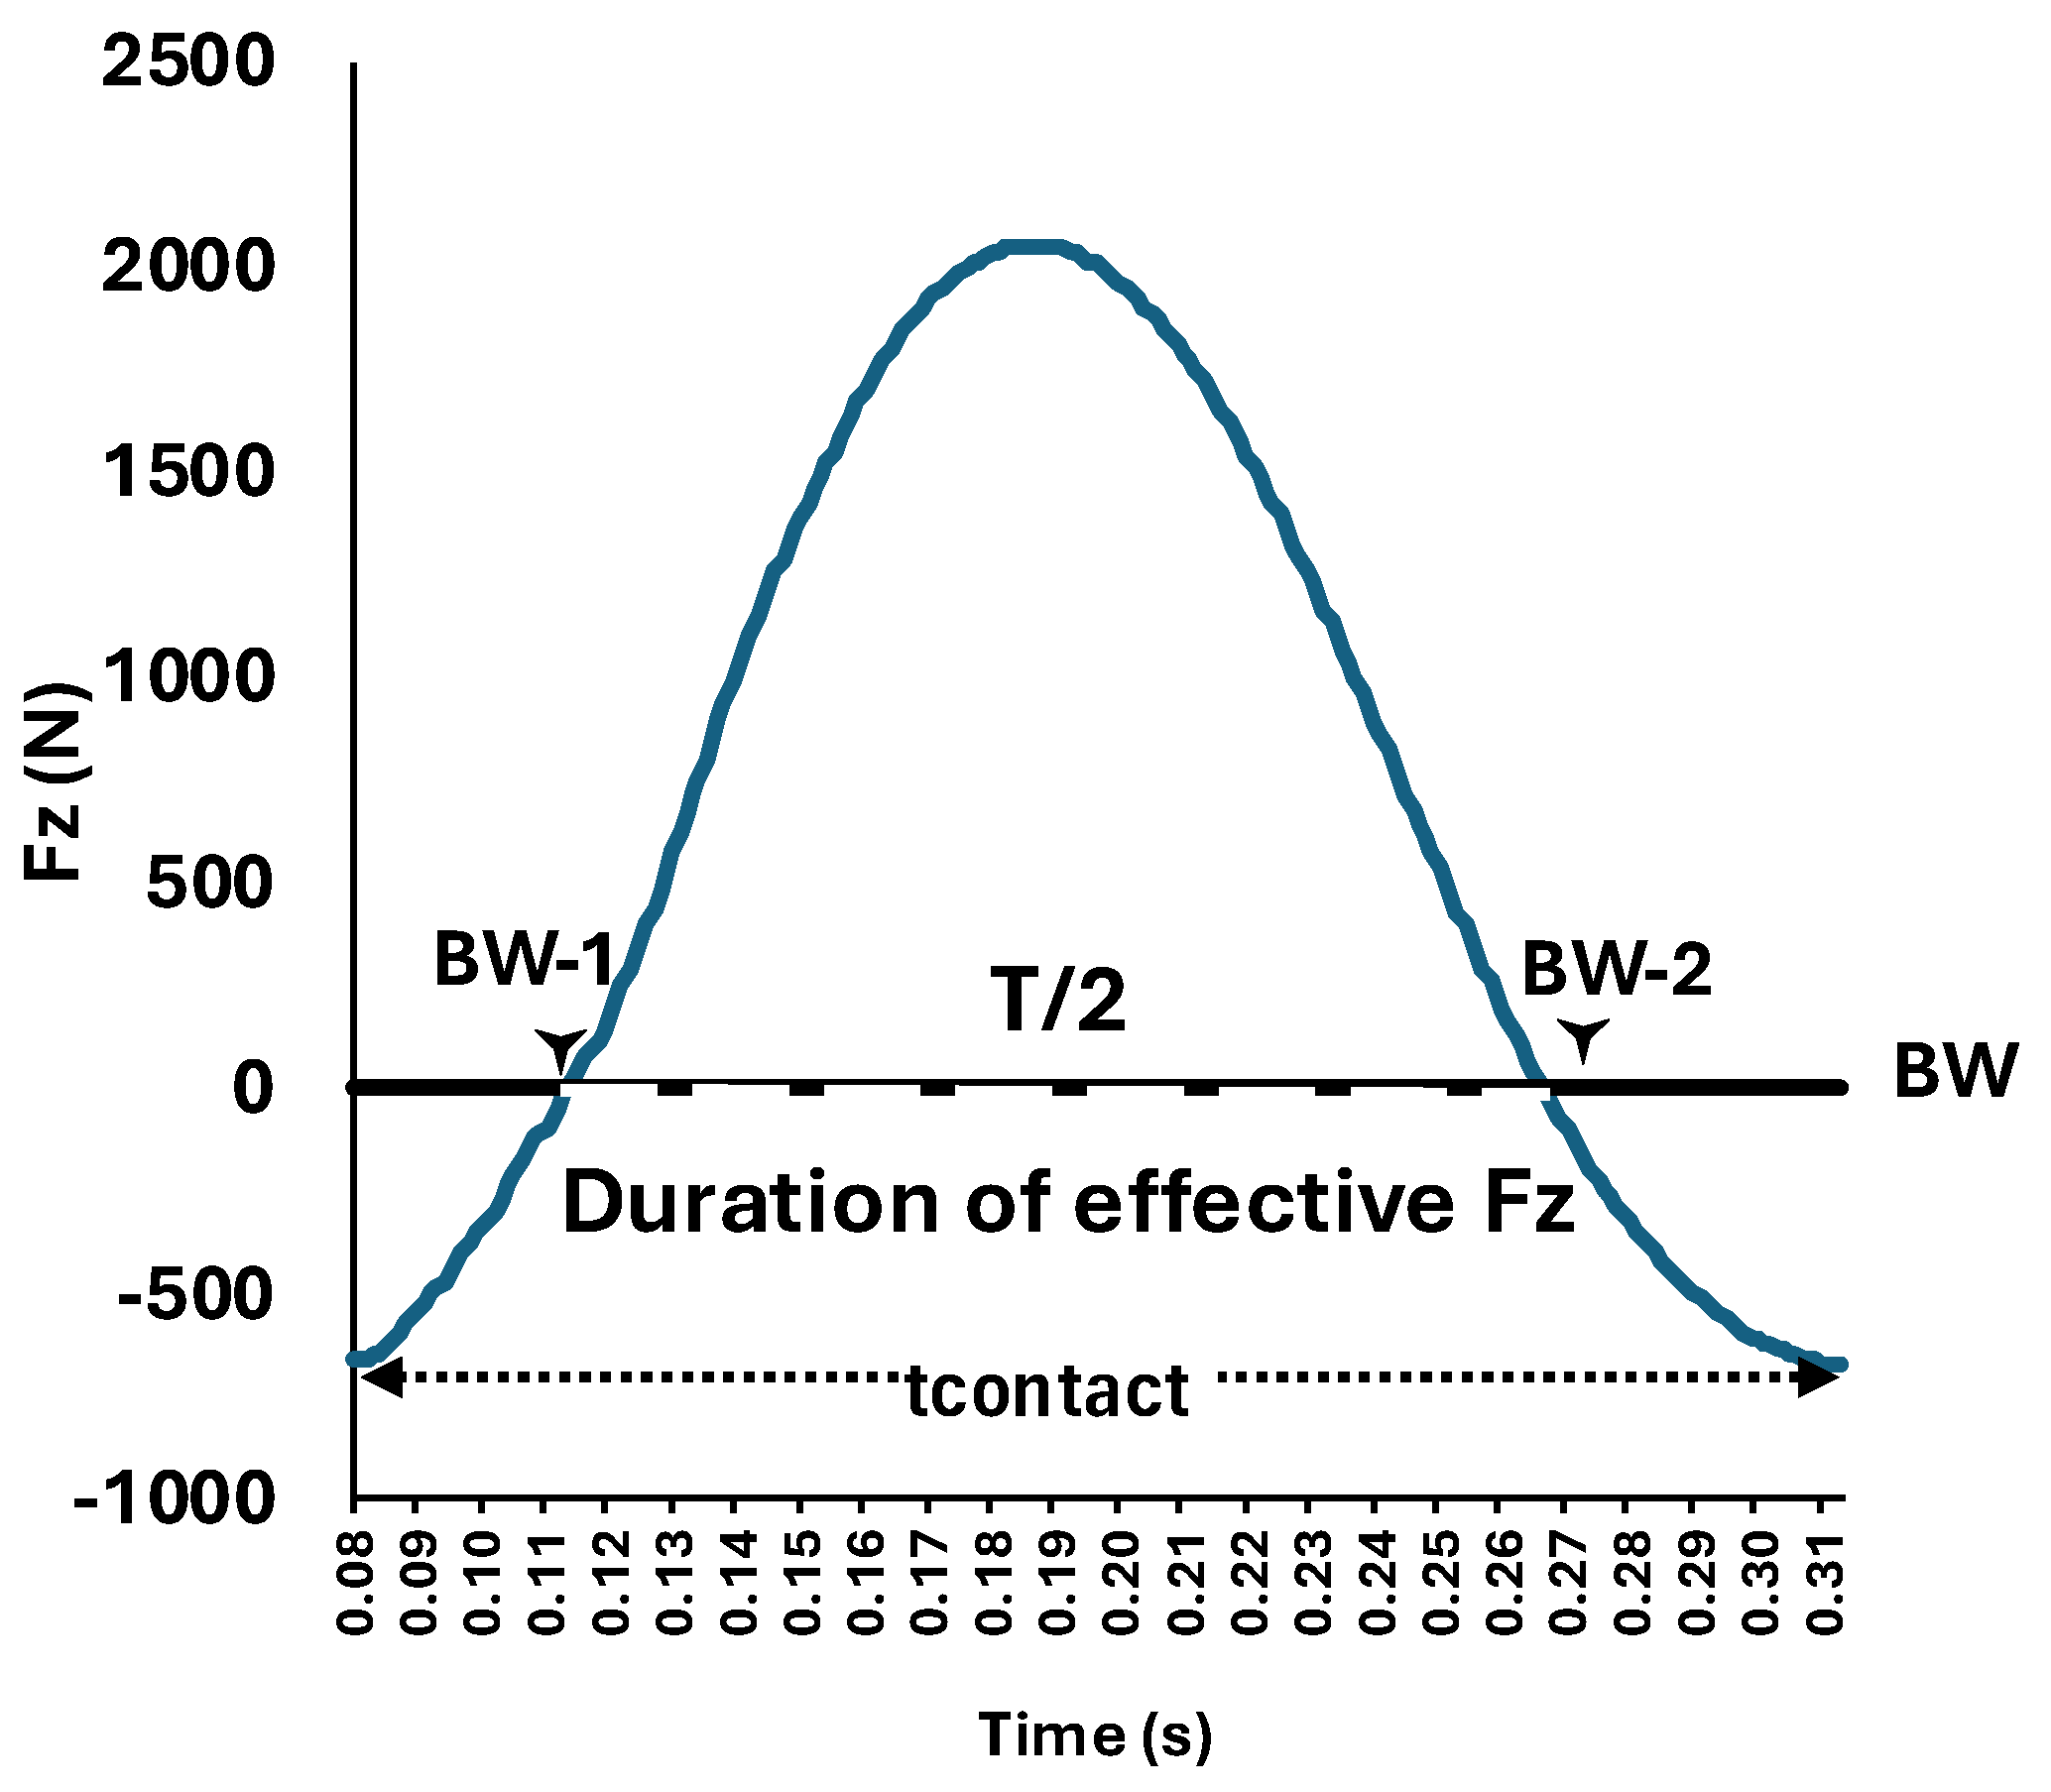
2.6. Variable Extraction

Hopping performance metrics.The hopping performance metrics were the peak vertical GRF (Fzpeak) expressed in BW and the durations (all expressed in s) of hopping cycle (tcycle), contact phase (tcontact) and flight phase (tflight). Also, the duty cycle was calculated as the contact duration relative to the total hopping cycle duration and was expressed as a percentage of tcycle (%tcycle). For each performance metric, values were calculated for every hop according to the corresponding segment. The mean value per segment was then computed for each trial, and finally, the average of the two trials was used in the statistical analysis.
Leg-Stiffness value. Stiffness value was computed based on the resonant frequency method assuming a simple spring–mass system [22,24]. In this method, the compression of the leg is seen as half the oscillation of a spring. The resonant frequency T was computed by the period indicating one half of the oscillation (T/2), that is, the duration that the net-GRF (fi−mg) is (upwards) positive (Figure 1). In continuance, leg stiffness (k) was computed (11).
k = m ×   ω 2 (11), where ω = 2π/Τ
To allow a robust resonant period extraction (otherwise termed as effective vertical GRF duration), the body weight (BW) recording while the participant stood on the forceplate before each trial was zeroed (Figure 2) aiming to apply the zerocrossing Matlab mathematical procedure (Matlab 2024a, Mathworks) for detecting the two time points defining T/2. The leg stiffness value was expressed in N/m as well as in BW/m. The averaged across the two trials leg stiffness comprised the value inserted in statistical analysis.
Individual variability.In each hopping segment, for the leg-stiffness as well as the kinetic performance metrics (Fzpeak, tcontact, tflight, tcycle, duty cycle), the relative individual variability was calculated by the coefficient of variation, that is the ratio of the segment standard deviation (SD) to the segment average per participant, multiplied by 100 and expressed as a percentage (%CVind). For all metrics, the two trials mean %CVind per participant comprised the value inserted in the statistical analysis.

2.7. Statistical Analysis

One-way repeated measures ANOVA was applied for testing the segment effect, followed by post hoc pairwise comparisons (Bonferroni correction) in the presence of a significant segment effect. In case that Mauchly’s test indicated violation of sphericity, the Greenhouse correction was used to determine the significance of the segment effect. SPSS version 30.0 (IBM Statistics) was used for all statistical procedures with the significance level set at a < 0.05.

3. Results

Table A1 and Table A2 (Appendices A and B, respectively).provide all numerical details about the mean and standard deviation of the magnitude and the %CVind, respectively, as well as all indices yielded from statistical analysis concerning the group X segment interaction and the segment effect for the total of participants

3.1. Group X Segment Interaction

Results are presented for the total sample of 56 participants (42 athletic and 14 non-athletic young women) because of no significant Group X Segment interaction either for the magnitude of variables (p > 0.05) (Table A1) or for their variability (p > 0.05) (Table A2).

3.2. Segment Effect

Figure 3 illustrates the leg stiffness expressed in kN/m across all hopping segments for the total of the 56 participants. Leg stiffness did not differ significantly (F = 0.572, p value = 0.592, Cohen’s d = 0.20) among the trial segments, with average segment values ranging from about 30.6 to 31.2 kN/m.
The trial segment effect on the kinetic performance metrics (Fz-Peak, tcontact, tflight, tcycle, duty cycle) is depicted in Figure 4. Only Fz-peak (F= 0.406, p < 0.001, Cohens’d = 0.72) and tflight (F= 6.37, p = 0.004, Cohens’d = 0.66) yielded a significant segment effect, with also significant segment pairwise differences (Figure 4).
3.3. Τrial Segment Effecton Individual Variability (%CVind)
The leg stiffness %CVind ranged from about 7.1% to 8.6% among the trial segments with non-significant differences among them (F = 0.784, p value = 0.382, Cohen’s d = 0.20) (Figure 5) (Table A2). In the kinetic performance metrics, %CVind yielded a significant main effect in Fz-Peak, tcontact, tflight, and duty cycle (p < 0.05), with significant pairwise differences only in tcontact and tflight (Figure 5).

4. Discussion

The purpose of this study was to assess if the selected segment along a two-legged hopping trial alters the leg stiffness and kinetic performance values as well as their variability. This research question was tested on a sample of elite level athletic women (volleyball, basketball, and handball) as well as in a cohort of non-athletic women of moderate physical activity (recreationally active, undertaking ≥2.5 h of physical activity per week). The results and discussion concern the total number of participants because athletic experience (comparison of athletic with non-athletic females or comparison among athletic groups) did not yield a significant interaction with the segment effect.
The leg stiffness value did not differ significantly among the trial segments, ranging from about 30.6 to 31.2 kN/m across the trial segments. The trial segment effect on the kinetic performance metrics was significant for Fzpeak, a finding that most possibly highlights the peaking of vertical force as a key factor for motor control modulation [25]. Taken in conjunction with the significant tflight differences, the vertical force during landing may account for variations in landing velocity due to greater or smaller flight times. It must be noted that, across the whole sample of 56 participants, participants demonstrated a behavior of pure spring-mass model, with the ground reaction force depicting a bell-shaped curve [10,24]. Thus, their lower limb mechanical behavior may be safely described as a linear spring one [24].
2nd paragraph
Main finding. The results indicate that just the initial 15 hops (in continuance reduced to 10 hops after excluding the 5 five ones to avoid neuromuscular adaptation, [21] are adequate for robust leg stiffness and kinetic performance results. This conclusion is supported by both the magnitude as well as the individual variability results.
The role and potential impact of data-reduction methods used to evaluate measures of lower limb stiffness has been previously stressed by [17] who tested during repeated maximal effort jumping tasks in young female athletes from a variety of sport backgrounds. In hopping studies, the overall conceptual convergence implies that a too short or a too long hopping bout may influence the leg stiffness outcomes; however, even for trials of the same duration, the segment labeling as initial, middle and late emerges relative to the trial duration chosen by the researchers of each study rather than from objectively and numerically standardized criteria defined by specific research evidence. Despite the overall conceptual similarity, inconsistencies are yet present, and little is known about whether the position of the selected segment along the total trial length may indeed affect the magnitude or/and the variability of leg stiffness and of the kinetic performance metrics.
Overall, hopping studies use either a preset trial duration or a present number of hops. In those with a preset trial temporal limit, trials may be categorized as short (< 30 s) or as long (> 30 up to 60 s). A short trial duration appears to prevail, from just 4 s [4] to 10-15 s [3,5,14] for leg stiffness assessment under different hopping frequencies [3,4,14], different loading conditions [4] or different landing surfaces [5].
The studies where the trial duration was defined by a preset number of hops (rather than a preset temporal duration) mainly aimed the hopping frequency effect, or its interaction, with gender Padua et al. [9] (10 hops), landing technique Lee et al. [8] (15 hops), bilateral deficit and bilateral asymmetries (employing either two- or single-leg hopping performance). In studies with a present number of hops, this number ranged to 15, 30 and 45, indicating an overall short trial duration from 5 to 15s, with data reduction procedures that resulted in a shorter subset of hops (segments of 5 or 10 hops) that not only varied among studies but also, they were not always clearly described.
The methodological choices in the literature appear inconsistent and rather arbitrary (most often, no justification for the trial type or its duration, i.e., preset temporal limit or preset number of hops), it is not clearly known if the methodological choice might have impacted on the results, and it hinders the within studies comparison. Just providing some examples, Padua et al [9] applied their data reduction method citing previous works [5,11], yet their choice indicates a varying position along the total trial length concerning the 10 hops segment used in their study. Similarly, Lee et al. [8] do not clearly describe the position of the 15 hops used in their analysis along the total trial length, Otsuka, et al. [15] reduced their 15 hops data collection in just 5 consecutive hops, from the 6th to the 10th of the total 15 hops without explicitly stating neither the 5 hop segment position along the total trial length nor their selection criteria. Finally, Maloney et al. [12] like Hobara et al. [6,7,16] and Otsuka et al [15] reduced series of 30 two-legged hops to just 5 consecutive hops, that is from the 6th to 10th of the total 30 hops, following the criteria of [17], (that is, the ground contact time of each of the 5 hops was required to fall within ±5% of the average ground contact time for the five-hop sample). Yet, taking their statement that all hopping trials met the above criteria, their choice for the 5 hops segment position along the total trial length is not clearly described.
The above-described inconsistencies inspired the rationale of the present study, which provides a reference for data reduction criteria in two legged hopping studies, by testing the magnitude and variability of leg stiffness and kinetic performance metrics across different segments of a 30s trial. These segments were defined in the perspective of increasing cumulative range (1st - 10th, 1st - 20th, 1st - 30th, and 1st - 40th, consecutive hops) as well as of 10 hop consecutive sub-ranges (1st - 10th, 11th - 20th, 21st - 30th, 31st - 40th consecutive hops). Thus, both the effect of temporal limit (segments of cumulative range) as well as the position of the segment along the trial (segments of 10-hop consecutive sub-ranges) could be tested.
Individual variability.The inclusion of individual variability in the present study enhances the impact of the results of the present study. Similar concerns have been previously raised about the variability of human leg stiffness across strides during running, [26], In their study, Selvitella & Foster [26], strongly recommend avoiding the sub-selection of stride lags without first confirming that sub-selection does not produce spurious results in locomotion data. Yet, to the best of our knowledge, there is no previous hopping study examining the individual variability across sub-ranges of the trial length.
It is worth noting that among the hopping metrics examined in the present study leg stiffness, Fzpeak and tcycle did not demonstrate any significant variability difference among the trial segments, with leg stiffness and tcycle exhibiting the lowest individual variability (about 3% for both) while Fzpeak variability ranged from 4.6% to 6.2%. Even in the kinetic performance metrics where some significant between semgnets differences were evidenced (tcontact, tflight, dutycycle) variability remained consistently low, with no metric exceeding 6.2%. Combined with the statistically proved adherence to the set hopping tempo of 130 bpm, these results indicate that, regardless of slight %CVind differences among the trial segments, the rhythmic temporal structure of two-legged hopping remained robust across the full trial length and participants performed precisely and repeatably [27].
Individual variability provides insight to temporal stability of performance—an index of motor control robustness. The overall low individual variability across all tested variables, verifies the reproducibility of timing patterns over time, that is a stable hopping performance. Crucially, such stability does not imply rigidity; instead, it reveals a flexible system that sustains coordination and energy efficiency under changing conditions (as those evidenced in the varying flight times that eventually lead to varying landing velocities, which in turn appear to be accounted for by varying the vertical force peaking). Functionally, the consistent variability across the hopping segments indicates an optimization of movement efficiency, conserve energy, and maintain control during repetitive cyclical actions. an inherently robust coordination state—even as absolute timing adapted to task-specific demands [28].
Limitations
One could argue the use of set hopping frequency as not allowing the natural behavior of the lower limbs as a limitation of the present study. Hopping at preferred tempo depicts mechanical and energetic economy [1] reinforcing and serving a self-regulating, task-sensitive system that balances motor pattern precision with adaptability [18].
However, set hopping frequency is a common methodological choice to ensure a linear spring mass behavior; yet, it may constitute a temporal biomechanical constraint interacting with the effect of trial segment or induce a lowering impact on movement variablilty. However, biomechanical constraints do not necessarily eliminate variability; instead, they may structure it into a form of functional flexibility, enabling the timing system to adapt along trial duration while remaining bounded by the set biomechanical limits [18,19].
It must be noted though, that when using a set hopping frequency, one should carefully test the ability of participants to satisfactorily perform at the set hopping frequency must be carefully checked before data collection. However, as Maloney et al. [12] reported, some of their participants failed to perform at 2.2 Hz, which is around the universally established typical human hopping frequency ([4] 2.07 ±0.18Hz; [11], 2.31±0.35Hz; [12], 2.8 ± 0.3 Hz; [22], 2.17±0.07 Hz; [23], 2.05 ± 0.12 Hz]. For our participants, this was checked not only before data collection, but also afterwards, through the stastistical procedure of one sample test.
One point of interest is the absence of significant group differences among the athletic groups as well as between the control and each one of the athletic groups. Stiffness modulation is reliant upon the task requirements, the individual’s training status and athletic training background of individuals [29,30]. Also, leg stiffness optimization is necessary to facilitate athletic performance and depends on the muscle’s ability to modulate stiffness, force production, absorption and the rate at which force is produce [31]. The inherently submaximal nature of the two-legged hopping task [16,23] may explain the non-significant interaction of athletic experience with the segment effect. Thus, two-legged hopping in place may be an inadequate discriminative stimulus for the athletic groups employed in the present study (court players) because of lower loading to that required in most likely stiffer landing patterns encountered in competitive situations. Similar to our findings, Millett et al. [32] compared well trained female endurance runners with female netball players and controls in a variety of leg stiffness demanding tasks (repetitive hopping inclusive); although the controls had significantly lower leg stiffness than both athletic groups, the difference between athletic groups was also non-significant. As may be inferred by the study of Hobara et al. [16], the discriminative ability of the hopping task itself may indeed be associated with the training background of the athletes tested. Hobara et al. [16] found significantly higher leg stiffness in power-trained athletes versus runners, most possibly denoting that for a significant leg stiffness difference due to athletic specificity, the difference of training interventions must be at extreme mechanical or physiological limits.
Ιn conclusion, regardless of training background, the leg stiffness magnitude and individual variability were both unaffected by trial segment selection, supporting the robustness of this measure across different sub-ranges of analysis. All temporal kinetic metrics were also unaffected in magnitude by trial segment selection, with overall low individual variability (despite some between segment differences= either for segments of increasing range or of sub-range segment) indicating a consistent rhythmic performance in precision with the set hopping frequency, thus providing a robust fundament for the leg stiffness results. The significant effect in the magnitude of Fz most possibly reflects a motor control modulation accounting for variations in landing velocity (due to flight time variations). Thus, based on the results of the present study employing a preset hopping frequency at 130 bpm, a data collection of just 15 hops, in continuance reduced to 10 hops (after excluding the 5 five ones to avoid neuromuscular adaptation) is indicated as a robust choice.

Supplementary Materials

No supplementary material

Author Contributions

Author Contributions: Conceptualization, O.T. and E.R.; methodology, O.T. and E.R.; formal analysis, O.T. and E.R.; investigation, O.T. and E.R.; data curation, O.T. A.E. and E.R.; writing—original draft preparation, O.T., A.E. and E.R.; writing—review and editing, O.T., A.E., E.R., KB, and K.B., and E.R.; visualization, A.E. and E.R.; supervision E.R. and K.B; project administration, E.R. KB, and K.B. All authors have read and agreed to the published version of the manuscript.

Funding

This research received no external funding.

Institutional Review Board Statement

“The study was conducted in accordance with the Declaration of Helsinki and approved by the Institutional Review Board (or Ethics Committee) of the SCHOOL OF PHYSICAL EDUCATION AND SPORT SCIENCE, NATIONAL AND KAPODISTRIAN UNIVERSITY OF ATHENS, GREECE (protocol code 1419 /19-October-2022).”

Informed Consent Statement

Informed consent was obtained from all subjects involved in the study.

Data Availability Statement

The data are not publicly available due to ethical restrictions.

Acknowledgments

We thank George Vagenas, PhD (McGill University), Emeritus Professor of Statistics in the School of Physical Education and Sport Science, National and Kapodistrian University of Athens, for his valuable contribution to the advancement of statistical reasoning and understanding.

Conflicts of Interest

“The authors declare no conflicts of interest.”

Abbreviations

The following abbreviations are used in this manuscript:
GRF Ground Reaction Force
bmp beats per minute
SD Standard Deviation
CV Coefficient of Variation

Appendix A

Table A1. Mean ± SD magnitude of the leg stiffness and the kinetic performance metrics in each trial segment. The statistical indices of the statistical analysis concerning the Group X Segment interaction as well as the Segment effect are also noted.
Stiffness
KN/m
Fz-Peak
(BW)
tcontact
(s)
tflight
(s)
tcycle
(s)
duty cycle (%tcycle)
hops 1-10 31.08 ± 8.87 3.09 ± 0.57 0.240 ± 0.037 0.228 ± 0.043 0.470 ± 0.026 51.4 ± 8.2
hops 1-20 31.11 ± 8.59 3.10 ± 0.57 0.239 ± 0.037 0.227 ± 0.043 0.470 ± 0.024 51.4 ± 8.3
hops 1-30 31.07 ± 8.60 3.08 ± 0.56 0.240 ± 0.037 0.226 ± 0.042 0.468 ± 0.023 51.6 ± 8.2
hops 1-40 30.64 ± 7.92 3.07 ± 0.55 0.240 ± 0.036 0.225 ± 0.041 0.467 ± 0.022 51.7 ± 8.0
hops 11-20 31.13 ± 8.40 3.11 ± 0.58 0.239 ± 0.037 0.227 ± 0.043 0.467 ± 0.022 51.4 ± 8.3
hops 21-30 31.00 ± 8.72 3.03 ± 0.55 0.241 ± 0.037 0.222 ± 0.040 0.465 ± 0.020 52.0 ± 7.9
hops 31-40 30.65 ± 7.69 3.03 ± 0.55 0.241 ± 0.035 0.222 ± 0.038 0.437 ± 0.192 52.1 ± 7.7
Group X Segment
Interaction
F = 0.795
p = 0.592
F = 1.177
p = 0.326
F = 1.656
p = 0.142
F = 0.844
p = 0.489
F = 0.940
p = 0.429
F = 1.553
p= 0.177
Segment Effect across the total of participants (N=56)
F 0.572 8.406 1.417 6.037 1.394 3.612
Sig.
(Greenhouse
correction for all)
0.592 < 0.001* 0.247 0.004* 0.243 0.034*
non-significant
pairwise comparisons
Cohen’s d effect size
0.20 = small
0.50 = medium
0.80 = large
[Cohen, 1988]**
0.20 0.78 0.32 0.66 0.32 0.51
small medium to
large
small to
medium
medium small to
medium
medium
Partial Eta Squared 0.010 0.133 0.025 0.099 0.025 0.062
Noncent. Parameter 1.340 16.230 2.841 11.110 1.415 6.666
Observed Powera 0.151 0.956 0.299 0.855 0.214 0.632
Pairwise Segment
Comparisons
ns for all 1-20 > 1-30
> 1-40
> 21-30
ns for all 1-10 > 1-30
> 1-40
1-20 >1-30
> 1.40
ns for all ns for all
*significant at p ≤ 0.05, **Cohen, J. Statistical Power Analysis for the Behavioral Sciences, 2nd ed.; Lawrence Erlbaum Associates: Hillsdale, NJ, USA, 1988.

Appendix B

Table A2. Mean ± SD individually variability (%CVind) of the leg stiffness and the kinetic performance metrics in each trial segment. The statistical indices of the statistical analysis concerning the Group X Segment interaction as well as the Segment effect are also noted.
KN/m
(%)
Fz -Peak
(%)
tcontact
(%)
tflight
(%)
tcycle
(%)
duty cycle
(%)
hops 1-10 8.2 ± 2.0 5.4 ± 2.4 4.8 ± 1.4 5.0 ± 2.1 2.9 ± 1.1 3.8 ± 1.5
hops 1-20 8.2 ± 2.1 5.5 ± 2.3 5.0 ± 1.5 5.3 ± 2.0 3.1 ± 1.1 3.9 ± 1.3
hops 1-30 8.7 ± 2.0 6.1 ± 2.2 5.4 ± 1.6 5.8 ± 2.1 3.1 ± 0.8 4.5 ± 1.5
hops 1-40 8.6 ± 2.0 6.2 ± 2.1 5.4 ± 1.4 5.9 ± 2.0 3.2 ± 0.9 4.4 ± 1.3
hops 11-20 7.1 ± 2.5 4.7 ± 2.2 4.3 ± 1.5 4.6 ± 2.0 2.8 ± 1.0 3.3 ± 1.2
hops 21-30 8.6 ± 3.0 5.4 ± 2.4 4.8 ± 1.4 4.9 ± 1.9 2.9 ± 0.9 3.7 ± 1.4
hops 31-40 7.4 ± 2.2 5.0 ± 2.6 4.6 ± 1.6 4.8 ± 2.0 3.0 ± 1.2 3.4 ± 1.3
Group X Segment
Interaction
F = 8.928
p < 0.001
F = 2.673
p = 0.035
F = 1.492
p = 0.131
F = 0.639
p = 0.801
F = 1.177
p = 0.279
F = 0.975
p = 0.471
Segment Effect across the total of participants (N=56)
F 0.784 6.648 8.182 7.955 1.222 12.803
Sig.
(Greenhouse
correction for all)
0.382 < 0.001* < 0.001* < 0.001* 0.303 <0.001*
Cohen’s d effect size
0.20 = small
0.50 = medium
0.80 = large
[Cohen, 1988]**
0.20 0.70 0.80 0.80 0.30 0.97
small large large large mediumto small large
Partial Eta Squared 0.014 0.110 0.129 0.126 0.022 0.189
Noncent. Parameter 0.796 19.718 32.413 30.820 3.851 47.485
Observed Powera 0.141 0.970 0.998 0.997 0.332 1.000
ns for all ns for all 1-20 > 11-20
> 21-30
> 31-40
1-30 > 11-20
> 21-30
> 31-40
1-40 > 11-20
> 21-30
> 31-40
1-10 < 1-30
< 1-40
1-30 > 11-20
>21-30
> 31-40
1-40 > 11-20
>21-30
> 31-40
ns for all 1-10 < 1-30
< 1-40
1-20 < 1-30
< 1-40
1-30 > 11-20
> 21-30
> 31-40
1-40 > 11-20
> 21-30
> 31-40
*significant at p ≤ 0.05, **Cohen, J. Statistical Power Analysis for the Behavioral Sciences, 2nd ed.; Lawrence Erlbaum Associates: Hillsdale, NJ, USA, 1988.

References

  1. Blickhan, R. The spring-mass model for running and hopping. J. Biomech. 1989, 22, 1217–1227. [Google Scholar] [CrossRef]
  2. McMahon, T.A.; Cheng, G.C. The mechanics of running: How does stiffness couple with speed? J. Biomech. 1990, 23, 65–78. [Google Scholar] [CrossRef] [PubMed]
  3. Dalleau, G.; Belli, A.; Viale, F.; Lacour, J.-R.; Bourdin, M. A Simple Method for Field Measurements of Leg Stiffness in Hopping. Int. J. Sports Med. 2004, 25, 170–176. [Google Scholar] [CrossRef] [PubMed]
  4. Demirbüken, I.; Yurdalan, S.U.; Savelberg, H.; Meijer, K. Gender specific strategies in demanding hopping conditions. . 2009, 8, 265–70. [Google Scholar] [PubMed]
  5. Farley, C.T.; Houdijk, H.H.P.; Van Strien, C.; Louie, M. Mechanism of leg stiffness adjustment for hopping on surfaces of different stiffnesses. J. Appl. Physiol. 1998, 85, 1044–1055. [Google Scholar] [CrossRef]
  6. Hutchings, A.; Hollywood, J.; Lamping, D.L.; Pease, C.T.; Chakravarty, K.; Silverman, B.; Choy, E.H.S.; Scott, D.G.; Hazleman, B.L.; Bourke, B.; et al. Clinical outcomes, quality of life, and diagnostic uncertainty in the first year of polymyalgia rheumatica. Arthritis Rheum. 2007, 57, 803–809. [Google Scholar] [CrossRef]
  7. Hobara, H.; Inoue, K.; Kanosue, K. Effect of Hopping Frequency on Bilateral Differences in Leg Stiffness. J. Appl. Biomech. 2013, 29, 55–60. [Google Scholar] [CrossRef]
  8. Lee, J.J., Kim, J.Y., Lee, H.Y., Kim, Y.H. (2010). Leg Stiffness from Landing Methods of Hopping. In: Lim, C.T., Goh, J.C.H. (eds) 6th World Congress of Biomechanics (WCB 2010). August 1-6, 2010 Singapore. IFMBE Proceedings, vol 31. Springer, Berlin, Heidelberg. [CrossRef]
  9. Padua, D.A.; Carcia, C.R.; Arnold, B.L.; Granata, K.P. Gender Differences in Leg Stiffness and Stiffness Recruitment Strategy During Two-Legged Hopping. J. Mot. Behav. 2005, 37, 111–126. [Google Scholar] [CrossRef]
  10. Farley, C.T.; Morgenroth, D.C. Leg stiffness primarily depends on ankle stiffness during human hopping. J. Biomech. 1999, 32, 267–273. [Google Scholar] [CrossRef]
  11. Granata, K.; Padua, D.; Wilson, S. Gender differences in active musculoskeletal stiffness. Part II. Quantification of leg stiffness during functional hopping tasks. J. Electromyogr. Kinesiol. 2002, 12, 127–135. [Google Scholar] [CrossRef]
  12. Maloney, S.J.; Fletcher, I.M.; Richards, J. A comparison of methods to determine bilateral asymmetries in vertical leg stiffness. J. Sports Sci. 2015, 34, 829–835. [Google Scholar] [CrossRef]
  13. Moritz, C.T.; Farley, C.T. Human hopping on damped surfaces: strategies for adjusting leg mechanics. Proc. R. Soc. B: Biol. Sci. 2003, 270, 1741–1746. [Google Scholar] [CrossRef]
  14. Kuriyama, K.; Takeshita, D. Leg stiffness adjustment during hopping by dynamic interaction between the muscle and tendon of the medial gastrocnemius. J. Appl. Physiol. 2025, 138, 899–908. [Google Scholar] [CrossRef]
  15. Otsuka, M.; Kurihara, T.; Isaka, T. Bilateral deficit of spring-like behaviour during hopping in sprinters. Eur. J. Appl. Physiol. 2017, 118, 475–481. [Google Scholar] [CrossRef]
  16. Hobara, H.; Inoue, K.; Kobayashi, Y.; Ogata, T. A Comparison of Computation Methods for Leg Stiffness During Hopping. J. Appl. Biomech. 2014, 30, 154–159. [Google Scholar] [CrossRef]
  17. Moresi, M.P.; Bradshaw, E.J.; Greene, D.A.; Naughton, G.A. The impact of data reduction on the intra-trial reliability of a typical measure of lower limb musculoskeletal stiffness. J. Sports Sci. 2014, 33, 180–191. [Google Scholar] [CrossRef]
  18. Repp, B.H.; Su, Y.-H. Sensorimotor synchronization: A review of recent research (2006–2012). Psychon. Bull. Rev. 2013, 20, 403–452. [Google Scholar] [CrossRef]
  19. Varlet, M.; Williams, R.; Keller, P.E. Effects of pitch and tempo of auditory rhythms on spontaneous movement entrainment and stabilisation. Psychol. Res. 2018, 84, 568–584. [Google Scholar] [CrossRef] [PubMed]
  20. Hobara, H.; Kanosue, K.; Suzuki, S. Changes in muscle activity with increase in leg stiffness during hopping. Neurosci. Lett. 2007, 418, 55–59. [Google Scholar] [CrossRef] [PubMed]
  21. Morin, J.-B.; Dalleau, G.; Kyröläinen, H.; Jeannin, T.; Belli, A. A Simple Method for Measuring Stiffness during Running. J. Appl. Biomech. 2005, 21, 167–180. [Google Scholar] [CrossRef] [PubMed]
  22. Farley, C.T.; Blickhan, R.; Saito, J.; Taylor, C.R. Hopping frequency in humans: a test of how springs set stride frequency in bouncing gaits. J. Appl. Physiol. 1991, 71, 2127–2132. [Google Scholar] [CrossRef]
  23. Joseph, C.W.; Bradshaw, E.J.; Kemp, J.; Clark, R.A. The Interday Reliability of Ankle, Knee, Leg, and Vertical Musculoskeletal Stiffness During Hopping and Overground Running. J. Appl. Biomech. 2013, 29, 386–394. [Google Scholar] [CrossRef] [PubMed]
  24. Cavagna, G.A. Force platforms as ergometers. J. Appl. Physiol. 1975, 39, 174–179. [Google Scholar] [CrossRef]
  25. Rousanoglou, E.N.; Boudolos, K.D. Rhythmic performance during a whole body movement: Dynamic analysis of force–time curves. Hum. Mov. Sci. 2006, 25, 393–408. [Google Scholar] [CrossRef] [PubMed]
  26. Selvitella, A.M.; Foster, K.L. On the variability and dependence of human leg stiffness across strides during running and some consequences for the analysis of locomotion data. R. Soc. Open Sci. 2023, 10, 230597. [Google Scholar] [CrossRef]
  27. Stergiou, N.; Decker, L.M. Human movement variability, nonlinear dynamics, and pathology: Is there a connection? Hum. Mov. Sci. 2011, 30, 869–888. [Google Scholar] [CrossRef] [PubMed]
  28. Wilson, A.D.; Collins, D.R.; Bingham, G.P. Perceptual coupling in rhythmic movement coordination: stable perception leads to stable action. Exp. Brain Res. 2005, 164, 517–528. [Google Scholar] [CrossRef]
  29. Komi, P.V. Stretch-shortening cycle: a powerful model to study normal and fatigued muscle. J. Biomech. 2000, 33, 1197–1206. [Google Scholar] [CrossRef]
  30. Fábrica, G.; López, F.; Souto, A. Effects of power training in mechanical stiffness of the lower limbs in soccer players. Rev. Andal. de Med. del Deport. 2015, 8, 145–149. [Google Scholar] [CrossRef]
  31. Butler, R.J.; Crowell, H.P., III; Davis, I.M. Lower extremity stiffness: implications for performance and injury. Clin. Biomech. 2003, 18, 511–517. [Google Scholar] [CrossRef]
  32. Millett, E.L.; Moresi, M.P.; Watsford, M.L.; Taylor, P.G.; A Greene, D. Variations in lower body stiffness during sports-specific tasks in well-trained female athletes. Sports Biomech. 2018, 20, 22–37. [Google Scholar] [CrossRef] [PubMed]
Figure 1. Vertical GRF (Fz in N) force-time curve during one double-legged hopping trial depicting the segment definition, for one typical athletic subject. The mean of each segment is noted.
Preprints 182525 g001
Figure 2. Vertical (Fz) GRF data for a single hopping contact. The definition of effective GRF duration corresponding to half the resonant period (T/2) in the formula used to calculate leg stiffness is depicted (typical athletic subject - barefoot condition). Before data collection, and with the participant standing on the force-plate, the BW recording was ‘zeroed’, thus the lowest negative values indicate the BW value which was stored in the debug window of the Kistler Bioware software used for data collection and analysis (Kistler Measurement, Analysis and Reporting Software v.5.5.1.0).
Preprints 182525 g002
Figure 3. Boxplots of leg stiffness in the selected hopping segments. The box indicates the interquartile range (IQR) of the values (IQR: 50% of the values lie within 0.6745 standard deviations). Each whisker extends to the furthest data point that is within 1.5 times the IQR. The horizontal line and the x symbol in the box indicate the median and the mean, respectively and the filled circles denote individual values (no outliers were evidenced). The segment effect statistics (F, p value, Cohen’s d effect size) indicate non-statistical significance (p ≤ 0.05).
Preprints 182525 g003
Figure 4. Boxplots of the two-legged kinetic performance metrics in the selected hopping segments. The box indicates the interquartile range (IQR) of the values (IQR: 50% of the values lie within 0.6745 standard deviations). Each whisker extends to the furthest data point that is within 1.5 times the IQR. The horizontal line and the x symbol in the box indicate the median and the mean, respectively and the filled circles denote individual values (no outliers were evidenced). The segment effect statistics (F, p value, Cohen’s d effect size) indicate non-statistical significance (p ≤ 0.05).
Preprints 182525 g004
Figure 5. Mean (±1SD) of individual variability (%CV) in all selected hopping segments, for leg stiffness and the kinetic performance metrics (Fz-peak, tcontact, tflight, tcycle, duty cycle). The main effect statistics (F, p value, Cohen’s d effect size) as well as the significant pairwise segment comparisons (in the presence of a significant segment effect are noted.
Preprints 182525 g005
Table 1. Mean ± SD of the hopping frequency in bpm in each one of the selected trial segments that was tested against the set frequency of 130 bpm. The p value is noted in parentheses with the level of significance set at ≤ 0.05. Also, the statistics of One Way Anova applied to examine potential group differences are noted.
Trial
Segments
Mean ± SD
(p value for one sample t-test with 130 bpm as test value)
One Way Anova
for Group Effect
Volley (N=14) Basket (N=14) Handball (N=14) Control (N=14) TOTAL (N=56) F Sig.
hops 1-10 126.6 ± 8.6
(0.161)
130.6 ± 3.0
(0.430)
129.2 ± 2.3
(0.216)
129.9 ± 3
(0.863)
129.1 ± 5.0
(0.174)
1.793 0.160
hops 1-20 126.9 ± 8.1
(0.182)
130.9 ± 3.0
(0.275)
129.0 ± 2.9
(0.221)
130 ± 2.5
(1.000)
129.2 ± 4.9
(0.232)
1.822 0.155
hops 1-30 127.2 ± 7.9
(0.211)
131.3 ± 2.7
(0.101)
129.5 ± 1.9
(0.346)
129.9 ± 2.2
(0.907)
129.5 ± 4.6
(0.400)
2.034 0.121
Hops 1-40 127.8 ± 7.6
(0.293)
131.4 ± 2.8
(0.098)
129.4 ± 1.6
(0.205)
130.0 ± 2.4
(1.000)
129.6 ± 4.4
(0.544)
1.657 0.188
hops 11-20 127.2 ± 7.8
(0.199)
131.2 ± 3.4
(0.189)
128.8 ± 2.9
(0.138)
129.9 ± 2.7
(0.848)
129.3 ± 4.8
(0.259)
1.880 0.144
hops 21-30 127.9 ± 7.2
(0.287)
132.0 ± 2.8
(0.061)
130.2 ± 1.7
(0.748)
129.1 ± 3.1
(0.314)
129.8 ± 4.4
(0.711)
2.335 0.085
hops 31-40 129.1 ± 7.9
(0.681)
131.6 ± 3.0
(0.071)
130.1 ± 2.8
(0.907)
128.9 ± 6.1
(0.502)
129.9 ± 5.3
(0.915)
0.704 0.554
Disclaimer/Publisher’s Note: The statements, opinions and data contained in all publications are solely those of the individual author(s) and contributor(s) and not of MDPI and/or the editor(s). MDPI and/or the editor(s) disclaim responsibility for any injury to people or property resulting from any ideas, methods, instructions or products referred to in the content.
Copyright: This open access article is published under a Creative Commons CC BY 4.0 license, which permit the free download, distribution, and reuse, provided that the author and preprint are cited in any reuse.
Prerpints.org logo

Preprints.org is a free preprint server supported by MDPI in Basel, Switzerland.

Subscribe

Disclaimer

Terms of Use

Privacy Policy

Privacy Settings

© 2025 MDPI (Basel, Switzerland) unless otherwise stated