
Submitted:
24 October 2025
Posted:
28 October 2025
You are already at the latest version
Abstract
Due to the effects of climate change, population growth, and the need for site-specific management in viticulture, a low-cost IoT system for bioclimatic monitoring in precision viticulture was developed. The aim of this project was to design and validate a modular solution with essential sensors for environment, plant, and soil monitoring, ensuring reliability, energy efficiency, and remote data transmission. For that purpouse, a custom PCB for simple integration and replication, as well as 3D-modeled structural components, were used in the development of the field prototype. Hardware and firmware were used for periodic data acquisition and transmission via LoRaWAN to the mySense platform. The performed field tests demonstrated that the station is energy self-sufficient during times of high solar availability, with a 97.32% uplink success rate and an average consumption of 104.67 mW. The estimated cost per node is approximately €260, dominated by sensors and structural components, which makes it affordable for small and medium-sized winegrowers. High-quality data supports correlations between soil matrix potential, climate, and leaf wetness, enabling operational alerts and predictive modeling. The solution proved to be practical, affordable, scalable, and adaptable, meeting its goals and offering a solid foundation for future enhancements to improve efficiency and usability.
Keywords:
precision viticulture
; sensors
; IoT
; monitoring
1. Introduction
Precision Agriculture (PA) has revolutionized the agricultural sector in recent decades by introducing both existing and new technologies that enable the collection, analysis, and application of spatial and temporal data for optimized crop management [1]. This approach has various aims, such as increasing productivity in response to the rapid growth of the global population [2], which demands improved efficiency in resource use, promotes more sustainable agricultural practices, and addresses the challenges posed by climate change [3]. As part of this technological evolution, Precision Viticulture (PV) has emerged as a specific application of PA, allowing in-depth monitoring and evaluation of the vines growing conditions and their physiological processes [4].
A key concept in PV is bioclimatic monitoring, which aggregates the practices described in the systematic observation of data from different sources - soil, plant and environment - enabling producers to make data-driven decisions that can be translated into various applications, like irrigation optimization, pest and disease detection and control, canopy management, and climatic indices monitoring [5,6].
Increasing climate variability makes real-time bioclimatic data essential for sustainable wine production and for mitigating climate-driven weather risks [7]. This importance lies not only in understanding the external environmental conditions, but in how these conditions affect the physiological responses of the vine and the dynamics of the soil where it obtains water and nutrients. Such monitoring links environmental drivers to vine physiology and soil dynamics: temperature, humidity, solar radiation, and precipitation regulate phenological stages—from budburst and flowering to fruit set and ripening—and processes such as photosynthesis, transpiration, nutrient uptake, and fruit-quality development; meanwhile, rainfall and evapotranspiration shape soil-moisture availability and thus root activity and nutrient transport [8]. In this context, it is also important to understand how mesoclimate is the word used to refer to the climate of a vineyard at the site scale [9].
These conditions not only affect vine physiology but also contribute to terroir, influencing the unique characteristics of wine from different regions [10]. Furthermore, a central concept in PV is the "within-vineyard variability", which refers to the spatial heterogeneity observed across different sections of the vineyard. Addressing this variability requires high-resolution, site-specific data that can guide localized interventions and improve both yield consistency and grape quality [11].
The act of monitoring underpins all PV applications: without reliable data, neither precise irrigation actuation nor credible environmental forecasts are feasible. In this regard, sensors are the essential technology that translate physical variables into electrical signals interpretable by microcontrollers, computers, or control systems. Although remote sensing technologies, such as satellite and UAV-based imaging, have an important role in large-scale vineyard monitoring [12], ground-based systems are more suitable for continuous, high-resolution data collection at plant and soil level, which aligns with the low-cost and site-specific objectives of the proposed solution. < Data acquisition systems (DAS) revolve around four core functions: collecting, processing, storing, and transmitting data, which shape the system’s architecture [13]. These systems’ performance hinges on sensor interfacing (amplification/conditioning and controller safeguards), while the decision support depends on measurement accuracy and on sampling/telemetry cadence to capture rapid plant–environment dynamics. In this sense, architectures must remain scalable and interoperable to reflect site-specific variability and to integrate heterogeneous sensors. Consequently, sensor selection should be mapped to each application and target variable.
Considering the context of proximal sensing technologies, we can distinguish four important applications for a DAS: Smart Irrigation, Smart Fertilization, Pest and diseases control and climatic indexes monitoring [5]. In all these applications there are different sensors applied, and to be inclusive in terms of all of them, a system would have to be immensely complex. But, taking into account the complexity, costs and suitability, it was distinguished that air temperature, relative humidity, wind speed and direction, precipitation, leaf wetness, soil water tension and soil temperature would be the best combination of parameters to maintain a high degree of adequate suitability for all applications, while keeping low cost and simplicity that a small/medium winegrower would prefer in a system:
- Climatic indices are pivotal because climate events act on both soils and plants, shaping grape maturation, evapotranspiration, disease pressure, and precipitation-driven moisture availability during critical phenological periods [14,15,16]. At the vineyard/site scale, these indices are typically derived from mesoclimate observations (on-site stations or quality-controlled interpolations) [17,18]. Microclimate modeling can downscale these site-scale (mesoclimate) observations from on-site stations to ≈ 10 m grids, enabling viticultural indices to be computed at vineyard-landscape resolutions [19].
- For irrigation, assessing the soil moisture status is a widely used strategy to reduce vine water stress for the vines [22]. While assessing plant water status is a viable solution [23], soil matric potential offers a cost-effective, accurate, andp easily integrated alternative for proximal monitoring [5].
- Soil temperature governs key soil–plant processes: it influences microbial biomass and organic-matter turnover [24], affects grape composition (elevating sugars while reducing acids and anthocyanins) [25], and informs water-availability dynamics in the root zone [26]. It is thus relevant to both fertilization and irrigation decisions.
- Leaf wetness is a critical disease-risk indicator for proximal sensing: beyond its agronomic benefits [27], many pathogens require surface water films to germinate and infect the plants [28]. Coupling leaf-wetness data with climatic variables supports timely prediction and detection of disease outbreaks.
The need for effective bioclimatic monitoring systems has sparked the development of many research and commercial solutions. Nevertheless, the majority of the existing solutions are characterized by either high cost, high power consumption, difficulty in installation, or low adaptability to different agricultural contexts. These limitations hinder the widespread adoption of PV throughout the world, particularly among the small and medium-sized wine producers, which constitute a significant portion of the wine sector in many regions worldwide. Furthermore, the traditional communication infrastructure is often non-existent or severely limited because vineyards are mostly located in remote places. In this context, communication technologies, such as LoRa (Long Range) and cellular (GSM, 3G, 4G), offer a promising alternative for efficient data transmission over large areas with minimal energy and economic impact.
Likewise, IoT (Internet-of-Things) has boosted advances in this area, with the adaptation of new and existing technology for agricultural and viticultural practices. Generally, IoT is defined as a network of physical devices featuring sensors, software, and connectivity, all of which collect and exchange data autonomously. In Agriculture, this concept has been applied for various purposes [29], overlapping with PV applications already described. All of these applications benefit from the implementation of sensors and their integration in network systems, like WSN’s (Wireless Sensor Networks) that spread different or equal sensors through an area to study all the area, like the example in [30], where a solution for soil moisture and temperature monitoring is proposed in the fields of a farmland using WSN and also local systems, that do a wide range of actions and use wireless communications, like the weather station proposed in [31].
Reliable communication between sensor nodes and data aggregation platforms is critical in IoT vineyard deployments, which often span large, topographically variable, and remote areas far from power and population centers. There are more than 20 communication technologies that allow for wireless data exchanges between devices and platforms [32], but for agricultural applications, there are a lot of factors that influence the use of the protocols.
Wi-Fi offers high throughput but short range and high energy use with infrastructure demands; cellular communication protocols provide wide-area coverage but incurs ongoing costs and higher power draw; ZigBee and similar mesh network protocols suit short-range links, yet add routing complexity. In contrast, LPWAN, particularly LoRaWAN, operates in unlicensed ISM bands, delivers kilometer-scale links at very low power and supplies a network layer with device addressing, adaptive data rates, and security. Its star-of-stars topology allows end devices to send uplinks directly to any in-range gateway (no multi-hop), minimizing configuration and energy.
As so, after taking into consideration the advantages and disadvantages, its clear that LoRaWAN offers the best solution for simple implementation and adaptability to different contexts.
The literature reports diverse PV DAS architectures spanning simple to flexible designs. A compact, low-cost LoRaWAN node using an ESP32-based module with a DHT11 and a custom soil-moisture probe demonstrates autonomy and ease of use, though with a limited sensor set [33]. A broader, low-cost ESP32 system acquires multiple parameters and serves a local HTML dashboard, but its reliance on Wi-Fi and plain-page visualization raises infrastructure and security concerns [34]. Focusing on soil-water status, another implementation couples air temperature, relative humidity, duplicated soil-moisture probes, and soil temperature on TTGO LoRa32 nodes, forwarding via a nearby gateway to a server, being an efficient LoRa field layer but dependent on Wi-Fi/4G backhaul availability [35].
In [36], a low-cost automatic weather station based on Raspberry Pi Zero offers expandability and multi-node support, yet higher power draw and the absence of low-power communication protocols limit long-term autonomous deployment in remote vineyards. Conversely, a flexible LoRaWAN node with plug-and-play SDI-12 interfacing (e.g., ATMOS-41/ATMOS-22) validates long-range, low-power, and cost-efficient telemetry, while the price of the commercial stations used underscores the value of truly low-cost sensing for widespread adoption [37].
Accordingly, this work proposes a low-cost, energy-autonomous bioclimatic monitoring system for PV (adaptable to broader PA). This system integrates readily available sensors to capture soil, weather, and plant variables already identified, using a custom PCB (printed circuit board) to fuse and simplify accommodation electronics. An MCU board with an integrated LoRa transceiver implements LoRaWAN to stream measurements to a central server, while a solar panel and rechargeable battery ensure continuous outdoor operation with minimal maintenance.
2. System Overview
Figure 1 provides an overview of the proposed system, which integrates low-cost commercial sensors and a custom-built sensor, a low-power LoRaWAN-enabled microcontroller development board, a custom PCB which fuses the needed electronics and an autonomous solar power supply for continuous bioclimatic monitoring in vineyards.
The chosen microcontroller development board for this project was a version of the Arduino which includes a 32-bit ARM Cortex-M0+ microcontroller and an integrated LoRa module (a Murata chip) for long-range and low-power wireless communication, the Arduino MKR WAN 1310. The choosing of this development board was derived between cost, facility of integration of the communication protocol, easy prototyping through Arduino IDE and low-power consumption, in comparison with other platforms. The sensor’s data are collected at regular intervals and transmitted using the LoRaWAN protocol to a centralized gateway.
Environmental parameters such as wind speed, wind direction, and precipitation are measured using an Argent Data Systems 80422 weather sensor assembly, which integrates three passive sensors based on reed switches and magnetic triggers. The wind speed sensor (anemometer) and the rain gauge sensor work with external interrupts in a microcontroller. The wind direction sensor (anemoscope) generates a signal that when measured can be mapped to one of the 16 directions possible on a rose compass. These sensors interface the signals with an RJ-11 connector. The details of the sensors are presented in the manufacturer datasheet.
Air temperature and relative humidity are measured using a DHT20 (Aosong, also known as Assair, China) digital sensor, which communicates with the Arduino MKR WAN 1300 through the I²C protocol. This sensor integrates both sensing elements and internal signal conditioning, facilitating reliable data retrieval via existing Arduino libraries, making it a reliable and easy implementable solution for these parameters. A multi-plate external shield is used to protect the sensor from solar radiation and precipitation, providing a more accurate measurement by blocking direct sunlight while allowing natural airflow.
Leaf wetness is detected with a custom sensor mostly based on the design of the Campbell Scientific 237-L sensor, developed in [38]. Using this sensor allows for reducing the cost of the final product, still ensuring proper results. The sensor’s output varies in resistance depending on the presence of water bridging the electrode pattern. Given its low signal amplitude, the sensor output is routed through a non-inverting operational amplifier powered by the Arduino’s 3.3 V rail. This amplified signal is then read by the microcontroller’s 10-bit ADC. To reduce long-term degradation and oxidation of the electrodes, the sensor is powered using a digital output pin, activated only during measurement intervals for reducing the time it is powered.
Soil temperature is monitored using a DS18B20 digital sensor (Maxim Integrated/Analog Devices, USA), properly encapsulated to be used buried in the soil, which operates using the 1-Wire protocol. It provides a temperature measurement range of -55 °C to +125 °C with a typical accuracy of ± 0.5 °C in the -10 °C to +85 °C range. The core of the DS18B20 is a silicon bandgap temperature sensor. This sensor was selected due to its low cost, digital interface (which reduces the need for analog signal conditioning) and ease of integration into outdoor IoT applications.
Soil moisture is measured using a Watermark 200SS sensor (Irrometer Company, USA), which relies on changes in electrical resistance within a porous matrix to estimate soil water tension.
The chosen method excites the sensor with simulated AC pulses, by rapidly reversing the applied polarity in short microcycles (“+” and “−” phases) while sampling the same sensing node in both phases. After that, it calculates the medium measured value, using that value with thermal compensation to convert resistance values into centibars. Studies show that the sensor can read values up to -600 cbs, but the recommended range, given by the manufacturer, is between 0 and -200 cbs, being that the sensor responds much slower to changes [39]. This information show that the sensor will, most of the time, exceed the 200 cb value of the measurements, but being most trustworthy in the 0-200 cb range.
Because the electrodes are embedded in gypsum and the device behaves as an impedance with parasitic capacitance (not strictly ohmic), this alternating drive minimizes net DC at the electrodes and mitigates polarization/corrosion. A simple conditioning network with two diodes isolates the conduction path for each phase so that, at any instant, the reading corresponds only to the active leg of the resistive divider after a brief settling time. This method can be visually understood with Figure 2.
Another essential component integrated in the system is an RTC clock, in our case a module based on a DS3231 (Analog Devices, USA) chip, to keep accurate time and generate periodic alarms to define the frequency of transmissions and data collection. Its built-in temperature-compensated crystal ensures minimal drift, and the alarm output lets the microcontroller wake up precisely (e.g. every minute) without busy-waiting. It also timestamps data collection and can be synchronized over the serial interface for manual clock updates.
After deciding and testing the functioning of the previous presented components, it was time to think about how to implement them in a fully operable system. Regarding this, a dedicated PCB was custom designed and then manufactured by a specialized company. The design was shaped for the PCB to act as a shield for the Arduino microcontroller board. Adopting this PCB offers clear advantages over bread and protoboards: stable and repeatable connections, a compact layout with improved routing and noise immunity and mechanical robustness to vibration and thermal cycling. Moreover, the layout and design facilitate scalability, leaving open paths and pins which can be later used if needed. These characteristics are central to the standardization of this system for small- and medium-scale producers.
In order for the system to operate autonomously, it was necessary to have a continuous power supply that would guarantee energy for the system to function correctly. With this in mind, and still trying to minimize costs, a mini 6 V 150 mA solar panel was purchased, providing a maximum power of 0.9 W. Its estimated energy conversion efficiency, under normal test conditions (1000 W/m² of irradiance), is between 15 and 18%. The interface between solar panel and battery is made through a solar charger module based on a CN3065 (several manufacturers in the world) chip. The chosen battery was a rechargeable lithium one with 3.7 V and 2200 mAh, which means that for a system with an output of 100 mA, it can work for approximately 22 hours.
Having in mind that the system needed an external structure capable of being installed in a remote vineyard, a box and supports were needed so all the components could be accommodated. For this purpose, 3D printed parts were acknowledged as a low-cost and practical solution, guaranteeing the most important characteristics: adaptability, structural resistance to extreme climate events, and component suitability. In this way, five sensor supports, a solar panel support, and a box were printed in UTAD, using a Bambu Lab H2D 3D printer and ABS for the filament material. The printed parts can be seen in Figure 3.
After having all the components chosen, a firmware needded to be developed. The behaviour of the system is divided in three parts: the data collection, the data prepartion and finnaly data transmission. As so, Figure 4 represents the firmware flow, which operates in the following manner: after powering up the microcontroller, it initializes the real-time clock and the sensors, then programs a periodic RTC alarm. Every time the alarm fires, the code takes and stores samples from the sensors. Independently, it checks whether the defined collection interval has elapsed: when it has, the firmware computes averages of the stored readings, builds a binary payload (including the channel-mask) and sends it over LoRa to TTN, clearing its buffers, and starting the next cycle.
Figure 5 shows the developed and installed field prototype, using a wooden vineyard post to ensure fixation, although it could be installed without it.
Before going to the data analysis, it is important to reflect on the cost of the developed prototype, since a low-cost product was one of the aims for the system. As so, Table 1 and Table 2 provide a compact and transparent breakdown of the per-node cost and the main price drivers, which is essential for reproducibility and cost transparency. The Vendor (example) column is retained even when certain parts were supplied by the university, offering equivalent sources for search and reproducibility.
As the table shows, the total cost for this station goes for around €260. Several mechanical items (posts, arms, metal clamps, and brackets) were supplied by the lab from previous projects, so their prices are indicative only. The total is not fixed: structural parts, mounts, and cabling can be substituted, and some sensors may be sourced more cheaply from marketplaces (e.g., AliExpress) at possible quality trade-offs. Overall, the station delivers its intended functionality at a low per-node cost, which can be further reduced through promotions, bundled purchases, or local sourcing—highlighting the system’s adaptability and affordability for the target applications.
The data gathered from the sensors are sent to a platform to be stored and analyzed. The mySense platform (Figure 6), [40], developed in UTAD, was chosen to smooth this process, as it is agriculture-oriented and easy for data access and visualization. This IoT platform is designed in a 4-layer architecture, which has been studied in the cybersecurity field [41], showing how well-developed it is. Studies like [42] show how IoT devices have been implemented with this platform, strengthening how well suited, for agricultural practices support, the platform is. Since the mySense platform isn’t a LoRaWAN Network Server (LNS), a dedicated LNS is needed to handle security, validation and decodification of LoRaWAN data packages. For this purpose, the The Things Network (TTN) was the chosen platform.
Specifically, the collected data is first packaged in a hexadecimal payload compatible with LoRaWAN: a 4 byte mask (32 bits) indicates which channels the data goes on, followed by 16 bit values (big-endian, signed) per channel present. The order results from the active bits in the mask. Each channel has a scaling factor applied in the TTN decoder, producing a JSON string with the fields already in physical units. Then, the constructed payload is sent to TTN using Over-the-air-activation (OTAA), ensuring authentication and session key derivation. The node transmits unconfirmed uplinks and a gateway located in UTAD forwards the frames to the TTN Network Server, which performs de-duplication, Message Integrity Code (MIC) validation and payload decryption. Figure 7 visually resumes this process.
Using a decoding function (Payload formatter) in TTN allows for the data to be converted to a compatible format (JSON) for mySense. After that, data is sent to mySense via HTTP Webhook. In the mySense Application Server, messages enter with timestamp, node ID, and metadata (channel/sensor type), and are persisted in the time series database for visualization and analysis [40].
3. Results
After testing and preparing the field deployment of the system, it was also needed to choose a suitable location for the deployment, aiming to obtain results in a real vinyeard. As the battery is to be charged using the solar panel, it is good practice to avoid locations where there is shade, as this will affect the number of hours of daily sunlight and therefore the charging of the battery. As so, the station was installed on the property of the Mateus Palace / Casa de Mateus Foundation, in the parish of Mateus (Vila Real, Portugal), with coordinates WGS84 41.2968° N; 7.7124° W (Figure 8) [43]. The site includes vineyards in production and an active winery (dating back to the 16th century) [44], allowing direct observation of the cultural cycle and viticultural treatments.
The Mateus Palace is located on the edge of the Douro Demarcated Region, at a higher altitude (500 m). In addition, the property hosts phytosanitary protection trials in a real-world context: as part of the UVineSafe project (CITAB/UTAD), trials are being conducted on the application of UV-C radiation in a commercial vineyard owned by the Casa de Mateus Foundation, with the aim of reducing the use of plant protection products [45,46,47] by 30–50% the use of plant protection products [45,46,47], which reinforces the relevance of the site for bioclimatic monitoring and decision support studies.
The system was in continuous operation for 14 days, between August 14, 2025, and August 28, 2025, with sampling every 15 minutes and an effective coverage of 97.32% of measurements. There were 1345 expected transmissions, with only 1309 being successful. The longest interval without records was 2h15m; the remaining gaps were short and without a consistent temporal pattern, suggesting sporadic non-systemic failures. Overall, the data obtained show temporal and inter-sensor consistency. To achieve validation for the obtained data, the system was installed next to a commercial station from Meter Group (USA), which integrates factory calibrated and high cost sensors from the same manufacturer. The system was evaluated in three main components: Energy autonomy, sensor data quality and prototype structural assessment.
For soil moisture and precipitation data, there was a need to extend the analyzed period, because in the first 14 days there were no precipitation events, so there were no conclusions to get from the data. The station was in continuous operation until the needed events occurred, extending operation until September 03 of the same year.
In terms of sensor data, the results show:
- Air temperature and relative humidity: The time series are consistent with the reference station, with no significant systematic deviations on a daily or sub-daily basis. Diurnal/nocturnal variations and responses to events (e.g., moist air advection) were correctly captured.
- Soil temperature: The sensor was buried in a 25 cm hole. A consistent trend was observed in relation to the reference, with minor differences attributable to the exact burial depth and local thermal conductivity. The stability of readings throughout the period is adequate for agronomic use.
- Precipitation: Rainfall records were almost consistent with the reference, due to the two sensors being different in build and firmware from each other, but were consistent with other variables (e.g., temperature drops, increases in RH). No rain gauge failures were observed during the recorded events. There were 2 identified problems that caused the inconsistencies: the positioning and some degree of delay in relation with the reference rain gauge. Still, the obtained data presents enough accuracy for agronomic use, taking into consideration the usage of a low-cost sensor.
- Wind: The evolution of wind speed showed the same dynamics between stations, with coinciding peaks and consistent direction during periods of greater intensity, supporting the validity of the anemometer. The differences in the peaks for the wind speed was determined to be because of a firmware error: The cup anemometer (developed station) counts rotations in a very short window (2 s) and reports an almost “instantaneous” value for each measurement, calculating the wind gust. The wind direction got the expected readings. The firmware returns a direction, from 0 (north) to 15 (North–Northwest), corresponding to the directions in a compass rose.
- Leaf wetness: The sensor accurately captured periods of wet/moist surfaces, corresponding to conditions of high RH and light winds. The interpretation should take into account that wetness results from the balance between deposition/condensation and drying by ventilation and radiation; even so, the patterns observed are consistent with the expected health risk for the period. Observed differences between stations result from field calibrations – the reference sensor is already calibrated from fabric.
- Soil matric potential: During late summer/early fall, the local soil was dry, with readings often close to the upper operating limit of the sensor. Even so, the response to precipitation events was consistent, with a decrease in potential immediately after rainfall and subsequent gradual recovery, in line with soil physics and previous observations. This behavior supports the usefulness of the sensor for trend tracking and decision-making regarding irrigation/controlled deficit.
The corresponding results can be seen in Figure 9 and Figure 10, with the same order as described before.
Using the data obtained from the test window (14–28 August), it was possible to build Table 3, summarizing the daily mesoclimate, reporting extremes of air temperature and relative humidity, rainfall, mean wind speed, and vapor pressure deficit (VPD). The aim is to contextualize the environmental regime in which the node operated and to anchor the interpretation of soil–plant water status and disease–risk indicators presented in the results.
Daily reached 40.2 °C (day 14) and dropped to 10.4 °C (day 28), evidencing a wide diurnal range. VPD spanned 0.59–2.68 kPa, with high evaporative demand on days 14–17 and 23 (VPD ≥ 1.5 kPa). Mean wind speeds were moderate–strong (∼5.7–12.5 m/s), favouring rapid leaf-surface drying, yet nightly up to ∼90–95% indicates potential dew windows. With zero rainfall, soil-moisture dynamics are dominated by evapotranspiration, consistent with elevated Watermark tensions and only gradual overnight relief.
During the test period, the vines are in the veraison–harvest stage of their phenologycal cycle. As so, the target is a moderate water deficit—concentration without arresting ripening. Accordingly: (i) on high-demand days (14–17, 23) tighten soil-water monitoring; if tensions exceed the vineyard’s target band, use brief maintenance irrigations to stabilise ripening and avoid shrivel; (ii) when nocturnal RH is high and leaf-wetness occurs, cross-check wetness duration with temperature to flag Botrytis-conducive hours and schedule protection on dry, calm mornings; (iii) under the dry, windy regime observed, infection pressure is generally lower but transpiration is elevated – avoid late heavy irrigations near harvest to prevent must dilution, and use lower-demand days (e.g., 27–28 August) for gentle recovery that preserves acidity and aroma. Together, these patterns illustrate the decision value of mesoclimate monitoring for irrigation timing and disease-risk management in precision viticulture.
This result interpretation allows for anyone to understand the agronomic value the chosen variables give to the vineyard bioclimatic monitoring, which aligns with the purpose of worldwide adoption of these types of systems. Futhermore, the use of VPD, which, in the firmware, is not calculated directly, shows how climate indices can easily be derivated using the critic monitored parameters, reinforcing the agronomic value of the developed system.
In terms of energy consumption, from instrumented measurements of the 15-minute cycle, the average power per operating state was obtained: idle ≈ 104 mW (92.9% of the time), data collection ≈ 108 mW (6.7%), LoRaWAN transmission ≈ 210 mW (0.44%). The weighted average leads to W, equivalent to Wh/day.
With a 2200 mAh at 3.7 V battery (≈ 8.14 Wh) and a 0.9 W solar panel, two overall efficiency scenarios were considered (including MPP/electronics/cables/diode/dirt):
- Favorable ( during 5 hours of usable sunlight): ; daily balance ⇒ self-sufficiency (battery maintains charge).
- Realistic ( during 5 hours): ; ⇒ autonomy from full charge , in the absence of improved charging conditions.
Figure 11.
Energy profile over the 14-day deployment. (a) Battery voltage vs time. (b) Time-weighted power by state (idle, sensing, LoRaWAN transmission). 5-minute duty-cycle, showing minute-level acquisitions and sporadic TX spikes.
Figure 11.
Energy profile over the 14-day deployment. (a) Battery voltage vs time. (b) Time-weighted power by state (idle, sensing, LoRaWAN transmission). 5-minute duty-cycle, showing minute-level acquisitions and sporadic TX spikes.
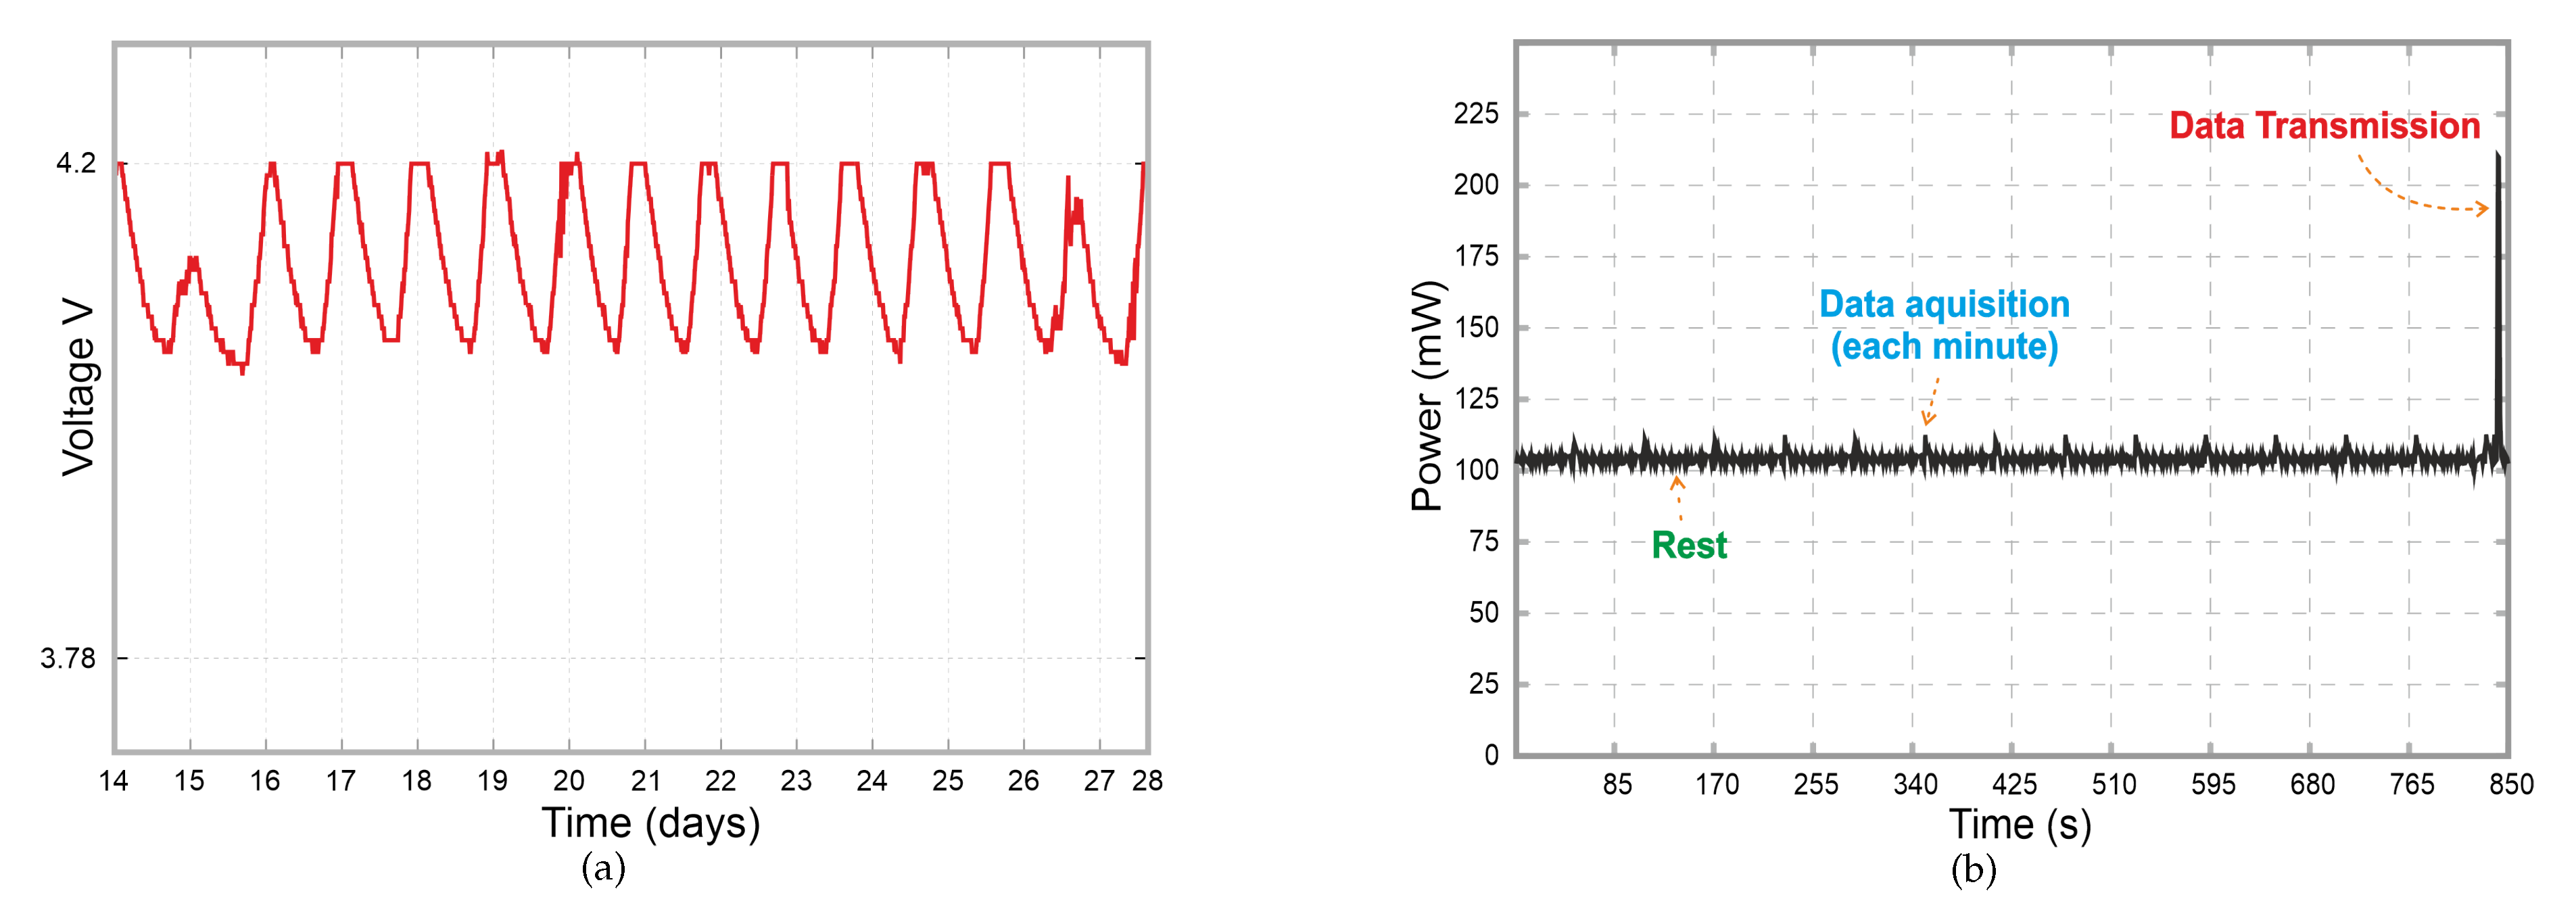
These values place the system on the verge of annual self-sufficiency with a 0.9 W panel. After studying both the favorable and realistic scenario, it becomes clear that minor optimizations, like the reduction of idle/telemetry consumption, an increase in the effective charging duty cycle, or a slightly larger panel could enhance energy autonomy in months with less sunshine, effectively ensuring autonomous operation of the system.
A structural prototype analysis, after prototype development tests and the field deployment test period of the system, revealed that the 3D printed box, sensor supports and solar panel support withstood thermal and meteorological variations without significant loosening and degradation. However, incremental improvements were identified:
- better UV resilience (more suitable materials and/or addition of stabilizers and coatings);
- sealing and breathing space (better condensation management and cable glands);
- geometric robustness of the supports (thicknesses and radii of agreement) to reduce local stresses and wear due to thermal cycles. These improvements should improve the structure of the system, so it can stay operating for a very long time and allow for easier maintenance.
4. Conclusion and Final Remarks
In view of increasing climate variability and the need for mesoclimate monitoring in viticulture, this study developed and validated a low-cost IoT system with integrated relevant sensors, periodic acquisition, and LoRaWAN transmission to an IoT platform. The overall objective was to design a robust, energy-efficient, and affordable node, which was achieved, as were the specific objectives: (i) selection/integration of the minimum set of sensors with adequate accuracy; (ii) hardware/firmware for regular data sampling and sending; (iii) robustness in the field and low maintenance; and (iv) attractive final cost for small and medium-sized farmers.
In actual operation, the system showed continuity and data quality compatible with daily mesoclimatic analysis, supported by a delivery success rate of 97.32%, with no prolonged gaps that would compromise interpretation. The consistency between variables confirmed the validity of the node for monitoring water status and health risk.
From an energy standpoint, the measured profile showed a weighted average consumption of 104.67 mA during the 15-minute operating cycle, allowing for extended operation with the defined power supply scheme and demonstrating self-sufficiency during the test period. This behavior results from the combination of low consumption in the idle, acquisition, and transmission states with the sizing of the power subsystem.
In terms of cost, the prototype reached a value per node of around €260, dominated by sensors and communications, remaining within a range compatible with adoption in small and medium-scale viticulture. The design with its own PCB and detailed documentation increases reproducibility and simplifies industrialization in small series.
In summary, the proposed system has proven to be viable, reliable, and affordable solution for bioclimatic monitoring in vineyards, providing consistent data to support decision-making (irrigation and disease risk management) and possibilitating small and medium-scale viticultors and agricultors to implement this type of system. Its architecture and results support transferability to operational scenarios, maintaining a focus on low cost and reduced maintenance.
Author Contributions
Conceptualization, A.V., N.S. and R.M.; methodology, A.V.; software, A.V. and N.S.; validation, A.V.; formal analysis, A.V. and N.S.; investigation, A.V.; resources, A.V. and R.M.; data curation, A.V. and N.S.; writing—original draft preparation, A.V.; writing—review and editing, N.S., D.P. and R.M.; visualization, A.V. and R.M.; supervision, N.S. and R.M.; project administration, R.M.; funding acquisition, R.M. All authors have read and agreed to the published version of the manuscript.
Funding
This research activity was supported by the Vine&Wine Portugal Project, co-financed by the RRP—Recovery and Resilience Plan and the European Next-Generation EU Funds, within the scope of the Mobilizing Agendas for Reindustrialization, under ref.C644866286-00000011.
Data Availability Statement
The data that support this study is all contained in the article. Other data details less important are available from the corresponding author upon reasonable request.
Acknowledgments
The authors would like to acknowledge the support through National Funds by the Portuguese Foundation for Science and Technology (FCT), under the projects UID/04033/2025: Centre for the Research and Technology of Agro-Environmental and Biological Sciences and LA/P/0126/2020: Institute for Innovation, Capacity Building and Sustainability of Agri-Food Production (https://doi.org/10.54499/LA/P/0126/2020).
Conflicts of Interest
The authors declare no conflicts of interest. The funders had no role in the design of this study; in the collection, analyses, or interpretation of data; in the writing of the manuscript; or in the decision to publish the results.
References
- Pierce, F.J.; Nowak, P. Aspects of precision agriculture. Advances in Agronomy 1999, 67, 1–85. [Google Scholar]
- ECONOMIC, U.N.D.F.
- Nelson, G.C.; Rosegrant, M.W.; Koo, J.; Robertson, R.; Sulser, T.; Zhu, T.; Ringler, C.; Msangi, S.; Palazzo, A.; Batka, M.; et al. Climate change: Impact on agriculture and costs of adaptation; Vol. 21, Intl Food Policy Res Inst, 2009.
- Bramley, R.G.V.; Hamilton, R.P. Terroir and precision viticulture: are they compatible? Journal International des Sciences de la Vigne et du Vin 2007, 41, 1–8. [Google Scholar] [CrossRef]
- Pascoal, D.; Silva, N.; Adão, T.; Lopes, R.D.; Peres, E.; Morais, R. A technical survey on practical applications and guidelines for IoT sensors in precision agriculture and viticulture. Scientific Reports 2024, 14, 29793. [Google Scholar] [CrossRef]
- Mizik, T. How can proximal sensors help decision-making in grape production? Heliyon 2023, 9, e16322. [Google Scholar] [CrossRef]
- Mesa, I.F.; Sánchez-Costa, E.; Aranda, X.; Altava-Ortiz, V.; Barrera-Escoda, A.; Prohom, M.; Poyatos, R.; Sánchez-Ortiz, A.; Savé, R.; De Herralde, F. Modelling future climate change impacts on grapevine water requirements and growing cycle in three wine PDOs of NE Spain. Oeno One 2024, 58. [Google Scholar]
- Santos, J.A.; Fraga, H.; Malheiro, A.C.; Moutinho-Pereira, J.; Dinis, L.T.; Correia, C.; Moriondo, M.; Leolini, L.; Dibari, C.; Costafreda-Aumedes, S.; et al. A Review of the Potential Climate Change Impacts and Adaptation Options for European Viticulture. Applied Sciences 2020, 10. [Google Scholar] [CrossRef]
- Coombe, B.G.; Dry, P.R. Viticulture. Volume 1. Resources in Australia. 1988. [Google Scholar]
- van Leeuwen, C.; Barbe, J.C.; Geffroy, O.; Gowdy, M.; Lytra, G.; Pons, A.; Thibon, C.; Marchand, S. How terroir shapes aromatic typicity in grapes and wines (Part I): Sourced from the research article:” Recent advancements in understanding the terroir effect on aromas in grapes and wines”(OENO One, 2020). Original language of the article: English. IVES Technical Reviews, vine and wine, 2023. [Google Scholar]
- Bramley, R. Understanding variability in winegrape production systems 2. Within vineyard variation in quality over several vintages. Australian Journal of Grape and Wine Research 2005, 11, 33–42. [Google Scholar] [CrossRef]
- Laroche-Pinel, E.; Duthoit, S.; Albughdadi, M.; Costard, A.D.; Rousseau, J.; Chéret, V.; Clenet, H. Towards vine water status monitoring on a large scale using sentinel-2 images. Remote Sensing 2021, 13, 1837. [Google Scholar] [CrossRef]
- Adetiba, E.; Ifijeh, A.H.; Oguntosin, V.; Odunuga, T.; Iweala, D.; Akindele, A.; Abayomi, A.; Obiyemi, O.; Thakur, S. Development of an IoT Based Data Acquisition and Automatic Irrigation System for Precision Agriculture. In Proceedings of the 2022 IEEE Nigeria 4th International Conference on Disruptive Technologies for Sustainable Development (NIGERCON); 2022; pp. 1–5. [Google Scholar] [CrossRef]
- Matese, A.; Crisci, A.; Di Gennaro, S.F.; Primicerio, J.; Tomasi, D.; Marcuzzo, P.; Guidoni, S. Spatial variability of meteorological conditions at different scales in viticulture. Agricultural and Forest Meteorology 2014, 189, 159–167. [Google Scholar] [CrossRef]
- Jones, R.A.; Barbetti, M.J. Influence of climate change on plant disease infections and epidemics caused by viruses and bacteria. CABI Reviews, 2023; 1–33. [Google Scholar]
- Lorenzo, M.; Taboada, J.; Lorenzo, J.; Ramos, A. Influence of climate on grape production and wine quality in the Rías Baixas, north-western Spain. Regional Environmental Change 2013, 13, 887–896. [Google Scholar] [CrossRef]
- Pipan, P.; Hall, A.; Rogiers, S.Y.; Holzapfel, B.P. Accuracy of interpolated versus in-vineyard sensor climate data for heat accumulation modelling of phenology. Frontiers in Plant Science 2021, 12, 635299. [Google Scholar] [CrossRef] [PubMed]
- Mania, E.; Petrella, F.; Giovannozzi, M.; Piazzi, M.; Wilson, A.; Guidoni, S. Managing vineyard topography and seasonal variability to improve grape quality and vineyard sustainability. Agronomy 2021, 11, 1142. [Google Scholar] [CrossRef]
- Fonseca, A.; Cruz, J.; Fraga, H.; Andrade, C.; Valente, J.; Alves, F.; Neto, A.C.; Flores, R.; Santos, J.A. Vineyard microclimatic zoning as a tool to promote sustainable viticulture under climate change. Sustainability 2024, 16, 3477. [Google Scholar] [CrossRef]
- Chen, R.; Zhang, X.; Yang, Y.; Yang, Y.; Wang, J.; Li, H. Analyses of Vineyard Microclimate in the Eastern Foothills of the Helan Mountains in Ningxia Region, China. Sustainability 2023, 15, 12740. [Google Scholar] [CrossRef]
- Rustioni, L.; Altomare, A.; Shanshiashvili, G.; Greco, F.; Buccolieri, R.; Blanco, I.; Cola, G.; Fracassetti, D. Microclimate of grape bunch and sunburn of white grape berries: effect on wine quality. Foods 2023, 12, 621. [Google Scholar] [CrossRef]
- Payero, J.O.; Mirzakhani-Nafchi, A.; Khalilian, A.; Qiao, X.; Davis, R.; et al. Development of a low-cost Internet-of-Things (IoT) system for monitoring soil water potential using Watermark 200SS sensors. Advances in Internet of Things 2017, 7, 71. [Google Scholar] [CrossRef]
- Blaya-Ros, P.J.; Blanco, V.; Torres-Sánchez, R.; Giménez-Gallego, J.; Jiménez-Buendía, M.; Domingo, R. Effects of drought stress on the water relations of sweet cherry trees. In Proceedings of the 2023 IEEE International Workshop on Metrology for Agriculture and Forestry (MetroAgriFor); 2023; pp. 715–720. [Google Scholar] [CrossRef]
- Alvarez, R.; Santanatoglia, O.J.; Garcîa, R. Effect of temperature on soil microbial biomass and its metabolic quotient in situ under different tillage systems. Biology and Fertility of Soils 1995, 19, 227–230. [Google Scholar] [CrossRef]
- Wang, H.; Yao, X.; Liu, M.; Xu, X.; Wang, Y.; Kong, J.; Chen, W.; Xu, Z.; Kuang, Y.; Fan, P.; et al. Climate, soil, and viticultural factors differentially affect the sub-regional variations in biochemical compositions of grape berries. Scientia Horticulturae 2025, 339, 113858. [Google Scholar] [CrossRef]
- Pham, T.A.; Hashemi, A.; Sutman, M.; Medero, G.M. Effect of temperature on the soil–water retention characteristics in unsaturated soils: Analytical and experimental approaches. Soils and Foundations 2023, 63, 101301. [Google Scholar] [CrossRef]
- Armstrong, R.; Barthakur, N.; Norris, E. A comparative study of three leaf wetness sensors. International journal of biometeorology 1993, 37, 7–10. [Google Scholar] [CrossRef]
- Agam, N.; Berliner, P.R. Dew formation and water vapor adsorption in semi-arid environments—A review. Journal of Arid Environments 2006, 65, 572–590. [Google Scholar] [CrossRef]
- Farooq, M.S.; Riaz, S.; Abid, A.; Umer, T.; Zikria, Y.B. Role of IoT technology in agriculture: A systematic literature review. Electronics 2020, 9, 319. [Google Scholar] [CrossRef]
- Chen, K.T.; Zhang, H.H.; Wu, T.T.; Hu, J.; Zhai, C.Y.; Wang, D. Design of monitoring system for multilayer soil temperature and moisture based on WSN. In Proceedings of the 2014 international conference on wireless communication and sensor network. IEEE; 2014; pp. 425–430. [Google Scholar]
- Chakraborty, S.; Joshi, T.; Agarwal, S. Internet of Things (IoT) Based Cost Effective Weather Monitoring Station. In Proceedings of the 2023 International Conference on Device Intelligence, Computing and Communication Technologies,(DICCT). IEEE; 2023; pp. 7–11. [Google Scholar]
- Elijah, O.; Rahman, T.A.; Orikumhi, I.; Leow, C.Y.; Hindia, M.N. An Overview of Internet of Things (IoT) and Data Analytics in Agriculture: Benefits and Challenges. IEEE Internet of Things Journal 2018, 5, 3758–3773. [Google Scholar] [CrossRef]
- Stojanovic, R.; Maras, V.; Radonjic, S.; Martic, A.; Durkovic, J.; Pavicevic, K.; Mirovic, V.; Cvetkovic, M. A Feasible IoT-Based System for Precision Agriculture. In Proceedings of the 2021 10th Mediterranean Conference on Embedded Computing, 6 2021., MECO 2021. Institute of Electrical and Electronics Engineers Inc. [Google Scholar] [CrossRef]
- Mokhtarzadeh, H.; Gorjian, S.; Minaei, S. Design, development, and evaluation of a low-cost smart solar-powered weather station for use in agricultural environments. Results in Engineering 2025, 26. [Google Scholar] [CrossRef]
- Dafonte, J.; Ángel González, M.; Comesaña, E.; Teijeiro, M.T.; Cancela, J.J. Soil Water Status Monitoring System with Proximal Low-Cost Sensors and LoRa Technology for Smart Water Irrigation in Woody Crops. Sensors 2024, 24. [Google Scholar] [CrossRef]
- Ioannou, K.; Karampatzakis, D.; Amanatidis, P.; Aggelopoulos, V.; Karmiris, I. Low-cost automatic weather stations in the internet of things. Information 2021, 12, 146. [Google Scholar] [CrossRef]
- Valente, A.; Silva, S.; Duarte, D.; Cabral Pinto, F.; Soares, S. Low-cost LoRaWAN node for agro-intelligence IoT. Electronics 2020, 9, 987. [Google Scholar] [CrossRef]
- Machado, D.M.C. Estudo de soluçoes de sensoriamento da humectaçao de folhas. Master’s thesis, Universidade de Tras-os-Montes e Alto Douro (Portugal), 2016.
- Nolz, R.; Kammerer, G.; Cepuder, P. Calibrating soil water potential sensors integrated into a wireless monitoring network. Agricultural Water Management 2013, 116, 12–20. [Google Scholar] [CrossRef]
- Morais, R.; Silva, N.; Mendes, J.; Adão, T.; Pádua, L.; López-Riquelme, J.; Pavón-Pulido, N.; Sousa, J.J.; Peres, E. mySense: A comprehensive data management environment to improve precision agriculture practices. Computers and Electronics in Agriculture 2019, 162, 882–894. [Google Scholar] [CrossRef]
- Carvalho, N.; Adão, T.; Morais, R.; Costa, A.R.; Peres, E. Cybersecurity in Precision Agriculture: a short review and a practical status assessment over mySense IoT-based platform. Procedia Computer Science 2025, 256, 255–266. [Google Scholar] [CrossRef]
- Silva, N.; Mendes, J.; Silva, R.; dos Santos, F.N.; Mestre, P.; Serôdio, C.; Morais, R. Low-cost IoT LoRa® solutions for precision agriculture monitoring practices. In Proceedings of the EPIA Conference on Artificial Intelligence. Springer; 2019; pp. 224–235. [Google Scholar]
- Directorate-General for Cultural Heritage (DGPC). Mateus Palace. https://imovel.patrimoniocultural.gov.pt/detalhes.php?code=71128, 2025. Includes coordinates: 41.296831, -7.712411. Accessed on 2025-08-14.
- Casa de Mateus Foundation. Casa de Mateus. https://www.casademateus.pt/paginas/a-casa-de-mateus/, 2025. States that the winery dates back to the 16th century and is currently operational. Accessed on 2025-08-14.
- CITAB — Centre for the Research and Technology of Agro-Environmental and Biological Sciences, UTAD. UVineSafe: innovation and sustainability in agriculture. https://www.citab.utad.pt/news/uvinesafe-a-inovacao-e-a-sustentabilidade-na-agricultura, 2025. Trials at a Casa de Mateus Foundation vineyard; projected 30–50% reduction in pesticide use. Accessed on 2025-08-14.
- Agrotec Magazine. CITAB bets on UV-C radiation in Douro vineyards. https://www.agrotec.pt/noticias/citab-aposta-em-radiacao-uv-c-nas-vinhas-do-douro/, 2024. Published in Aug 2024. Accessed on 2025-08-14.
- Lusa via AMAN Alliance. Ultraviolet C radiation may help Douro region vineyards combat pests. https://www.aman-alliance.org/Home/ContentDetail/79696, 2024. News article dated 2024-08-26 about UVineSafe and the Casa de Mateus plot. Accessed on 2025-08-14.
Figure 1.
Functional schematic of the proposed system.
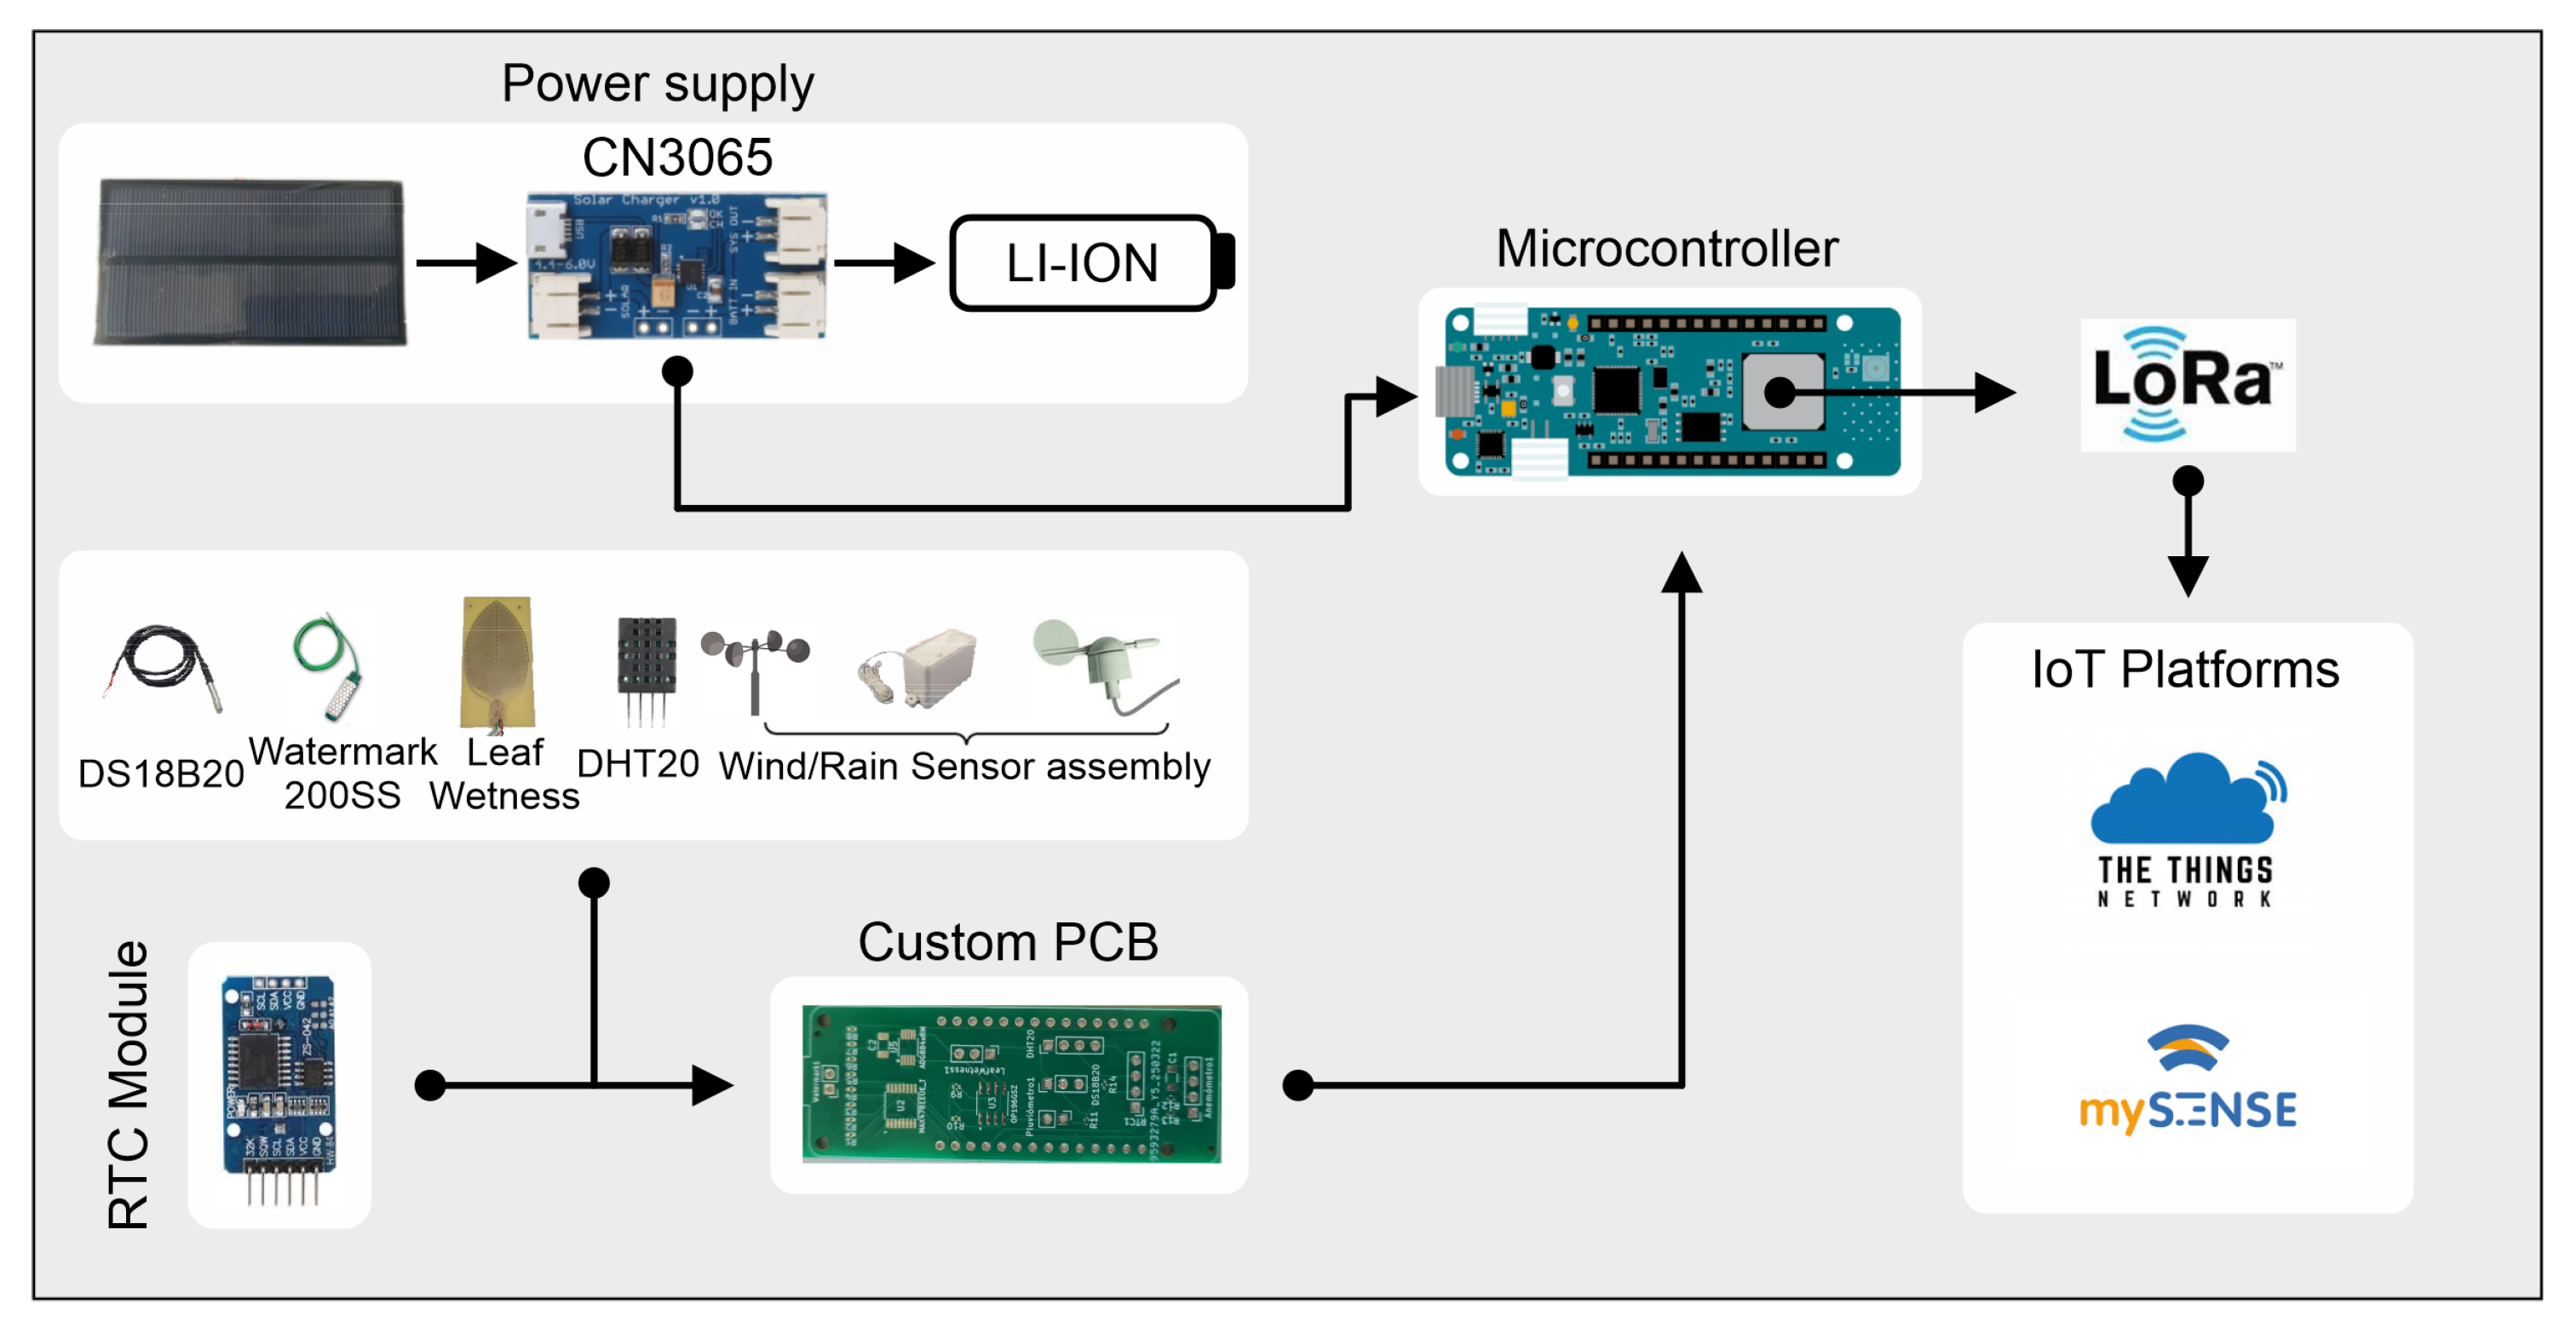
Figure 2.
Watermark measurement method with polarity switching.
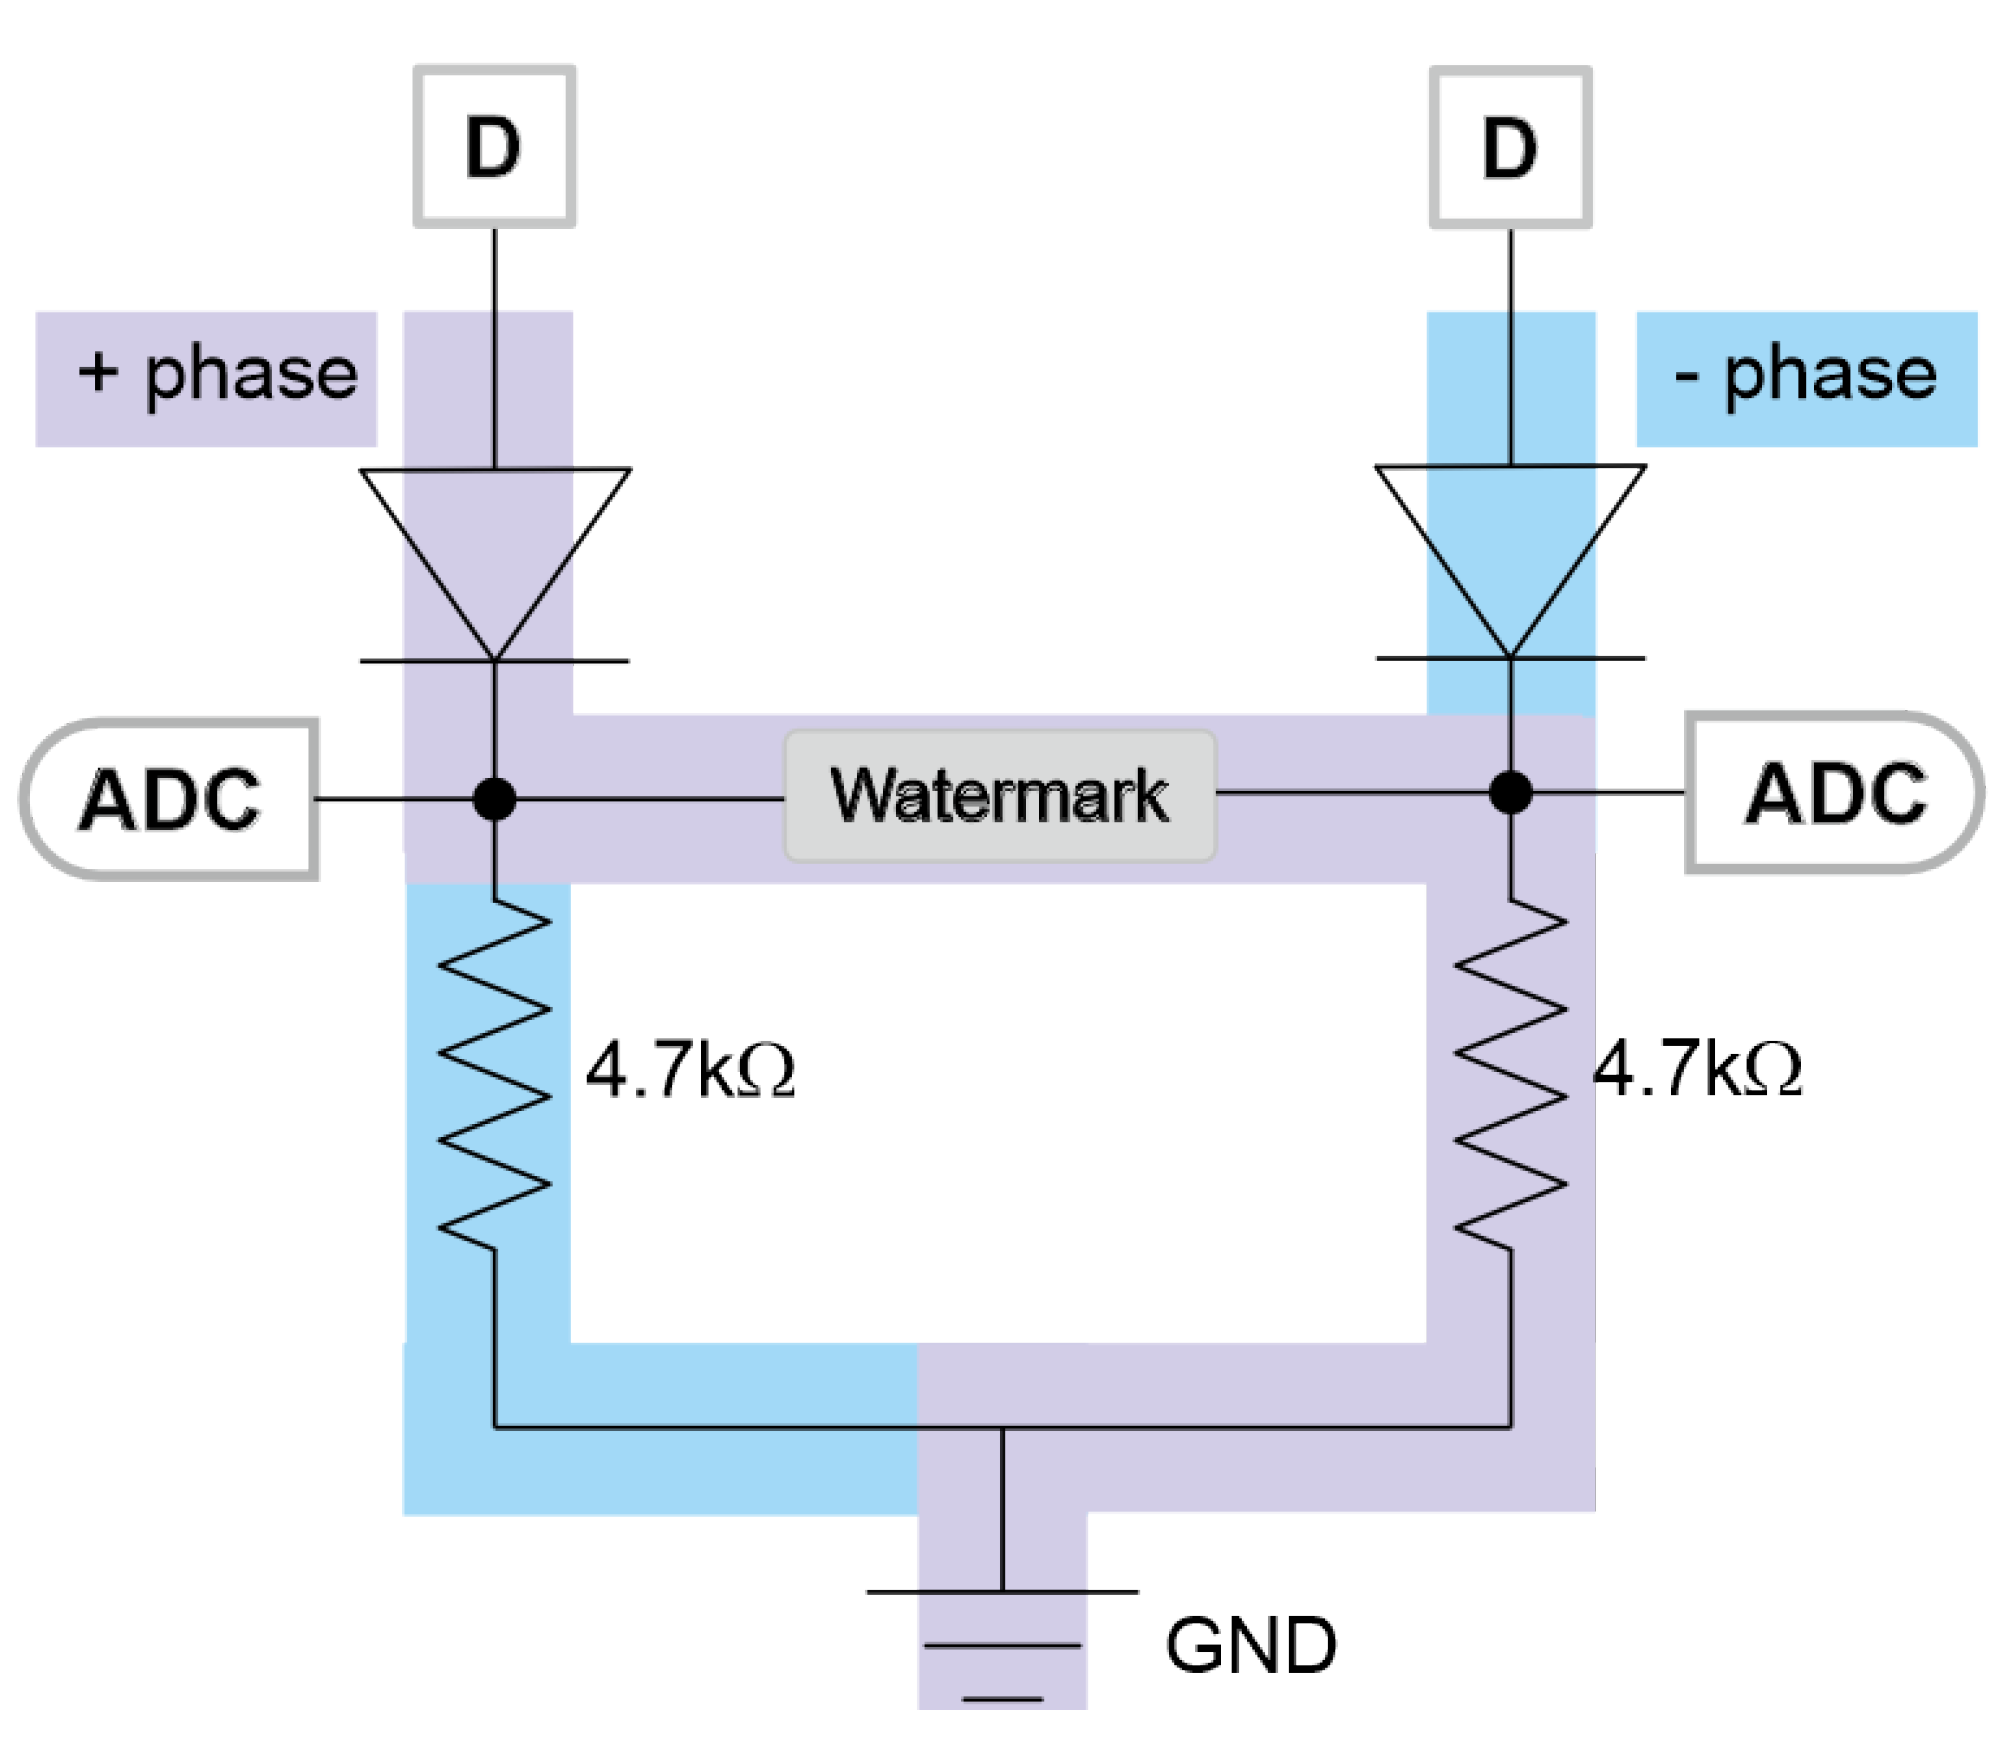
Figure 3.
3D-printed enclosure and sensor mounts. (a) Node enclosure; (b) DHT20 sensor mount; (c) leaf-wetness sensor mount; (d) adjustable solar-panel bracket; (e) rain-gauge mount; (f) anemometer mount; (g) wind-vane (anemoscope) mount.
Figure 3.
3D-printed enclosure and sensor mounts. (a) Node enclosure; (b) DHT20 sensor mount; (c) leaf-wetness sensor mount; (d) adjustable solar-panel bracket; (e) rain-gauge mount; (f) anemometer mount; (g) wind-vane (anemoscope) mount.
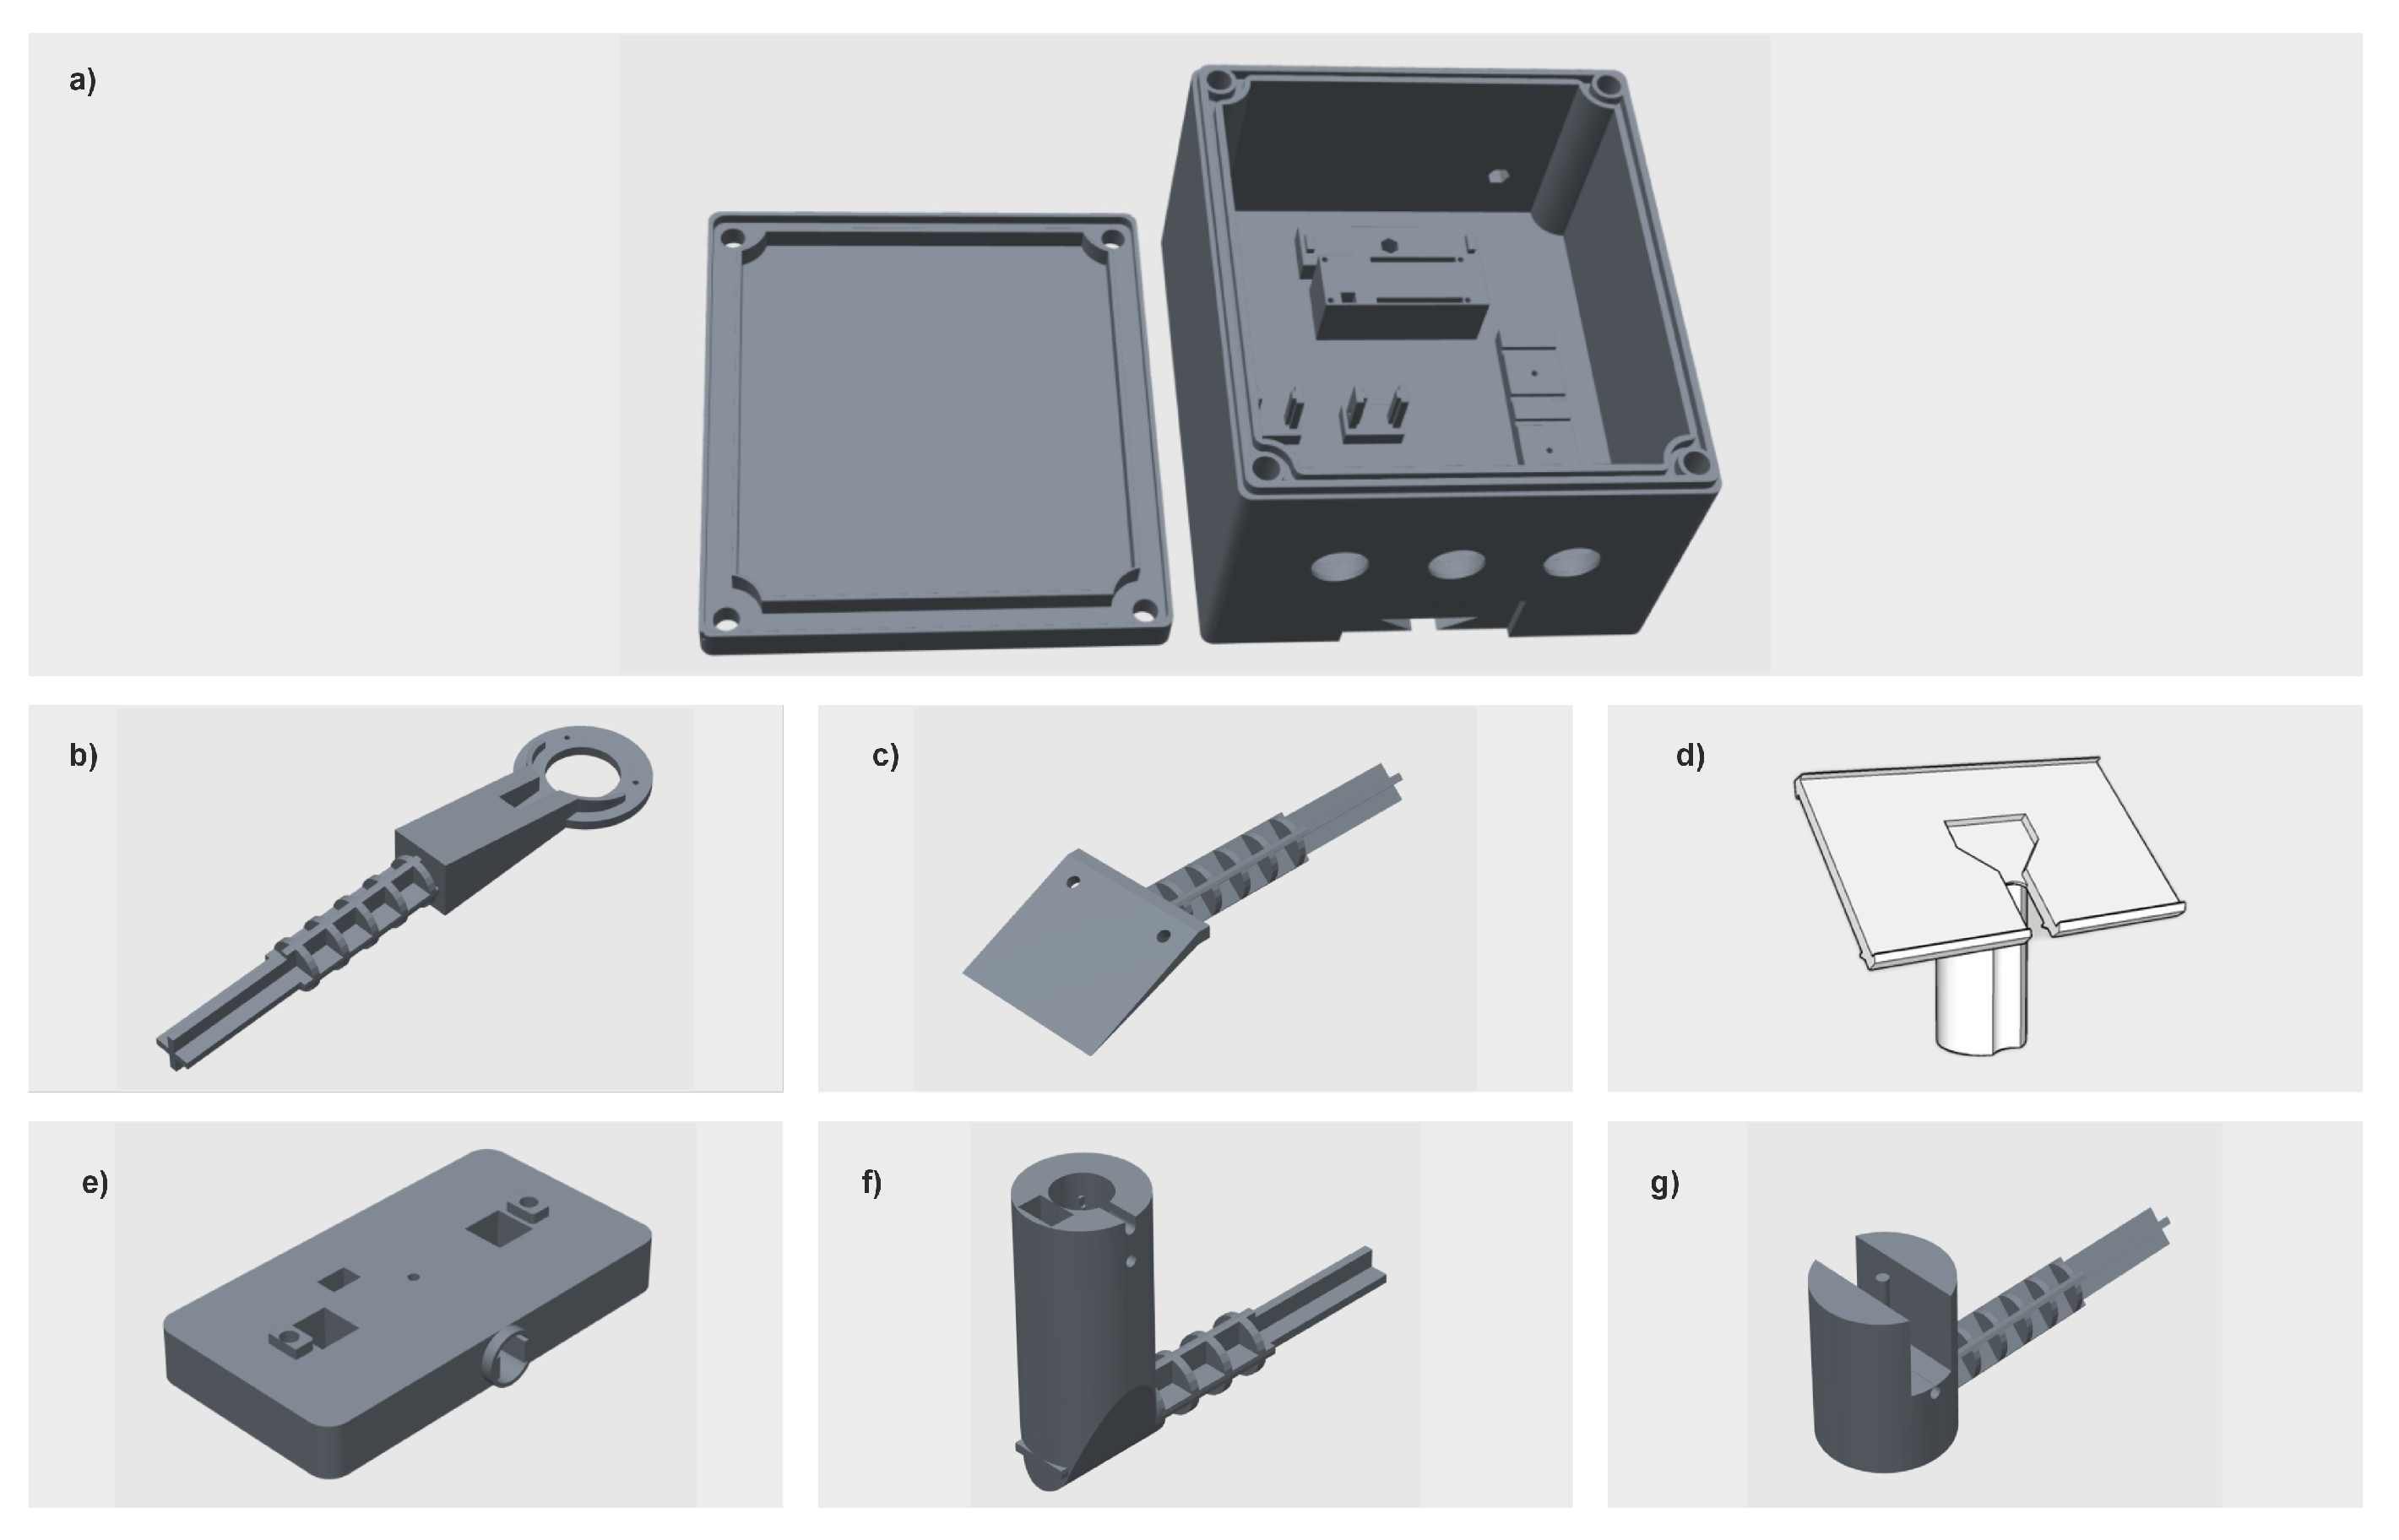
Figure 4.
Developed firmware flowchart.
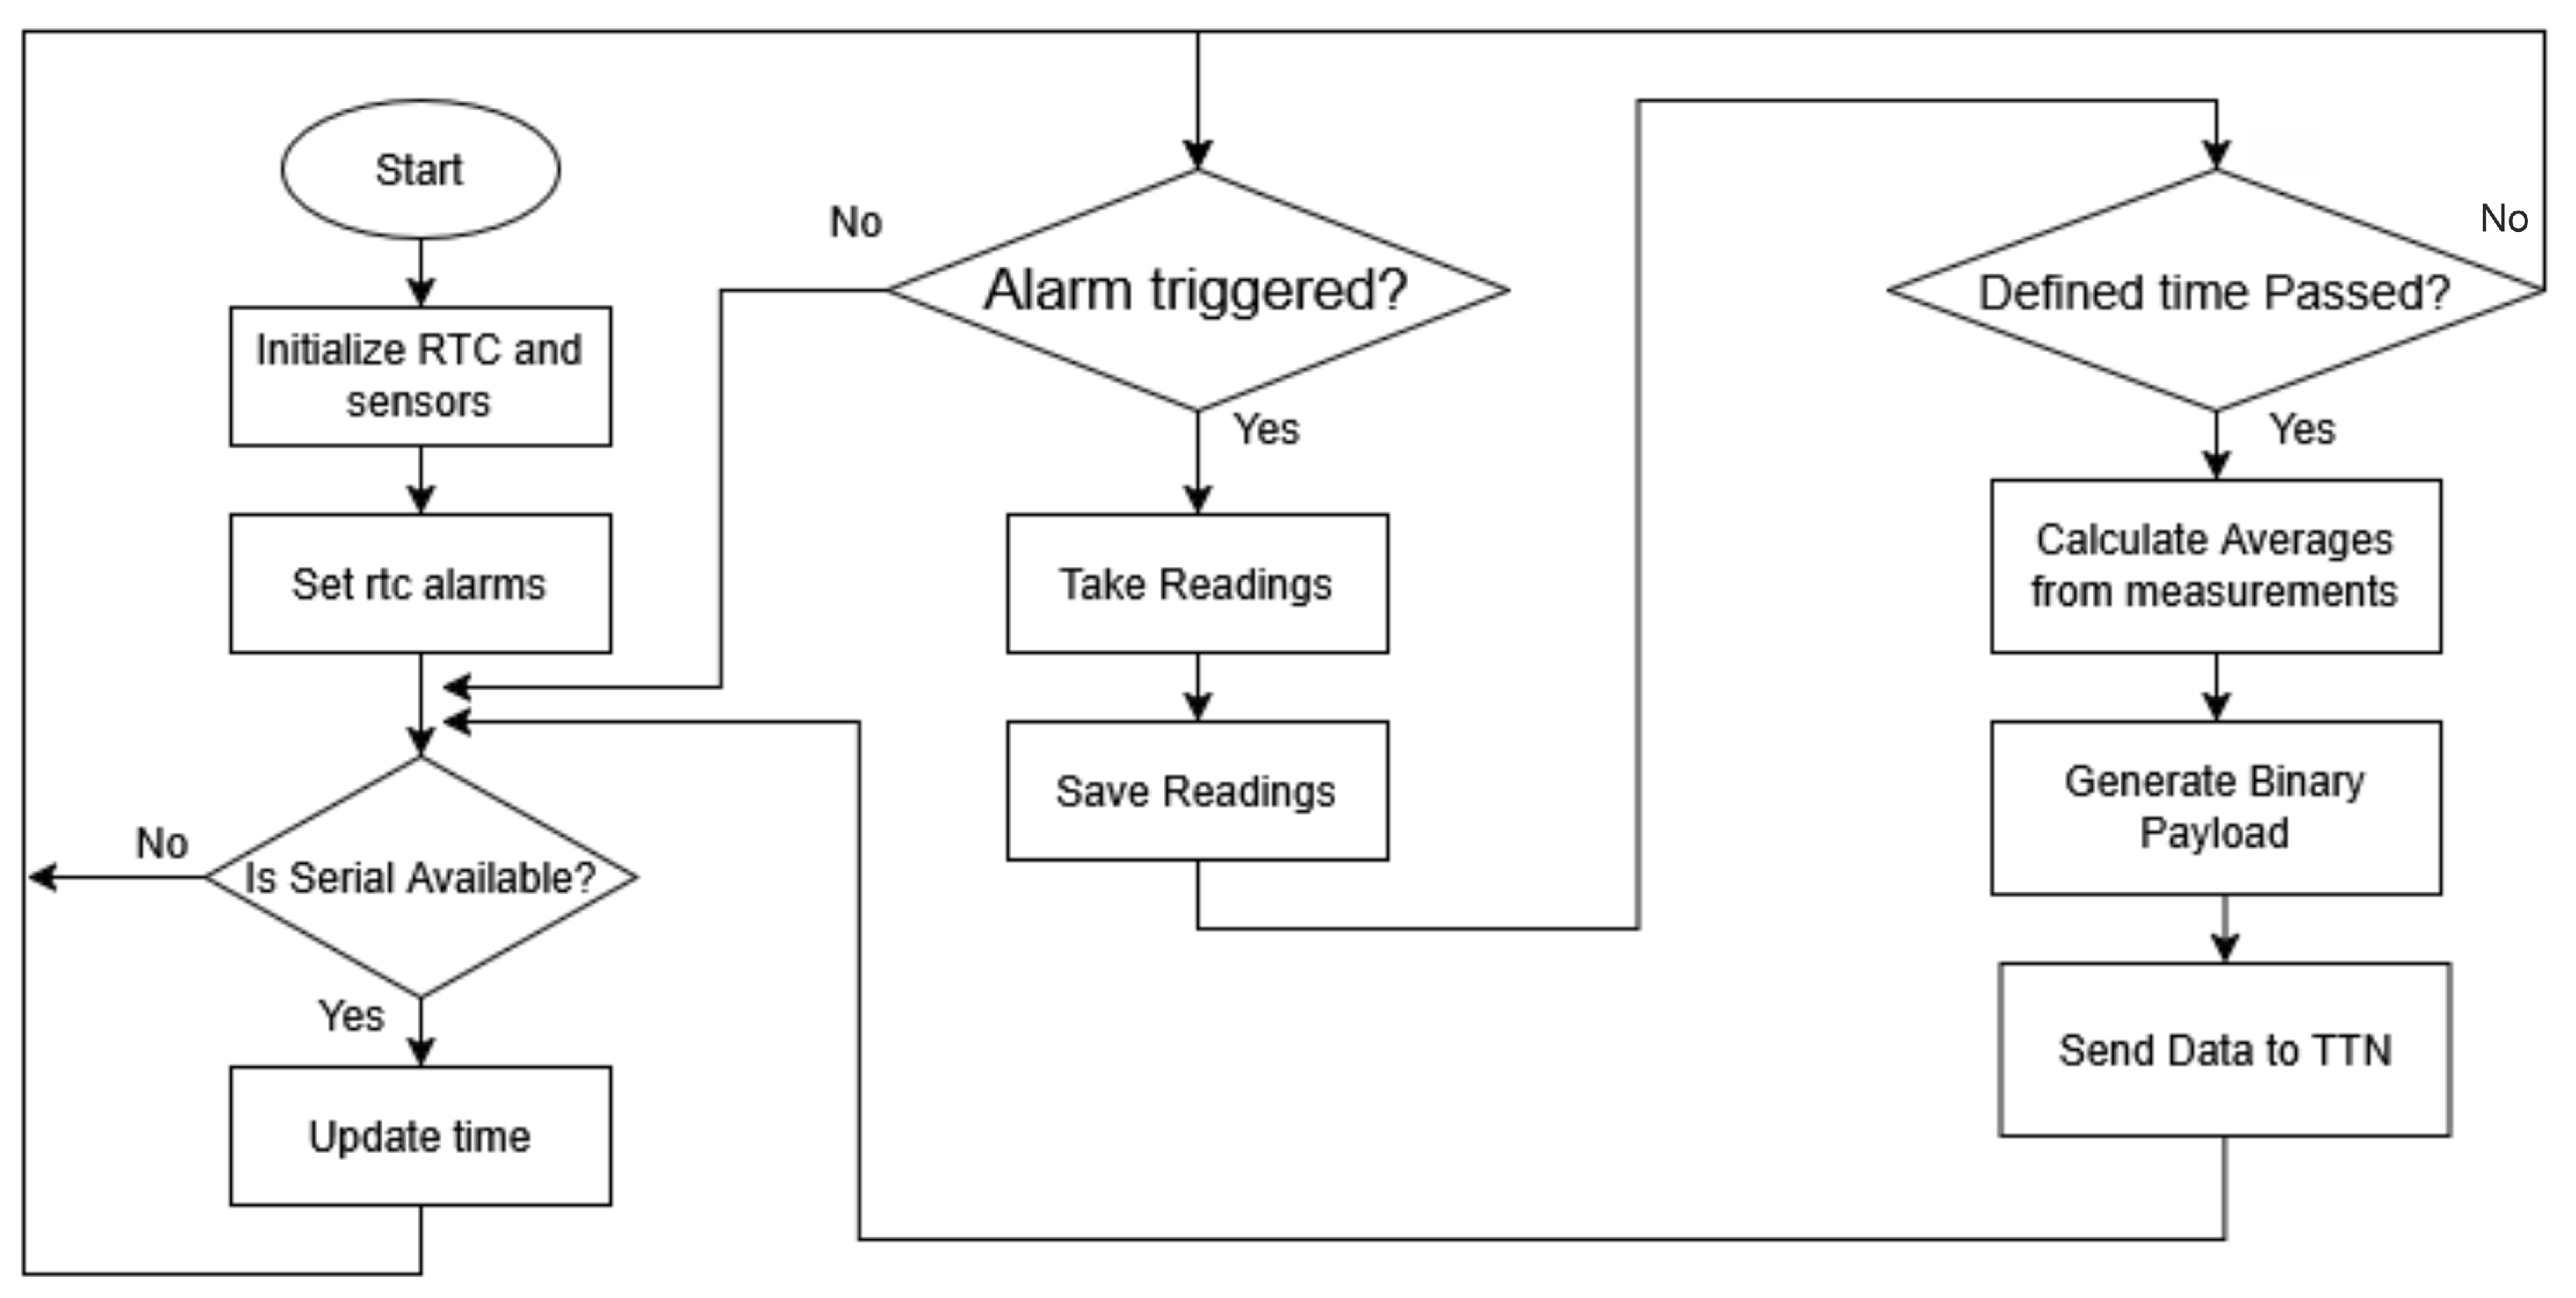
Figure 5.
Deployed field prototype in the vineyard. (a) Front view of the complete station; (b) back view showing sensor mounts and enclosure placement.
Figure 5.
Deployed field prototype in the vineyard. (a) Front view of the complete station; (b) back view showing sensor mounts and enclosure placement.
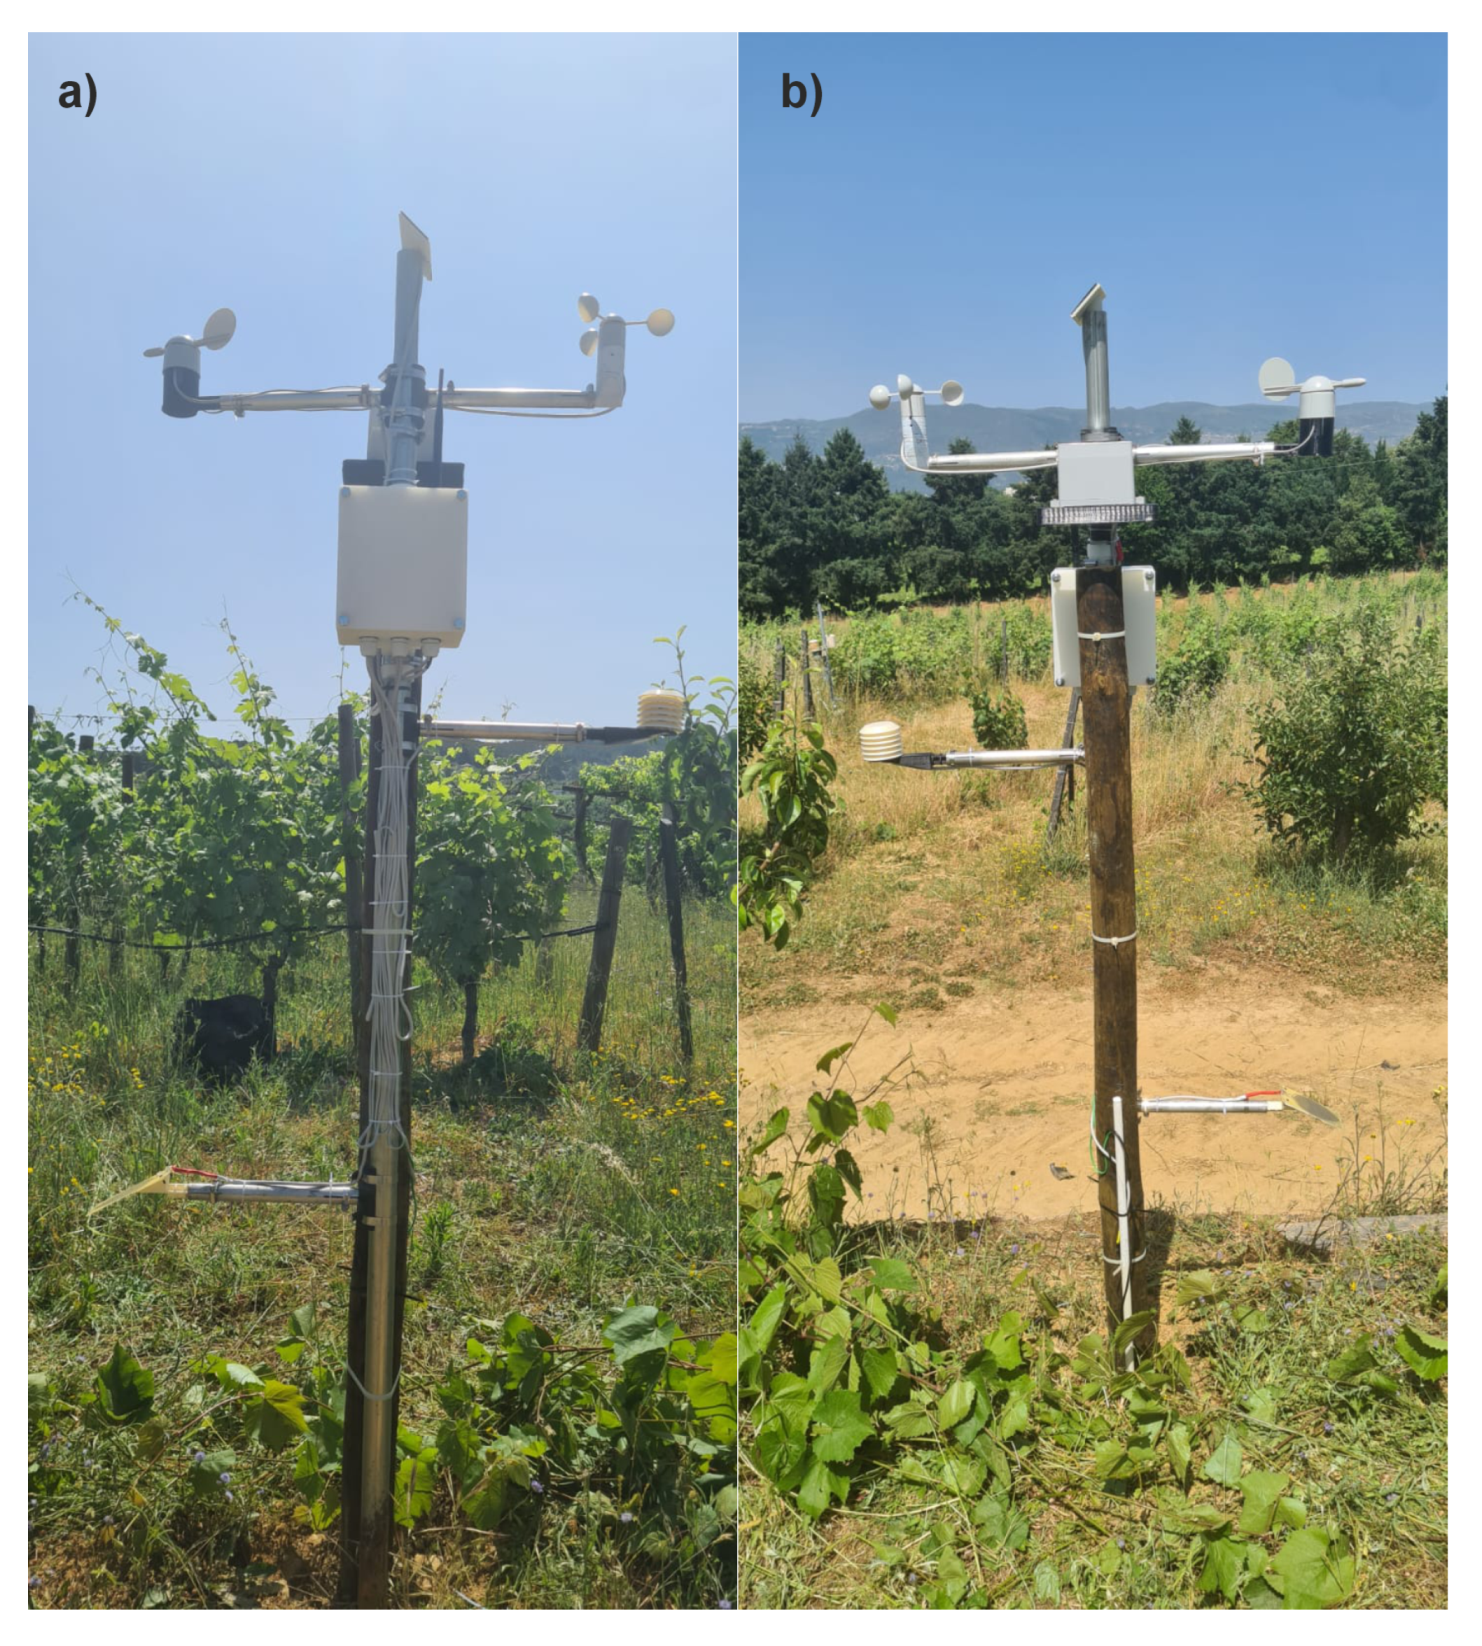
Figure 6.
mySense API.
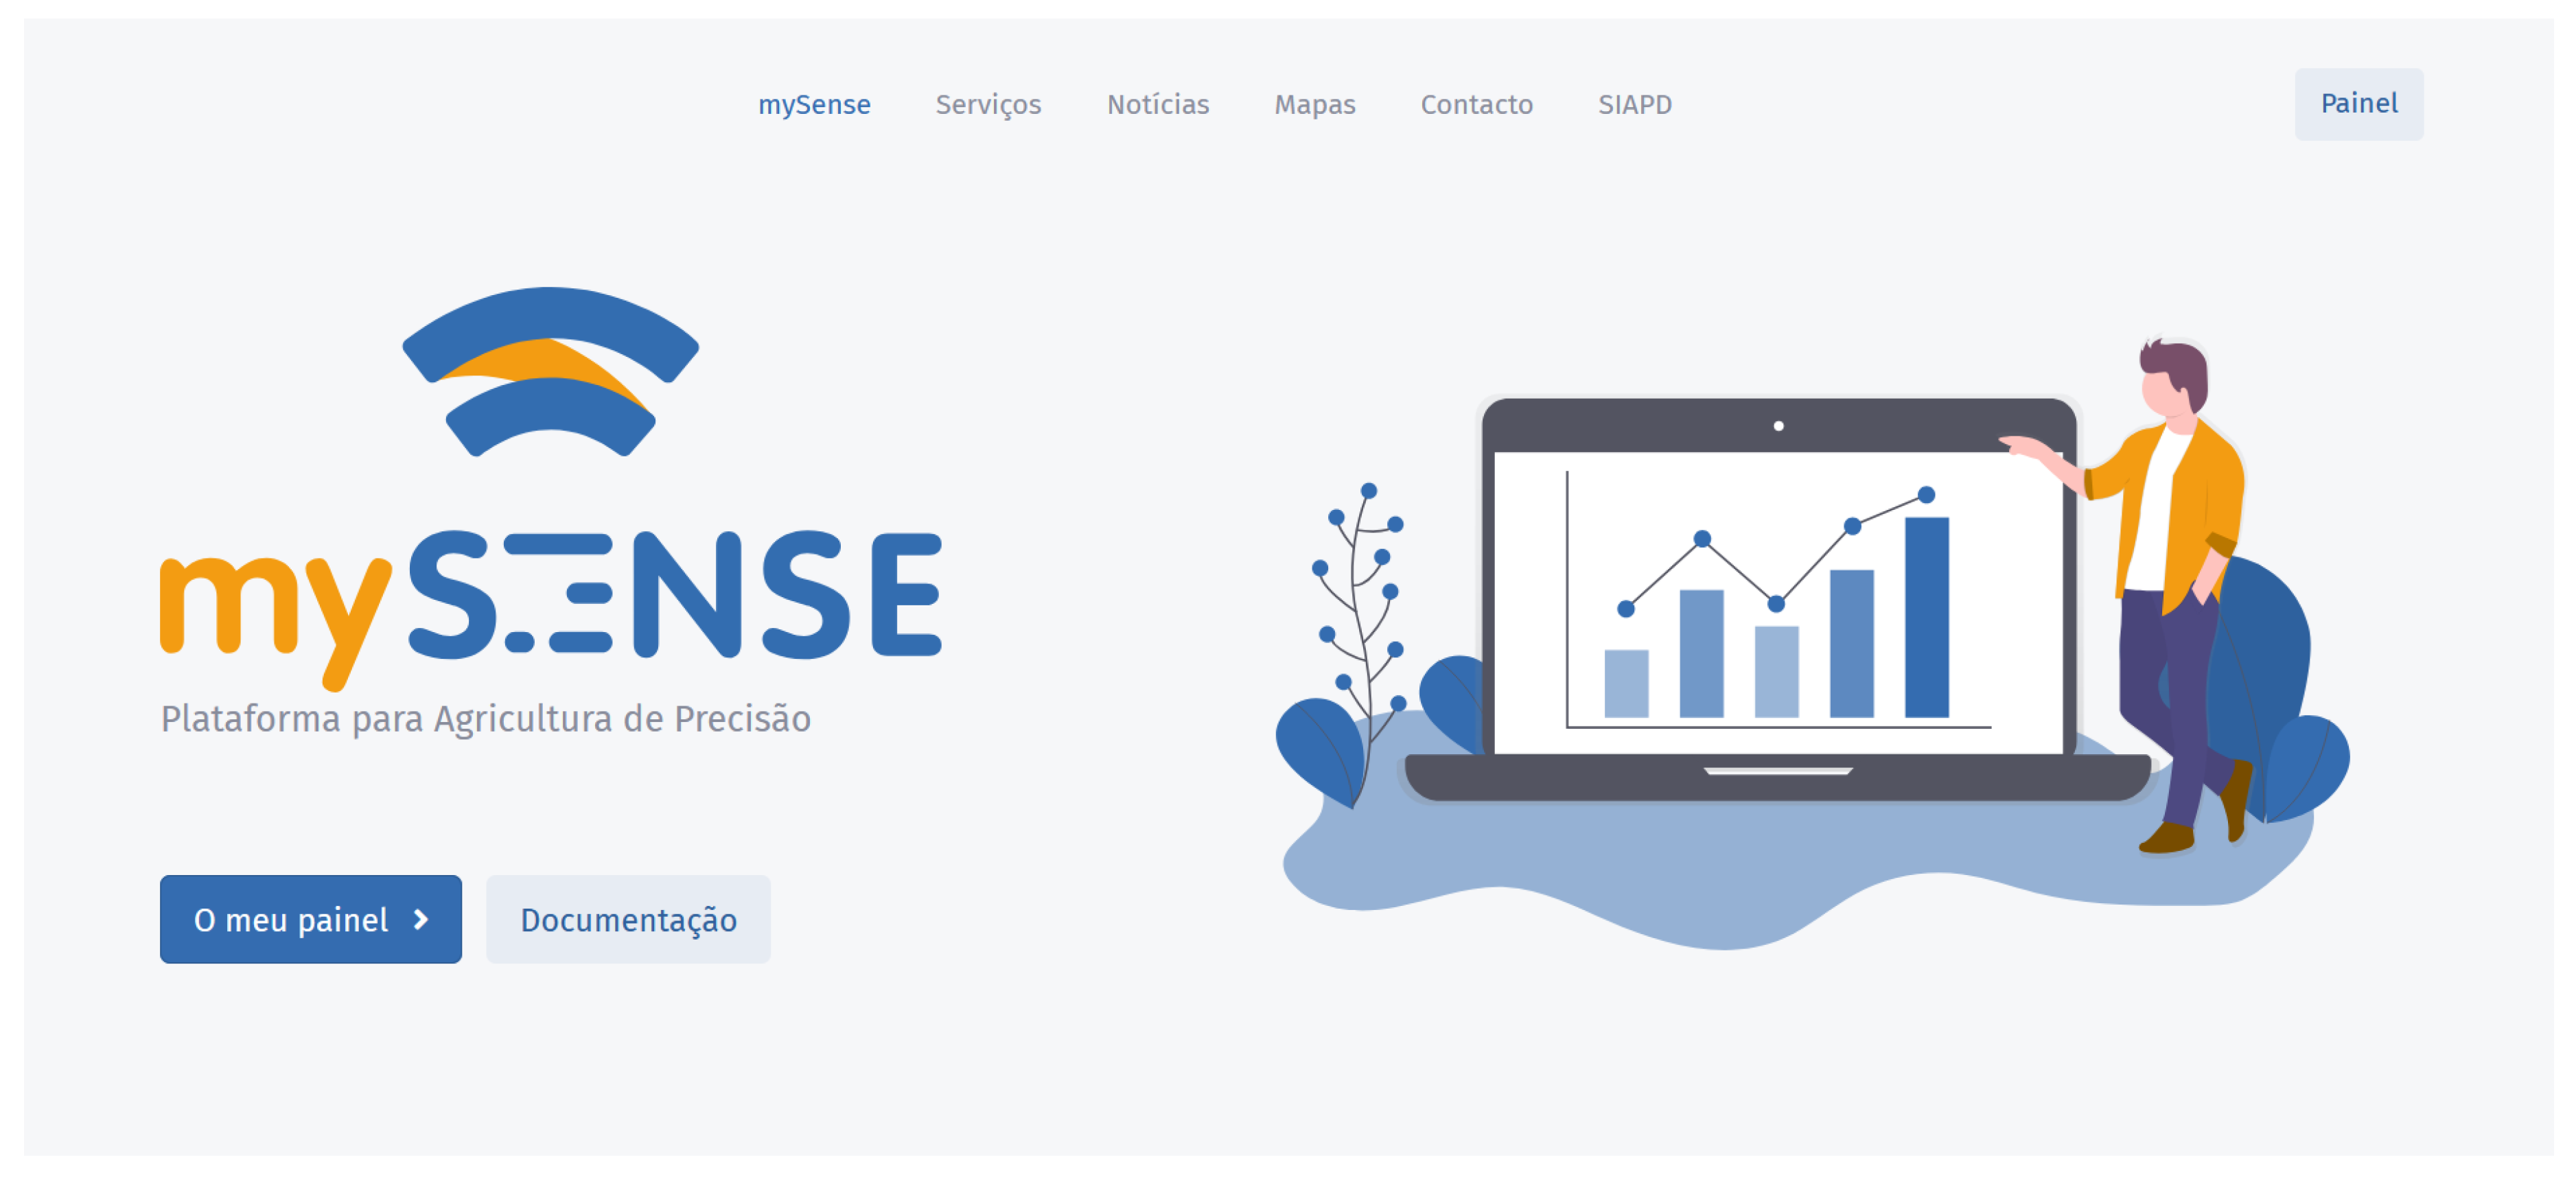
Figure 7.
Example of a payload encoded in hexadecimal and decoded to JSON format.
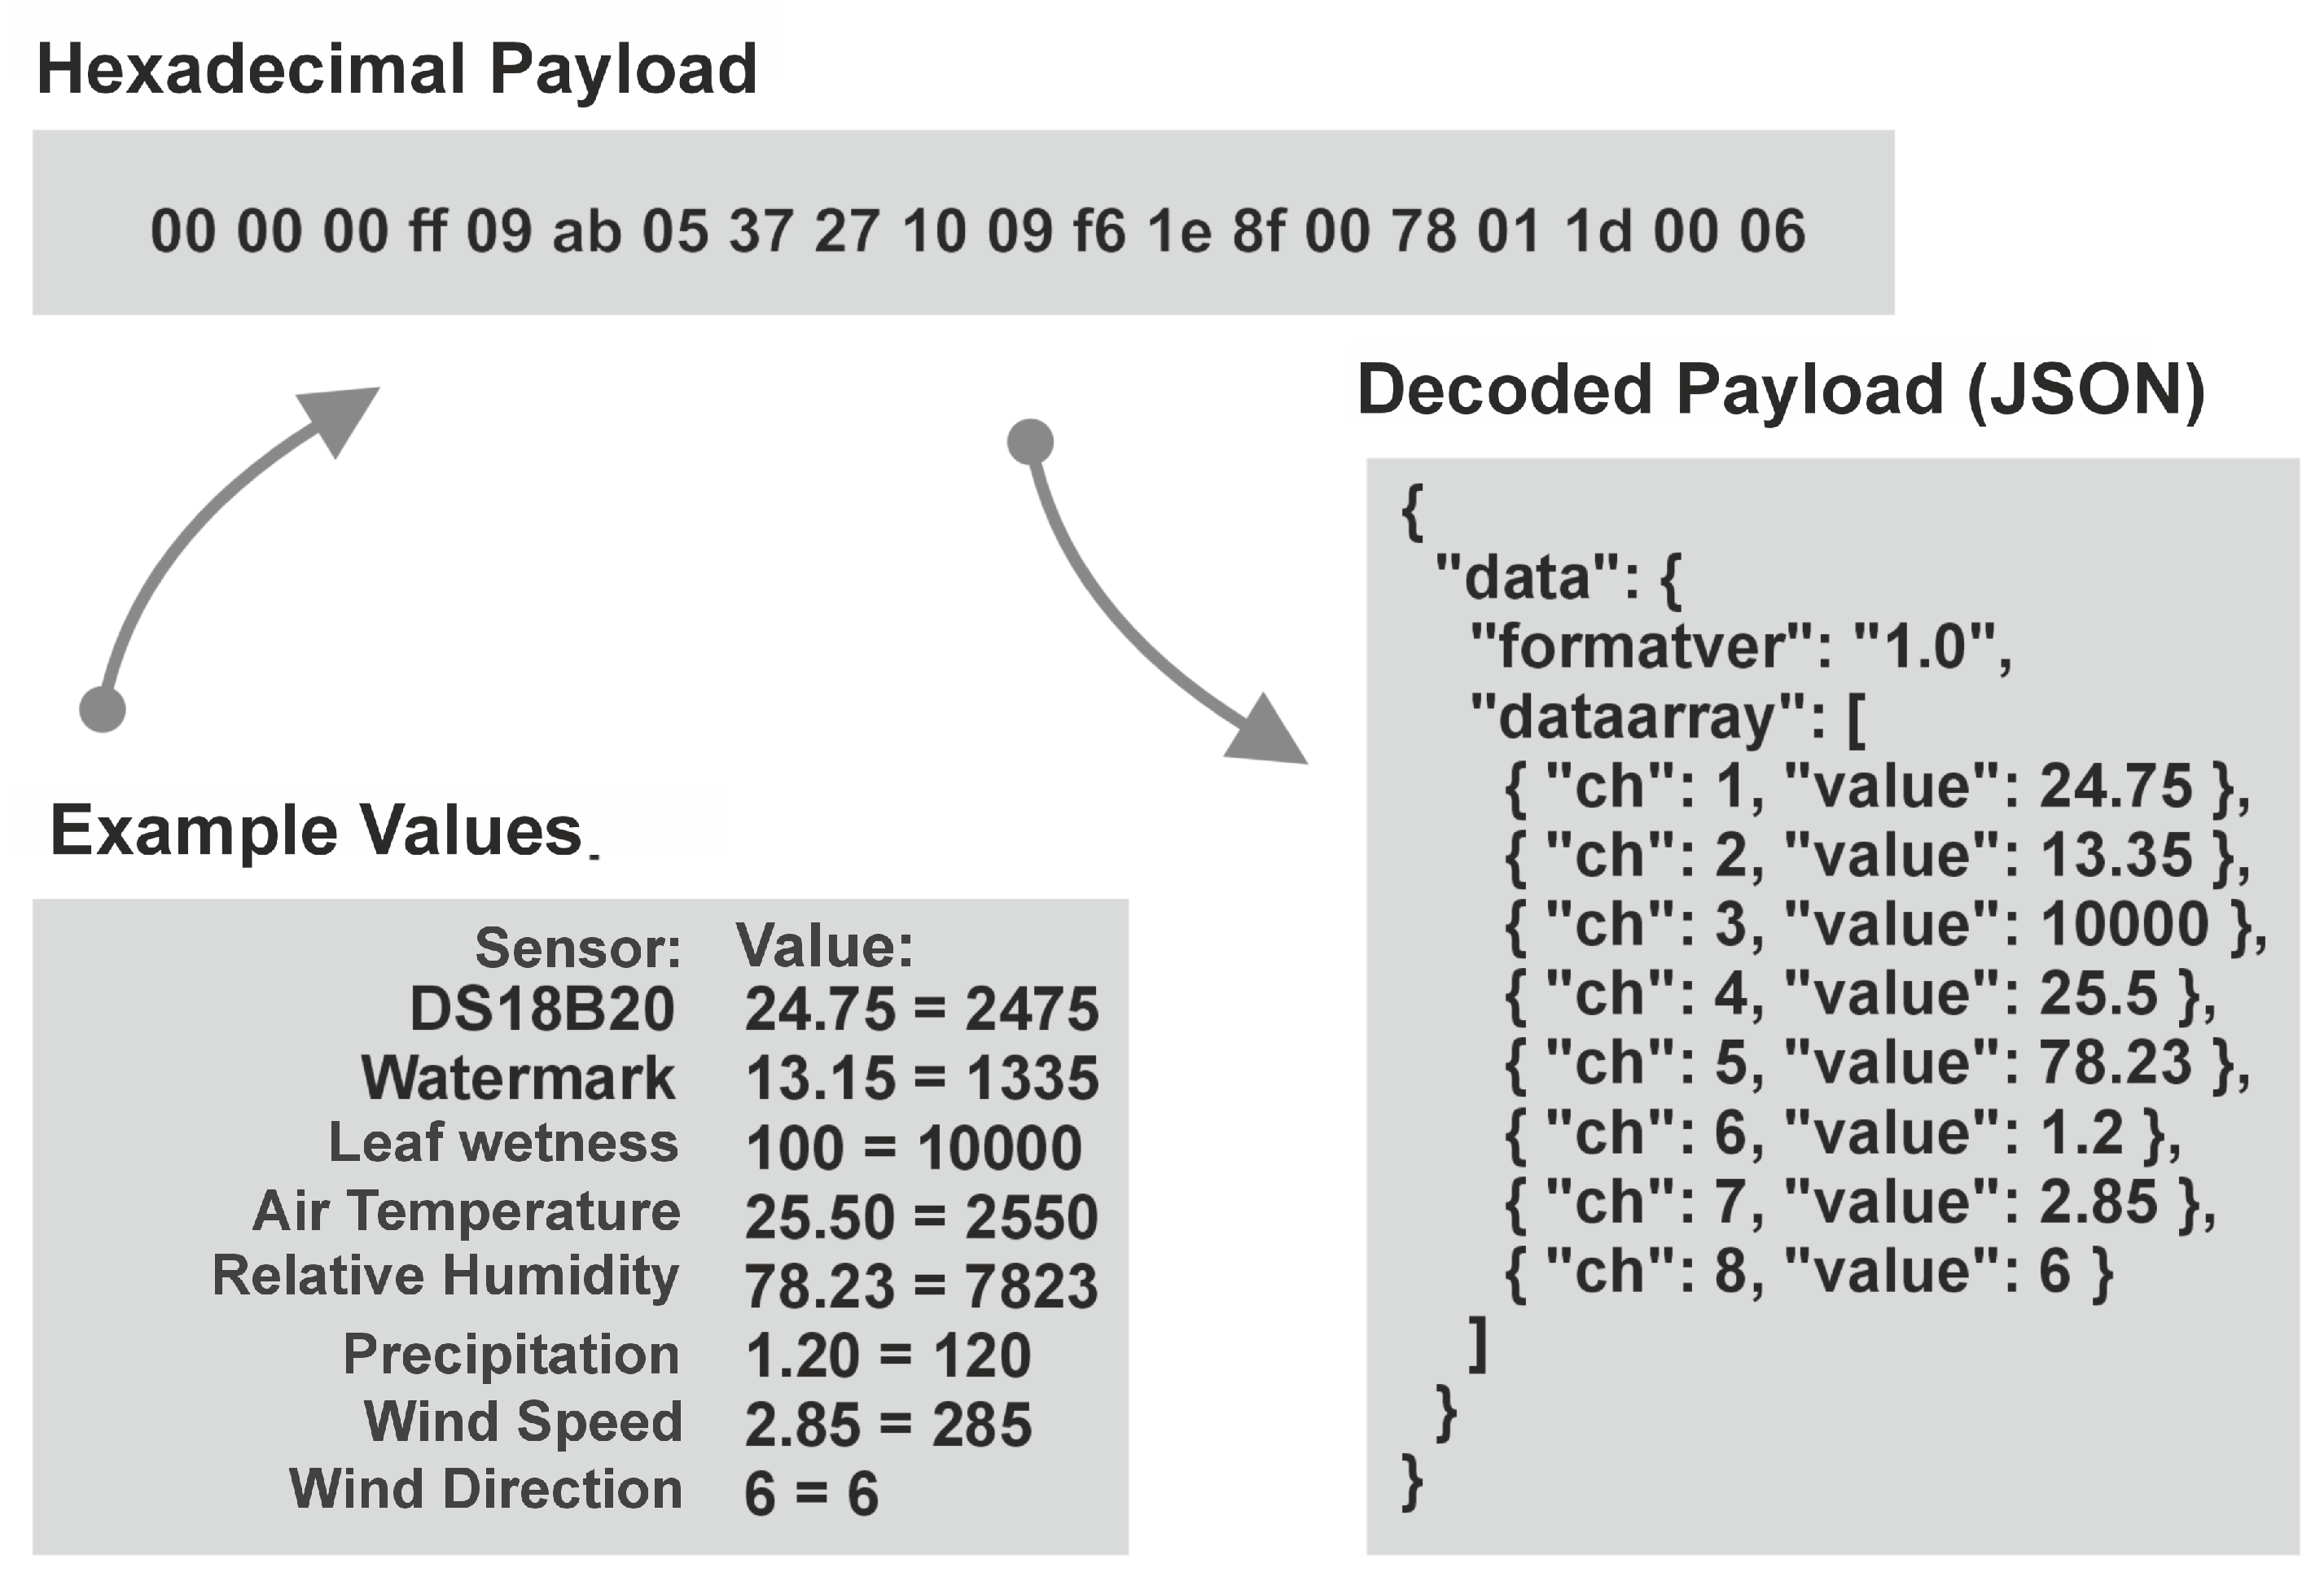
Figure 8.
Map showing the location of Mateus Palace, highlighting the distance between the station and the Gateway, located at UTAD.
Figure 8.
Map showing the location of Mateus Palace, highlighting the distance between the station and the Gateway, located at UTAD.
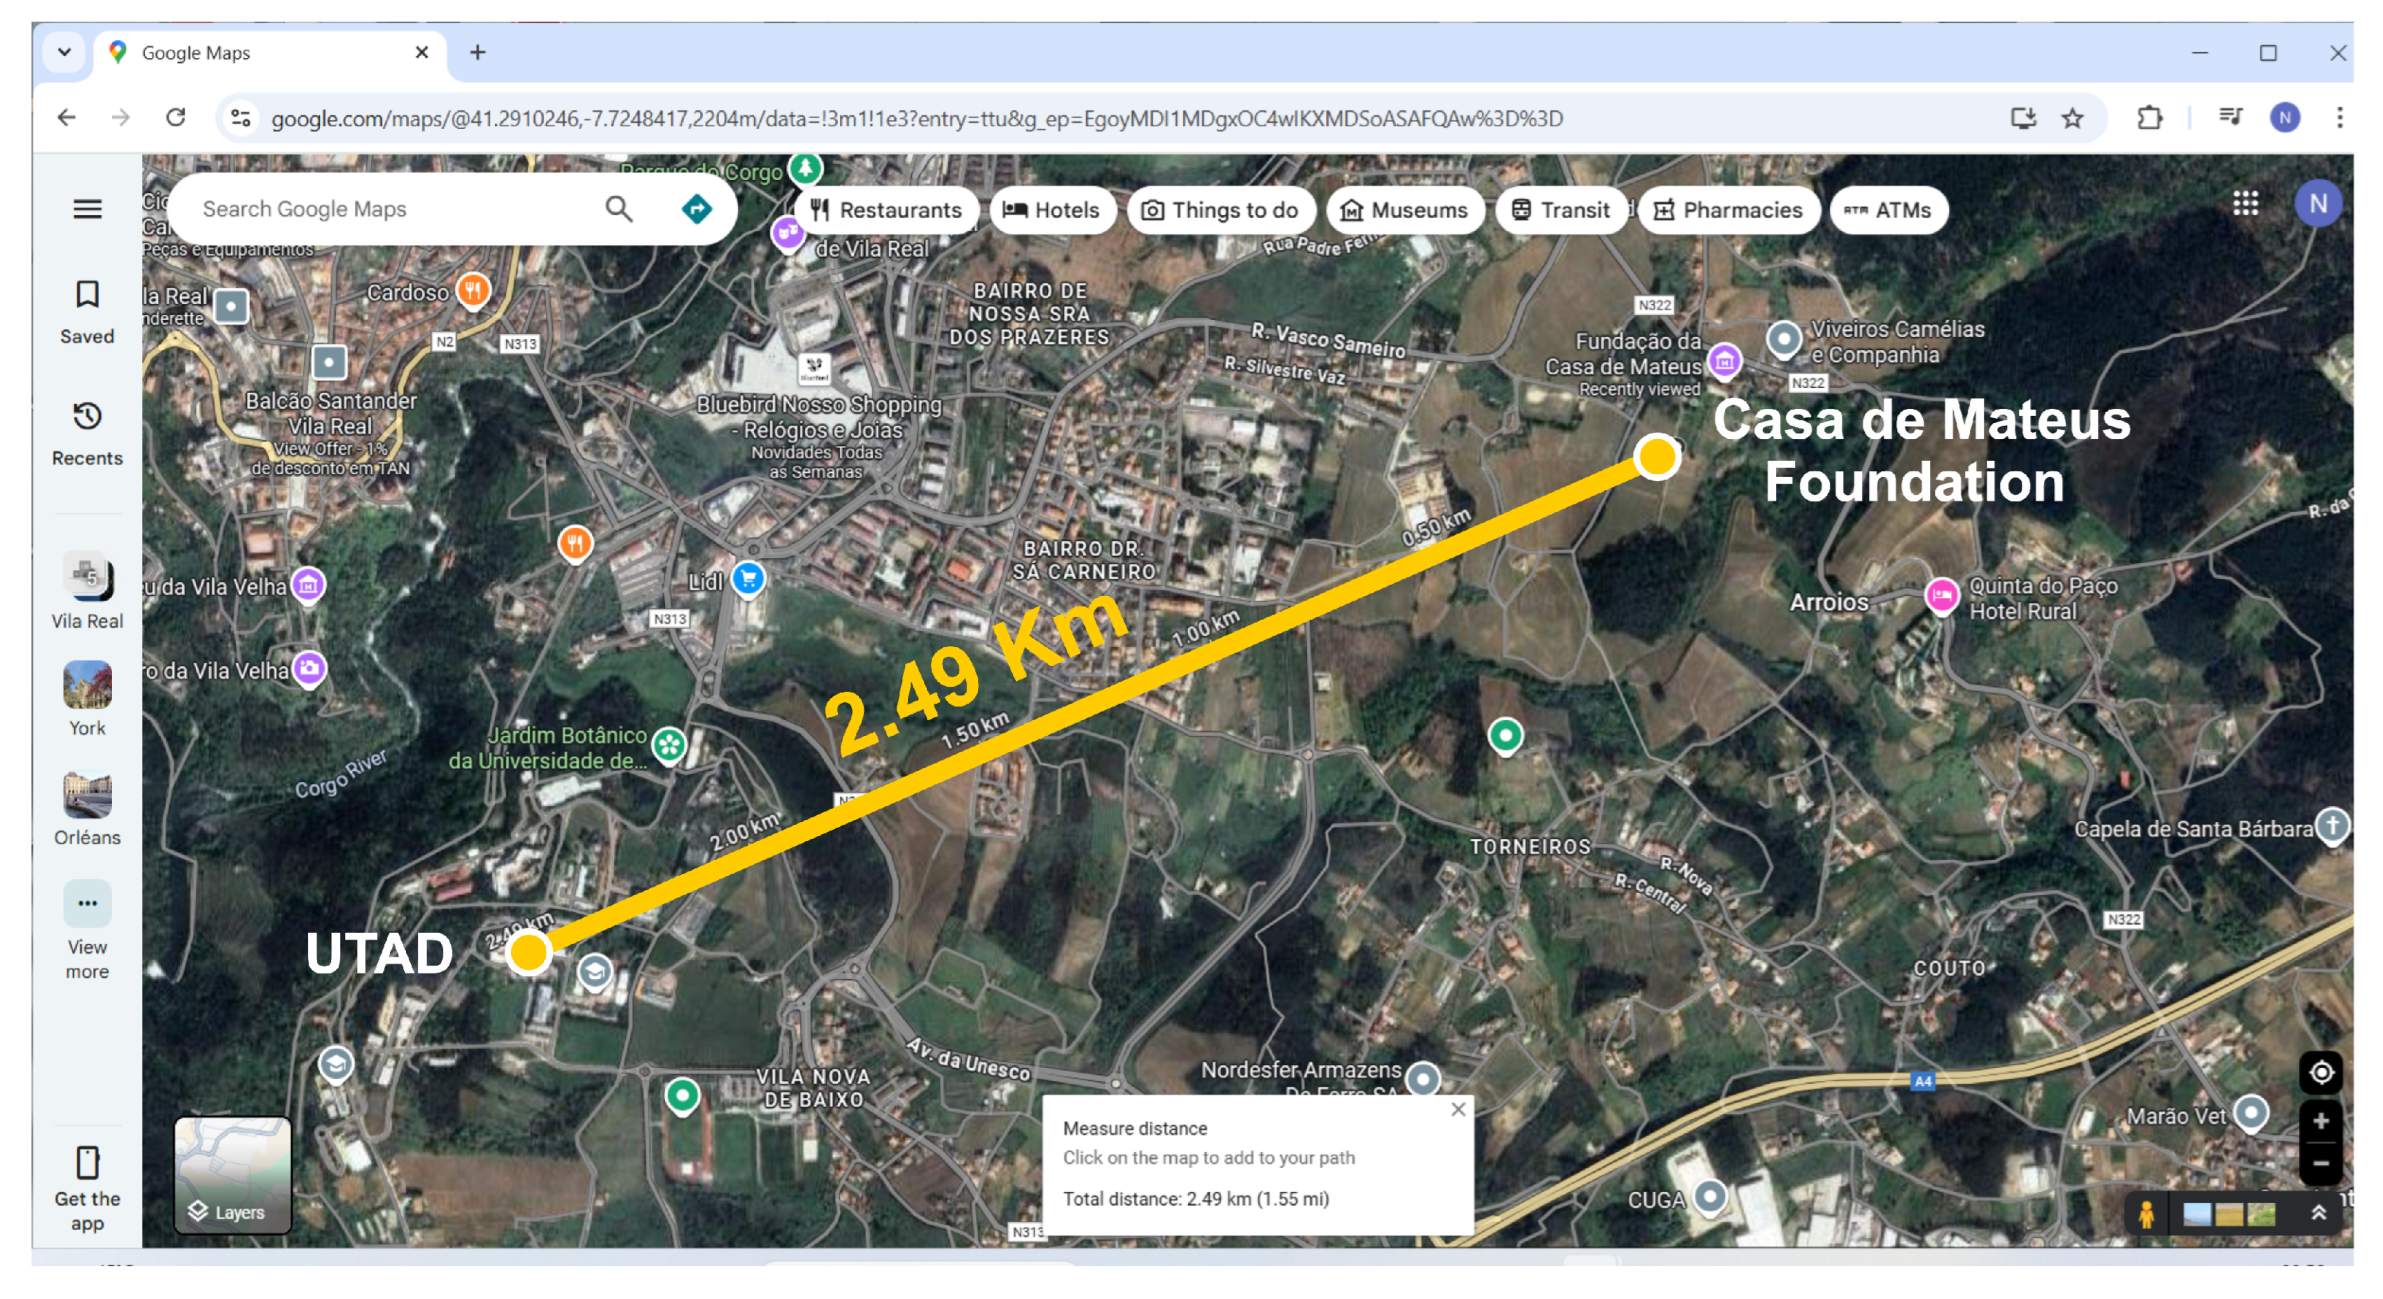
Figure 9.
Field results comparing the developed station with a co-located reference station. (a) Air temperature (°C); (b) Relative humidity (%); (c) Soil temperature (°C); (d) Precipitation (mm).
Figure 9.
Field results comparing the developed station with a co-located reference station. (a) Air temperature (°C); (b) Relative humidity (%); (c) Soil temperature (°C); (d) Precipitation (mm).
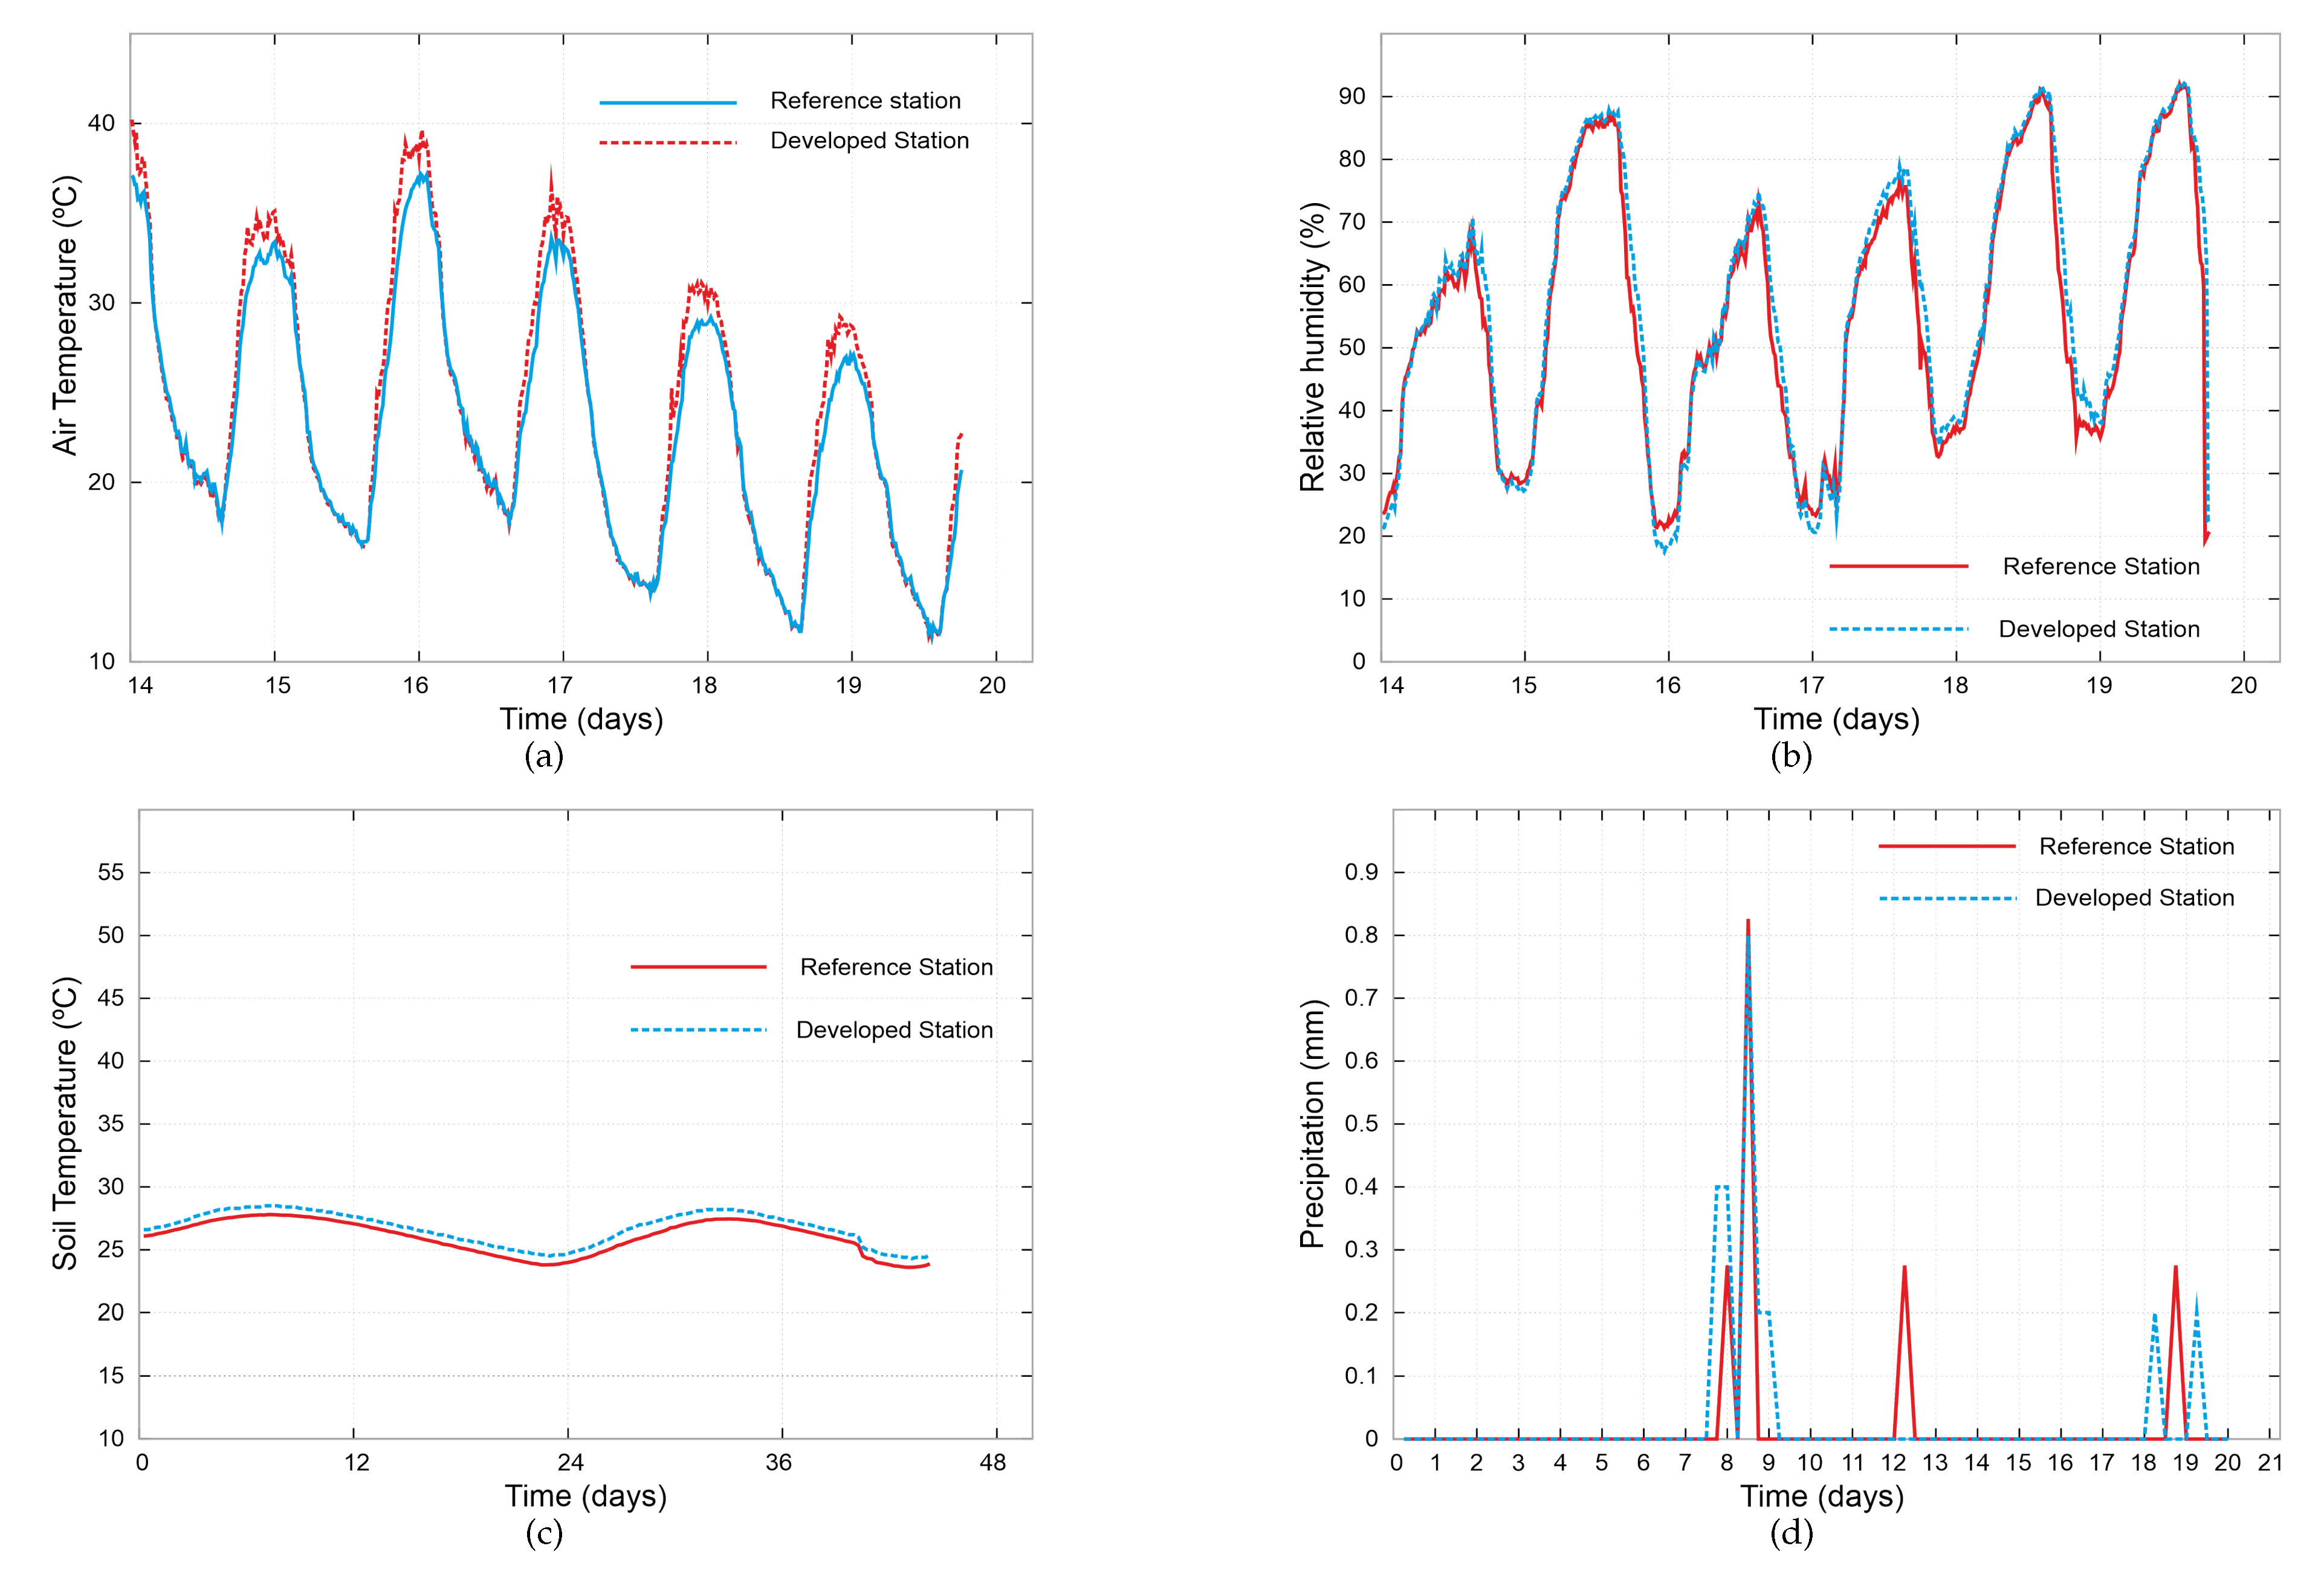
Figure 10.
Field results comparing the developed station with a co-located reference station. (a) Wind speed (km/h); (b) Wind direction (0–15); (c) Leaf wetness (0–1); (d) Soil matric potential (cb).
Figure 10.
Field results comparing the developed station with a co-located reference station. (a) Wind speed (km/h); (b) Wind direction (0–15); (c) Leaf wetness (0–1); (d) Soil matric potential (cb).
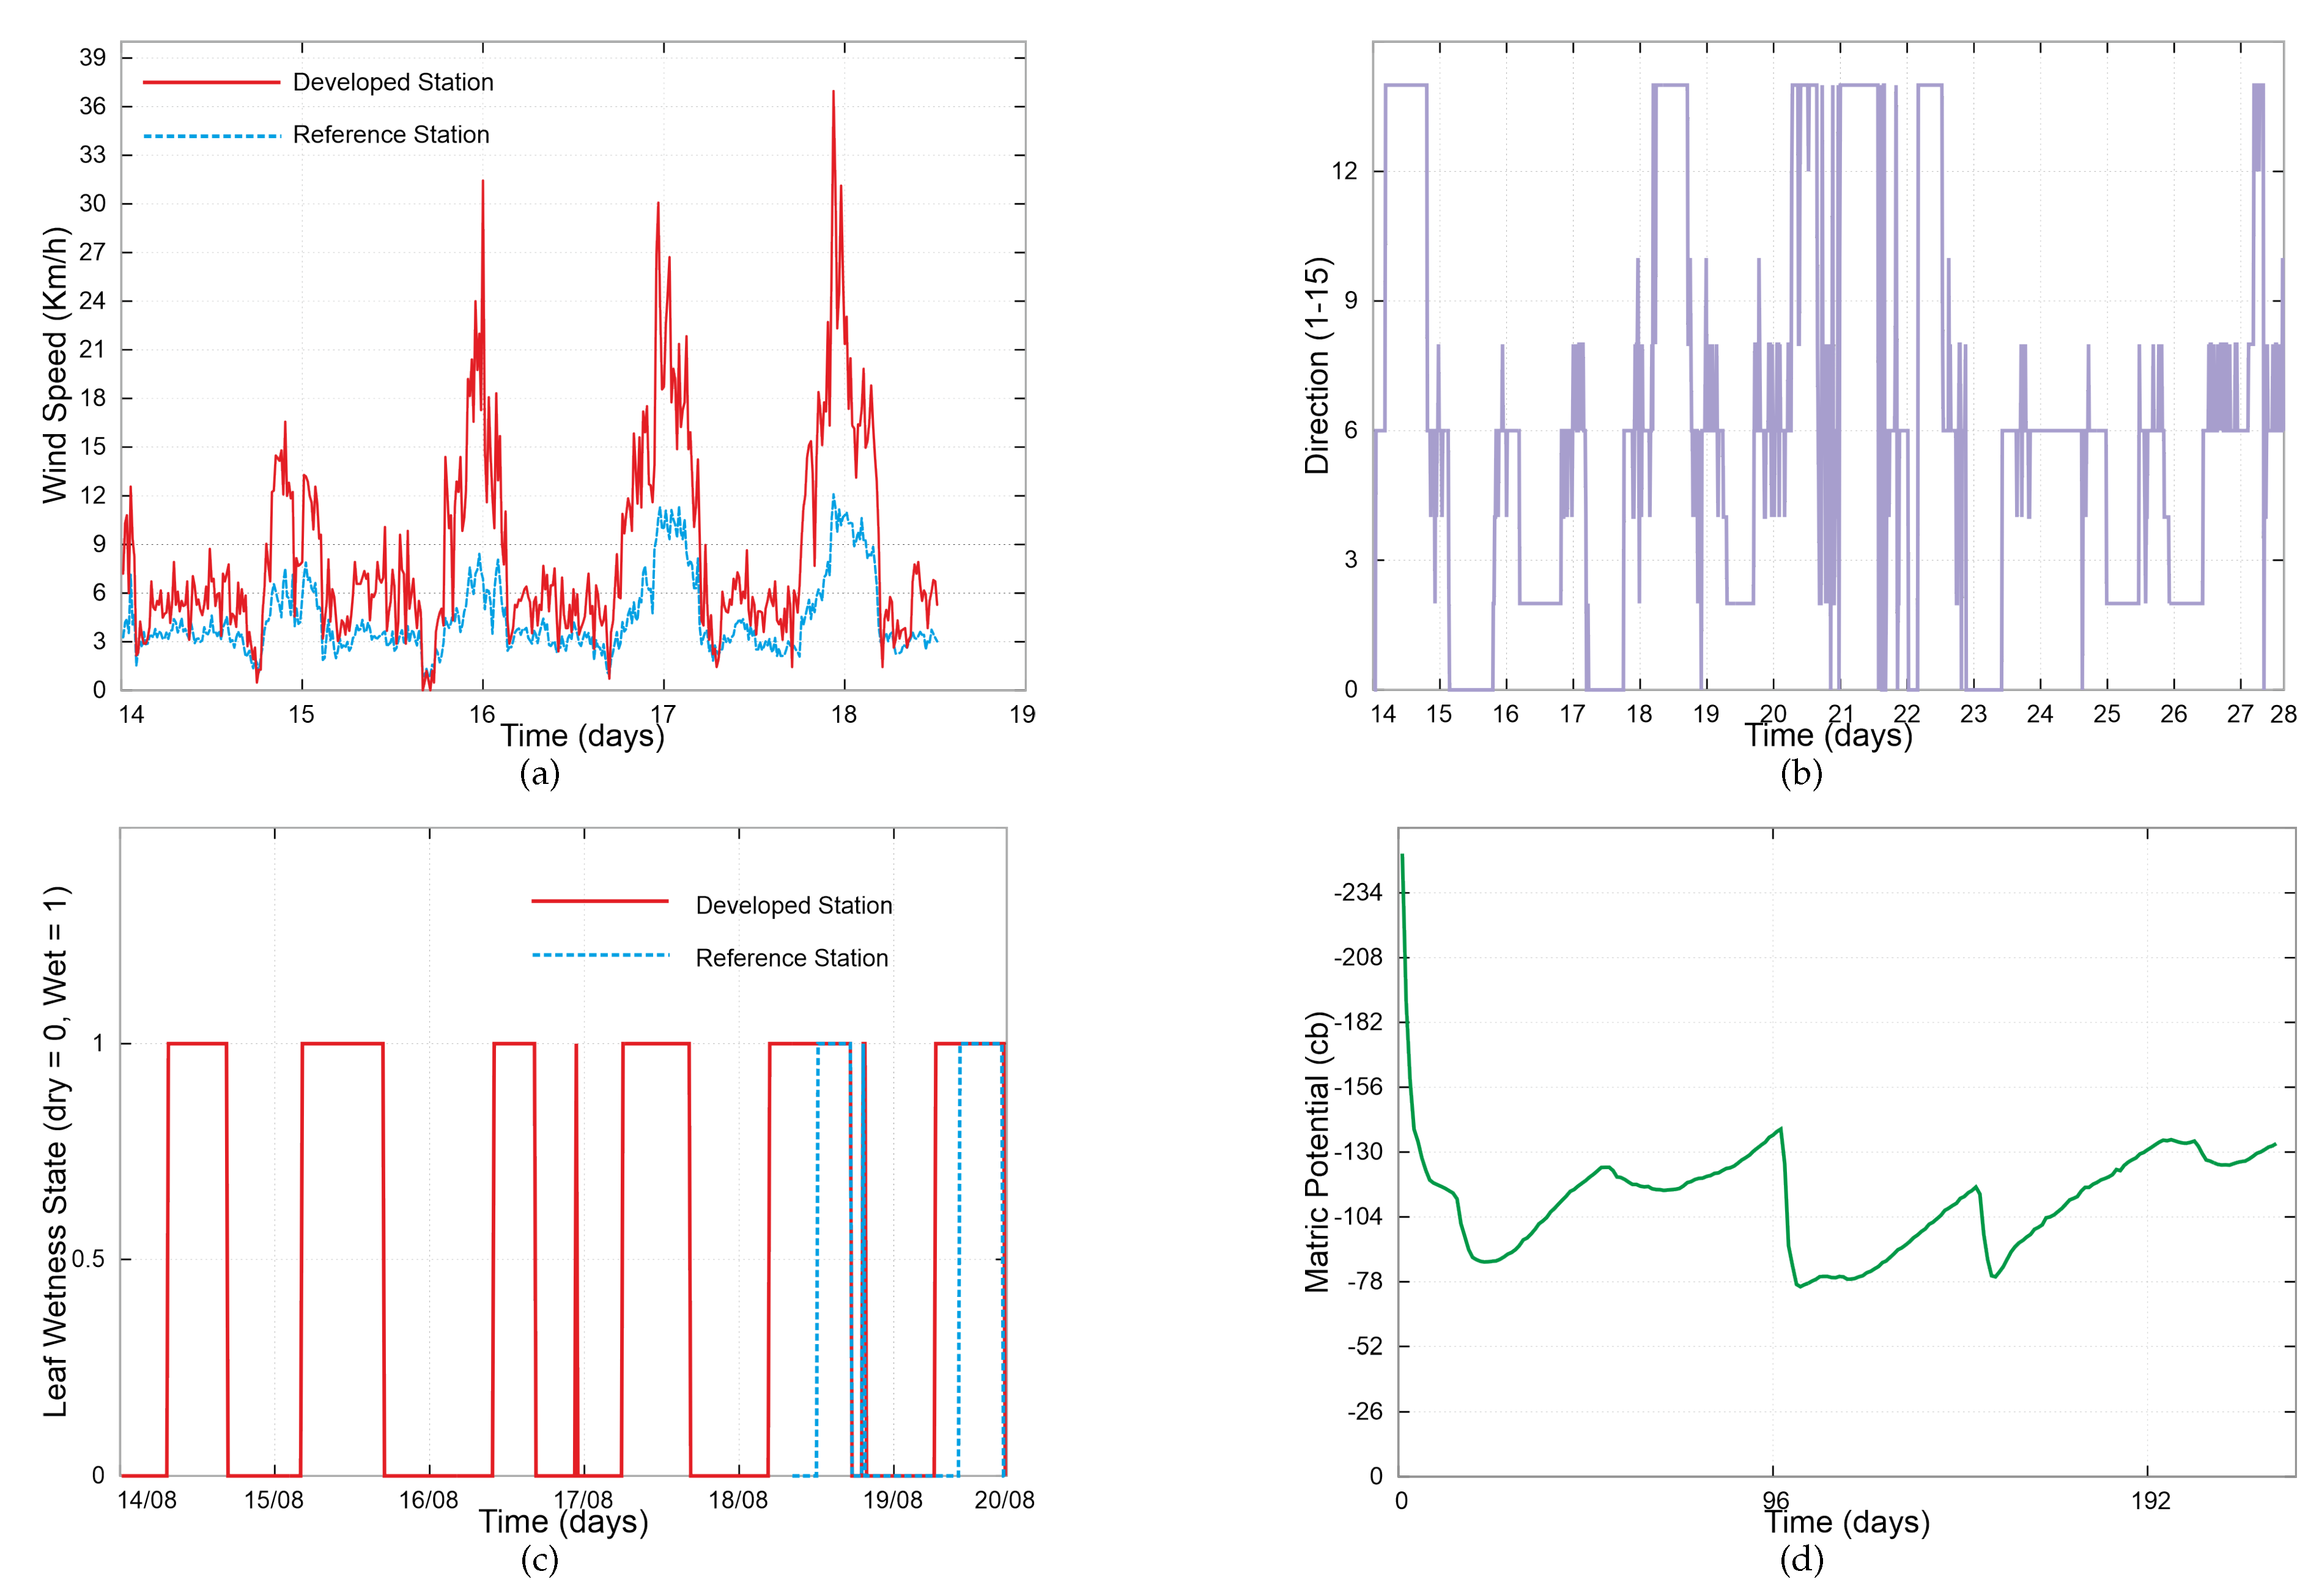

Table 1.
Core bill of materials (electronics & sensors) per node.
| Item | Qty | Unit cost [€] | Subtotal [€] | Vendor (example) |
|---|---|---|---|---|
| Arduino MKR WAN 1310 (board only) | 1 | 35.09 | 35.09 | Botland (EU) |
| Custom PCB (node board) | 1 | 13.37 | 13.37 | JLCPCB |
| LoRa antenna + U.FL→SMA pigtail | 1 | 3.72 | 3.72 | AliExpress |
| DHT20 (air T/RH) | 1 | 5.19 | 5.19 | Digi-Key |
| DS18B20 (soil temperature, waterproof) | 1 | 2.50 | 2.50 | Botland |
| Watermark 200SS (soil water tension) | 1 | 49.94 | 49.94 | Irrigation-Mart |
| Argent 80422 wind/rain assembly | 1 | 64.36 | 64.36 | Argent Data Systems |
| Leaf-wetness sensor (custom)† | 1 | 4.00 | 4.00 | In-house |
| RTC DS3231 module | 1 | 2.74 | 2.74 | Amazon |
| CN3065 solar charger (1S) | 1 | 0.81 | 0.81 | AliExpress |
| 6 V / 1 W solar panel | 1 | 1.24 | 1.24 | eBay |
| Subtotal (electronics & sensors) | € 182.96 |
Notes: items marked with † were provided or built in-house, and their unit prices are reference values to support replication.
Table 2.
Mounting, wiring & enclosure (site-dependent).
| Item | Qty | Unit cost [€] | Subtotal [€] | Vendor (example) |
|---|---|---|---|---|
| Galvanized post 2 m × 3 cm† | 1 | 10.99 | 10.99 | Leroy Merlin |
| Mounting arms (sensor brackets)† | 4 | 7.66 | 30.64 | AliExpress |
| Shielded cable 4×0.22 (per m)† | 5 | 1.25 | 6.25 | ibdglobal.pt |
| RJ11 6P4C panel jack with leads | 2 | 0.42 | 0.84 | Mauser.pt |
| JST-XH assorted connectors (pack) | 1 | 1.40 | 1.40 | A7Lab |
| Cable ties (pack)† | 1 | 1.69 | 1.69 | Leroy Merlin |
| Mounting screws (assorted) | 1 | 2.00 | 2.00 | Local hardware |
| DHT20 multi-panel radiation shield† | 1 | 1.00 | 1.00 | 3D Printed |
| 3D-printed parts (enclosure & supports, 1.17 kg)† | 1 | 21.00 | 21.00 | In-house |
| Subtotal (mounting & wiring) | € 75.81 | |||
| Grand total (as built) | € 258.77 |
Notes: items marked with † were provided or built in-house, and their unit prices are reference values to support replication.
Table 3.
Daily observed mesoclimate summary.
| Day | [°C] | [°C] | [%] | [%] | Rain [mm] | Wind (mean) [m/s] | VPD [kPa] |
|---|---|---|---|---|---|---|---|
| 14 | 22.5 | 40.2 | 23.6 | 54.4 | 0.0 | 5.7 | 2.68 |
| 15 | 17.7 | 35.1 | 27.9 | 77.8 | 0.0 | 7.0 | 1.67 |
| 16 | 16.5 | 39.7 | 21.3 | 87.3 | 0.0 | 8.3 | 1.59 |
| 17 | 17.3 | 36.4 | 23.3 | 73.1 | 0.0 | 9.8 | 1.76 |
| 18 | 13.9 | 31.1 | 32.7 | 76.6 | 0.0 | 10.6 | 1.16 |
| 19 | 11.7 | 29.2 | 35.7 | 91.2 | 0.0 | 9.5 | 0.88 |
| 20 | 11.4 | 30.2 | 32.6 | 91.9 | 0.0 | 10.7 | 0.86 |
| 21 | 11.2 | 32.3 | 28.4 | 89.0 | 0.0 | 7.1 | 1.11 |
| 22 | 14.2 | 35.1 | 25.7 | 75.1 | 0.0 | 7.0 | 1.40 |
| 23 | 14.4 | 37.1 | 21.9 | 68.5 | 0.0 | 7.9 | 1.63 |
| 24 | 14.2 | 35.2 | 27.0 | 80.0 | 0.0 | 9.0 | 1.31 |
| 25 | 13.7 | 36.3 | 25.4 | 86.2 | 0.0 | 8.9 | 1.30 |
| 26 | 13.4 | 32.9 | 25.3 | 89.5 | 0.0 | 11.5 | 1.09 |
| 27 | 11.3 | 24.9 | 44.0 | 94.5 | 0.0 | 10.4 | 0.59 |
| 28 | 10.4 | 24.4 | 37.2 | 89.9 | 0.0 | 12.5 | 0.78 |
Disclaimer/Publisher’s Note: The statements, opinions and data contained in all publications are solely those of the individual author(s) and contributor(s) and not of MDPI and/or the editor(s). MDPI and/or the editor(s) disclaim responsibility for any injury to people or property resulting from any ideas, methods, instructions or products referred to in the content. |
© 2025 by the authors. Licensee MDPI, Basel, Switzerland. This article is an open access article distributed under the terms and conditions of the Creative Commons Attribution (CC BY) license (http://creativecommons.org/licenses/by/4.0/).
Copyright: This open access article is published under a Creative Commons CC BY 4.0 license, which permit the free download, distribution, and reuse, provided that the author and preprint are cited in any reuse.


