Submitted:
17 October 2025
Posted:
27 October 2025
You are already at the latest version
Abstract
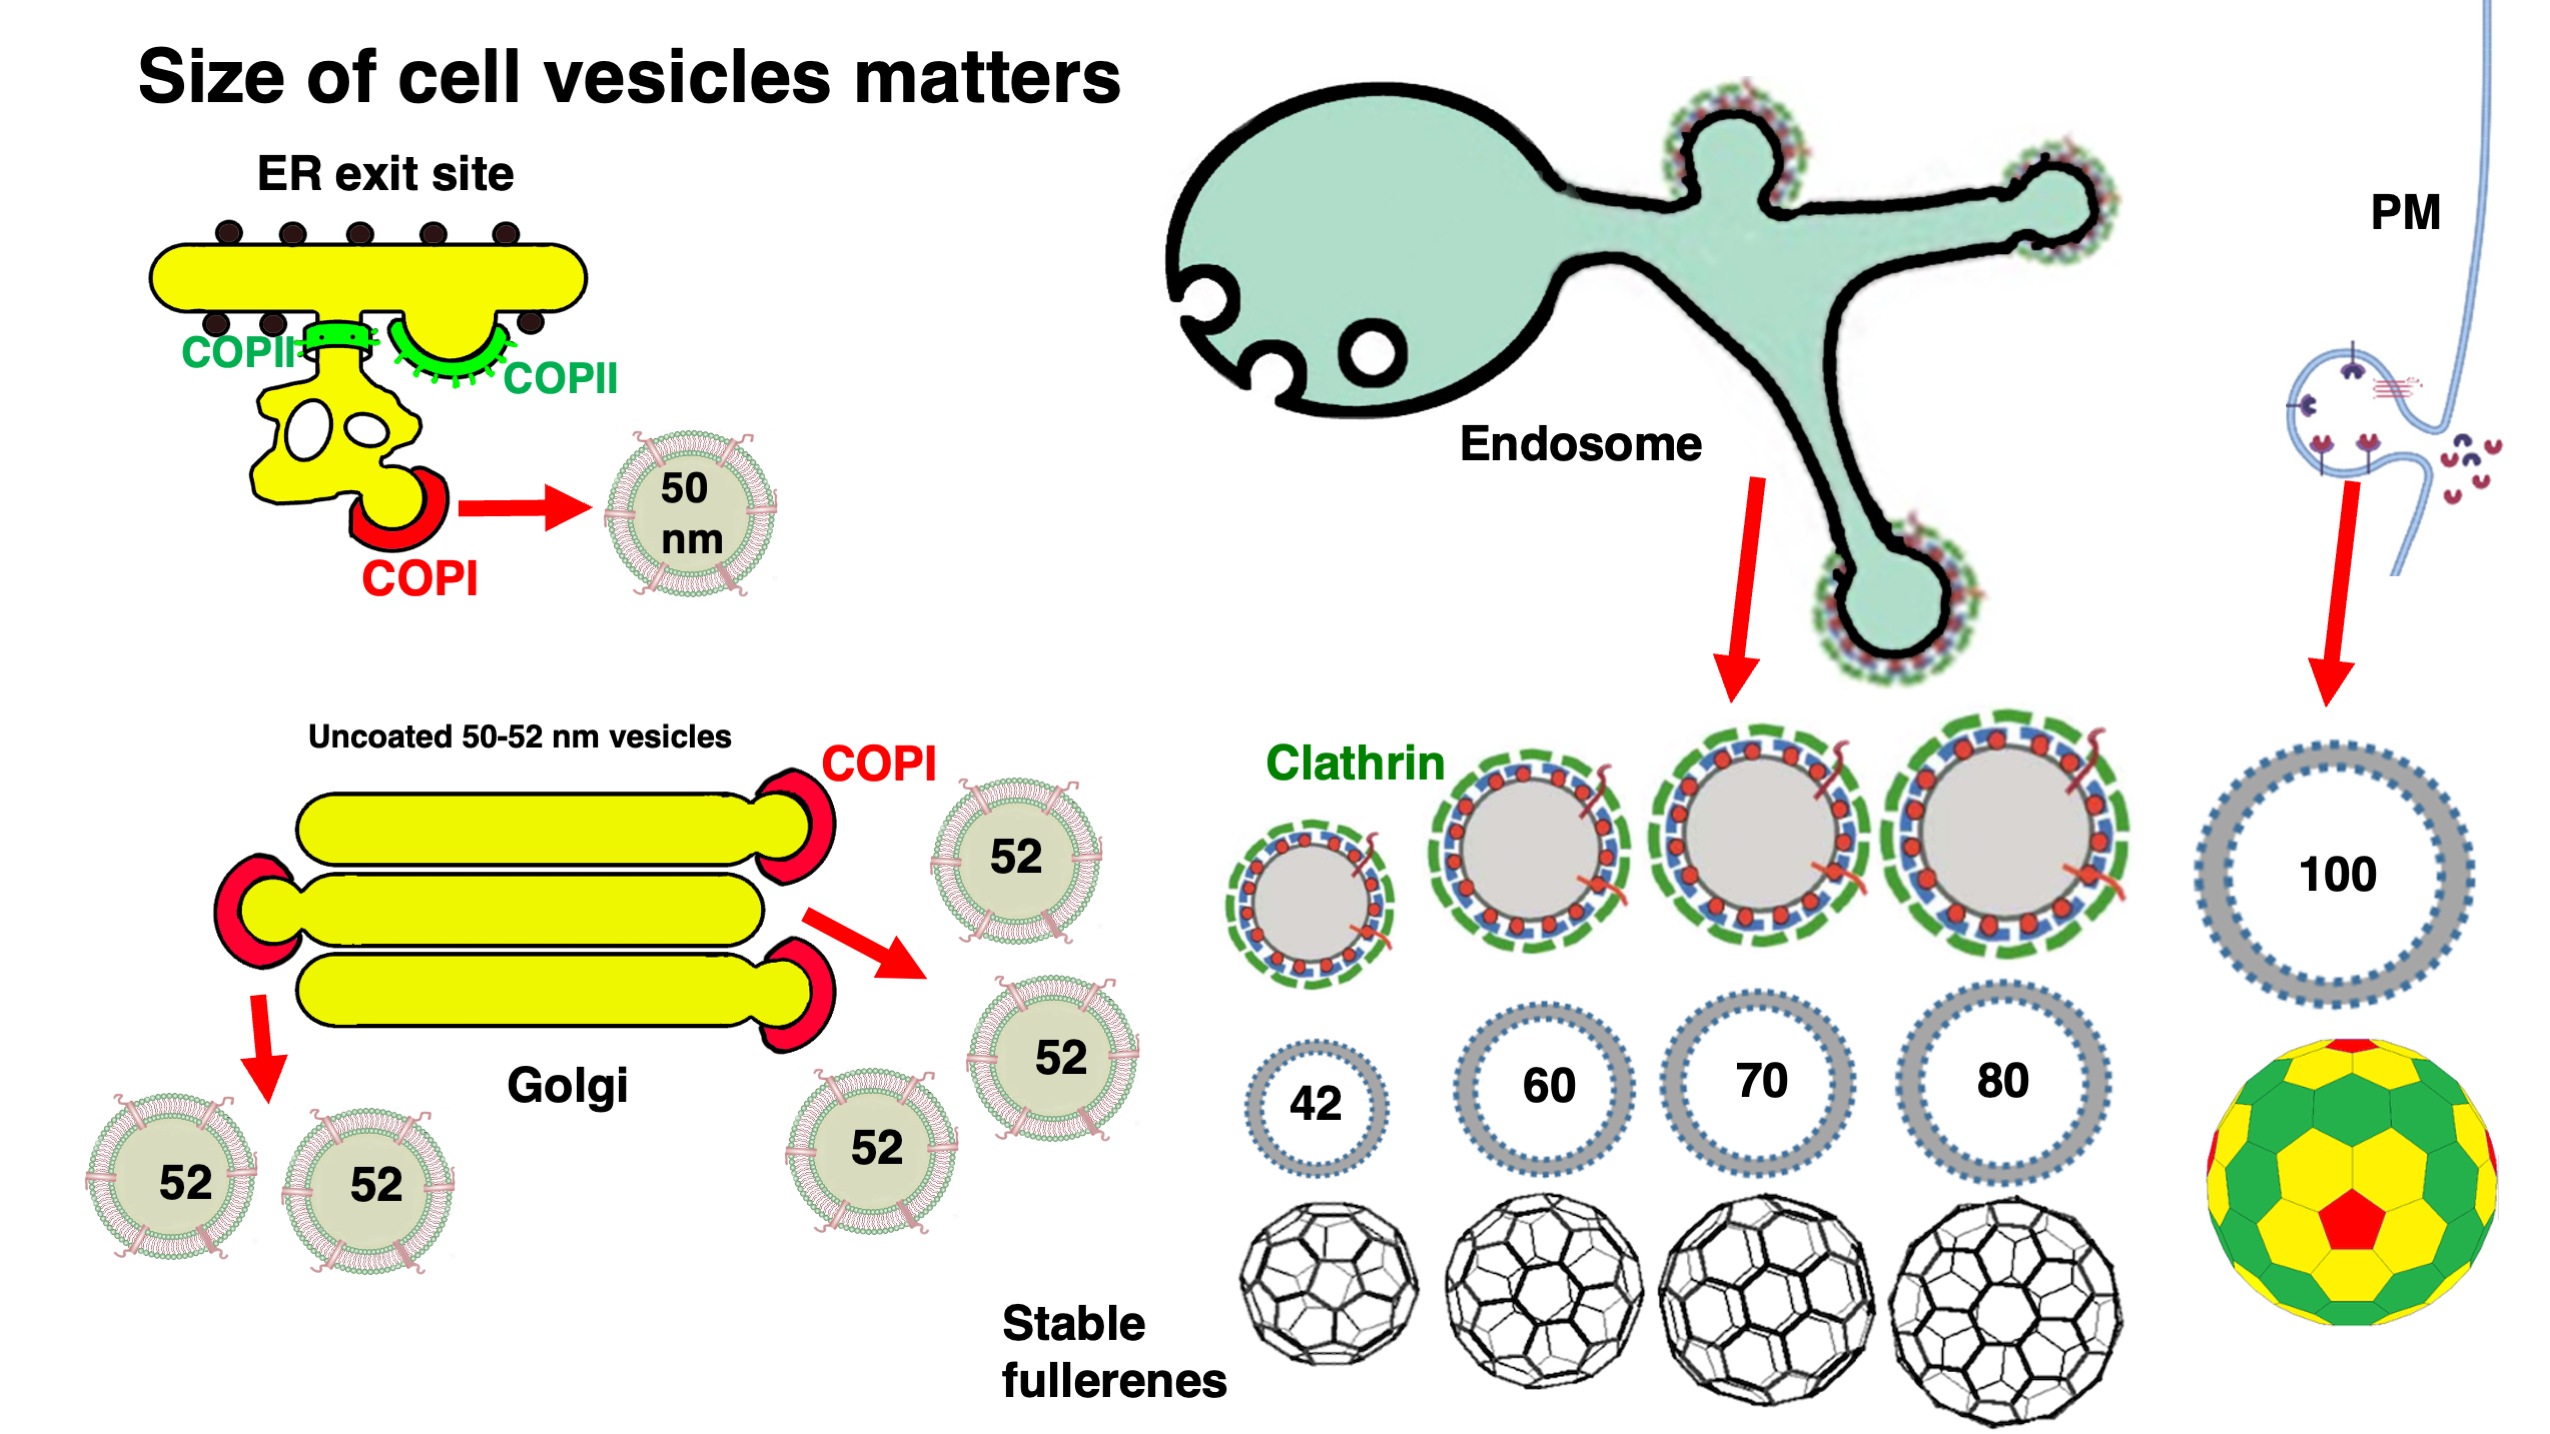
The characteristics of cell small membrane spheres (vesicles) have not been fully explored to date. Here, we found that the distribution of diameters of these vesicles exhibits distinct peaks at 42, 50-52, 60, 70, 80, and 100 nm, which with the exception of the 50-nm vesicles can be inscribed into stable fullerenes, namely C₆₀, C₇₂, C₈₄, C₉₆, and C₁₃₄, respectively. Coated 50-52 and 100 nm vesicles were not found. The 60-, 70-, and 80-nm vesicles could be clathrin-coated or uncoated. These are accessible to WGA added externally. The COPI- or COPII-coated vesicles were not found. The concentration of resident proteins in the 50-52-nm vesicles is lower than in ER exit sites and Golgi membranes. These vesicles do not contain Sec22 but are enriched in GS27 and could bind Sec13. The vesicles isolated in the vesicular fraction share similar features. The formation of vesicles could stimulate membrane uncoating. Thus, the vesicle size is important.
Keywords:
intracellular transport
; cell vesicles
; COPI
; COPII
; clathrin
; Golgi
1. Introduction
Until now, coated and coat-dependent vesicles were considered the final stage of transport vesicle formation, since vesicles that have undergone division are still coated and vesicles lose their coat only subsequently [1,2,3,4,5,6,7,8,9,10,11,12,13,14,15]. Three coats, namely, COPII, COPI, and clathrin were proposed to be involved in the formation small (<100 nm) vesicles. COPII is present over COPII-coated buds, which are always hemispherical in shape and are visible on the granular ER [16,17,18,19]. COPI-coated buds are located on the ER exit site (ERES) structures, the cis-most Golgi cisterna and the medial Golgi cisternae, where COPI-coated structures usually have the shape of buds with a neck [20,21]. However, these organelles do not have clathrin-coated buds. Alternatively, trans-most cisternae, TGNs, endosomes, and plasma membrane lack COPII or COPI-coated buds but exhibit clathrin-coated buds [22,23,24,25,26,27,28].
According to generally accepted models, AP1/Arf1 or AP2 (for clathrin-dependent vesicles formed on endosomes or PMs, respectively), GDP-Sar1 (for COPII-dependent vesicles), or DGP-Arf1-5 (for COPI-dependent buds) initially bind to membranes of the secretory pathway. In the case of COPII-dependent vesicles, GDP bound to Sar1 is replaced with GTP. Sec23/24 are then recruited, followed by Sec13/31. This results in the formation of the COPII coat. In the case of COPI-dependent buds, GDP-Arf1(or 2-5) first attaches to the membranes of the ERES or Golgi. ARFGEF then exchanges GDP for GTP. This leads to the recruitment of COPI. Once the coat is assembled, the vesicle undergoes fission. It is assumed that after this event, vesicles coated with either COPII or COPI persist in cells for some time. Finally, GTP hydrolysis triggers coat disassembly and uncoating [14,15,16,17,18,19,20].
Indeed, many studies have claimed to have demonstrated the existence of COPI and COPII-coated vesicles. However, to date, no one has reported the existence of vesicles coated with either COPI or COPII in normal cells [11,12,13,14,15]. Also, analysis of images presented in the literature allowed us to conclude that to date, no one has reported the existence of vesicles coated with either COPI or COPII in normal cells because in all these studies, where the authors claimed to have detected COPI-coated vesicles, three-dimensional electron microscopy was not used. Only thin sections or cryosections were used. Therefore, they were unable to distinguish COPI-coated buds from COPI-coated vesicles, especially in cryosections, where the COPI-coated structure could be separated from the clathrin coat with considerable difficulty [28].
According to the current consensus, in the case of clathrin-dependent vesicles, initially AP1 (with the help of Arf1) attaches to the membrane surface of the trans-Golgi cisternae, trans-Golgi network, and endosomes whereas AP2 binds to the plasma membrane resulting in the assembly of a lattice of clathrin triskelium. The triskelium binds to AP1 or AP2 and form characteristic polyhedral closed cages, or fullerenes. which then forms clathrin-coated pits or buds. Next, in the case of clathrin-coated pits appeared on the plasma membrane, dynamin binds to the neck connecting the clathrin-coated sphere to the original membrane. When the thickness of this becomes sufficiently small, dynamin contracts, causing the coated sphere to split off or subjected to fission. Only after this step the clathrin coat does detach from the membrane [20,21].
It is claimed that clathrin-dependent vesicles formed from endosomes have a diameter of approximately 60 nm [29]. However, three-dim3nswionql analysis of these “vesicles” was not performed. The presence of free clathrin-coated vesicles has been described previously [30,31], However, a complete set of serial images was not presented. We demonstrated serial tomo-images of the clathrin-coated 42 nm vesicle in S. cerevisiae (see Figure S1 in [32]) and similar images of the 70-nm clathrin-coated vesicle [33].
In the literatures, there are dozens of images of clathrin-coated buds on endosomes, the trans-most cisternae and the TGN [27,34], and distensions of Golgi cisternae filled with procollagen I (see Figure 7D presented by Fusella et al. [35]). Coated vesicles isolated from bovine adrenal cortex have diameters of 100 nm and 70 nm [36]. The diameters of the round profiles near the basolateral PM ranges from 95 to 115 nm [37,38], and super-resolution images revealed clathrin-coated primordia near the PM with a diameter of 100–110 nm (see Figure 2h in Shevchuk et al. [39]). In early rat spermatids, the diameter of clathrin-coated round profiles was 103 nm [28]. In Figure 2C in Diao et al. [40, the diameter of a similar circular profile was 107 nm. In neurons, clathrin-coated vesicles localized near the basolateral plasma membrane have a diameter of 97 nm [41]. The mechanism of fission of clathrin-coated buds formed on endosomes and TGN is unclear.
The functional role of cellular vesicles as transport carriers remains highly controversial. Both the vesicle- and cisterna maturation-dependent models of intracellular transport, which consider vesicles as carriers, have rather limited explanatory power [20,42. However, recent data by Sumya et al. [43] have been interpreted in favor of this transport role of COPI-dependent vesicles. Furthermore, several studies describing the isolated vesicle fraction have reported an enrichment of this fraction in Golgi enzymes, but not in nucleotide-sugar transporters [8,44,45,46,47,48,49,50,51,52,53,54]. Vesicles are important for various models of intracellular transport [20]. In the ongoing competition between different models of intracellular transport, the function of small coat-dependent vesicles represents an important argument. For example, the isolation from cells of the so-called vesicular fraction, enriched in Golgi resident proteins, is a major argument in favor of the cisternal maturation-progression model [55].
In this study, we investigated the distribution of small vesicle diameters and their abundance under various conditions. For a long time, vesicle size remained virtually unnoticed. In this study, we demonstrated for the first time that vesicle size is highly specific and precise, which has important implications for understanding intracellular transport.
2. Material and Methods
2.1. Cells
Unless otherwise stated, all other chemicals and reagents were obtained from previously indicated sources [34,42,56,57] or from Sigma-Aldrich (Milan, Italy). Cells were from sources presented previously and manipulated as described as it was indicated there [34,42]. Growth of cells was performed exactly as it has been described [42,57].
2.2. Antibodies
Rabbit polyclonal antibody against SLC35A1 (CMP-Sialic acid transporter [CMPST]) was from ThermoFisher (catalogue number 16342-1-AP). Rabbit Polyclonal antibody against Human SLC35A1 Anti-SLC35A1 (solute carrier family 35 (CMP-sialic acid transporter) antibody was from CD Creative Diagnostics (Catalogue number CABT-B9685) or Abcam (Catalogue number ABIN714969) and used for HeLa cells. Polyclonal mouse anti-Human SLC35A2 (solute carrier family 35 [UDP-galactose transporter; UDPGT]) polyclonal antibody (aa 88-156) was from CD Creative Diagnostics (Catalogue number DPAB-DC3168). Rabbit polyclonal antibody against UDP-galactose translocator (anti-SLC35A2) was from Abcam (catalogue number ab222854). Rabbit Polyclonal antibody against Human SLC35C1 (GDP-fucose transporter 1) Antibody (aa51 100, WB) LS C40438 was from LSBio (Catalogue Number LS-C40438-100). Rabbit polyclonal antibody against Sec22A was from Atlas antibodies (product number HPA039127) and Rabbit polyclonal antibody against Sec22A was from Sigma-Aldrich (product number HPA051639). Rabbit polyclonal antibodies against ManI and ManII were from Dr. K. W. Moremen (University of Georgia, Athens, GA); polyclonal antibodies against the luminal and cytosolic domains of galactosyl transferase from E. Berger (University of Zurich). Polyclonal antibodies against cMyc (c-Myc8A-14: sc-789) from Santa Cruz Biotechnology.Protein A conjugated with colloidal gold was from Dr. J. Slot (Utrecht University, Utrecht, The Netherlands). Monoclonal against GS27 was from Enzo Life Sciences AG.
Anti-rabbit, anti-mouse and anti-sheep conjugated with Alexa 488 and Alexa 546 were from Molecular Probes. Nanogold-conjugated Fab fragments of anti-rabbit IgG and Gold Enhancer were from Nanoprobes, and protein A conjugated with colloidal gold was from J. Slot (Utrecht University, the Netherlands).
2.3. Constructs
The Myc6-tagged GDP-mannose transporter tagged with Myc (pMA12 [Vig4-6myc in pRS416]) was obtained from Prof. K. Yoda (University of Tokyo). It was processed exactly as it was described by [35]. The cDNAs of the His6–SNAP (L294A) mutant (αSNAPmu) was from Prof. R. Burgoyne (University of Liverpool, Liverpool, United Kingdom). The temperature sensitive variant the vesicular stomatitis virus (tsVSV) was kindly provided by Prof. K. Simons (Max-Planck-Institute, Germany).
2.4. Cell Culture and Their Permeabilization
We used the same biochemical method with all controls described in previously published papers (see Figure 1 presented by Fusella et al. [35]) and had got the same results. Briefly: cell permeabilization with digitonin was performed exactly as it was described by Adolf et al. [53,54]. The permeabilized cells, were incubated with cytosol, and ATP regeneration system but in the absence of Ca2+ (by addition of EGTA). In the absence of cytosol, the distribution of p58, which at the beginning of the transport reaction can be readily detected in the perinuclear cis-Golgi region [56]. SLO-induced permeabilization was performed exactly as described [35,56,58].
Preparation of myristoylated Arf1 was performed exactly as described by Ha et al. [59,60]. The clathrin terminal domain inhibitor Pitstop 2-100 (MW 463.35 g/mol, Purity >99%) was from Abcam (catalogue number ab144650). Rabbit Polyclonal Clathrin heavy chain antibody was from Abcam (catalogue number ab21679). Ikarugamycin was from Sigma-Aldrich (Milan Italy; catalogue number SML0188). Ikarugamycin (IKA) was used at concentration 4 µM [61]. The His6--SNAP [L294A]) mutant was prepared as described previously [62]. We treated the cells with 1 mM NEM, which, as we have previously shown, gives the same results within 3 minutes as microinjection of the alpha-SNAP mutant [56]. CHO and LDLF cells grown at 32 ˚C. They placed at 40 ˚C for 2 min and then moved to ice where they were treated with 1 mM NEM for 15 min, washed with DTT on ice for 10 min and then placed back at 32 ˚C or 40 ˚C for 1 or 3 min, fixed, and prepared for routine EM.
2.5. Isolation of Golgi Membranes
We used reagents prepared in Mario Negri Sud and stored in liquid nitrogen. Homogenization of cells using the Balch homogenizer (was performed exactly as it has been described Balch et al. [62] with modifications proposed by German and Howe [63]. Briefly, cells were detached from dishes and 12 times passed through the Balch apparatus (Industrial Tectonics Co., Ann Arbor, Mich.). The crude homogenate was frozen in liquid N2 and stored at -80 °C. Before subcellular fractionation, frozen homogenates were thawed rapidly at 37 °C. The enriched Golgi fractions were prepared as described previously [35,56,64]. Briefly, liver homogenates were prepared from 6 rat livers. The homogenate (48 g) was resuspended in 100 mL of Ringer solution contained 10 mM Tris – HCl buffer and 0.25 M sucrose (pH 7.4). The homogenate was centrifuged at low speed (3000×g for 10min at 4 ˚C) to eliminate cell debris, nuclei and unbroken cells. The final sucrose concentration in the resulting supernatant was adjusted to 1.4M and the supernatant was loaded onto the bottom of ultracentrifuge tubes (Beckman SW28), with an overlay in succession of 1.2 M, 1.0 M, 0.9 M and 0.8 M sucrose. The gradient was centrifuged at high speed (90000×g for 2.5h at 4 C, in a SW28 rotor) (Beckman Analytical). The enriched Golgi membranes were collected at the interface of 0.9/1.0 M sucrose. Protein concentrations of the fractions were determined using the DC protein assay (Bio-Rad). The proteins were washed with potassium acetate or urea [35,56].
Microsomes from rat liver homogenates were isolated exactly as described [64,65,66]. Briefly, minced rat liver tissue was homogenized using a Potter-Elvehjem homogenizer. The homogenate was submitted to a series of centrifugations at increasing speeds to allow successive separation of nucleus, mitochondria and total microsomal fractions. Total microsomes were suspended in 1.38 M sucrose and placed under a 3-step sucrose gradient (steps: 1, 0.86, and 0.25 M sucrose) and centrifuged at 300,000 X g, for 60 min. The pellet was distributed in the upper half of the 1M sucrose step. Pellets were resuspended at ~20 μg/μL in 3 mM imidazole buffer (pH 7.4) containing 0.25 M sucrose and stored at -80 ˚C.
2.6. Isolation of Vesicles
Additionally, we prepared the vesicular fraction using the magnetic beads [35,65]. Briefly, the isolated vesicle fraction was incubated with anti-GS27 monoclonal mouse antibodies for 1 h at 37◦ C. Then, the magnetic beads (2.8μm diameter Dynabeads) were conjugated with M-280 sheep anti-mouse IgG (Dynal Biotech ASA). After its incubation with the antibody the vesicle fraction was mixed with magnetic beads. This mixture was incubated at 4◦C for 1h. Then, the beads were moved to the lateral wall of the test-tube using the magnetic device, according to the manufacturer instruction, and then centrifuged (90 000 × g for 30 min at 4 C using a SW28.1 rotor, Beckman Analytical). The pellet of magnetic beads was fixed with 0.05% glutaraldehyde plus 4% formaldehyde for 5 min, and next prepared for routine EM or immuno-EMand labelled for GGEs, and NSTs.
To test whether the scarce COPI coat usually present on Golgi membranes [91] could form membrane buds covered with the dense COPI coat we incubated isolated Golgi membranes or permeabilized cells at 37 ˚C with myristoylated Arf1; then with cytosol lacking COPI on ice, and then with purified COPI on ice. Then heat the cells to 37 ˚C. The incubation was made according to the original description, but with 8 mg /ml cytosol. The coatomer subunits combine more slowly than the stack is reorganized. The vesicular fraction obtained after incubation of isolated Golgi membranes was isolated as described [56,64]. Then we examined the entire pellet.
Golgi membranes were incubated in a K-rich transport buffer with cytosol, GTP, and an ATP regeneration system, as described by Godi et al. [82] and Lanoix et al. [63] with minor modifications, which included a higher concentration (7 mg/ml) of cytosol and a longer incubation (90 min). Coatomer-depleted cytosols, purified coatomer, and recombinant ARF1 were prepared exactly as described previously [33,82]. Isolated Golgi membranes Incubated with myristoylated Arf1 at 37 ˚C. Then cells were incubated with cytosol or with COPI-depleted cytosol on ice. If cells were incubated without crude cytosol, COPI-coated buds are formed, and if with cytosol, COPI rapidly disappeared from membrane and 52-nm vesicles are formed.
2.8. Microscopies
Fluorescence microscopy analysis, conventional and immuno-EM, 3D reconstructions of EM serial sections, correlative light-EM, ultrathin cryo- sectioning, rapid freezing-cryo-substitution, and analysis of samples by EM tomography were all carried out as described previously [57]. Diameters of vesicles were measured based on EM tomography according to the criteria described earlier [35,56]. All necessary controls for immune labelling were performed and demonstrated negative results.
For routine electron microscopy, cells were fixed with 1% glutaraldehyde in HEPES (pH 7.1), post-fixed in reduced OsO4 for 2 h, washed, treated with 0.3% thiocarbohydrazide for 30 min and then, after the washout, with 1% OsO4 for 1 h following dehydration and embedding in Epon-812. The OTOTO methods were applied as described [34,35,56,66].
Pre-embedding-based immune EM was performed according to [34,35,56,66]. Briefly, after the fixation of cells with glutaraldehyde (see above), samples were washed with the blocking buffered solution (four rinses over 30 min), incubated with primary antibody dissolved in blocking solution for 4 h at room temperature, rinsed with blocking buffer (four times over 30 min), and incubated with the species-specific Fab fragments of secondary antibody labelled with 1.4 nm nanogold in blocking solution overnight at room temperature. Then cells were additionally fixed with 1.6% glutaraldehyde in 0.1M sodium cocadylate buffer (pH 7.4) for 15 min, rinsed with HEPES buffer (50 mM HEPES with 200 mM sucrose, pH 5.8, four times over 30 min), washed 3 × 5 min with PBS including glycine (20 mM sodium phosphate, pH 7.4, 150 mM NaCl, 50 mM glycine) to remove aldehydes, rinsed (3 × 5 min) with PBS–BSA–Tween (PBS containing 1% BSA and 0.05% Tween 20), and washed (3 × 5 min) with Solution E (5 mM sodium phosphate, pH 5.5, 100 mM NaCl) from the gold enhancement kit (GoldEnhance-EM 2113; Nanoprobes, Inc. see Table 7). Next, samples were placed in a mixture of manufacturer’s Solutions A and B at a 2:1 ratio (80 μL of A and 40 μL of B for 5 min and 200 μL of Solution E with 20% gum Arabic [Sigma–Aldrich] and then 80 μL of Solution C was added to develop gold for 7–15 min. The enhancement was conducted at 4 ◦C. Further, samples were transferred to the neutral fixer solution composed of 250 mM sodium thiosulfate and 20 mM HEPES at pH 7.4 to stop the enhancement (three rinses over 5 min), washed with buffer E for 3-5 min, incubated in 1% OsO4 in 0.1 M sodium phosphate (pH 6.1) for 60 min, and rinsed with distilled H2O. Finally, after standard dehydrations, cells were embedded into Epon (from EMS, USA).
For cryo-immune-EM cells were fixed in 1% glutaraldehyde in HEPES (pH 7.1), for 1 h and embedded into gelatine. Then 45-nm cryosection were prepared using the Leica cryo-ultramicrotome (UC7; Leica Microsystems, Vienna). Proteins were detected in the immune-EM using the polyclonal antibodies diluted 1:50.
High-pressure freezing (HPF) was performed using a Bal-Tec HPM010 high-pressure freezer (Bal-Tec AG, Principality of Liechtenstein) and using interlocking brass hats as the specimen carrier (Swiss Precision Inc., Palo Alto, CA, USA). Cells were harvested, centrifuged, and inserted into cellulose microcapillaries (Leica Microsystems, Vienna). Briefly, the cell suspension was centrifuged briefly, and the pellet was diluted twofold. Then, short tubes from cellulose (Leica AFS; Leica Microsystems, Vienna) with an internal diameter of 200 nm were soaked in the bottom of the test tube. Capillary forces elevated the cell suspension into the cellulose tube. The ends of the cellulose tubes were closed with the help of forceps and placed into the HPF holder from Leica. The carriers were placed in the freezer and subjected to HPF. Subsequently, freeze substitution (FS) was performed using an automatic FS unit (Leica AFS; Leica Microsystems, Vienna) with 4% OsO4 in 96% acetone in 1.5-ml conical Eppendorf centrifuge tubes (Eppendorf UK Ltd., Cambridge, UK). The cells were dehydrated in ethanol and embedded into Epon 812 and polymerized at 60 °C. To prevent shrinkage of samples during tomographic analysis, we used a methyl-nadic anhydride (MNA)-based Epon 812 hard resin [34,42,67].
For electron microscopy tomography an ultramicrotome Leica AFS (Leica Microsystems, Vienna) was used to cut 60 nm serial thin sections and 200 nm serial semi-thick sections. Sections were collected onto 1% Formvar films adhered to slot grids. Both sides of the grids were labelled with fiduciary 10 nm colloidal gold were used to construct individual tomograms [34,42,67].
To measure the diameters of cell vesicles, initially, the EM tomograms were made over randomly selected area of cell. Then membrane spheres were identified within tomograms. The measurement of diameter was performed along X, Y and Z axes in the position when in all projection the spheres sphere appears round (see description and images 1 in the paper presented by [35]). We defined round profiles with diameters of 50, 60, 70, and 80 nm as vesicles if they were present in only one or two sequential serial sections taken at the same location on the projection. We cut the pellet vertically and separately measured stereologically the volume density of the 50 nm vesicles in the bottom and upper parts.
The buds were measured across around their maximum size. If there is a neck, then along the maximum diameter of the spherical part. For COPII-coated buds on the ER, the measurement was performed along the equator of the hemisphere. When the coated bud has a neck, then the maximal cross diameter of the head of the bud was measured.
To get reproducible data, we measured diameter based on the knowledge that dark layers of membranes are formed after application of OsO4 and represent a precipitate of osmium. When a three-layer membrane were visible the measurement was performed from the middle of one translucent layer situated between osmiophilic layers to that of another one. Also, we used serial sectioning as it was described in the paper by ([56] and thick 110 nm sections where all the above-mentioned vesicles are visible. Only vesicles completely situated within the section body were considered.
2.9. Stereology
To examine the ERES vesicles, we selected very flat spread cells and looked at ERES located far from the nucleus. For each time point we examined statistically 5-6 pairs of samples [42,68]. For search of free vesicles, we used criterion presented in the paper by [35]. We measure the length of membrane contour using stereological grid and counting intersections (I) between text lines and profiles. We have placed the test grid on random sections of Golgi cisternae and counted the intersections between test-line and membranes of cisternal rims and membranes of vesicles. The ratio between the surface area of vesicles (Iv) and cisternae (Ic) was estimated. Then stereological squared grid was placed and the number of intersections between grid lines and the defined membrane as well as the number of gold particles (N) near the defined membrane was estimated [42]. The ratio between the number of gold particles over the 50-nm RPs and the number of gold particles over cisternae or cisternal remnants (in vesicular fraction) was estimated and multiplicated by the first ratio. To measure the volumetric density of the cisternal remnants min the pellet of the vesicular fraction we were used random but representative method selected randomly areas in the bottom and the upper part of the pellet and cut these zones. Then placed the stereological grid on sections and we calculated the ration of grid points (P) placed over the remnants (Pcr) and the round profiles (Pv) and estimated the volume density Vv using the formula Vv=Pcr/(Pv+Pcr).
Statistical analyses were performed using GraphPad Prism software version 9.0 for MacOS (GraphPad Software) as described [42]. Briefly, data were analyzed with Mann-Whitney tests. Cumulative probability distributions were compared using the Kolmogorov-Smirnov test. Data are reported as mean ± SD. Statistical values can be found in the figures and figure legends. Statistical calculation was performed with GraphPad Prism version 7 and SigmaPlot version 12.5 soft wares. Difference was considered as s statistically significant when p<0.05.
3. Results
Initially, using two step electron microscopy (EM) tomography and serial sections [21,32] we measured the distribution of diameters of small (<100 nm) membrane spheres (vesicles) in different cells, namely, COS7, HepG2, and HeLa cells. Representative examples of buds (Figure 1A, D, E, I, L) and round profiles-vesicles (Figure 1B, C, E, F, I, J, K, M-W) with different diameters obtained from in HeLa (Figure 1A-F, I-V), HepG2 (Figure 1G, H), and COS-7 (Figure 1W) cells are demonstrated. For the preparation of cells, we used high pressure freezing. (Figure 1A, E), labelling for EGF conjugated with 10 nm gold (Figure 1B, C, F, J, T, U), labelling of endosomes with WGA-HRP (Figure 1D, I), routine transmission EM (Figure 1G, H, K, L, R), Tokuyasu cryosections (Figure 1M, N, O, S), and EM tomography (Figure 1Q, V-W). EM tomography allowed us to detect free vesicles (see serial tomo-images in Figure 1W). Most of vesicles were present in the central part of the cells and near ER exit sites (Figure S1). The peripheral parts of cells are mostly empty and do not contain vesicles. We compared the diameters of 52 nm near-Golgi vesicles after freezing and after chemical fixation (52.1±2.2 and 51.8±1.3 nm correspondingly) and concluded that both methods give comparable results.
The diameter distribution formed the standard peaks with maximal sizes equal to 42 (not found in HeLa cells), 50-52, 60, 70, 80, 100-nm. Intermediate diameters with intermediate sizes were detected rarely. HeLa cells do not contain the 42-nm vesicles (Figure 2A-F). The 50-52- and 100-nm vesicles were always uncoated (Figure 2K-M) whereas the 42-, 60-, 70-, and 80-nm vesicles could be coated with clathrin or uncoated. Near ERES we found the 50-nm vesicles which were always uncoated and were negative for Sec22 (Figure 2G). There are no vesicles with a diameter of 65-85 nm near ERES. COPII-coated buds on the ER always have the shape of hemisphere. Distributions of diameters of the ERES vesicles is like those of ERES COPI-coated buds, Golgi vesicles, and Golgi COPI-coated buds, but different from that of the ERES COPII-coated buds (Figure 2E-I).
To find the source of clathrin-dependent vesicles, we incubated cells with the WGA lectin conjugated with horse radish peroxidase (HRP) to the medium. Also, we used WGA to discriminate the 60-, 70- and 80-nm uncoated vesicles presumably clathrin-dependent from COPII-dependent ones. The application of WGA conjugated with HRP or with the EGF protein combined with subsequent gold labelling allowed us to identified vesicles derived from the PM and endosomes because WGA could label the PM endosome and even the trans-Golgi network (TGN) and trans-most cisterna. This method potentially could discriminate the uncoated 70- and 80-nm vesicles as being derived from ERES (if these vesicles would be negative for WGA), or endosome and plasma membrane derived when the 70- and 80-nm vesicles will be positive for WGA. Stimulation of EGF receptor with EGF and labelling with gold would for a short time would allow us to discriminate clathrin-coated or clathrin-dependent vesicles derived from the basolateral plasma membrane.
To this end, COS-7 cells were incubated with WGA-HRP for 30 min. Accumulation of WGA-HRP in the trans-most-cisternae after incubation of cells with WGA-HRP was observed in 30 min (Figure 2J). Incubation of cells with WGA-HRP induced labelling of endosomes and some of the vesicles and buds with diameters of 60, 70, 80 and 100 nm. Vesicles with diameter equal to 50-52 nm were filled with WGA-HRP (Figure 1D, I). Some of these clathrin-coated vesicles have diameter equal to 42 nm (Figure 3A: green arrows). In cells incubated with EGF conjugate with the 10-nm gold particles led to the appearance of gold particles inside these vesicles (Figure 1J, P, T, U).
In cells incubated with WGA-HRP for 15 min and then with NEM on ice, washing and worming up to 37 ˚C and subsequent incubation for 1 min, a significant portion of vesicles were positive for WGA-HRP and some of them were coated with clathrin (green arrows in Figure 3A, 4, 5P). However, when after treatment of cells with NEM and warming brefeldin A was added to the incubation medium the percentage of the 52 nm vesicles decreased (Figure 3C). This was evident even after the NEM treatment the 3 min incubation with brefeldin A was prolonged up to 3 min (Figure 3B, 4, 5P). Diameter of most vesicles accumulated after microinjection of antibodies against COG4 is larger than 55 nm (Figure 3C).
To examine the effect of Golgi vesiculation on the content of the isolated vesicular fraction we used N-ethylmaleimide (NEM), which blocks membrane fusion. To accumulate free vesicles, we incubated cells with 1 mM NEM on ice for 15 min and after washed cells with DTT, cells were incubated at 37˚C for 1 or 3 min. Then we incubated cells with NEM. In agreement with our previous work [35,36,81] In both COS-7 (Figure 3A, E) and HeLa (Figure 3B- D, F-J), the NEM treatment induced accumulation of vesicles. This is especially evident after incubation of cells with WGA-HRP for 15 min (to prevent labeling of the trans-most cisternae [69\0], subsequent treatment with NEM on ice and next incubation with 1 mg/ml brefeldin A to prevent formation of Golgi COPI-dependent vesicles) for one (Figure 3A) of three (Figure 3B) minutes, the 42 nm clathrin-coated vesicles and buds were visible better (Figure 3A and 3B). Green arrows there show the clathrin-coated [completely or partially] round 42-nm round profiles. Also, accumulation of mostly WGA-HRP-positive vesicles were observed (Figure 3A).
Microinjection of antibodies against COG4 also induced accumulation of mostly WGA-positive vesicles with diameter larger than 55 nm (Figure 3C). The 52-nm vesicles accumulated under the action of NEM are positive for GS27 (Figure 3D; nanogold), GS28 (Figure 3E; nanogold) and SNAP29 (Figure 3F; nanogold). Using IEM based on cryosections (Figure 3G-I) or peroxidase-DAB-based labelling (Figure 3J) we demonstrated that the 52-nm vesicles (red arrows) accumulated under the action of NEM are depleted in Golgi enzymes (Figure 3G, H, J) and sugar transporters (Figure 3G, I). The 52-nm vesicles accumulated under the action of NEM is positive for GS27 (Figure 3D), GS8 (Figure 3E) and SNAP29 (Figure 3F).
Structure of the pellet formed after centrifugation of vesicular fractions obtained from cells incubated at 37ºC for 3 min after NEM treatment is shown in Figue 4A. Structure of the pellet formed after centrifugation of vesicular fractions was examined using routine transmission EM (Figure 5A, H-O). After more intensive Golgi vesiculation the percentage of cisternal remnants in the vesicular fraction was significantly higher (Figure 5P). The 52-nm uncoated vesicles are indicated in the red box. Membranes incubated with GTPgS were subjected to shaking to liberated COPI-coated vesicles and mixed with vesicular fraction formed after incubation of Golgi membranes with cytosol in the presence of GTP. Next, the pellet of the vesicular fraction was formed sung centrifugation.
In the mixture of vesicles formed in the presence of GTPgS or GTP the GTPgS-dependent COPI-coated vesicles are heavier than the uncoated ones and as a result were found on the very bottom of the pellet (Figure 4B; COPI-coated vesicles are shown in green box). Figure 4C demonstrated the pellet of the vesicular fraction obtained from normal cells. Cryosection of the pellet of the vesicular fraction obtained from cells incubated with NEM for 1 min. is shown in Figure 4D. In the 52-nm round profiles visible in the pellet of the vesicular fraction we also observed a depletion of markers, namely, Golgi enzymes and nucleotide sugar transporters (Figure 4D-G, I, M, N) and enrichment of GS27 (Figure 4H, M, N), and GS28 (Figure 4J, M, N) over the 52-nm round profiles. In the vesicular fraction the labelling for Sec22 is not observed over round profiles (Figure 4K, L, M. N)
We used immune EM labelling was based on nanogold (Figure 5B, F) and cryosections (Figure 5C-E, G). The purity of the isolated Golgi. Is shown in Figure 5A. In the vesicular fraction obtained from cells incubated for 3 min after the treatment with NEM, the 52-nm uncoated round profiles are GS27–positive (Figure 5B). There is labelling for clathrin over the coat surrounding round profiles (Figure 5C). In the vesicular fraction obtained from Golgi membranes, the 52-nm round profiles were negative for CMPST, the nucleotide sugar transporter (Figure 5D) and for Myc6 (Figure 5E). Man-II was depleted over round profiles but enrichment in other Golgi membranes (Figure 5F, G). After isolation of the 52-mnm Golgi vesicles with magnetic beads coated with and antibodies against GS27, not only the 52-nm vesicles but also remnants of Golgi cisternae are obtained (Figure 5H-K).
The vesicular fraction used for experiments with Arf1, and sequential binding was shown in Figure 5L. Incubation of the Golgi membranes with cytosol induced formation of the 52-nm vesicles (Figure 5M). After incubation of Golgi membranes with Arf1 at 37˚C) and then with COPI fraction oif cytosol on ice, the COPI-coated buds were not found (Figure 5N). Incubation of the above-mentioned membranes at 37˚C for 2 min without addition of other proteins induced formation of COPI-coated buds (Figure 5O). Thus, formation of COPI-coated buds and their fission potentiate uncoating of Golgi membranes.
Finally, we tested whether COPI-dependent vesicles could recruit Sec13, the subunit of COPII. To this end, the 50-nm vesicles formed after incubation of endoplasmic reticulum microsomes with cytosol were isolated with magnetic beads conjugated with antibodies against GS27, we isolated COPI-dependent vesicles from the ER and incubated these vesicles with Sec13. The isolated with GS27/membrin-containing magnetic beads the 50-nm vesicles were not positive for Sec13. Labelling for Sec13 is visible over membrane structures larger than 60 nm (Figure 6iA). After incubation of the vesicular fraction with cytosol, the 50-nm round profiles became positive for Sec13 (Figure 6iB, iC) whereas incubation with anti-albumin antibody the labeling was absent (not shown). Schemes of the formation of cell vesicles is shown in Figure 6iiA-iF.
4. Discussion
Our analysis is aimed to study cell vesicles. The super-resolution methods are not suitable for the identification of small vesicles with sufficient details. We observed clear peaks on the diameter distribution graph: 42, 50, 60, 70, 80, 100 nm. We could not find the 42-nm vesicles in HeLa cells but found them in COS-7 cells. According to R2 test, this difference is statistically significant (p<0.05). The 42-nm vesicles were observed in absorptive enterocytes [74] and neurons [75], However, these 42-nm vesicles are not present in goblet cells [21].
The 42, 60, 70, 80 nm vesicles can be coated with clathrin. Being dependent on the clathrin and sometimes coated with it, these vesicles clearly corresponded to stable fullerenes: C₆₀, C₇₂, C₈₄, C₉₆, and C₁₃₄. Schemes of stable fullerenes are shown in Figure 6iiG. 1. The fullerene C60 corresponds to a soccer ball; the diameter of the inscribed sphere = 42 nm; 2. C72: the diameter of the inscribed sphere = 60 nm; 3. C84; the diameter of the inscribed sphere = 70 nm; 4. C96; the diameter of the inscribed sphere = 80 nm; 5. C134; the diameter of the inscribed sphere = 100 nm.
These vesicles are achievable for the WGA lectin conjugated with peroxidase and added to the culture medium. The 50-52 nm vesicles were always uncoated. Similar observations regarding vesicles of 50–52 nm have been previously reported [66,78]. We compared the size of the buds and vesicles. There is a higher chance that ER exit site (ERES) vesicles are formed from COPI-coated buds. In the cells and vesicular fractions, vesicles were depleted in Sec22, GGE, NSTs, GS27 is present in the 50 nm vesicles.
In intestinal absorptive enterocytes, there are no COPII-coated buds and COPII-dependent vesicles [74]. In goblet cells, ERES are extremely small [51,76] COPII-coated buds and COPII-dependent vesicles were not found there [21]). Also in the regenerating endothelium, endothelial cells being in G2 phase contain ERES [77].
Clathrin-coated vesicles were achievable for WGA lectin added outside. Uncoated vesicles with diameters of 42, 60, 70, 80, and 100 nm were also available for external addition of WGA. After 30 minutes of cell incubation with WGA-HRP and subsequent membrane fusion blocking, vesicles with wavelengths of 42, 60, 70, 80, and 100 nm, but not 50–52 nm, were labeled with the lectin. In vesicles with diameter equal to 42, 60, 70, and 80 nm, the concentration of Sec22 was significantly lower than in the ERES. These findings indicate that 50 nm vesicles are of a different origin than other vesicles. Clathrin-coated 100 nm vesicles were not found. Therefore, the hypothesis that clathrin-coated buds on the plasma membrane can also transform into clathrin-coated vesicles is either incorrect or a very rare occurrence.
Several authors have stated that they have demonstrated COPII- or COPI-coated vesicles, but none of them have used 3D EM. For example, in Figure 1A presented by [29], the so-called “clearly visible COP layer” is an indistinct structure without a clearly visible white membrane line. In Figure 1C also shown in the same location, the “Man II positive vesicle with visible COP coating” is coated with clathrin, as the coating thickness exceeds 15 nm in diameter. Figure 2 shows a circular profile without evidence that this profile represents a vesicle.
It is more straightforward to identify COPII dependency by labeling Sec22, a marker that was already identified in the research by Rexach et al. [79]. However, such labeling has not been performed or shown in the images presented by Bednarek and colleagues [73]. The so-called COPII-coated vesicles shown in Figure 2D and COPI-coated vesicles in Figure 2E from Bednarek et al [73] are identical in both size and morphology. Their structural characteristics closely resemble those of COPI coats depicted in the images provided by Orci et al [78]. COPI binds to the ER proteins using the dilysine motif [80].
In the images published by [16,17,18,19] obtained from quickly frozen samples, the transverse diameter of hemispheres coated with COPII ranged from 70 to 85 nanometers on the ER. This makes it difficult to form spheres from these hemispheres, as excess membranes are formed. For instance, the surface area of a sphere with a diameter of 50 nanometers is twice that of a sphere with a diameter of 70 nm, and nearly three times that of a sphere with diameters between 85 and 86 nm. If we assume that the COPII vesicles originated from a coated bud of such a large size, a mechanism will need to exist to remove excess membrane during the formation of the vesicle. Buds observed by Bannykh et al. [81] were also larger than 65 nm.
In most studies, vesicles of 52 nm do not contain Golgi resident proteins [35,56,82,83,84,85]. Also, during mitosis, these vesicles have fewer Golgi enzymes compared to Golgi cisternae [86,87]. Martinez-Menarguez et al. [88] observed a slight increase in ManII-GFP content in circular profiles coated with COPI, although this protein was overexpressed.
Golgi glycosylation enzymes, nucleotide sugar transporters, and Sec22 are not present in 52 nm vesicles but are positive for GS27. Specifically, the concentration of Golgi resident proteins in these 52 nm vesicles is significantly lower compared to above the tanks or tank residues located at the bottom of the sedimentary fraction obtained after centrifugation. Furthermore, the structural characteristics of NSTs indicate their involvement in COPI-dependent retrograde transport vesicles. Indeed, NSTs contain ten transmembrane domains and form homo-oligomers ranging from dimers to hexamers [89,90,91,92,93]. The width of the NST dimer with 20 trans-membrane domains is 20 nanometers, and the size of hexamers is even higher [93]. Due to these dimensions, it is highly unlikely that NSTs could be effectively encapsulated in membrane of the 52 nanometer COPI vesicles.
The formation of COPI-buds coated with COPI and subsequent detachment o0f vesicles may serve as a mechanism for the removal of COPI from the Golgi membranes. It has been established that COPI is not only present in buds coated with this protein, but also along the periphery of Golgi cisternae, where these buds function as a means for collecting COPI [94]. During our investigations, we did not observe vesicles positive for Sec22, which should be in putative COPII vesicles [21,79,95].
To demonstrate that COPI-dependent bud formation leads to membrane opening, a three-stage experimental approach was employed. Initially, myristoylated Arf1 was incorporated into the membranes of Golgi cisternae. At 0 °C, COPI binds to Arf1, a temperature that decreases membrane fluidity but does not disrupt the Arf1-COPI interaction. The inhibition of the formation of COPI-coated vesicles when heated in the presence of coatomer complexes without e-COPI support this mechanism, thus confirming the hypothesis that the formation of these vesicles helps to remove the COPI coat. The sequential attachment of Arf1 to the Golgi membrane, then binding of COPI to Arf1 and subsequent heating, resulted in a decrease in the labeling of COPI on these membranes. This suggests that the formation of 50–52 nm vesicles could induce the removal of the COPI coat from the Golgi membranes.
Clathrin-coated vesicles, the size of which was consistent with our data, were identified by several research groups (see the Introduction). One potential explanation for the presence of these distinct peaks observed in clathrin-coated vesicles is that their formation is guided by the physical principles that underlie the geometry of fullerenes. It is well known that clathrin triskelions, composed of three heavy chains and three light chains, self-assemble into multifaceted structures. The thickness of the clathrin coat is 18.3 nanometers, and the length of the edges of the polyhedral structure is approximately 16 nanometers. Notably, the structure of C60 fullerene, also known as a truncated icosahedron, comprises 20 hexagonal faces and 12 pentagonal faces, forming a spherical structure with 60 vertices, mirroring the geometry of a coat for a soccer ball. If we consider a synaptic vesicle with an outer diameter of 41.6 nm, then the outer diameter of the clathrin coat of a football-shaped fullerene would be 77.6 nm. This is calculated by adding the 41.6 nm of the vesicle and doubling the 18.3 nm of the clathrin coat. Thus, the membrane sphere that fits within the geometry of a cell has a diameter of approximately 42 nm. The geometry of clathrin coats provides a physical justification for the consistent size of clathrin-coated vesicles. The stable relationship between the vesicle diameter and the football-shaped structure supports the idea that the assembly of the coat may be challenging from a physical perspective. C₆₀ fullerenes, consisting of 60 carbon atoms and forming a truncated icosahedron, geometrically correspond to clathrin frameworks that can accommodate a membrane sphere with a diameter of ~42 nm. This size is like that of synaptic vesicles. A membrane sphere with a diameter of 60 nanometers (nm) could be inserted into the C96 fullerene molecule, while spheres with diameters of 70 and 80 nm correspond to C138 and C180 fullerenes, respectively. These fullerenes (C96, C138, and C180) are among the most stable and geometrically ideal due to their lack of adjacent pentagonal contacts, a well-known destabilizing factor in fullerene structures. In contrast, smaller fullerenes with pentagonal structures, such as C76, are energetically less favorable and structurally less stable [96,97].
These diameters of the polyhedron that form the clathrin coating correspond to more energetically favorable configurations for the formation of the clathrin lattice [98,99,100]. Additionally, a barrel-shaped hexagonal fullerene can accommodate spheres with a diameter of 30 nanometers (nm), and even smaller mini-shell-like fullerenes composed entirely of pentagons may correspond to tiny vesicles observed in S. cerevisiae [101,102]. Therefore, our findings once again demonstrate that biology follows physical laws, specifically, mathematics and fullerene physics dictate biological structure.
Our data explain why the vesicle fraction used for analysis of COPI vesicles contain significant amount of Golgi glycosylation enzymes. One possible explanation is that the vesicle fractions contain not only intact vesicles but also cisternal remnants [56]. Importantly, according to the methods described by Gilchrist et al, [49] samples prepared for electron microscopy was additionally purified using gradient centrifugation whereas this procedure was not used for samples prepared for biochemical analysis. Moreover, in the vesicular fraction analyzed by Gilchrist et al, [49], four Golgi resident proteins, ERGIC32, STX5, p115, and p24 were found in these vesicles in lower concentrations compared to their levels in cisternal membranes. This suggests against the role of COPI vesicles as retrograde carriers.
Another problem of the vesicle isolation is the use of GTPgS instead of GTP [103]. For instance, Sonnichsen et al. [104] observed giantin on COPI vesicles using cryosections. However, to obtain the vesicles they used GTPγS. On the other hand, in several papers, where GTP was used, ARFGAP was not included in their incubation medium. These experimental conditions resemble those based on GTPgS because when GTP hydrolysis is inhibited in the presence GTPgS, or in the presence of GTP but in the absence of ARFGAP, vesicles are unable to detach from the membrane [105]. Adolf et al. [8] used incubation with COPI subunits, myristoylated ARF1, GTP but in the absence of ARFGAP and observed in vesicular fractions an increase in the levels of ManI and GalNAcT2, enzymes commonly found in the cis- and trans-Golgi. They claim that ARFGAP is not necessary for the release of COPI vesicles. However, g-COP was present on their COPI vesicles, suggesting that these vesicles are coated with COPI. This situation resembles that when GTPgS is used. Moreover, the size of vesicles visible in the vesicula fraction is unusual. Figure 6 presented by Adolf et al. [8] shows that the diameter of these COPI vesicles is approximately 90 nm. Alternatively, in Figure 1D from Adolf et al. [106], the diameters of round profiles, judging by the scale bar, range from 17 to 43 nm. Our data suggest that during the isolation procedure, COPII components could have bound nonspecifically to COPI-dependent vesicles, like the nonspecific interactions described by Aridor et al. [1]. Thus, it is not possible to exclude that GGEs are present in the vesicular fractions are derived from cisternal remnants.
We have previously shown [35,56,70] that during intensive Golgi vesiculation, many cisternal remnants appear in the cell after their detachment from the stacks. The remnants contaminate the vesicular fraction. Their entry into the vesicular fraction explains why, when Golgi vesicle function is blocked, many remnants appear in the vesicular fraction that contain a significant amount of Golgi enzyme.
Indeed, after treatment of cells with N-ethylmaleimide (NEM), especially after prolonged treatment, cisternal remnants were visible in the bottom of our vesicular fraction after its centrifugation more often. Also, in cells from which lacking the COG complex was suddenly eliminated, the Golgi appeared irregular in shape (“ugly”) and contain cisternal remnants [107,108]. These remnants containing a higher concentration of GGE [56] have accumulated in the vesicular fraction, potentially creating the impression that Golgi vesicles are enriched in GGE. This mechanism may provide an alternative explanation for observations reported by the Lupashin’s group [43,55]. This observation provides an alternative explanation for data presented by Lupashin’s group [43,55] who observed that after Golgi vesiculation then amount of Golgi enzymes in the vesicular fraction became higher than without Golgi vesiculation. However, they did not examine the pellet of the vesicular fraction at EM level Gilchrishst et al. [49] also took a non-pellet precipitate and a membrane fraction enclosed between the density gradients of sucrose solutions whereas the entire vesicular fraction was biochemically examined.
However, this sharp increase in the number of vesicles following acute inactivation of the COG function reported by Sumya et al [43,55] appears to be a transient phenomenon [109,110]. Sumya et al. [43,55] isolated vesicles using antibodies against giantin and GS15, but the concentration of GS15 and giantin was almost the same in Golgi cisternae and COPI vesicles [85]. Furthermore, our observations indicate that even when magnetic beads conjugated with antibodies against GS27 or GS28 are used to increase the specificity of isolation, infection with remnants of Golgi cisterna cannot be completely ruled out.
A vesicle fraction obtained in the presence of GTP and analyzed by Gilchrist et al. [49], was enriched in Rab1A, Rab1B, Rab2A, and Rab14 proteins were enriched. This suggest that COG able to bind Rabs could function as a tether fir COPI-dependent vesicle and explains why in the absence of COG the number of 50-nm vesicles increased. Indeed, in the absence of tether-like strings vesicles could diffuse out of Golgi zone.
Finally, in experiments conducted by Munro’s group [111,112,113], Golgins were directed to the mitochondria, where they functioned to bind vesicles. The Golgi-97-dependent vesicles, which were approximately 30-80 nanometers in size and attached to mitochondria, did not contain GGE or NST, but did contain TGN46, CI-M6PR, and CD-M6PR [111]. However, this study lacked systematic measurements of the diameter of the vesicles and immunolabeling for GGE, NST, GS27, and GS28, which are markers for COPI-dependent vesicles. Our measurements of the diameters of round profiles RPs attached to mitochondria after application of Golgin-97 probe in (Figure 7 presented by Wong and Munro [112]) using the diameter of microtubules as a reference showed that the diameters ranged from 93 to 140 nanometers. This suggested that these vesicles were independent of COPI but likely depended on clathrin. In Figure 3B presented by Welch et al. [113], the vesicles near the mitochondria in insect cells had a diameter of approximately 30-40 nanometers. They worked with insects that have the 42 nm clathrin-dependent vesicles [21,32].
Therefore, the data collected by Munro’s team could have alternative explanation and thus, does not obligatory support the hypothesis that COPI-dependent vesicles serve as retrograde carriers.
Recently, we have shown that the articles by Kaiser and Schekman [71] and Barlowe et al. [72] have alternative explanations. Here we would like to show an alternative explanation for the paper by Bednarek et al. [73]. We believe that the structures depicted in Figure 2E presented by [73] are COPI-coated buds. This interpretation is supported by several lines of evidence. We measured the diameter of the two coated buds depicted in Figure 2A,D presented by [73]. Their diameters are equal to 56 and 48 nm respectively. These measurements correspond precisely to the 50–52 nm vesicle sizes we reported, supporting our interpretation. Notably, we did not detect vesicles with diameter equal to 70–85 nm near ERES. However, Bednarek et al. [73] observed coated buds on the nuclear envelope in the absence of ARF1 but in the presence of COPI.
Conversely, the addition of Arf1 resulted in the formation of a minimal number of coated buds (see Figure 1E in [73]). For the membrane isolation Bednarek et al [73] used method described by Rexach and Schekman [114\97], which does not include a washing step. Moreover, Figure 2A presented by Bednarek and colleagues [73] clearly demonstrates proteins within the nuclear pores. This suggests that the nuclear envelope has not been washed. Also, in the earlier work of the Schekman group [72], the authors employed ER membranes containing a significant amount of g-COP.
Considering that the nuclei in the experiments conducted by Bednarek and others [73] were not treated with urea or high-concentrated potassium, it is plausible that their samples contain some erosion typically observed on the nuclear membrane. However, in the absence of a specific amount of Arf1, which is typically absent in ERESs, COPI would not be capable of forming the curvature of the membrane [115,116]. The addition of Arf1 allows COPI, which was attached to the membrane of nuclear envelopes, to migrate into ERESs, bind to Arf1, and form COPI-coated bud.
5. Conclusion
Here, we established that the distribution of diameters of cellular vesicles forms several distinct peaks equal to 42, 50, 60, 70, 80, and 100 nanometers. While clathrin-coated free vesicles are present, free COPI- or COPII-coated vesicles are absent. Clathrin coats are organized in a stable, fullerene-like structure. Vesicles with diameters of 50-52 nm are depleted of both anterograde and retrograde cargos, Sec22, but enriched in GS27. During the isolation, formation of vesicles from Golgi cisternae induces detachment of cisternae from each other and alteration of their morphology, which affect the purity of the vesicular fraction during its isolation. Additionally, the 50 nm vesicles derived from ERES are negative for Sec22 and can bind to Sec13. our data allow us to propose alternative explanations for all data suggesting in favor of the cisterna maturation model of intracellular transport (see details in [42].
Supplementary Materials
The following supporting information can be downloaded at the website of this paper posted on Preprints.org
Author Contributions
Conceptualization, A.A.M.; methodology, A.F.; validation, A.F.; investigation, A.F.; data curation, A.A.M., H.-S.K. and A.F.; writing—original draft preparation, A.A.M.; writing—review and editing, A.A.M..; visualization, A.F. and H.-S.K. All authors have read and agreed to the published version of the manuscript.
Funding
This research received no financial support from FIRC, AIRC, INTAS (Project 99-4-1732), Telethon (E.1105), the Italian National Research Council (Convenzione CNR–Consorzio Mario Negri Sud).
Acknowledgments
We acknowledge the Centre European of Nano-medicine (CEN; Italy) for the possibility to use the Tecnai 20 EM. We thank all scientists kindly sent us antibodies and constructs; FIRC for its support of our laboratory, INTAS (Project 99-4-1732), Telethon (E.1105), the Italian National Research Council (Convenzione CNR–Consorzio Mario Negri Sud).
Conflicts of Interest
The authors declare no conflicts of interest
References
- Aridor M, Bannykh SI, Rowe T, Balch WE. Sequential coupling between COPII and COPI vesicle coats in endoplasmic reticulum to Golgi transport. J Cell Biol. 1995 Nov;131(4):875-893. [CrossRef]
- Aridor M, Bannykh SI, Rowe T, Balch WE. 1999. Cargo can modulate COPII vesicle formation from the endoplasmic reticulum. J Biol Chem 274:4389-4399. [CrossRef]
- Allan, B.B., Moyer, B.D., and Balch W.E. 2000. Rab1 recruitment of p115 into a cis-SNARE complex: programming budding COPII vesicles for fusion. Science. 289:444–448.
- Aridor, M., and Balch, W. E. (2000). Kinase signaling initiates coat complex II (COPII) recruitment and export from the mammalian endoplasmic reticulum. J. Biol. Chem. 275, 35673–35676. [CrossRef]
- Aridor M, Fish KN, Bannykh S, Weissman J, Roberts TH, Lippincott-Schwartz J, and Balch WE. 2001. The Sar1 GTPase coordinates biosynthetic cargo selection with endoplasmic reticulum export site assembly. J Cell Biol. 152(1):213-229.
- Ahluwalia, J.P., Topp, J.D., Weirather, K., Zimmerman, M., and Stamnes M. 2001. A role for calcium in stabilizing transport vesicle coats. J. Biol. Chem. 276(36):34148-34155.
- McMahon HT, Mills IG. COP and clathrin-coated vesicle budding: different pathways, common approaches. Curr Opin Cell Biol. 2004 Aug;16(4):379-91. [CrossRef]
- Adolf F, Herrmann A, Hellwig A, Beck R, Brügger B, Wieland FT. Scission of COPI and COPII vesicles is independent of GTP hydrolysis. Traffic. 2013 Aug;14(8):922-932. [CrossRef]
- Andika IB, Zheng S, Tan Z, Sun L, Kondo H, Zhou X, Chen Endoplasmic reticulum export and vesicle formation of the movement protein of Chinese wheat mosaic virus are regulated by two transmembrane domains and depend on the secretory pathway. J. Virology. 2013 Jan 20;435(2):493-503. [CrossRef]
- Gomez-Navarro N, Miller EA. COP-coated vesicles. Curr Biol. 2016 Jan 25;26(2):R54-R57. [CrossRef]
- Arakel EC, Schwappach B. Formation of COPI-coated vesicles at a glance. J Cell Sci. 2018 Mar 13;131(5):jcs209890. [CrossRef]
- Taylor RJ, Tagiltsev G, Briggs JAG. FEBS Lett. 2023 Mar;597(6):819-835. [CrossRef]
- Arab M, Chen T, Lowe M. Mechanisms governing vesicle traffic at the Golgi apparatus. Curr Opin Cell Biol. 2024 May 4;88:102365. [CrossRef]
- Johnson A. Mechanistic divergences of endocytic clathrin-coated vesicle formation in mammals, yeasts and plants. J Cell Sci. 2024 Aug 15;137(16):jcs261847. [CrossRef]
- Viotti C. ER to Golgi-Dependent Protein Secretion: The Conventional Pathway. Methods Mol Biol. 2016;1459:3-29. [CrossRef]
- Bacia K, Futai E, Prinz S, Meister A, Daum S, Glatte D, Briggs JA, Schekman R. Multibudded tubules formed by COPII on artificial liposomes. Sci Rep. 2011, 1:17. [CrossRef]
- Bykov YS, Schaffer M, Dodonova SO, Albert S, Plitzko JM, Baumeister W, Engel BD, Briggs JA. 2017. The structure of the COPI coat determined within the cell. Elife. 6. pii: e32493. [CrossRef]
- Pyle E, Miller EA, Zanetti G. Cryo-electron tomography reveals how COPII assembles on cargo-containing membranes. Nat Struct Mol Biol. 2025 Mar;32(3):513-519. [CrossRef]
- Chung KP, Frieboese D, Waltz F, Engel BD, Bock R. Identification and characterization of the COPII vesicle-forming GTPase Sar1 in Chlamydomonas. Plant Direct. 2024 Jun 16;8(6):e614. [CrossRef]
- Mironov AA, Beznoussenko GV. Models of intracellular transport: Pros and cons. Front Cell Dev Biol. 2019, 7, 146. [CrossRef]
- Mironov, A. A.; Fusella, A.; Beznoussenko, G. V. The 50-nm Free Vesicles Visible in Saccharomyces cerevisiae Are Not COPII-Dependent. Current Issues in Molecular Biology, 2025, 47, 336. [CrossRef]
- Holzman, E. Cytochemical studies of protein transport in the nervous system. Philos. Trans. R. Soc. Lond. 1971, 261, 407–421. [CrossRef]
- Friend DS, Farquhar MG. Functions of coated vesicles during protein absorption in the rat vas deferens. J Cell Biol. 1967 Nov;35(2):357-76. [CrossRef]
- Griffiths G, Fuller SD, Back R, Hollinshead M, Pfeiffer S, Simons K. 1989. The dynamic nature of the Golgi complex. J Cell Biol 108:277-297.
- Klumperman, J., Hille, A., Veenendaal, T., Oorschot, V., Stoorvogel, W., von Figura, K., and Geuze, H.J. (1993). Differences in the endosomal distributions of the two mannose 6-phosphate receptors. J Cell Biol 121, 997-1010.
- Le Borgne, R., Griffiths, G., and Hoflack, B. (1996). Mannose 6-phosphate receptors and ADP-ribosylation factors cooperate for high affinity interaction of the AP-1 Golgi assembly proteins with membranes. J Biol Chem 271, 2162-2170.
- Bonfanti L, Mironov AA Jr, Martínez-Menárguez JA, Martella O, Fusella A, Baldassarre M, Buccione R, Geuze HJ, Mironov AA, Luini A. 1998. Procollagen traverses the Golgi stack without leaving the lumen of cisternae: evidence for cisternal maturation. Cell. 95(7):993-1003. [CrossRef]
- Martínez-Menárguez, J. A., Geuze, H. J.; Ballesta, J. Identification of two types of beta-COP vesicles in the Golgi complex of rat spermatids. Eur. J. Cell. Biol. 1996, 71, 137–143.
- Stoorvogel, W., Oorschot, V., and Geuze, H.J. 1996. A novel class of clathrin-coated vesicles budding from endosomes. J. Cell Biol. 132:21-33.
- Ladinsky, M. S., Mastronarde, D. N., McIntosh, J. R., Howell, K. E., and Staehelin, L. A. Golgi structure in three dimensions, functional insights from the normal rat kidney cell. J. Cell. Biol. 1999, 144, 1135–1149. [CrossRef]
- Puri C, Tosoni D, Comai R, Rabellino A, Segat D, Caneva F, Luzzi P, Di Fiore PP, Tacchetti C. Relationships between EGFR signaling-competent and endocytosis-competent membrane microdomains. Mol Biol Cell. 2005 Jun;16(6):2704-18. [CrossRef]
- Beznoussenko GV, Ragnini-Wilson A, Wilson C, Mironov AA. 2016. Three-dimensional and immune electron microscopic analysis of the secretory pathway in Saccharomyces cerevisiae. Histochem Cell Biol. 146(5):515-527. [CrossRef]
- Mironov AA, Sesorova IS, Seliverstova EV, Beznoussenko GV. 2017. Different Golgi ultrastructure across species and tissues: Implications under functional and pathological conditions, and an attempt at classification. Tissue Cell 2017, 49 (2 Pt A):186-201. [CrossRef]
- Mironov AA, Beznoussenko GV. The Regulated Secretion and Models of Intracellular Transport: The Goblet Cell as an Example. Int J Mol Sci. 2023 May 31;24(11):9560. [CrossRef]
- Fusella, A., Micaroni, M., Di Giandomenico, D., Mironov, A. A., and Beznoussenko, G. V. Segregation of the Qb-SNAREs GS27 and GS28 into Golgi vesicles regulates intra-Golgi transport. Traffic 2013, 14, 568–584. [CrossRef]
- Bomsel M, de Paillerets C, Weintraub H, Alfsen A. Lipid bilayer dynamics in plasma and coated vesicle membranes from bovine adrenal cortex. Evidence of two types of coated vesicle involved in the LDL receptor traffic. Biochim Biophys Acta. 1986 Jul 10;859(1):15-25. [CrossRef]
- Avinoam O, Schorb M, Beese CJ, Briggs JA, Kaksonen M. ENDOCYTOSIS. Endocytic sites mature by continuous bending and remodelling of the clathrin coat. Science. 2015 Jun 19;348(6241):1369-72. [CrossRef]
- Mettlen M, Chen PH, Srinivasan S, Danuser G, Schmid SL. Regulation of Clathrin-Mediated Endocytosis. Annu Rev Biochem. 2018 Jun 20;87:871-896. [CrossRef]
- Shevchuk AI, Hobson P, Lab MJ, Klenerman D, Krauzewicz N, Korchev YE. Endocytic pathways: combined scanning ion conductance and surface confocal microscopy study. Pflugers Arch. 2008 Apr;456(1):227-35. [CrossRef]
- Diao A, Rahman D, Pappin DJ, Lucocq J, Lowe M. The coiled-coil membrane protein golgin-84 is a novel rab effector required for Golgi ribbon formation. J Cell Biol. 2003 Jan 20;160(2):201-212. [CrossRef]
- Peters A, Palay SL, Webster H. Fine Structure of the Nervous System: Neurons and Their Supporting Cells. Oxford, New York Toronto. Oxford University Press. 3 edition. (1991) 528 pages.
- Beznoussenko GV, Kweon HS, Sesorova IS, Mironov AA. Comparison of the Cisterna Maturation-Progression Model with the Kiss-and-Run Model of Intra-Golgi Transport: Role of Cisternal Pores and Cargo Domains. Int. J. Mol. Sci. 2022, 23, 3590. [CrossRef]
- Sumya FT, Pokrovskaya ID, D’Souza Z, Lupashin VV. Acute COG complex inactivation unveiled its immediate impact on Golgi and illuminated the nature of intra-Golgi recycling vesicles. Traffic. 2023 Feb;24(2):52-75. [CrossRef]
- Waters, M.G., Clary, D.O., and Rothman, J.E. 1992. A novel 115-kD peripheral membrane protein is required for intercisternal transport in the Golgi stack, J. Cell Biol. 118:1015–1026.
- Ostermann J, Orci L, Tani K, Amherdt M, Ravazzola M, Elazar Z, Rothman JE. Stepwise assembly of functionally active transport vesicles. Cell. 1993 Dec 3;75(5):1015-1025. [CrossRef]
- Williger BT, Ostermann J, Exton JH. Arfaptin 1, an ARF-binding protein, inhibits phospholipase D and endoplasmic reticulum/Golgi protein transport. FEBS Lett. 1999 Jan 25;443(2):197-200. [CrossRef]
- Love HD, Lin CC, Short CS, Ostermann J. Isolation of functional Golgi-derived vesicles with a possible role in retrograde transport. J Cell Biol. 1998;140(3):541-551. [CrossRef]
- Lanoix J, Ouwendijk J, Lin CC, Stark A, Love HD, Ostermann J, Nilsson T. GTP hydrolysis by arf-1 mediates sorting and concentration of Golgi resident enzymes into functional COP I vesicles. EMBO J. 1999 Sep 15;18(18):4935-48. [CrossRef]
- Gilchrist, A., Au, C. E., Hiding, J., Bell, A. W., Fernandez-Rodriguez, J., Lesimple, S., et al. (2006). Quantitative proteomics analysis of the secretory pathway. Cell 127, 1265–1281. [CrossRef]
- Malsam J, Gommel D, Wieland FT, Nickel W. 1999. A role for ADP ribosylation factor in the control of cargo uptake during COPI-coated vesicle biogenesis. FEBS Lett. 462(3):267-272.
- Adolf F, Rhiel M, Hessling B, Gao Q, Hellwig A, Béthune J, Wieland FT. Proteomic Profiling of Mammalian COPII and COPI Vesicles. Cell Rep. 2019 Jan 2;26(1):250-265.e5. [CrossRef]
- Adolf F, Rhiel M, Reckmann I, Wieland FT. Sec24C/D-isoform-specific sorting of the preassembled ER-Golgi Q-SNARE complex. Mol Biol Cell. 2016 Sep 1;27(17):2697-707. [CrossRef]
- Adolf F, Wieland FT. Analysis of Golgi complex functions: in vitro reconstitution systems. Methods Cell Biol. 2013;118:3-14. [CrossRef]
- Adolf F, Rhiel M, Hessling B, Gao Q, Hellwig A, Béthune J, Wieland FT. Proteomic Profiling of Mammalian COPII and COPI Vesicles. Cell Rep. 2019 Jan 2;26(1):250-265.e5. [CrossRef]
- Sumya FT, Aragon-Ramirez WS, Lupashin VV. Mol Deep proteomic profiling of the intra-Golgi trafficking intermediates. Biol Cell. 2025 Jul 1;36(7):ar87. [CrossRef]
- Kweon HS, Beznoussenko GV, Micaroni M, Polishchuk RS, Trucco A, Martella O, Di Giandomenico D, Marra P, Fusella A, Di Pentima A, Berger EG, Geerts WJ, Koster AJ, Burger KN, Luini A. and Mironov AA. 2004. Golgi enzymes are enriched in perforated zones of golgi cisternae but are depleted in COPI vesicles. Mol Biol Cell. 15:4710-4724. [CrossRef]
- Beznoussenko GV, Bejan AI, Parashuraman S, Luini A, Kweon H.-S.; Mironov AA. The Diffusion Model of Intra-Golgi Transport Has Limited Power. Int J Mol Sci. 2023 Jan 10;24(2):1375. [CrossRef]
- Mironov A.A., Colanzi A., Polishchuk R.S., Beznoussenko G.V., Mironov A.A. Jr., Fusella A., Di Tullio G., Silletta M.G., Corda D., De Matteis M.A. and Luini A. 2004. Dicumarol, an inhibitor of ADP-ribosylation of CtBP3/BARS, fragments Golgi non-compact tubular zones and inhibits intra-Golgi transport. Eur. J. Cell Biol. 83:263-279.
- Ha VL, Thomas GM, Stauffer S, Randazzo PA. Preparation of myristoylated Arf1 and Arf6. Methods Enzymol. 2005;404:164-74. [CrossRef]
- Godi A, Santone I, Pertile P, Devarajan P, Stabach PR, Morrow JS, Di Tullio G, Polishchuk R, Petrucci TC, Luini A, De Matteis MA. ADP ribosylation factor regulates spectrin binding to the Golgi complex. Proc Natl Acad Sci U S A. 1998 Jul 21;95(15):8607-12. [CrossRef]
- Elkin SR, Oswald NW, Reed DK, Mettlen M, MacMillan JB, Schmid SL. Ikarugamycin: A Natural Product Inhibitor of Clathrin-Meiated Endocytosis. Traffic. 2016 Oct;17(10):1139-49. [CrossRef]
- Barnard RJ, Morgan A. and Burgoyne RD. 1996. Domains of alpha-SNAP required for the stimulation of exocytosis and for N-ethylmalemide-sensitive fusion protein (NSF) binding and activation. Mol Biol Cell. 7:693-701.
- German CL, Howe CL. Preparation of biologically active subcellular fractions using the Balch homogenizer. Anal Biochem. 2009 Nov 1;394(1):117-24. [CrossRef]
- Beznoussenko GV, Pilyugin SS, Geerts WJ, Kozlov MM, Burger KN, Luini A, Derganc J, Mironov AA. 2015. Trans-membrane area asymmetry controls the shape of cellular organelles. Int J Mol Sci. 16(3):5299-5333. [CrossRef]
- Yang JS, Lee SY, Gao M, Bourgoin S, Randazzo PA, Premont RT, Hsu VW. 2002. ARFGAP1 promotes the formation of COPI vesicles, suggesting function as a component of the coat. J Cell Biol. 159(1):69-78.
- Marsh, B. J., Mastronarde, D. N., Buttle, K. F., Howell, K. E., and McIntosh, J. R. (2001). Organellar relationships in the Golgi region of pancreatic beta cell line, HIT-T15, visualized by high resolution electron tomography. Proc. Natl. Acad. Sci. U.S.A. 98, 2399–2406. [CrossRef]
- 1Beznoussenko, G. V., Parashuraman, S., Rizzo, R., Polishchuk, R., Martella, O., Di Giandomenico, D., et al. (2014). Transport of soluble proteins through the Golgi occurs by diffusion via continuities across cisternae. Elife 3:e02009. [CrossRef]
- Mironov, A. A. Jr.; Mironov, A. A. Estimation of subcellular organelle volume from ultrathin sections through centrioles with a discretized version of vertical rotator. J. Microsc. 1998, 192, 29-36. [CrossRef]
- Vetterlein, M., Ellinger, A., Neumuller, J.; Pavelka, M. Golgi apparatus and TGN during endocytosis. Histochem Cell Biol. 2002, 117:143-150.
- Beznoussenko GV, Pilyugin SS, Geerts WJ, Kozlov MM, Burger KN, Luini A, Derganc J, Mironov AA. 2015. Trans-membrane area asymmetry controls the shape of cellular organelles. Int J Mol Sci. 16(3):5299-5333. [CrossRef]
- Kaiser, C. A.; Schekman, R. Distinct sets of SEC genes govern transport vesicle formation and fusion early in the secretory pathway. Cell 1990, 61, 723–733. [CrossRef]
- Barlowe, C., Orci, L., Yeung, T., Hosobuchi, M., Hamamoto, S., Salama, N., Rexach, M.F., Ravazzola, M.; Amherdt, M.; Schekman, R. COPII: a membrane coat formed by Sec proteins that drive vesicle budding from the endoplasmic reticulum. Cell 1994, 77, 895–907. [CrossRef]
- Bednarek, S. Y., Ravazzola, M., Hosobuchi, M., Amherdt, M., Perrelet, A., Schekman, R., et al. COPI- and COPII-coated vesicles bud directly from the endoplasmic reticulum in yeast. Cell 1995, 83, 1183–1196. [CrossRef]
- Sesorova IS, Karelina NR, Kazakova TE, Parashuraman S, Zdorikova MA, Dimov ID, Seliverstova EV, Beznoussenko GV, Mironov AA. 2020. Structure of the enterocyte transcytosis compartments during lipid absorption. Histochem Cell Biol. 2020 Jun;153(6):413-429. [CrossRef]
- Peters A, Palay SL, Webster H. Fine Structure of the Nervous System: Neurons and Their Supporting Cells. Oxford, New York Toronto. Oxford University Press. 3 edition. (1991) 528 pages.
- Mironov AA, Sesorova IS, Vavilov PS, Longoni R, Briata P, Gherzi R, Beznoussenko GV. Structure of the Secretory Compartments in Goblet Cells in the Colon and Small Intestine. Cells. 2025 Jul 31;14(15):1185. [CrossRef]
- Mironov AA, Sesorova IS, Vavilov PS, Longoni R, Briata P, Gherzi R, Beznoussenko GV. Structure of the Secretory Compartments in Goblet Cells in the Colon and Small Intestine. Cells. 2025 Jul 31;14(15):1185. [CrossRef]
- Orci L, Malhotra V, Amherdt M, Serafini T, Rothman JE. Dissection of a single round of vesicular transport: sequential intermediates for intercisternal movement in the Golgi stack. Cell. 1989 Feb 10;56(3):357-68. [CrossRef]
- Rexach MF, Latterich M, Schekman RW. Characteristics of endoplasmic reticulum-derived transport vesicles. J Cell Biol. 1994 Sep;126(5):1133-48. [CrossRef]
- Cosson, P.; Letourneur, F. 1994. Coatomer interaction with di-lysine endoplasmic reticulum retention motif. Science 263:1629-1631.
- Bannykh, S. I., Rowe, T.; Balch, W. E. The organization of endoplasmic reticulum export complexes. J. Cell. Biol. 1996, 135, 19–35. [CrossRef]
- Cosson P, Amherdt M, Rothman JE, Orci L. A resident Golgi protein is excluded from peri-Golgi vesicles in NRK cells. Proc Natl Acad Sci U S A. 2002 Oct 1;99(20):12831-4. [CrossRef]
- German CL, Howe CL. Preparation of biologically active subcellular fractions using the Balch homogenizer. Anal Biochem. 2009 Nov 1;394(1):117-24. [CrossRef]
- Orci, L.; Amherdt, M., Ravazzola, M., Perrelet, A., and Rothman, J. E. (2000a). Exclusion of Golgi residents from transport vesicles budding from Golgi cisternae in intact cells. J. Cell. Biol. 150, 1263–1270. [CrossRef]
- Volchuk A, Ravazzola M, Perrelet A, Eng WS, Di Liberto M, Varlamov O, Fukasawa M, Engel T, Söllner TH, Rothman JE, Orci L. Countercurrent distribution of two distinct SNARE complexes mediating transport within the Golgi stack. Mol Biol Cell. 2004 Apr;15(4):1506-18. [CrossRef]
- Jokitalo, E., Cabrera-Poch, N., Warren, G., and Shima, D.T. 2001. Golgi clusters and vesicles mediate mitotic inheritance independently of the endoplasmic reticulum. J. Cell Biol. 154(2):317-330.
- Gaietta GM, Giepmans BN, Deerinck TJ, Smith WB, Ngan L, Llopis J, Adams SR, Tsien RY, Ellisman MH. Golgi twins in late mitosis revealed by genetically encoded tags for live cell imaging and correlated electron microscopy. Proc Natl Acad Sci U S A. 2006 Nov 21;103(47):17777-82. [CrossRef]
- Martinez-Menárguez, J. A., Prekeris, R., Oorschot, V. M., Scheller, R., Slot, J. W., Geuze, H. J., et al. Peri-Golgi vesicles contain retrograde but not anterograde proteins consistent with the cisternal progression model of intra-Golgi transport. J. Cell. Biol. 2001, 155, 1213–1224. [CrossRef]
- Mandon EC, Milla ME, Kempner E, Hirschberg CB: Purification of the Golgi adenosine 30-phosphate 50-phosphosulfate transporter, a homodimer within the membrane. Proc Natl Acad Sci U S A 1994, 91:10707-10711.
- Puglielli L, Hirschberg C: Reconstitution, identification, and purification of the rat liver Golgi membrane GDP-fucose transporter. J Biol Chem 1999, 274:35596-35600.
- Puglielli, L., Mandon, E. C., Rancour, D. M., Menon, A. K., and Hirschberg, C. B. (1999) Identification and purification of the rat liver Golgi membrane UDP-N-acetylgalactosamine transporter. J Biol Chem. 274: 4474-4479.
- Parker JL, Newstead S. 2019. Gateway to the Golgi: molecular mechanisms of nucleotide sugar transporters. Curr Opin Struct Biol. 2019 Aug;57:127-134. [CrossRef]
- Maszczak-Seneczko D, Wiktor M, Skurska E, Wiertelak W, Olczak M. Delivery of Nucleotide Sugars to the Mammalian Golgi: A Very Well (un)Explained Story. Int J Mol Sci. 2022 Aug 3;23(15):8648. [CrossRef]
- Weidman P, Roth R, Heuser J. Golgi membrane dynamics imaged by freeze-etch electron microscopy: views of different membrane coatings involved in tubulation versus vesiculation. Cell 1993, 75(1), 123-133. 80089-80093.
- Mossessova, E., Bickford, L.C., and Goldberg, J. SNARE selectivity of the COPII coat. Cell. 2003, 114:483–495. [CrossRef]
- Khamatgalimov AR, Kovalenko VI. Substructural Approach for Assessing the Stability of Higher Fullerenes. Int J Mol Sci. 2021 Apr 4;22(7):3760. [CrossRef]
- Khamatgalimov AR, Idrisov RI, Kamaletdinov II, Kovalenko VI. Open-shell nature of non-IPR fullerene С40: isomers 29 (C2) and 40 (Td). J Mol Model. 2021 Jan 7;27(2):22. [CrossRef]
- den Otter WK, Briels WJ. The generation of curved clathrin coats from flat plaques. Traffic. 2011 Oct;12(10):1407-16. [CrossRef]
- Fotin A, Cheng Y, Grigorieff N, Walz T, Harrison SC, Kirchhausen T. Structure of an auxilin-bound clathrin coat and its implications for the mechanism of uncoating. Nature. 2004 Dec 2;432(7017):649-53. [CrossRef]
- Fotin A, Cheng Y, Sliz P, Grigorieff N, Harrison SC, Kirchhausen T, Walz T. Molecular model for a complete clathrin lattice from electron cryomicroscopy. Nature. 2004 Dec 2;432(7017):573-9. [CrossRef]
- Kukulski W, Schorb M, Kaksonen M, Briggs JA: 2012. Plasma membrane reshaping during endocytosis is revealed by time-resolved electron tomography. Cell. 150:508-520.
- Kukulski W, Schorb M, Welsch S, Picco A, Kaksonen M, Briggs JA. 2011. Correlated fluorescence and 3D electron microscopy with high sensitivity and spatial precision. J Cell Biol. 192(1):111-119.
- Ostermann J. 2001. Stoichiometry and kinetics of transport vesicle fusion with Golgi membranes. EMBO Rep. 2(4):324-329.
- Sonnichsen, B., Lowe, M., Levine, T., Jamsa, E., Dirac-Svejstrup, A.B., Warren, G. 1998. A role for Giantin in docking COPI vesicles to Golgi membranes. J. Cell Biol. 140:1013–1021.
- Malhotra V.; Serafini T, Orci L, Shepherd JC, Rothman JE. Purification of a novel class of coated vesicles mediating biosynthetic protein transport through the Golgi stack. Cell. 1989 Jul 28;58(2):329-36. [CrossRef]
- Adolf F, Rhiel M, Hessling B, Gao Q, Hellwig A, Béthune J, Wieland FT. Proteomic Profiling of Mammalian COPII and COPI Vesicles. Cell Rep. 2019 Jan 2;26(1):250-265.e5. [CrossRef]
- Vasile E, Oka T, Ericsson M, Nakamura N, Krieger M. IntraGolgi distribution of the Conserved Oligomeric Golgi (COG) complex. Exp Cell Res. 2006 Oct 1;312(16):3132-3141. [CrossRef]
- Eckert ES, Reckmann I, Hellwig A, Röhling S, El-Battari A, Wieland FT, Popoff V. Golgi phosphoprotein 3 triggers signal-mediated incorporation of glycosyltransferases into coatomer-coated (COPI) vesicles. J. Biol. Chem. 2014, 289, 31319-31329. [CrossRef]
- Oka T, Vasile E, Penman M, Novina CD, Dykxhoorn DM, Ungar D, Hughson FM, Krieger M. Genetic analysis of the subunit organization and function of the conserved oligomeric golgi (COG) complex: studies of COG5- and COG7-deficient mammalian cells. J Biol Chem. 2005 Sep 23;280(38):32736-45. [CrossRef]
- Bailey Blackburn J, Pokrovskaya I, Fisher P, Ungar D, Lupashin VV. 2016. COG Complex Complexities: Detailed Characterization of a Complete Set of HEK293T Cells Lacking Individual COG Subunits. Front Cell Dev Biol. 2016 Mar 30;4:23. [CrossRef]
- Shin JJH, Crook OM, Borgeaud AC, Cattin-Ortolá J, Peak-Chew SY, Breckels LM, Gillingham AK, Chadwick J, Lilley KS, Munro S. Spatial proteomics defines the content of trafficking vesicles captured by golgin tethers. Nat Commun. 2020 Nov 25;11(1):5987. [CrossRef]
- Wong M, Munro S. Membrane trafficking. The specificity of vesicle traffic to the Golgi is encoded in the golgin coiled-coil proteins. Science. 2014 Oct 31;346(6209):1256898. [CrossRef]
- Welch LG, Peak-Chew SY, Begum F, Stevens TJ, Munro S. GOLPH3 and GOLPH3L are broad-spectrum COPI adaptors for sorting into intra-Golgi transport vesicles. J Cell Biol. 2021 Oct 4;220(10):e202106115. [CrossRef]
- Rexach MF, Schekman RW. Distinct biochemical requirements for the budding, targeting, and fusion of ER-derived transport vesicles. J Cell Biol. 1991 Jul;114(2):219-29. [CrossRef]
- Ktistakis NT, Brown HA, Waters MG, Sternweis PC, Roth MG. Evidence that phospholipase D mediates ADP ribosylation factor-dependent formation of Golgi coated vesicles. J Cell Biol. 1996 Jul;134(2):295-306. [CrossRef]
- Stamnes M, Schiavo G, Stenbeck G, Söllner TH, Rothman JE. ADP-ribosylation factor and phosphatidic acid levels in Golgi membranes during budding of coatomer-coated vesicles. Proc Natl Acad Sci U S A. 1998 Nov 10;95(23):13676-80. [CrossRef]
Figure 1.
Examples of vesicles with different diameters in HeLa (A-F, I-V), COS-7 (W-Z), and HepG2 (G, H) cells. (A, E) High pressure freezing. (B, C, F, J, T, U) Labelling for EGF conjugated with 10 nm gold. (D, I) Labelling of endosomes with WGA conjugated with peroxidase. (G, H, K, L, R) Routine TEM. (M, N, O, S) Cryosections. (Q, V, W) EM tomography. Diameters of round profiles are indicated on images. Diameter of gold particles is equal to 10 nm. The thickness of clathrin coat in all images is equal to 18 nm. arrow in [Z]) is equal to 24.5 nm. (W) Serial tomo-slices of the 70-nm clathrin-coated vesicle (red arrows) in COS-7 cell. Scale bars: 100 nm (size is indicated on images).
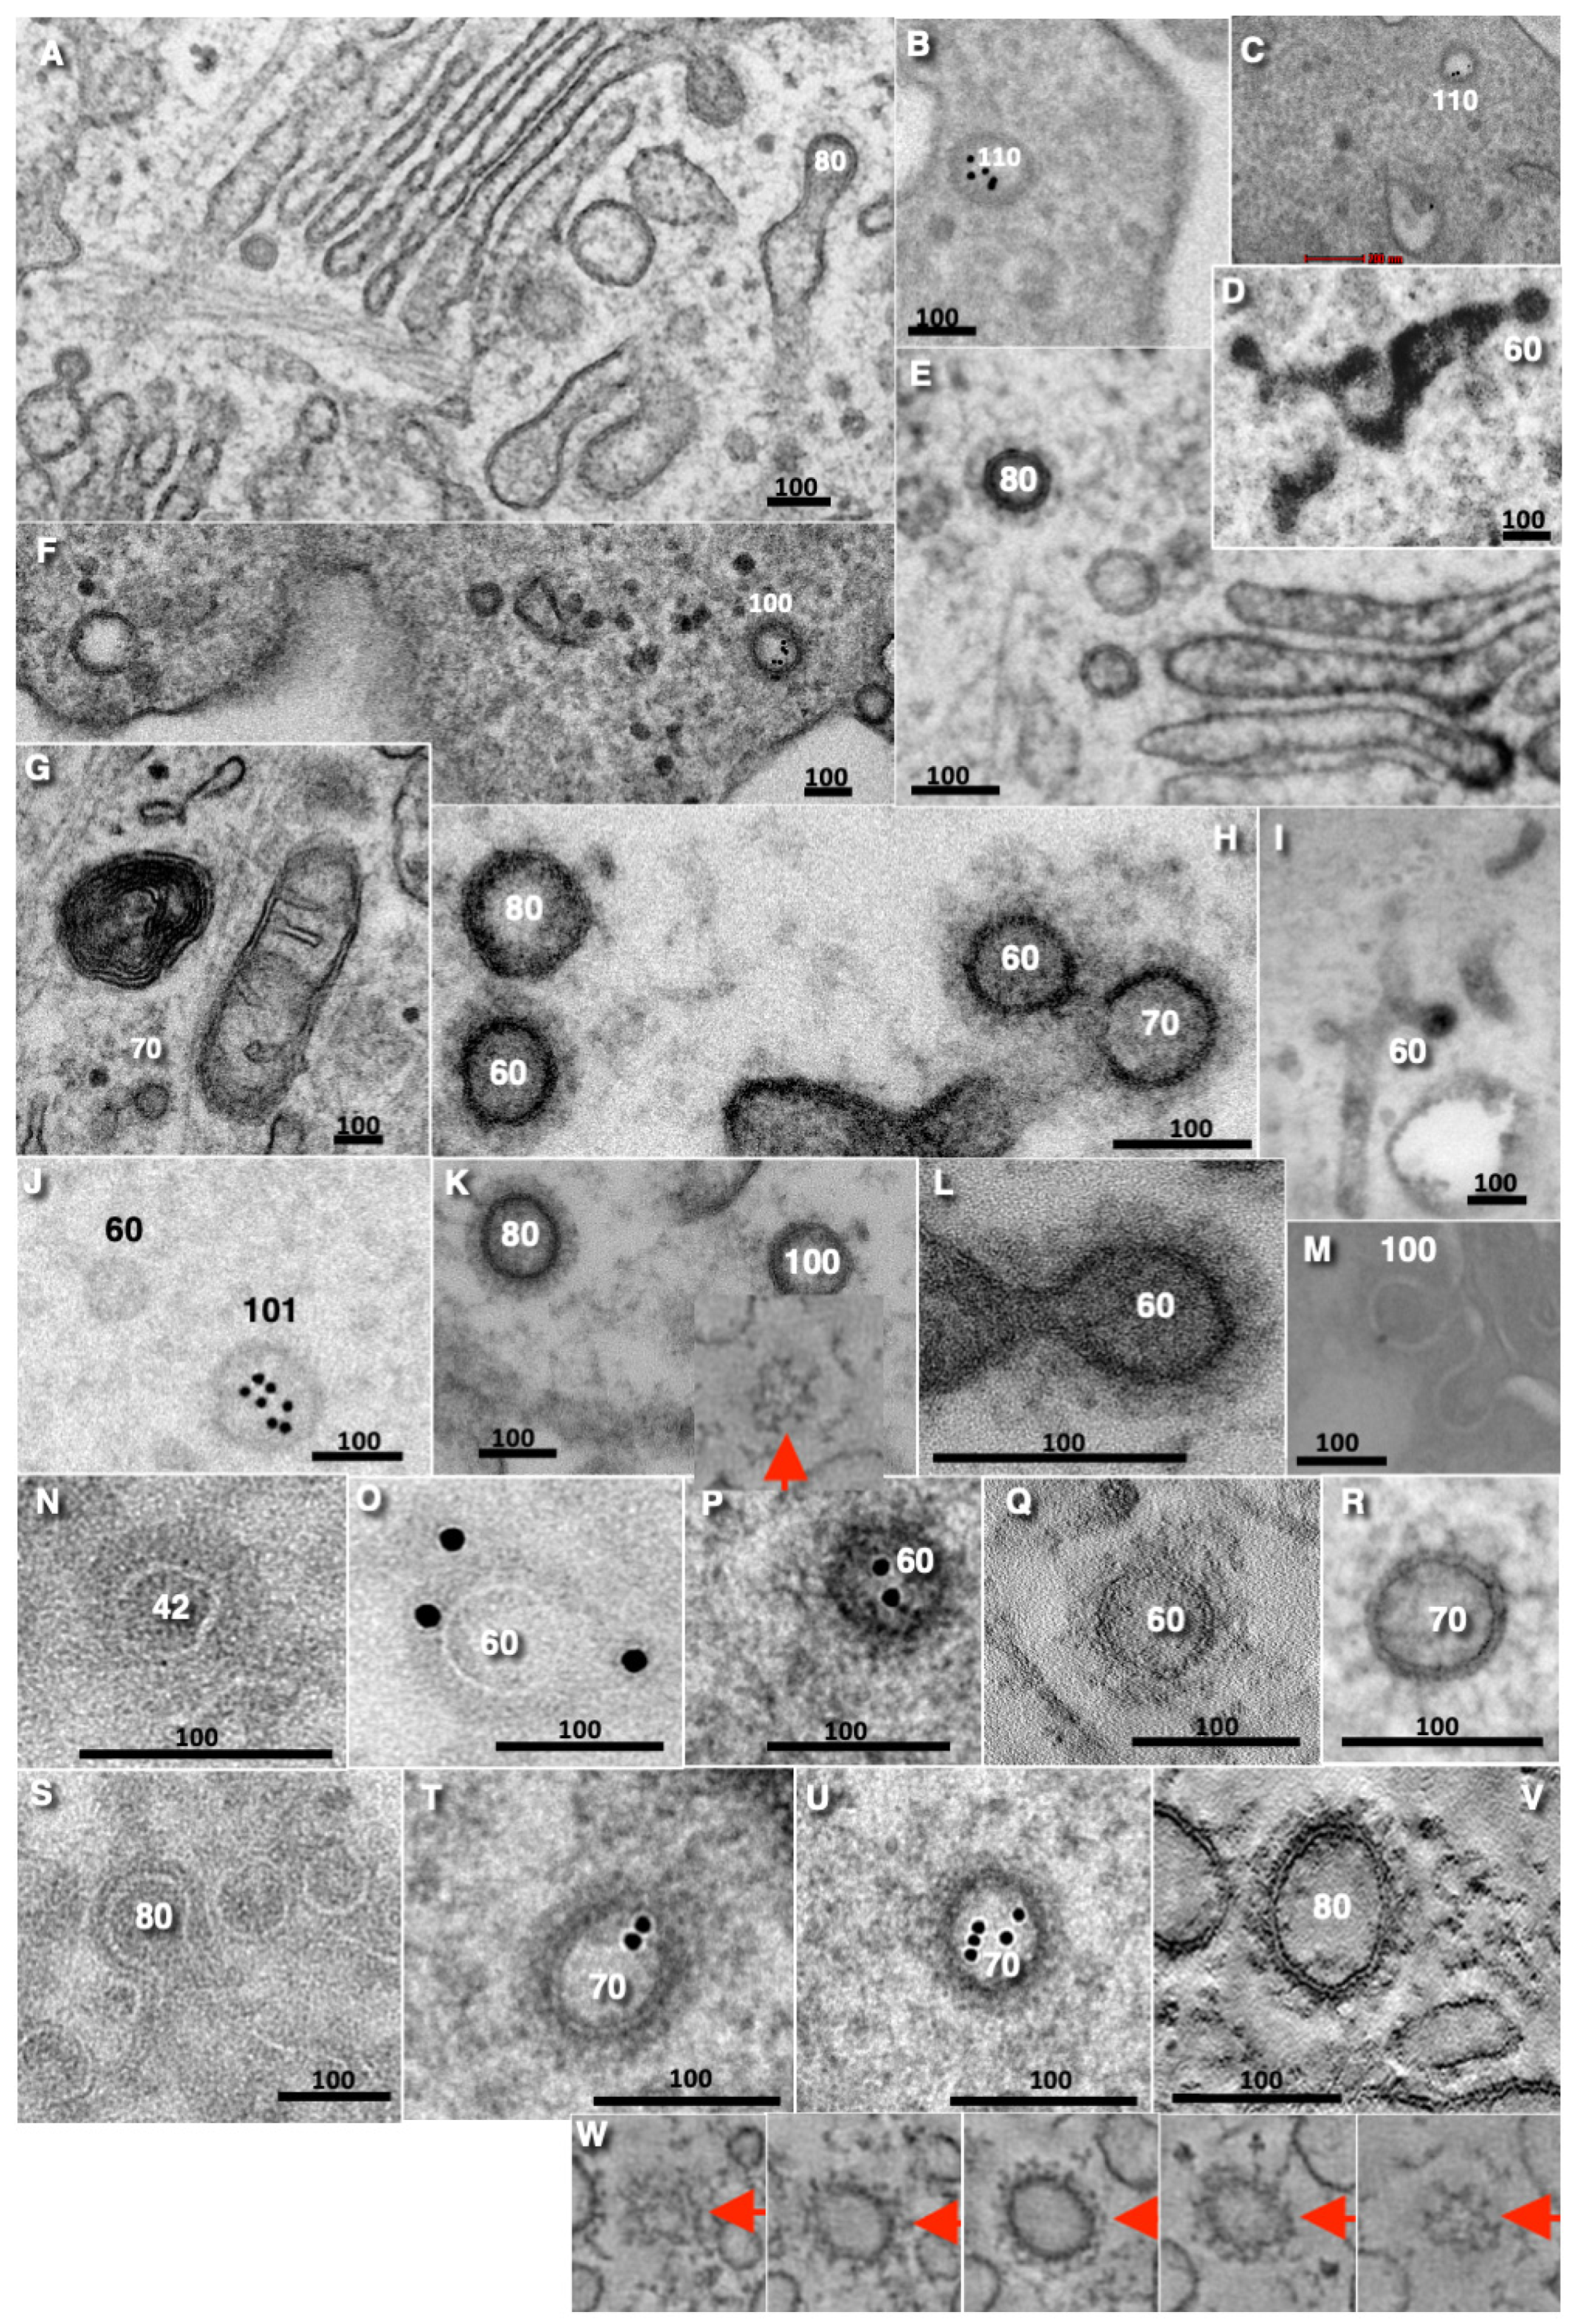
Figure 2.
Size of different cell vesicles. (A, B) Distribution of diameters of the cell vesicles in HeLa (A) and COS-7 (B) cells. The 42-nm vesicles in HeLa cells are present whereas in COS-7 cells these vesicles are very rarely seen. (C) Treatment of cells with NEM, subsequent washing, warming and incubation at 37ºC for 3 min, the proportion of the 52-nm vesicles increased. (D) In cells incubated after the NEM treatments in the presence of brefeldin A, the speed of the formation of the 52-nm vesicle became lower than that of other vesicles. (E) The section of ERES. Nanogold labelling. The absence of Sec22 nano-gold labelling over the ERES 52 nm round profiles (red arrows, see also Figure S4C). (F-J) Distribution of diameters of ERES free vesicles and buds. (F) ERES COPI-coated buds. (G) ERES COPI-coated buds. (I), Golgi free vesicles. (J) Golgi COPI-coated buds in HeLa cells. (K) Accumulation of WGA-HRP in the trans-most-cisternae after incubation of cells with WGA-HRP for 30 min. (L) In cells, treated with NEM and examined in 1 min, there is accumulation of the 52-nm vesicles mostly near the Golgi (red arrow) and in less extent near ERES (green arrow). (M) Cells treated with WGA-HRP for 30 min, then incubated with NEM and next examined in 1 min after the NEM washout. Red arrows show clathrin-coated the 42-nm vesicle. (N) In cells, treated with NEM and examined in 3 min in the presence of IKA blocking endocytosis, the Golgi is completely transformed into the 52-nm vesicles. (O) Cells processed as in (M) but incubated after the NEM treatment in the presence of brefeldin A. Accumulation of WGA–positive vesicles and tubulation of the Golgi. Scale bars (nm): 600 (J, L-O); 1000 (K); size is shown in images.
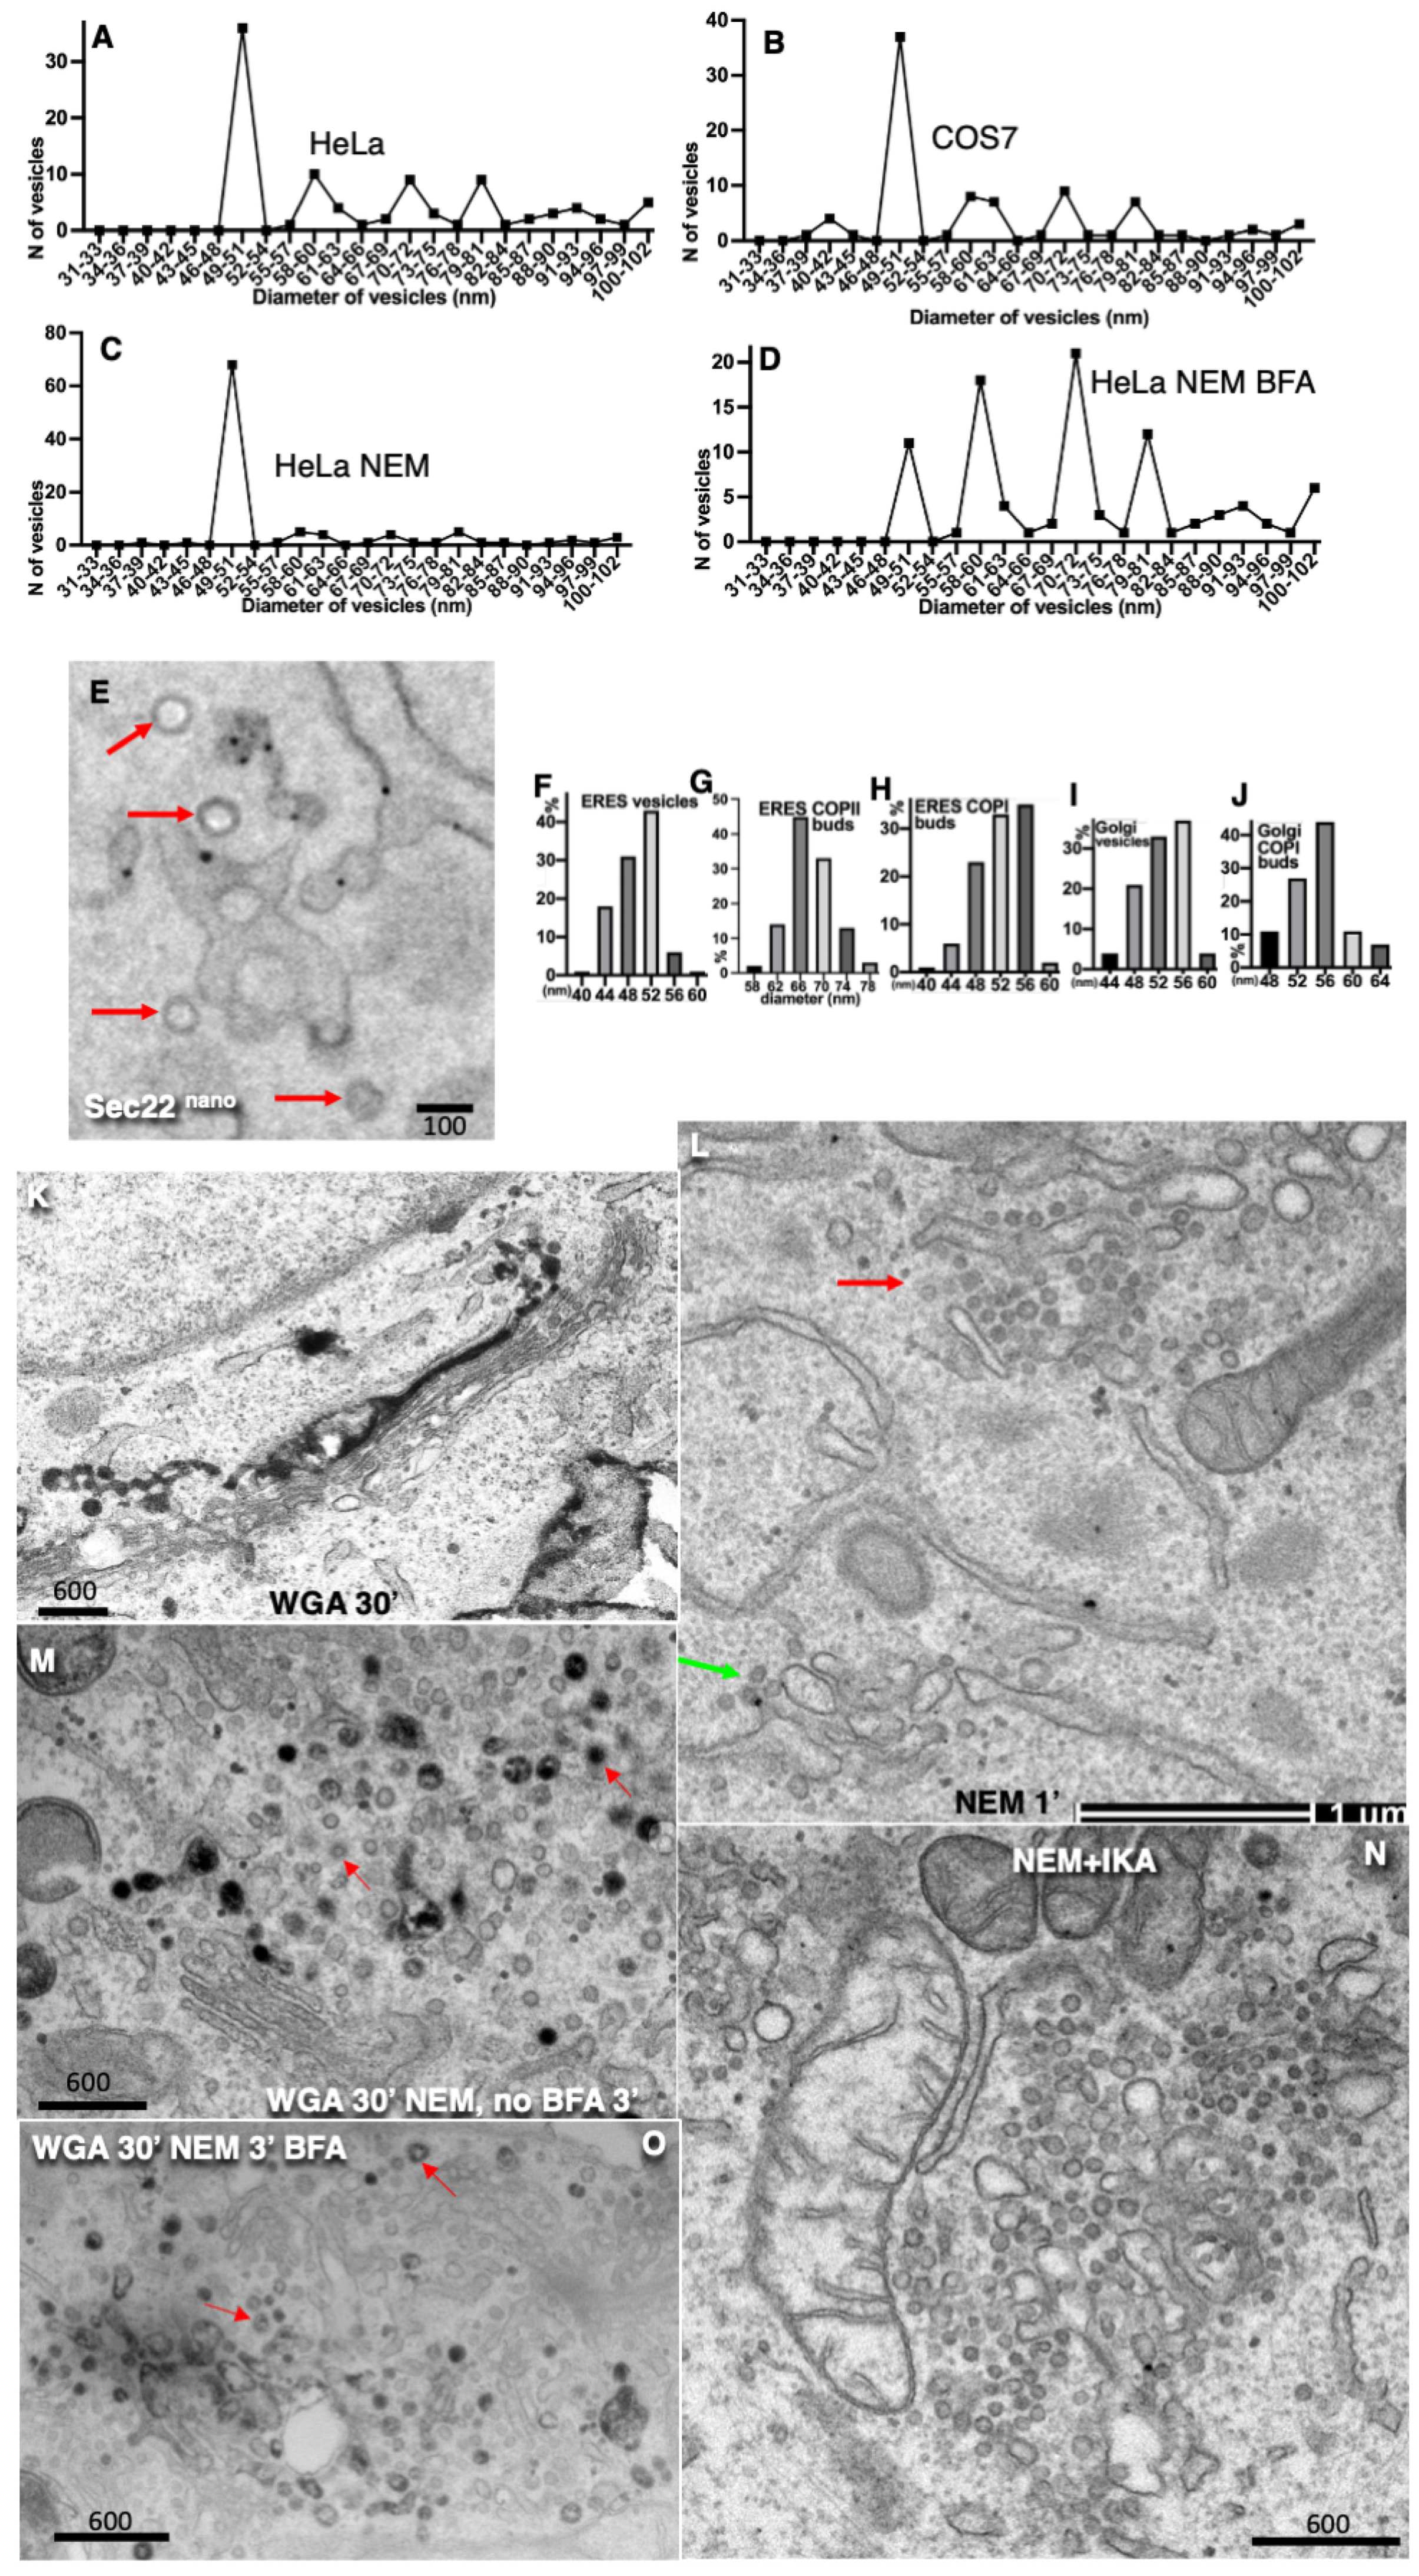
Figure 3.
Vesicles accumulated after the NEM treatment in COS-7 (A, E) and HeLa (others) cells are depleted in Golgi enzymes and nucleotide sugar transporters but enriched in GS27. resident proteins. (A) Accumulation of WGA-HRP (DAB)-positive vesicles after incubation with WGA-HRP (15 min), then NEM and next BFA. Green arrows show the 42 nm clathrin-coated vesicles and buds. (B) Accumulation of WGA-HRP (DAB)-positive vesicles after incubation with WGA-HRP (15 min) and NEM and next brefeldin A. Green arrows show the clathrin-coated (completely and partially) round profiles. (C) Microinjection of antibodies against COG4. Low level of the accumulation of the 52-nm vesicles. Diameter of most vesicles is larger than 55 nm. (D-F) The 52-nm vesicles accumulated under the action of NEM is positive for GS27 (D; nanogold), GS8 (E; nanogold) and SNAP29 (F; nanogold). (G-J) The 52-nm vesicles accumulated (red arrows) under the action of NEM are depleted in Golgi enzymes (G, H, J) and sugar transporters (G, I). Cryosection based IEM (G-I) and peroxidase-based IEM (J). Markers and gold size are shown on images. Scale bars (nm): 200 (A-H), 100 (I, J); size is shown in images.
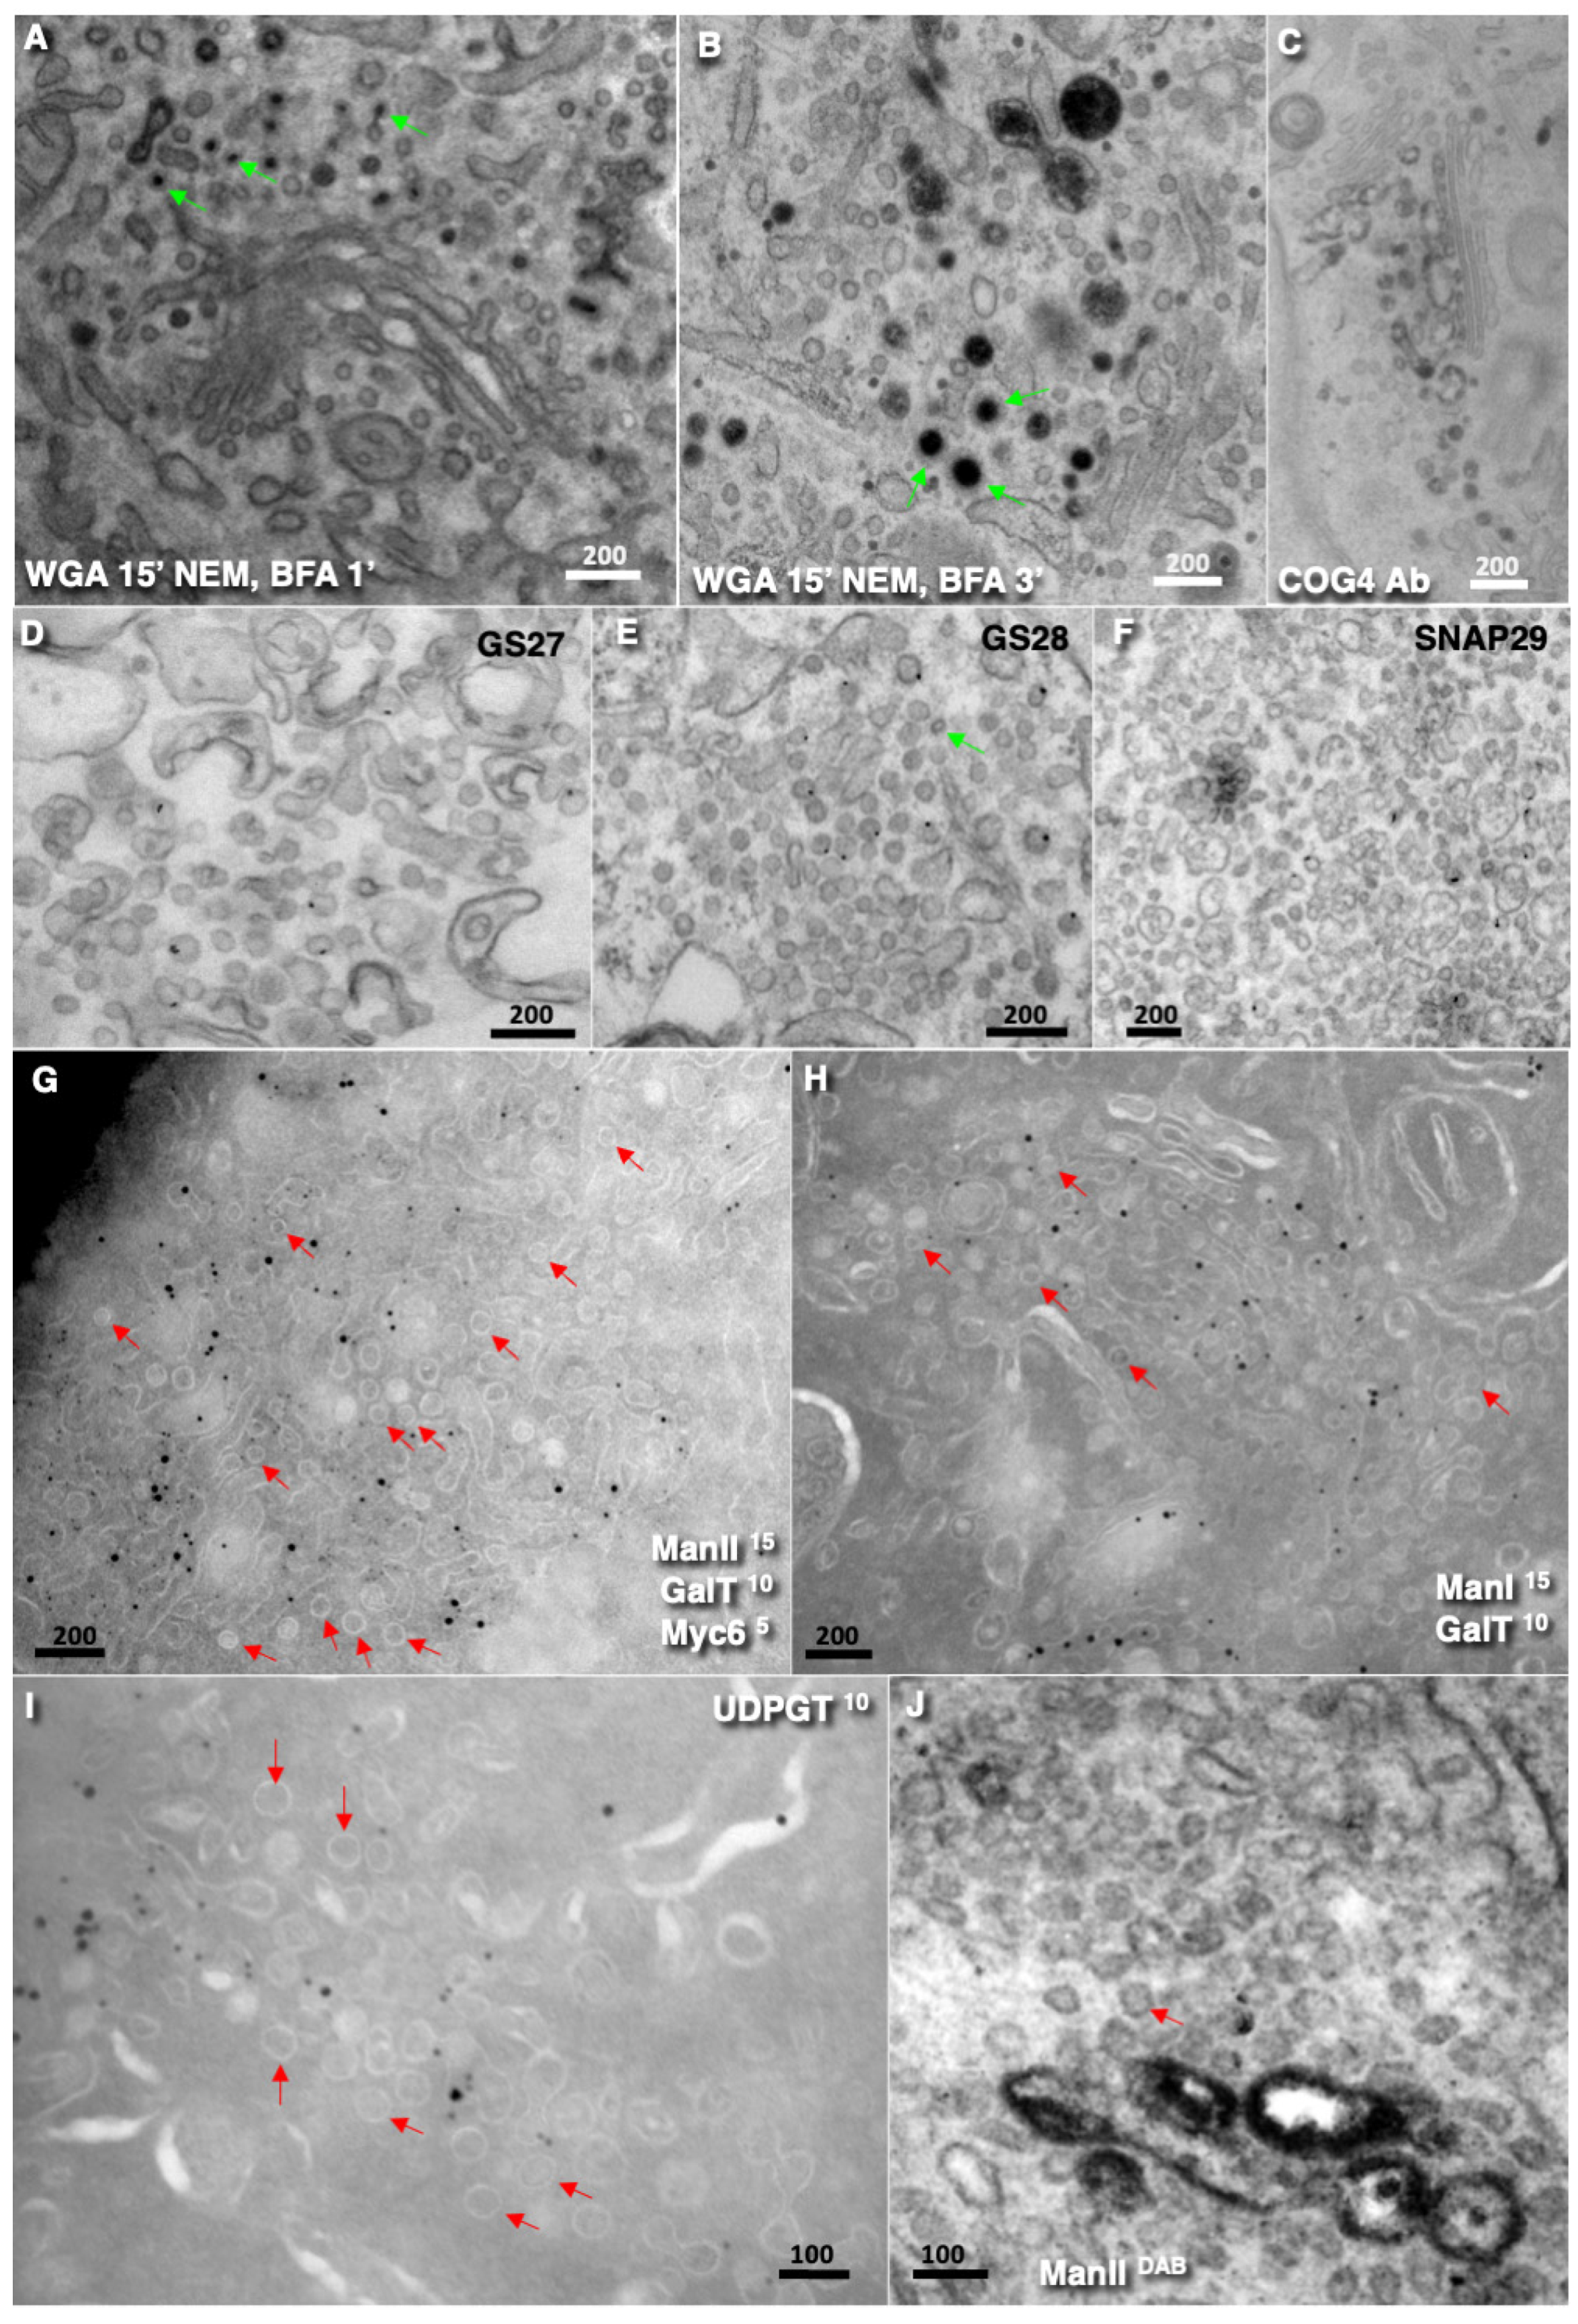
Figure 4.
Structure of the pellet formed after centrifugation of vesicular fractions. (A) The vesicular fraction from cells incubated for 3 min after NEM treatment with NEM. The 52-nm uncoated vesicles are indicated in the red box. (B) The mixture of vesicles formed in the presence of GTPgS and GTP. COPI-coated vesicles are shown in green box. (C) The pellet of the vesicular fraction obtained from normal cells. (D) The pellet of the vesicular fraction obtained from cells incubated with NEM for 1 min. Cryosection. (D-G, I) Depletion of markers, namely, Golgi enzymes and nucleotide sugar transporters, in the 52-nm round profiles. (H, J) Enrichment of GS27 (H), and GS28 (J) over the 52-nm round profiles. (K, L) No labelling for Sec22 is observed over round profiles in the vesicular fraction. (M, N) Labelling density of different markers in normal COS-7 cells (N) and in the vesicular fraction obtained from them (N). Gold labelling for Golgi enzymes and nucleotide sugar transporters (see indications on images: D-G, I, M, N), Sec22 (K, L, M. N), GS27 (H, M, N), and GS28 (J, M, N) over the 52-nm round profiles. Scale bars (nm): 200 (A); 100 (others); size is shown in images.
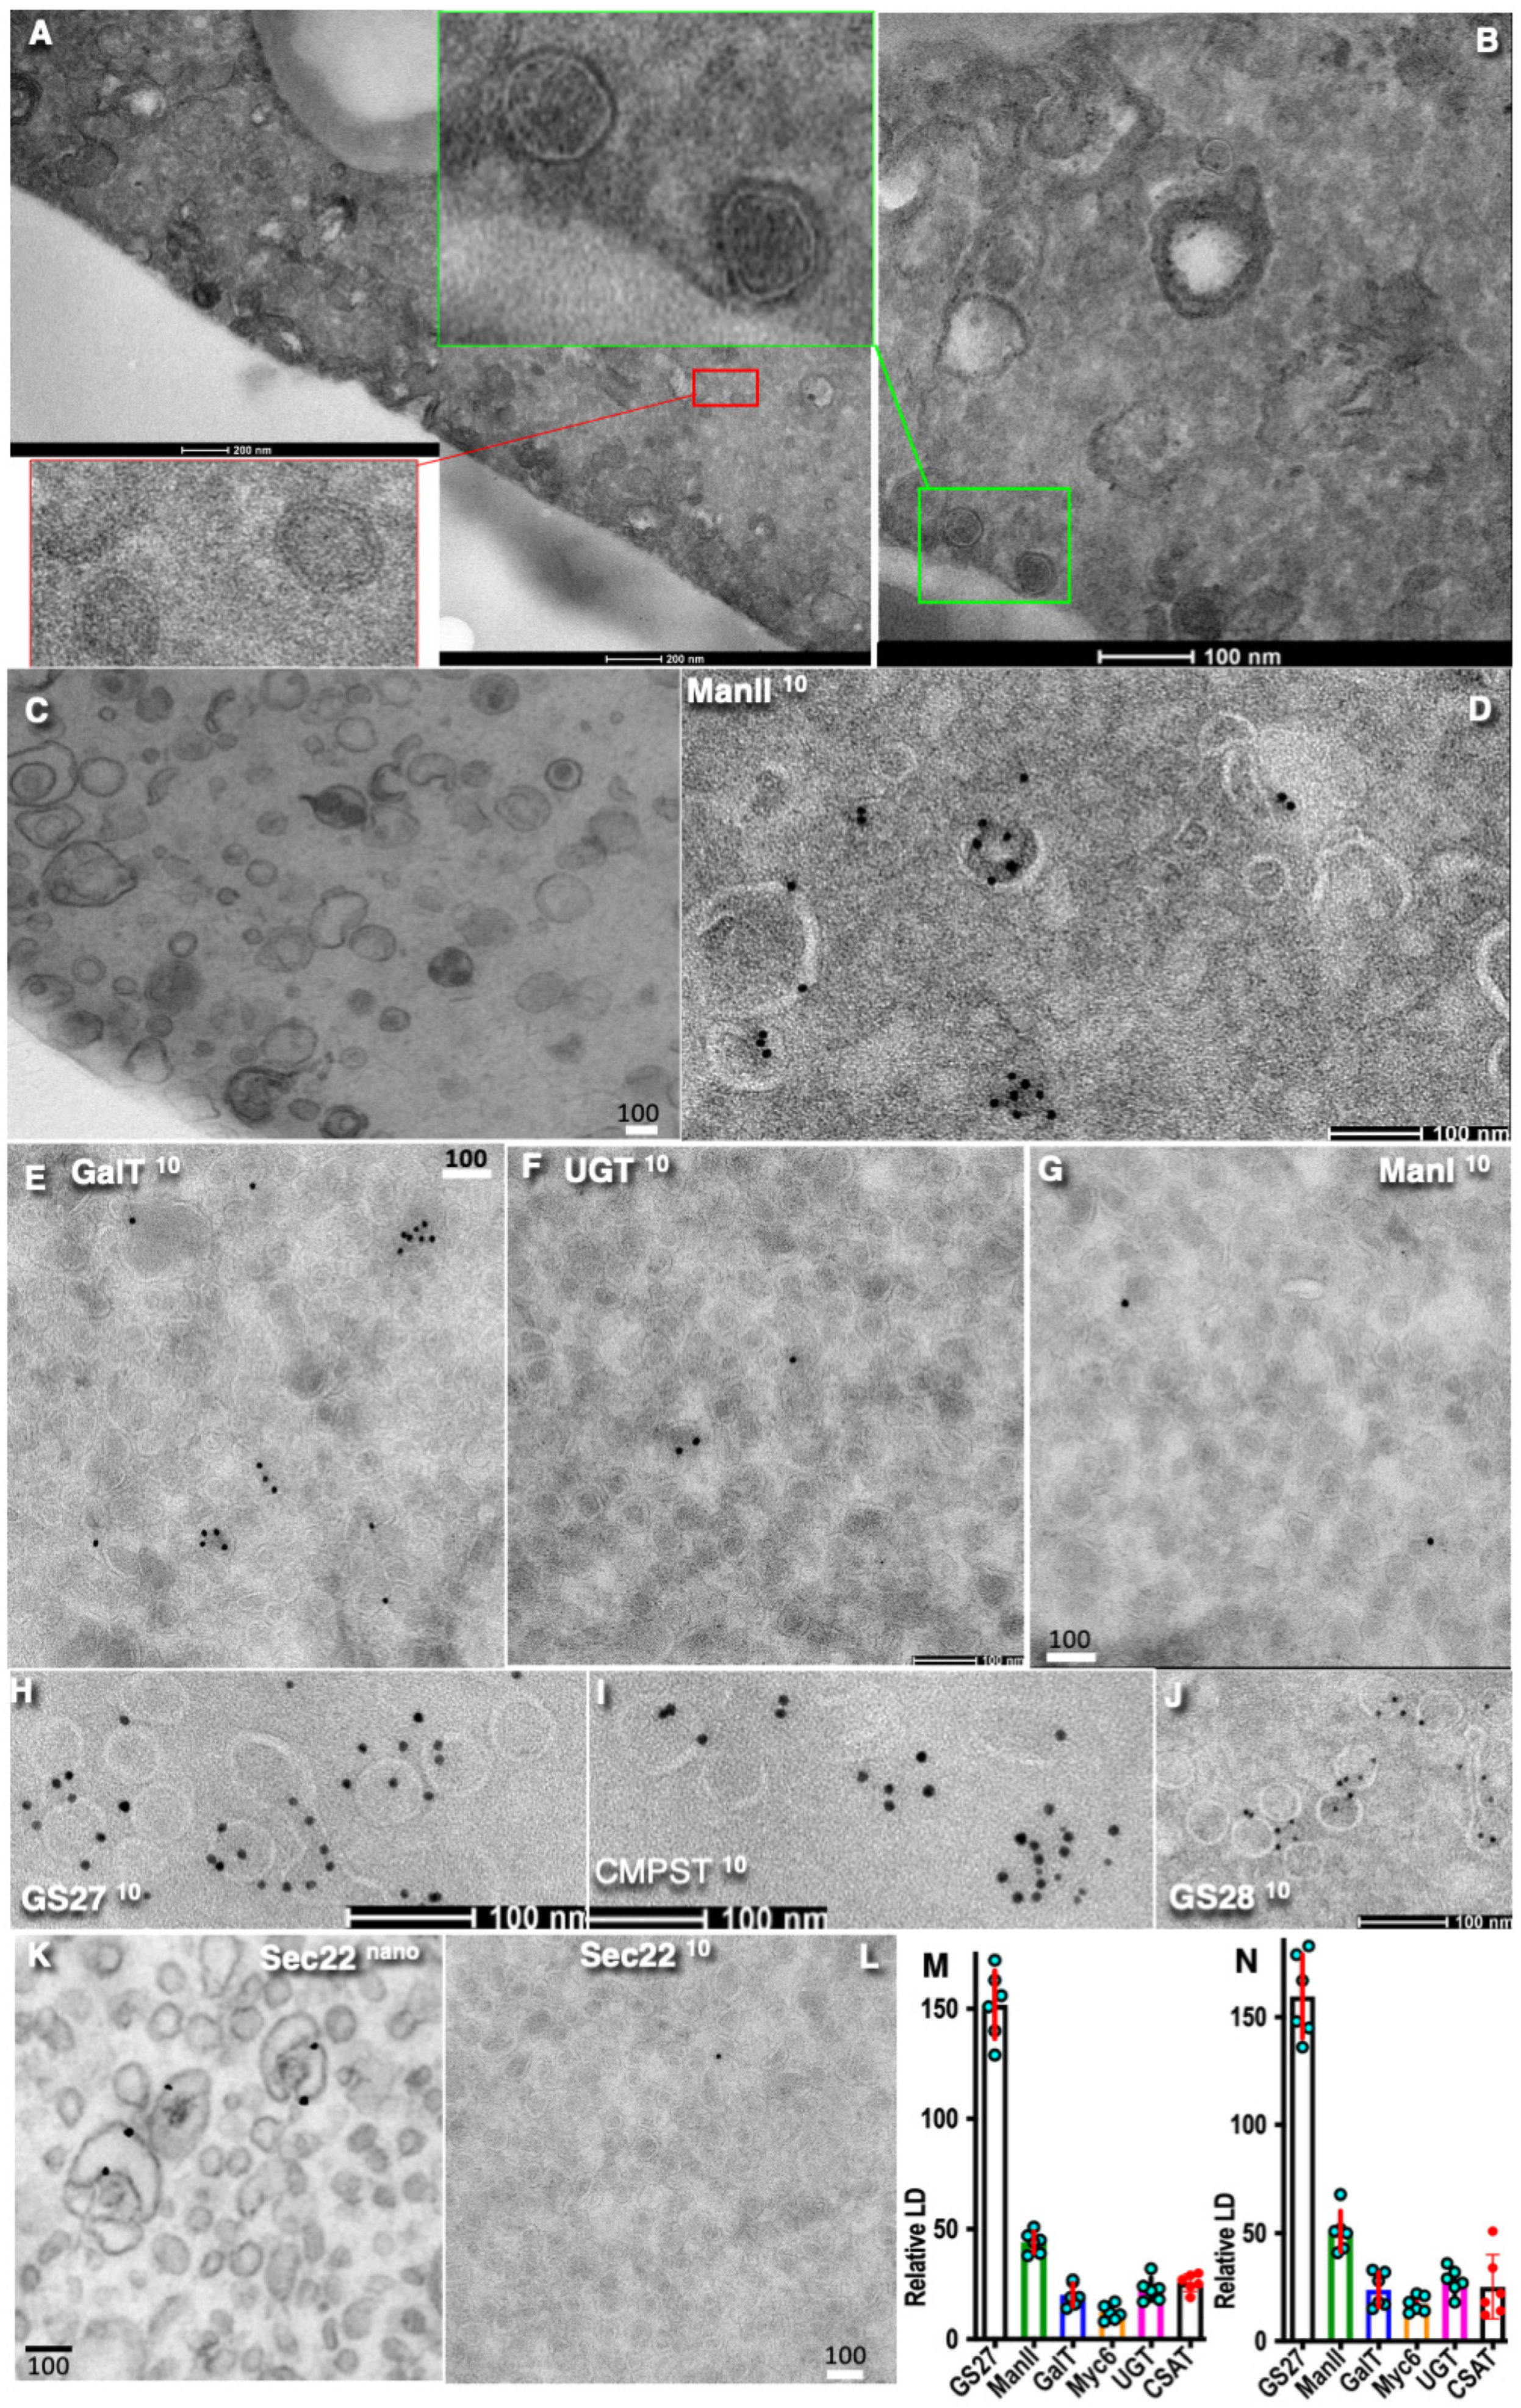
Figure 5.
Structure of the pellet formed after centrifugation of different vesicular fractions. Routine transmission EM (A, H-O). Labelling with nanogold (B, F). Cryosections (C-E, G). (A) The purity of the isolated Golgi. (B) The vesicular fraction from cells incubated for 3 min after NEM treatment with NEM. The 52-nm uncoated vesicles are indicated in the red box. (B) Presence of GS27 over the 52-nm round profiles. (C) Labelling for clathrin over the coat surrounding round profile (green arrows). (D) Depletion of the NST, namely, CMPST over the 52-nm round profiles. (E) Depletion of the nucleotide sugar transporters tagged with Myc6 (see Methods) over the 52-nm vesicles. (F, G) Depletion of ManII over round profiles but enrichment in other Golgi membranes. (H-K) Isolation of the 52-mnm Golgi vesicles with magnetic beads (red arrows) and antibodies against GS27. Not only the 52-nm vesicles are isolated (green arrows) but also remnants of Golgi cisternae (blue arrows) are isolated. (L) The vesicular fraction used for experiments with ARf1 and sequential binds. (M) Incubation of the vesicular fraction with cytosol induced formation of the 52-nm vesicles (green arrows). (N) After incubation of Golgi mem brans with Arf1 (at 37˚C) and then with COPI on ice, the COOPI-coated buds were not found. (O) Incubation of the above-mentioned membranes at 37˚C without addition of proteins induced formation of COPI-coated buds (magenta arrows). (P) The percentage of cisternal remnants in the pellet of the vesicular fraction obtained after treatment of cells with NEM and consecutive incubation at 37 ˚C for the time indicated on the graph. After more prolonged incubation these cisternal remnants were observed more often. Scale bars (nm): the length of bars is shown in images.
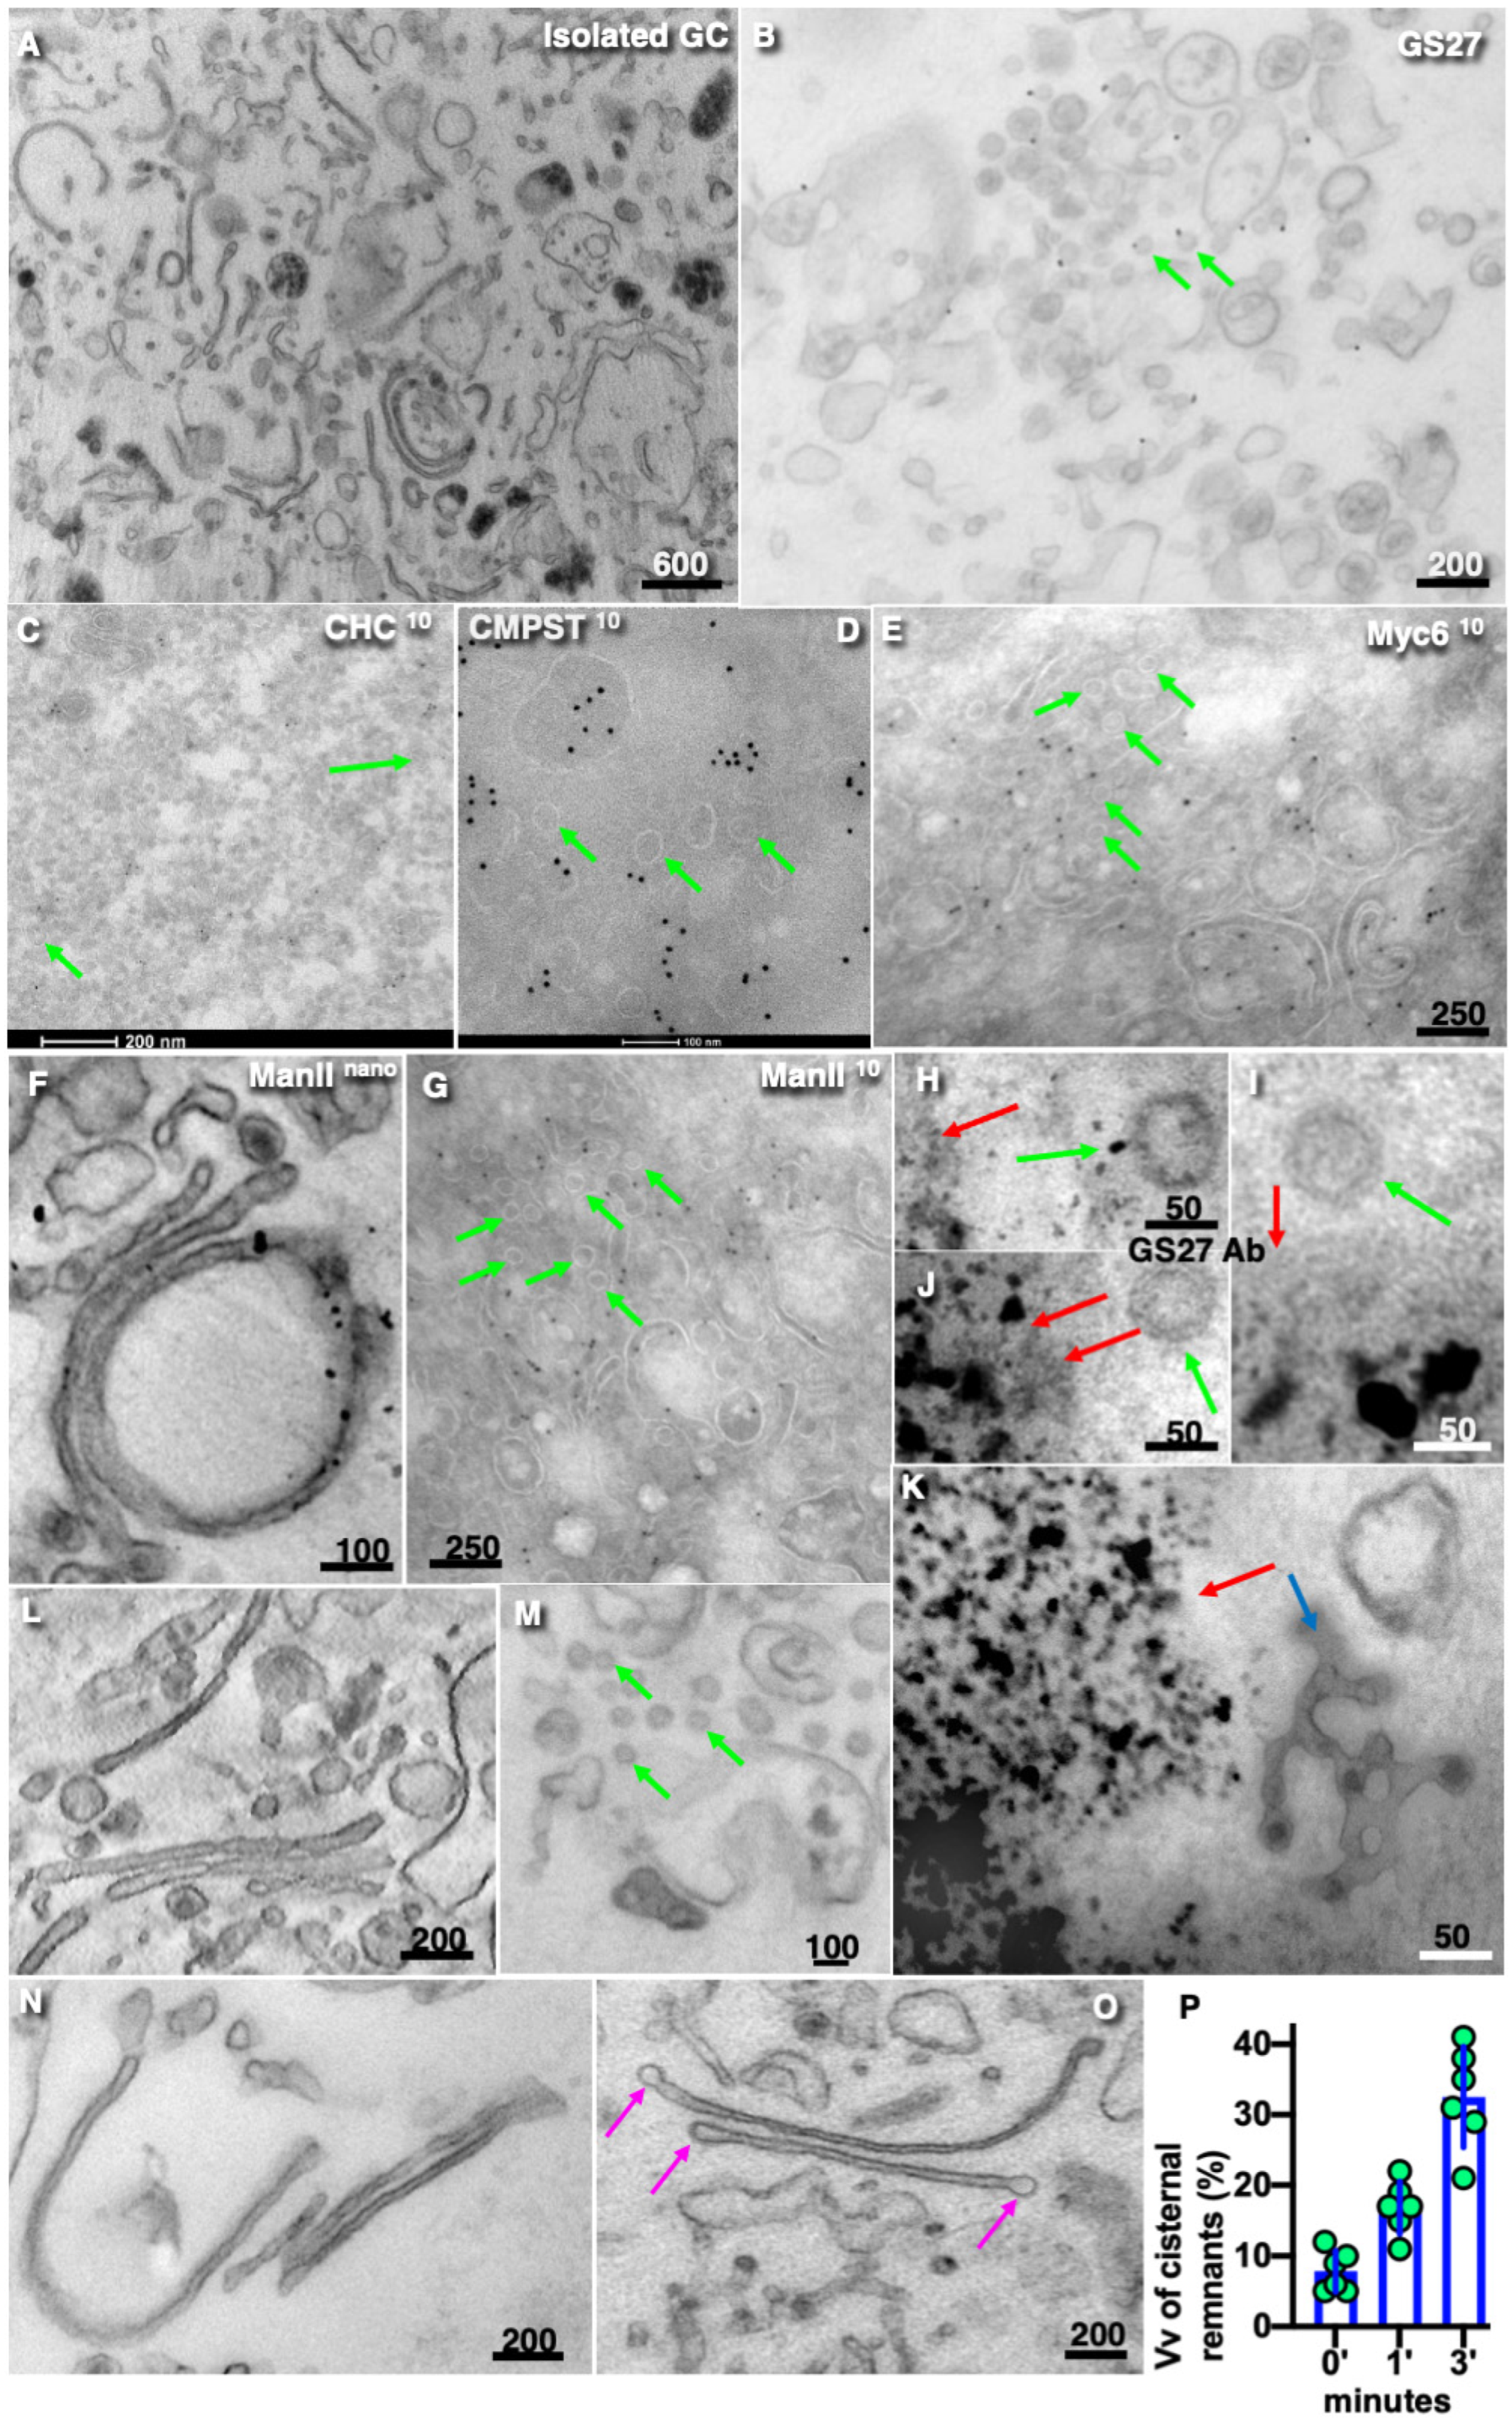
Figure 6.
Nonspecific binding of Sec13 to COPI-dependent vesicles and scheme of cell vesicles. (iA-iD) The 50-nm vesicles formed after incubation of microsomes with cytosol and isolated with magnetic beads can recruit COPII. (iA) The isolated with GS27/membrin-containing magnetic beads the 50-nm vesicles are not positive for Sec13. Labelling for Sec13 is visible over membrane structures larger than 60 nm. (iB, iC) After incubation of the vesicular fraction with cytosol, the 50-nm RPs are positive for Sec13. Nonspecific binding of Sec13 to COPI-dependent vesicles isolated from the ER after their incubation with cytosol. In the absence of COPI in cytosol these vesicles were not formed. (iiA-iiF) Schemes of the formation of cell vesicles. (iiG) Schemes of stable fullerenes. 1. C60 soccer ball; the diameter of the inscribed sphere = 42 nm; 2. C72: the diameter of the inscribed sphere = 60 nm; 3. C84; the diameter of the inscribed sphere = 70 nm; 4. C96; the diameter of the inscribed sphere = 80 nm; 5. C134; the diameter of the inscribed sphere = 100 nm. Scale bars (nm): the length of bars is shown in images (iA-iC).
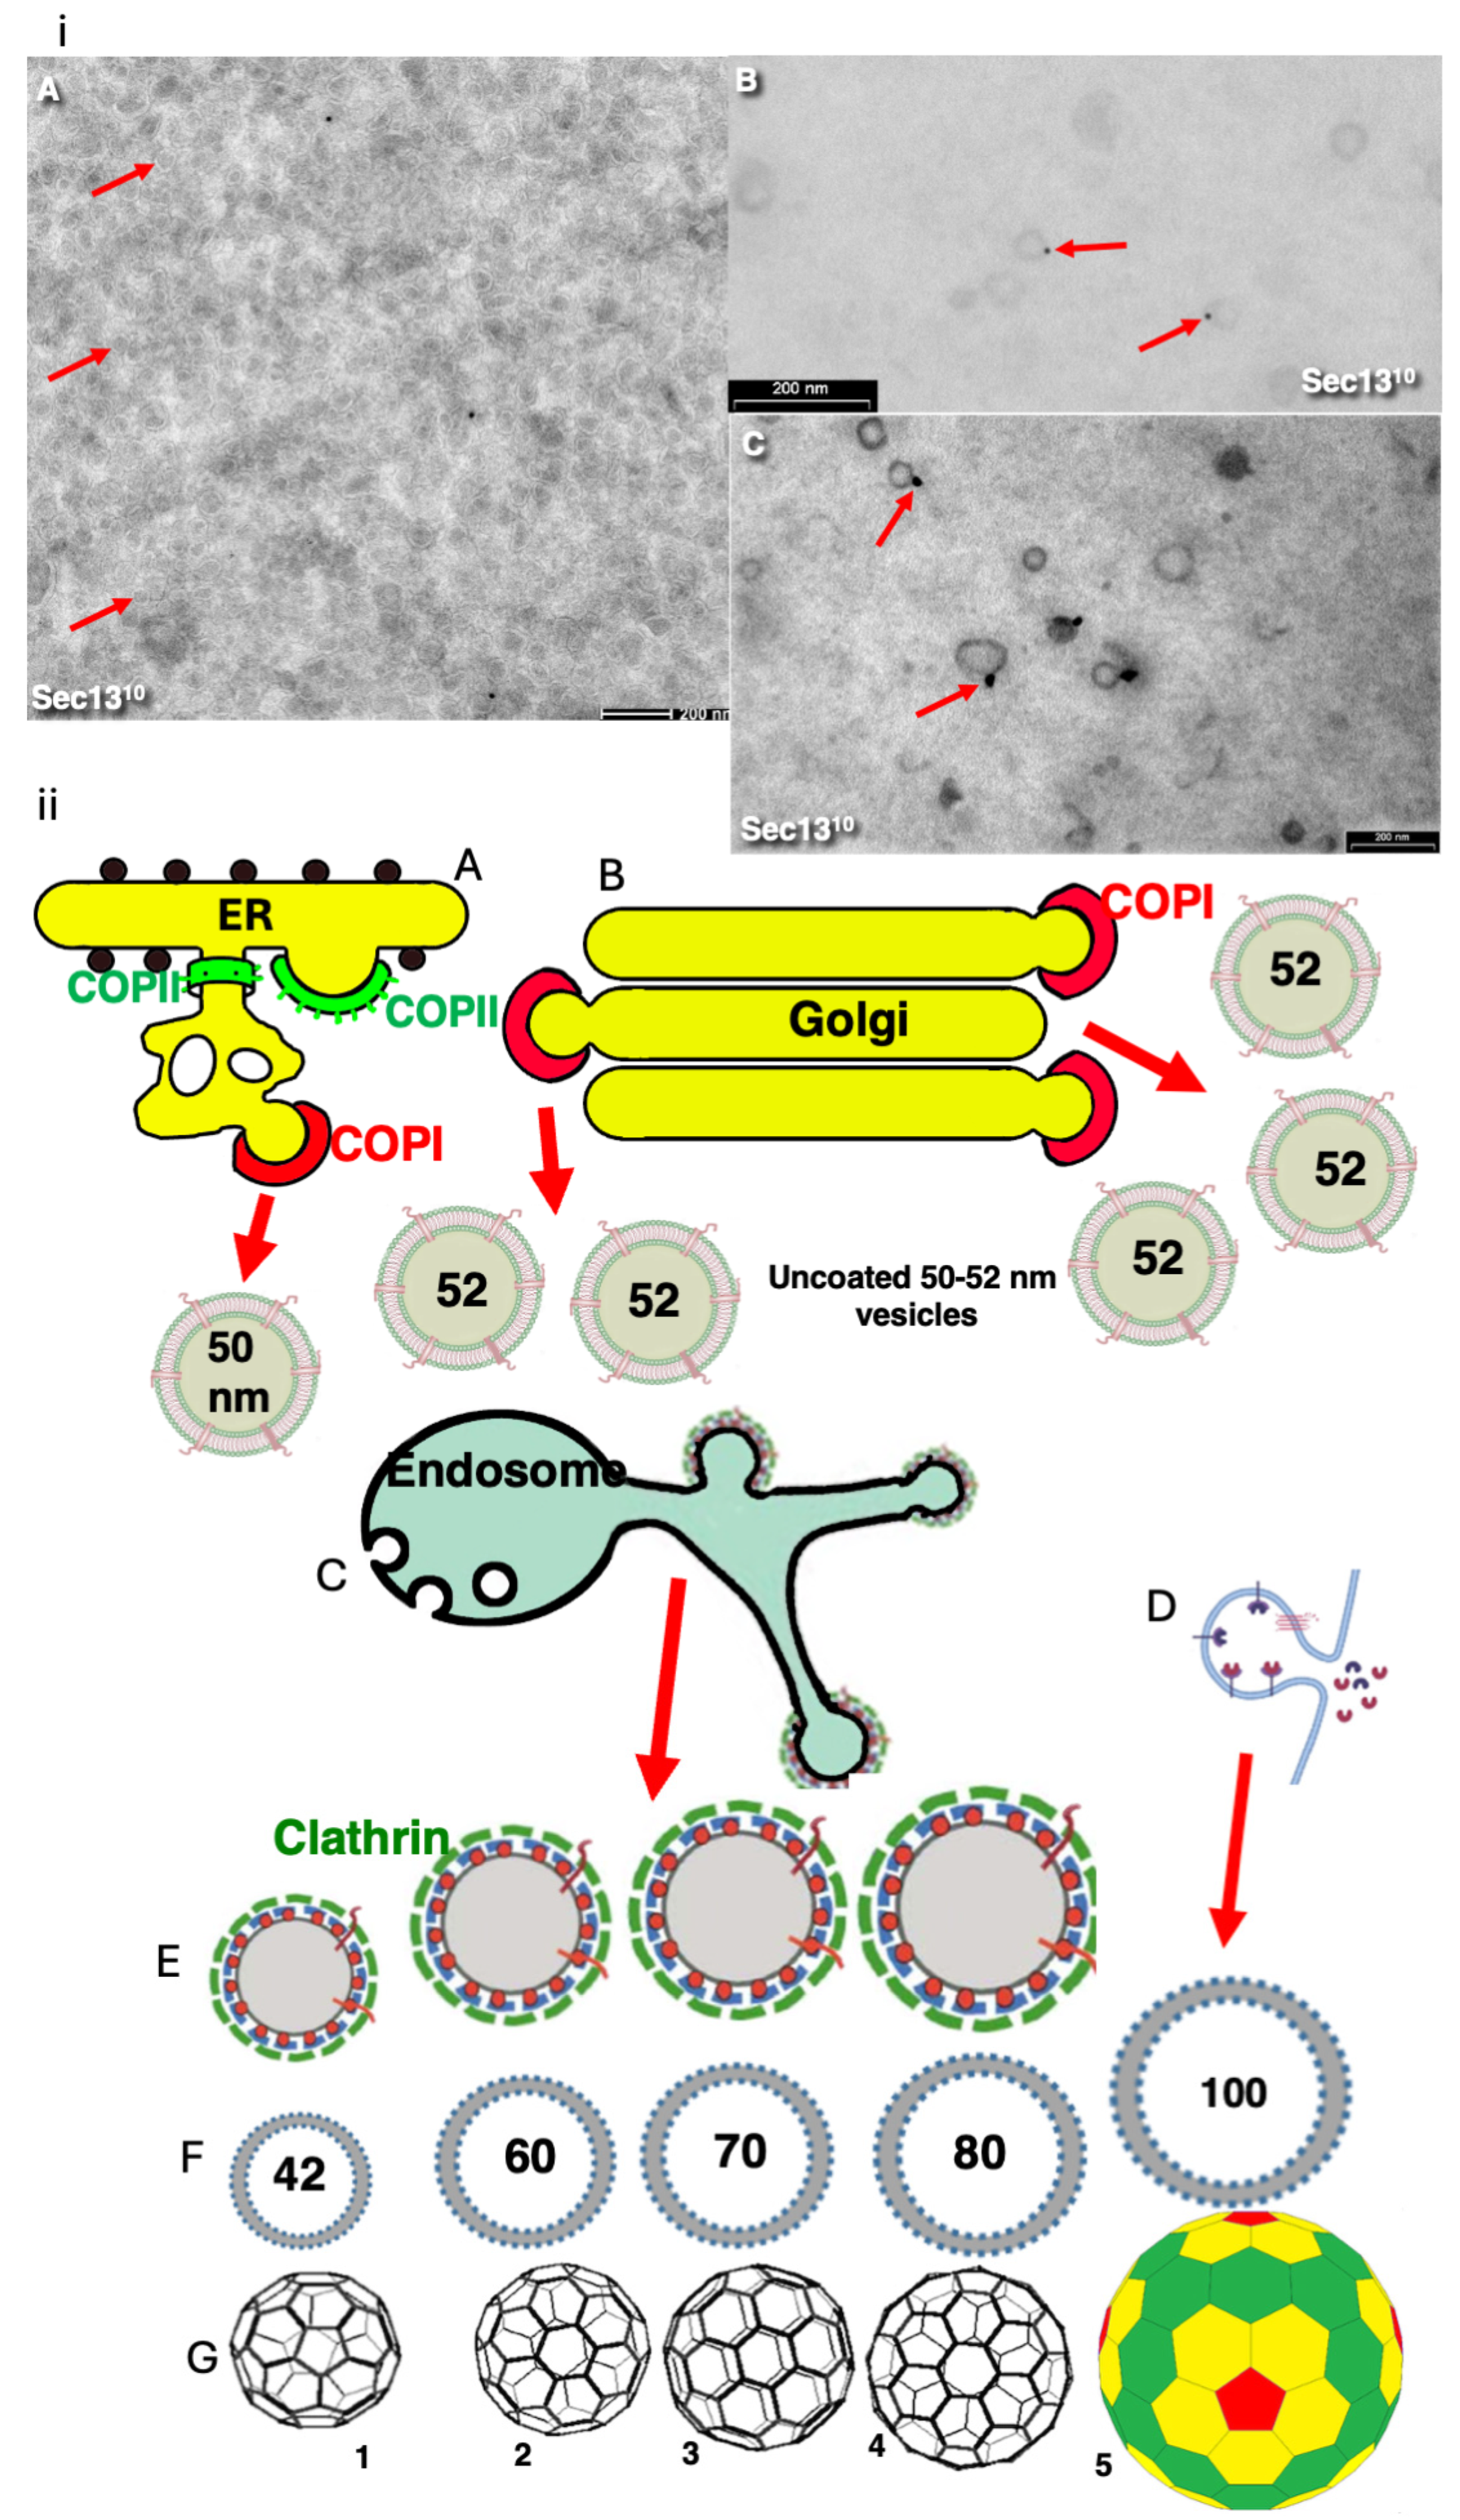
Disclaimer/Publisher’s Note: The statements, opinions and data contained in all publications are solely those of the individual author(s) and contributor(s) and not of MDPI and/or the editor(s). MDPI and/or the editor(s) disclaim responsibility for any injury to people or property resulting from any ideas, methods, instructions or products referred to in the content. |
© 2025 by the authors. Licensee MDPI, Basel, Switzerland. This article is an open access article distributed under the terms and conditions of the Creative Commons Attribution (CC BY) license (http://creativecommons.org/licenses/by/4.0/).
Copyright: This open access article is published under a Creative Commons CC BY 4.0 license, which permit the free download, distribution, and reuse, provided that the author and preprint are cited in any reuse.


