
Submitted:
24 October 2025
Posted:
28 October 2025
You are already at the latest version
Abstract
This study investigates the corrosion and scaling behaviour of Extreme High-speed Laser Application (EHLA)-fabricated corrosion-resistant alloy (CRA) claddings under simulated geothermal brine conditions. EHLA 316L stainless steel and alloy 625 coat-ings were produced and tested in simulated brine (Chloride–carbonate–silica geo-thermal brine) at 70°C for 720h to evaluate the influence of additive manufacturing microstructures on corrosion performance. The EHLA coatings exhibited dense, met-allurgically bonded microstructures with minimal porosity. Microstructural analysis revealed Nb- and Mo- rich segregation in EHLA 625 and fine columnar dendritic morphology in all coatings. EHLA 625 also displayed stable passive film formation but had a thin deposit of Mg-O-containing compounds from the brine. EHLA 316L on the other hand exhibited localised pitting and heavy Si- and Mg-containing scale accumu-lation, especially in as-built conditions. Surface finishing reduced corrosion activity by minimizing roughness and defect-driven localised attack. Critical pitting temperature tests confirmed the superior localised corrosion resistance of EHLA 625 compared to EHLA 316L. However, further process improvements and perhaps post-deposition thermal treatments might be required to bring the performance of the coatings in line with the wrought alloys. The results demonstrate that EHLA-fabricated coatings offer corrosion and scaling resistance. This coating technique has the potential to provide cost-effective solutions to produce corrosion resistant coatings on geothermal components.
Keywords:
EHLA
; corrosion resistance alloys
; geothermal
; scaling
1. Introduction
Geothermal energy is a promising source of renewable and clean energy. However, the harsh conditions of geothermal environments pose significant challenges to the materials used in production equipment. In more recent years, drilling deeper geothermal wells considered to enhance the energy output up to 10 times higher than the conventional wells which then faced a variety of failures due to the higher temperature, lower pH, supercritical state of the geothermal fluid, higher corrosively, etc. [1,2]. These environments often contain high concentrations of solids, chloride ions, hydrogen sulphide (H2S) and carbon dioxide (CO2). Such conditions can be highly-corrosive to carbon and low-alloy steels, which are commonly used in geothermal wells [3,4,5,6].
Various mitigation strategies have been explored to overcome the failures due to the high corrosion susceptibility of carbon steel in such environment. Using corrosion-resistant alloys (CRAs) to mitigate corrosion is considered by several researchers [7,8,9]. However, using CRAs are expensive and therefore using weld overlay/cladding is a more cost-effective alternative successfully applied in other energy industries. Inconel 625 and 316LSS are among the candidates known for good weldability and resistance to corrosion. Using CRA weld overlays offer better resistance to corrosion and erosion, whereas the backing steel provides appropriate mechanical properties such as high strength.
Laser cladding is an advanced technique for protecting underlying material using a deposition layer where a cladding material is deposited on a surface with a thermal energy supplied by laser beam [10,11,12]. While wire-feed method is compatible with laser, most claddings use powder due to better versatility [13,14]. The overlay cladding is commonly used to enhance corrosion and tribological performance of the surface [15,16,17].
The Extreme High-speed Laser Application (EHLA) process which is a state-of-the-art technology based on laser cladding can operate at ultra-high processing speeds. In EHLA, the laser focuses above the surface of the substrate which melts the metal powder mid-air. On reaching the substrate surface, the melted powder solidifies, and forms a metallurgically bonded coating [18,19]. The EHLA can achieve deposition rates of up to 200 m/min, with processing efficiencies approaching 500 cm2/min [20]. The high processing speed of this method allows large-scale fabrication to be carried out more economically, which is essential for its viability in the renewable energy sector.
While CRA overlays improve corrosion performance of the substrate material for geothermal applications, its effect on scale deposition rate and associated issues related to scaling is not very well understood. A range of factors influence the tendency for scale formation, including temperature as well as the presence and concentration of species such as silicon, calcium, carbonates, sulphates, and other heavy metal ions [21]. The cladding material and surface roughness are some additional parameters that influence scaling in cladded surfaces.
This work examines the suitability of EHLA-produced corrosion-resistant alloy (CRA) overlays, namely Inconel 625 and 316 stainless steel, for service in high-silica geothermal environments. Particular attention is given to the role of surface condition (as-deposited versus polished) in governing corrosion behaviour and scaling tendencies under simulated geothermal exposure.
2. Materials and Methods
2.1. Materials
To compare the performance of conventionally manufactured (wrought) materials with those produced by the EHLA process, tests were carried out on samples fabricated using both methods. The materials examined in this study are as follows: Precipitation hardened nickel alloy 718, Inconel ® 600, austenitic stainless steel 316L and Nickel alloy 625 (the last two were manufactured using EHLA). Alloy 718 and Inconel® 600 were selected to provide an intermediate level of corrosion resistance between 316L and 625, although it is recognised that these alloys are not typically employed for the intended application.
For the EHLA-fabricated materials, trials were conducted to identify the best processing conditions that yield minimal porosity and defects (such as lack of fusion, micro-cracks, and inclusions) without compromising deposition efficiency. The manufacturing parameters investigated are listed below: Spot size, Laser power, Speed, Powder fed rate, Feeder and pitch. The detailed results of the trials can be found in reference [22]. The particle size ranged between 15 to 45 µm and 25 to 45 µm for 316L and Nickel alloy 625, respectively. The parameters used to produce the 625 and 316 samples are shown below in Table 1. The coatings were manufactured under Argon shielding gas.
The assessments of the microstructure were carried out only for the EHLA manufactured layers, using samples prepared via conventional metallurgical procedures (i.e., sectioning from cladding, followed by grinding, polishing and etching). The microstructure of the alloys studied was revealed by Kalling’s no 2 reagent. Optical and Scanning electron microscopy (SEM) coupled with energy dispersive X-ray spectroscopy (EDX) was used for the assessment of the microstructure. The percentage of porosity in the materials was estimated by image analysis of the metallurgical prepared sections using Image J in as polished condition (before etching).
2.2. Scaling and Corrosion Tests
2.2.1. Test Performed Simulating Geothermal Conditions
To assess materials’ degradation behaviour under representative geothermal conditions, laboratory-scale corrosion and scaling tests were performed using a custom-built vessel with rotating paddles, this test rig was presented in detail in reference [23]. Test coupons fabricated from the alloys mentioned in Section 2.1 were mounted inside the vessel and instrumented for electrochemical measurements, allowing real-time monitoring of surfaces changes during exposure.
The simulated geothermal brine was formulated based on field analyses from Nesjavellir subcritical fluids. The composition was selected to include corrosive species such as chloride and dissolved CO2, as well as scaling agents including calcium, magnesium, and silica. Solution preparation was carried out in stages: NaOH (0.1 M, 2 g in 500 mL DI water) was used to dissolve 1.804 g of SiO2 (solution 1), while 24.2 g of NaHCO3 and 7.64 g of Na2CO3 were dissolved in 2 L of DI water (solution 2). After mixing the two solutions, CaCl2·2H2O (0.5388 g) and MgCl2·6H2O (0.7398 g) were added, and the final mixture was diluted to 4 L with DI water. The subcritical fluid of Nesjavellir also contains H2S, this was not included during these tests due to Health and Safety considerations.
Experiments were carried out at 70 °C, corresponding to the maximum temperature achievable by the test rig. While the subcritical fluid at Nesjavellir reaches higher temperatures, this testing regime was selected to allow early screening of materials for corrosion susceptibility and to define preliminary operational limits. A 50 L reservoir was used to store the prepared solution, which was circulated through the test vessel using a peristaltic pump to ensure stable hydrodynamic and chemical conditions throughout the experiments. The test duration was 720 hours.
2.2.2. Post-Tests Examination
Once the long-term tests simulating the geothermal conditions were completed, the samples were analyzed visually, and images were taken to record observations. In the as-received post-testing condition, the surface of the samples was examined using light optical microscopy and scanning electron microscopy coupled with energy-dispersive X-ray spectroscopy (SEM-EDX). At this stage, EDX maps were taken from all the samples in equal number of locations to quantify the nature (chemistry) and level of scaling in the samples.
Subsequently, cross-sectional metallographic specimens were prepared by sectioning through the regions of interest, mounting, grinding, and polishing to reveal the internal structure. These sections were examined to determine the depth and nature of corrosion damage, including pitting, intergranular attack, or scale formation.
2.2.3. Critical Pitting Temperature
In this study, the pitting corrosion resistance of the investigated EHLA materials was evaluated following a procedure based in ASTM G150 using specimens electrochemical prepared This involved attaching a wire for electrical connection of 35 × 35 mm in as-built condition The surface of the specimens was not ground. The procedure involved immersing the specimens in two different nitrogen deaerated solutions: (i) a solution containing 170ppm of chloride ions and (ii) a standard ASTM G-150 solution (1M of NaCl). The specimens were put under a controlled fixed potential while gradually increasing the solution temperature. The temperature at which current density rose above 0.1mA/cm2 was identified as the critical pitting temperature (CPT). Note: These tests were conducted in a slightly different solution to the geothermal brine, to have an idea of the influence of the other species in the brine apart from the chlorides.
3. Results
3.1. Sample Manufacturing by EHLA
3.1.1. Inconel 625
The part manufactured to extract the coupons for the corrosion testing is shown in Figure 1a. The disc diameter was 150mm and 10mm thick. Metallographic sections and corrosion coupons were extracted from this flat disc (i.e an example of the type of coupon used for the corrosion test is illustrated in orange in Figure 1a, the coupons for the metallurgical examination were extracted transversal to this). The as-built cladding surface was analysed using a 3D microscopy and the roughness of the surface was Ra measured 5.7 μm.
3.1.2. EHLA 316L
As with Alloy 625, a 150 mm-diameter steel disc was used as the substrate for depositing the 316L EHLA cladding. The roughness of the as-built surface was Ra 7.3 μm. Note: For both 625 and 316L, the corrosion test coupons were carefully prepared to ensure that only the cladding surface was exposed, to avoid any influence of the steel base/substrate.
3.2. Microstructural Examinations
3.2.1. Inconel 625
The metallographic section extracted from the flat coupon was polished and etched appropriately. The revealed microstructure is shown in Figure 2. The microstructure exhibits a primarily elongated columnar dendritic structure growing perpendicular to the interface with the average thickness of 442μm. The overlay exhibited a dense and uniform morphology, with no evidence of solidification cracking within the cladding material. However, some un-melted deposits were still present on the surface, indicating incomplete fusion in localized regions. High-magnification SEM imaging revealed distinct banding patterns consistent with elemental segregation, particularly of niobium and molybdenum, within the dendritic structure [24].
3.2.2. 316 Stainless Steel
Figure 3 displays the revealed microstructure, which consists predominantly of elongated columnar dendrites aligned along the thickness of the cladding. The average measured thickness of the cladding layer is approximately 1240 μm. While the overlay appears generally dense, some linear and rounded features were observed. The linear indications are consistent with solidification cracks, whereas the rounded ones are likely due to porosity or non-metallic inclusions. SEM analysis of this sample showed a uniform microstructure with no signs of elemental segregation or significant amount of secondary phases.
3.3. Flow Rig Test
Figure 4 shows a comparison of the coupons before and after testing, while representative images of the SEM examination after testing are presented in Figure 5. The surface of the coupons revealed varying degrees of surface alteration among the tested alloys. 316 as-built coupon showed a yellowish hue on the surface after testing with visible signs of surface degradation. SEM examination revealed extensive surface coverage by deposits, with the underlying metal exposed only in isolated areas. Remnants of the original powder particles were still present, and EDX spectra indicated silica, oxygen and magnesium scales (see Figure 5g); notably, the dark region at the base of right-Figure 5d corresponds to a silica-based scale.
The 316-ground coupon exhibited a noticeably darker appearance; however, the SEM image confirmed the absence of surface deterioration, with changes limited to scale formation. These scales were predominantly composed of silicon, oxygen, and magnesium, while other deposits rich in calcium and oxygen (with minor silicon content) were also observed.
Alloys 600 and 718 followed the same trend that was noticed in 625 ground sample, in particular, the EDX spectra of the scales of alloy 600 identified magnesium, silicon and oxygen as the principal elements. In 718, this type of scale was identified, but also with additional scales rich in calcium and oxygen. The coupon of alloy 625 (ground) was the one that displayed smaller amount of scaling.
For 625, the-as built sample showed no signs of surface degradation, although a significant layer of deposits was observed, primarily composed of magnesium and oxygen (this was the only sample that displayed significant amounts of this type of scale, see Figure 5h). In ground condition, this alloy showed minimal surface change, with only a light layer of scale detected; EDX analysis identified magnesium, silicon, and oxygen as the principal elements in these scales, and no corrosion damage was evident.
The open circuit potential (OCP) measurements of the six tested materials 316 ground, 316 as-built, 625 ground, 625 as-built, 718, and 600 revealed a similar electrochemical shift during the early stages of exposure. Within the first 200 hours, all samples experienced a transition from more negative to more positive potentials, suggesting surface evolution likely linked to passive film formation or stabilization. Among these, the 316 as built specimen stands out due to the OCP values being consistently higher throughout the test, indicating that at least, from a thermodynamic point of view, the surface is more reactive. Meanwhile, the 316 ground sample, although displaying similar OCP values to the other materials, exhibited greater fluctuations in OCP, pointing to possible changes in the surface of the sample (i.e., local events of passive film breakdown and repassivation). The remaining alloys, 625 in both conditions, 718, and 600, showed relatively stable behavior after the initial 200 hours, with minor variations that suggest a steady electrochemical environment.
Figure 6.
Open circuit potential measurements versus the Ag/AgCl reference electrode for the six different coupons used during tests simulating the geothermal conditions.
Figure 6.
Open circuit potential measurements versus the Ag/AgCl reference electrode for the six different coupons used during tests simulating the geothermal conditions.
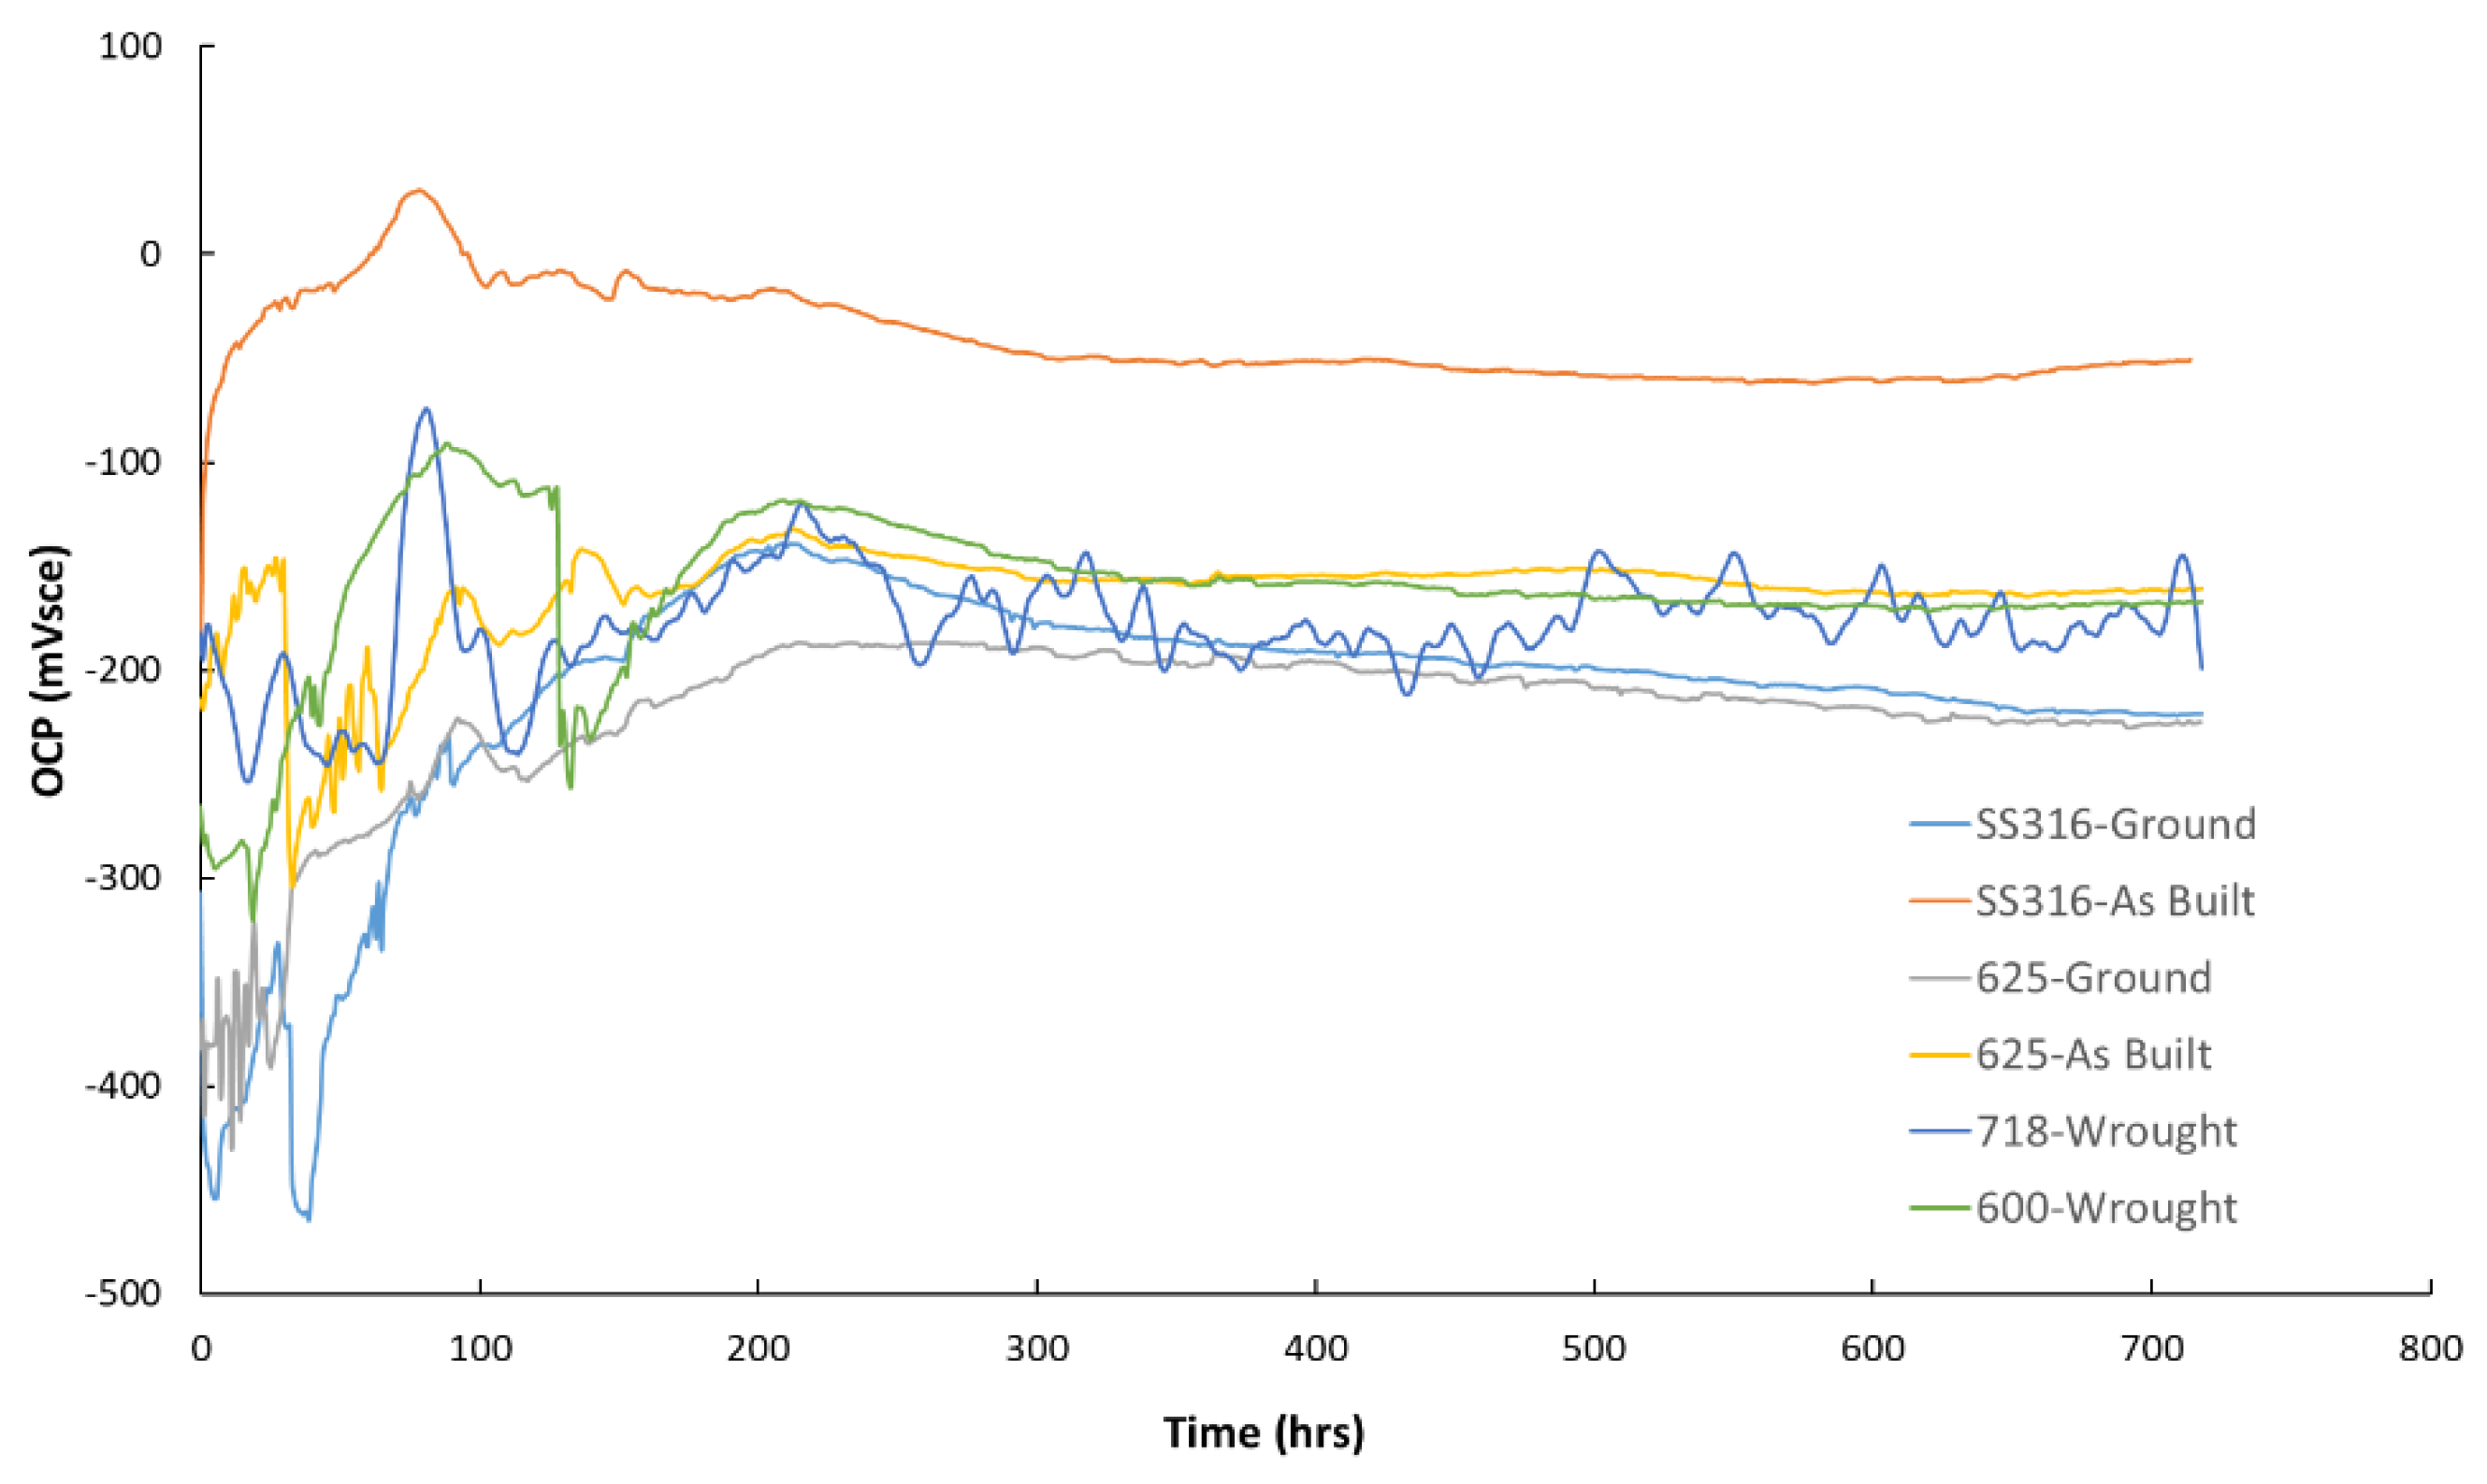
Figure 7 presents the cross-sectional view of the 316 as-built sample after testing. As expected for this alloy in a chloride-containing environment, the corrosion observed is localized, manifesting primarily as pitting. Figure 7a highlights the development of secondary pits within existing surface pits, suggesting that despite the flow conditions during testing, localized concentration of aggressive species is occurring. This may occur due to the scales observed in the sample or due to un-melted surface particles that shield specific regions. At higher magnification (Figure 7b), the pit bottom reveals a growth pattern that appears to follow the orientation of the dendritic microstructure. The pit propagation occurs in a toothed/serrated manner, indicating that the solidification structure of the as-built material influences the pitting growth.
3.4. Critical Pitting Temperature
Table 2 shows a summary of the results of ASTM G150 tests. As expected, 625 displayed, in general, higher resistance to localized corrosion than 316, while, as expected again, the environment containing higher amount of chlorides proved to be more aggressive, compare the critical pitting temperature (CPT) of 316L in both environments. It was interesting to observe that the CPT of the EHLA 316L at the chloride concentration that could be identified in the geothermal well, the material was not susceptible to pitting corrosion up to a temperature of 80 °C (this was the temperature limit of the CPT testing rig), however different results were obtained in the tests simulating the geothermal conditions.
In addition to the G150 test results, Figure 8 presents the current density versus time curves recorded during the tests. Although the 625 alloy successfully passed, the data reveal that the current generated during exposure to 170 ppm chloride concentration brine was higher than that observed for 316L. In absence of any other knowledge of the material, this is unexpected given the well-established superior corrosion resistance of alloy 625.
4. Discussion
First, it is important to highlight that the samples tested in their as-built condition exhibited higher surface roughness than the ground samples. This increased roughness results in a larger exposed surface area, which in turn leads to higher absolute current passing through the material during the corrosion tests. While this consideration might introduce some inconsistencies during the comparison of the results presented in this paper, it reflects a key advantage of additively manufactured (AM) parts- the potential to eliminate post-processing such as machining. This consideration is likely part of a broader discussion on the usage of AM parts. Nevertheless, this is the reason why, despite it could generate some inconsistencies during the comparison of the different results, the tests were performed in both conditions. The paper of Quok An teo et al. investigated the influence of different post-processing treatments in the surface finishes of AM 316L [25], Clark et al. explore this influence directly in the corrosion performance of Laser beam powder bed fusion (LB-PBF) 316L, this research indicate that the influence of the surface finish is not given by the roughness of the part, rather, this is related to the surface chemistry [26].
To facilitate understanding of the experimental findings, potentiodynamic sweeps were carried out in the geothermal brine. The results are shown in Figure 9. Alloy 625 in the as-built condition exhibited the lowest OCP among the tested materials. This result is somewhat unexpected, as OCP typically reflects the thermodynamic tendency of a material to corrode. Among the alloys tested, 625 contains the least iron, which would suggest a higher OCP. However, the as-built 625 surface displayed several features detrimental to corrosion resistance, including high surface roughness, surface heterogeneities, and chemical segregation. These factors are likely to contribute to the unusually low OCP observed for this alloy. All the other alloys showed similar OCP values. In terms of Icorr, 316 as-built displayed the higher value, while all the alloy displayed relatively similar values. On the anodic side, ignoring as-built 625, it can be observed that 316L displayed the lower pitting potential, followed by alloy 600 and finally the ground 625. As expected, given the observation of the microstructure in 625, 718 displayed the lower current in the anodic site, and interestingly, we did not identify the pitting potential of 316 ground, suggesting that its pitting potential was higher than all the other alloys apart from 718. For 625 as-built, it would appear that the pitting potential is very low, however, a high current plateau can be observed.
If the results of the different tests are compared, no one-to-one correlation can be identified. For 316L as -built, the corrosion behavior in simulated geothermal brine at ~70 °C observed in this study confirms that this alloy is vulnerable to degradation under these conditions. The measured high icorr, low pitting potential and the presence of localised pits/crevice attack detected by the post-exposure surface examination in the long-term tests indicate that the passive film of 316L is unstable in this environment. This finding is consistent with the established understanding that elevated temperatures (>55–60 °C) and high chloride concentrations promote passive film breakdown and accelerate localised corrosion processes in austenitic stainless steels. Microscopic examination revealed subsurface pits, nucleation of pits inside primary pits, and crevice-like attack under deposits/corrosion products, etc., which are characteristic of chloride-induced pitting corrosion. The initiation of pitting likely occurred due to localised de-passivation when chloride ions locally penetrated the thin chromium oxide film, establishing an anodic site. The measured OCP further supports this interpretation, showing a shift to more active potentials (or incursions). The potential presence of dissolved CO2 in the simulated geothermal brine would further exacerbate this behavior, even without chlorides [27]. This is supported by the results of the ASTM G150, which show that in a low chloride containing environment only current increase is observed It should ne noted that other factors might play a role as the flow. Also highlight the important of long term duration tests to assess materials corrosion performance. The synergistic interaction between chlorides and CO2 at elevated temperature (~70C) creates an aggressive environment that possibly exceeds the materials’ resistance to corrosion in this condition [28]. Likewise, the observations and measurements from 316 ground seem to be consistent, with high pitting potential and no pitting in the long duration tests. In the potentiodyamic tests, a conventionally manufactured 316L was tested, and show a similar behaviour, suggesting that the passive film of both alloys is very similar. Regarding the pit morphology found in 316L, although no chemistry segregation or secondary phases were identified, the structure at the bottom of the pits suggested that the pit growth is governed by the microstructure, Voisin et al. [29] and Wang et al. [30] studied the microstructure of laser powder bead fusion (LPBF) 316L in detail. They found that in this alloy, there is a cellular structure within the grains creating partitioning of the elements. This observation is compatible with the morphology of pit growth presented in this paper. No pit growth rate was established during this study, however, if this cellular structure leads to potentially higher corrosion rates To contrast this, Chao et al. [34] found that in samples of 316L fabricated using selective laser melting (SLM), the pitting potential was higher in conventionally manufactured wrought 316L., then, it implicates that the qualification of AM material might require more detailed information that is generally used for wrought alloys. For example, the qualification of the materials might require macrographs, micrograph and advance microscopy imaging.
Regarding 625, despite no pitting or localized corrosion events being identified during the long terms tests, this indicated some corrosion related information such as the increase in current during the ASTM G150 or the poor behavior during the potentatidynamics scans. Differentiating them from their wrought counterpart. The differences can be rationalised by examining the unique microstructural characteristics imparted by the AM process. Unlike wrought material, which typically exhibits a more homogeneous, often equiaxed, and well-controlled microstructure, AM alloys are shaped by rapid solidification, localised melting, and layer-by-layer deposition, factors that promote microstructural heterogeneity, elemental segregation, and defect formation, all of which influence corrosion performance.
One of the primary contributors to this increased corrosion susceptibility is the non-homogeneous nature of deposit formation, as observed in Figure 2d. For example, in previous long-duration tests in sulfuric acid have revealed shallow but distinct selective attack along melt pool borders, indicating that these features create local electrochemical inhomogeneities that accelerate localised corrosion processes in LPBF 625 [31]. While wrought Alloy 625 generally forms equiaxed grains with more uniform chemistry, the layer-wise deposition in AM introduces melt pool boundaries and microsegregation that do not exist in conventionally processed material. Marchese et al. [32] have found that within the microsegragation regions i.e., in the interdendritic regions, which are typically rich in elements such as niobium (Nb) and molybdenum (Mo), precipitates such as niobium carbides or gamma double prime are present. While no specific Mo-rich precipitates were identified During this research, it was found that the bands observed in Figure 2d are rich in Niobium and molybdenum, no Cr enrichment was identified, it is well established that the precipitates deplete the adjacent gamma-Ni matrix of protective elements, reducing the resistance to localised corrosion. Porosity and other manufacturing defects further amplify this effect. Although laser-based methods typically achieve relatively low porosity, any residual voids, can serve as initiation points for corrosion attack. In contrast, wrought alloys typically exhibit no porosity, and precipitation of secondary phases typically occurs only after pro-longed exposure or poor heat treatment. This understanding, which enables effective control of sensitization in wrought alloys and has begun to be applied to conventional laser additive manufacturing (AM) processes [33], still needs to be developed for EHLA-fabricated claddings.
In addition to the parameters discussed in this study, one critical aspect that was not characterized is the passive layer. The condition and integrity of the passive layer formed during EHLA (or in general for AM parts), compared to ground parts, remains unknown [29]. A complete understanding of the corrosion behavior would benefit from further characterisation of the material’s composition, thickness, and electrochemical properties. Without this, the conclusions from the corrosion tests remain preliminary.
5. Conclusions
The following conclusions can be drawn from the work presented in the paper:
- EHLA-fabricated coatings exhibited dense microstructures with excellent substrate bonding and minimal porosity, confirming process suitability for corrosion-resistant coatings.
- EHLA alloy 625 showed better corrosion and scaling resistance than EHLA 316L in simulated geothermal brine due to its stable passive film and higher alloying content. However, in ground condition, after removal of the as-deposited surface the differences in corrosion performance are not significant.
- Localized Nb- and Mo- rich segregation in EHLA 625 had some influence on the corrosion resistance under the tested conditions. Surface conditions strongly influenced performance. Processes such as grinding, reduced scale deposition and enhanced electrochemical stability.
These results demonstrate that EHLA offers considerable potential as a cost-effective technique for producing corrosion-resistant claddings suited to demanding geothermal conditions. Nonetheless, further refinement of the processing parameters, together with appropriate post-deposition treatments, is likely to be necessary to achieve substantial improvements in corrosion performance.
Author Contributions
Conceptualization, S.P., E.A.E. and D.M.; methodology, T.M., E.A.E. and D.M.; software, E.A.E. and D.M.; validation, E.A.E. and D.M.; formal analysis, E.A.E. and D.M; investigation, E.A.E., T.M. and D.M; resources, N.K., E.A.E. and S.P.; data curation, E.A.E. and D.M.; writing—original draft preparation, D.M., E.A.E. and S.P.; writing—review and editing, D.M., N.K., E.A.E. and S.P.; visualization, D.M. and E.A.E.; supervision, N.K. and S.P.; project administration, N.K.; funding acquisition, N.K. and S.P. All authors have read and agreed to the published version of the manuscript.
Funding
Funded by the European Union. This research (COMPASS) has received funding from the European Union’s Horizon Europe research and innovation programme under grant agreement nº. 101084623 and InnovateUK grant no. 10061668. Views and opinions expressed are, however, those of the author(s) only and do not necessarily reflect those of the European Union or CINEA. Neither the European Union nor the granting authority can be held responsible for them.
Institutional Review Board Statement
Not applicable.
Informed Consent Statement
Not applicable.
Data Availability Statement
The original contributions presented in the study are included in the article, further inquiries can be directed to the corresponding authors.
Acknowledgments
The authors of this document acknowledge the support of Mike Bennet for performing the corrosion tests and its related data curation. During the preparation of this manuscript, the authors used ChatGPT and Copilot to improve language consistency and grammar. All generated content was reviewed and edited by the authors, who take full responsibility for the final version of this publication. The authors also wish to thank the members of the COMPASS consortium for their valuable support and guidance throughout the project.
Conflicts of Interest
The authors declare no conflicts of interest. The funders had no role in the design of the study; in the collection, analyses, or interpretation of data; in the writing of the manuscript; or in the decision to publish the results.
References
- Elders, W.A.; Friðleifsson, G.Ó.; Albertsson, A. Drilling into magma and the implications of the Iceland Deep Drilling Project (IDDP) for high-temperature geothermal systems worldwide. Geothermics 2014, 49, 111–118. [Google Scholar] [CrossRef]
- Kruszewski, M.; Wittig, V. Review of failure modes in supercritical geothermal drilling projects. Geothermal Energy 2018, 6, 28. [Google Scholar] [CrossRef]
- Nogara, J.; Zarrouk, S.J.; Seastres, J. Surface analysis of metal alloys exposed to geothermal fluids with high non-condensable gas content. Geothermics 2018, 72, 372–399. [Google Scholar] [CrossRef]
- Karlsdottir, S.N.; Thorhallson, A.I.; Prikryl, J.; Pekyavas, M.; Asbjornsson, S.; Wallevik, S.O.; Alexandersson, K.F. Material challenges for deep superhot geothermal wells. Geothermal Resources Council Transactions 2022, 46, 271–284. [Google Scholar]
- Gallup, D.L. Unusual adherence of manganese silicate scale to metal substrates. Geothermal Resources Council Transactions 2004, 28, 529–532. [Google Scholar]
- Penot, C.; Martelo, D.; Paul, S. Corrosion and scaling in geothermal heat exchangers. Applied Sciences 2023, 13, 11549. [Google Scholar] [CrossRef]
- Brownlie, F.; Hodgkiess, T.; Pearson, A.; Galloway, A.M. A study on the erosion-corrosion behaviour of engineering materials used in the geothermal industry. Wear 2021, 477, 203821. [Google Scholar] [CrossRef]
- Karlsdóttir, S.N.; Hjaltason, S.M.; Ragnarsdóttir, K.R. Corrosion behavior of materials in hydrogen sulfide abatement system at Hellisheiði geothermal power plant. Geothermics 2017, 70, 222–229. [Google Scholar] [CrossRef]
- Mundhenk, N.; Huttenloch, P.; Bäßler, R.; Kohl, T.; Steger, H.; Zorn, R. Electrochemical study of the corrosion of different alloys exposed to deaerated 80 C geothermal brines containing CO2. Corrosion science 2014, 84, 180–188. [Google Scholar] [CrossRef]
- Liu, M.; Cai, Y.; Duan, C.; Li, G. Key techniques in parts repair and remanufacturing based on laser cladding: A review. Journal of Manufacturing Processes 2024, 132, 994–1014. [Google Scholar] [CrossRef]
- Wang, K.; Du, D.; Liu, G.; Chang, B.; Ju, J.; Sun, S.; Fu, H. Microstructure and property of laser clad Fe-based composite layer containing Nb and B4C powders. Journal of Alloys and Compounds 2019, 802, 373–384. [Google Scholar] [CrossRef]
- Ranjan, R.; Das, A.K. Protection from corrosion and wear by different weld cladding techniques: A review. Materials Today: Proceedings 2022, 57, 1687–1693. [Google Scholar] [CrossRef]
- Syed, W.U.H.; Pinkerton, A.J.; Li, L. A comparative study of wire feeding and powder feeding in direct diode laser deposition for rapid prototyping. Applied Surface Science 2005, 247, 268–276. [Google Scholar] [CrossRef]
- Wang, K.; Liu, W.; Hong, Y.; Sohan, H.S.; Tong, Y.; Hu, Y.; Ju, J. An overview of technological parameter optimization in the case of laser cladding. Coatings 2023, 13, 496. [Google Scholar] [CrossRef]
- Li, X.; Zhang, S.; Liu, W.; Pang, X.; Tong, Y.; Zhang, M.; Wang, K. Effect of WC content on the wear and corrosion properties of oscillating laser-cladding-produced nickel-based coating. Coatings 2023, 13, 1614. [Google Scholar] [CrossRef]
- Mahmoud, E.R.; Khan, S.Z.; Ejaz, M. Laser surface cladding of mild steel with 316L stainless steel for anti-corrosion applications. Materials Today: Proceedings 2021, 39, 1029–1033. [Google Scholar] [CrossRef]
- Ding, H.; Yang, T.; Wang, W.; Zhu, Y.; Lin, Q.; Guo, J.; Liu, Q. Optimization and wear behaviors of 316L stainless steel laser cladding on rail material. Wear 2023, 523, 204830. [Google Scholar] [CrossRef]
- Du, J.; Xu, X.; Zhang, H.M.; Lu, M.W.; Sun, J.F.; Luo, K.Y.; Lu, J.Z. Microstructure and wear resistance of CoCrFeNiMn coatings prepared by extreme-high-speed laser cladding. Surface and Coatings Technology 2023, 470, 129821. [Google Scholar] [CrossRef]
- Pacheco, J.T.; Veiga, M.T.; dos Santos, M.T.; Trabasso, L.G. Status of high-speed laser cladding process: An up-to-date review. Progress in Additive Manufacturing 2024, 9, 1857–1868. [Google Scholar] [CrossRef]
- Lampa, C.; Smirnov, I. High speed laser cladding of an iron-based alloy developed for hard chrome replacement. Journal of Laser Applications 2019, 31, 02. [CrossRef]
- Conover, M.; Ellis, P.; Curzon, A. Material selection guidelines for geothermal power systems: An overview. Geothermal scaling and corrosion 1980, 24-40. [CrossRef]
- Abedi Esfahani, E.; Maccio, T. Corrosion Performance Testing of Cladding — Compass Deliverable D4.3. 2025.
- Martelo, D.F.; Holmes, B.; Kale, N.; Scott, S.W.; Paul, S. Investigation of scaling and materials’ performance in simulated geothermal brine. Materials 2024, 17, 5250. [Google Scholar] [CrossRef]
- Nguejio, J.; Szmytka, F.; Hallais, S.; Tanguy, A.; Nardone, S.; Martinez, M.G. Comparison of microstructure features and mechanical properties for additive-manufactured and wrought nickel alloy 625. Materials Science and Engineering: A 2019, 764, 138214. [Google Scholar] [CrossRef]
- Teo, A.Q.A.; Yan, L.; Chaudhari, A.; O’Neill, G.K. Post-processing and surface characterization of additively manufactured stainless steel 316L lattice: Implications for biomedical use. Materials 2021, 14, 1376. [Google Scholar] [CrossRef]
- Clark, C.L.; Karasz, E.K.; Melia, M.; Hooks, D.E.; Hackenberg, R.; Colon-Mercado, H.; Stull, J.A. Machine-to-machine variability of roughness and corrosion in additively manufactured 316L stainless steel. Journal of Manufacturing Processes 2023, 106, 380–392. [Google Scholar] [CrossRef]
- Ansari, N.; Alabtah, F.G.; Khraisheh, M. Influence of temperature on corrosion behavior of additively manufactured SS316L stainless steel in CO2-saturated brine solution. Materials Letters 2024, 376, 137272. [Google Scholar] [CrossRef]
- Ezuber, H.M. Influence of temperature on the pitting corrosion behavior of AISI 316L in chloride–CO2 (sat) solutions. Materials & Design 2014, 59, 339–343. [Google Scholar]
- Voisin, T.; Shi, R.; Zhu, Y.; Qi, Z.; Wu, M.; Sen-Britain, S.; Wood, B.C. Pitting corrosion in 316L stainless steel fabricated by laser powder bed fusion additive manufacturing: A review and perspective. JOM 2022, 74, 1668–1689. [Google Scholar] [CrossRef]
- Wang, Y.M.; Voisin, T.; McKeown, J.T.; Ye, J.; Calta, N.P.; Li, Z.; Zhu, T. Additively manufactured hierarchical stainless steels with high strength and ductility. Nature Materials 2018, 17, 63–71. [Google Scholar] [CrossRef]
- Gola, K.; Ledwig, P.; Dubiel, B. Effect of microstructure of additively manufactured Inconel 625 on long-term corrosion behaviour in sulfuric acid media. JOM 2023, 75, 1242–1250. [Google Scholar] [CrossRef]
- Marchese, G.; Lorusso, M.; Parizia, S.; Bassini, E.; Lee, J.W.; Calignano, F.; Biamino, S. Influence of heat treatments on microstructure evolution and mechanical properties of Inconel 625 processed by laser powder bed fusion. Materials Science and Engineering: A 2018, 729, 1–9. [Google Scholar] [CrossRef]
- Cabrini, M.; Lorenzi, S.; Testa, C.; Pastore, T.; Brevi, F.; Biamino, S.; Fino, P.; Manfredi, D.; Marchese, G.; Calignano, F.; Scenini, F. Evaluation of corrosion resistance of alloy 625 obtained by laser powder bed fusion. Journal of The Electrochemical Society 2019, 166, C3399–C3408. [Google Scholar] [CrossRef]
- Chao, Q.; Cruz, V.; Thomas, S.; Birbilis, N.; Collins, P.; Taylor, A.; Fabijanic, D. On the enhanced corrosion resistance of a selective laser melted austenitic stainless steel. Scripta Materialia 2017, 141, 94–98. [Google Scholar] [CrossRef]
Figure 1.
Photographs of the EHLA-deposited claddings, showing the steel substrate at the center and the outer ring of the samples: (a) 625 and (b) 316L.
Figure 1.
Photographs of the EHLA-deposited claddings, showing the steel substrate at the center and the outer ring of the samples: (a) 625 and (b) 316L.
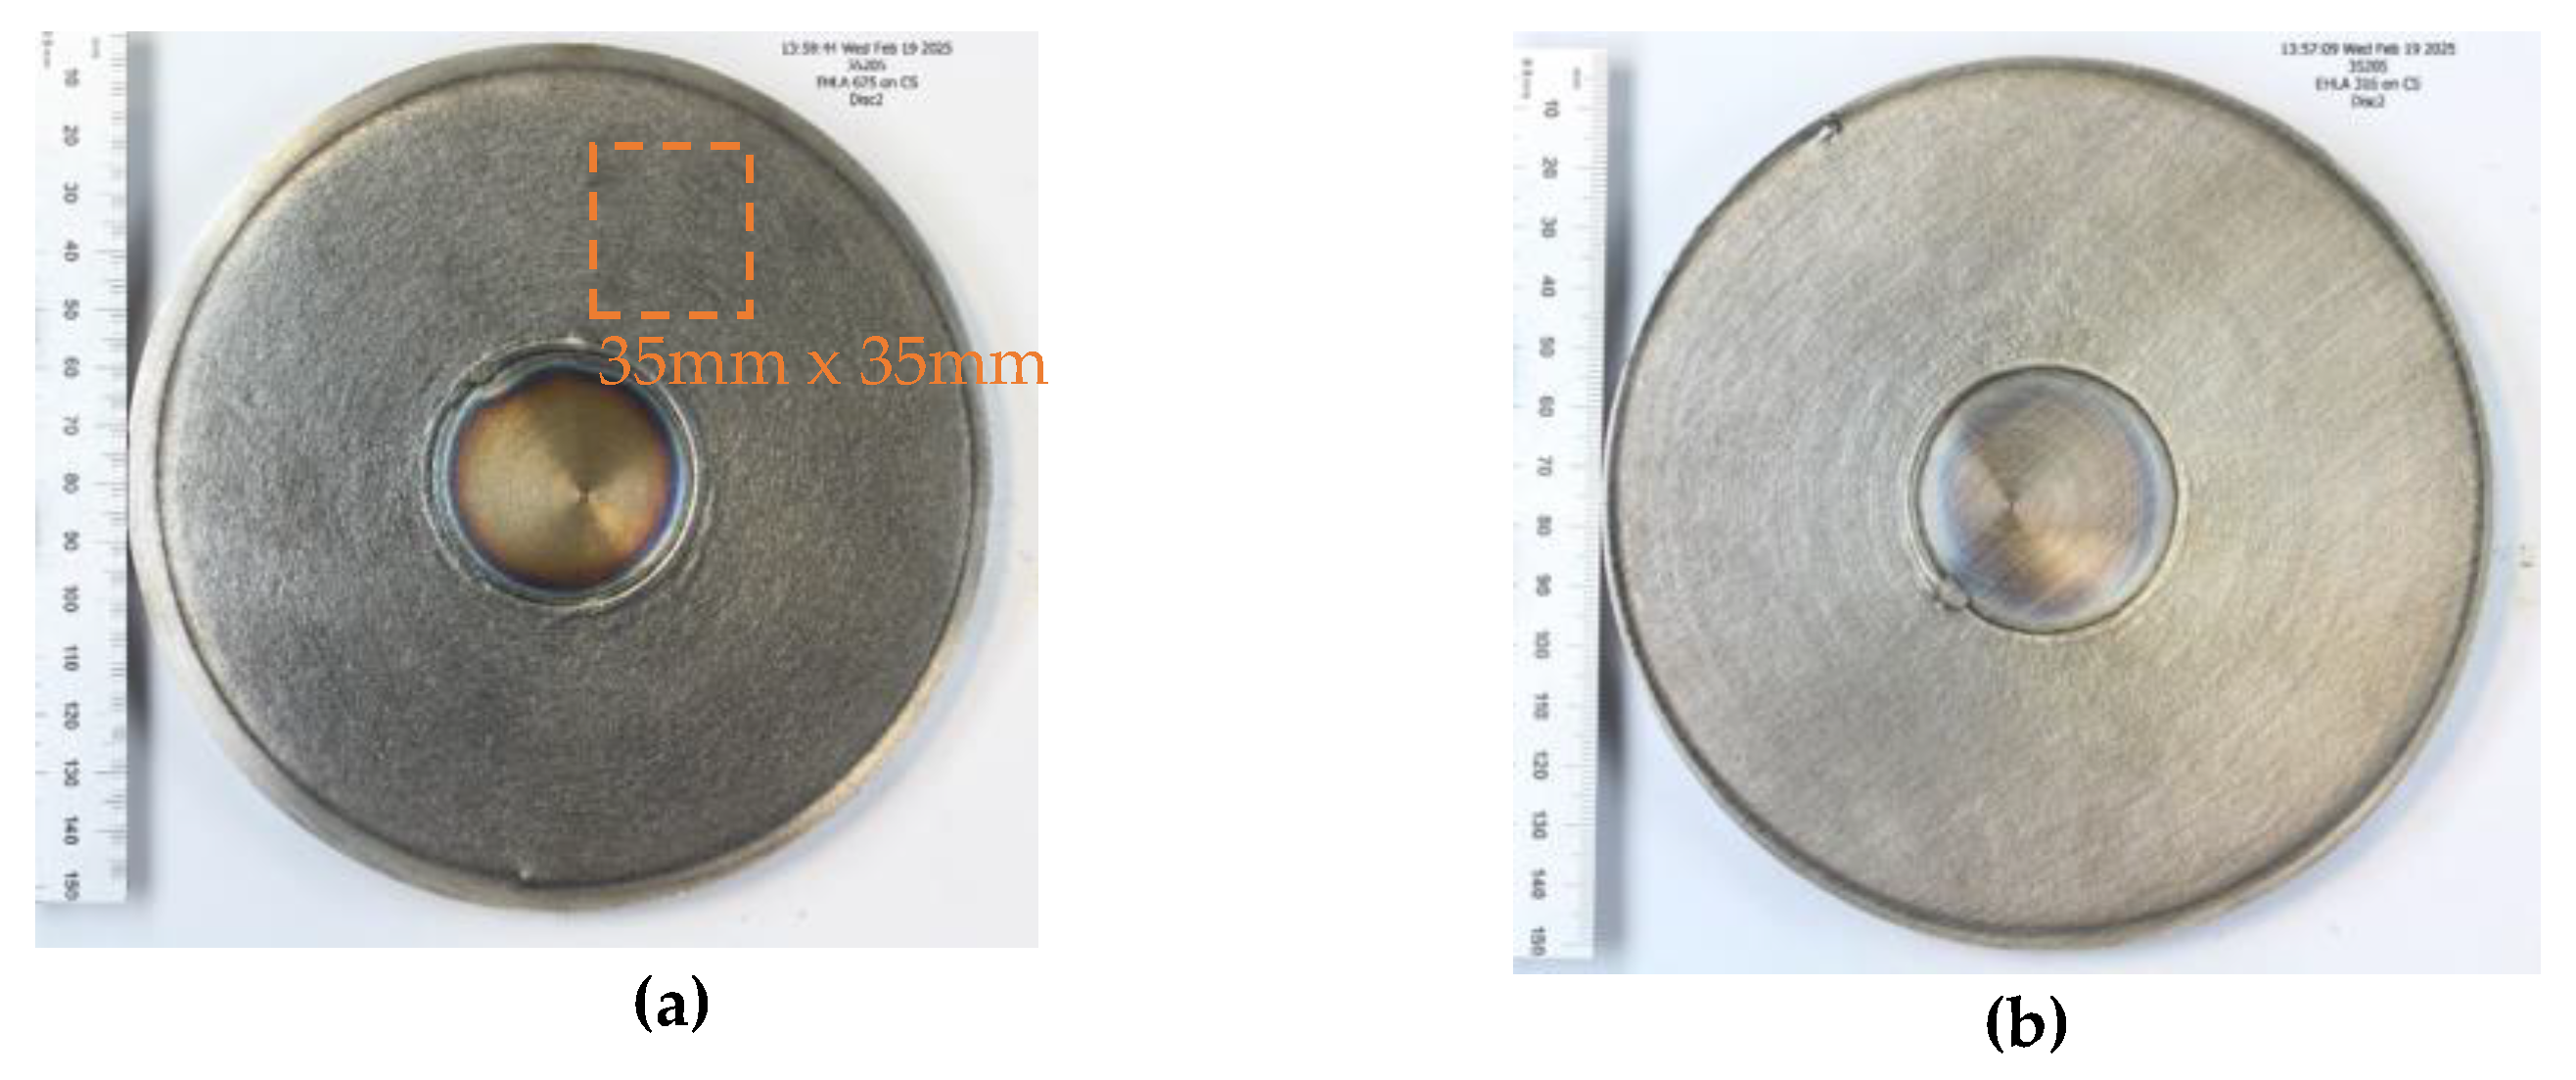
Figure 2.
The cross-sectional micrographs of EHLA Alloy 625 coating: (a) and (b) are light optical images showing some macro-characteristics of the microstructure, (c) SEM image showing unfused deposits on the cladding surface and (d) high magnification backscatter SEM image showing the segregation features.
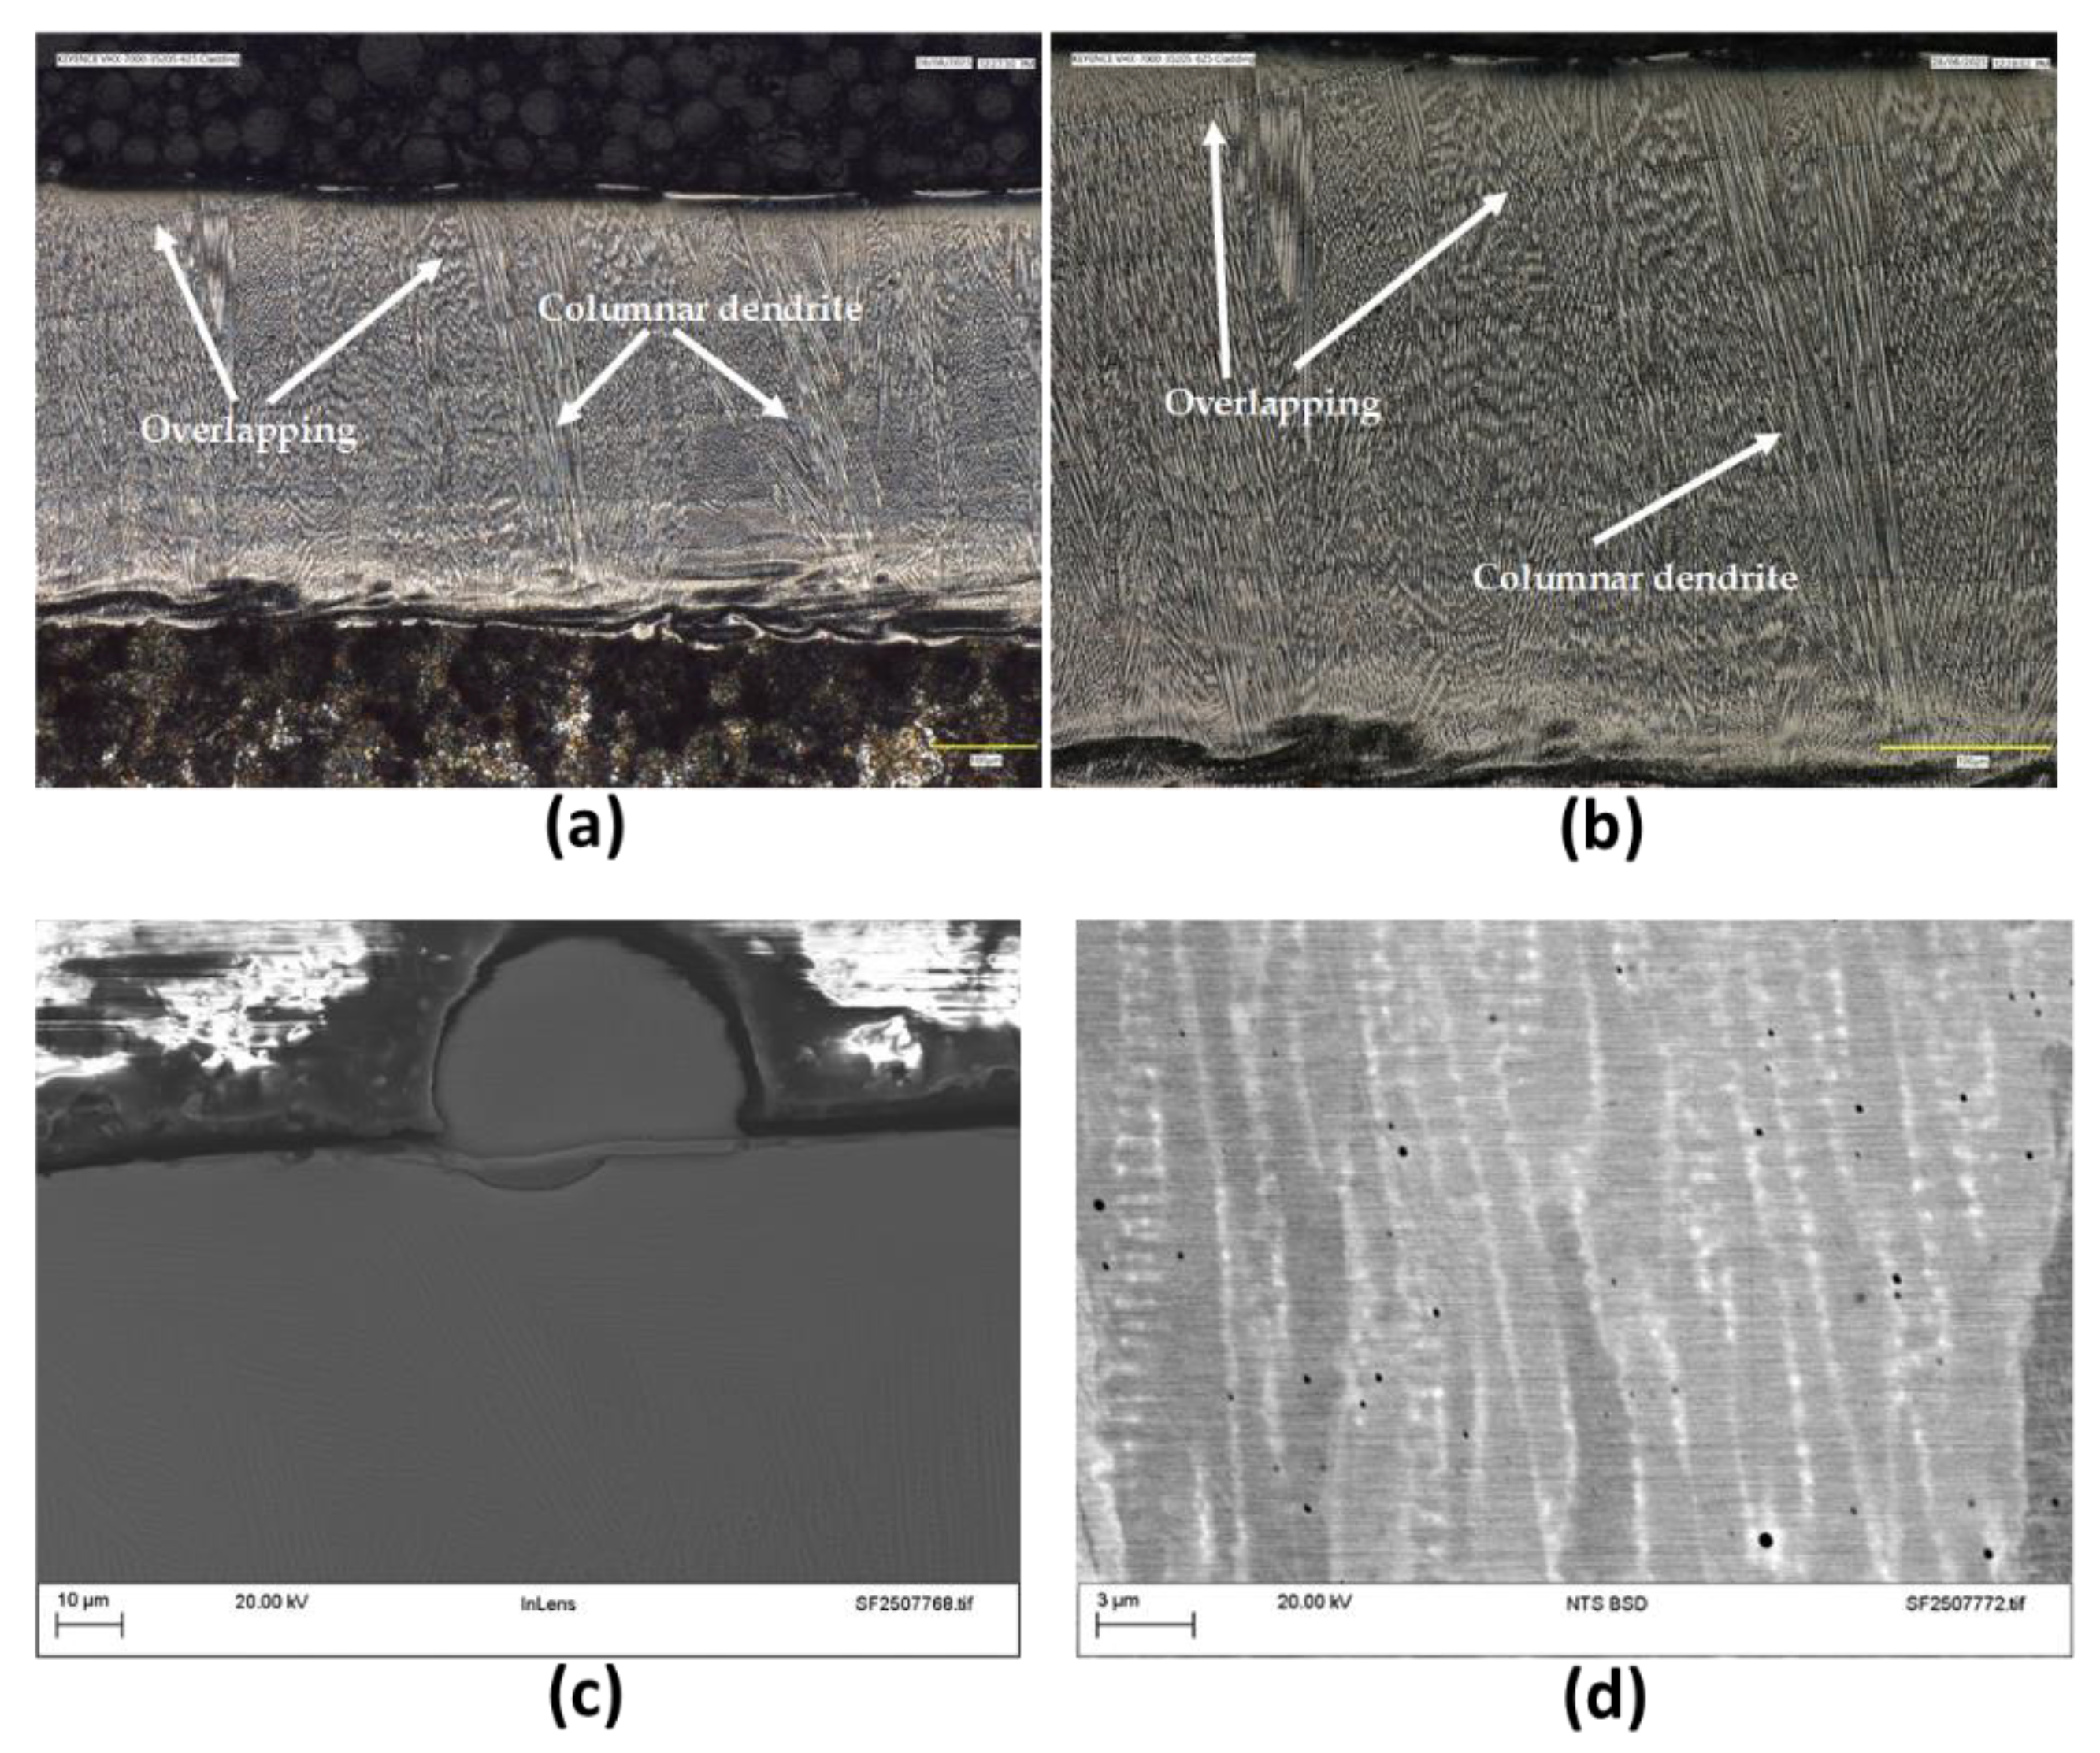
Figure 3.
The cross-sectional micrographs of EHLA 316 stainless steel cladding: (a) and (b) are light optical images showing some characteristics of the microstructure, including some flaws.
Figure 3.
The cross-sectional micrographs of EHLA 316 stainless steel cladding: (a) and (b) are light optical images showing some characteristics of the microstructure, including some flaws.
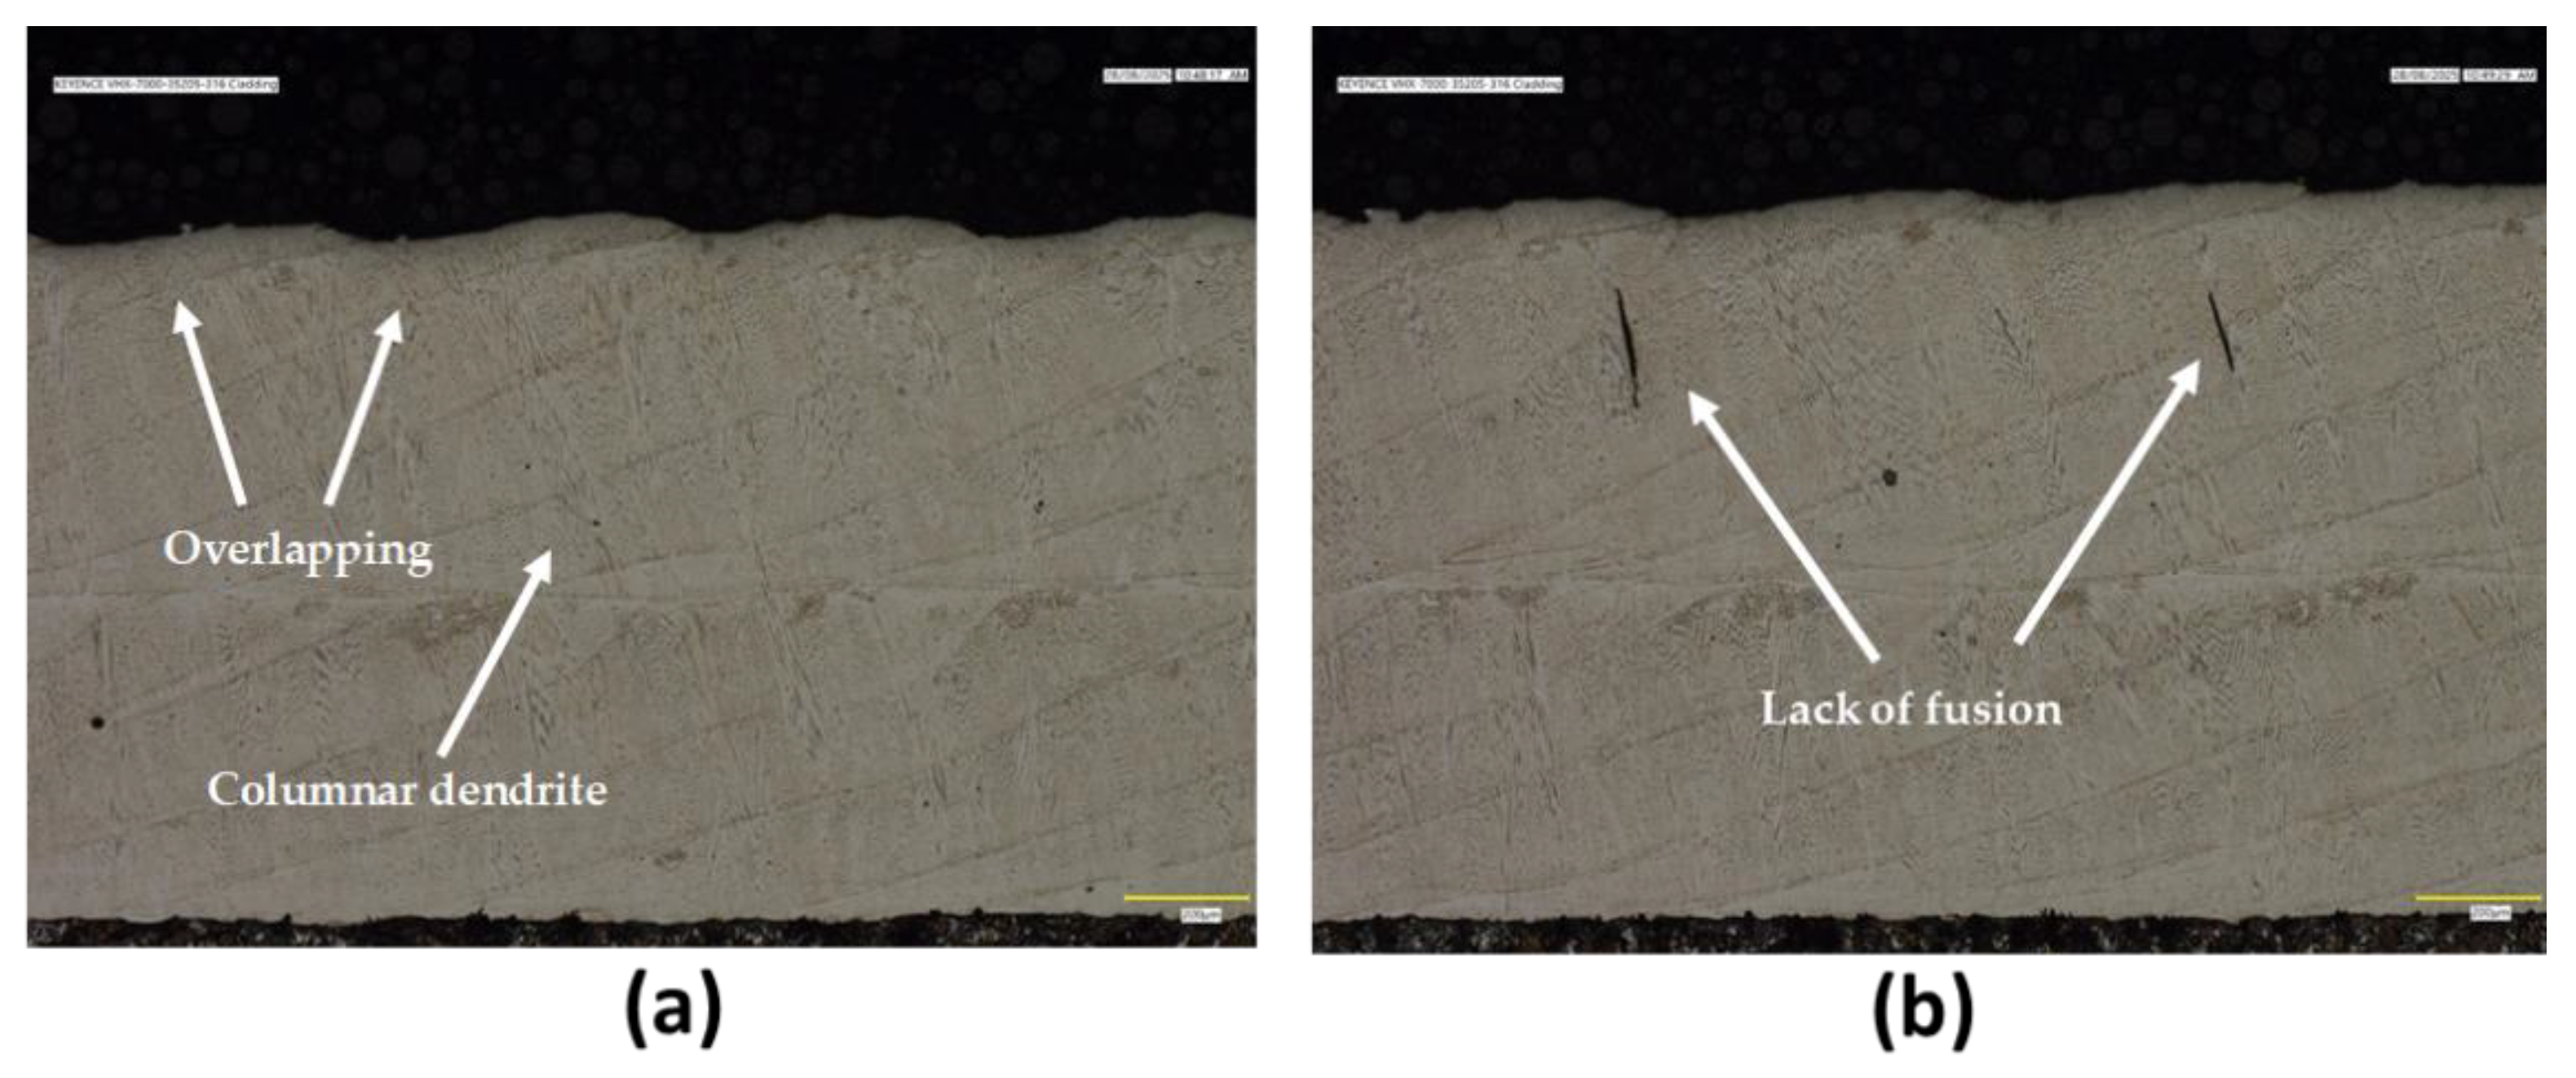
Figure 4.
Visual assessment of the coupons before and after 30 days of testing. Remember, Inconel alloy 600 and 718 were used from wrought materials, therefore no as-built coupons exited.
Figure 4.
Visual assessment of the coupons before and after 30 days of testing. Remember, Inconel alloy 600 and 718 were used from wrought materials, therefore no as-built coupons exited.
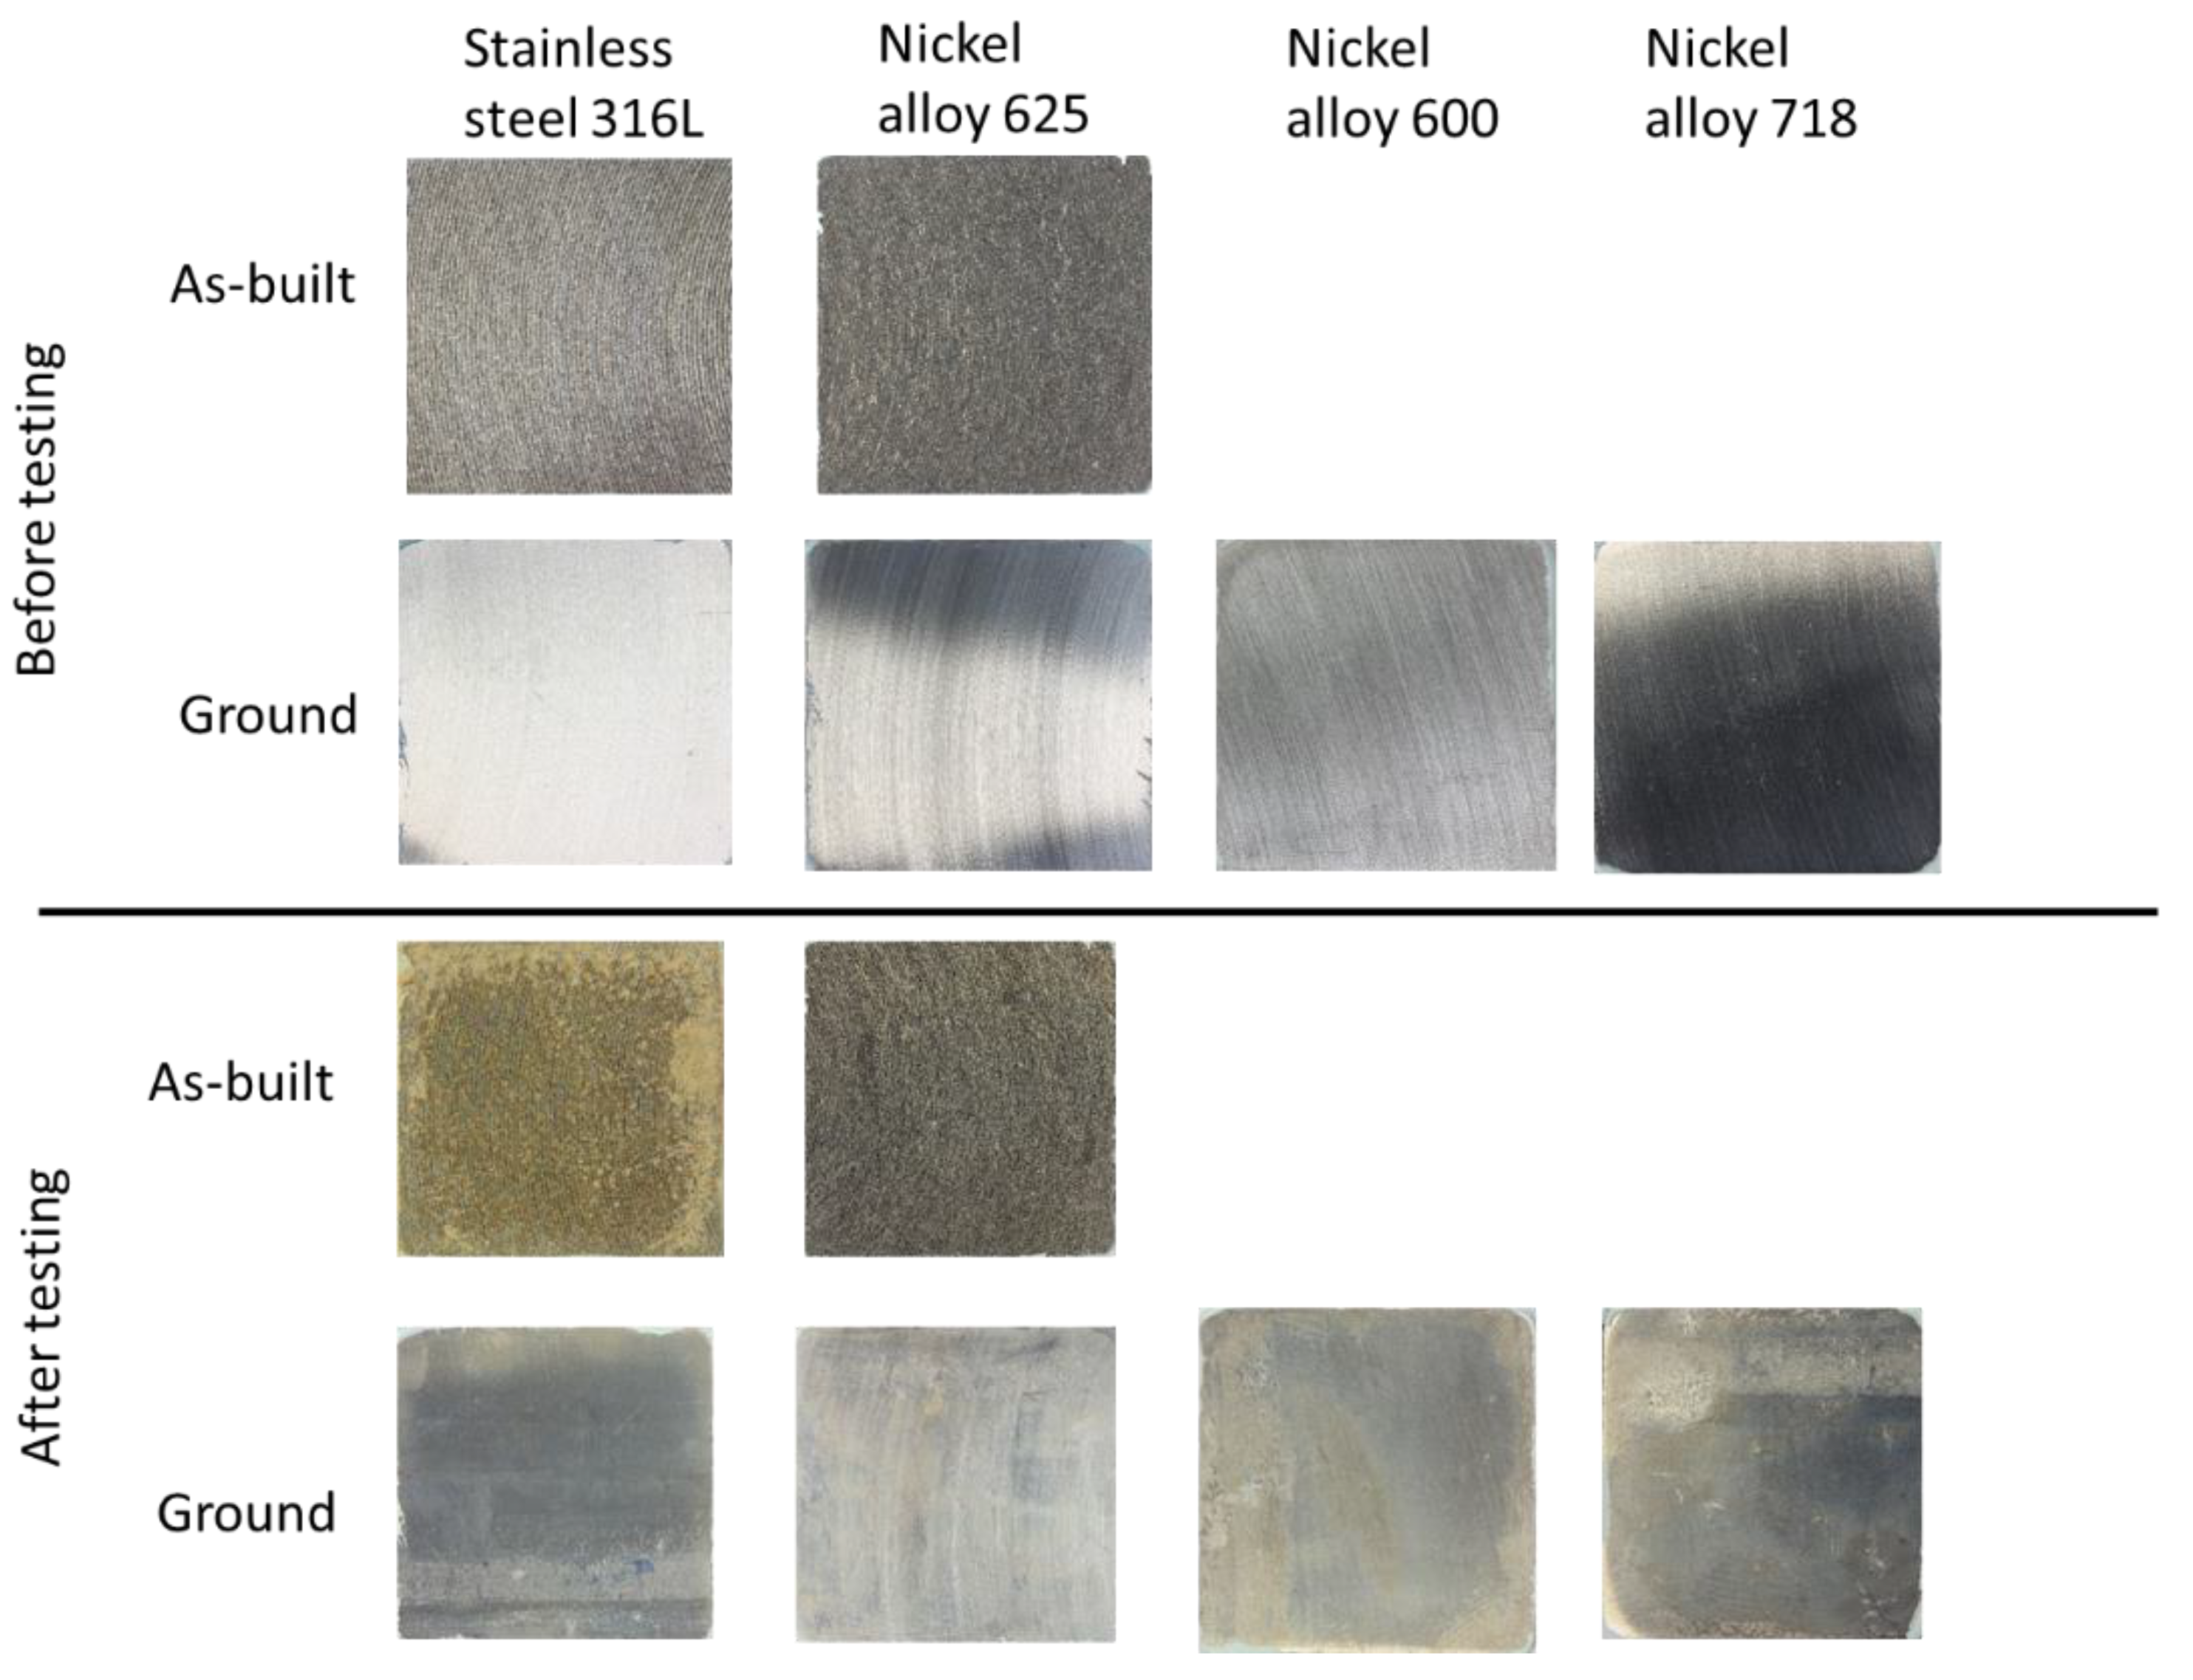
Figure 5.
Representative images obtained from the SEM-EDX analysis of the surface of the samples after testing: (a) Inconel alloy 600, (b) 718, (c) 316 ground, (d) 316 as-built, (e) 625 ground, (f) 625 as-built, (g) EDX-maps of calcium, oxygen, magnesium and silica for 718 as built and (h) EDX-maps of calcium, oxygen, magnesium and silica for 625 as built.
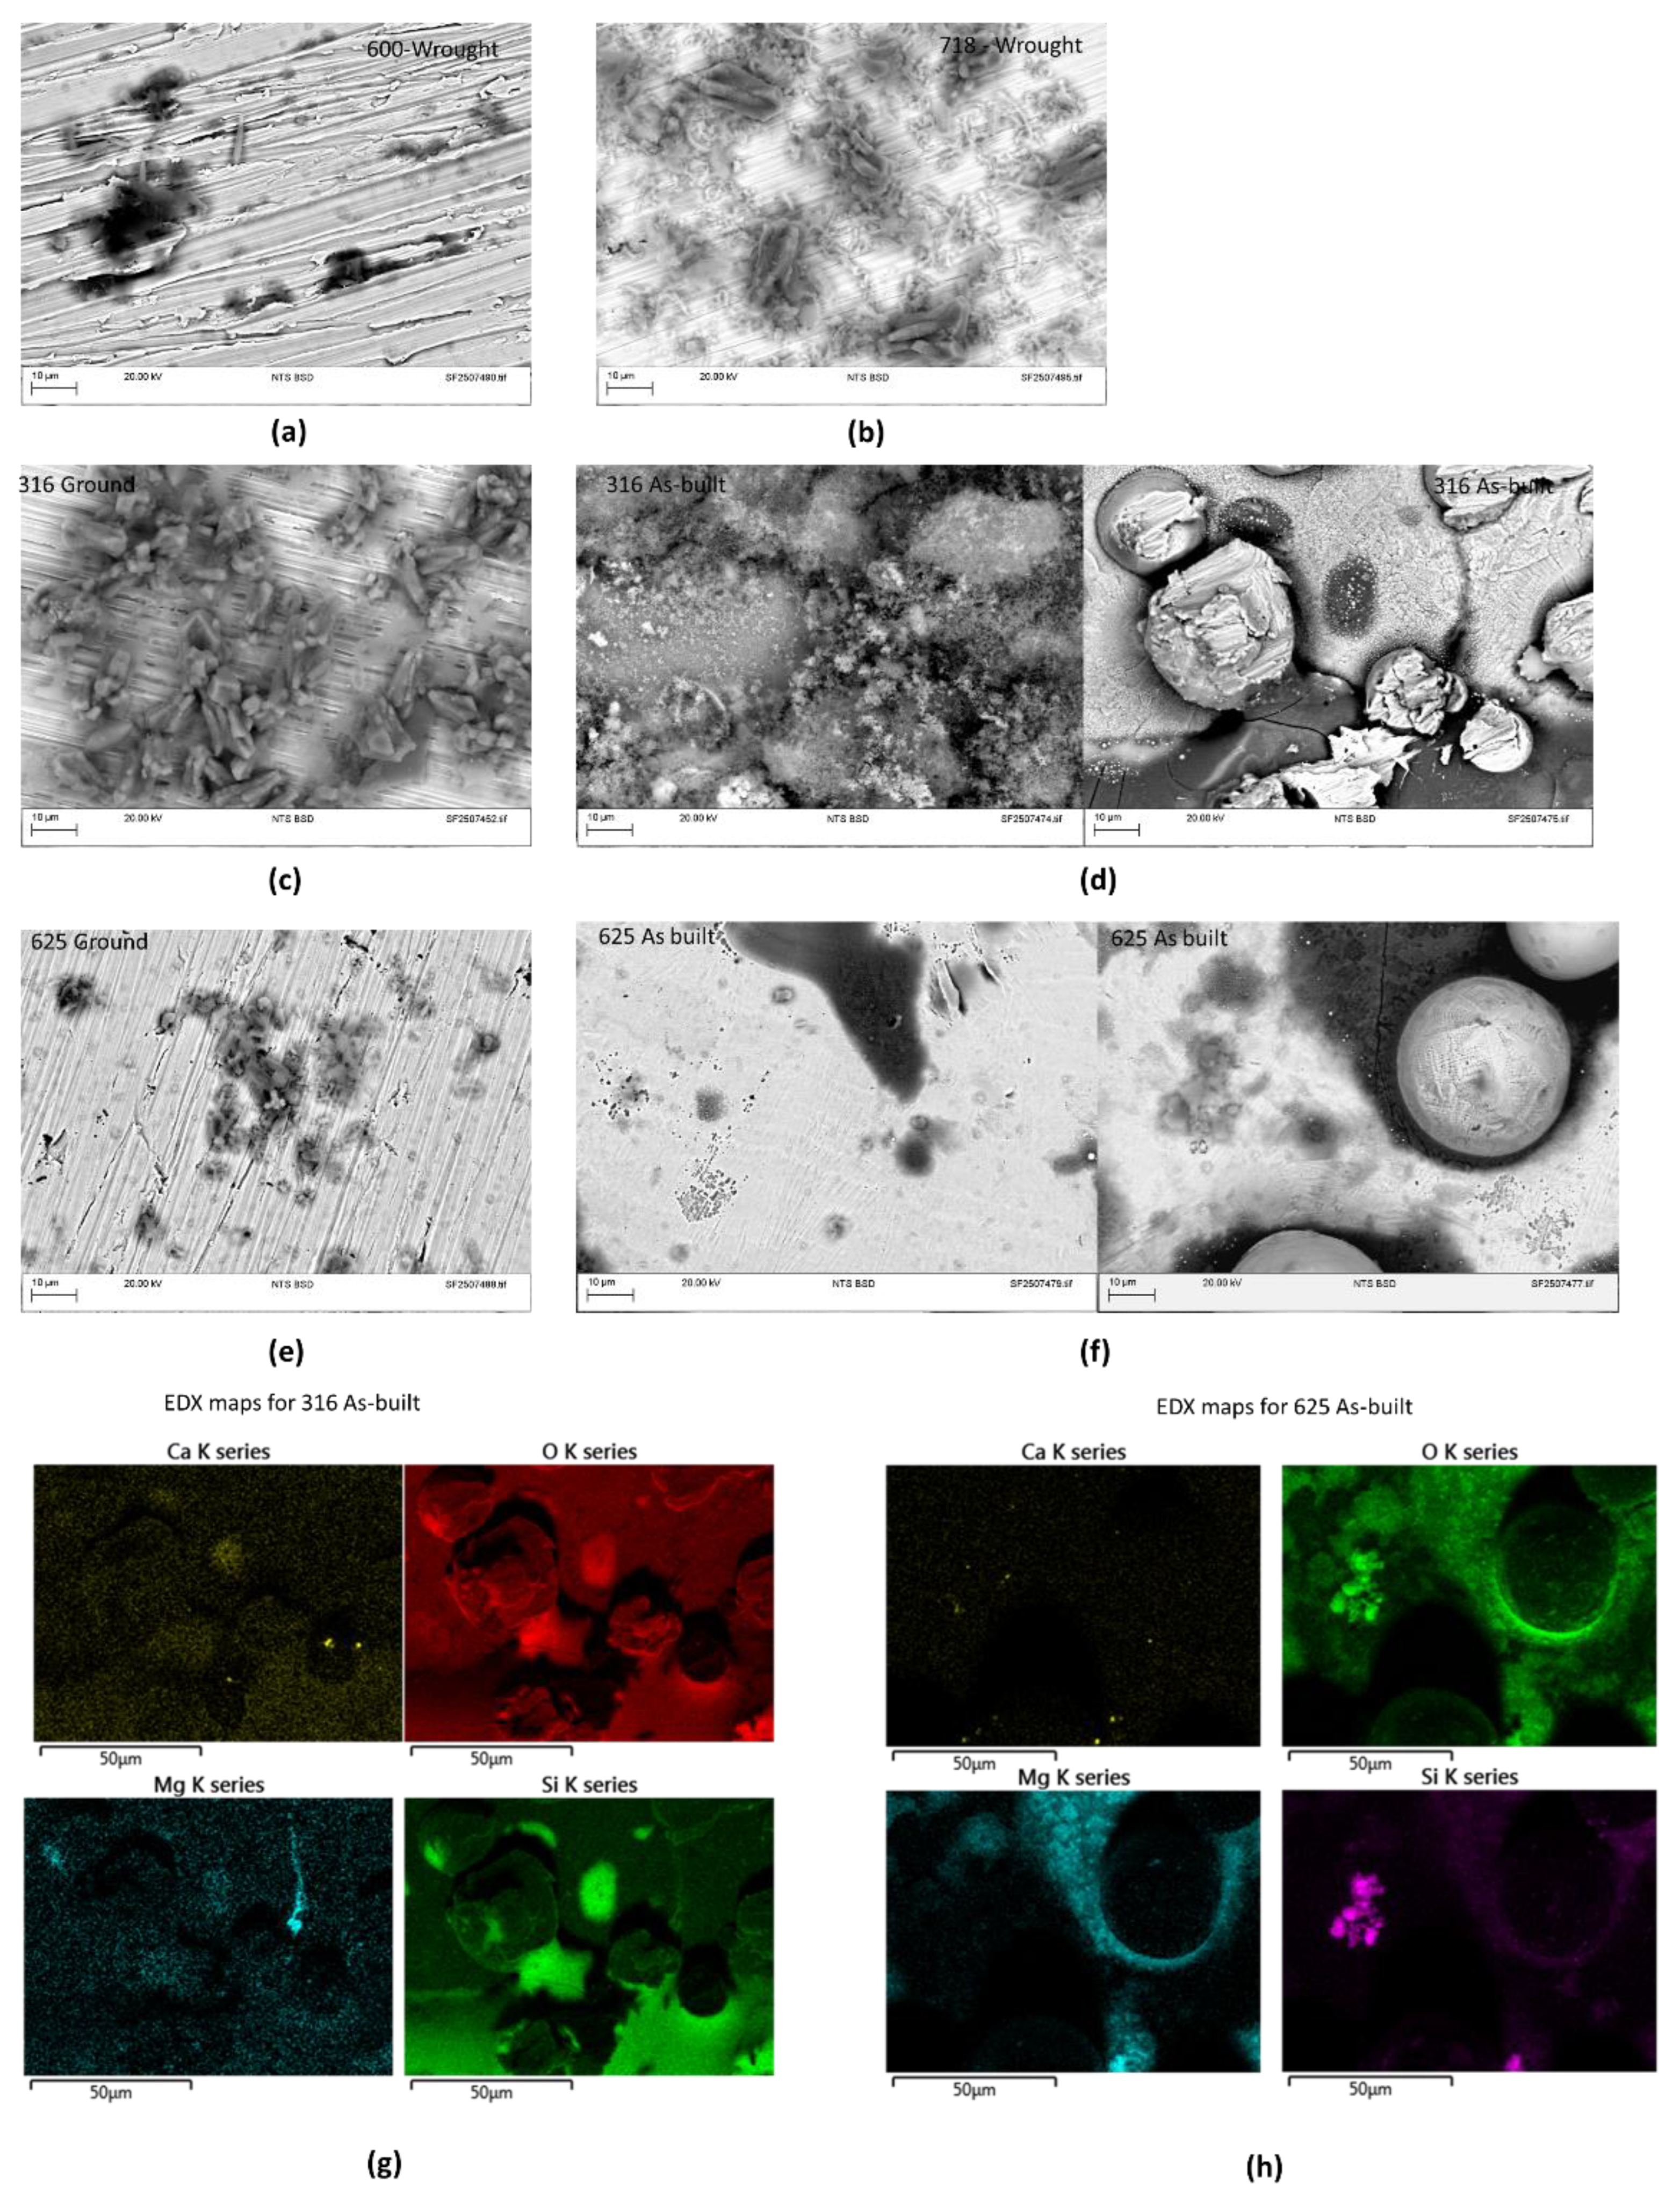
Figure 7.
Cross-sectional micrographs of the stainless steel (316L) as-built coupons used in the flow-rig tests.
Figure 7.
Cross-sectional micrographs of the stainless steel (316L) as-built coupons used in the flow-rig tests.
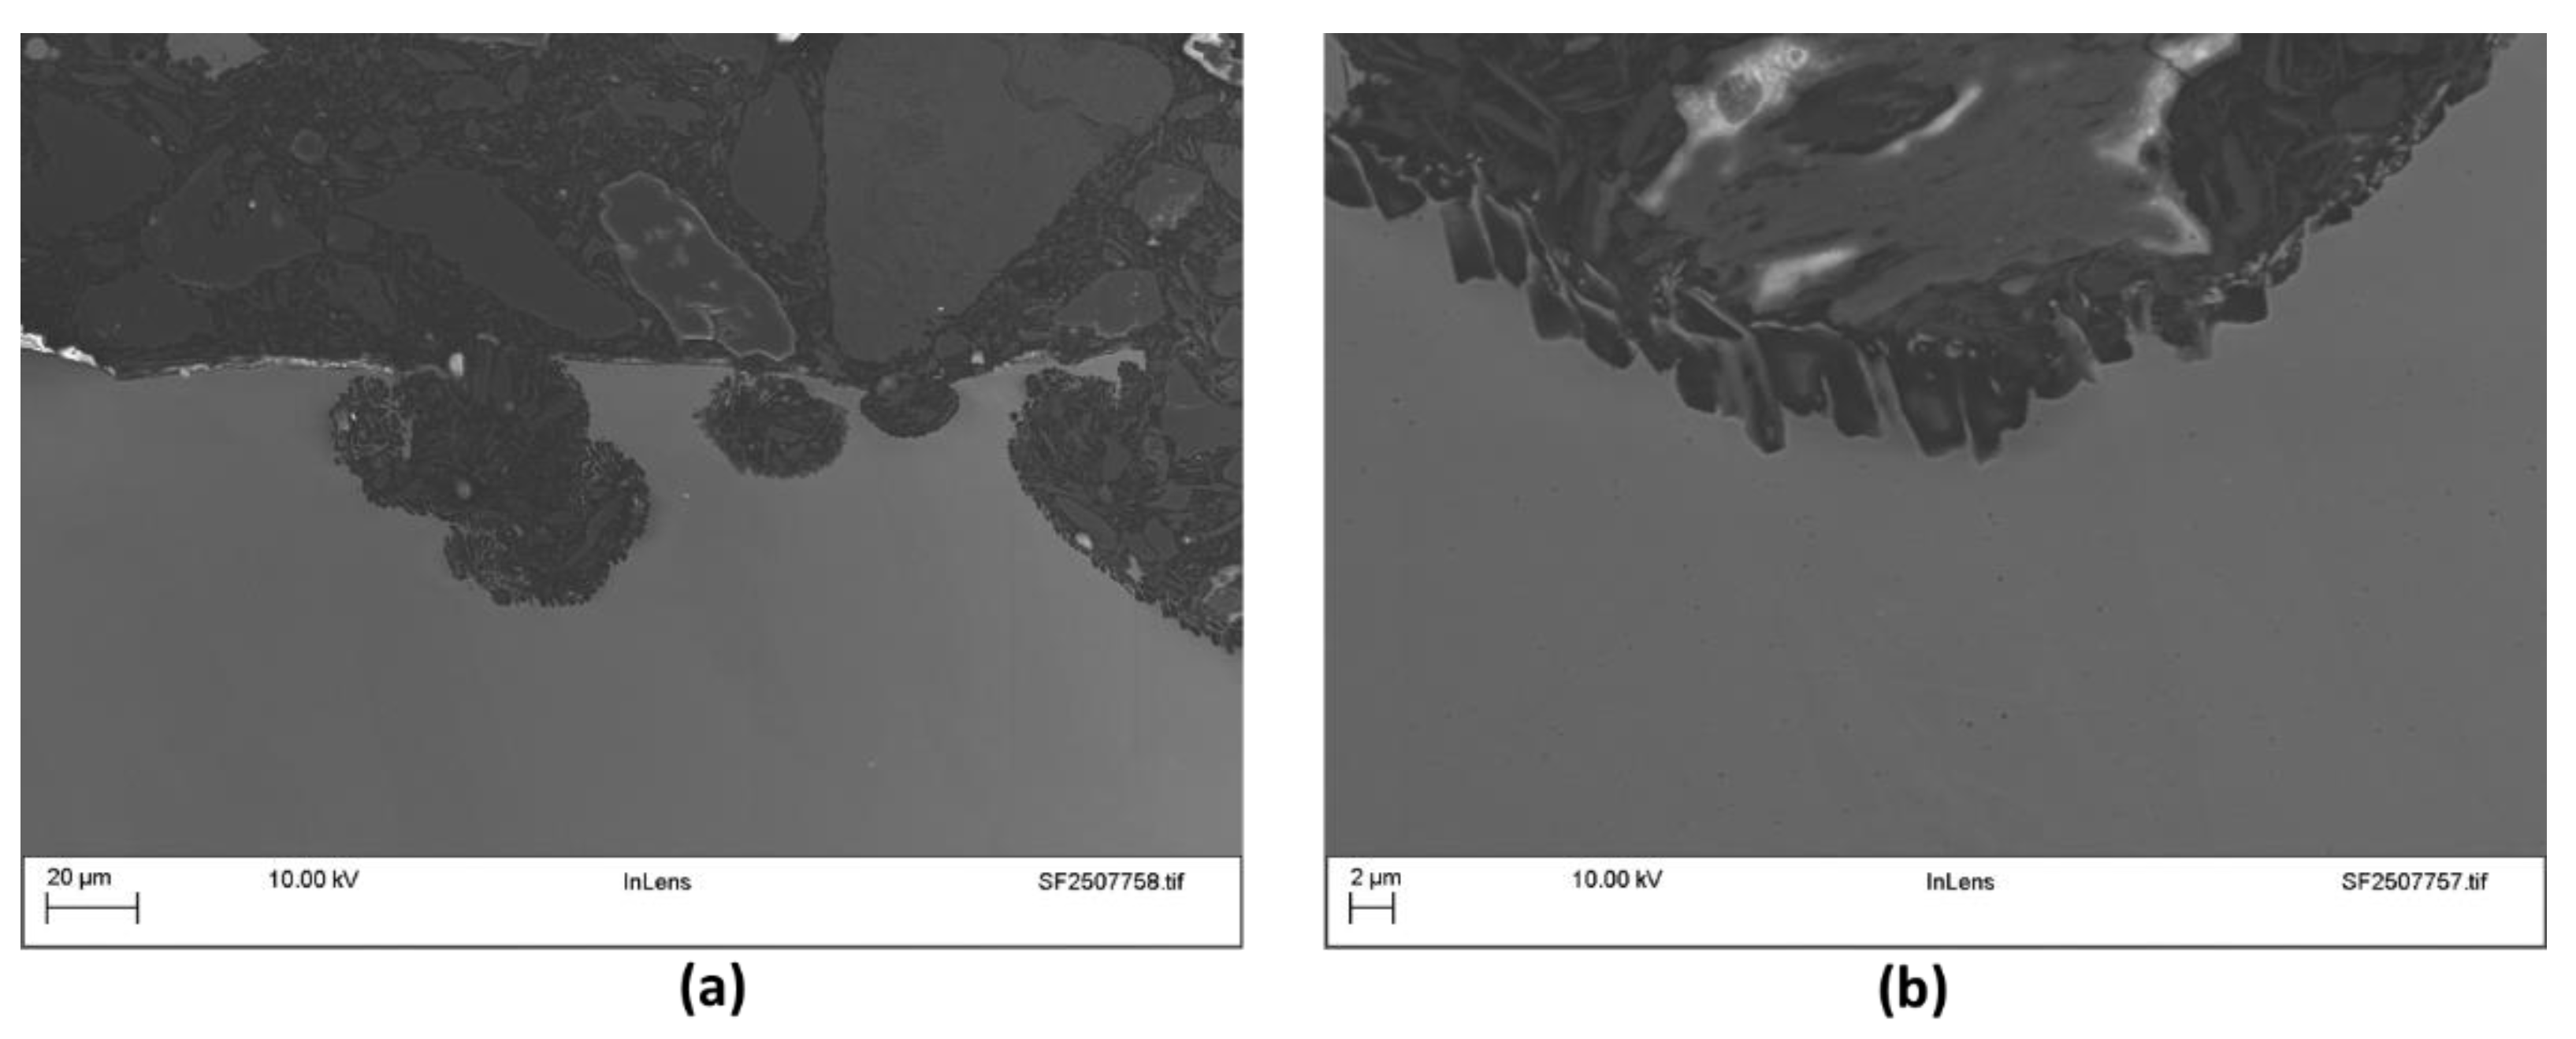
Figure 8.
Current density versus temperature graph generated during the ASTM G150 tests.
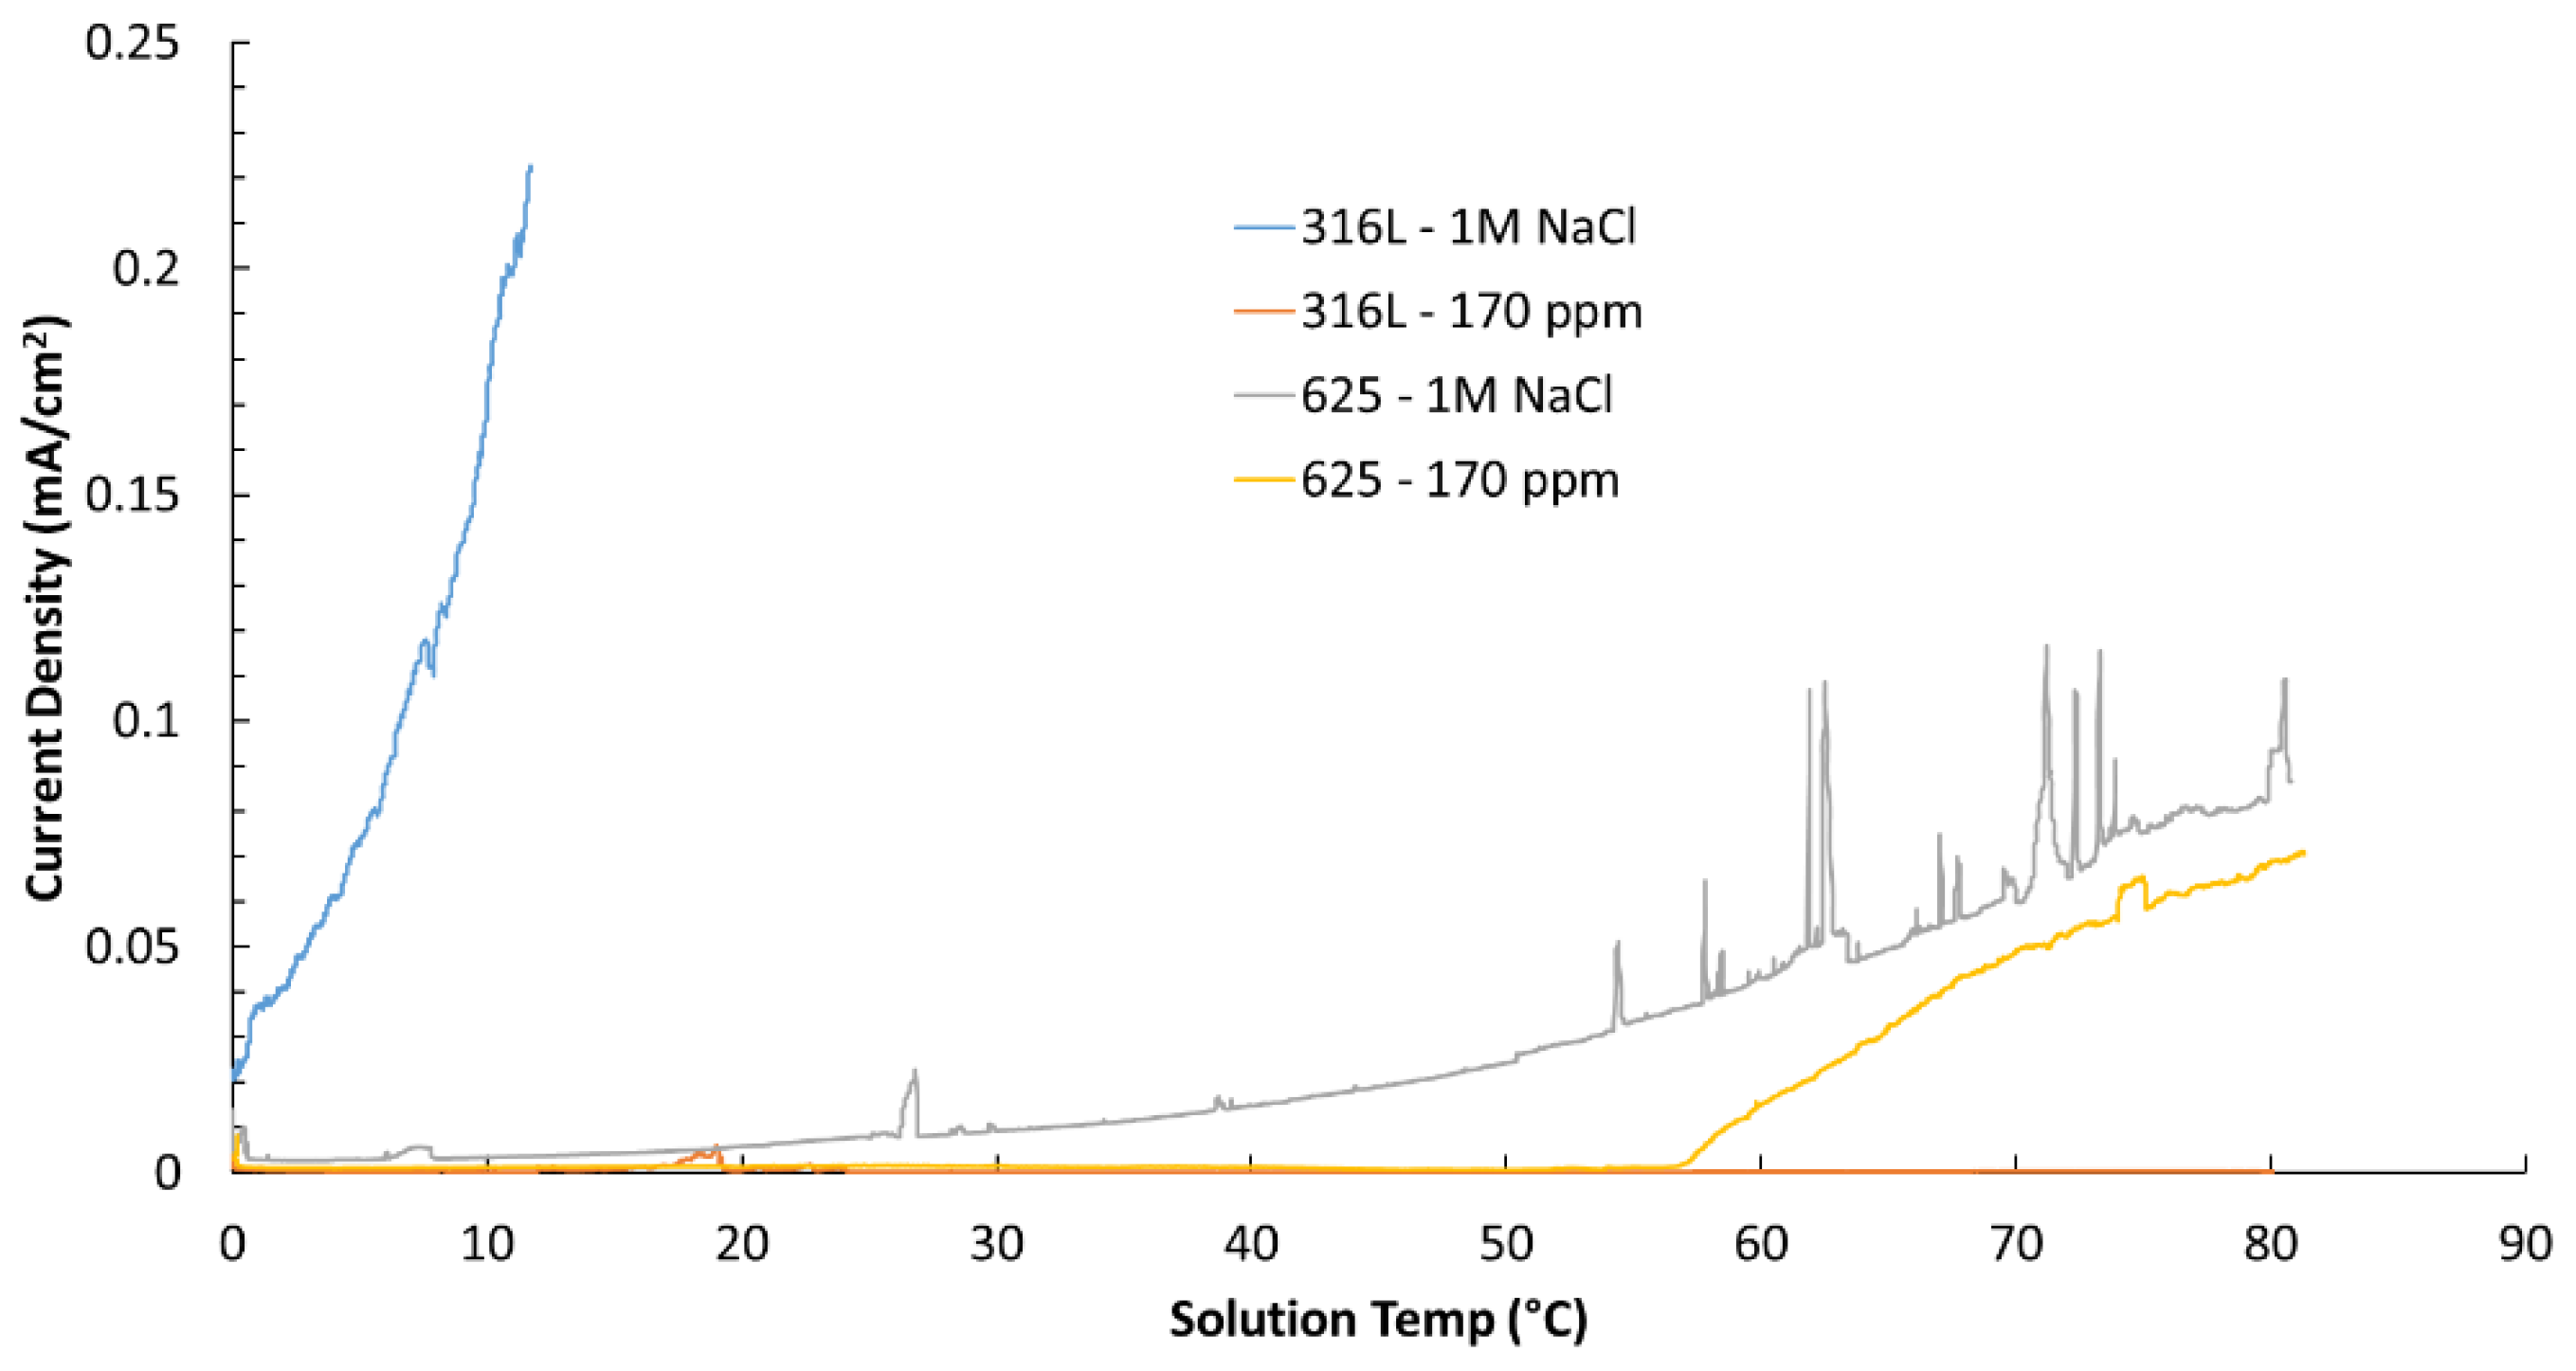
Figure 9.
Potentiodynamic scans carried out in simulated geothermal brine at elevated temperature (70 °C).
Figure 9.
Potentiodynamic scans carried out in simulated geothermal brine at elevated temperature (70 °C).
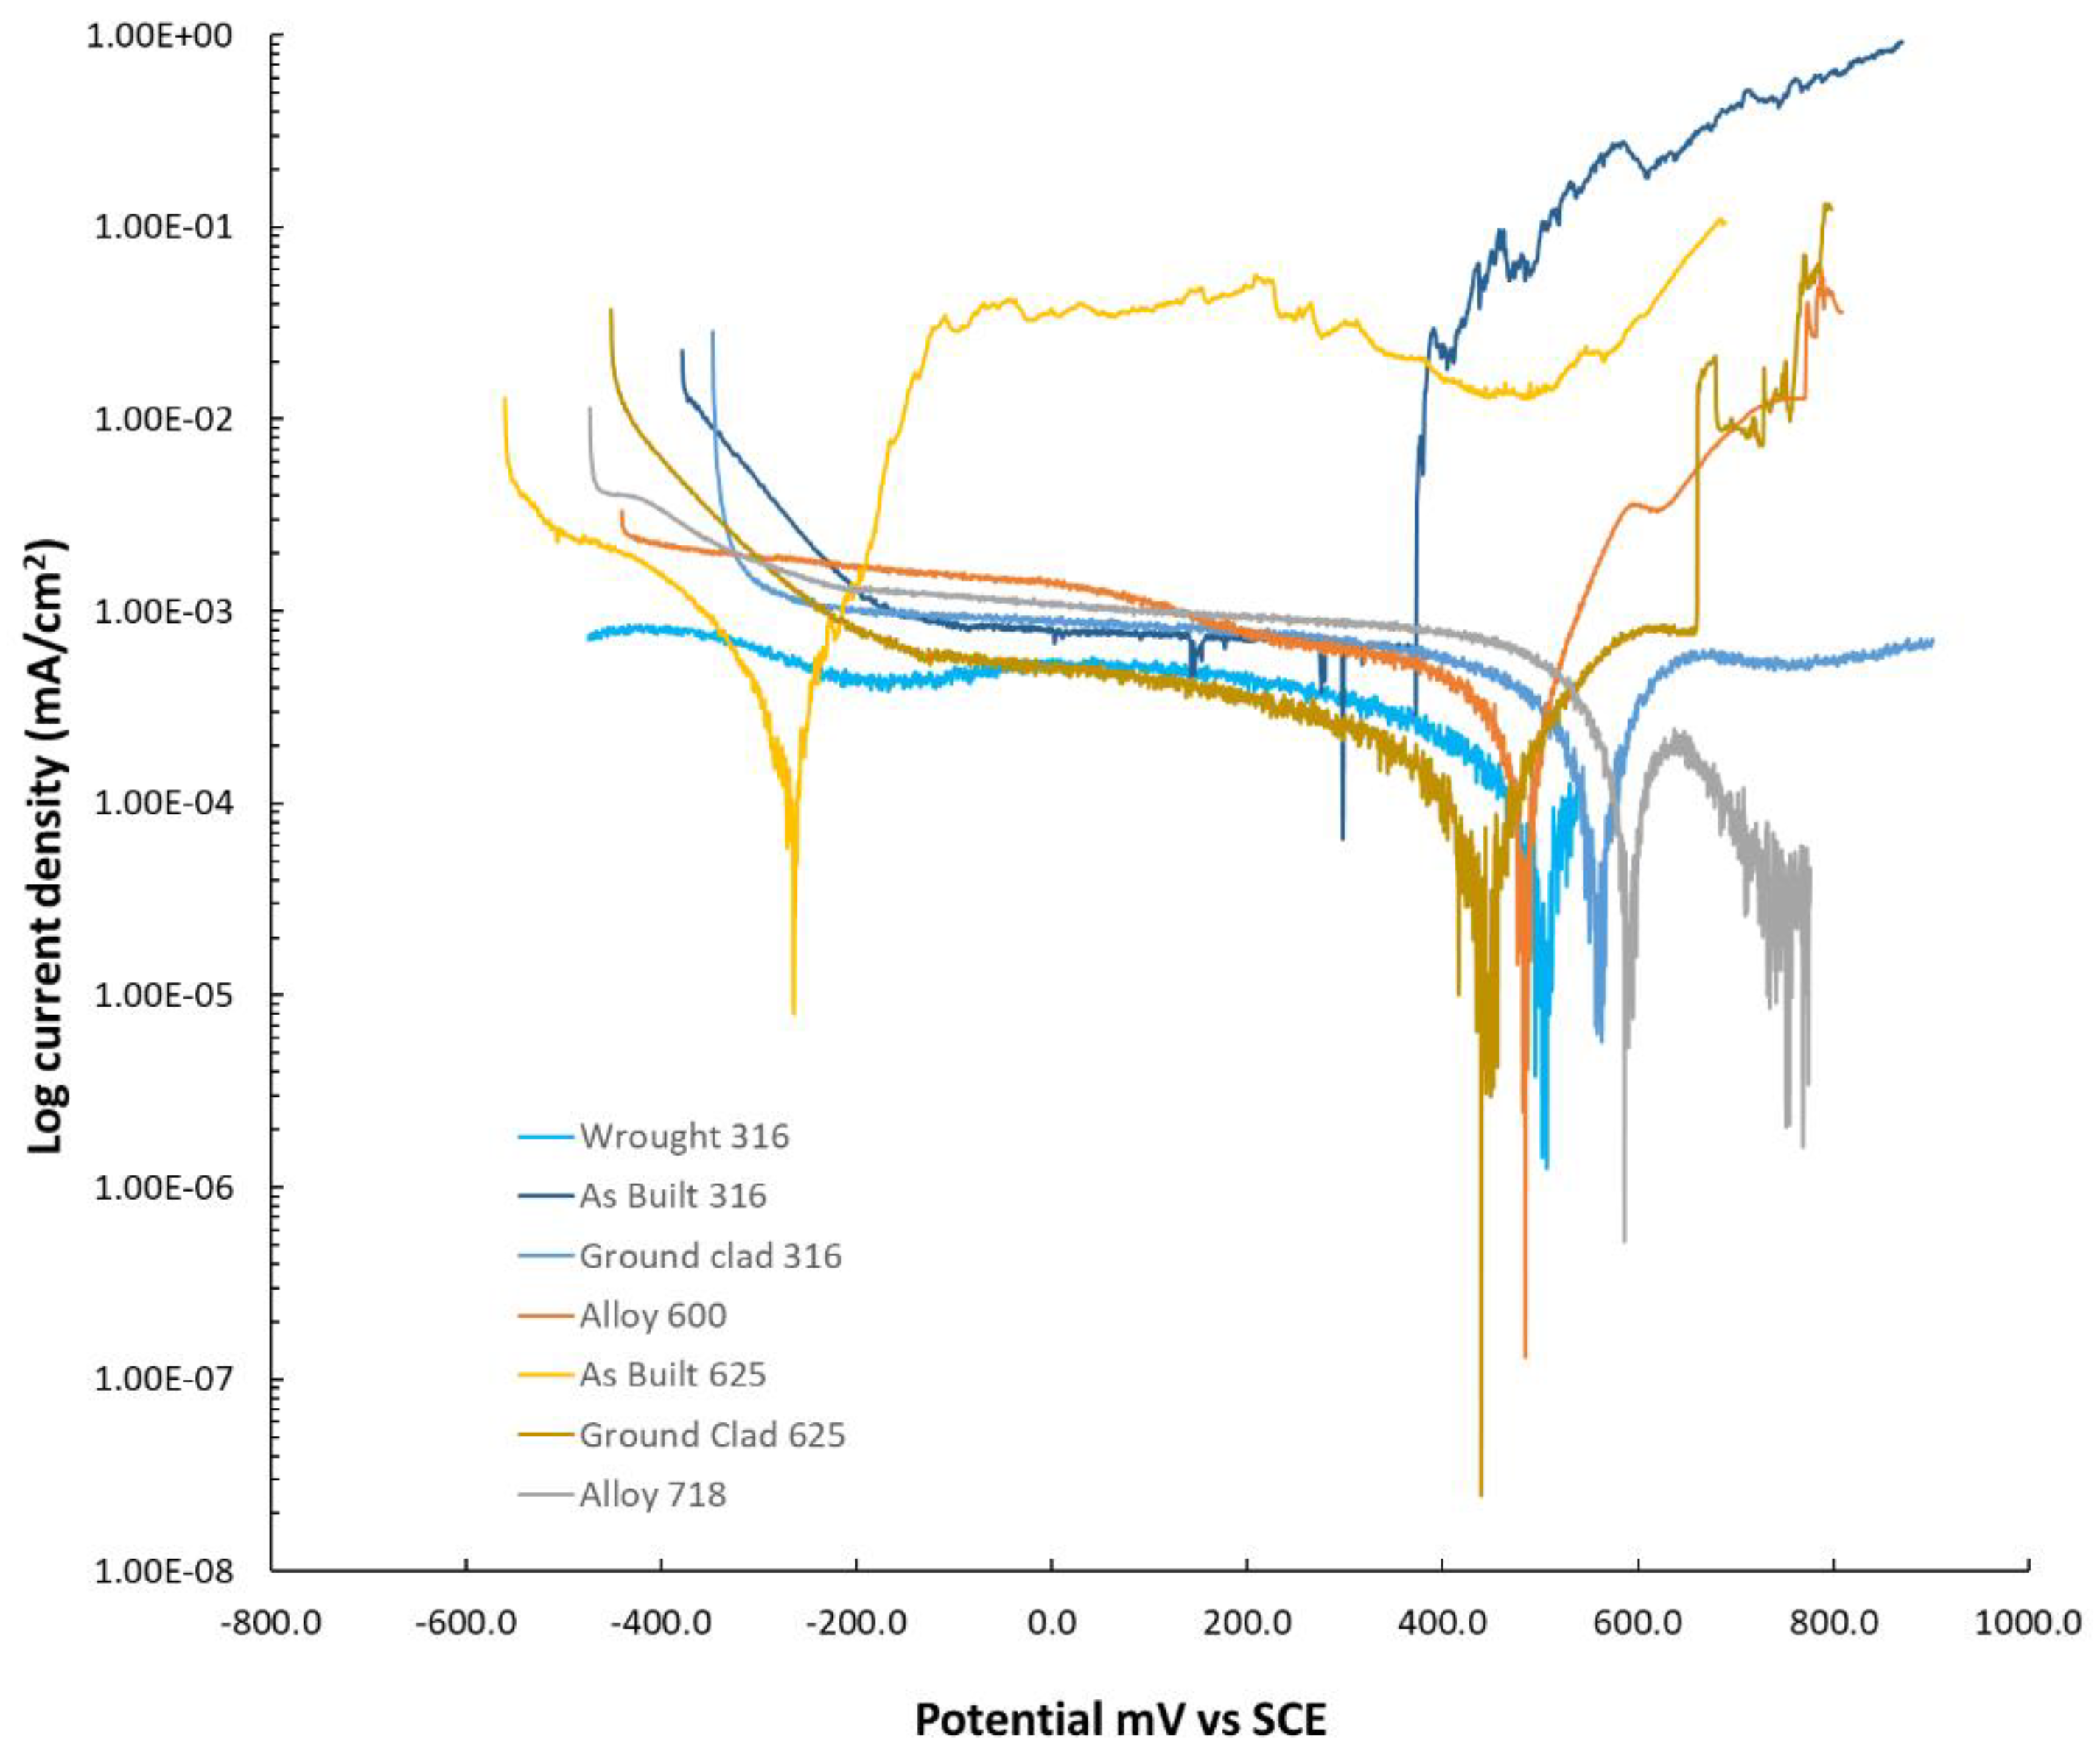

Table 1.
Process parameters employed during cladding deposition for the specimens used in the corrosion tests.
Table 1.
Process parameters employed during cladding deposition for the specimens used in the corrosion tests.
| Material | Spot Size (mm) |
Laser Power (kW) |
Speed (m/min) |
Powder Feed rate (g/min) |
Feeder (RPM) |
Pitch % | Pitch (mm) |
|---|---|---|---|---|---|---|---|
| 625 | 3 | 2 | 10 | 15 | 1.1 | 80 | 0.4 |
| 316L | 3 | 2.5 | 10 | 25 | 4.6 | 70 | 0.48 |
Table 2.
Results of the ASTM G150 tests and modified G150 tests with lower chloride concentration.
| Material | Environment | CPT value |
|---|---|---|
| 316L | 1M NaCl | 7.7 °C |
| 316L | 170 ppm chloride | >80 °C |
| 625 | 1M NaCl | >80 °C |
| 625 | 170 ppm chloride | >80 °C |
Disclaimer/Publisher’s Note: The statements, opinions and data contained in all publications are solely those of the individual author(s) and contributor(s) and not of MDPI and/or the editor(s). MDPI and/or the editor(s) disclaim responsibility for any injury to people or property resulting from any ideas, methods, instructions or products referred to in the content. |
© 2025 by the authors. Licensee MDPI, Basel, Switzerland. This article is an open access article distributed under the terms and conditions of the Creative Commons Attribution (CC BY) license (http://creativecommons.org/licenses/by/4.0/).
Copyright: This open access article is published under a Creative Commons CC BY 4.0 license, which permit the free download, distribution, and reuse, provided that the author and preprint are cited in any reuse.


