
Submitted:
24 October 2025
Posted:
27 October 2025
You are already at the latest version
Abstract
This study investigates the impact of institutional quality on digital financial inclusion (DFI) across 191 countries from 2004 to 2023, with a particular focus on regional and income-group heterogeneities. Using a two-step system generalised method of moments (GMM) estimator, the analysis addresses endogeneity, autocorrelation, and country-specific effects. The digital financial inclusion index is constructed through principal component analysis (PCA) of nine indicators representing access, usage, and quality, while the institutional quality index is derived from six World Governance Indicators. The findings reveal that institutional quality exerts a positive and significant influence on DFI, with government effectiveness, regulatory quality, and control of corruption emerging as the most influential dimensions. The effects are strongest in lower-middle-income countries and in developed regions such as North America. Long-run and marginal-effect analyses further confirm that stronger institutions enhance DFI. Robustness checks using alternative estimation techniques confirm the stability of the results. This study provides the first global empirical evidence linking institutional quality to digital financial inclusion, offering new insights into governance-driven financial ecosystems and practical policy implications for strengthening institutional frameworks to promote inclusive digital finance across diverse socio-economic contexts.
Keywords:
digital financial inclusion
; institutional quality
; system GMM
; global panel data
; income groups
; regions
1. Introduction
The twenty-first century has witnessed a transformative shift in the global financial landscape, propelled by the rapid advancement of digital technologies. Within this evolving context, digital financial inclusion (DFI) has gained prominence for its capacity to stimulate economic development, alleviate poverty, and promote social equity (Ben Abdallah et al., 2023; Chinoda and Kapingura, 2024). The World Bank (2025) defines digital financial inclusion as the use of cost-effective digital channels to extend formal financial services to excluded and underserved populations, delivered responsibly at an affordable cost and in a sustainable manner. Importantly, distinguishing DFI from traditional financial inclusion is essential for formulating policies that effectively address the distinct challenges of the digital realm and promote equitable access to financial services for vulnerable populations. Despite its transformative potential, approximately 1.4 billion adults globally remain unbanked (World Bank, 2024). This stark reality highlights a persistent challenge; although digital infrastructure is expanding, access, utilisation, and quality remain uneven, with significant disparities across regions and income groups (Ahmad et al., 2021; Baafi and Asiedu, 2025). The success of DFI is inherently linked to the institutional quality (IQ) of a country. The World Bank (2024) conceptualises institutional quality as the effectiveness and strength of a country’s institutions in fostering economic development, reducing corruption, maintaining social stability, and protecting citizens’ rights. Strong institutions, characterised by transparent governance, sound regulatory frameworks, and adherence to the rule of law, tend to foster trust, reduce risks such as fraud and cyber threats, and enhance the effectiveness of digital platforms. In contrast, weak institutional environments often lead to uncertainty, inefficiencies, and limited uptake of digital finance (Chinoda and Kapingura, 2024; Doku et al., 2023). Institutional quality, therefore, plays a critical enabling role, particularly in ensuring that DFI benefits reach the most marginalised and underserved populations.
Our study posits that in a global context where DFI is increasingly recognised as a catalyst for economic development, the prevailing discourse must move beyond simply extolling its benefits and help address the key issues/gaps faced. A common gap in the literature is the treatment of institutional quality as merely a subsidiary or moderating variable. This perspective risks diverting policy attention towards digital initiatives without addressing the foundational institutional reforms required for their success. To address this gap, the study examines a central but underexplored question: what is the direct and dynamic impact of institutional quality on digital financial inclusion? By investigating this relationship more explicitly, our study offers a robust empirical foundation for policymakers to better align institutional reforms with digital innovation, ensuring that DFI initiatives are both effective and sustainable. Regarding this, a global-level analysis is essential, given the considerable differences in institutional strength and digital financial development worldwide. For instance, Africa has witnessed impressive growth in mobile money services, yet institutional weaknesses often constrain this progress (Astuti et al., 2025). In Asia, while digital ecosystems are thriving, challenges persist around enforcement and consumer protection (Adel, 2024; Ozili, 2022). Furthermore, in advanced economies, such as those in Europe and North America, issues like cybersecurity and digital exclusion remain pressing (Bilal et al., 2024; Donnelly et al., 2024).
Additionally, income-level disparities highlight the varying institutional capacities of low- and high-income countries. While the former may require foundational reforms to create an enabling environment, the latter must strike a balance between innovation, regulatory oversight, and data protection (Garz et al., 2021). Accordingly, our study further undertakes both regional and income-level analyses to capture these complex dynamics. This approach facilitates cross-regional learning and supports the development of tailored policy responses, accounting for the socio-economic and institutional specificities of each context (Hasan et al., 2023; Le-Quoc, 2024). Although the growing interest in DFI underscores its transformative potential, its effectiveness remains heavily dependent on the institutional quality context. The existing literature has largely focused on broader financial inclusion, often overlooking the digital component and its unique dynamics. While studies have explored the institutional quality of financial inclusion (e.g., Muriu, 2020; Nsiah and Tweneboah, 2023; Nguyen and Ha, 2021; Van et al., 2022), to the best of our knowledge, no study has examined institutional quality as a central explanatory factor in the context of DFI. Where applicable, it is often considered an auxiliary or moderating influence (see Ofosu-Mensah Ababio et al., 2024; Doku et al., 2023). Our study differentiates itself in three significant ways. First, it adopts a global perspective rather than a purely regional one, allowing us to capture the full spectrum of institutional quality and digital inclusion. Second, it positions institutional quality as a primary driver, thereby investigating its direct and causal relationship with digital financial inclusion. Third, we construct a Digital Financial Inclusion Index (DFII) using principal component analysis (PCA). Unlike earlier studies that typically rely on general financial inclusion indicators as proxies for digital financial inclusion, our index is built from nine dedicated variables spanning access, usage, and quality, thereby offering a more precise measure of digital financial inclusion. In parallel, an institutional quality index (IQI) is developed using PCA, with separate consideration of governance dimensions. This methodological approach enables a more granular understanding of the mechanisms through which effective institutions foster inclusive digital finance. In doing so, our study addresses an important empirical gap by analysing the long-term, dynamic, and heterogeneous impacts of institutional quality on DFI across countries and income groups. This study makes several key contributions:
- i.
- It is among the first to empirically investigate the direct and dynamic impact of institutional quality on DFI at a global scale.
- ii.
- It conducts a systematic analysis across regions and income groups, unveiling context-specific institutional pathways.
- iii.
- It estimates long-run effects, highlighting the sustained influence of governance structures on digital financial development.
Notably, no study has directly investigated the role of institutional quality as the primary determinant of digital financial inclusion at the global level. Therefore, these contributions enrich the literature on good governance and digital finance, providing policymakers with practical knowledge to strengthen institutional frameworks in support of inclusive digital financial systems. The remainder of the paper is structured as follows: Section 2 reviews the relevant literature; Section 3 describes the methodology; Section 4 presents and discusses the empirical results; and Section 5 concludes with policy implications and suggestions for future research.
2. Literature Review
2.1. Theoretical Framework
Our theoretical framework for this study is built on the premise that institutional quality is a fundamental determinant of digital financial inclusion and broader economic outcomes. Institutional quality, encompassing dimensions such as governance effectiveness, the rule of law, regulatory quality, and the control of corruption, provides the essential legal and regulatory infrastructure that builds trust in digital platforms, reduces transaction costs, and encourages the widespread adoption of financial technologies (Ansari et al., 2024; Ofosu-Mensah Ababio et al., 2024). This is a well-established concept in the literature, with studies consistently showing that countries with robust institutional frameworks experience higher levels of DFI due to increased investor confidence and effective consumer protection mechanisms (Tay et al., 2022). Conversely, a lack of strong institutions can hinder digital financial inclusion by fostering an environment of uncertainty and regulatory inefficiency, ultimately leading to economic exclusion. This relationship can be understood through two key theoretical lenses.
Regulatory theory (Kane, 1988) posits that a country's financial regulations and supervisory frameworks shape the environment for digital banking, mobile money, and fintech innovations. Effective frameworks promote competition and enhance consumer protection, thereby fostering financial accessibility (Amnas et al., 2024). However, the theory also cautions that excessive regulatory burdens can stifle innovation. Complementing this, the Technology Acceptance Model (Davis, 1985) provides a micro-level perspective, explaining user adoption based on perceived ease of use and usefulness. Institutional quality directly influences these perceptions; in a well-regulated, secure environment, individuals are more likely to trust and adopt digital financial services (Ben Abdallah et al., 2023). Conversely, weak institutions can heighten digital scepticism and reduce participation.
This relationship is not uniform, as it varies significantly across continents and income groups due to differences in governance and socio-economic contexts (Lu, 2023; Van et al., 2022). For instance, in high-income countries, strong institutions facilitate the seamless integration of digital finance, whereas in developing nations, foundational institutional reforms such as improving the rule of law and combating corruption are crucial for establishing a viable digital financial ecosystem (Nsiah and Tweneboah, 2023; Meniago, 2025).
Over the long term, institutional quality has a sustained and profound impact on DFI. It fosters a stable environment that encourages investment and innovation, leading to the widespread adoption of digital financial services (Chinoda and Kapingura, 2024; Vo, 2025). Countries with strong institutions experience continued DFI expansion, driven by investor confidence and improved accessibility. However, in low-income nations, weaker institutional structures may hinder long-term progress, highlighting the need for strategic and sustained reforms (Konadu-Yiadom et al., 2025).
2.2. Empirical Literature
This section synthesises the empirical evidence of the key variables under study. The existing literature consistently highlights institutional quality, ICT diffusion, and technological adoption as pivotal factors that influence the pace and depth of financial inclusion. A recent study by Ofosu-Mensah Ababio et al. (2024) investigated how institutional quality moderates the link between digital financial inclusion and inclusive development in lower-middle-income countries (LMICs). Using a dynamic generalised method of moments (GMM) on a balanced panel of 48 LMICs from 2004 to 2022, they found a positive relationship between digital financial inclusion and inclusive development, which aligns with theoretical predictions. Similarly, Meniago (2025) examined the nexus between digital financial inclusion and economic growth within the Southern African Development Community. By constructing indices of digital financial inclusion and institutional quality using PCA and applying a system GMM to annual data from 2010 to 2023, the study confirmed that digital financial inclusion significantly enhances growth, particularly when supported by strong institutional frameworks.
Further evidence from Sub-Saharan Africa (SSA) comes from Abaidoo and Agyapong (2022), who explored the relationship between financial development and institutional quality using data from 29 countries between 2001 and 2018. Their findings demonstrated that institutional quality is a vital driver of financial development in the region. In a complementary study in India, Vyas and Jain (2021) examined the role of technology adoption in promoting financial inclusion. Drawing on survey data from 433 educated adults in Rajasthan, they applied the extended Technology Acceptance Model and found that technology adoption mediates the relationship between the digital economy and financial inclusion, underscoring the behavioural and institutional dimensions of technology-driven finance. Expanding on the SSA context, Doku et al. (2023) analysed 34 countries from 2004 to 2021 to assess the moderating effect of institutional quality on the digital finance–financial inclusion nexus. Their two-stage system GMM approach concluded that while digital financial technologies significantly enhance financial inclusion on their own, institutional quality further amplifies this impact. At a global level, Vo (2024) employed a panel smooth transition regression on data from 110 countries (2004–2020), finding that the effect of institutional quality on financial inclusion is asymmetric, varying according to income levels. Nasreen et al. (2023) applied panel quantile regression to data from 22 Asian economies (2004–2020), reporting that both ICT diffusion and institutional quality significantly promote financial inclusion, particularly in terms of penetration, accessibility, and usage of financial services.
Similarly, Zeqiraj et al. (2022), analysing 73 developing countries with multiple dynamic panel estimators, showed that institutional quality plays a central role in improving access to and use of formal financial services. The interplay between institutions, digital financial inclusion, and economic growth is further highlighted by Chinoda and Kapingura (2024), who examined SSA economies between 2014 and 2020. Their findings revealed that institutional quality and governance significantly strengthen the positive effect of digital financial inclusion on growth. While factors like trade and population growth were also supportive, inflation exerted a negative influence. Complementary evidence is provided by Ben Abdallah et al. (2023), who studied 14 Middle East and North Africa countries from 2000 to 2021 and found that the digitisation of financial services strongly supports financial inclusion. Likewise, Ahmad et al. (2021), focusing on Chinese provinces, introduced a novel index of digital financial inclusion that captures coverage, usage, and digitalisation. Their results confirmed that both digital financial inclusion and human capital exert a significant positive impact on economic growth.
In summary, whilst the existing studies are robust and provide valuable perspectives, they remain fragmented, with findings often constrained to regional contexts and specific methodologies. Given that, this study explores the global and dynamic interplay between institutional quality and digital financial inclusion. Furthermore, the effects of heterogeneity across regions and income groups remain under-investigated. These gaps motivate the present study to provide a comprehensive global analysis, thereby offering a deeper theoretical understanding and practical policy implications for emerging and developing economies.
3. Methodology
3.1. Data Collection and Sources
The dataset used consists of unbalanced panel data covering 191 countries for 20 years (2004-2023), where two-step system GMM estimation is employed to address endogeneity and unobserved heterogeneity. The data sources are the World Bank’s World Development Indicators (WDI), Global Findex database, and the World Governance Indicators (WGI). Missing values were addressed using multiple imputation with predictive mean matching in Stata. This approach, widely recognised as a best practice, preserves the distributional properties of the original data, reduces potential bias from incomplete observations, and enhances the robustness of the final dataset (Rubin, 1987; Morris et al., 2014).
3.2. Econometric Model
To empirically investigate the key variables, we specify a dynamic panel data model that captures both the persistence of digital financial behaviour over time and the structural factors influencing it. Our model is grounded in the assumption that digital financial inclusion is not only formed by contemporaneous institutional frameworks but also exhibits inertia, whereby past levels of inclusion significantly affect current outcomes. By incorporating lagged dependent variables, the model reflects this dynamic nature. Furthermore, to mitigate endogeneity concerns, particularly those arising from simultaneity, reverse causality, and omitted variable bias, we adopt a two-step system GMM estimator. This approach enables us to control for country-specific unobserved heterogeneity, autocorrelation, and potential feedback effects, thereby yielding robust and consistent estimates of the study. To address the issue of potential endogeneity, a dynamic two-step system GMM estimation was used (Ofosu-Mensah Ababio et al., 2024).
The model is expressed as:
where t = 1, …, T, and i = 1, …, N denote the time and the country indices, respectively. is the dependent variable, representing the digital financial inclusion index for the country at time is the first lag of the dependent variable, capturing the dynamic nature of digital financial inclusion over time; is the independent variable, representing the aggregate institutional quality index, while represent its six sub-dimensions: voice and accountability, political stability and absence of violence/terrorism, government effectiveness, regulatory quality, rule of law, and control of corruption; represent control variables including GDP per capita, urban population, financial literacy proxy and trade openness; are parameters to be estimated; denotes country-specific fixed effects, capturing time-invariant unobserved heterogeneity; represents time-fixed effects (year dummies), controlling for global shocks and common macroeconomic trends, and is the idiosyncratic error term.
Expanding equation (1), the baseline estimation model becomes:
3.3. Principal Component Analysis and Variable Definitions
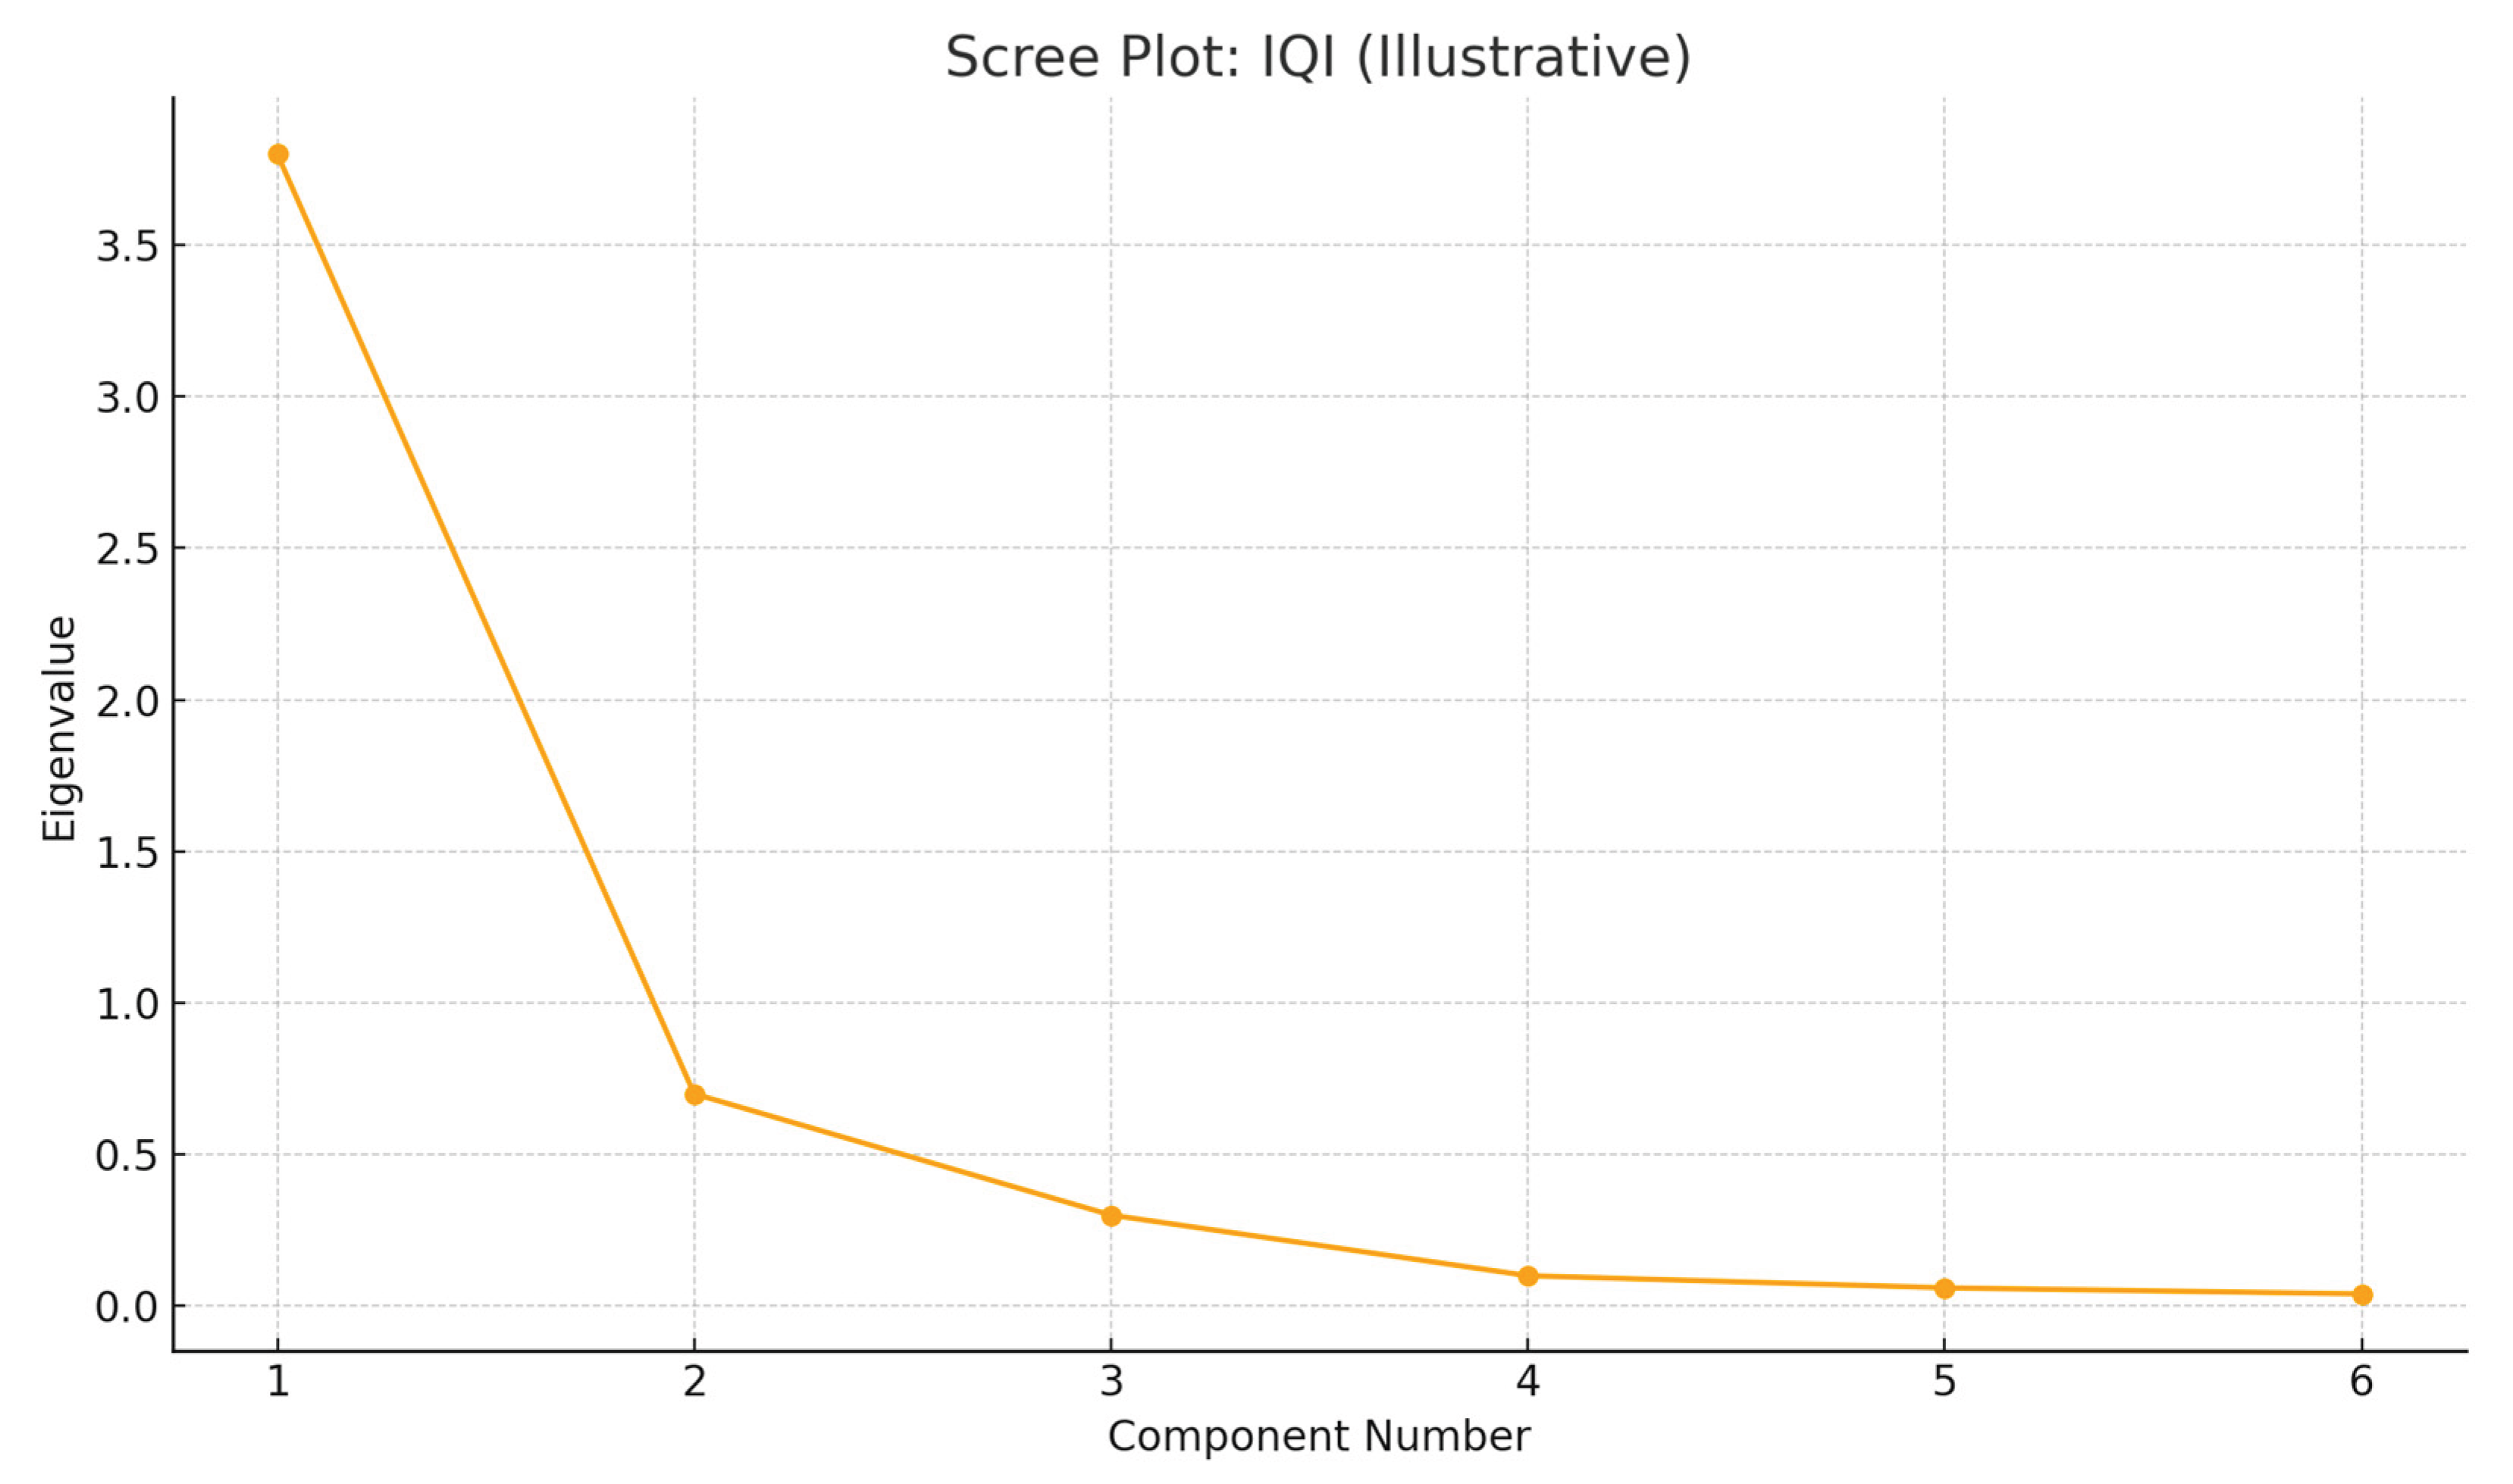
To construct robust measures for the digital financial inclusion index (DFII) and the institutional quality index (IQI), this study employed principal component analysis (PCA). The PCA was conducted separately for the indicators comprising each index. As shown in Appendix A, the first principal component (PC1) in each case had an eigenvalue greater than one and accounted for a substantial proportion of the total variance, approximately 63.8% for DFII and 76.0% for IQI. This suggests that PC1 adequately captures the underlying latent structure of the included indicators and justifies its use as the representative composite index for both constructs. The scree plots (Figure A1 and Figure A2) further support this decision by displaying a clear inflection point after the first component, confirming the application of the Kaiser criterion and the dominance of PC1 in explaining the common variance across the indicators (see Appendix A). Below are the variable definitions and measurements used in the analysis:

Table 1.
Variable Definitions and Measurements.
| Variable Category | Variable Name | Symbol | Definition and Measurement | Source |
| Dependent Variable | Digital Financial Inclusion Index | DFII | Composite index derived using PCA from nine components across three dimensions of digital financial inclusion: | Constructed using PCA |
| Access Dimension | ||||
| Internet Penetration | INTP | % of individuals using the internet. | WDI | |
| Mobile Phone for Transactions | MP | % of respondents using mobile phones to send money in the past year. | Findex | |
| Account Ownership | AO | % of individuals aged 15+ with an account at a formal financial institution or mobile money provider. | Findex | |
| Usage Dimension | ||||
| Debit Card Ownership | DC | % of adults (15+) holding a debit card. | Findex | |
| Mobile Money Transactions | MMT | Number of active mobile money accounts used for digital payments. | WDI | |
| Credit Card Ownership | CD | % of adults (15+) holding a credit card. | Findex | |
| Quality Dimension | ||||
| Secure Internet Servers | SIS | Number of secure internet servers per million people, proxy for cybersecurity. | WDI | |
| Automated Teller Machines | ATM | Number of ATMs per 100,000 adults, proxy for financial infrastructure. | WDI | |
| Borrowers from Commercial Banks | BCB | Number of borrowers from commercial banks per 1,000 adults, proxy for lending accessibility. | WDI | |
| Independent Variable | Institutional Quality Index | IQI | Composite index constructed via PCA from six governance indicators. | Authors' computation using PCA |
| Government Effectiveness | GE | Perceptions of quality of public services and civil service. | WGI | |
| Regulatory Quality | RQ | Perceptions of government’s ability to implement sound policies for private sector development. | WGI | |
| Rule of Law | RL | Perceptions of confidence in and compliance with societal rules. | WGI | |
| Control of Corruption | CC | Perceptions of extent to which public power is exercised for private gain. | WGI | |
| Voice and Accountability | VA | Perceptions of citizen participation, freedom of expression, and association. | WGI | |
| Political Stability and Absence of Violence/Terrorism | PSAVT | Perceptions of likelihood of political instability and politically-motivated violence. | WGI | |
| Control Variables | GDP per Capita | GDPPC | Economic development, measured in current US dollars. | WDI |
| Financial Literacy | FL | Adult literacy rate (% of population aged 15+), proxy for financial literacy. | WDI | |
| Urban Population | UP | % of total population living in urban areas. | WDI | |
| Trade Openness | TO | Sum of exports and imports as % of GDP, proxy for economic integration. | WDI |
3.4. Estimation Technique and Robustness Check
Given the potential challenges of endogeneity and unobserved time-invariant heterogeneity across countries, we employed the two-step system GMM estimator developed by Blundell and Bond (1998) and Arellano and Bover (1995). The choice of the system GMM approach is justified by the dataset's characteristics, where the number of cross-sectional units (N) exceeds the period (T), making it appropriate for dynamic panel estimation. This method effectively addresses endogeneity concerns by using internal instruments, specifically, lagged levels and first differences of the endogenous variables, while simultaneously correcting for heteroskedasticity and autocorrelation within large panels. Also, several robustness checks were conducted to ensure the reliability and validity of the empirical findings (See Table 7). While alternative estimators, including ordinary least squares (OLS), feasible generalised least squares (FGLS), and fixed effects (FE) and random effects (RE) models, were also tested, the system two-step GMM method was ultimately preferred owing to its superior performance in addressing dynamic panel data challenges.
4. Empirical Results and Discussions
4.1. Descriptive Statistics
Table 2 presents the descriptive statistics for the main variables employed in the study. Digital financial inclusion records a mean value close to zero (–0.017) with a standard deviation of 1.211, indicating moderate variation across observations. The distribution is slightly positively skewed (0.310) with a kurtosis of 2.852, suggesting a near-normal distribution. The institutional quality index is also centred around zero (mean = –0.008) with relatively low variation (standard deviation = 0.977). Its positive skewness (0.342) and relatively flat kurtosis (2.514) reflect heterogeneous governance outcomes across countries. The lagged DFII exhibits similar characteristics, reaffirming consistency in digital financial inclusion globally.
The disaggregated indicators show wider disparities. For example, control of corruption has an average score of 43.87, with a large standard deviation (31.36), underscoring marked cross-country differences. Political stability and absence of violence/terrorism also display high variability, with values ranging from zero to 60.75. Voice and accountability show both positive and negative extremes, ranging from –9.98 to 18.71, with a near-normal distribution. Regulatory quality and the rule of law both exhibit positive skewness, indicating that while many countries score lower, a few record significantly higher values. Government effectiveness has a mean slightly below zero (–0.012) with negative skewness, suggesting more countries score below the global benchmark. Table 2 further shows that the lagged GDP per capita averages a value of –0.019, with moderate dispersion. Financial literacy exhibits a negative mean (–0.225), indicating relatively low literacy levels across the sample. However, the positive skewness (1.186) suggests that some countries perform better. The urban population has a wide variation (standard deviation = 1.292) and is positively skewed, while trade openness averages 25.74, with significant variation (standard deviation = 19.60), consistent with differences in trade intensity across economies.
4.2. Correlation Matrix
Table 3 reports the correlation matrix coefficients among the study variables. Digital financial inclusion is strongly and positively correlated with the institutional quality index (0.680, p < 0.01) and GDP per capita (0.773, p < 0.01), highlighting the complementarity between institutional strength, economic development, and financial inclusion. DFI is also positively associated with Government effectiveness (0.334, p < 0.01), Political stability (0.296, p < 0.01), and financial literacy (0.201, p < 0.01), underscoring the role of governance and knowledge in shaping financial inclusion outcomes. Institutional quality itself is moderately correlated with GDP per capita (0.387, p < 0.01) and rule of law (0.051, p < 0.01), suggesting institutional quality improves with economic advancement. Among institutional dimensions, government effectiveness shows particularly strong links with rule of law (0.517, p < 0.01) and Political Stability (0.527, p < 0.01), consistent with the notion that effective governance underpins stability and legal enforcement. Interestingly, urban population exhibits a negative correlation with DFI (–0.401, p < 0.01) and IQI (–0.256, p < 0.01), which may suggest that higher urbanisation does not necessarily guarantee improved institutional quality or inclusive finance. Trade openness, meanwhile, shows a negative association with most institutional indicators, such as regulatory quality (–0.430, p < 0.01) and Rule of Law (–0.494, p < 0.01), pointing to potential structural weaknesses in more open economies.
Our variance inflation factor (VIF) results, with an overall mean of 1.64, are well below the conventional threshold of 10, as recommended by Hair Jr. et al. (1995), indicating no serious multicollinearity concerns among the explanatory variables. This strengthens the reliability of the regression estimates that follow.
4.3. Baseline Estimation Results
Table 4 presents the baseline results from the main variables. Across all model specifications (Models 1–4), the lagged dependent variable DFII is consistently positive and highly significant (β ≈ 0.375, p < 0.01), indicating strong persistence in digital financial engagement over time. The IQI reveals a consistently positive and statistically significant association with L.DFII across all models (β ≈ 0.23, p < 0.01), indicating the importance of governance mechanisms in promoting digital financial inclusion. This result is consistent with existing literature, demonstrating the enabling role of institutional architecture in digital ecosystem development (Aracil et al., 2022; Doku et al., 2023). Furthermore, the marginal effect of the IQI on digital financial inclusion reveals meaningful sensitivity to governance improvements. Indicating that, all else equal, a one-unit rise in institutional quality leads to a 23.9% increase in digital financial inclusion. This finding underscores the policy relevance of institutional reform and resonates with global evidence on the role of governance transparency and regulatory coherence in driving digital adoption.
Our disaggregated indicators of IQ provide further understanding. Control of Corruption demonstrates a robust and significant positive effect throughout (β = 0.0076, p < 0.01), indicating that improved transparency and accountability promote digital financial inclusion. Similarly, government effectiveness demonstrates a strong positive influence (β ≈ 0.20–0.22, p < 0.01), reinforcing the role of administrative capacity and public service delivery in creating conducive environments for digital engagement (Chinoda and Kapingura, 2024). Conversely, rule of law consistently returns a negative and significant coefficient (β ≈ –0.011 to –0.014, p < 0.05), implying that overly stringent legal frameworks may hinder technological uptake, particularly in settings with limited regulatory agility. Political stability and absence of violence/terrorism vary in significance across models, but become notably negative in Models 3 and 4 (β ≈ –0.007, p < 0.01), suggesting that instability and uncertainty may hinder digital inclusion. Voice and accountability show marginal significance and a modest positive sign (β ≈ 0.0028, p < 0.10), warranting cautious interpretation. While participatory governance is generally associated with inclusive outcomes, its independent effect may be contingent on broader institutional relationships.
Among the macroeconomic controls, L.GDPPC exhibits the strongest positive impact (β ≈ 0.42, p < 0.01), affirming the role of economic freedom in supporting infrastructure and digital access. Financial literacy maintains statistical significance (β ≈ 0.095–0.15, p < 0.05), reinforcing the relevance of user capabilities in enabling meaningful financial engagement (Adel, 2024; Amnas et al., 2024). Urban population consistently shows a negative coefficient (β ≈ –0.26, p < 0.01), suggesting possible structural exclusion in dense urban environments, an issue that merits spatial disaggregation. Trade openness also appears to have a negative and significant effect (β ≈ –0.002, p < 0.01), indicating that liberalisation alone may not be sufficient to promote inclusive financial participation. Model diagnostics support the robustness of these estimates. The Arellano-Bond tests fail to reject the null hypothesis of no second-order autocorrelation (AR (2) p > 0.05), supporting the validity of the dynamic panel specification. Hansen and Sargan statistics (p > 0.10) confirm instrument validity. Additionally, the highly significant Wald Chi-squared values confirm the overall model's strength.
4.4. Heterogeneous Impact of Institutional Quality on Digital Financial Inclusion Across Continents
Table 5 reports the region-specific estimates for the main variables. The lagged dependent variable (L.DFII) remains positive and statistically significant across all regions (β = 0.160–0.318), confirming the persistence of digital financial inclusion. Europe exhibits the highest level of temporal dependence (β = 0.318), whereas North America records the lowest (β = 0.160), reflecting differences in maturity and diffusion patterns of digital finance. Institutional quality index is strongly and positively associated with DFII across all regions, with coefficients ranging from 0.185 (Asia) to 0.386 (North America).
These findings indicate that enhanced institutional frameworks are universally conducive to digital financial inclusion, with comparatively stronger effects in highly formalised governance environments such as North America. This result confirms the evidence reported by Vo (2024) and Zeqiraj et al. (2022). Sub-indicators reveal distinct regional patterns. Control of corruption positively influences DFII in Africa (β = 0.0059, p < 0.01), whereas its impact is small in Asia and Europe, reinforcing the assertion that anti-corruption mechanisms are particularly critical for digital inclusion in vulnerable institutional settings (Abaidoo and Agyapong, 2022). Political stability demonstrates a statistically significant negative impact only in North America (β = –0.0154, p < 0.01), possibly indicating heightened sensitivity to political tensions affecting end-user confidence in digital finance (Donnelly et al., 2024). Voice and accountability yield an average positive impact exclusively in Europe (β = 0.0037, p < 0.10), potentially reflecting favourable civic and regulatory environments conducive to digital participation. Conversely, lagged regulatory quality is significant in Africa, Asia and Europe, but not in North America, suggesting that regulatory evolution exerts greater influence in emerging markets with developing institutional structures. Rule of law negatively impacts DFII in Africa and Asia (β ≈ –0.021), whereas its effect decreases in Europe and North America. This could imply that rigid legal frameworks may suppress DFI where complementary institutional supports are lacking.
Government effectiveness emerges as a strong predictor of DFII across all regions, with its greatest impact found in North America (β = 0.588, p < 0.01), strengthening the argument that institutional competence and service delivery are crucial for digital inclusion. Lagged GDP per capita also exerts a robust positive influence across regions, peaking in Asia (β = 0.721), thus underscoring the strengthening role of economic development in digital financial adoption (Wang et al., 2023). Financial literacy indicates regional variation, being most influential in Asia (β = 0.576) and North America (β = 0.525), but relatively weak in Europe and Africa. This suggests that DFI remains uneven globally and supports targeted educational interventions (Van et al., 2022; Vo, 2025). Urban population shows a negative impact across all regions, with the sharpest impacts observed in Africa and Asia (β ≈ –0.370), indicating that infrastructural constraints and spatial inequality hinder digital outreach in urban centres. Trade openness yields mixed results, statistically significant only in Africa and Europe, suggesting that integration into global markets does not automatically translate into inclusive digital financial systems. All the diagnostic tests support model validity (See Table 5).
4.5. Heterogeneous Impact of Institutional Quality on Digital Financial Inclusion Across Income Groups
Table 6 presents the key income-group variable results aimed at uncovering the differential effects of IQI on the digital financial inclusion across country income levels. The lagged DFII variable is statistically significant and positively signed across all income groups (β ≈ 0.30–0.40), indicating strong path dependence and behavioural persistence in digital financial engagement. This finding corroborates prior findings on technology diffusion, particularly in financial ecosystems (Blundell and Bond, 1998; Ozili, 2022). Institutional quality emerges as a consistent and significant driver of DFII in all four income groups. The coefficient indicates low in low-income countries (β = 0.154, p < 0.01) and high in lower-middle-income economies (β = 0.286, p < 0.01), suggesting greater responsiveness among countries situated in transitional development phases. This heightened sensitivity could reflect a stage of digital readiness where institutional reforms yield disproportionately large gains (Vo, 2024).
Disaggregated institutional quality indicators provide further intuition. Control of corruption exerts a strong and significant influence in low-income economies (β = 0.0074), is modest in lower-middle-income countries (β = 0.0021), and is statistically insignificant elsewhere. This finding underscores the pivotal role of transparency and trust in supporting digital adoption in contexts where regulatory vulnerabilities are more pronounced (Aracil et al., 2022; Garz et al., 2021). Voice and accountability, though insignificant in low-income countries, demonstrate a positive and significant association with DFII in upper and high-income groups (β ≈ 0.0045–0.0051), pointing to the importance of civic participation and institutional openness in digitally advanced environments. These findings are in line with previous work on institutional sophistication and its moderating role in digital finance (Doku et al., 2023).
Lagged regulatory quality retains a positive and statistically significant impact across all income tiers, reinforcing the centrality of coherent regulatory frameworks in shaping inclusive digital finance. Rule of law, by contrast, is generally insignificant and only marginally negative in high-income economies (β = –0.0218, p < 0.10), supporting critiques that legal rigidity may stifle financial innovation in highly formalised environments (Kane, 1988). Government effectiveness remains a consistent and significant predictor of DFII, with coefficient values ranging from 0.164 in low-income economies to 0.259 in lower-middle-income contexts. This attests to the foundational role of state capacity and institutional delivery in expanding digital access (Chinoda and Kapingura, 2024).
Economic development, proxied by lagged GDP per capita, produces strong and significant coefficients across all categories (β ≈ 0.38–0.52), reaffirming that digital infrastructure and financial inclusion advance in tandem with broader economic maturity. Financial literacy, while significant in lower-middle and upper-income economies, is less so in low and high-income groups. The asymmetry may reflect educational and infrastructural limitations at the lower end and adoption plateaus at the upper end (Adel, 2024; Amnas et al., 2024). Urbanisation population shows a consistent relationship with reduced DFII across all income levels, with a significant negative association. This could point to exclusion dynamics, infrastructural mismatch, or digital congestion in urban centres. Likewise, trade openness bears a negative relationship in most income categories, but is absent only in the lower-middle group. This finding lends empirical support to growing concerns about the limits of market liberalisation in fostering inclusive digital finance (Donnelly et al., 2024). Model diagnostics tests show robust in all cases (See Table 6).
8. Robustness Test
Table 7 reports the robustness checks for the core variable estimates, applying a range of estimation techniques. The analysis employs OLS, FGLS, FE, RE, and one-step System GMM, thereby ensuring a comprehensive assessment of consistency across alternative econometric approaches. The lagged dependent variable, DFI, remains positive and statistically significant in every specification, with coefficients between 0.183 and 0.387. This persistent significance highlights the dynamic path-dependent nature of digital financial inclusion and supports the rationale for incorporating autoregressive elements into the model. Institutional quality also emerges as a consistently strong determinant of DFII across all estimators.
The coefficients vary from 0.224 in the GMM estimator to 0.352 under OLS, each significant at the 1% threshold. These findings align with cross-country evidence that effective institutions underpin digital financial inclusion (Vo, 2024). Moreover, diagnostic tests across all models confirm the reliability of the estimators (see Table 7).
5. Conclusion, Policy Implications, and Recommendations for Future Research
5.1. Conclusion
This study has provided fresh empirical evidence on the role of institutional quality in shaping digital financial inclusion across 191 countries, covering twenty years. By constructing novel composite indices for both DFI and institutional quality using PCA, and estimating a dynamic panel model through two-step system GMM, the study offers a robust understanding of the institutional drivers of digital financial inclusion.
The findings demonstrate a consistently positive and statistically significant relationship between institutional quality and digital financial inclusion. In particular, governance elements such as government effectiveness, control of corruption, and regulatory quality are found to be key enablers of digital financial expansion. The study also reveals that this relationship is not uniform across regions or income groups, with countries in the lower-middle-income and upper-middle-income categories showing the strongest marginal effects. These results suggest that improvements in governance deliver the greatest returns in transitional economies where foundational digital and financial infrastructures are still evolving. Furthermore, the study contributes to the broader literature by highlighting the importance of context-specific approaches to institutional reform. The persistence of DFI over time and the heterogeneity of impacts across regions underscore the need for tailored regulatory frameworks and targeted policy interventions. The robustness of the results across several estimation techniques adds further credibility to the empirical findings.
5.2. Policy Implications
Our empirical evidence suggests that strengthening institutional frameworks is crucial for promoting digital financial inclusion across all economies. The following actionable recommendations are derived: First, enhance regulatory quality and government effectiveness; in countries with fragile institutions, clear and transparent regulations should be prioritised to build public trust in digital finance and reduce transaction risks. Second, combat corruption through digital governance tools; anti-corruption reforms, including e-governance and blockchain-based monitoring systems, can create a more secure environment for digital financial transactions, especially in low-income and Sub-Saharan African economies. Third, tailor interventions by income group and region; the study shows greater institutional sensitivity in lower-middle-income countries. therefore, targeted reforms, such as simplified regulatory processes and digital identity infrastructure, can yield greater marginal benefits in these contexts. Fourth, address urban financial exclusion: the negative association between urbanisation and DFI suggests the need to redesign urban financial strategies. urban-specific fintech innovations, public-private partnerships, and infrastructure upgrades can reduce urban exclusion. Fifth, reassess trade liberalisation's role; policymakers should ensure that trade agreements and digital cross-border transactions include inclusive finance provisions, particularly for SMEs and marginalised communities, and lastly, global and regional collaboration; Multilateral development institutions should prioritise funding programmes that integrate institutional reform with financial inclusion objectives. Our findings provide a strong rationale for embedding institutional development at the core of national digital finance strategies, supporting inclusive economic growth and resilience.
5.3. Recommendations for Future Research
While our present study makes a significant contribution to the literature, it also opens avenues for further empirical and conceptual exploration. Future research may consider the following directions:
- Explore the mediating role of fintech development in the IQI and DFI relationship
- Investigate micro-level behavioural barriers to DFI in weak institutional settings
- Incorporate machine learning techniques to model non-linear interactions between institutions, innovation, and inclusion. By addressing these policy implications and pursuing these avenues for future research, the global community can collectively promote the agenda of digital financial inclusion, ensuring that the benefits of DFI are equitably distributed through strong institutional quality and contribute to sustainable development worldwide.
Appendix A
Table A1.
DFII Eigenvalues and Variance result.
| Component | Eigenvalue | % Variance Explained | Cumulative % |
| PC1 | 5.1 | 63.75 | 63.75 |
| PC2 | 1.1 | 13.75 | 77.5 |
| PC3 | 0.55 | 6.88 | 84.38 |
| PC4 | 0.45 | 5.63 | 90.0 |
| PC5 | 0.35 | 4.38 | 94.38 |
| PC6 | 0.2 | 2.5 | 96.88 |
| PC7 | 0.12 | 1.5 | 98.38 |
| PC8 | 0.08 | 1.0 | 99.38 |
| PC9 | 0.05 | 0.63 | 100.0 |
Figure A1.
Scree plot for DFII result.
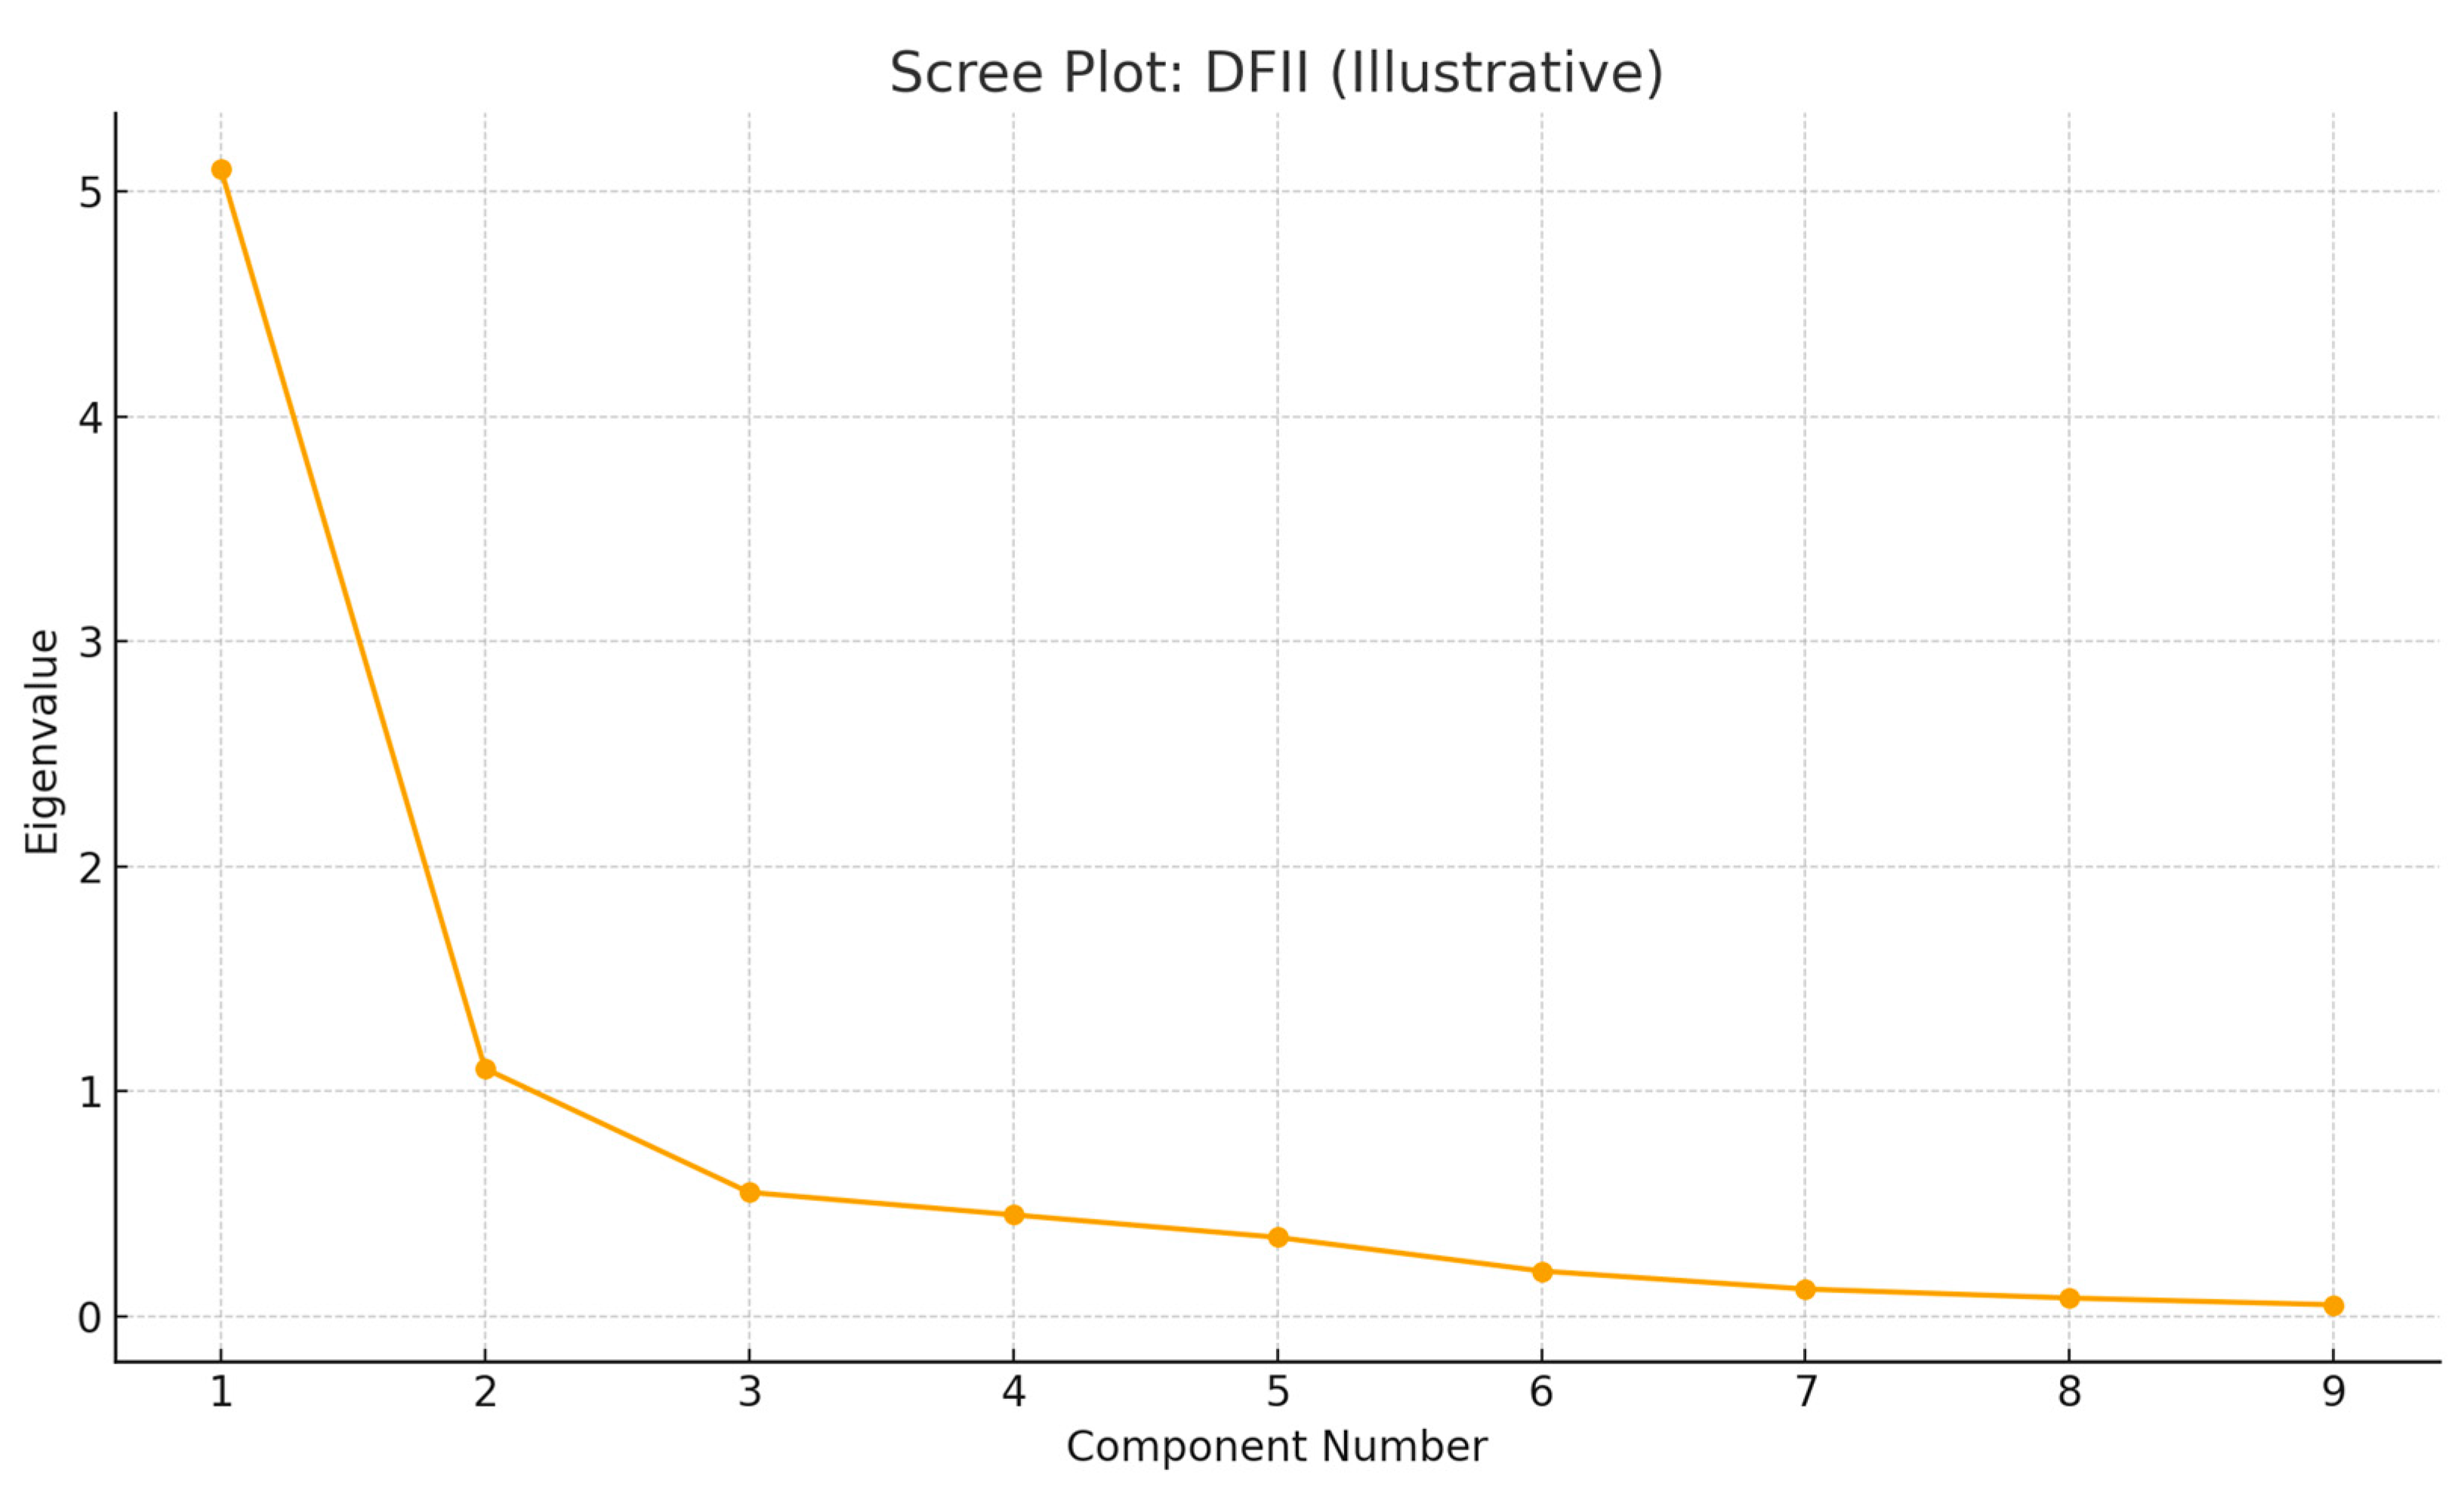
Table A2.
IQI Eigenvalues and Variance result.
| Component | Eigenvalue | % Variance Explained | Cumulative % |
| PC1 | 3.8 | 76.0 | 76.0 |
| PC2 | 0.7 | 14.0 | 90.0 |
| PC3 | 0.3 | 6.0 | 96.0 |
| PC4 | 0.1 | 2.0 | 98.0 |
| PC5 | 0.06 | 1.2 | 99.2 |
| PC6 | 0.04 | 0.8 | 100.0 |
Figure A2.
Scree plot for IQI result.
References
- Abaidoo, R.; Agyapong, E.K. Financial development and institutional quality among emerging economies; Journal of Economics and Development, 2022; Vol. 24, No. 3, pp. 198–216. [Google Scholar]
- Adel, N. The impact of digital literacy and technology adoption on financial inclusion in Africa, Asia, and Latin America; Heliyon, 2024; Vol. 10, No. 24. [Google Scholar]
- Ahmad, M.; Majeed, A.; Khan, M.A.; Sohaib, M.; Shehzad, K. Digital financial inclusion and economic growth: Provincial data analysis of China; China Economic Journal, 2021; Vol. 14, No. 3, pp. 291–310. [Google Scholar]
- Amnas, M.B.; Selvam, M.; Parayitam, S. FinTech and financial inclusion: Exploring the mediating role of digital financial literacy and the moderating influence of perceived regulatory support; Journal of Risk and Financial Management, 2024; Vol. 17, No. 3. [Google Scholar]
- Ansari, M.A.A.; Sajid, M.; Khan, S.N.; Antohi, V.M.; Fortea, C.; Zlati, M.L. Unveiling the effect of renewable energy and financial inclusion towards sustainable environment: Does interaction of digital finance and institutional quality matter? Sustainable Futures, 2024; Vol. 7, p. 100196. [Google Scholar]
- Aracil, E.; Gómez-Bengoechea, G.; Moreno-de-Tejada, O. Institutional quality and the financial inclusion-poverty alleviation link: Empirical evidence across countries; Borsa Istanbul Review, 2022; Vol. 22, No. 1, pp. 179–188. [Google Scholar]
- Arellano, M.; Bover, O. Another look at the instrumental variable estimation of error-components models; Journal of Econometrics, 1995; Vol. 68, No. 1, pp. 29–51. [Google Scholar]
- Astuti, H.M.; Ayinde, L.A. Uneven progress: Analysing the factors behind digital technology adoption rates in Sub-Saharan Africa; Data & Policy, 2025; Vol. 7, p. Article e23. [Google Scholar]
- Baafi, J.A.; Asiedu, M.K. The synergistic effects of remittances, savings, education and digital financial technology on economic growth in Sub-Saharan Africa, Journal of Electronic Business & Digital Economics, 2025.
- Ben Abdallah, A.; Becha, H.; Kalai, M.; Helali, K. Does digital financial inclusion affect economic growth? New insights from MENA region. International Conference on Digital Economy; Springer; Cham, 2023; pp. 195–221. [Google Scholar]
- Bilal, S.; Teevan, C.; Tilmes, K. Financing inclusive digital transformation under the EU Global Gateway. In ECDPM Discussion Paper 370; Maastricht; ECDPM, 2024. [Google Scholar]
- Blundell, R.; Bond, S. Initial conditions and moment restrictions in dynamic panel data models; Journal of Econometrics, 1998; Vol. 87, No. 1, pp. 115–143. [Google Scholar]
- Chinoda, T.; Kapingura, F.M. Digital financial inclusion and economic growth in Sub-Saharan Africa: The role of institutions and governance; African Journal of Economic and Management Studies, 2024; Vol. 15, No. 1, pp. 15–30. [Google Scholar]
- Davis, F.D. A technology acceptance model for empirically testing new end-user information systems: Theory and results. PhD thesis, Massachusetts Institute of Technology, 1985. [Google Scholar]
- Doku, J.N.; Iddrisu, K.; Bortey, D.N.; Ladime, J. Impact of digital financial technology on financial inclusion in Sub-Saharan Africa: The moderating role of institutional quality; African Finance Journal, 2023; Vol. 25, No. 2, pp. 31–45. [Google Scholar]
- Donnelly, S.; Ríos Camacho, E.; Heidebrecht, S. Digital sovereignty as control: The regulation of digital finance in the European Union; Journal of European Public Policy, 2024; Vol. 31, No. 8, pp. 2226–2249. [Google Scholar]
- Garz, S.; Giné, X.; Karlan, D.; Mazer, R.; Sanford, C.; Zinman, J. Consumer protection for financial inclusion in low- and middle-income countries: Bridging regulator and academic perspectives; Annual Review of Financial Economics, 2021; Vol. 13, No. 1, pp. 219–246. [Google Scholar]
- Hair, J. F., Jr.; Anderson, R. E.; Tatham, R. L.; Black, W. C. Multivariate Data Analysis. In New York. NY: Macmillan Publishing Company, 3rd Edn. ed; 1995. [Google Scholar]
- Hasan, R.; Ashfaq, M.; Parveen, T.; Gunardi, A. Financial inclusion – Does digital financial literacy matter for women entrepreneurs? International Journal of Social Economics, 2023; Vol. 50, No. 8, pp. 1085–1104. [Google Scholar]
- Kaiser, H. F. The application of electronic computers to factor analysis. Educational and psychological measurement 1960, 20(1), 141–151. [Google Scholar] [CrossRef]
- Kane, E.J. Interaction of financial and regulatory innovation; The American Economic Review, 1988; Vol. 78, No. 2, pp. 328–334. [Google Scholar]
- Konadu-Yiadom, E.; Domeher, D.; Appiah, K.O.; Frimpong, J.M. Digital finance, institutional quality, and carbon dioxide emissions in Africa. Climate and Development 2025, 1–18. [Google Scholar] [CrossRef]
- Le-Quoc, D. The relationship between digital financial inclusion, gender-inequality, and economic growth: Dynamics from financial development; Journal of Business and Socio-Economic Development, 2024; Vol. 4, No. 4, pp. 370–388. [Google Scholar]
- Lu, F. How does financial development environment affect regional innovation capabilities? New perspectives from digital finance and institutional quality; Journal of Information Economics, 2023; Vol. 1, No. 1, pp. 31–46. [Google Scholar]
- Meniago, C. Digital financial inclusion and economic growth: The moderating role of institutions in SADC countries; International Journal of Financial Studies, 2025; Vol. 13, No. 1. [Google Scholar]
- Morris, T.P.; White, I.R.; Royston, P. Tuning multiple imputation by predictive mean matching and local residual draws; BMC Medical Research Methodology, 2014; Vol. 14. [Google Scholar]
- Muriu, P.W. Role of institutional quality in promoting financial inclusion, 2020; unpublished.
- Nasreen, S.; Ishtiaq, F.; Tiwari, A.K. The role of ICT diffusion and institutional quality on financial inclusion in Asian region: Empirical analysis using panel quantile regression. Electronic Commerce Research 2023, 1–68. [Google Scholar] [CrossRef]
- Nguyen, Y.H.D.; Ha, D.T.T. The effect of institutional quality on financial inclusion in ASEAN countries; The Journal of Asian Finance, Economics and Business, 2021; Vol. 8, No. 8, pp. 421–431. [Google Scholar]
- Nsiah, A.Y.; Tweneboah, G. Determinants of financial inclusion in Africa: Is institutional quality relevant? Cogent Social Sciences, 2023; Vol. 9, No. 1, p. 2184305. [Google Scholar]
- Ofosu-Mensah Ababio, J.; Boachie Yiadom, E.; Ofori-Sasu, D.; Sarpong–Kumankoma, E. Digital financial inclusion and inclusive development in lower-middle-income countries: The enabling role of institutional quality; Journal of Chinese Economic and Foreign Trade Studies, 2024; Vol. 17 Nos. 2/3, pp. 133–151. [Google Scholar]
- Ozili, P.K. Digital financial inclusion, in Big Data: A Game Changer for Insurance Industry; Emerald Publishing Limited, 2022; pp. 229–238. [Google Scholar]
- Rubin, D.B. Multiple Imputation for Nonresponse in Surveys; John Wiley & Sons; New York, NY, 1987. [Google Scholar]
- Tay, L.Y.; Tai, H.T.; Tan, G.S. Digital financial inclusion: A gateway to sustainable development; Heliyon, 2022; Vol. 8, No. 6. [Google Scholar]
- Van, L.T.H.; Nguyen, N.T.; Nguyen, H.L.P.; Vo, D.H. The asymmetric effects of institutional quality on financial inclusion in the Asia-Pacific region; Heliyon, 2022; Vol. 8, No. 12. [Google Scholar]
- Vo, D.H. Does institutional quality matter for financial inclusion? International evidence; PLOS ONE, 2024; Vol. 19, No. 2. [Google Scholar]
- Vo, D.H. Long-term effects of institutional quality on financial inclusion in Asia–Pacific countries; Financial Innovation, 2025; Vol. 11, No. 1, p. 59. [Google Scholar]
- Vyas, V.; Jain, P. Role of digital economy and technology adoption for financial inclusion in India; Indian Growth and Development Review, 2021; Vol. 14, No. 3, pp. 302–324. [Google Scholar]
- Wang, W.; He, T.; Li, Z. Digital inclusive finance, economic growth and innovative development; Kybernetes, 2023; Vol. 52, No. 9, pp. 3064–3084. [Google Scholar]
- World Bank. World Bank country classifications by income level for 2024–2025, World Bank Blogs. 2024. Available online: https://blogs.worldbank.org/en/opendata/world-bank-country-classifications-by-income-level-for-2024-2025</u> (accessed on 6 July 2025).
- World Bank. Worldwide Governance Indicators, Washington, DC. 2024. Available online: https://info.worldbank.org/governance/wgi/ (accessed on 16 August 2025).
- World Bank. Digital financial inclusion, Washington, DC. 2025. Available online: https://www.worldbank.org/en/topic/financialinclusion/publication/digital-financial-inclusion (accessed on 16 August 2025).
- Zeqiraj, V.; Sohag, K.; Hammoudeh, S. Financial inclusion in developing countries: Do quality institutions matter? Journal of International Financial Markets, Institutions and Money, 2022; Vol. 81, p. Article 101677. [Google Scholar]
Table 2.
Descriptive Statistics.
| Variable | Obs | Mean | Std. Dev. | Min | Max | Skewness | Kurtosis |
| DFII | 3,819 | -0.017 | 1.211 | -2.455 | 3.170 | 0.310 | 2.852 |
| L.DFII | 3,628 | -0.019 | 1.211 | -2.455 | 3.170 | 0.312 | 2.834 |
| IQI | 3,819 | -0.008 | 0.977 | -1.547 | 2.621 | 0.342 | 2.514 |
| CC | 3,819 | 43.866 | 31.358 | 0.296 | 98.572 | 0.135 | 1.624 |
| PSAVT | 3,819 | 16.499 | 16.846 | 0.000 | 60.745 | 0.985 | 2.931 |
| VA | 3,819 | 4.489 | 6.328 | -9.985 | 18.706 | 0.138 | 3.147 |
| L.RQ | 3,628 | 13.091 | 21.034 | -2.098 | 67.067 | 1.253 | 2.967 |
| RL | 3,819 | 1.808 | 3.001 | -1.717 | 7.289 | 0.974 | 2.469 |
| GE | 3,819 | -0.012 | 0.998 | -2.402 | 1.945 | -0.515 | 2.697 |
| L.GDPPC | 3,628 | -0.019 | 0.937 | -1.259 | 2.652 | 0.777 | 3.198 |
| FL | 3,819 | -0.225 | 0.281 | -0.411 | 0.309 | 1.186 | 2.62 |
| UP | 3,819 | -0.031 | 1.292 | -2.230 | 3.553 | 0.715 | 2.915 |
| TO | 3,819 | 25.737 | 19.604 | 0.000 | 65.125 | 0.125 | 1.817 |
Table 3.
Correlation Matrix.
| Variables | VIF | DFII | IQI | CC | PSAVT | VA | L.RQ | RL | GE | L.GDPPC | FLI | UP | TO | ||
| DFII | 1.000 | ||||||||||||||
| IQI | 1.35 | 0.680 | 1.000 | ||||||||||||
| CC | 1.71 | 0.277 | 0.261 | 1.000 | |||||||||||
| PSAVT | 1.88 | 0.296 | 0.223 | 0.551 | 1.000 | ||||||||||
| VA | 1.03 | -0.024 | -0.021 | -0.075 | -0.073 | 1.000 | |||||||||
| L.RQ | 2.16 | 0.018 | -0.003 | 0.038 | -0.031 | -0.015 | 1.000 | ||||||||
| RL | 2.50 | 0.136 | 0.051 | 0.159 | 0.153 | -0.045 | 0.676 | 1.000 | |||||||
| GE | 2.05 | 0.334 | 0.140 | 0.438 | 0.527 | 0.001 | 0.313 | 0.517 | 1.000 | ||||||
| L.GDPPC | 1.20 | 0.773 | 0.387 | 0.166 | 0.168 | -0.017 | 0.031 | 0.061 | 0.157 | 1.000 | |||||
| FL | 1.11 | 0.201 | 0.072 | 0.007 | 0.140 | -0.048 | -0.156 | -0.061 | 0.086 | 0.051 | 1.000 | ||||
| UP | 1.51 | -0.401 | -0.256 | 0.047 | 0.010 | 0.033 | 0.434 | 0.320 | 0.199 | -0.148 | -0.229 | 1.000 | |||
| TO | 1.53 | 0.010 | 0.029 | 0.096 | 0.024 | -0.093 | -0.430 | -0.494 | -0.252 | 0.009 | 0.119 | -0.366 | 1.000 | ||
Table 4.
Baseline System GMM Estimates of Institutional Quality on Digital Financial Inclusion.
| VARIABLES | Model 1 | Model 2 | Model 3 | Model 4 |
| L.DFII | 0.375*** | 0.375*** | 0.385*** | 0.384*** |
| (0.0571) | (0.0568) | (0.0584) | (0.0581) | |
| IQI | 0.239*** | 0.237*** | 0.232*** | 0.229*** |
| (0.0268) | (0.0267) | (0.0273) | (0.0271) | |
| CC | 0.00373*** | 0.00380*** | 0.00751*** | 0.00762*** |
| (0.00107) | (0.00108) | (0.00194) | (0.00195) | |
| PSAVT | -0.00269* | -0.00246 | -0.00702*** | -0.00676*** |
| (0.00150) | (0.00150) | (0.00243) | (0.00241) | |
| VA | 0.00249* | 0.00246 | 0.00280* | 0.00277* |
| (0.00151) | (0.00151) | (0.00152) | (0.00152) | |
| L.RQ | 0.00401*** | 0.00376*** | 0.00460*** | 0.00428*** |
| (0.000739) | (0.000766) | (0.000779) | (0.000801) | |
| RL | -0.0109** | -0.0131*** | -0.0114** | -0.0144*** |
| (0.00471) | (0.00473) | (0.00479) | (0.00500) | |
| GE | 0.225*** | 0.220*** | 0.203*** | 0.197*** |
| (0.0290) | (0.0292) | (0.0306) | (0.0308) | |
| L.GDPPC | 0.429*** | 0.430*** | 0.424*** | 0.425*** |
| (0.0398) | (0.0397) | (0.0409) | (0.0408) | |
| FL | 0.149*** | 0.150*** | 0.0951** | 0.0953** |
| (0.0393) | (0.0391) | (0.0379) | (0.0378) | |
| UP | -0.257*** | -0.258*** | -0.258*** | -0.259*** |
| (0.00963) | (0.00954) | (0.00958) | (0.00947) | |
| TO | -0.00260*** | -0.00204*** | -0.00269*** | -0.00196*** |
| (0.000653) | (0.000731) | (0.000646) | (0.000721) | |
| Country FE | Yes | No | No | Yes |
| Year FE | No | No | Yes | Yes |
| Constant | -0.0688* | -0.133** | 48.22*** | 48.47*** |
| (0.0363) | (0.0546) | (13.09) | (13.14) | |
| Observations | 3,628 | 3,628 | 3,628 | 3,628 |
| Number of Countries | 191 | 191 | 191 | 191 |
| No. of Instruments | 19 | 20 | 20 | 21 |
| AR(2) p-value | 0.079 | 0.082 | 0.098 | 0.107 |
| Sargan p-value | 0.397 | 0.414 | 0.524 | 0.544 |
| Hansen p-value | 0.161 | 0.174 | 0.272 | 0.295 |
| Wald Chi2 (12) | 8179.82 | 8497.99 | 7341.05 | 7520.98 |
| Diff-in-Hansen (GMM) p | 0.110 | 0.121 | 0.198 | 0.219 |
| Diff-in-Hansen (IV) p | 0.617 | 0.601 | 0.622 | 0.609 |
Standard errors in parentheses, *** p<0.01, ** p<0.05, * p<0.1.
Table 5.
Regional System GMM Estimates of Institutional Quality on Digital Financial Inclusion.
| (1) | (2) | (3) | (4) | |
| VARIABLES | Africa | Asia | Europe | North America |
| L.DFII | 0.217*** | 0.195*** | 0.318*** | 0.160*** |
| (0.0442) | (0.0480) | (0.0766) | (0.0458) | |
| IQI | 0.239*** | 0.185*** | 0.268*** | 0.386*** |
| (0.0348) | (0.0424) | (0.0398) | (0.0421) | |
| CC | 0.00590*** | -0.000193 | 0.00169 | 0.00320** |
| (0.00180) | (0.00206) | (0.00198) | (0.00161) | |
| PSAVT | -0.00162 | -0.00220 | -0.000722 | -0.0154*** |
| (0.00315) | (0.00413) | (0.00281) | (0.00495) | |
| VA | 0.000972 | 0.00331 | 0.00369* | -0.00177 |
| (0.00339) | (0.00329) | (0.00208) | (0.00282) | |
| L.RQ | 0.00702*** | 0.00489*** | 0.00275** | 0.00927 |
| (0.00138) | (0.00183) | (0.00129) | (0.00722) | |
| RL | -0.0205* | -0.0219* | -0.0147 | -0.0510 |
| (0.0107) | (0.0133) | (0.00929) | (0.0354) | |
| GE | 0.244*** | 0.358*** | 0.234*** | 0.588*** |
| (0.0475) | (0.0631) | (0.0522) | (0.0883) | |
| L.GDPPC | 0.581*** | 0.721*** | 0.444*** | 0.399*** |
| (0.0639) | (0.0606) | (0.0478) | (0.102) | |
| FL | 0.214*** | 0.576** | 0.0383 | 0.525*** |
| (0.0665) | (0.243) | (0.0557) | (0.119) | |
| UP | -0.370*** | -0.374*** | -0.279*** | -0.240*** |
| (0.0462) | (0.0701) | (0.0174) | (0.0207) | |
| TO | -0.00354* | -0.00400 | -0.00258* | -0.00129 |
| (0.00185) | (0.00286) | (0.00147) | (0.00208) | |
| Constant | -0.190*** | 0.306*** | -0.310*** | 0.432*** |
| (0.0560) | (0.0850) | (0.0641) | (0.103) | |
| Observations | 1,026 | 798 | 817 | 380 |
| Number of Countries | 54 | 42 | 43 | 20 |
| No. of Instruments | 16 | 18 | 18 | 18 |
| AR(2) p-value | 0.321 | 0.766 | 0.599 | 0.350 |
| Sargan p-value | 0.488 | 0.556 | 0.164 | 0.083 |
| Hansen p-value | 0.192 | 0.768 | 0.177 | 0.122 |
| Wald Chi2 (12) | 2861.28 | 2530.00 | 2655.47 | 2354.61 |
| Diff-in-Hansen (GMM) p | 0.336 | 0.869 | 0.196 | 0.086 |
| Diff-in-Hansen (IV) p | 0.110 | 0.253 | 0.204 | 0.464 |
Standard errors in parentheses, *** p<0.01, ** p<0.05, * p<0.1.
Table 6.
Regional System GMM Estimates of Institutional Quality on Digital Financial Inclusion Across Income Groups.
Table 6.
Regional System GMM Estimates of Institutional Quality on Digital Financial Inclusion Across Income Groups.
| (1) | (2) | (3) | (4) | |
| VARIABLES |
Low-Income Group |
Lower-Middle Income Group |
Upper-Income Group |
High-Income Group |
| L.DFII | 0.400*** | 0.305*** | 0.353*** | 0.398*** |
| (0.0874) | (0.0760) | (0.0697) | (0.0680) | |
| IQI | 0.154*** | 0.286*** | 0.282*** | 0.233*** |
| (0.0314) | (0.0355) | (0.0449) | (0.0317) | |
| CC | 0.00740*** | 0.00212* | 0.00187 | 0.00158 |
| (0.00262) | (0.00119) | (0.00156) | (0.00202) | |
| PSAVT | -0.00293 | -0.00390* | 3.38e-05 | -0.00196 |
| (0.00440) | (0.00214) | (0.00217) | (0.00285) | |
| VA | -0.00622 | -1.53e-06 | 0.00512*** | 0.00453** |
| (0.00426) | (0.00290) | (0.00187) | (0.00222) | |
| L.RQ | 0.00705*** | 0.00454*** | 0.00303*** | 0.00580*** |
| (0.00240) | (0.00106) | (0.000897) | (0.00184) | |
| RL | -0.0209 | -0.00855 | -0.00623 | -0.0218* |
| (0.0186) | (0.00836) | (0.00552) | (0.0114) | |
| GE | 0.164** | 0.259*** | 0.196*** | 0.244*** |
| (0.0646) | (0.0346) | (0.0363) | (0.0438) | |
| L.GNIPC | 0.445*** | 0.524*** | 0.426*** | 0.379*** |
| (0.0632) | (0.0578) | (0.0535) | (0.0506) | |
| FL | 0.118 | 0.202*** | 0.183** | 0.0552 |
| (0.102) | (0.0569) | (0.0716) | (0.0549) | |
| UP | -0.267*** | -0.260*** | -0.265*** | -0.271*** |
| (0.0226) | (0.0162) | (0.0127) | (0.0180) | |
| TO | -0.00381** | -0.000132 | -0.00269*** | -0.00221** |
| (0.00153) | (0.00108) | (0.00992) | (0.00101) | |
| Constant | -0.251*** | -0.0325* | -0.0495* | 0.0388* |
| (0.0811) | (0.0519) | (0.0540) | (0.0730) | |
| Observations | 589 | 817 | 1,006 | 1,083 |
| Number of Countries | 31 | 43 | 53 | 57 |
| No. of Instruments | 16 | 19 | 16 | 18 |
| AR (2) p-value | 0.629 | 0.824 | 0.391 | 0.157 |
| Sargan p-value | 0.579 | 0.791 | 0.097 | 0.441 |
| Hansen p-value | 0.381 | 0.268 | 0.065 | 0.209 |
| Wald Chi2 (12) | 2896.44 | 8030.77 | 6885.79 | 2696.25 |
| Diff-in-Hansen (GMM) p | 0.937 | 0.918 | 0.063 | 0.130 |
| Diff-in-Hansen (IV) p | 0.087 | 0.093 | 0.334 | 0.804 |
Standard errors in parentheses, *** p<0.01, ** p<0.05, * p<0.1.
Table 7.
Robustness Test Results of Institutional Quality on DFI.
| (1) | (3) | (4) | (5) | (6) | |
| VARIABLES | OLS | FGLS | FE | RE | One-step Sys. GMM |
| L.DFII | 0.251*** | 0.251*** | 0.183*** | 0.251*** | 0.387*** |
| (0.00811) | (0.00809) | (0.00784) | (0.00811) | (0.0602) | |
| IQI | 0.352*** | 0.352*** | 0.281*** | 0.352*** | 0.224*** |
| (0.00781) | (0.00780) | (0.0105) | (0.00781) | (0.0272) | |
| CC | 0.00106*** | 0.00106*** | 0.000747* | 0.00106*** | 0.00541*** |
| (0.000341) | (0.000340) | (0.000446) | (0.000341) | (0.00207) | |
| PSAVT | -0.000764 | -0.000764 | -0.000712 | -0.000764 | -0.00506** |
| (0.000544) | (0.000543) | (0.00108) | (0.000544) | (0.00252) | |
| VA | 0.00229** | 0.00229** | 0.00167 | 0.00229** | 0.00275* |
| (0.000930) | (0.000928) | (0.00112) | (0.000930) | (0.00152) | |
| L.RQ | 0.00248*** | 0.00248*** | 0.00222*** | 0.00248*** | 0.00503*** |
| (0.000430) | (0.000430) | (0.000554) | (0.000430) | (0.000855) | |
| RL | 0.0138*** | 0.0138*** | 0.0182*** | 0.0138*** | -0.0113** |
| (0.00322) | (0.00322) | (0.00420) | (0.00322) | (0.00517) | |
| GE | 0.184*** | 0.184*** | 0.123*** | 0.184*** | 0.196*** |
| (0.00859) | (0.00857) | (0.0222) | (0.00859) | (0.0291) | |
| L.GDPPC | 0.557*** | 0.557*** | 0.695*** | 0.557*** | 0.424*** |
| (0.00829) | (0.00828) | (0.0105) | (0.00829) | (0.0409) | |
| FL | 0.245*** | 0.245*** | 0.244*** | 0.245*** | 0.500*** |
| (0.0227) | (0.0227) | (0.0232) | (0.0227) | (0.0807) | |
| UP | -0.234*** | -0.234*** | -0.241*** | -0.234*** | -0.252*** |
| (0.00564) | (0.00563) | (0.00602) | (0.00564) | (0.00965) | |
| TO | -0.00143*** | -0.00143*** | -0.00166** | -0.00143*** | -0.00303*** |
| (0.000364) | (0.000364) | (0.000649) | (0.000364) | (0.000657) | |
| Year Dummies | -0.00395** | -0.00395** | -0.00290* | -0.00395** | -0.0128* |
| (0.00157) | (0.00157) | (0.00173) | (0.00157) | (0.00708) | |
| Constant | 7.934** | 7.934** | 5.849* | 7.934** | 25.75* |
| (3.153) | (3.147) | (3.480) | (3.153) | (14.19) | |
| Observations | 3,628 | 3,628 | 3,628 | 3,628 | 3,628 |
| Number of Countries | 191 | 191 | 191 | 191 | 191 |
| R-squared | 0.917 | 0.838 | 0.831 | ||
| Adj. R-squared | 0.916 | ||||
| No. of Instruments | 20 | ||||
| AR(2) p-value | 0.071 | ||||
| Sargan p-value | 0.270 | ||||
| Hansen p-value | 0.134 | ||||
| Wald Chi2 (13) | 7026.25 | ||||
| Diff-in-Hansen (GMM) p | 0.183 | ||||
| Diff-in-Hansen (IV) p | 0.835 |
Standard errors in parentheses, *** p<0.01, ** p<0.05, * p<0.1.
Disclaimer/Publisher’s Note: The statements, opinions and data contained in all publications are solely those of the individual author(s) and contributor(s) and not of MDPI and/or the editor(s). MDPI and/or the editor(s) disclaim responsibility for any injury to people or property resulting from any ideas, methods, instructions or products referred to in the content. |
© 2025 by the authors. Licensee MDPI, Basel, Switzerland. This article is an open access article distributed under the terms and conditions of the Creative Commons Attribution (CC BY) license (http://creativecommons.org/licenses/by/4.0/).
Copyright: This open access article is published under a Creative Commons CC BY 4.0 license, which permit the free download, distribution, and reuse, provided that the author and preprint are cited in any reuse.


