
Submitted:
26 October 2025
Posted:
27 October 2025
You are already at the latest version
Abstract
Background/Objectives: Colorectal cancer (CRC) is the third most commonly occurring cancer. Apoptosis is a fundamental cellular process of programmed cell death, and although many pathways for inducing apoptosis may exist, only the intrinsic and the extrinsic pathways have been demonstrated in detail. This study investigated the expression of BAD, BID, BCL2, MDM2, p53, Ki-67, and PUMA in primary CRC, paired lymph node metastases, and adjacent normal mucosa, and explored their associations with clinicopathologic features and patient outcomes. Methods: One hundred thirty patients who underwent surgery for resectable CRC were included in the study. FFPE tumor tissue samples were prospectively collected and used for the construction of the ΤΜΑ blocks from primary tumour, paired lymph node metastasis, and paired normal mucosa. Immunohistochemistry for BAD, BID, BCL2, MDM2, p53, Ki-67, and PUMA antibodies was performed. Results: Univariate analysis showed reduced cancer-specific (CSS), disease-free (DFS), and overall survival (OS) in patients with lymphatic invasion, ≥4 positive lymph nodes, poorly differentiated tumors, older age (≥65), right-sided tumors, stage IIIC disease, or no chemotherapy. Multivariate analysis identified lymphovascular invasion, ≥4 metastatic nodes, and high Ki-67 as independent predictors of worse DFS and CSS, with low BAD expression additionally predicting DFS. For OS, adverse predictors included nodal burden, tumor location, absence of chemotherapy, and high p53, MDM2, and Ki-67 expression. Notably, combined high PUMA and low p53 expression independently predicted poorer CSS and OS. Conclusions: Combined high expression of PUMA with low expression of p53 as well as high expression of Ki-67, were independent unfavorable prognostic indicators for both OS and CSS. Further studies are required to clarify the prognostic and therapeutic role of these markers in CRC.
Keywords:
anti-apoptotic
; cancer specific survival
; colorectal cancer
; mdm2
; overall survival
; right colon cancer
; prognostic indicators
; p53
; PUMA
1. Introduction
Colorectal cancer (CRC) is among the most common malignancies worldwide[1]. While surgical resection is the primary treatment for patients with stages I–III CRC, adjuvant treatment with 5-fluorouracil (5-FU)-based chemotherapy with the addition of oxaliplatin (FOLFOX/XELOX regimen) in stage III disease is estimated to result in an approximately 5–6% improvement in 5-year overall survival (OS)[2].
The process of tumor development in CRC is thoroughly studied and well-characterized, and although early detection, improved treatment regimens, and increased understanding of the disease have contributed to declining mortality rates over the past decade, the survival of CRC patients still largely depends on disease stage at diagnosis and varies widely between stages[3,4]. In clinical practice, while TNM staging remains the cornerstone for clinical decision-making, additional molecular and pathological factors (e.g., microsatellite instability, KRAS/BRAF mutation status) are increasingly integrated into practice and research[5].
Apoptosis, a fundamental process of programmed cell death, maintains tissue homeostasis and prevents the survival of damaged cells. Evasion of apoptosis is a hallmark of CRC progression and treatment resistance[6]. Two major pathways regulate apoptosis: the intrinsic (mitochondrial) and extrinsic (death receptor) pathways[7]. The intrinsic pathway involves mitochondrial cytochrome c release and caspase activation, tightly controlled by the BCL-2 protein family, which includes both anti-apoptotic (BCL-2, BCL-XL, MCL-1, etc.) and pro-apoptotic (BAX, BAK, BID, BIM, BAD) members that share conserved BH domains.[8]. The BH3-only proteins (Bad, Bid, Bim, Puma, and Noxa) are sensors of cellular damage and can engage and inactivate prosurvival Bcl-2 family members[9]. The interaction of BH3-only proteins through their BH3 domain with prosurvival proteins negates their cytoprotective function.
The TP53 tumor suppressor plays a central role in DNA damage response and apoptosis regulation.[10]. TP53 tumor suppressor induces apoptosis by upregulating expression of the Noxa and Puma BH3-only proteins, doing so in response to substantial levels of DNA breaks and other chromosomal abnormalities[10]. Furthermore, MDM2 oncoprotein (mouse double minute 2, HDM2 in humans) binds directly to the N-terminus transactivation domain of p53, regulates the transcriptional activity of p53 and indices the nuclear export of p53[11]. MDM2 regulates the ubiquitination of p53 which leads to its degradation, and this forms a negative feedback loop that maintains low levels of p53 in normal cells[12].
Ki-67 is a nuclear protein associated with cell proliferation [13,14]. It is associated with transcription of ribosomal RNA 210 and its inactivation leads to inhibition of the synthesis[15]. The Ki-67 marker is present in all proliferating cells and expressed in all phases of the cell cycle except the resting phase (G0 phase), while there is a great interest in its role as an proliferations marker[14]. The percentage of Ki-67 positive cells in a tumor is called Ki-67 labeling index (LI) and is often associated with the clinical course of the disease. In colorectal cancer (CRC), the prognostic significance of Ki-67 expression remains less consistent. While numerous studies and meta-analyses report that elevated Ki-67 expression is associated with reduced overall and disease-free survival, others have observed a paradoxical association with improved outcomes in specific subgroups [16,17,18].
While Bcl-2 and p53 molecules are widely investigated in CRC by different researchers’ contradictory observations concerning their expression and prognostic value were reported [19-22]. To date, only sparse data are available about the expression and prognostic value of other members of pro-apoptotic pathway, as Bad, Bid, Puma, and p53 pathway, as MDM2 in CRC.
The aim of this study was to investigate the expression of BAD, BID, BCL2, MDM2, p53, Ki67 and PUMA in primary CRC, and paired locally metastatic and normal colon epithelium. Furthermore, we investigated the potential associations of all of the above-mentioned molecules with each other, when appropriate, and with clinical, pathologic characteristics and outcome.
2. Materials and Methods
2.1. Patients
One hundred thirty patients who underwent surgery for resectable CRC were included on the study. Eligibility criteria for this study were, a: histologically confirmed CRC with anatomic and clinical TNM, UICC/AJCC stage II and III (8th edition, 2016), b: adequacy of clinical data on patient’s history, demographics, tumor characteristics, treatment details, and clinical outcome, and c: availability of adequate formalin-fixed paraffin-embedded (FFPE) tumor tissue for biological marker evaluation.
The research protocol was approved by the Bioethics Committee of the Aristotle University of Thessaloniki School of Medicine (Protocol #232; 23/03/2016).
2.2. Tissue Processing & Tissue Microarray (TMA) Construction
Formalin-fixed paraffin-embedded (FFPE) tumor tissue samples were prospectively collected and histologically reviewed for tissue and tumor availability by experienced
pathologist (MB) and the most representative areas were marked for the construction of the ΤΜA blocks with the use of a manual arrayer (Model I, Beecher Instruments, San Prairie, WI). In total 328 FFPE tissue blocks from 130 patients were collected. These samples included primary tumour, paired lymph node metastasis (LNM) in 43 cases and paired normal mucosa (N) in 84 cases. Two 1.5-mm cores per tumor, as well as one core from cases with paired normal mucosa and one core from the paired LNM metastasis were transferred into 7 low density tissue microarrays (TMAs), which were used for in situ methods. The TMA blocks contained in total 594 tissue cores. In each TMA block, 10 tissue cores from neoplastic and non-neoplastic tissues were also included as positive and negative controls of the tested antibodies. To assure optimal immunoreactivity, immunostaining was done 7–10 days after sectioning at the Laboratory of Molecular Oncology of the Hellenic Foundation for Cancer Research, Aristotle University of Thessaloniki School of Medicine. The REMARK diagram for the study is shown in Figure 1.
2.3. Immunohistochemistry (IHC) and Interpretation of IHC Results
Serial 3 μm thick TMA sections were stained for BAD, BID, BCL2, MDM2, p53, PUMA and Ki67 antibodies on Bond-Max autostainer. Diaminobenzidine (DAB) was used as a chromogen and Mayer’s hematoxylin as a counterstain. The source of the antibodies and the conditions of staining were as shown in Table 1. All sections were stained in one run for each antibody and were evaluated by one of the authors (MB) blinded as to the patient’s clinical characteristics and survival data.
For each immunostain, cellular localization of the protein, e.g., nucleus or cytoplasm was recorded. The expression of BAD, BID, BCL2, MDM2, p53 and PUMA was calculated based on the intensity of staining (I) on a scale of 0-3 (0 = no expression, 1 = mild expression, 2 = moderate expression, 3 = intense expression), whereas percentage of positive neoplastic cells (P) for each localization was also scored on a scale of 0-100%. Histoscore (H-Score) was then created according to the formula 1xP + 2xP + 3xP = 0-300. The H-Score in each case was calculated from the average of the H-Score in the two tissue cylinders, ie TC and IF. If one of the tissue cores was lost or damaged the score was determined from the remaining core. The Ki-67 marker was evaluated as a percentage of positive cells from the “hot spots” of the tumor, in a range from 0-100.
2.4. Statistical Analysis
The median H-Score was used as a predetermined cut-off for each antibody. Positive samples or samples with high expression were considered when the value of H-Score was equal to or greater than the median. We used the median H-Score as the default cut-off value for each indicator, and this was done to avoid false-positive results from multiple calculations of cut-offs. After specifying the median value for each sample, additional and combinatorial variables were created. χ2 or Fisher’s exact tests and Mann-Whitney or Kruskall-Wallis tests were used to test associations between protein expression and different categorical clinicopathological variables. OS was defined as the time from the date of diagnosis to the date of death regardless of cause and DFS as the time elapsed between the date of diagnosis and the date of the patient’s confirmed recurrence of illness[23]. Disease-Specific Survival (DSS) or CSS was stated as the time elapsed from the date of diagnosis to the date of death from CRC[23]. Survival probabilities were estimated by the Kaplan-Meier method and compared using the log-rank test. Model choice was performed using backward selection criteria at p<0.15.
Analyses were conducted using the SAS software (version 9.3, SAS Institute Inc., Cary, NC), and the language R, specific to statistical computations and graphics (version 2.14.1, “R & R”, Statistics Department of the University of Auckland). The results of this study are presented according to reporting recommendations for tumor marker prognostic studies[18].
3. Results
3.1. Clinicopathologic Features and Tumor Characteristics
The mean patient age were 69.8 years (SD, 10.5) with a range, 32–91 years. The majority of patients were age ≥ 65 years (93, 71.6%) (P = 0.0001), and males (71, 54.6%). Of all patients, 39 (30%) had cancer in the right colon (cecum, ascending colon, right colic flexure and proximal transverse colon 2/3), 52 (40%) in the left colon (left colic flexure, descending colon and sigmoid) and 39 (30%) in the rectum. Large tumors, >3 cm were found in 91 (70%) of patients, mainly in rectum, 30 out or 39 patients (77%). The majority of tumors showed moderate histologic differentiation (71.6%). 50% of patients were classified according to Astler-Coller classification as Stage B2, while the remaining 50% as Stage C. lymphovascular invasion detected in 30% of cases, while 50% of cases was free of nodal metastases (P = 0.009). 22.4% of cases had >4 metastatic lymph nodes (LN). AJCC stage III were classified 65 (50%) patients, mostly with rectum than colon cancer, 24 and 41 patients respectively (P = 0.058).
In 88 (67.7%) patients administered postoperative chemotherapy, 40 (30.8%) received no treatment other than surgical excision of the tumor, while for 2 (1.5%) postoperative information wasn’t available. 55 of patients received FOLFOX, 10 patients 5FU-LV, and 23 patients XELOX as a postoperative chemotherapy treatment.
Clinicopathological features of the study patients and their resected colorectal carcinomas are shown in Table 2.
3.2. Protein Markers Expression by Immunohistochemistry (IHC)
The eligible tested cases by IHC for protein evaluation expression was >92% for tumors, >98.5% for normal tissues and >90.5% for metastatic tumors (REMARK diagram, Figure 1).
BAD high expression was detected in 53/124 (43%) primary tumors, in 18/41(44%) LN metastases and in 40/84 (48%) normal colonic mucosa. BAD staining showed lower median H-Score on normal tissues than primary neoplastic or locally metastatic tumors, i.e. 100 median H-Score for normal colonic mucosa, 140 for LN tumor metastasis (P = NS), 170 for TC (P = 0.003), and 190 for IF (P = 0.001), (Figure 1A, 1H). BID overexpression was identified in 55/123 (45%) of primary CRC tumors, in 6/41(15%) LN metastases and in 26/83 (41%) normal mucosa cases. The median BID expression was two-fold higher on tumor and metastasis than normal tissue, with median H-Score 100 for normal tissue, 200 for LN metastasis (P = 0.001), 200 for TC (P = 0.001), and 200 for IF (P = 0.001), (Figure 1Β, 1Ι). Elevated BCL2 protein was observed in 60/123 (49%) of tested primary tumors, in 20/40 (50%) LN metastases and in almost half of normal mucosa cases (40/83, 48%). Higher median H-Score of BCL2 were noticed in normal tissues compared to primary and metastatic tumors, while high values of BCL2 expression, over 200, were detected only on tumor tissues. BCL2 expression on LN, IF and TC was statistically significant compared to normal tissue (P = 0.003, P = 0.001 and P = 0.001 respectively) (Figure 1C, 1J). MDM2 protein was expressed in 60/120 (50%) CRC cases, 21/42 (50%) LN metastases and 39/83 (47%) of cases with normal epithelium. Higher median H-Score of MDM2 were detected on tumors compared to normal tissue and metastatic tumor, whereas the highest values of MDM2 expression (H-Score: 300) were detected only on tumor tissues (Figure 1D, 1K). Tumor protein p53 showed an overexpression in 58/121(48%) of tested CRCs. Similar number of LN metastatic cases showed elevated p53 expression (21/43, 49%). High H-Score of p53 staining in normal tissues (>220) was noticed in only 3 cases (3.6%). P53 staining showed lower median H-Score on normal tissues than primary neoplastic or locally metastatic tumors, i.e. 5 median H-Score for normal colonic mucosa, 160 for LN metastasis (P = 0.001), 150 for TC (P = 0.001), and 170 for IF (P = 0.001), (Figure 1E, 1L). We noticed high PUMA protein expression in 82/122 (67%) primary CRC cases, in 20/41 (49%) LN metastases and in 27/83 (32.5%) normal tissues. Higher median H-Score of PUMA were detected on primary and metastatic tumors compared to normal tissue, with statistical significance only on TC (P = 0.001) and IF (P = 0.012), (Figure 1F, 1M).
Finally, Ki67 proliferation was high in 60/120 (50%) of CRCs, 17/38 (45%) LN metastases and 30/83 (36%) of non-neoplastic mucosa cases, (Figure 1G, 1N).
3.3. Correlations Between Molecules & Clinicopathological Variables
Statistically significant correlations emerged between expression BAD/BID (P = 0.001), PUMA/BAD (P = 0.018), PUMA/Ki-67 (P <0.0001) and p53/MDM2 (P = 0.033) in the primary tumor (Supplemental Table 1).
Significant associations were noticed between BCL2 and tumor differentiation (P = 0.036), BAD and tumor localization (P = 0.011), p53 and the number of infiltrated lymph nodes (P = 0.024), BID with the maximal tumor diameter and with lymphovascular invasion (P = 0.002 and P = 0.049 respectively), MDM2 and maximal tumor diameter (P = 0.015), and Ki-67 with mucinous adenocarcinomas (P = 0.016). None of the studied immunohistochemical markers showed a statistically significant correlation with chemotherapy (Supplemental Table 2).
Regarding protein expression only on the tumor front (IF), statistically significant correlations were found between LN metastasis and BAD, and BID molecules (P = 0.032 and P = 0.032, respectively), histological differentiation and BAD (P = 0.052), maximum tumor diameter and BID, and Ki-67 (P = 0.030 and P = 0.033, respectively), Astler-Coller stage and p53 (P = 0.020), the number of filtered lymph nodes (and stage N by TNM) also with the expression of p53 protein (P = 0.001), and end of mucosal adenocarcinomas with the MDM2 molecule (P = 0.009).
3.4. Survival and Prognostic Factors
The median follow-up time was 54 months (range: 1-81). 16 patients died from other than CRC causes. The 3-year DFS was 67%, while for OS and CSS the progression of the disease was identical (70.8%).
The univariate survival analysis showed significantly smaller CSS, DFS and OS for patients with lymphatic invasion (P = 0.0031, P = 0.0072 and P = 0.0289) and ≥4 infiltrated lymph nodes (P = 0.0016, P = 0.0051 and P < 0.0001). Moreover, worse CSS had patients with poorly differentiated tumor (P = 0.0074). Significantly lower OS, observed in cases who not received chemotherapy (P < 0.0001), in patients aged ≥ 65 years (P = 0.0109), in patients AJCC stage IIIC (P = 0.0035), and with adenocarcinoma in the right colon (P = 0.0309).
Low expression of BAD in IF of primary tumor associated with worse patients’ DFS (P = 0.034), lower CSS (P = 0.0086) and lower OS (P = 0.033), (Figure 2A, 2B, 2C). Ki-67 low expression was significant associated with longer OS (P = 0.03) Similarly, the combination of low expressed p53 and PUMA in TC of primary tumor disclosed marginal significant association with OS (P = 0.068). Finally, patients whose tumors showed low expression of PUMA associated with a marginally shorter OS (P = 0.056).
In multivariate analysis as independent unfavorable prognostic indicators for both DFS and the CSS highlighted the lymphovascular invasion (HR = 4.17 and HR = 2.72), ≥4 infiltrated lymph nodes (HR = 1.39 and HR = 1.79) and high Ki-67 labelling index (HR = 3.20 and HR = 2.36). In addition, independent adverse predictor for DFS was low expression of BAD (HR = 2.97). For OS emerged as independent adverse prognostic indicators ≥4 metastatic lymph nodes (HR = 4.89), the location of the primary tumor in the rectum and right colon (HR = 5.05, HR = 2.63), no chemotherapy treatment (HR = 7.36), and high-expression of p53, MDM2 and Ki-67 (HR = 0.35, HR = 2, and HR = 2.94). Finally, as an independent unfavorable prognostic value was highlighted the combination of high expression of PUMA with low expression of p53 in both CSS and OS (HR: 2.42, CI 0.6-9.7, Wald p= 0.0503 and HR: 4.6, CI 0.85- 24.98, Wald p= 0.0963 respectively), (Table 3 and Table 4).
4. Discussion
This study investigated the immunohistochemical expression patterns of key apoptotic regulators (BAD, BID, BCL2, MDM2, p53, and PUMA) and the proliferation marker Ki-67 in resectable stage II–III colorectal cancer (CRC) and evaluated their potential clinicopathological and prognostic significance. The findings provide evidence that deregulation of apoptosis- and proliferation-related proteins plays a critical role in colorectal carcinogenesis and disease progression, while specific profiles may serve as independent prognostic markers.
In our work the location of the primary tumor had a significant effect on the prognosis. The univariate analysis showed a lower OS as well as a strong positive trend of poorer CSS for the patients with CRC and tumor localization in the right colon (RC). The multivariate analysis demonstrated as an independent adverse prognostic indicator the tumor localization in the RC and rectum. On the other hand, the tumor localization in the left colon (LC) was identified as a favorable prognostic indicator.
Univariate analysis also showed significantly lower CSS, DFS and OS in patients with angiolymphatic infiltration (P = 0.0031) or neoplastic infiltration of equal or more than 4 LN (N2 per TNM). The same clinicopathological factors have also emerged as independent adverse prognostic indicators in the multivariate analysis for DFS and CSS. Our study showed that each of the above two factors (LN metastasis and lymphovascular invasion) has an independent prognostic value for 3-year survival (CSS, DFS, and OS) in patients with stage II and III colon cancer.
Furthermore, in our study there was a statistically significantly lower CSS in patients with low tumor differentiation, while for DFS there was a strong positive trend of poor prognosis for the same characteristic. In the multivariate analysis of our study for DFS, CSS and OS the high levels of Ki-67 expression emerged as an adverse prognostic indicator for stage II and III patients. Ki-67 was overexpressed in lymph node metastases compared to normal tissue.
We also observed increased BAD expression in the primary tumor compared to normal tissue, both at the tumor center and invasive margin, while a difference was found, but without being statistically significant, between its expression in LN metastasis and the normal intestinal epithelium. BAD overexpression was an independent adverse prognostic factor for DFS and significant in univariate analysis for DFS, CSS, and OS. In its active dephosphorylated form BAD is dimerized with either Bcl-2 or Bcl-XL, preventing their binding to Bax, thus promoting apoptosis. However, no correlation was observed between BAD and Bcl-2 expression, though the two molecules showed nearly identical distribution at the invasive margin, indicating disrupted apoptosis in CRC.
BAD protein showed a strong positive correlation with PUMA, suggesting apoptosis induction, as PUMA acts as a promoter of both p53-dependent and p53-independent apoptosis.
Significant differences were observed in BAD, PUMA, and p53 expression between normal mucosa and carcinoma (tumor center and invasive margin), but not in lymph node metastases. DNA damage from gamma radiation or chemotherapeutics (e.g., 5-FU, adriamycin, etoposide) induces p53-dependent PUMA expression and apoptosis. The combination of PUMA overexpression and p53 underexpression was identified as an independent adverse predictor for OS and CSS, likely reflecting disruption of the balance between proliferation and apoptosis in CRC. Finally, we observed that MDM2 overexpression was associated with adverse OS in CRC.
Our results on apoptosis regulators and proliferation markers in general concur with earlier reports in stage II–III colorectal cancer. Overexpression of p53 and high Ki-67 were associated with poor prognosis, consistent with a number of studies demonstrating their independent prognostic value for relapse-free and overall survival [24,25,26]. Overexpression of BCL2 was associated with favorable outcome, consistent with reports that BCL2 positivity is predictive of early-stage, well-differentiated tumors [27,28]. BAD and PUMA expression was upregulated in tumor tissue compared to normal mucosa, with significant positive correlation between them, reflecting their pro-apoptotic function; however, similar to in earlier studies, BAD expression was not correlated with BCL2, suggesting autonomous regulation of apoptosis in CRC [29,30,31]. Surprisingly, overexpression of BAD was found to be an independent negative prognostic factor for DFS, suggesting dysregulation of pro-apoptotic signaling may contribute to aggressive tumor behavior [31].
Regarding clinicopathological variables, our findings confirm the adverse prognostic significance of lymphovascular invasion, N2 node status, and adverse tumor differentiation for CSS, DFS, and OS, in agreement with large series reports and database analyses [32,33,34,35,36,37,38,39]. Improved outcomes for right-sided colon cancers were consistent with previous findings in stage III–IV disease, although the impact in stage II is less clear-cut [40,41,42,43]. Both high Ki-67 values and low differentiation were also associated with poor tumor biology [24,25,26]. MDM2 overexpression was also associated with poor OS, consistent with its role in p53 degradation and chemoresistance [44,45]. In contrast, PUMA overexpression with low p53 as a poor predictor is not in line with most literature, which generally reserves low PUMA expression as an omen for poor outcomes [46,47,48]. Combined, our findings substantiate the prognostic role of apoptotic regulators, proliferation markers, and conventional clinicopathological features in stage II–III CRC, suggesting the potential utility of incorporating these biomarkers into clinical decision-making and risk stratification.
The findings of this study have significant clinical implications for stage II–III colorectal cancer prognostication and potential therapeutic decision-making. Identification of combined high PUMA and low p53 expression, with a high Ki-67 proliferative index, as unfavorable independent prognostic factors predicts that these molecular markers might add value to conventional clinicopathologic risk stratification. Inclusion of these biomarkers in clinical algorithms might have the potential to enable more precise selection of patients at a higher risk of recurrence or poor survival, who would be eligible for intensified surveillance or consideration of adjuvant therapy. Also, that observed correlation between impaired apoptosis, namely by the PUMA–p53 pathway, and aggressive tumor behavior justifies developing treatments against such pathways. If validated, modalities of treatment that focus on modulation of the p53–PUMA regulatory pathway or control of proliferative function could represent novel precision medicine in the treatment of colorectal cancer.
This study benefits from a well-characterized cohort with clearly defined inclusion and exclusion criteria, focusing specifically on resectable stage II–III colorectal cancer, and including comprehensive clinical and pathological annotation. The use of a robust tissue microarray platform allowed high-throughput, standardized immunohistochemical assessment across paired tumor, lymph node metastasis, and adjacent normal tissue samples, while blinded evaluation minimized observer bias. Prognostic correlations were rigorously analyzed by univariate and multivariate models, and findings were put into perspective with the literature to include enhanced interpretive information. Limitations include the single-institution design and moderate cohort size, which can limit generalizability and need to be validated in large, multi-center cohorts. Cross-sectional study of protein expression precludes inference of causality or mechanistic pathways. Some combinations of biomarkers, specifically high PUMA–low p53, were at variance with previous reports, perhaps due to cohort-specific effects or differences in methodology. Insufficient mutational data (e.g., TP53 sequence, MSI status, KRAS/BRAF mutations) also limited inclusion of genetic context, and tissue microarray sampling will not capture absolute intratumoral heterogeneity. Finally, predictive utility of such biomarkers for responsiveness to specific therapies was not determined by this study, and direct translation to the clinic is still hypothetical at this stage.
5. Conclusions
In this study, we demonstrated that dysregulation of apoptotic signaling, particularly through the PUMA–p53 axis, and increased proliferative activity marked by Ki-67 overexpression, are independently associated with adverse outcomes in colorectal cancer. High PUMA expression combined with low p53 expression, along with elevated Ki-67, correlated with significantly poorer overall and cancer-specific survival, underscoring the critical interplay between apoptosis resistance and tumor proliferation in disease progression. Low BAD expression further identified patients at increased risk of recurrence, emphasizing its potential role as a tumor-suppressive marker. Collectively, these findings highlight a distinct molecular signature involving PUMA, p53, BAD, and Ki-67 that may refine prognostic stratification beyond conventional clinicopathologic factors. Future studies integrating molecular and functional analyses are warranted to validate these markers as potential prognostic tools and therapeutic targets in colorectal cancer.
Author Contributions
AMe, MB and AMi conceived the idea for the manuscript; AMe and MB performed the research; AMe, DM and AV collected the data; AMe and MB analyzed the data; AMe, MB, DT, DP and AV reviewed the literature and drafted the manuscript; AMe, AMi, DT, DP, DM, and AVrevised the manuscript. The submission of this manuscript has been approved by all authors.
Institutional review board statement
The study was approved by by the Bioethics Committee of the Aristotle University of Thessaloniki School of Medicine. (Protocol #232; 23/03/2016).
Informed consent statement
A written informed consent was required from each patient before obtaining any biological material for the translational research studies.
Conflict-of-interest statement
he authors declare that they have no conflict of interest.
References
- Biller LH, Schrag D. Diagnosis and Treatment of Metastatic Colorectal Cancer: A Review. JAMA. 2021;325(7):669–685. [CrossRef]
- Salem ME, Yin J, Goldberg RM, Pederson LD, Wolmark N, Alberts SR, Taieb J, Marshall JL, Lonardi S, Yoshino T, Kerr RS, Yothers G, Grothey A, Andre T, De Gramont A, Shi Q. Evaluation of the change of outcomes over a 10-year period in patients with stage III colon cancer: pooled analysis of 6501 patients treated with fluorouracil, leucovorin, and oxaliplatin in the ACCENT database. Ann Oncol. 2020 Apr;31(4):480-486. Epub 2020 Jan 16. [CrossRef] [PubMed] [PubMed Central]
- Orlandi G, Roncucci L, Carnevale G, Sena P. Different Roles of Apoptosis and Autophagy in the Development of Human Colorectal Cancer. Int J Mol Sci. 2023 Jun 15;24(12):10201. [CrossRef] [PubMed] [PubMed Central]
- Siegel RL, Wagle NS, Cercek A, Smith RA, Jemal A. Colorectal cancer statistics, 2023. CA Cancer J Clin. 2023 May-Jun;73(3):233-254. Epub 2023 Mar 1. [CrossRef] [PubMed]
- Lindner AU, Concannon CG, Boukes GJ, Cannon MD, Llambi F, Ryan D, Boland K, Kehoe J, McNamara DA, Murray F, Kay EW, Hector S, Green DR, Huber HJ, Prehn JH. Systems analysis of BCL2 protein family interactions establishes a model to predict responses to chemotherapy. Cancer Res. 2013 Jan 15;73(2):519-28. CAN-12-2269. [CrossRef] [PubMed]
- Ramesh P, Medema JP. BCL-2 family deregulation in colorectal cancer: potential for BH3 mimetics in therapy. Apoptosis. 2020 Jun;25(5-6):305-320. [CrossRef] [PubMed] [PubMed Central]
- Chaudhry GE, Akim AM, Sung YY, Muhammad TST. Cancer and Apoptosis. Methods Mol Biol. 2022;2543:191-210. [CrossRef] [PubMed]
- Qian S, Wei Z, Yang W, Huang J, Yang Y, Wang J. The role of BCL-2 family proteins in regulating apoptosis and cancer therapy. Front Oncol. 2022 Oct 12;12:985363. [CrossRef] [PubMed] [PubMed Central]
- Kaloni D, Diepstraten ST, Strasser A, Kelly GL. BCL-2 protein family: attractive targets for cancer therapy. Apoptosis. 2023 Feb;28(1-2):20-38. Epub 2022 Nov 7. [CrossRef] [PubMed] [PubMed Central]
- Delbridge AR, Strasser A. The BCL-2 protein family, BH3-mimetics and cancer therapy. Cell Death Differ. 2015 Jul;22(7):1071-80. Epub 2015 May 8. [CrossRef] [PubMed] [PubMed Central]
- Shangary S, Ding K, Qiu S, et al. Reactivation of p53 by a specific MDM2 antagonist (MI-43) leads to p21-mediated cell cycle arrest and selective cell death in colon cancer. Mol Cancer Ther 2008;7:1533–42. [CrossRef] [PubMed]
- Li X-L, Zhou J, Chen Z-R, Chng W-J. p53 mutations in colorectal cancer- molecular pathogenesis and pharmacological reactivation. World J Gastroentero 2015;21:84–93. [CrossRef] [PubMed]
- Richardsen E, Andersen S, Al-Saad S, Rakaee M, Nordby Y, Pedersen MI, Ness N, Grindstad T, Movik I, Dønnem T, Bremnes R, Busund LT. Evaluation of the proliferation marker Ki-67 in a large prostatectomy cohort. PLoS One. 2017 Nov 15;12(11):e0186852. [CrossRef] [PubMed] [PubMed Central]
- Li LT, Jiang G, Chen Q, Zheng JN. Ki67 is a promising molecular target in the diagnosis of cancer (review). Mol Med Rep. 2015 Mar;11(3):1566-72. Epub 2014 Nov 10. [CrossRef] [PubMed]
- Rahmanzadeh R., Hüttmann G., Gerdes J., Scholzen T. Chromophore-assisted light inactivation of pKi-67 leads to inhibition of ribosomal RNA synthesis. Cell Prolif. 2007;40 (3):422–30. [CrossRef]
- Tong G, Zhang G, Liu J, Zheng Z, Chen Y, Niu P, Xu X. Cutoff of 25% for Ki67 expression is a good classification tool for prognosis in colorectal cancer in the AJCC-8 stratification. Oncol Rep. 2020 Apr;43(4):1187-1198. Epub 2020 Feb 21. [CrossRef] [PubMed] [PubMed Central]
- Luo ZW, Zhu MG, Zhang ZQ, Ye FJ, Huang WH, Luo XZ. Increased expression of Ki-67 is a poor prognostic marker for colorectal cancer patients: a meta analysis. BMC Cancer. 2019 Feb 6;19(1):123. [CrossRef] [PubMed] [PubMed Central]
- Kasprzak A. Prognostic Biomarkers of Cell Proliferation in Colorectal Cancer (CRC): From Immunohistochemistry to Molecular Biology Techniques. Cancers (Basel). 2023 Sep 15;15(18):4570. [CrossRef] [PubMed] [PubMed Central]
- Watson AJM. Apoptosis and colorectal cancer. Gut 2004;53:1701. 1. [CrossRef] [PubMed]
- Wang L, Liu Z, Fisher KW, Ren F, Lv J, Davidson DD, Baldridge LA, Du X, Cheng L. Prognostic value of programmed death ligand 1, p53, and Ki-67 in patients with advanced-stage colorectal cancer. Hum Pathol. 2018 Jan;71:20-29. Epub 2017 Aug 4. [CrossRef] [PubMed]
- Huang Q, Li S, Cheng P, Deng M, He X, Wang Z, Yang C-H, Zhao X-Y, Huang J. High expression of anti-apoptotic protein Bcl-2 is a good prognostic factor in colorectal cancer: Result of a meta-analysis. World J Gastroentero 2017;23:5018–33. [CrossRef] [PubMed]
- Huang Q, Li S, Cheng P, Deng M, He X, Wang Z, Yang CH, Zhao XY, Huang J. High expression of anti-apoptotic protein Bcl-2 is a good prognostic factor in colorectal cancer: Result of a meta-analysis. World J Gastroenterol. 2017 Jul 21;23(27):5018-5033. [CrossRef] [PubMed] [PubMed Central]
- Rich JT, Neely JG, Paniello RC, Voelker CCJ, Nussenbaum B, Wang EW. A practical guide to understanding Kaplan-Meier curves. Otolaryngology- Head Neck Surg 2010;143:331–6. [CrossRef] [PubMed]
- Saleh HA, Jackson H, Banerjee M. Immunohistochemical expression of bcl-2 and p53 oncoproteins: correlation with Ki67 proliferation index and prognostic histopathologic parameters in colorectal neoplasia. Appl Immunohistochem Mol Morphol. 2000 Sep;8(3):175-82. [CrossRef] [PubMed]
- Garrity MM, Burgart LJ, Mahoney MR, Windschitl HE, Salim M, Wiesenfeld M, Krook JE, Michalak JC, Goldberg RM, O’Connell MJ, Furth AF, Sargent DJ, Murphy LM, Hill E, Riehle DL, Meyers CH, Witzig TE; North Central Cancer Treatment Group. Prognostic value of proliferation, apoptosis, defective DNA mismatch repair, and p53 overexpression in patients with resected Dukes’ B2 or C colon cancer: a North Central Cancer Treatment Group Study. J Clin Oncol. 2004 May 1;22(9):1572-82. [CrossRef] [PubMed]
- Wang L, Liu Z, Fisher KW, Ren F, Lv J, Davidson DD, Baldridge LA, Du X, Cheng L. Prognostic value of programmed death ligand 1, p53, and Ki-67 in patients with advanced-stage colorectal cancer. Hum Pathol. 2018 Jan;71:20-29. Epub 2017 Aug 4. [CrossRef] [PubMed]
- Elkablawy MA, Maxwell P, Williamson K, Anderson N, Hamilton PW. Apoptosis and cell-cycle regulatory proteins in colorectal carcinoma: relationship to tumour stage and patient survival. J Pathol. 2001 Aug;194(4):436-43. [CrossRef] [PubMed]
- Buglioni S, D’Agnano I, Cosimelli M, Vasselli S, D’Angelo C, Tedesco M, Zupi G, Mottolese M. Evaluation of multiple bio-pathological factors in colorectal adenocarcinomas: independent prognostic role of p53 and bcl-2. Int J Cancer. 1999 Dec 22;84(6):545-52. [CrossRef] [PubMed]
- Yu J, Zhang L. PUMA, a potent killer with or without p53. Oncogene. 2008 Dec;27 Suppl 1(Suppl 1):S71-83. [CrossRef] [PubMed] [PubMed Central]
- Zalata KR, Elshal MF, Foda AA, Shoma A. Genetic dissimilarity between primary colorectal carcinomas and their lymph node metastases: ploidy, p53, bcl-2, and c-myc expression--a pilot study. Tumour Biol. 2015 Aug;36(8):6579-84. Epub 2015 Apr 4. [CrossRef] [PubMed]
- Kim MR, Jeong EG, Chae B, Lee JW, Soung YH, Nam SW, Lee JY, Yoo NJ, Lee SH. Pro-apoptotic PUMA and anti-apoptotic phospho-BAD are highly expressed in colorectal carcinomas. Dig Dis Sci. 2007 Oct;52(10):2751-6. Epub 2007 Mar 28. [CrossRef] [PubMed]
- Sugiura K, Seo Y, Tajima Y, Kikuchi H, Hirata A, Nakadai J, Baba H, Kondo T, Makino A, Kato Y, Matsui S, Seishima R, Shigeta K, Okabayashi K, Kitagawa Y. Prognostic Impact of Main Lymph Node Metastasis in Patients with Colon Cancer. World J Surg. 2023 May;47(5):1292-1302. Epub 2023 Jan 23. [CrossRef] [PubMed]
- Zhang M, Zhao F, Wu A, Du X, Zhou L, Mei S, Wei F, Hu S, Liu X, Yang H, Xu L, Xiao Y, Wang X, Liu Q, On Behalf Of The Chinese Apical Lymph Node Study Consortium. Metastatic Patterns of Apical Lymph Node and Prognostic Analysis in Rectal and Sigmoid Colon Cancer-A Multicenter Retrospective Cohort Study of 2809 Cases. Cancers (Basel). 2025 Jul 18;17(14):2389. [CrossRef] [PubMed] [PubMed Central]
- Mroczkowski P, Kim S, Otto R, Lippert H, Zajdel R, Zajdel K, Merecz-Sadowska A. Prognostic Value of Metastatic Lymph Node Ratio and Identification of Factors Influencing the Lymph Node Yield in Patients Undergoing Curative Colon Cancer Resection. Cancers (Basel). 2024 Jan 2;16(1):218. [CrossRef] [PubMed] [PubMed Central]
- Eng C, Yoshino T, Ruíz-García E, Mostafa N, Cann CG, O’Brian B, Benny A, Perez RO, Cremolini C. Colorectal cancer. Lancet. 2024 Jul 20;404(10449):294-310. Epub 2024 Jun 20. [CrossRef] [PubMed]
- Skancke M, Arnott SM, Amdur RL, Siegel RS, Obias VJ, Umapathi BA. Lymphovascular Invasion and Perineural Invasion Negatively Impact Overall Survival for Stage II Adenocarcinoma of the Colon. Dis Colon Rectum. 2019 Feb;62(2):181-188. [CrossRef] [PubMed]
- Akagi Y, Adachi Y, Ohchi T, Kinugasa T, Shirouzu K. Prognostic impact of lymphatic invasion of colorectal cancer: a single-center analysis of 1,616 patients over 24 years. Anticancer Res. 2013 Jul;33(7):2965-70. [PubMed]
- Parnaby CN, Scott NW, Ramsay G, MacKay C, Samuel L, Murray GI, Loudon MA. Prognostic value of lymph node ratio and extramural vascular invasion on survival for patients undergoing curative colon cancer resection. Br J Cancer. 2015 Jul 14;113(2):212-9. Epub 2015 Jun 16. [CrossRef] [PubMed] [PubMed Central]
- Emile SH, Horesh N, Garoufalia Z, Wignakumar A, Boutros M, Wexner SD. Association between lymphovascular invasion and lymph node metastases in colon cancer: A National Cancer Database analysis. Colorectal Dis. 2025 Jan;27(1):e17256. [CrossRef] [PubMed]
- Inoue M, Kanemitsu Y, Tsukamoto S, Moritani K, Takamizawa Y, Daiko H. Prognostic impact of primary tumour location after curative resection in Stage I-III colorectal cancer: a single-centre retrospective study. Jpn J Clin Oncol. 2024 Jul 7;54(7):753-760. [CrossRef] [PubMed]
- Ishihara S, Murono K, Sasaki K, Yasuda K, Otani K, Nishikawa T, Tanaka T, Kiyomatsu T, Kawai K, Hata K, Nozawa H, Sugihara K, Watanabe T. Impact of Primary Tumor Location on Postoperative Recurrence and Subsequent Prognosis in Nonmetastatic Colon Cancers: A Multicenter Retrospective Study Using a Propensity Score Analysis. Ann Surg. 2018 May;267(5):917-921. [CrossRef] [PubMed]
- Diez-Alonso M, Mendoza-Moreno F, Ortega MA, Aguado H, Matías B, Vera C, Soto S, Quiroga A, Blazquez SB, de Mon MA, Gutierrez-Calvo A. Differences in Colorectal Cancer Survival Based on Primary Tumor Location: Retrospective Study from a Single Institution. J Cancer. 2023 Aug 6;14(13):2444-2454. [CrossRef] [PubMed] [PubMed Central]
- Colebunders J, Mullebrouck B, Liégeois V, Peeters M, Vanhoutte G, Van Damme N, Janssens K, Vandamme T. Prognosis in stage II colorectal cancer: the effect of the primary tumour location and biomarkers - a retrospective cohort study. Oncologist. 2025 Oct 8:oyaf317. Epub ahead of print. [CrossRef] [PubMed]
- Sugano N, Suda T, Godai TI, Tsuchida K, Shiozawa M, Sekiguchi H, Yoshihara M, Matsukuma S, Sakuma Y, Tsuchiya E, Kameda Y, Akaike M, Miyagi Y. MDM2 gene amplification in colorectal cancer is associated with disease progression at the primary site, but inversely correlated with distant metastasis. Genes Chromosomes Cancer. 2010 Jul;49(7):620-9. [CrossRef] [PubMed]
- Zhang L, Zhu D, Jiang J, Min Z, Fa Z. The ubiquitin E3 ligase MDM2 induces chemoresistance in colorectal cancer by degradation of ING3. Carcinogenesis. 2023 Oct 20;44(7):562-575. [CrossRef] [PubMed]
- Xiong H, Zhang J. Expression and clinical significance of ATM and PUMA gene in patients with colorectal cancer. Oncol Lett. 2017 Dec;14(6):7825-7828. Epub 2017 Oct 13. [CrossRef] [PubMed] [PubMed Central]
- Gao W, Yuan Z, Zhao X, Wang S, Lai S, Ni K, Zhan Y, Liu Z, Liu L, Xin R, Yin X, Zhou X, Liu X, Zhang X, Zhang Q, Li G, Wang W, Zhang C. The prognostic and clinical value of p53 upregulated modulator of apoptosis expression in solid tumors: a meta-analysis and TCGA data review. Expert Rev Mol Diagn. 2022 Aug;22(8):811-819. [CrossRef] [PubMed]
- Sinicrope FA, Rego RL, Okumura K, Foster NR, O’Connell MJ, Sargent DJ, Windschitl HE. Prognostic impact of bim, puma, and noxa expression in human colon carcinomas. Clin Cancer Res. 2008 Sep 15;14(18):5810-8. [CrossRef] [PubMed] [PubMed Central]
- Mekras A, Bobos M., Vasilakou A, et al. Left-sided tumors and low expression of Mdm2 are independent favorable prognostic indicators of OS for stage II and III colorectal cancer. Adamina, M., #ECCStGallen Scientific Committee. Abstracts presented at the 13th European Colorectal Congress (#ECCStGallen), 1-5.12.2019, St. Gallen, Switzerland. Tech Coloproctol 24, 657–658 (2020). [CrossRef]
- Mekras, Alexandros MD, MSc, PhD, FICS; Bobos, Matthaios MD, PhD; Vasilakou, Alexandra MD, MSc; Atamer, Cem MD, PhD; Tsoulfas, Georgios MD, PhD, FACS, FICS; Mekras, Dimosthenis MD, MSc, PhD, FICS; Kalles, Vasileios MD, PhD; Michalopoulos, Antonios MD, PhD. Combined High Expression of PUMA and Ki-67 with Low Expression of p53 Are Independent Unfavourable Prognostic Indicators for Both the Overall Survival (OS) and Cancer Specific Survival (CSS) in Resectable Colorectal Adenocarcinomas. Journal of the American College of Surgeons 229(4):p e89, October 2019. [CrossRef]
Figure 1.
Flowchart depicting the inclusion and tissue microarray (TMA) construction process for this colorectal cancer (CRC) study. A total of 130 patients with histologically confirmed stage II or III CRC were included. Formalin-fixed paraffin-embedded tissue samples from primary tumors, paired lymph node metastases (n=43), and adjacent normal mucosa (n=84) were collected and assembled into 7 TMA blocks containing 328 tissue cores. Immunohistochemical analysis was performed for apoptotic and proliferation markers BAD, BCL2, BID, Ki-67, MDM2, p53, and PUMA. Numbers and percentages reflect the successful evaluation rate of each marker in the respective tissue types. This diagram illustrates the comprehensive coverage of samples and markers used for biomarker expression and correlation analyses in the study.
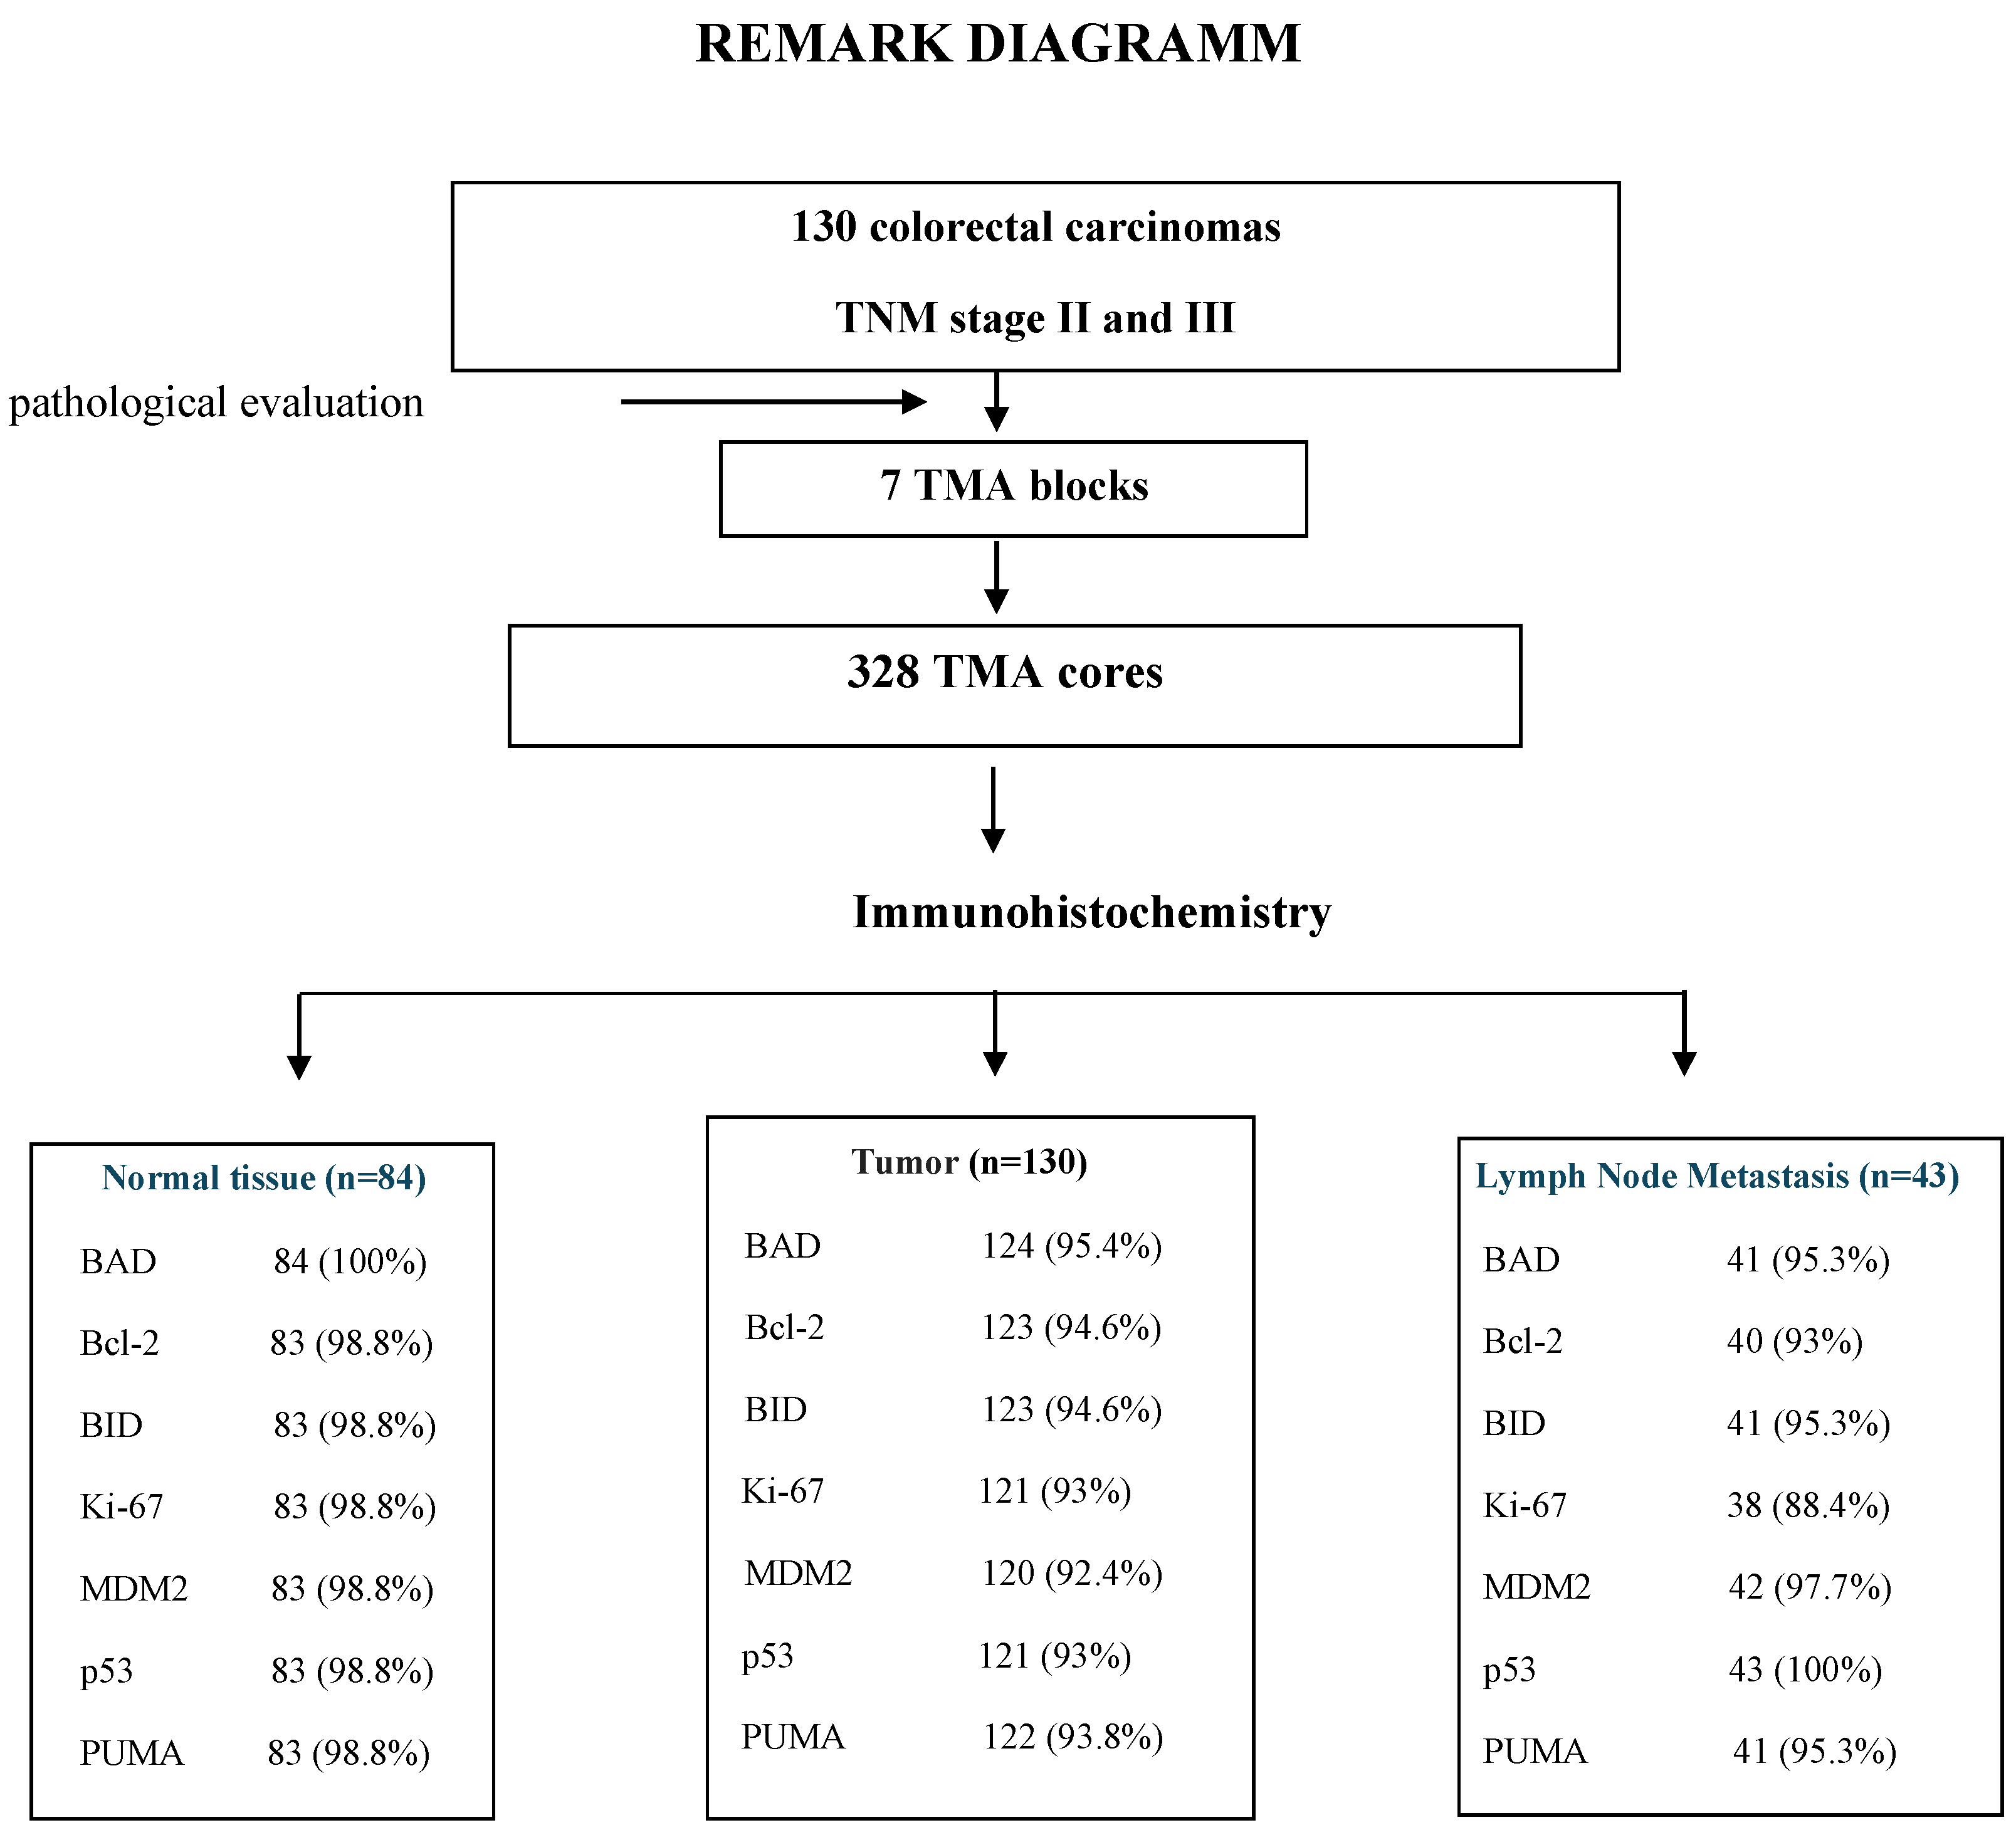
Figure 2.
Kaplan-Meier survival analysis. BAD low expression on primary tumor was associated with lower DFS (A); inferior CSS (B) and poorer OS (C).
Figure 2.
Kaplan-Meier survival analysis. BAD low expression on primary tumor was associated with lower DFS (A); inferior CSS (B) and poorer OS (C).
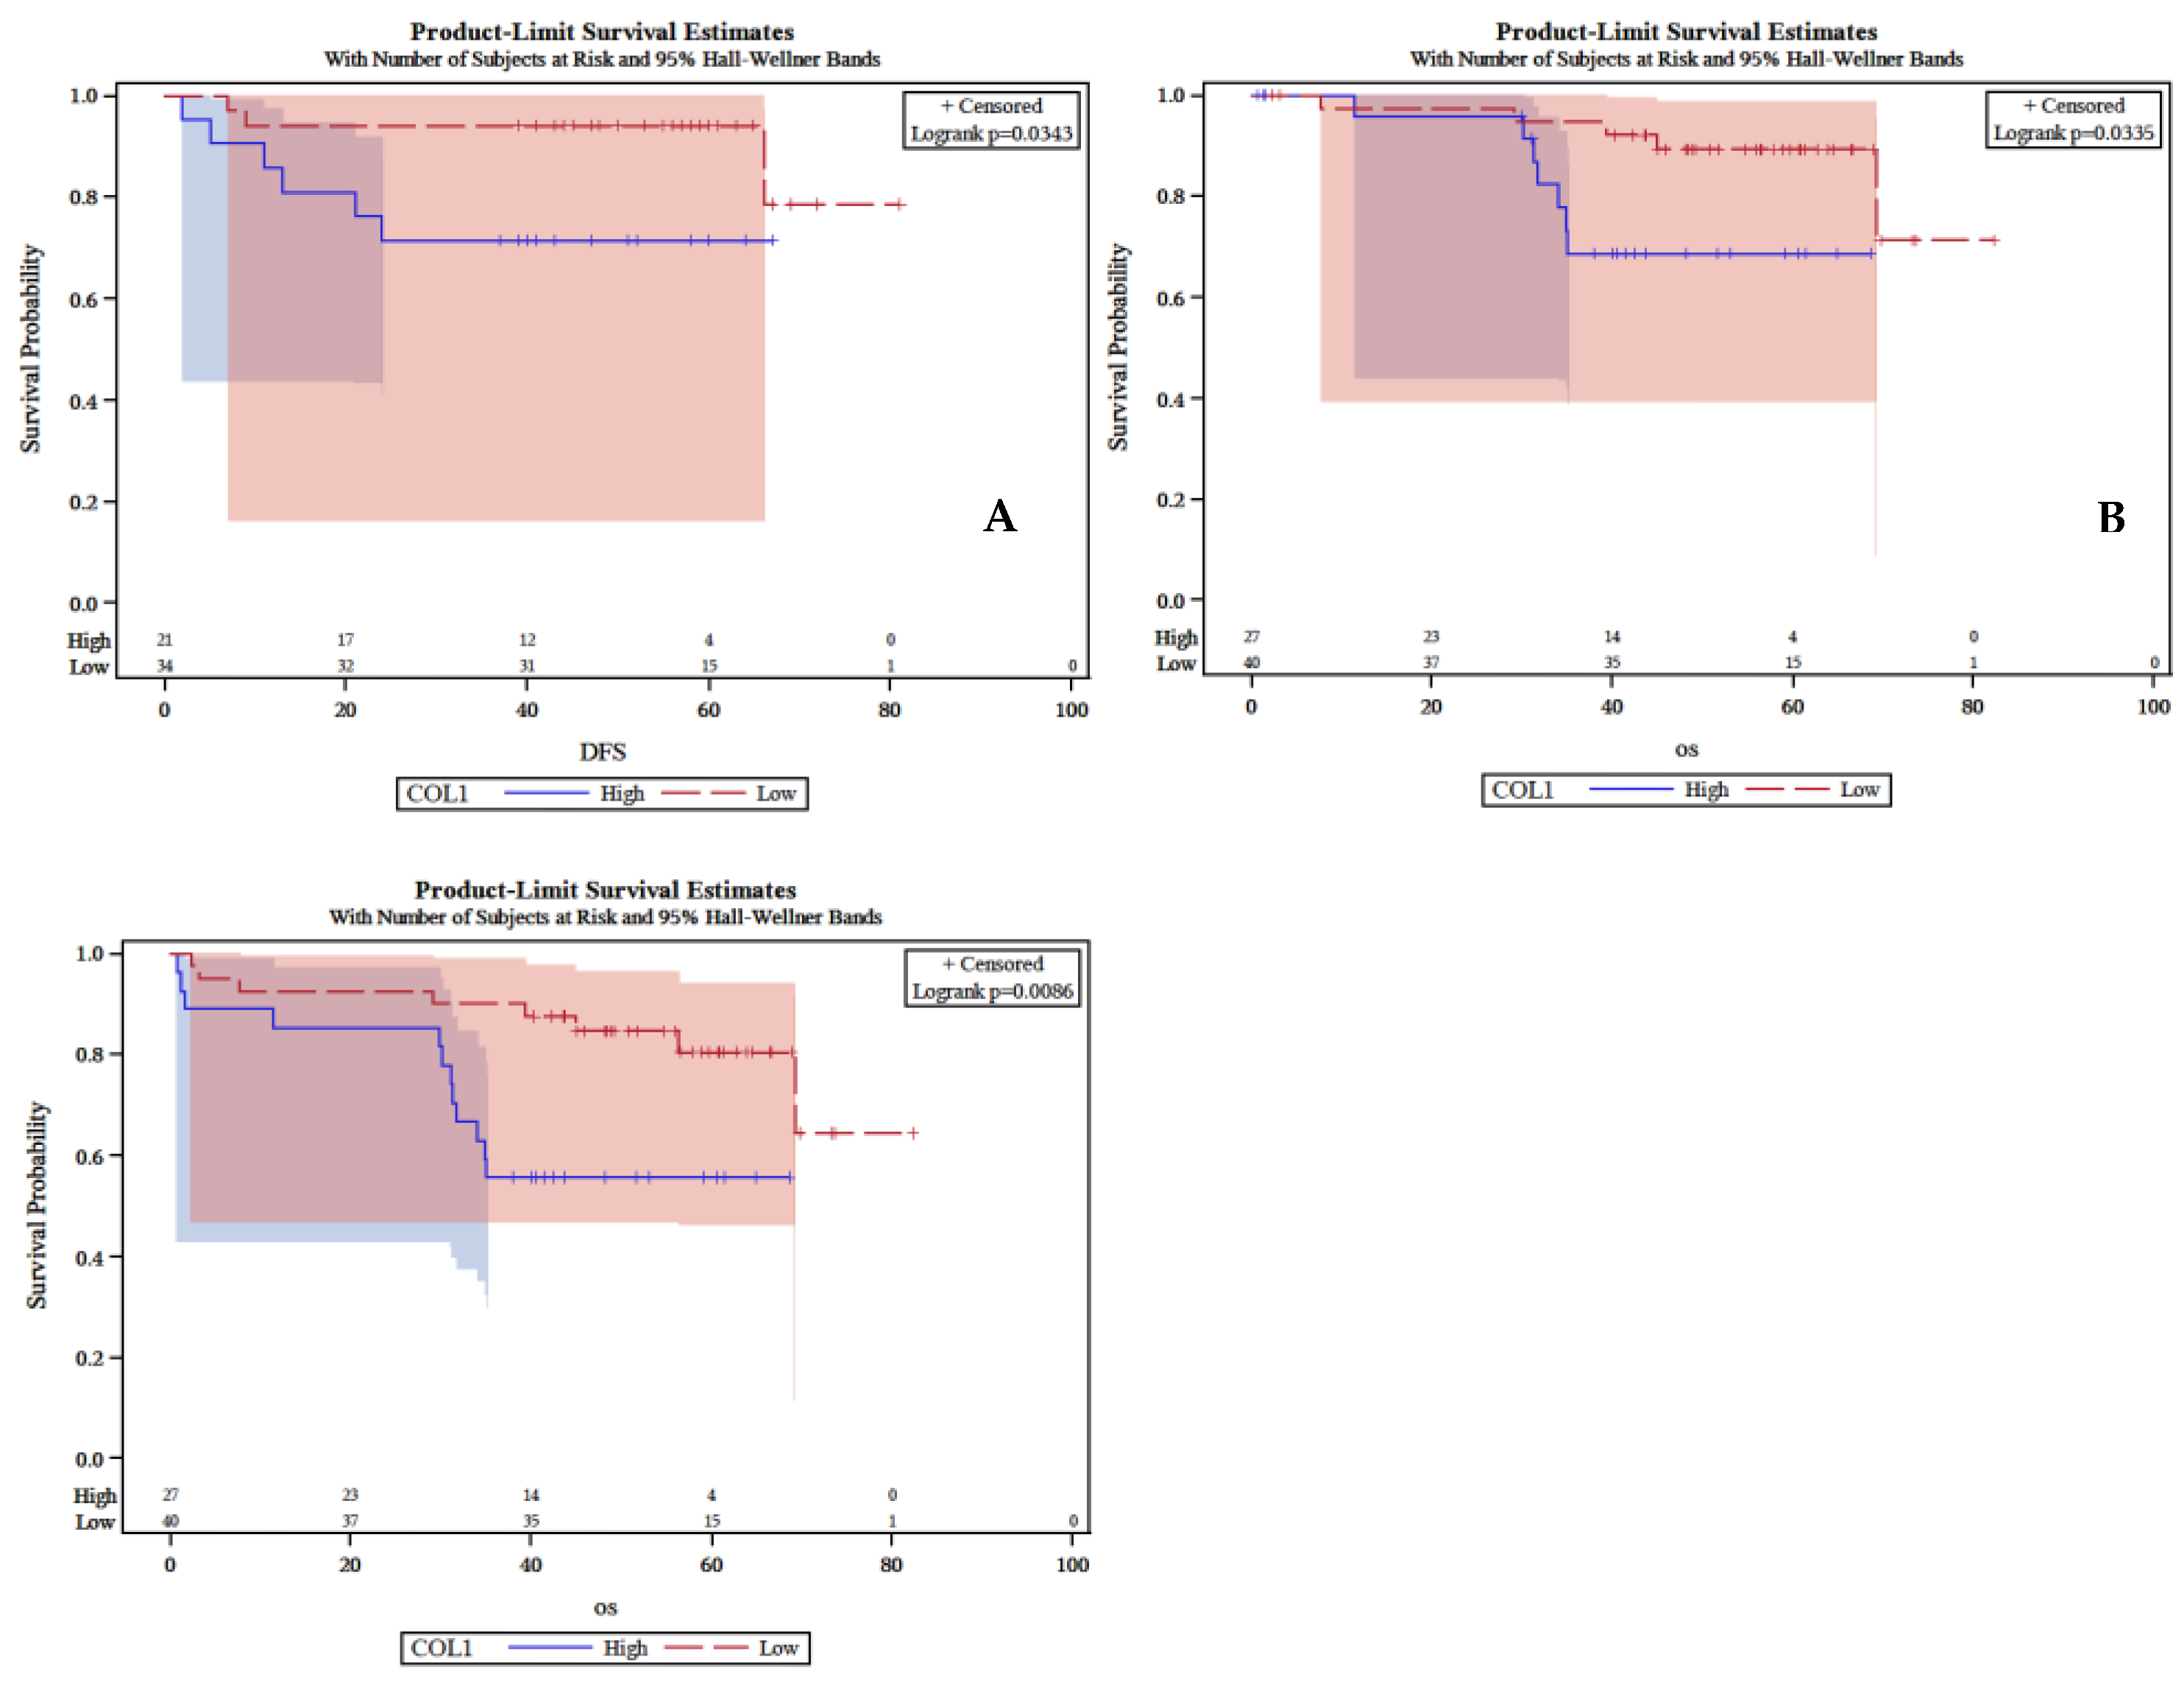

Table 1.
Antibodies and staining procedures used in the present study.
| Antigen | Clone/P | AR/Τ/WB | AD | I | DTS/P | SP |
| BAD | ab32445 (1) | ER1/HP, 20΄/PBS | 1:250 | 30΄ | Polymer HRP/DAB (3) | C |
| Bcl2 | 124 (2) | ER1/HP, 20΄/PBS | 1:80 | 20΄ | Polymer HRP/DAB (3) | C |
| BID | ab32060 (1) | ER1/HP, 20΄/PBS | 1:100 | 15 | Polymer HRP/DAB (3) | C |
| Ki-67 | MIB1 (2) | ER2/HP, 20΄/PBS | 1:70 | 70΄ | Polymer HRP/DAB (3) | N |
| MDM2 | SMP14 (1) | ER2/HP, 20΄/PBS | 1:50 | 30΄ | Envision (2) | N |
| p53 | DO-7 (2) | ER2/HP, 20΄/PBS | 1:100 | 30΄ | Polymer HRP/DAB (3) | N |
| PUMA | ab 33906 (1) | ER1/HP, 20΄/PBS | 1:30 | 30΄ | Polymer HRP/DAB (3) | C |
Abbreviations: AD: Antibody Dilution; AR: Antigen Retrieval; C: Cytoplasm; DTS: Detection System; ER1: Citric Acid pH6.0; ER2: Ethylenediaminetetraacetate, pH8.8; N: Nuclear; P: Provider; PBS: Phosphate Buffered Saline; Antibody and detection systems providers: (1): Abcam, Cambridge, UK; (2): Dako, Glostup, DK; (3): Leica Biosystems, Newcastle Upon Tyne, UK.
Table 2.
Patient and tumor characteristics in the entire cohort and in colon and rectum.
| Total | Colon | Rectum | P-value | ||
| N | 130 (100%) | 91 (70%) | 39 (30%) | ||
| Age | |||||
| Mean (SD) | 69.8 (10.5) | 72.4 (9.7) | 63.7 (9.7) | ||
| Min-Max | 32-91 | 49-91 | 32-79 | ||
| Age | |||||
| <65 | 37 (28.4%) | 18 (19.8%) | 19 (48.8%) | 0.001 | |
| ≥ 65 | 93 (71.6%) | 73 (80.2%) | 20 (51.2%) | ||
| Sex | |||||
| Female | 59 (45.4%) | 43 (47.2%) | 16 (41%) | 0.513 | |
| Male | 71 (54.6%) | 48 (52.8%) | 23 (59%) | ||
| Tumor primary site | |||||
| Rectum | 39 (30%) | 39 (100%) | - | ||
| Left Colon | 52 (40%) | 52 (57.2%) | - | - | |
| Right Colon | 39 (30%) | 39 (42.8%) | - | - | |
| Tumor size | |||||
| <=3 | 39 (30%) | 30 (33%) | 9 (23%) | 0.259 | |
| >3 | 91 (70%) | 61 (67%) | 30 (77%) | ||
| LVI | |||||
| Yes | 39 (30%) | 24 (26.4%) | 15 (38.4%) | 0.168 | |
| No | 91 (70%) | 67 (73.6%) | 24 (61.6%) | ||
| Grade | |||||
| Low | 16 (12.4%) | 12 (13.2%) | 4 (10.2%) | 0.363 | |
| High | 21 (16.2%) | 12 (13.2%) | 9 (23%) | ||
| Intermediate | 93 (71.6%) | 67 (73.6%) | 26 (66.6%) | ||
| Astler Coller | |||||
| Classification | B2 | 65 (50%) | 50 (55%) | 15 (38.4%) | 0.085 |
| C1-C2 | 65 (50%) | 41 (45%) | 24 (61.6%) | ||
| T(TNM) | |||||
| T2 | 6 (4.6%) | 4 (4.4%) | 2 (5.2%) | 0.855 | |
| T3-T4 | 124 (95.4%) | 87 (95.6%) | 37 (94.8%) | ||
| N(ΤΝΜ) | |||||
| N0 | 65 (50%) | 50 (55%) | 15 (38.4%) | 0.009 | |
| N1 | 37 (28.4%) | 28 (30.8%) | 9 (23%) | ||
| N2 | 28 (21.6%) | 13 (14.2%) | 15 (38.4%) | ||
| AJCC Stage | |||||
| IIA | 65 (50%) | 50 (55%) | 15 (38.4%) | 0.058 | |
| IIIA | 4 (3%) | 3 (3.2%) | 1 (2.6%) | ||
| IIIB | 52 (40%) | 35 (38.4%) | 17 (43.6%) | ||
| IIIC | 9 (7%) | 3 (3.2%) | 6 (15.4%) | ||
| Recurrence | |||||
| No | 99(79.2) | 68 (79.1) | 31 (79.5) | 0.958 | |
| Yes | 26(20.8) | 18 (20.9) | 8 (20.5) | ||
| CTx | |||||
| Yes | 88 (67.6%) | 54 (59.4%) | 34 (87.2%) | 0.003 | |
| No | 40 (30.8%) | 35 (38.4%) | 5 (12.8%) | ||
| Not reported | 2 (1.6%) | 2 (2.2%) | - | ||
| CTx Schemes | |||||
| Not reported | 2 (1.6%) | 2 (2.2%) | - | 0.026 | |
| FOLFOX | 55 (42.4%) | 33 (36.2%) | 22 (56.4%) | ||
| None | 40 (30.8%) | 35 (38.4%) | 5 (12.8%) | ||
| 5FU-LV | 10 (7.6%) | 7 (7.6%) | 3 (7.6%) | ||
| XELOX | 23 (17.6%) | 14 (15.4%) | 9 (23%) |
Abbreviations: CTx: Chemotherapy; 5FU-LV: Fluorouracil-Leucovorin Calcium; LN: lymph Node; LVI: Lymphovascular invasion.
Table 3.
Multivariate cox regression analysis of CSS were the combined PUMA/p53 variable is included.
Table 3.
Multivariate cox regression analysis of CSS were the combined PUMA/p53 variable is included.
| Description | HazardRatio | WaldLower | WaldUpper | ProbChiSq |
| Stage_N_N1 | 0.451 | 0.113 | 1.804 | 0.2601 |
| Stage_N_N2(a+b) | 2.843 | 0.897 | 9.013 | 0.0759 |
| Invasion Yes | 0.920 | 0.280 | 3.018 | 0.0532 |
| Rectum vs Colon | 3.407 | 1.104 | 10.510 | 0.8902 |
| Right vs Left Colon | 2.866 | 0.985 | 8.333 | 0.0330 |
| KI67_High | 1.315 | 0.230 | 7.505 | 0.1104 |
| PUMA_p53_high/high | 4.599 | 0.847 | 24.982 | 0.7579 |
| PUMA_p53_high/low | 2.674 | 0.382 | 18.729 | 0.0772 |
| PUMA_p53_low/high | 2.222 | 0.834 | 5.924 | 0.3221 |
Table 4.
Multivariate cox regression analysis of OS were the combined PUMA/p53 variable is included.
Table 4.
Multivariate cox regression analysis of OS were the combined PUMA/p53 variable is included.
| Description | HazardRatio | WaldLower | WaldUpper | ProbChiSq |
| Stage_N_N1 | 1.983 | 0.839 | 4.687 | 0.7011 |
| Stage_N_N2(a+b) | 0.814 | 0.285 | 2.324 | 0.0012 |
| Rectum vs Colon | 4.971 | 1.881 | 13.136 | 0.0047 |
| Right vs Left Colon | 5.817 | 1.716 | 19.720 | 0.0282 |
| Chemotherapy none | 3.074 | 1.127 | 8.379 | 0.0001 |
| Chemotherapy 5FU vs FOLFOX | 7.117 | 2.628 | 19.276 | 0.7616 |
| Chemotherapy XELOX | 1.411 | 0.153 | 13.037 | 0.0290 |
| KI67_High | 0.088 | 0.010 | 0.780 | 0.0376 |
| PUMA_p53_high/high | 0.751 | 0.171 | 3.305 | 0.7049 |
| PUMA_p53_high/low | 2.423 | 0.604 | 9.722 | 0.2119 |
| PUMA_p53_low/high | 0.638 | 0.107 | 3.806 | 0.6223 |
| MDM2_High | 2.437 | 1.053 | 5.643 | 0.1186 |
Disclaimer/Publisher’s Note: The statements, opinions and data contained in all publications are solely those of the individual author(s) and contributor(s) and not of MDPI and/or the editor(s). MDPI and/or the editor(s) disclaim responsibility for any injury to people or property resulting from any ideas, methods, instructions or products referred to in the content. |
© 2025 by the authors. Licensee MDPI, Basel, Switzerland. This article is an open access article distributed under the terms and conditions of the Creative Commons Attribution (CC BY) license (http://creativecommons.org/licenses/by/4.0/).
Copyright: This open access article is published under a Creative Commons CC BY 4.0 license, which permit the free download, distribution, and reuse, provided that the author and preprint are cited in any reuse.


