Submitted:
22 October 2025
Posted:
27 October 2025
You are already at the latest version
Abstract
Accurate calculation of toric intraocular lenses (IOLs) remains challenging, particularly in accounting for posterior corneal astigmatism. This study compared the prediction accuracy of two industry-standard toric calculators using ray-traced total corneal astigmatism (TCA). In a two-year retrospective chart review at an academic outpatient center, patients undergoing femtosecond laser-assisted cataract surgery with toric IOL implantation were included, excluding those with corneal pathology, irregular astigmatism, prior ocular surgery, or maculopathy. Tomographic and ray-traced TCA along with swept-source OCT (SS-OCT) biometry were entered into the Tecnis Toric Calculator (TTC), while SS-OCT values were entered into the Barrett Toric Calculator (BTC) using both predicted posterior corneal astigmatism (P) and measured posterior corneal astigmatism (M). Absolute prediction errors (PE) of spherical equivalent and cylinder power were compared, with subgroup analysis of with-the-rule (WTR) and against-the-rule (ATR) astigmatism. Sixty eyes of forty patients were analyzed. TTC with TCA achieved lower mean absolute cylinder PE (0.52 D) than BTC with P (0.59 D, p=0.016) and M (0.56 D, p=0.024), with significant advantages in WTR eyes but not ATR eyes. Across calculators, ATR eyes showed greater residual error and overcorrection. These findings support incorporating ray tracing and tomography to improve toric IOL prediction accuracy.
Keywords:
toric IOL
; vector analysis
; Alpins method
; total corneal astigmatism
; posterior corneal astigmatism
; tomography
; residual astigmatism
; toric IOL calculators
1. Introduction
Expectations for refractive outcomes following cataract surgery are increasingly higher with the improvement in surgical expertise, decreased complication rates, and improved lens manufacturing technology. Residual astigmatism following cataract surgery can adversely affect refractive outcome and visual quality. One study estimated that approximately 20% of patients undergoing cataract surgery have greater than 1.5 D of pre-operative astigmatism.[1] Measures to perform astigmatism correction are essential for achieving optimal visual and refractive outcomes.
The effect of the posterior corneal astigmatism (PCA) is an important factor to consider for toric IOL calculations. Previous studies have shown that the average PCA can range from 0.24 – 0.66 D.[2,3,4,5] Neglecting this amount of astigmatism may result in unwanted refractive errors. The PCA can be calculated directly by various methods including dual-Scheimpflug tomography (Galilei G4, Zeimer Ophthalmic Systems AG, Alton, IL), or SWEPT source OCT (SS-OCT) (IOLMaster 700, Carl Zeiss Meditec AG, Dublin, CA), or indirectly calculated through formulas (the Barrett toric calculator (BTC) and the TECNIS toric calculator ((TTC).[6] The BTC allows for manual input of a measured PCA (M) or utilization of its proprietary algorithm for a predicted PCA (P) from anterior corneal astigmatism.
One recent study using the BTC demonstrated a higher percentage of eyes within +/- 0.50 D and 0.75 D using SS-OCT keratometry and the P PCA (99%) compared to using SS-OCT keratometry and tomographically M PCA (95%) and both tomographically measured keratometry and M PCA (84%).[7] A similar smaller study demonstrated comparable accuracy between P and M SS-OCT PCA in the BTC.[8]
Using tomography and ray tracing, total corneal power (TCP) is calculated, designating the powers and orientations of the steep and flat meridians, and total corneal astigmatism (TCA).[9] The accuracy of tomographic measurements and ray tracing calculated TCA with IOL toric calculations is not established and cannot be input into the BTC, as there would be a double accounting for the PCA. This study aims to compare the accuracy of tomographic measured TCA input into the TTC with that of the P and M PCA of the IOLMaster 700 input into the BTC.
2. Materials and Methods
2.1. Subjects
This retrospective study analyzed patients who underwent femtosecond laser assisted cataract surgery (FLACS) and toric intraocular lens (IOLs) implantation from February 2019 to August 2021. The University of North Carolina Office of Human Research and Ethics determined this study did not constitute human subjects research, and a waiver was issued indicating no further Institutional Review Board approval was necessary. This study was in adherence to the tenets of the Declaration of Helsinki as well as regulations established by HIPAA.
Inclusion criteria for this study consisted of patients with implanted monofocal Tecnis toric IOLs (Johnson & Johnson Vision Care, Inc. Santa Anna, CA) who returned 1 month after surgery for post-operative measurements. Patients with intra-operative complications (such as posterior capsular rupture), previous corneal surgery, acute or chronic diseases of the anterior segment, and existing co-morbidities that would likely affect refractive outcomes (Fuchs’ dystrophy, Salzmann’s dystrophy, keratoconus, maculopathy, epiretinal membrane, etc.) were excluded from the study.
Preoperatively, to calculate IOL power, biometry was performed using SS-OCT (IOLMaster 700, Carl Zeiss Meditec AG, Dublin, CA). Callisto eye reference images were acquired. Pre-operative TCA, steep and flat powers and meridians were calculated using Placido topography, dual-Scheimpflug tomography, and ray tracing.[9] TCA calculations take into consideration corneal thickness and both the anterior and posterior corneal curvatures and meridians.
Post-operative measurements comprised of manifest refraction taken by a skilled ophthalmic technician. Uncorrected distance visual acuity (UDVA) and corrected distance visual acuity (CDVA) were measured preoperatively and postoperatively.
2.2. Calculation Methods
For the TTC group, the TCA, steep and flat powers and meridians were input into the online Johnson & Johnson Vision TTC and suggested toric power and predicted residual cylinder were calculated using the Holladay 1 formula.[6] The spherical power was input from IOLMaster calculations, using the Haigis formula with surgeon-specific optimized constants. The option to include the TTC’s internal algorithm for PCA was not selected, since TCA data were used. Calculations from this method were used for surgical planning and IOL implantation.
In a retrospective manner, steep and flat keratometric powers and meridians and other biometric measurements from the IOLMaster were input into the online BTC of the same patients. The option to include the BTC’s algorithm for P PCA was compared to M PCA for BTC. These data for PK were derived from the IOLMaster 700. The IOL SE power was calculated by the BTC.
2.3. Surgical Technique
All surgeries were performed by the same experienced surgeon (KLC). Callisto eye reference images were uploaded into the Zeiss OPMI LUMERA microscope (Zeiss Meditec AG, Dublin, CA), and aligned with the real-time operative images to identify the 180 degree and the steep meridians. FLACS was performed (Catalys Precision Laser System (Johnson&Johnson Vision Care, Inc. Santa Ana, CA)), creating the capsulotomy, lens softening, and lens fragmentation. Bimanual, sleeveless phacoemulsification using an appropriate chopping technique and cortex removal were performed through two 1.2 x 1.4 trapezoid blade created side-port incisions (Whitestar Signature® PRO Phacoemulsification System (Johnson & Johnson Vision, Santa Ana, CA)). The right-hand incision was enlarged with a 2.2 mm keratome, and the Tecnis monofocal toric IOL (ZCT or ZCU, Johnson & Johnson Vision, Santa Ana, CA) was injected, incision-assisted, and placed into the capsular bag using a Sinskey hook. The toric IOL was positioned in the intended steep meridian using the Callisto eye Z Align® function. Postoperatively, patients were given a combination of antibiotic, steroidal, and nonsteroidal eye drops. All patients returned for routine follow-up including approximately 1 month after surgery.
2.4. Outcome Measures
The spherical equivalent (SE) and residual cylinder arithmetic differences and absolute prediction errors (PE) were calculated by comparing post-operative manifest refraction to the predicted value for each calculation method. Suggested spherical and toric power, IOL orientation and residual cylinder meridian were also compared across calculation methods.
The Alpins method was used to calculate the four main vector parameters: target induced astigmatism (TIA), surgically induced astigmatism (SIA), difference vector (DV), and correction index (CI).[10] Postoperative manifest refractions were converted to the corneal plane (vertex distance = 12 mm) for the vector analysis since pre-operative astigmatic measurements were taken at the corneal plane. Double angle-plot analysis was performed.[11]
For further analysis, study eyes were separated into groups according to their preoperative steep astigmatic meridian from dual-Scheimpflug tomography: with-the-rule (60° ≤ Steep Meridian ≤ 120°), against-the-rule (0° ≤ Steep Meridian ≤ 30° and 150° ≤ Steep Meridian ≤ 180°), and oblique (30° < Steep Meridian < 60° and 120° < Steep Meridian < 150°). The oblique subgroup was excluded from separate analysis since it was comprised of only 4 eyes.
2.5. Statistical Analysis
Data was analyzed using SPSS Statistics for Windows operating system (version 27.0, SPSS, Inc.). The Shapiro-Wilk test was used to check data distributions for normality. The Wilcoxon Signed-Rank Test was used to compare differences before and after surgery. A P-value less than 0.05 was considered statistically significant. The single angle plots for TIA, SIA, DV, and CI analyses were constructed using the AstigMATIC application.[12]
3. Results
A total of 60 eyes of 40 patients were included in this study (16 male, 24 female). The average patient age was 69.62 ± 9.66 years. A summary of pre-operative biometry and IOL power is found in Table 1. Twenty-two eyes demonstrated with-the-rule astigmatism (WTR), 34 against-the-rule astigmatism (ATR), and 4 oblique astigmatism. The mean calculated SE for IOL power was 19.62±4.42 D with SS-OCT using the optimized Haigis formula (Table 2). The mean calculated SE IOL power was 19.42±4.42 D with the biometry input with the predicted (P) PCA in the BTC, and 19.42±4.33 D for the same biometry input with the measured (M) PCA in BTC. The SE of TCA input into TTC was significantly greater than the SE lens power of P and M in BTC (p=0.015 each). The mean suggested toric power with P PCA input into BTC was 2.60±0.98 D. This was significantly more compared to use of tomographic TCA input into TTC (2.35±0.88 D, p=0.010) and with M PCA input into BTC (2.29±0.89 D, p<0.001). The ATR subgroup followed this same pattern with P PCA in BTC (2.98±0.97 D) greater than TCA in TTC (2.27±0.70 D, p<0.001) and M PCA in BTC (2.47±0.98 D, p<0.001). The WTR subgroup demonstrated a higher suggested toric power by formulas using the TCA in TTC (2.52±1.07 D) compared to M PCA in BTC (2.10±0.73 D, p=0.016) and P PCA in BTC (2.14±0.75 D, p=0.007) (Table 2).
The average pre-operative CDVA LogMAR was 0.24±0.23, and average post-operative UDVA was LogMAR 0.17±0.28. Sixty-five percent of eyes demonstrated 20/25 UDVA or better at one month post-operatively (Figure 1). Mean post-operative CDVA was LogMAR 0.01±0.10.
3.1. Spherical Equivalent Predicted Error
There was no significant difference between the mean SE PE between all groups. However, the mean absolute SE PE was lower using TCA in TTC (0.32±0.26 D) compared to M PCA in BTC (0.36±0.28 D, p=0.036), and no different compared to the P PCA in BTC (0.39±0.46, p =0.181) (Table 3). Subgroup analysis found that ATR eyes, the mean absolute SE PE was greatest using P PCA in BTC (0.42±0.53 D) compared to both TCA in TTC (0.31±0.23 D, p=0.016) and M PCA in BTC (0.35±0.24, p=0.05) (Table 3).
3.2. Residual Cylinder Predicted Error
The mean residual cylindrical power (CYLP) PE of the TCA in TTC was greater (0.21±0.12 D) compared to both P PCA in BTC (0.16±0.11 D, p=0.011) and M PCA in BTC (0.15±0.12 D, p=0.040) (Table 3). This relationship was consistent within the WTR group, but not ATR group. WTR mean residual CYLP PE of TCA in TTC (0.23±0.11 D) was greater compared to CYLP PE of P PCA in BTC (0.14±0.10 D, p=0.009) and CYLP PE of M PCA in BTC (0.14±0.12 D, p=0.23). The mean absolute CYLP PE of TCA in TTC (0.52±0.44 D) was smaller compared to P PCA in BTC (0.59±0.45, p=0.024) and M PCA in BTC (0.56±0.40, p=0.016). This was also consistent within the WTR group but not ATR group where no significant difference in mean absolute CYLP PE was appreciated. WTR mean absolute CYLP PE of TCA in TTC (0.26±0.27) was less than mean absolute CYLP PE of P PCA in BTC (0.31±0.32, p=0.044) and CYLP PE of M PCA in BTC (0.35±0.32, p=0.016) (Table 3). Overall, the mean absolute CYLP PE was greater in the ATR group compared to the WTR group with use of all formulas (TCA in TTC, P PCA in BTC, M PCA in BTC, p<0.001 in each). A full summary of values and statistical relationships is found in Table 3. Thirty-three percent of eyes achieved <0.25 D 48% <0.5 D and 85%<1.0 of residual astigmatism (Figure 2).
3.3. Vector Analysis
The vector analysis (which used the data from TCA in TTC and implanted IOL) demonstrated a summated vector mean TIA of 0.31 D at 21° (Figure 3). The mean TIA was 1.74±0.57 D overall, 1.86±0.69 D for WTR, and 1.66 D±0.46 D for ATR (Table 4). The mean summated vector for SIA was 0.62 D at 6°, while the mean SIA was 2.10 D for all eyes, 1.84 D for WTR and 2.26 D for ATR. The mean summated DV was 0.38 D at 84° for all eyes (Figure 4), 0.06 D at 57° for WTR, and 0.60 D at 86° for ATR. The CI was 1.17 for all eyes, 0.96 for WTR, and 1.32 for ATR. For all eyes, the mean AE was -2, -1, and -3 for All, WTR, and ATR, respectively, which is an average counterclockwise rotation to the intended axis. The IOS was 0.39, 0.20, and 0.52 for All, WTR, and ATR, respectively (Table 4). A double angle plot analysis of the predicted postoperative refractive residual astigmatism is demonstrated in Figure 5 for each calculation method. The centroids were 0.34 D @ 19º ± 0.66D for M PCA in BTC, 0.34 D @ 20º ± 0.66D for P PCA in BTC, and 0.41 D @ 17º ± 0.67D for TCA in TTC.
4. Discussion
The results of this study demonstrate that TCA calculated using dual-Scheimpflug tomography and ray tracing is a viable alternative for toric IOL calculation. Our results are at least as good as the published BTC into which TCA cannot be input. This is important as it is well established that PCA must be considered for toric IOL calculations.[4] There is, in fact, recent evidence that using an algorithm to adjust for PCA improved results for toric IOL outcome.[13] Also, ray tracing is being investigated as a viable method for IOL calculations.[14] Beyond tomographic ray tracing of the cornea alone, software such as Okulix offers a more comprehensive ray tracing approach by modeling the entire eye rather than relying solely on keratometric or anterior segment parameters. Okulix incorporates corneal topography, anterior chamber depth, lens thickness, and axial length into a true ray tracing algorithm, thereby avoiding many of the simplifications inherent in paraxial formulas.[15] Early work by Preußner and colleagues has demonstrated that Okulix can achieve high accuracy across a range of biometric profiles, with particular utility in challenging eyes such as post-refractive surgery cases.[15] Comparative studies have also shown that tomography-based ray tracing for IOL power prediction can achieve accuracy on par with or superior to standard formula-based methods.[16] While our current study was limited to TCA via dual-Scheimpflug tomography and did not incorporate whole-eye ray tracing, these findings suggest that extending the principles demonstrated here into platforms like Okulix may further refine toric IOL power prediction and astigmatism correction. The Okulix formula is more sophisticated than using the Galilei’s TCA as it takes into account the entire eye.[15,16] It should be emphasized that measurements of Scheimpflug tomographic technology and SS-OCT technology are not interchangeable for IOL calculations, specifically posterior corneal measurements.[17-19]
For all subjects, supporting the use of M PCA when performing toric IOL calculations, there is a smaller absolute mean PE of residual CYLP using TCA in TTC compared to use of the commonly used P PCA in the BTC (Table 3). Also, use of M PCA in BTC resulted in a smaller absolute mean PE of residual CYLP than P PCA in the BTC. Overall, the mean absolute PE of residual CYLP with use of P PCA in the BTC was greatest compared to other methods. In the subgroup analysis, mean absolute residual CYLP was smaller only in the WTR group using TCA in the TTC compared to using either P or M PCA in the BTC. In the ATR group, the mean absolute PE of residual CYLP was greater than the WTR group for all toric calculations (Table 3). This is highlighted by the over correction in the ATR group (CI = 1.32 ATR versus CI = 0.96 WTR) (Table 4). This suggests better accuracy using PCA (TCA, P PCA, M PCA) for toric IOL calculations in WTR eyes. Overall, the need to consider PCA for toric IOL calculations is supported by the double angle plots of the postoperative refractive astigmatism PE corrected to the corneal plane (Figure 5). For TTC, P BTC, and M BTC, all centroids are smaller than 0.50 D, and their meridians are similar, as one would want. In addition, even with one outlier on the TTC, the 95% confidence intervals appear very similar between groups.
The mean SE PE used for the implanted IOL was also greater compared to M PCA in BTC but not P PCA in BTC (Table 3). The opposite relationship was seen with the mean absolute SE PE, which was smallest compared to the BTC. The discrepancy between these two findings suggests similar accuracy between methods with the surgeon optimized Haigis tending to leave the patient slightly more myopic compared BTC. While the differences in PEs were statistically significant, the magnitudes are quite small and unlikely clinically significant (Table 3). Additionally, our method is effective as the arithmetic mean of the DV was about 39% of the arithmetic mean of the TIA, and comparison of the single angle plots demonstrate clustering of the DVs 1 D or less (Figure 1 and Figure 2).
Limitations in this study include nature of retrospective chart review, subjective 1-month post-operative refractions which were carried out by different technicians, and astigmatism outcome with less optimal index of success (overall 0.39 with zero being preferred).
The use of anterior corneal measurements alone in toric IOL calculations has been previously shown to overestimate TCA in WTR eyes and underestimate astigmatism in ATR eyes.[20-24] Nearly 97% of eyes have an ATR of the posterior cornea with mean magnitude near 0.3 D.[4,24] We present a novel method using tomography and ray tracing calculation for TCA that incorporates direct measurement of the PCA for use in toric IOL calculation. This method seems at least as good as the BTC, which as stated, cannot use this methodology. Interestingly, in this study all calculation methods which incorporated PCA overestimated the toric power in ATR, which was demonstrated by a CI greater than 1 and mean absolute residual CYLP greater in the ATR eyes compared to WTR eyes. This resulted in 85% of eyes in the ATR with a flipped meridian versus 27% of eyes in the WTR with a flipped meridian.
5. Conclusions
Integrating the TCA via ray tracing and tomography should be considered when calculating toric IOL powers and may improve accuracy for astigmatism correction with cataract surgery. Use of TCA in TTC may improve accuracy with prediction of residual CYLP in WTR eyes. Recognition that these formulas may tend to overcorrect astigmatism in ATR eyes should guide decision-making with toric IOL selection.
Author Contributions
Each author made substantial contributions to the conception and design of the work including the acquisition, analysis, and interpretation of data. Conceptualization, N.K.P. and K.L.C.; methodology, N.K.P. and K.L.C.; software, N.K.P. and K.L.C.; validation, N.K.P. and K.L.C.; formal analysis, N.K.P. and K.L.C.; investigation, N.K.P. and K.L.C.; data curation, N.K.P. and K.L.C.; writing, N.K.P. and K.L.C.; supervision, K.L.C. All authors have read and agreed to the published version of the manuscript.
Funding
This research received no external funding.
Institutional Review Board Statement
The University of North Carolina Office of Human Research and Ethics issued a waiver of informed consent in its entirety as well as a waiver of HIPAA authorization. This study was in adherence to the tenets of the Declaration of Helsinki as well as regulations established by HIPAA.
Informed Consent Statement
Informed consent was not obtained from the patients as this study was retrospective.
Data Availability Statement
The data that support the findings of this study are available from the corresponding author upon reasonable request.
Acknowledgments
No financial support was received to support this study.
Conflicts of Interest
The authors declare no conflicts of interest.
Abbreviations
The following abbreviations are used in this manuscript:
| ATR | Against-the-Rule |
| BTC | Barrett Toric Calculator |
| CDVA | Corrected Distance Visual Acuity |
| CI | Correction Index |
| CYLP | Mean Residual Cylinder Power |
| DV | Difference Vector |
| FLACS | Femtosecond Laser-Assisted Cataract Surgery |
| HIPAA | Health Insurance Portability and Accountability Act |
| IOL | Intraocular Lens |
| IOS | Index of Success |
| OCT | Optical Coherence Tomography |
| PCA | Posterior Corneal Astigmatism |
| PE | Prediction Error |
| PK | Posterior Keratometry |
| SD | Standard Deviation |
| SE | Spherical Equivalent |
| SIA | Surgically-Induced Astigmatism |
| SS-OCT | Swept Source-Optical Coherence Tomography |
| TCA | Total Corneal Astigmatism |
| TCP | Total Corneal Astigmatism |
| TIA | Target-Induced Astigmatism |
| TP | Toric Power |
| TTC | Tecnis Toric Calculator |
| UDVA | Uncorrected Distance Visual Acuity |
| VA | Visual Acuity |
| WTR | With-the-Rule |
References
- Ostri C, Falck L, Boberg-Ans G, Kessel L. The need for toric intra-ocular lens implantation in public ophthalmology departments. Acta Ophthalmol (Copenh). 2015;93(5):e396-e397. [CrossRef]
- Ho JD, Tsai CY, Liou SW. Accuracy of corneal astigmatism estimation by neglecting the posterior corneal surface measurement. Am J Ophthalmol. 2009;147(5):788-795, 795.e1-2. [CrossRef]
- Dubbelman M, Sicam VADP, Van der Heijde GL. The shape of the anterior and posterior surface of the aging human cornea. Vision Res. 2006;46(6-7):993-1001. [CrossRef]
- Koch DD, Ali SF, Weikert MP, Shirayama M, Jenkins R, Wang L. Contribution of posterior corneal astigmatism to total corneal astigmatism. J Cataract Refract Surg. 2012;38(12):2080. [CrossRef]
- Prisant O, Hoang-Xuan T, Proano C, Hernandez E, Awad S, Azar DT. Vector summation of anterior and posterior corneal topographical astigmatism. J Cataract Refract Surg. 2002;28(9):1636. [CrossRef]
- Johnson & Johnson Vision. Tecnis Toric Calculator. Accessed January 27, 2023. https://www.tecnistoriccalc.com/.
- Shammas HJ, Yu F, Shammas MC, Jivrajka R, Hakimeh C. Predicted vs measured posterior corneal astigmatism for toric intraocular lens calculations. J Cataract Refract Surg. 2022;48(6):690-696. [CrossRef]
- Lukewich MK, Murtaza F, Somani S, Tam ES, Chiu HH. Comparison of Barrett Toric Calculations Using Measured and Predicted Posterior Corneal Astigmatism in Cataract Surgery Patients. Clin Ophthalmol Auckl NZ. 2022;16:1739-1751. [CrossRef]
- Ziemer. Galilei™ Models: Operator Manual. Revision 06. Document CM3940-0304. August 2019:26-28.
- Alpins N. Astigmatism analysis by the Alpins method. J Cataract Refract Surg. 2001;27(1):31. [CrossRef]
- Abulafia A, Koch DD, Holladay JT, Wang L, Hill W. Pursuing perfection in intraocular lens calculations: IV. Rethinking astigmatism analysis for intraocular lens-based surgery: Suggested terminology, analysis, and standards for outcome reports. J Cataract Refract Surg. 2018;44(10):1169. [CrossRef]
- Gauvin M, Wallerstein A. AstigMATIC: an automatic tool for standard astigmatism vector analysis. BMC Ophthalmol. 2018;18:255. [CrossRef]
- Rémignon CH, Levron A, Agard E, et al. Impact of Total Corneal Astigmatism Estimated With the Abulafia-Koch Formula Versus Measured With a SS-OCT Biometer on the Refractive Outcomes of a Toric Intraocular Lens in Cataract Surgery. J Refract Surg. 2023;39(3):171-179. [CrossRef]
- Ghaffari R, Abdi P, Moghaddasi A, Heidarzadeh S, Ghahvhechian H, Kasiri M. Ray Tracing versus Thin-Lens Formulas for IOL Power Calculation Using Swept-Source Optical Coherence Tomography Biometry. J Ophthalmic Vis Res. 2022;17(2):176-185. [CrossRef]
- Preußner PR. OKULIX raytracing software. In: Aramberri J, Hoffer KJ, Olsen T, Savini G, Shammas HJ, eds. Intraocular Lens Calculations. Essentials in Ophthalmology. Cham: Springer; 2024. [CrossRef]
- Wagner FM, Hoffmann P, Preußner P-R. Accuracy comparison of tomography devices for ray tracing-based intraocular lens calculation. J Cat Refract Surg 50(2): 110-115.
- Muzyka-Woźniak M, Oleszko A, Grzybowski A. Measurements of Anterior and Posterior Corneal Curvatures with OCT and Scheimpflug Biometers in Patients with Low Total Corneal Astigmatism. J Clin Med. 2022;11(23):6921. [CrossRef]
- Lu W, Li Y, Savini G, et al. Comparison of anterior segment measurements obtained using a swept-source optical coherence tomography biometer and a Scheimpflug–Placido tomographer. J Cataract Refract Surg. 2019;45(3):298. [CrossRef]
- Jin A, Han X, Zhang J, et al. Agreement of Total Keratometry and Posterior Keratometry Among IOLMaster 700, CASIA2, and Pentacam. Transl Vis Sci Technol. 2023;12(3):13. [CrossRef]
- Goggin M, Zamora-Alejo K, Esterman A, van Zyl L. Adjustment of anterior corneal astigmatism values to incorporate the likely effect of posterior corneal curvature for toric intraocular lens calculation. J Refract Surg. Thorofare NJ 1995. 2015;31(2):98-102. [CrossRef]
- Koch DD, Jenkins RB, Weikert MP, Yeu E, Wang L. Correcting astigmatism with toric intraocular lenses: Effect of posterior corneal astigmatism. J Cataract Refract Surg. 2013;39(12):1803. [CrossRef]
- Tonn B, Klaproth OK, Kohnen T. Anterior surface-based keratometry compared with Scheimpflug tomography-based total corneal astigmatism. Invest Ophthalmol Vis Sci. 2014;56(1):291-298. [CrossRef]
- Savini G, Næser K. An Analysis of the Factors Influencing the Residual Refractive Astigmatism After Cataract Surgery With Toric Intraocular Lenses. Invest Ophthalmol Vis Sci. 2015;56(2):827-835. [CrossRef]
- Jiang Y, Tang Y, Jing Q, Qian D, Lu Y. Distribution of posterior corneal astigmatism and aberration before cataract surgery in Chinese patients. Eye Lond Engl. 2018;32(12):1831-1838. [CrossRef]
Figure 1.
Pre and Post Operative Visual Acuity Distribution. Postoperative acuity outcomes show a marked improvement compared to baseline, with the majority of patients achieving functional vision (≥20/40). CDVA = Corrected distance visual acuity, UDVA = Uncorrected distance visual acuity, VA = Visual acuity.
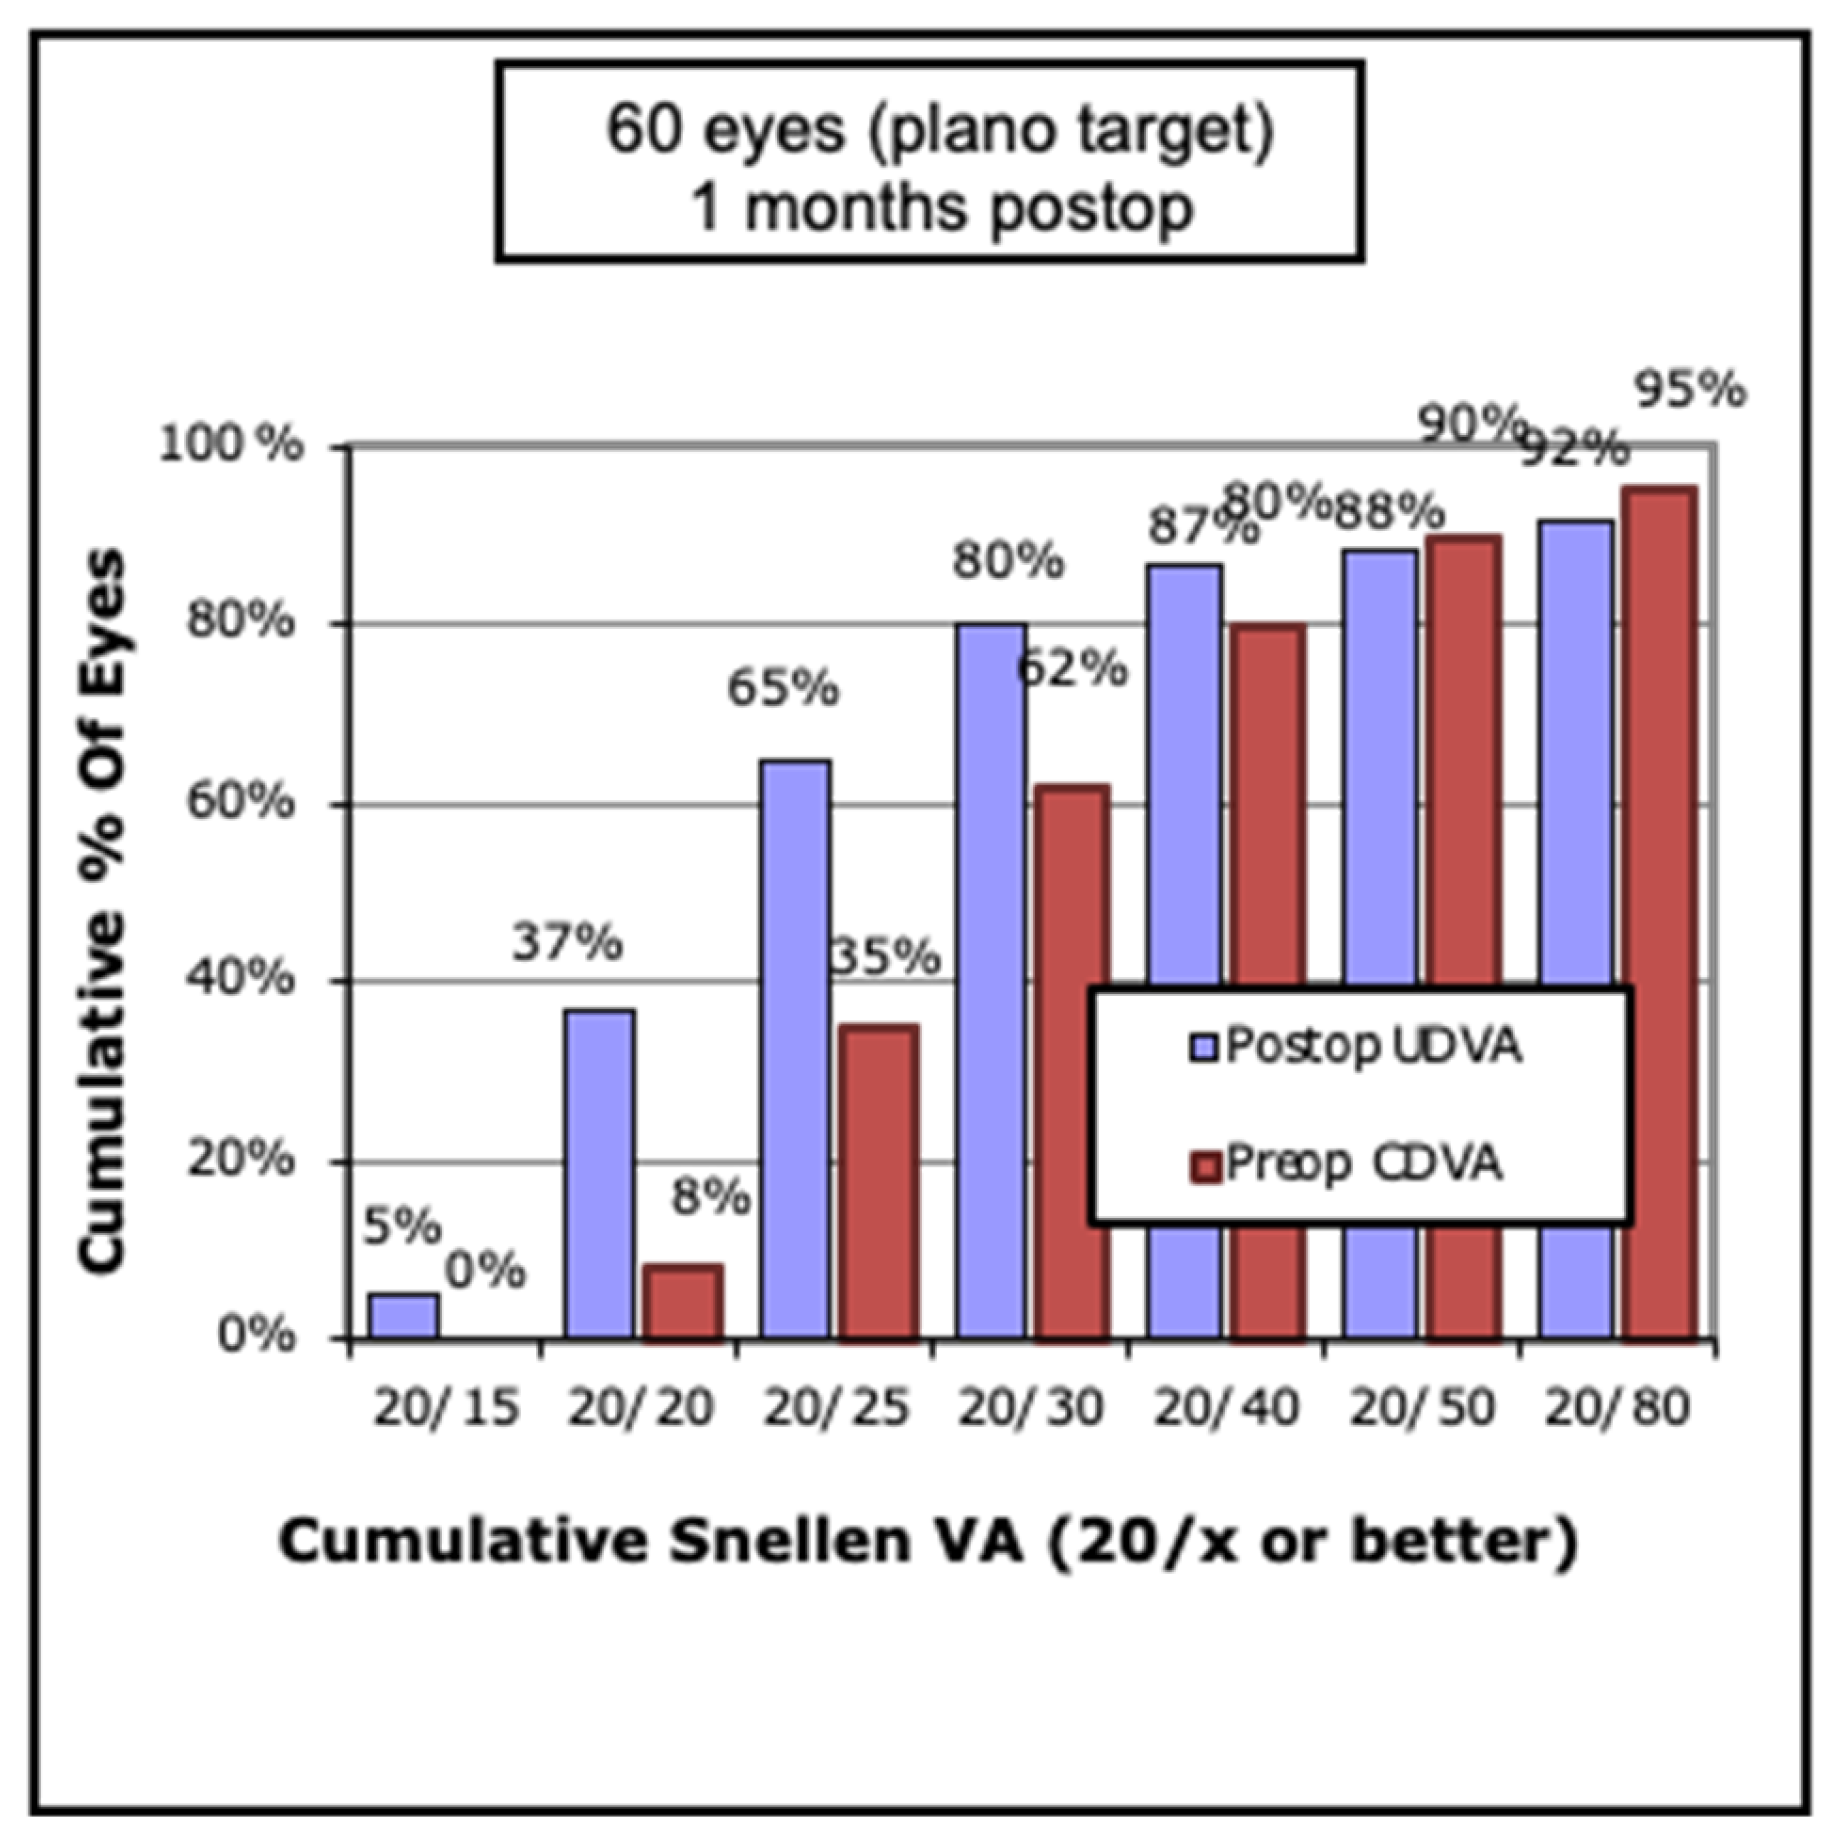
Figure 2.
Pre and Post-operative Refractive Astigmatism. Magnitude of refractive astigmatism decreased significantly following surgery, indicating effective correction of corneal cylinder across the study population. D = Diopter.
Figure 2.
Pre and Post-operative Refractive Astigmatism. Magnitude of refractive astigmatism decreased significantly following surgery, indicating effective correction of corneal cylinder across the study population. D = Diopter.
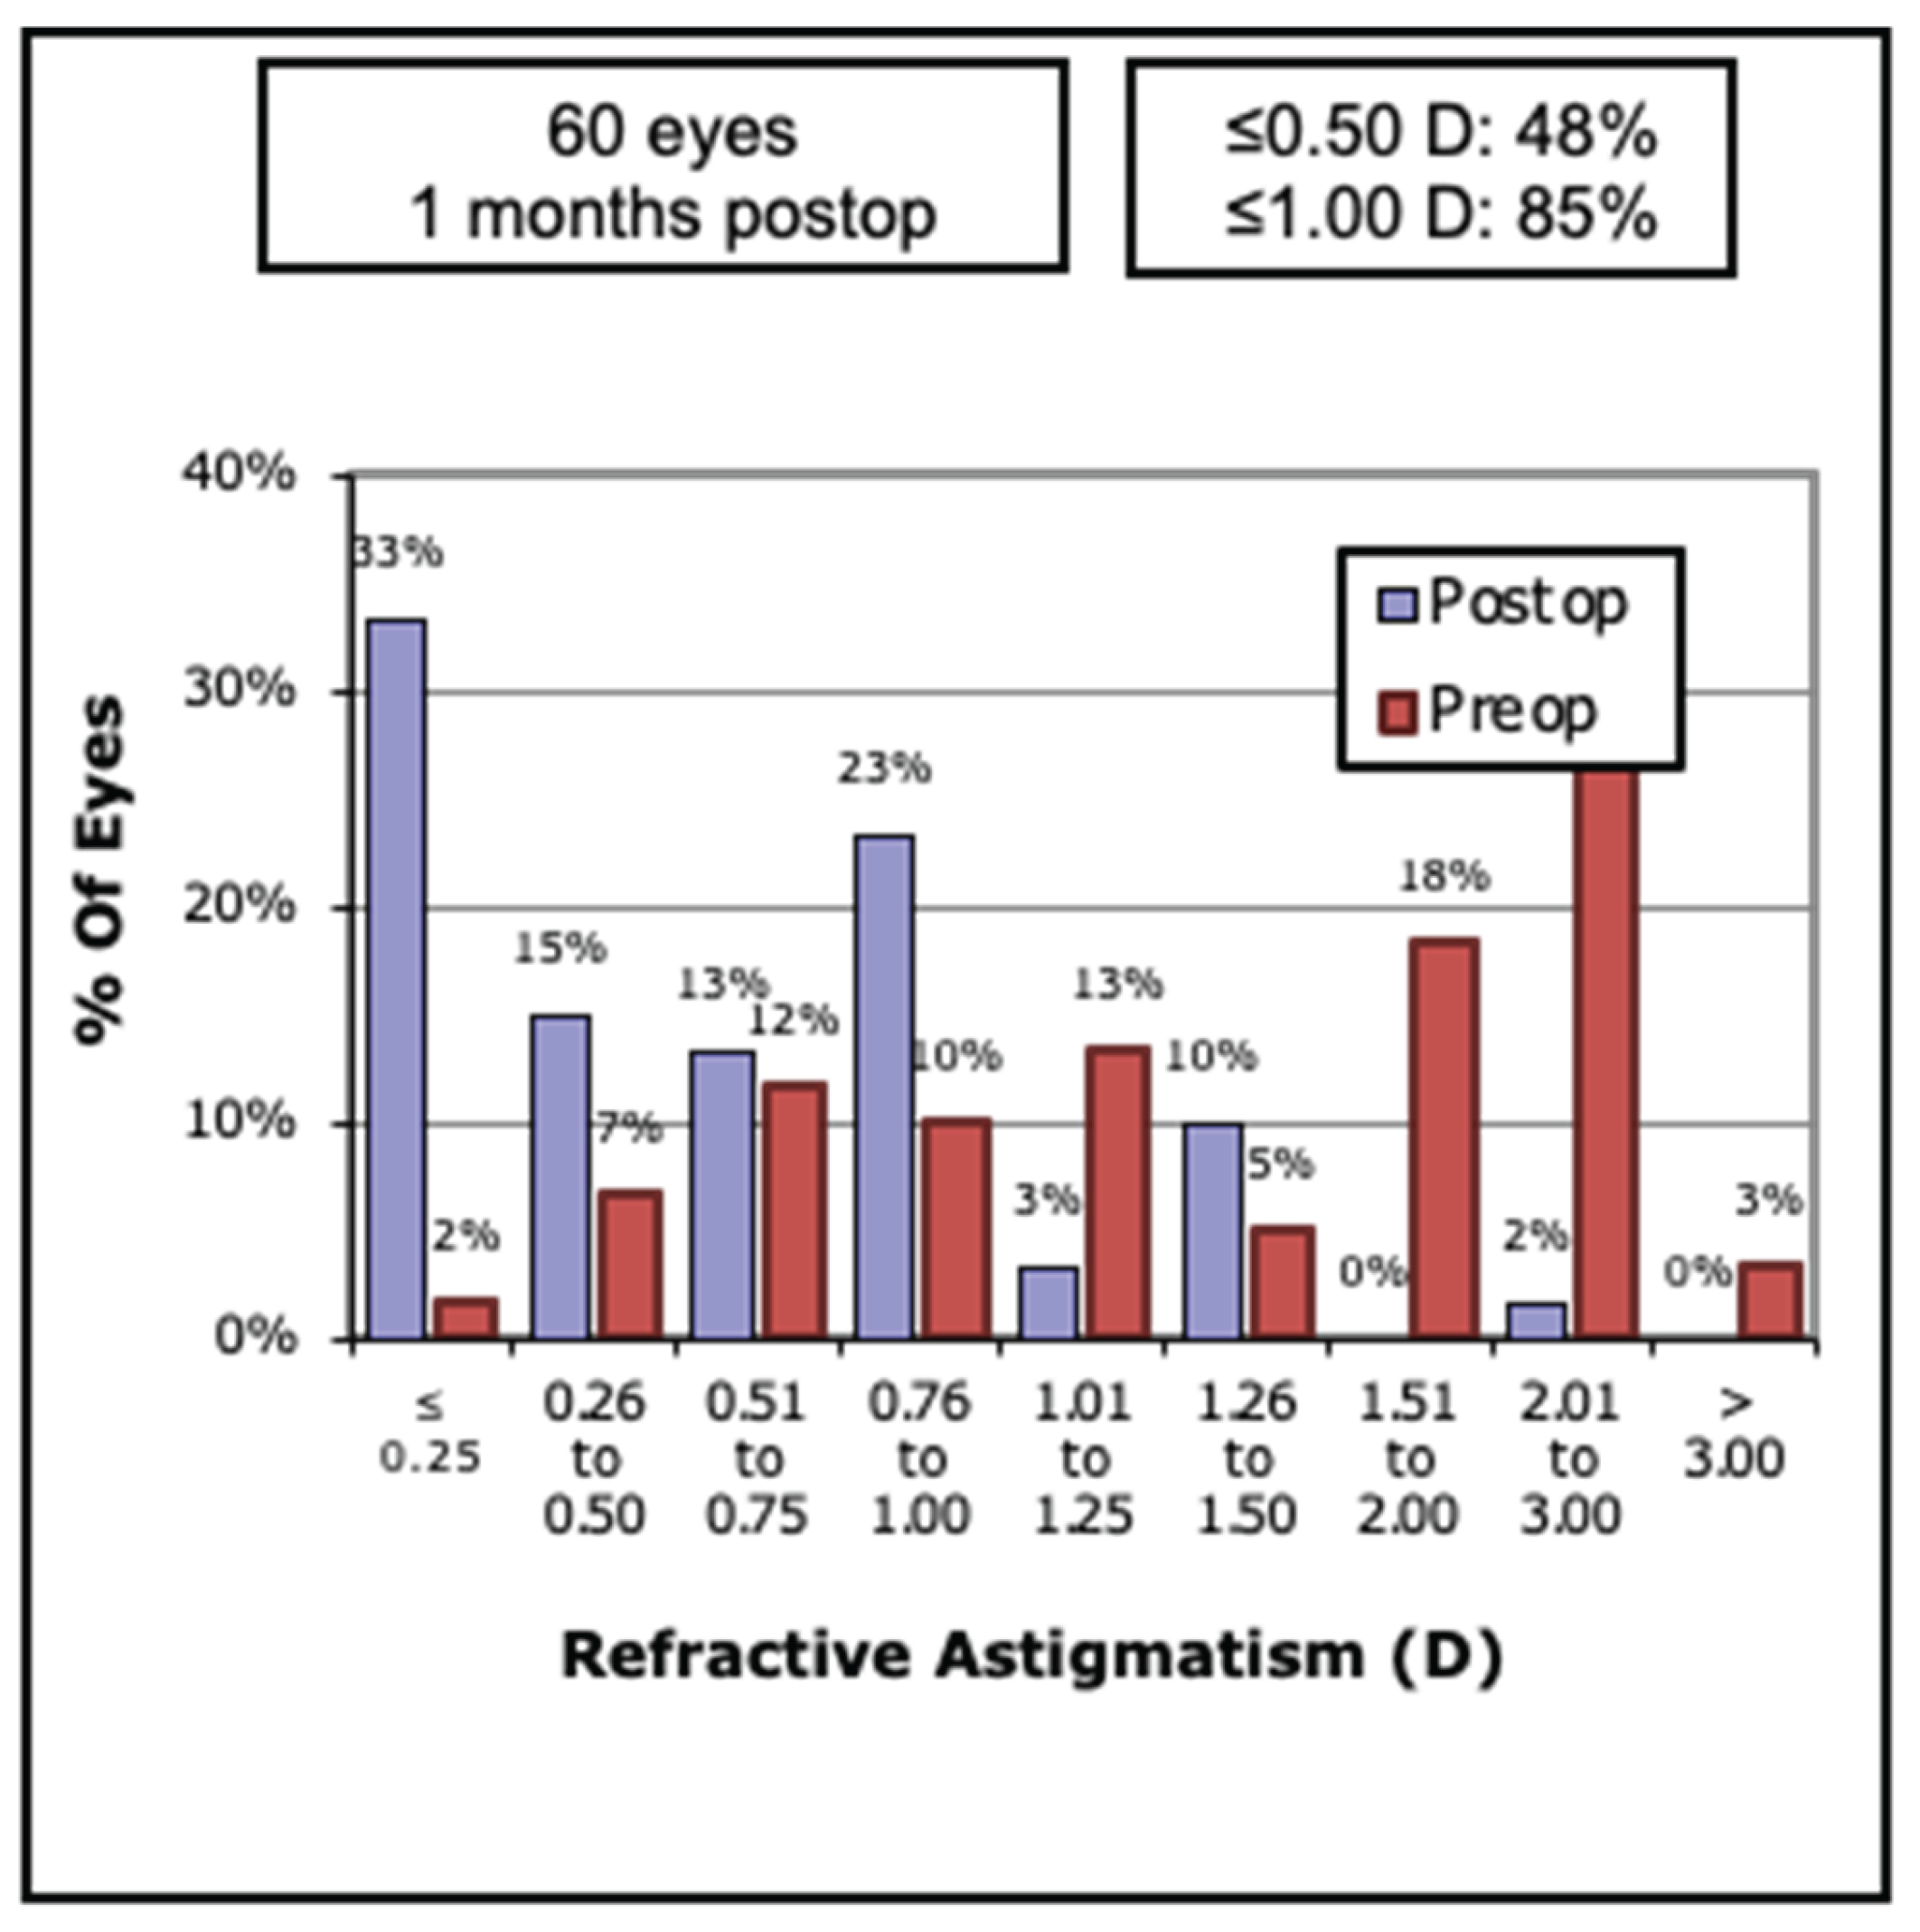
Figure 3.
Target-induced astigmatism for all patients (n=54). Target-induced astigmatism vectors reveal consistent induction patterns across patients, reflecting planned astigmatic correction by the surgical technique and IOL orientation. Target-induced astigmatism is the astigmatic change that was intended. Ax = Axis, Arith. = Arithmetic, D = Diopter, SD = Standard deviation, +ve cyl = Positive cylinder.
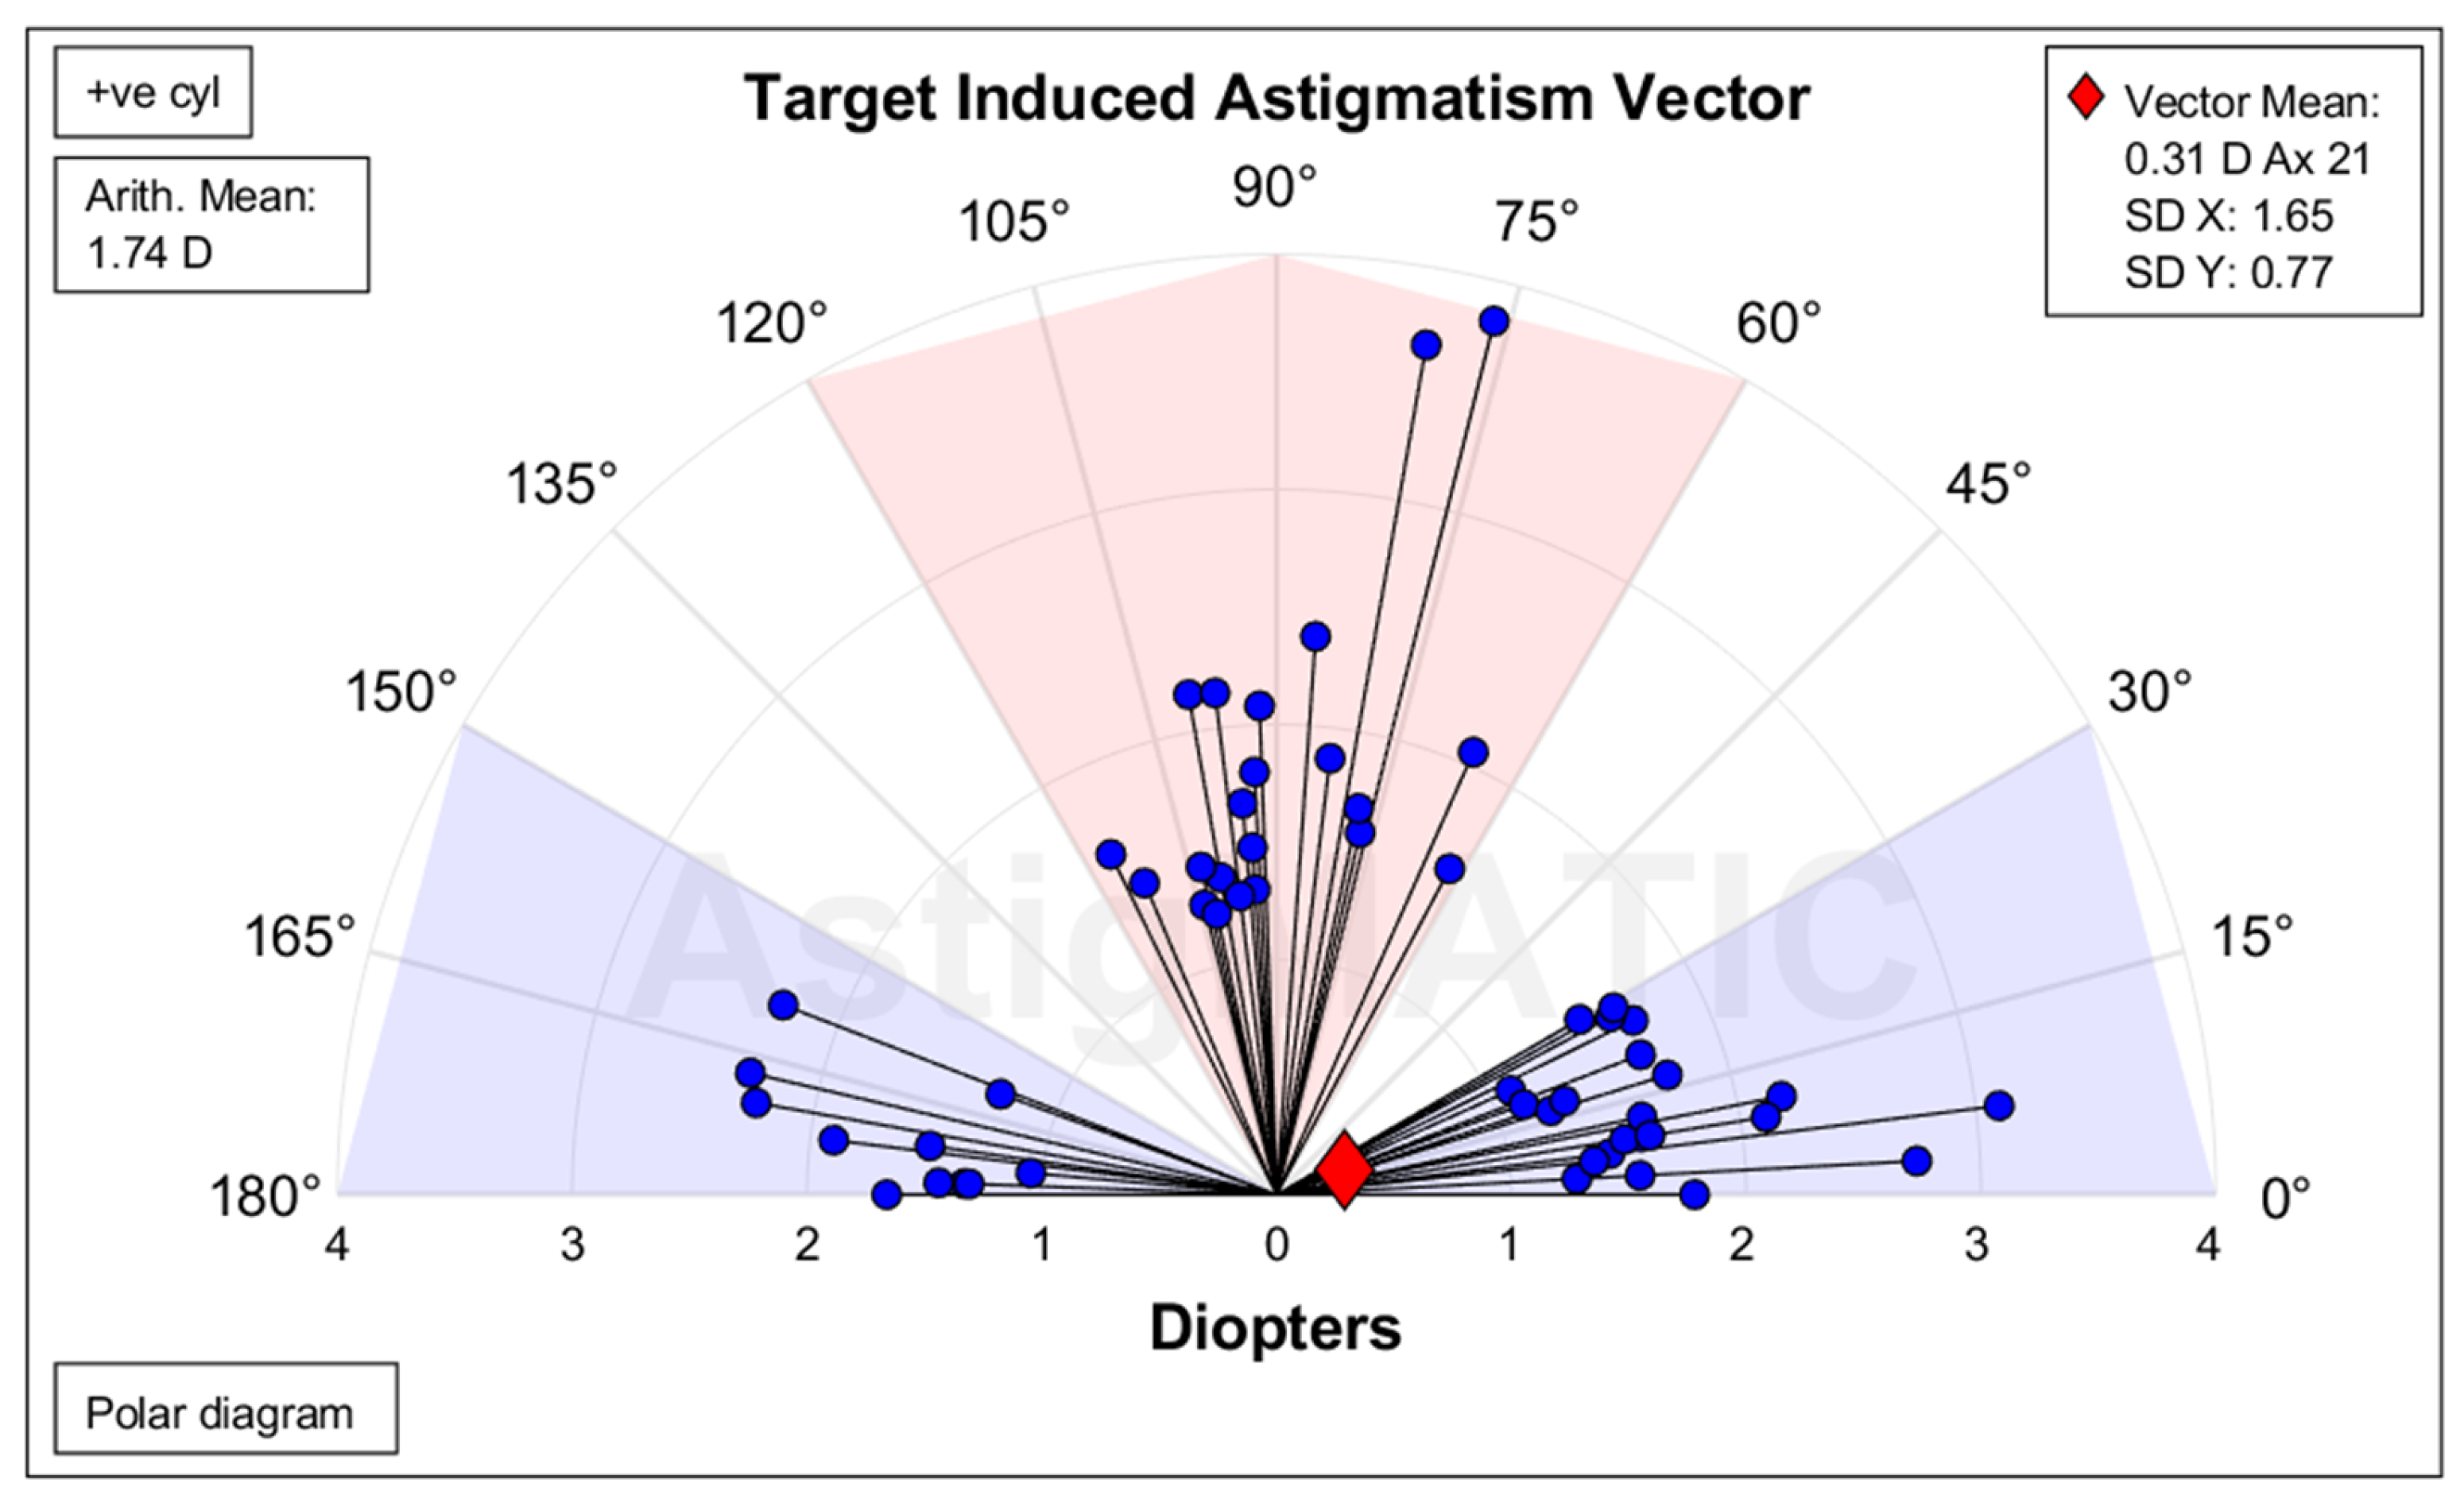
Figure 4.
Difference vector for all patients (n=54). Residual astigmatism vectors cluster near the origin, indicating low residual refractive error and confirming accuracy of toric IOL alignment and power selection. Difference vector is the change in astigmatism that would allow achievement of initial target-induced astigmatism. Ax = Axis, Arith. = Arithmetic, D = Diopter, SD = Standard deviation, +ve cyl = Positive cylinder.
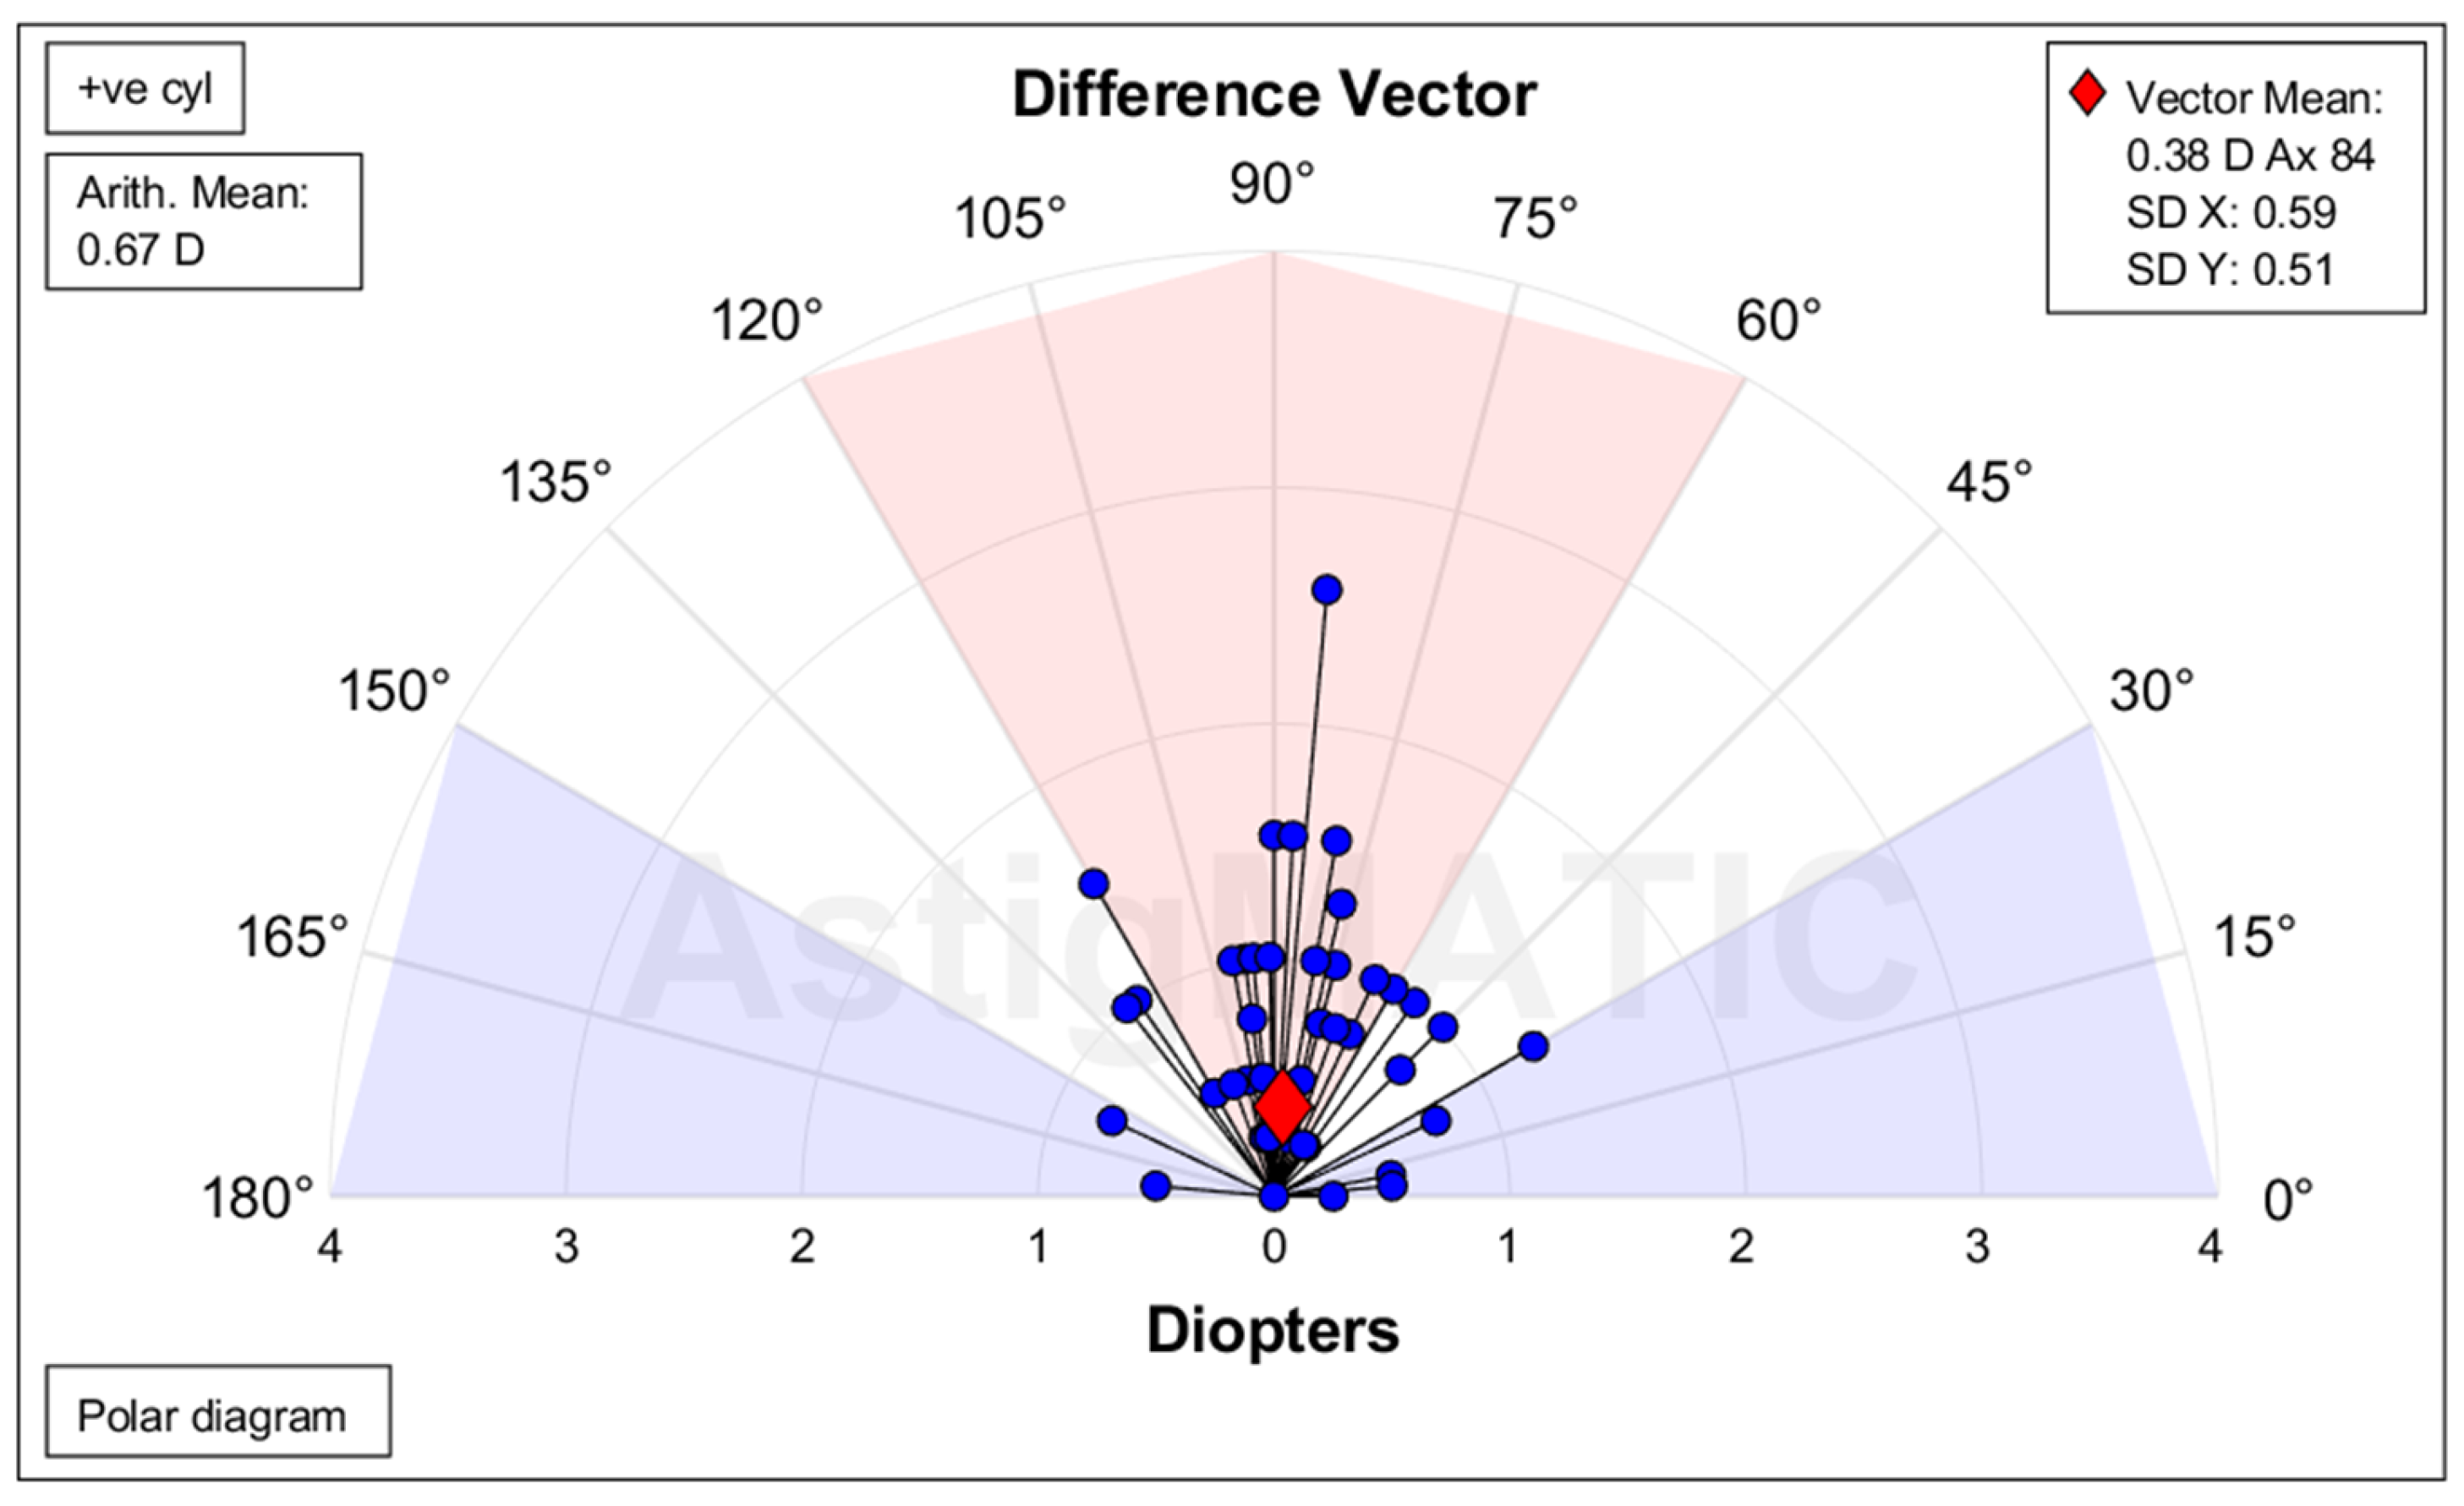
Figure 5.
Postoperative Refractive Astigmatism prediction error by calculation method. Centroid analysis of prediction error demonstrates small residual astigmatic errors across all calculation methods, with magnitudes under 0.5 D and minimal angular deviation. This confirms clinically acceptable accuracy for Barrett Toric (using measured or predicted PCA) and Tecnis Toric calculators. (A) Centroid of 0.34 D @ 19° ± 0.66 D, indicating low prediction error when posterior corneal astigmatism is directly measured. (B) Centroid of 0.34 D @ 20° ± 0.66 D, nearly identical to M PCA, supporting the reliability of posterior corneal astigmatism prediction models. (C) Centroid of 0.41 D @ 17° ± 0.67 D, slightly higher than Barrett values but still within clinically acceptable limits. Means ± SD, D = Diopter, M PCA = Measured posterior corneal astigmatism, P PCA = Predicted posterior corneal astigmatism, TCA = Total corneal astigmatism.
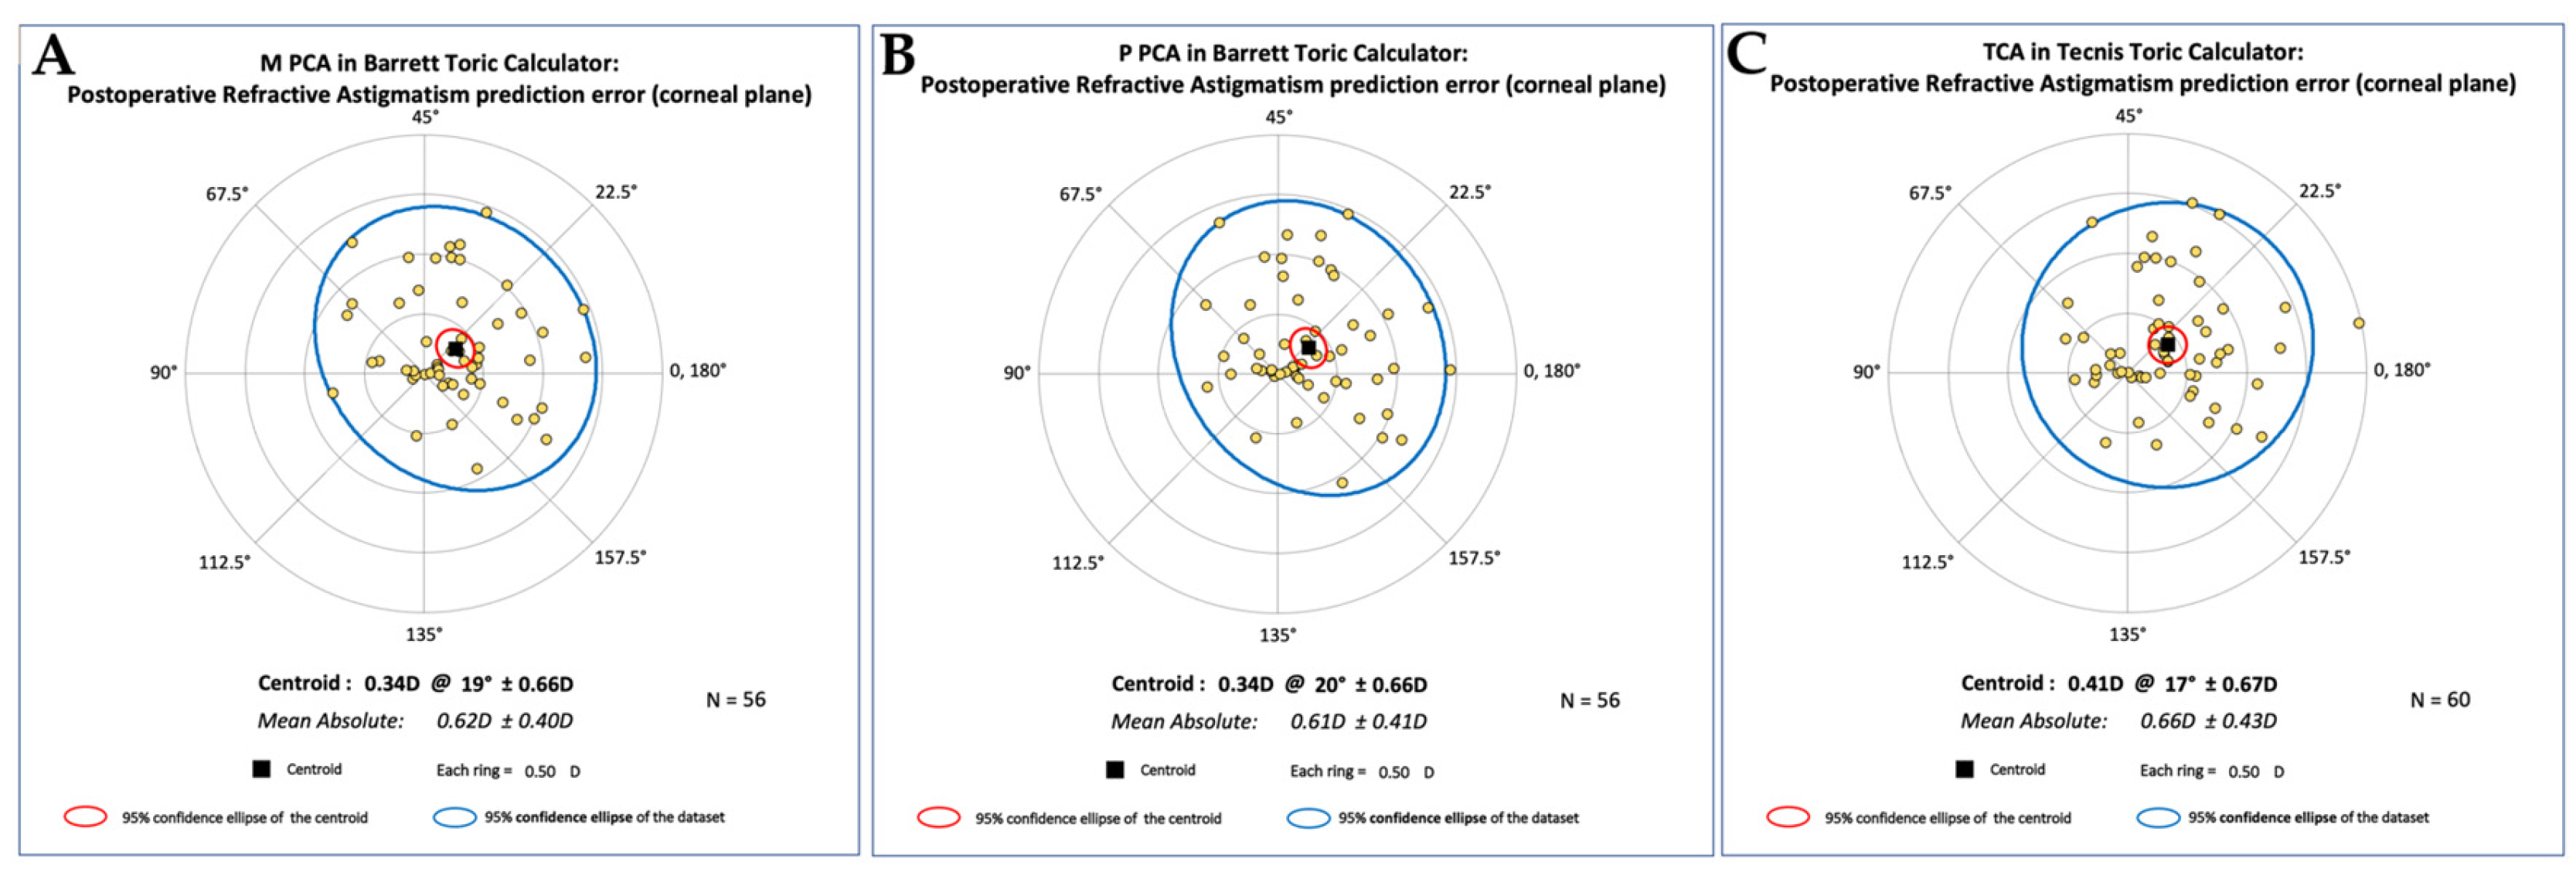

Table 1.
Pre-operative patient biometry and implanted lens powers.
| Parameter | Mean ± SD |
| Lens Spherical Power (D) | 19.62 ± 4.42 |
| Lens Toric Power (D) | 2.35 ± 0.88 |
| Haigis Predicted SE (D) | -0.22 ± 0.72 |
| Axial Length (mm) | 24.05 ± 1.22 |
| Anterior Chamber Depth (mm) | 3.22 ± 0.41 |
| IOL Master Flat K (D) | 43.21 ± 1.55 |
| IOL Master Flat Meridian (°) | 89.6 ± 52.19 |
| IOL Master Steep K (D) | 45.06 ± 1.49 |
| IOL Master Steep Meridian (°) | 95.6 ± 61.57 |
| IOL Master Posterior Flat K (D) | -5.77 ± 0.25 |
| IOL Master Posterior Flat Meridian (°) | 59.82 ± 57.17 |
| IOL Master Posterior Flat K (D) | -6.06 ± 0.27 |
| IOL Master Posterior Flat Meridian (°) | 104.82 ± 42.41 |
| TCP Flat K (D) | 41.7 ± 1.56 |
| TCP Flat Meridian (°) | 85.5 ± 50.28 |
| TCP Steep K (D) | 43.44 ± 1.52 |
| TCP Steep Meridian (°) | 97.5 ± 61.22 |
Preoperative characteristics including axial length, anterior chamber depth, keratometry, and lens powers. Means ± SD; D = Diopter, mm = Millimeter, K = Keratometry, SE = Spherical equivalent, TCP = Total corneal power by Galilei, ° = Degrees.
Table 2.
Comparison of spherical equivalent and toric powers across calculators all patients, WTR, and ATR subgroups.
Table 2.
Comparison of spherical equivalent and toric powers across calculators all patients, WTR, and ATR subgroups.
| Subgroup | Calculator | SE (D) | TP (D) | Lens Orientation (°) |
| All | Tecnis Toric | 19.62 ± 4.42§‡ | 2.35 ± 0.88§ | 114.18 ± 55.92 |
| Barrett + P PCA | 19.42 ± 4.22† | 2.60 ± 0.98†‡ | 114.17 ± 59.31 | |
| Barrett + M PCA | 19.42 ± 4.33† | 2.29 ± 0.89§ | 115.79 ± 54.89 | |
| WTR | Tecnis Toric | 17.66 ± 4.77 | 2.52 ± 1.07§‡ | 94.95 ± 13.34¥ |
| Barrett + P PCA | 17.52 ± 4.55 | 2.14 ± 0.75† | 97.54 ± 15.0¥ | |
| Barrett + M PCA | 17.55 ± 4.63 | 2.10 ± 0.73† | 98.09 ± 14.20¥ | |
| ATR | Tecnis Toric | 20.18 ± 3.55 | 2.27 ± 0.70§ | 128.91 ± 68.14¥ |
| Barrett + P PCA | 19.97 ± 3.73 | 2.98 ± 0.97†‡ | 125.68 ± 74.27¥ | |
| Barrett + M PCA | 20.03 ± 3.45 | 2.47 ± 0.98§ | 129.73 ± 69.56¥ |
Suggested mean spherical equivalent, toric powers, and lens orientation for all patients (n=54), WTR (n=22), and ATR (n=34) subgroups. † denotes statistical difference from Tecnis Toric values. § Denotes statistical difference from Barrett P PCA values. ‡ Denotes statistical difference from Barrett M PCA values. ¥ denotes a statistical difference between the corresponding WTR vs ATR value (statistical significance defined as p<0.05). Means ± SD; ATR = Against-the-rule (150° ≤ steep meridian ≤ 180° or 0° ≤ steep meridian ≤ 30°), D = Diopter, SE = Spherical equivalent, TP = Toric power, WTR = With-the-rule (60° ≤ steep meridian ≤ 120°) ° = Degrees.
Table 3.
Prediction error values for spherical equivalent and residual cylinder for all patients, WTR, and ATR subgroups.
Table 3.
Prediction error values for spherical equivalent and residual cylinder for all patients, WTR, and ATR subgroups.
| Subgroup | Calculator | Mean SE PE (D) | Mean Absolute SE PE (D) | Mean Residual Cylinder PE (D) | Mean Absolute Residual Cylinder PE (D) |
| All | Tecnis Toric | -0.22 ± 0.72‡ | 0.32 ± 0.26‡ | 0.21 ± 0.12§‡ | 0.52 ± 0.44§ |
| Barrett + P PCA | -0.17 ± 0.60 | 0.39 ± 0.46 | 0.16 ± 0.11† | 0.59 ± 0.45†‡ | |
| Barrett + M PCA | -0.17 ± 0.42† | 0.36 ± 0.28† | 0.15 ± 0.12† | 0.56 ± 0.40§ | |
| WTR | Tecnis Toric | -0.11 ± 0.43 | 0.34 ± 0.30 | 0.23 ± 0.11§‡ | 0.26 ± 0.27§‡¥ |
| Barrett + P PCA | -0.11 ± 0.41 | 0.37 ± 0.36¥ | 0.14 ± 0.10† | 0.31 ± 0.32†¥ | |
| Barrett + M PCA | -0.11 ± 0.46 | 0.37 ± 0.33 | 0.14 ± 0.12† | 0.35 ± 0.32†¥ | |
| ATR | Tecnis Toric | -0.25 ± 0.77 | 0.31 ± 0.23§ | 0.19 ± 0.12 | 0.72 ± 0.46¥ |
| Barrett + P PCA | -0.16 ± 0.61 | 0.42 ± 0.53‡¥ | 0.16 ± 0.11 | 0.75 ± 0.45¥ | |
| Barrett + M PCA | 0.00 ± 0.11 | 0.35 ± 0.24†§ | 0.17 ± 0.13 | 0.68 ± 0.37¥ |
Mean prediction errors and mean absolute prediction of the lens spherical equivalent and residual cylinder power for all patients (n=54), WTR (n=22), and ATR (n=34) subgroups. † denotes statistical difference from Tecnis toric values. § denotes statistical difference from Barrett P PCA values. ‡ denotes statistical difference from Barrett M PCA values. ¥ denotes a statistical difference between the corresponding WTR vs ATR value (statistical significance defined as p<0.05). Means ± SD; ATR = Against-the-rule (150° ≤ steep meridian ≤ 180° or 0° ≤ steep meridian ≤ 30°), D = Diopter, PE = Prediction error, SE = Spherical equivalent, WTR = With-the-rule (60° ≤ steep meridian ≤ 120°) ° = Degrees.
Table 4.
Vector Analysis for all patients (n=54), WTR (n=22), and ATR (n=34) subgroups.
| Subgroup | TIA | SIA | DV | CI | IOS | Mean Angle of Error |
| All (n=56) | 1.74 D | 2.10 D | 0.67 D | 1.17 | 0.39 | -2° |
| WTR (n=22) | 1.86 D | 1.84 D | 0.37 D | 0.96 | 0.20 | -1° |
| ATR (n=34) | 1.66 D | 2.26 D | 0.87 D | 1.32 | 0.52 | -3° |
Vector analysis demonstrated overall effective correction of astigmatism, with a slight tendency toward overcorrection (CI = 1.17) and a mean angle of error of −2°. Subgroup analysis showed more accurate outcomes in WTR eyes compared to ATR eyes, which exhibited greater residual error. This shows ATR astigmatism remains more challenging to predictably correct compared to WTR astigmatism. ATR = Against-the-rule (150° ≤ steep meridian ≤ 180° or 0° ≤ steep meridian ≤ 30°), CI = Correction index, D = Diopter, DV = Difference vector, IOS = Index of success, SIA = Surgically-induced astigmatism, TIA = Target-induced astigmatism, WTR = With-the-rule (60° ≤ steep meridian ≤ 120°) ° = Degrees.
Disclaimer/Publisher’s Note: The statements, opinions and data contained in all publications are solely those of the individual author(s) and contributor(s) and not of MDPI and/or the editor(s). MDPI and/or the editor(s) disclaim responsibility for any injury to people or property resulting from any ideas, methods, instructions or products referred to in the content. |
© 2025 by the authors. Licensee MDPI, Basel, Switzerland. This article is an open access article distributed under the terms and conditions of the Creative Commons Attribution (CC BY) license (http://creativecommons.org/licenses/by/4.0/).
Copyright: This open access article is published under a Creative Commons CC BY 4.0 license, which permit the free download, distribution, and reuse, provided that the author and preprint are cited in any reuse.


