Plain Language Summary
Most U.S. hospitals operate under a fee-for-service payment model, in which increased service delivery results in higher revenue. This structure can elevate costs and contribute to revenue instability. In contrast, since 2014, Maryland has implemented global budgets, establishing a fixed annual hospital revenue target across all payers.
This study compared hospitals in Maryland and Massachusetts from 2010 to 2023 using Medicare cost-report financial data. The analysis focused on hospital profit margins, revenue per inpatient discharge (as a proxy for revenue intensity), and the extent of margin fluctuations during the COVID-19 period.
Following the adoption of global budgets in Maryland, hospital revenue per discharge increased more in Maryland than in Massachusetts, while hospital margins did not exhibit a statistically significant change. There was also no strong evidence that Maryland hospitals experienced less margin volatility during COVID-19 compared to Massachusetts hospitals. Overall, these results suggest that global budgets may alter the mechanisms by which hospitals generate revenue per case without producing substantial, detectable changes in profitability or financial stability during the pandemic period.
2. Introduction
2.1. Problem Framing
Hospital financial sustainability is a persistent U.S. policy concern because hospitals anchor access, emergency readiness, and local system capacity. Under fee-for-service (FFS) payment, hospital revenue is strongly linked to service volume, which can create incentives for higher throughput and expose providers to financial risk when utilization falls sharply. The COVID-19 pandemic served as a clear stress test: multiple studies documented substantial financial threats and heterogeneous resilience across hospital types during COVID-related caseload disruption and elective-procedure cancellations, reinforcing concerns about the fragility of volume-dependent revenue models during shocks. [
1,
2]
Prospective revenue models are therefore attractive to policymakers because they can reduce revenue dependence on short-run volume and make hospital finances more predictable. However, prospective payment does not guarantee improved profitability or lower unit prices. Hospitals may respond to new constraints by changing service mix, coding, or revenue strategies in ways that preserve margins while altering revenue intensity (e.g., revenue per discharge). For this reason, evaluating reforms using financial outcomes—including profitability (margins), revenue per discharge (unit revenue intensity), and volatility under shocks—is policy-relevant for at least three reasons: (i) provider viability and service continuity, (ii) incentives that may affect utilization and spending growth, and (iii) resilience during system-wide disruptions.
2.2. Policy Context
Maryland’s All-Payer Model is the most developed U.S. example of statewide hospital rate regulation combined with global budgeting. Under a waiver from the Centers for Medicare & Medicaid Services (CMS), Maryland implemented all-payer global hospital budgets beginning in 2014, with hospital revenue regulated by the Health Services Cost Review Commission (HSCRC). [
3,
4] Policy descriptions emphasize restraining revenue growth while supporting predictable financing and linking accountability to performance goals. [
3,
4]
Peer-reviewed evaluations of Maryland’s early global budget period have largely focused on Medicare cost and utilization and report impacts consistent with cost containment in the early years of implementation. [
5] Complementary qualitative evidence from health system leaders highlights that global budgets can stabilize revenue and planning while introducing administrative and operational challenges. [
6] More recently, Maryland expanded accountability beyond inpatient care through Total Cost of Care (TCOC) initiatives and has continued to serve as a reference point for newer population-based payment demonstrations. [
7,
8]
2.3. Research Gap
This study addresses three gaps:
Long-horizon, cross-state evidence on hospital financial outcomes remains limited. Many Maryland evaluations emphasize utilization and spending—often Medicare-centric—or cover earlier phases of implementation, leaving less clarity on hospital financial outcomes through 2023 with a clear counterfactual state. [
5,
10]
Post-implementation dynamics need validation beyond a single average DiD estimate. Best-practice methods warn that static pre/post estimates may mislead when effects evolve over time or when pre-trends differ; event-study and falsification (placebo) tests strengthen credibility. [
11,
12,
13]
Shock-period stability is under-tested in comparative frameworks. COVID-era evidence documents substantial financial stress and heterogeneous resilience, but fewer studies test whether regulated prospective revenue systems measurably dampen margin volatility relative to a comparator state. [
1,
2]
2.4. Research Questions and Hypotheses
Using a matched hospital-year panel spanning 2010–2023 and comparing Maryland and Massachusetts hospitals, this study evaluates whether Maryland’s 2014 implementation of global budget revenue (GBR) is associated with changes in hospital financial outcomes relative to Massachusetts. The analytic file is based on RAND’s HCRIS-derived hospital cost report panel, with hospital identifiers harmonized to support longitudinal analysis. [
14]
The study examines three outcomes aligned with the current models: (i) total margin (profitability), (ii) log inpatient revenue per discharge (proxy for revenue intensity per inpatient stay), and (iii) volatility, defined as the absolute year-over-year change in total margin, with a COVID-period focus (2020–2022).
Research Questions
RQ1 (Margins): Did Maryland’s GBR change total hospital margins relative to Massachusetts after 2014?
RQ2 (Revenue per discharge): Did Maryland’s GBR change log revenue per discharge relative to Massachusetts after 2014?
RQ3 (Volatility/COVID): Did Maryland’s GBR change margin volatility during COVID-19 (2020–2022) relative to Massachusetts?
Hypotheses
H1: GBR increased revenue per discharge post-2014 (expected positive MD×post-2014 differential in log revenue per discharge).
H2: GBR did not materially change total margins post-2014 (expected statistically null MD×post-2014 differential in total margin).
H3: GBR did not materially change COVID-period margin volatility (expected statistically null MD×COVID differential in absolute year-over-year margin change).
To support identification, the analysis follows difference-in-differences best-practice guidance by using hospital and year fixed effects, clustering standard errors at the hospital level, and complementing the main estimate with an event-study specification to assess pre-trends and a placebo test using a false intervention date. [
11,
12,
13]
3. Background
3.1. Maryland GBR Mechanics (Why Revenue per Discharge Might Move)
Maryland’s All-Payer Model implemented hospital global budgets beginning in 2014, replacing a volume-driven revenue model with a prospective revenue target regulated through the HSCRC under a CMS waiver. [
3,
4] In practice, GBR changes the hospital’s problem from “maximize billable volume” to “manage within a revenue constraint while meeting quality and accountability expectations.” This shift has two direct implications for the outcomes in this paper: it can change unit revenue measures (e.g., revenue per discharge) even if it does not raise margins, and it may reduce exposure to short-run volume shocks without guaranteeing reduced volatility in accounting margins.
Why might revenue per discharge increase under a revenue cap? Several mechanisms are plausible and are consistent with the logic of prospective payment:
Intensity/service-mix responses: When overall revenue growth is constrained, hospitals have incentives to protect revenue by shifting toward higher-acuity case mix within inpatient admissions, increasing intensity of services per stay, or re-optimizing coding/documentation. These changes can increase average revenue per discharge even if aggregate revenue is regulated.
Rebalancing across settings and lines of business: GBR incentives can encourage hospitals to reduce avoidable utilization and manage volume; however, hospitals can respond by altering service composition (e.g., focusing on profitable lines within regulated constraints). This can change unit revenue measures even if total revenue is controlled.
Margins need not rise: Even if unit revenue increases, margins may remain stable if costs rise in parallel (labor, supplies, capital) or if efficiency gains offset revenue changes. Prior evaluations of Maryland’s global budgets emphasize cost/utilization outcomes and do not imply systematic margin expansion as an intended goal of GBR. [
5] Qualitative accounts similarly stress operational adaptation and administrative demands rather than windfall profitability. [
6]
These mechanisms motivate the directional expectations used in this manuscript: H1 (positive effect on revenue per discharge) is plausible under behavioral and accounting responses to prospective revenue constraints, while H2 (null effect on margins) is plausible if cost dynamics and regulatory design prevent systematic profit expansion. [
3,
4,
5,
6]
3.2. Why Massachusetts Is a Defensible Comparator
A credible comparator should (i) share broad structural features that affect hospital finance trends and (ii) lack the treated policy mechanism. Massachusetts offers a valuable comparison for Maryland because both states are high-income U.S. jurisdictions with advanced hospital systems, high insurance coverage rates, and mature sectors featuring large integrated delivery systems and academic medical centers. [
15] Both are embedded in a similar macro-regional and national financing environment, including exposure to the same federal policies, economic cycles, and shocks (e.g., macroeconomic trends, ACA expansions, and COVID-era disruptions). This comparability strengthens identification, as the main estimand in this study is the differential change in outcomes for Maryland hospitals after 2014 relative to a non-GBR state facing parallel external pressures.
Crucially, Massachusetts does not operate a statewide, all-payer global budget revenue (GBR) system analogous to Maryland’s HSCRC-regulated model. Instead, Massachusetts largely retains fee-for-service (FFS) payments and emphasizes transparency, cost-growth benchmarks, and voluntary cost-control initiatives through payer/provider contracting rather than mandatory rate-setting. Massachusetts also represents a useful policy counterpoint: it is often described as “reform-oriented,” with experience in global payment approaches (e.g., ACO contracts) that can affect spending and quality under certain designs, but these differ fundamentally from Maryland’s statewide all-payer regulation. As a result, Massachusetts serves as a pragmatic benchmark, a high-capacity, reform-active environment without Maryland’s distinctive all-payer GBR infrastructure. [
9] The contrast between Maryland’s rate-regulated, all-payer system and Massachusetts’s benchmark-driven, market-based approach creates a natural setting for examining whether global budgeting is associated with distinct trajectories in hospital margins and prices.
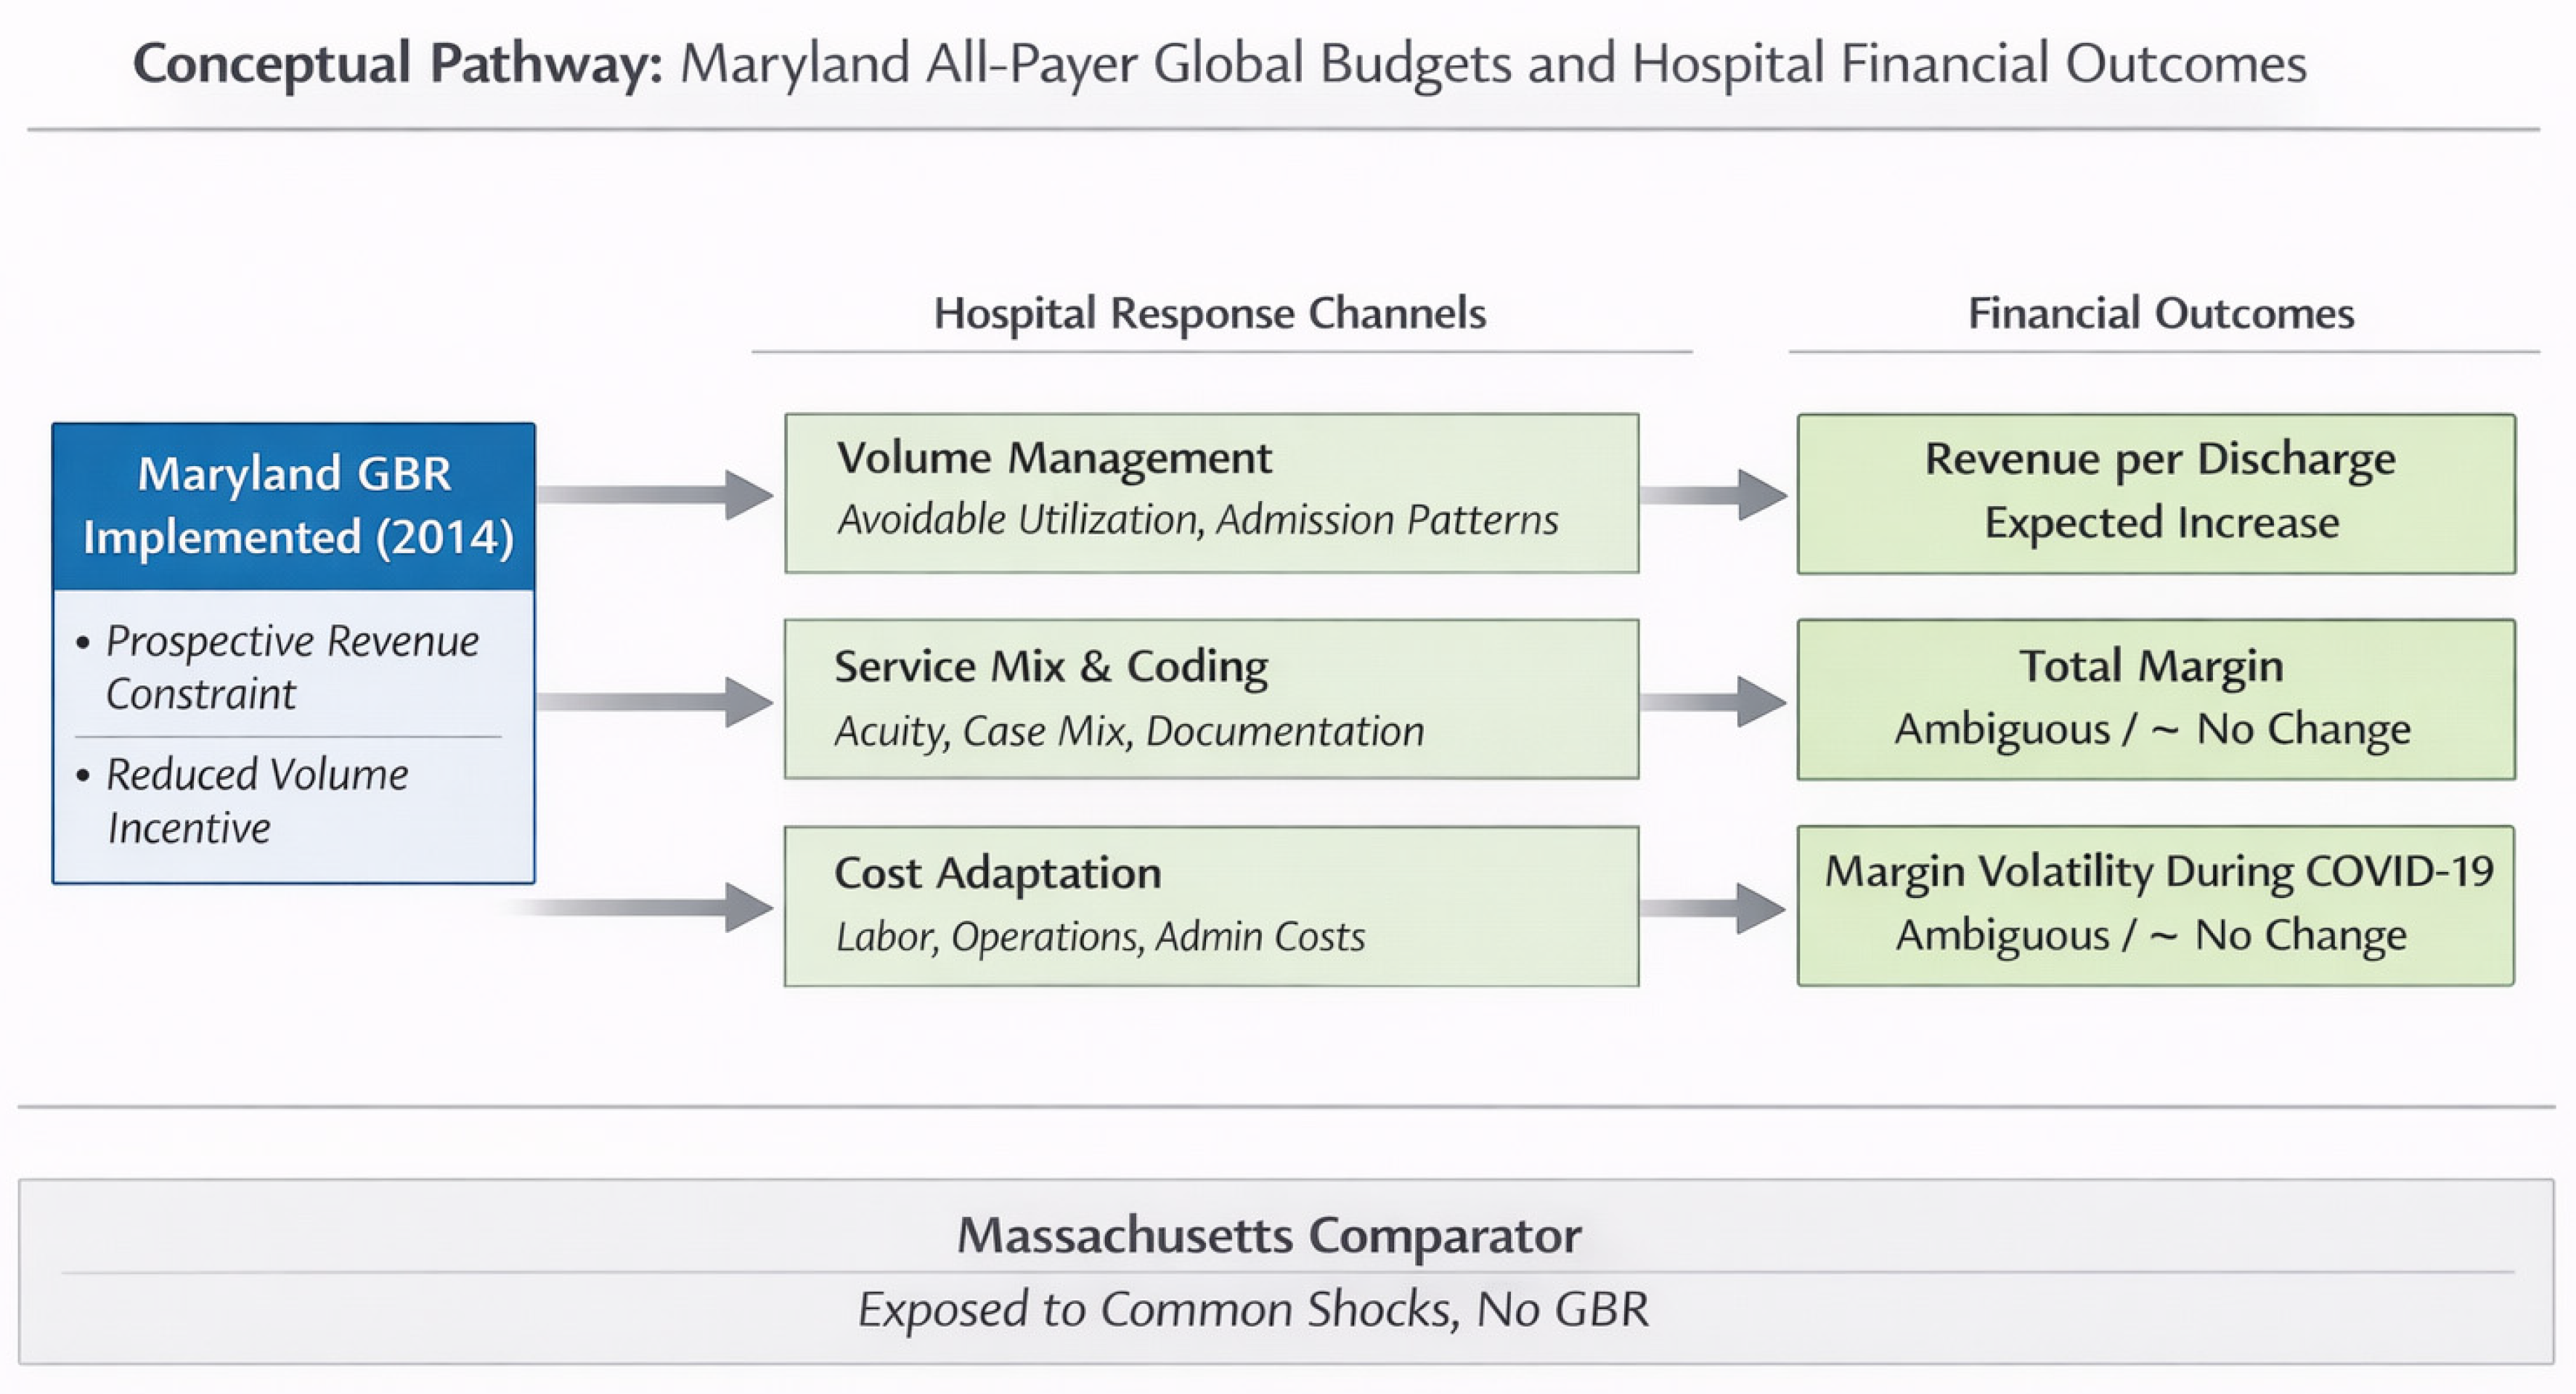
3.3. Conceptual Pathways
Figure 1 summarizes the conceptual channels through which GBR could affect unit revenue (revenue per discharge), margins, and margin volatility relative to a non-GBR comparator.
This justifies why the empirical strategy focuses on (i) unit revenue intensity (log revenue per discharge) as the most policy-responsive financial outcome under GBR (H1), while (ii) margins and volatility are theoretically ambiguous and empirically expected to be smaller or null in a mature regulated environment (H2–H3). [
3,
4,
5,
6]
4. Methods: Data and Study Design
4.1. Data Construction and Analytic Sample
This study used a comparative interrupted-panel design implemented as a two-way fixed-effects difference-in-differences (DiD) analysis. Hospital financial outcomes were obtained from RAND Hospital Cost Report Information System (HCRIS)- derived files, which standardize Medicare hospital cost-report items into longitudinal analytic variables suitable for hospital finance research. [
14] Time-varying provider characteristics were obtained from the Centers for Medicare & Medicaid Services (CMS) Provider of Services (POS) File—Hospital & Non-Hospital Facilities, which includes certification and facility characteristics keyed to CMS Certification Number (CCN). [
16] The analytic panel was created by merging the RAND hospital-year file and the POS file at the CCN × fiscal-year level using a 1:1 matched-only merge by CCN and fiscal year (retaining only matched observations), yielding 2,261 matched hospital-year observations spanning fiscal years 2010–2023. The resulting panel is unbalanced. A hospital panel identifier (hid) was constructed from the CCN where needed, and the volatility outcome (absolute year-over-year change in total margin for consecutive fiscal years) was derived from the merged hospital-year series for COVID-period analyses.
The treatment contrast was defined by Maryland’s 2014 statewide all-payer global budget implementation, modeled as an indicator for MD × post-2014. Identification was assessed using a dynamic event-study specification and a placebo falsification test (a 2012 “fake treatment,” estimated on the pre-period only). To evaluate financial stability under pandemic shock, a COVID-period differential model examined whether Maryland experienced changes in margin volatility, defined as the absolute year-over-year change in total margin during 2020–2022, relative to Massachusetts. [
11,
12,
13] All inferential models used hospital-clustered standard errors to account for within-hospital serial correlation and heteroskedasticity, consistent with recommended practice for DiD applications. [
11]
4.2. Outcomes and Variable Definitions
Three outcomes were prespecified to align with the study questions on level effects (margins; revenue per discharge) and stability during the COVID period.
(i) Total margin (profitability).
Total margin was measured using RAND’s standardized cost-report variable
Totalmargin (total margin; net income divided by total revenue). This outcome is a standard measure in hospital finance research, used to summarize profitability and financial viability. Because total margin can exhibit heavy tails due to accounting anomalies, extraordinary items, and reporting outliers in cost reports, sensitivity analyses were designed to assess the robustness of the conclusions to winsorization strategies (described below). [
14]
(ii) Log inpatient revenue per discharge (price proxy / unit revenue).
The primary “price proxy” was the natural log of inpatient revenue per discharge (ln_price_per_discharge), operationalized as inpatient revenue divided by inpatient discharges, then log-transformed. This measure is interpreted as a unit-revenue metric, capturing changes in revenue intensity per inpatient stay. It does not isolate transaction prices at the service-line level but is widely used as a tractable proxy in cost report–based analyses when payer-specific prices are unavailable. [
14]
(iii) Margin volatility (stability), including the COVID stress-test.
Volatility was defined as the absolute 1-year change in total margin for consecutive-year observations:
constructed only when hospital
i reported total margin in both year
t and
t−1, and years were consecutive. This design intentionally measures short-run instability rather than long-run trend shifts. To assess whether global budgets functioned as a “shock absorber” during the pandemic—an empirically important stress test for volume-sensitive payment systems—an indicator for the COVID period (2020–2022) was used to estimate a Maryland differential in volatility during COVID relative to Massachusetts. [
1,
2]
Outcome availability differed by measure due to missing cost report items and the consecutive-year requirement for volatility. Therefore, descriptive tables report state-specific non-missing counts for each outcome (rather than reusing the full merged N), and all regressions were estimated on the maximal non-missing sample for the dependent variable under study.
4.3. Identification Strategy: Comparative Interrupted Panel (DiD with Fixed Effects)
The primary causal estimand was the average differential change in Maryland hospital outcomes after implementation of statewide all-payer global budgets in 2014, relative to contemporaneous changes in Massachusetts.
Policy break (treatment timing).
Maryland’s all-payer global budget model began in 2014, motivating the pre/post definition used in the main DiD specification. [
3,
4] The treatment indicator was defined at the state level (Maryland vs Massachusetts), and the post-policy indicator was defined as fiscal year ≥ 2014. The interaction term (
MD × Post2014) captured the DiD effect.
Main DiD model.
For hospital
i in year
t, the core specification was:
where
are hospital fixed effects and
are year fixed effects. The fixed effects absorb all time-invariant differences between hospitals (e.g., baseline teaching status, persistent market position) and all common shocks by year (e.g., national policy, macroeconomic conditions, pandemic-era national changes). [
11,
12] The coefficient
is interpreted as the average post-2014 differential change in Maryland relative to Massachusetts, net of hospital-invariant and year-common confounding.
This framework aligns with best-practice guidance emphasizing (i) a clearly defined intervention time, (ii) appropriate fixed effects, and (iii) cluster-robust inference at the unit of treatment assignment (hospital). [
11,
12]
Interrupted-panel framing.
Although DiD terminology is used throughout, the design also reflects an interrupted-panel logic: Maryland experienced a clear statewide policy break, and Massachusetts provides the counterfactual trajectory absent all-payer global budgets. This framing is particularly appropriate when the intervention occurs at the state level and hospital outcomes may evolve gradually rather than discontinuously.
4.4. Diagnostics and Validity Checks
Because DiD validity depends on the plausibility of parallel trends and on avoiding over-interpretation of a single average post indicator, diagnostics were specified as core components of the design rather than add-ons. [
11,
12,
13]
(i) Event study (pre-trends and dynamics).
An event-study specification was estimated for total margin to test for evidence of differential pre-trends and to characterize post-implementation dynamics. Following standard event-study practice, relative time indicators around 2014 were interacted with the Maryland indicator, with a pre-policy year serving as the omitted baseline. Event studies also address a key limitation of static DiD: a single post coefficient can mask dynamic adjustment and heterogeneous timing of effects. [
13] The primary diagnostic interpretation focuses on whether pre-policy relative-time coefficients are close to zero (supporting parallel trends in the pre-period) and whether post-policy coefficients show a consistent pattern.
(ii) Placebo test (fake treatment timing).
A placebo DiD was estimated using a false policy date (2012) restricted to the pre-period (through 2013). A null placebo estimate increases confidence that observed post-2014 differences are not artifacts of spurious timing or unrelated shocks affecting the two states differently prior to the true intervention window. [
11,
12]
(iii) COVID-period volatility model (stress test).
To evaluate the hypothesis that global budgets may stabilize finances during volume shocks, volatility models estimated a Maryland differential during COVID (2020–2022) using an interaction (
MD × COVID) in a fixed-effects panel. This approach directly addresses the empirical concern that fee-for-service environments may exhibit larger revenue and margin swings during major utilization shocks. [
1,
2]
(iv) Sensitivity analyses for outliers (winsorization).
Given the heavy-tailed nature of financial ratio outcomes—particularly volatility measures derived from differences—winsorized variants of the volatility outcome were estimated (e.g., trimming at extreme percentiles) to ensure that inference was not driven by a small number of extreme observations. This is a pragmatic robustness step in cost report–based finance analyses where outliers can reflect reporting anomalies rather than true economic variation. [
14]
Summary of hypothesis testing alignment.
The analytic structure mapped directly onto the research questions and hypotheses. The main DiD models addressed RQ1 (margins) and RQ2 (log revenue per discharge) via the MD×Post2014 interaction. The COVID volatility model addressed RQ3 via the MD×COVID interaction. Event-study and placebo analyses served as identification checks supporting the credibility of the DiD interpretation.11–13
New dataset documentation note.
The POS file used for the merge is updated quarterly and is explicitly described as providing certification, ownership, location, and related provider characteristics organized by CMS Certification Number; a new POS file covering additional facility types was introduced beginning Q4 2023, and the dataset metadata was updated in January 2026. [
16]
Software.
Statistical analyses were conducted in Stata/SE 18 (StataCorp LLC, College Station, TX) using two-way fixed-effects panel regressions with hospital-clustered standard errors. Output tables and figures were generated using Stata add-on packages (estout/esttab, coefplot).
5. Results
5.1. Descriptive Statistics and Trends (Table 1; Figure 1 and Figure 2)
Table 1 describes the merged analytic panel of hospitals in Maryland and Massachusetts from 2010–2023 (2,261 matched hospital-year observations). Massachusetts contributes 1,431 hospital-years (63.3%) and Maryland 830 (36.7%). Outcome availability varies by measure: total margin is observed in 1,995 hospital-years (MA: 1,263; MD: 732), ln(revenue per discharge) in 2,044 hospital-years (MA: 1,301; MD: 743), and the volatility outcome—absolute one-year change in total margin for consecutive years—in 1,833 hospital-years (MA: 1,161; MD: 672)
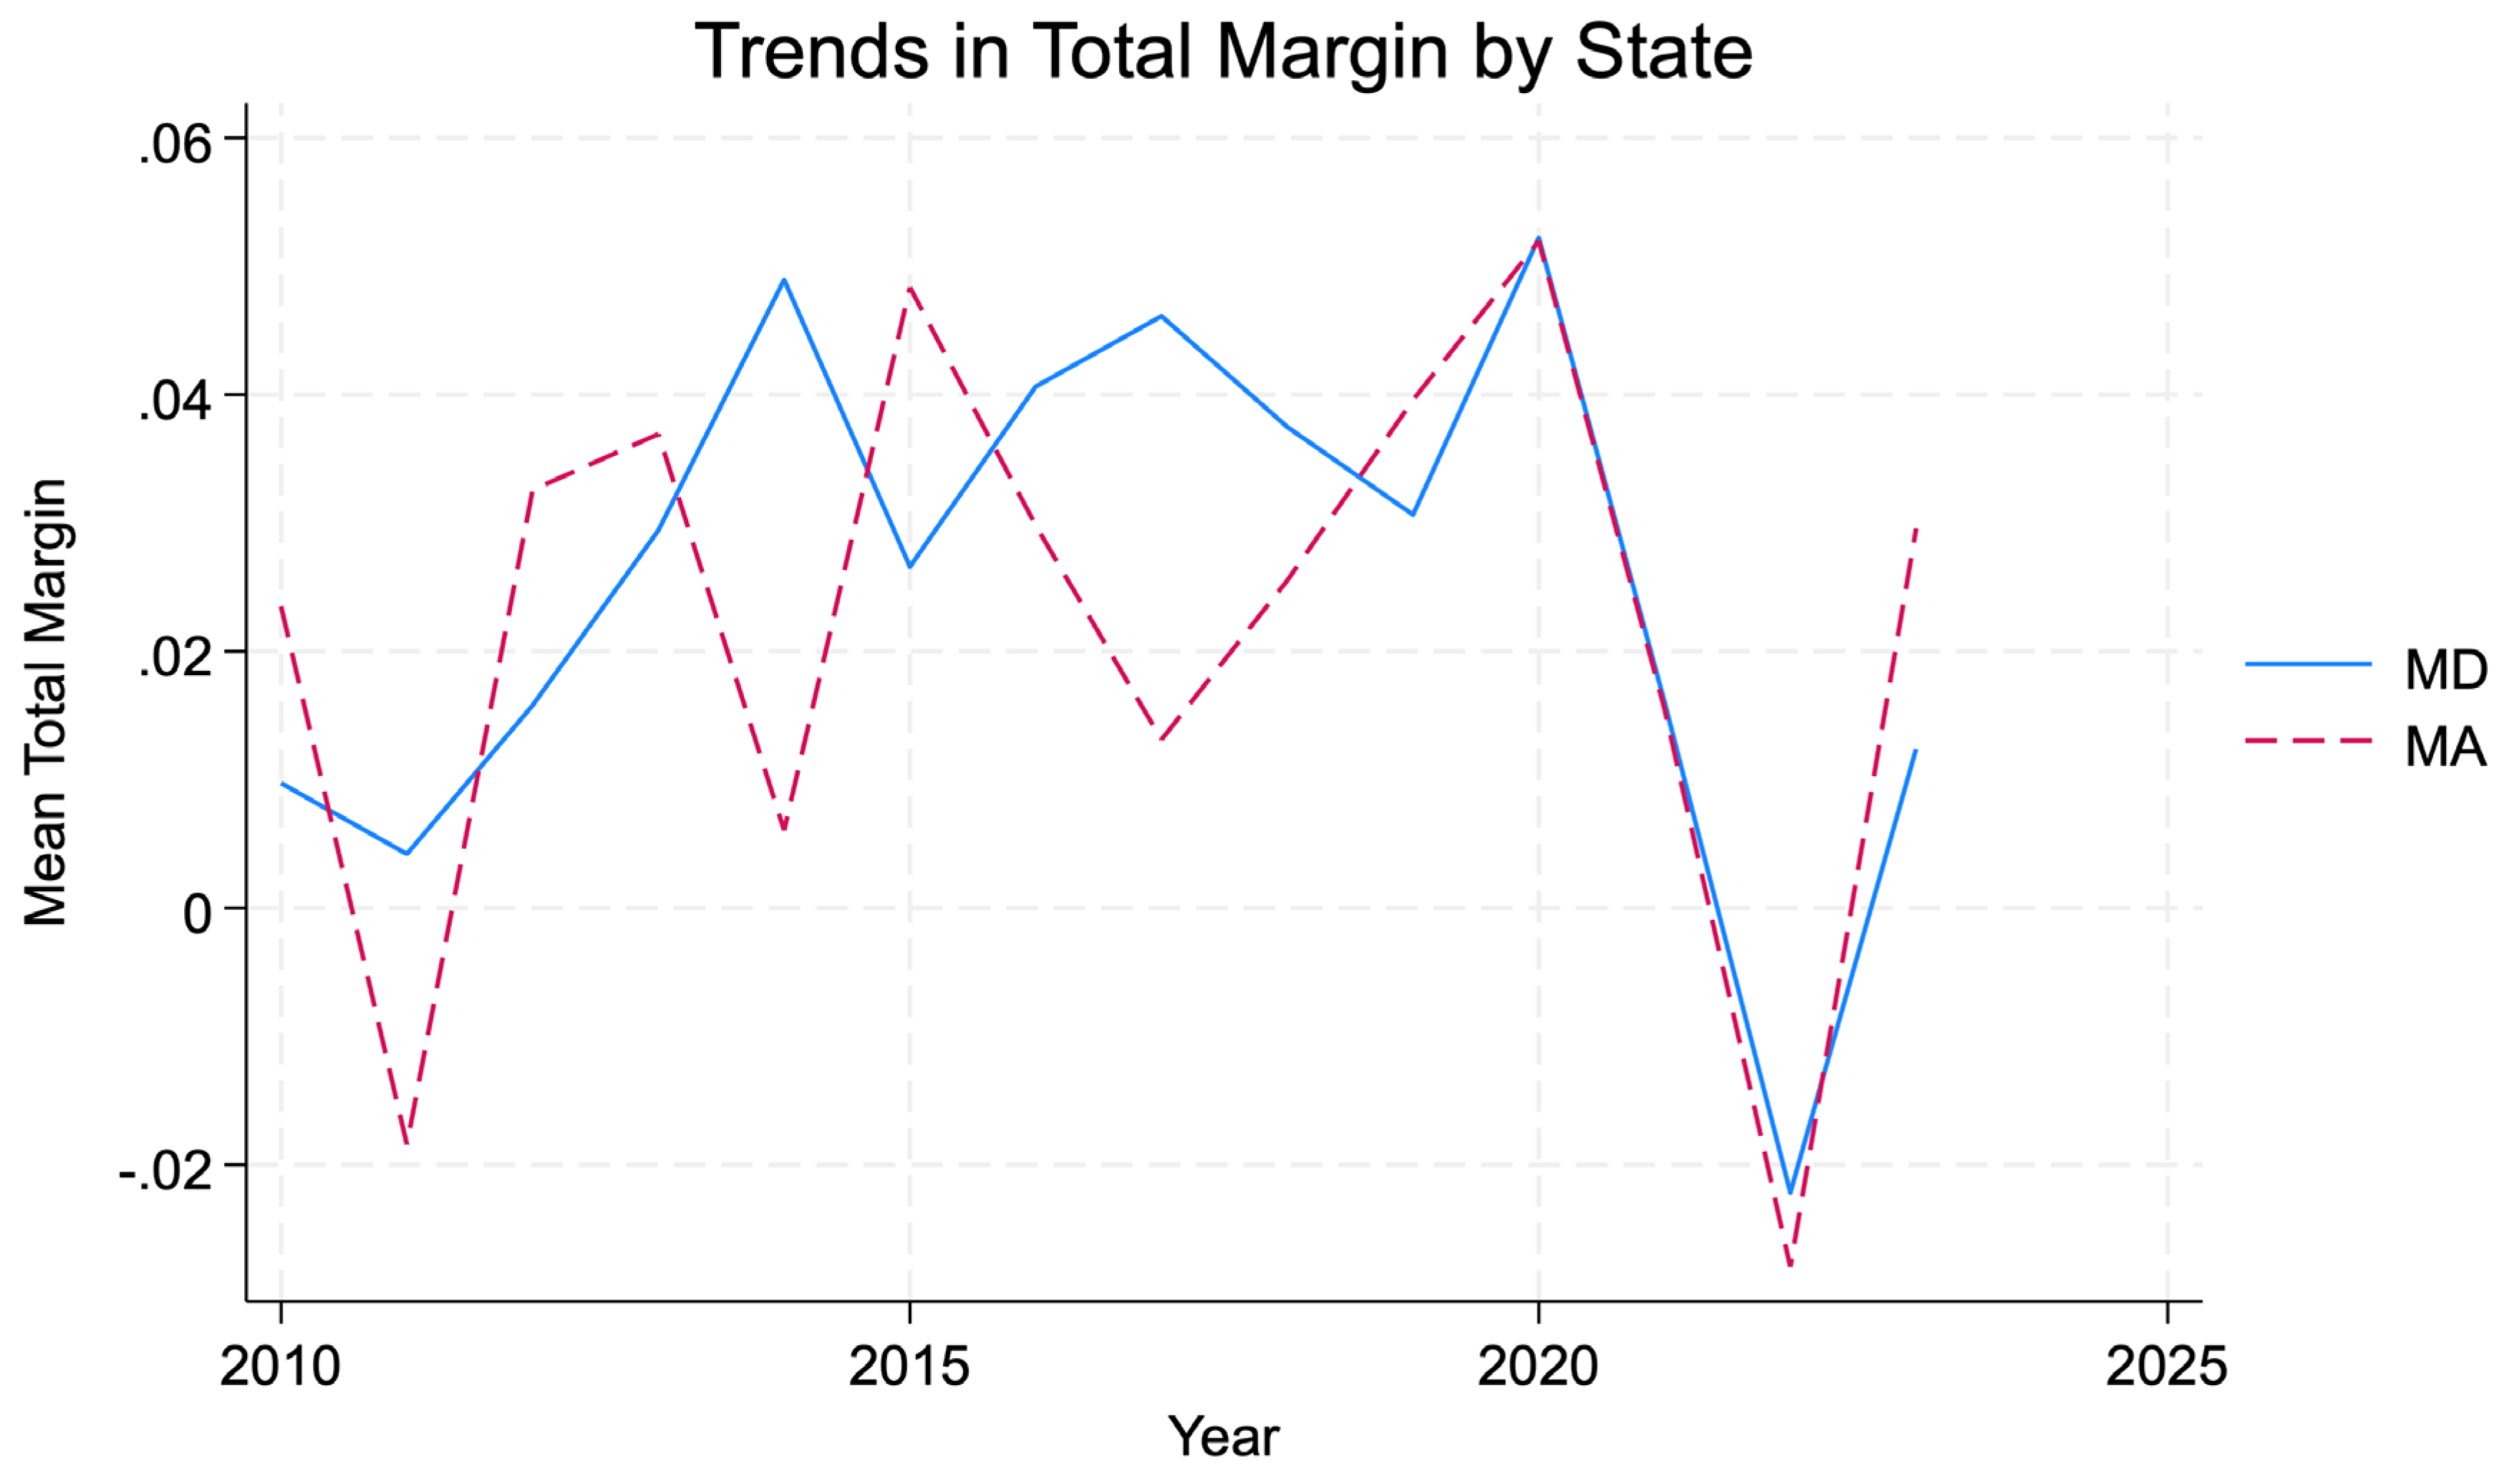
Figure 2 presents state-year trends in mean total margin for Maryland and Massachusetts from 2010–2023. Visual inspection suggests broadly similar long-run trajectories, with year-to-year variation in both states and no sharp or sustained post-2014 divergence consistent with a large, immediate profitability shift under global budgets.
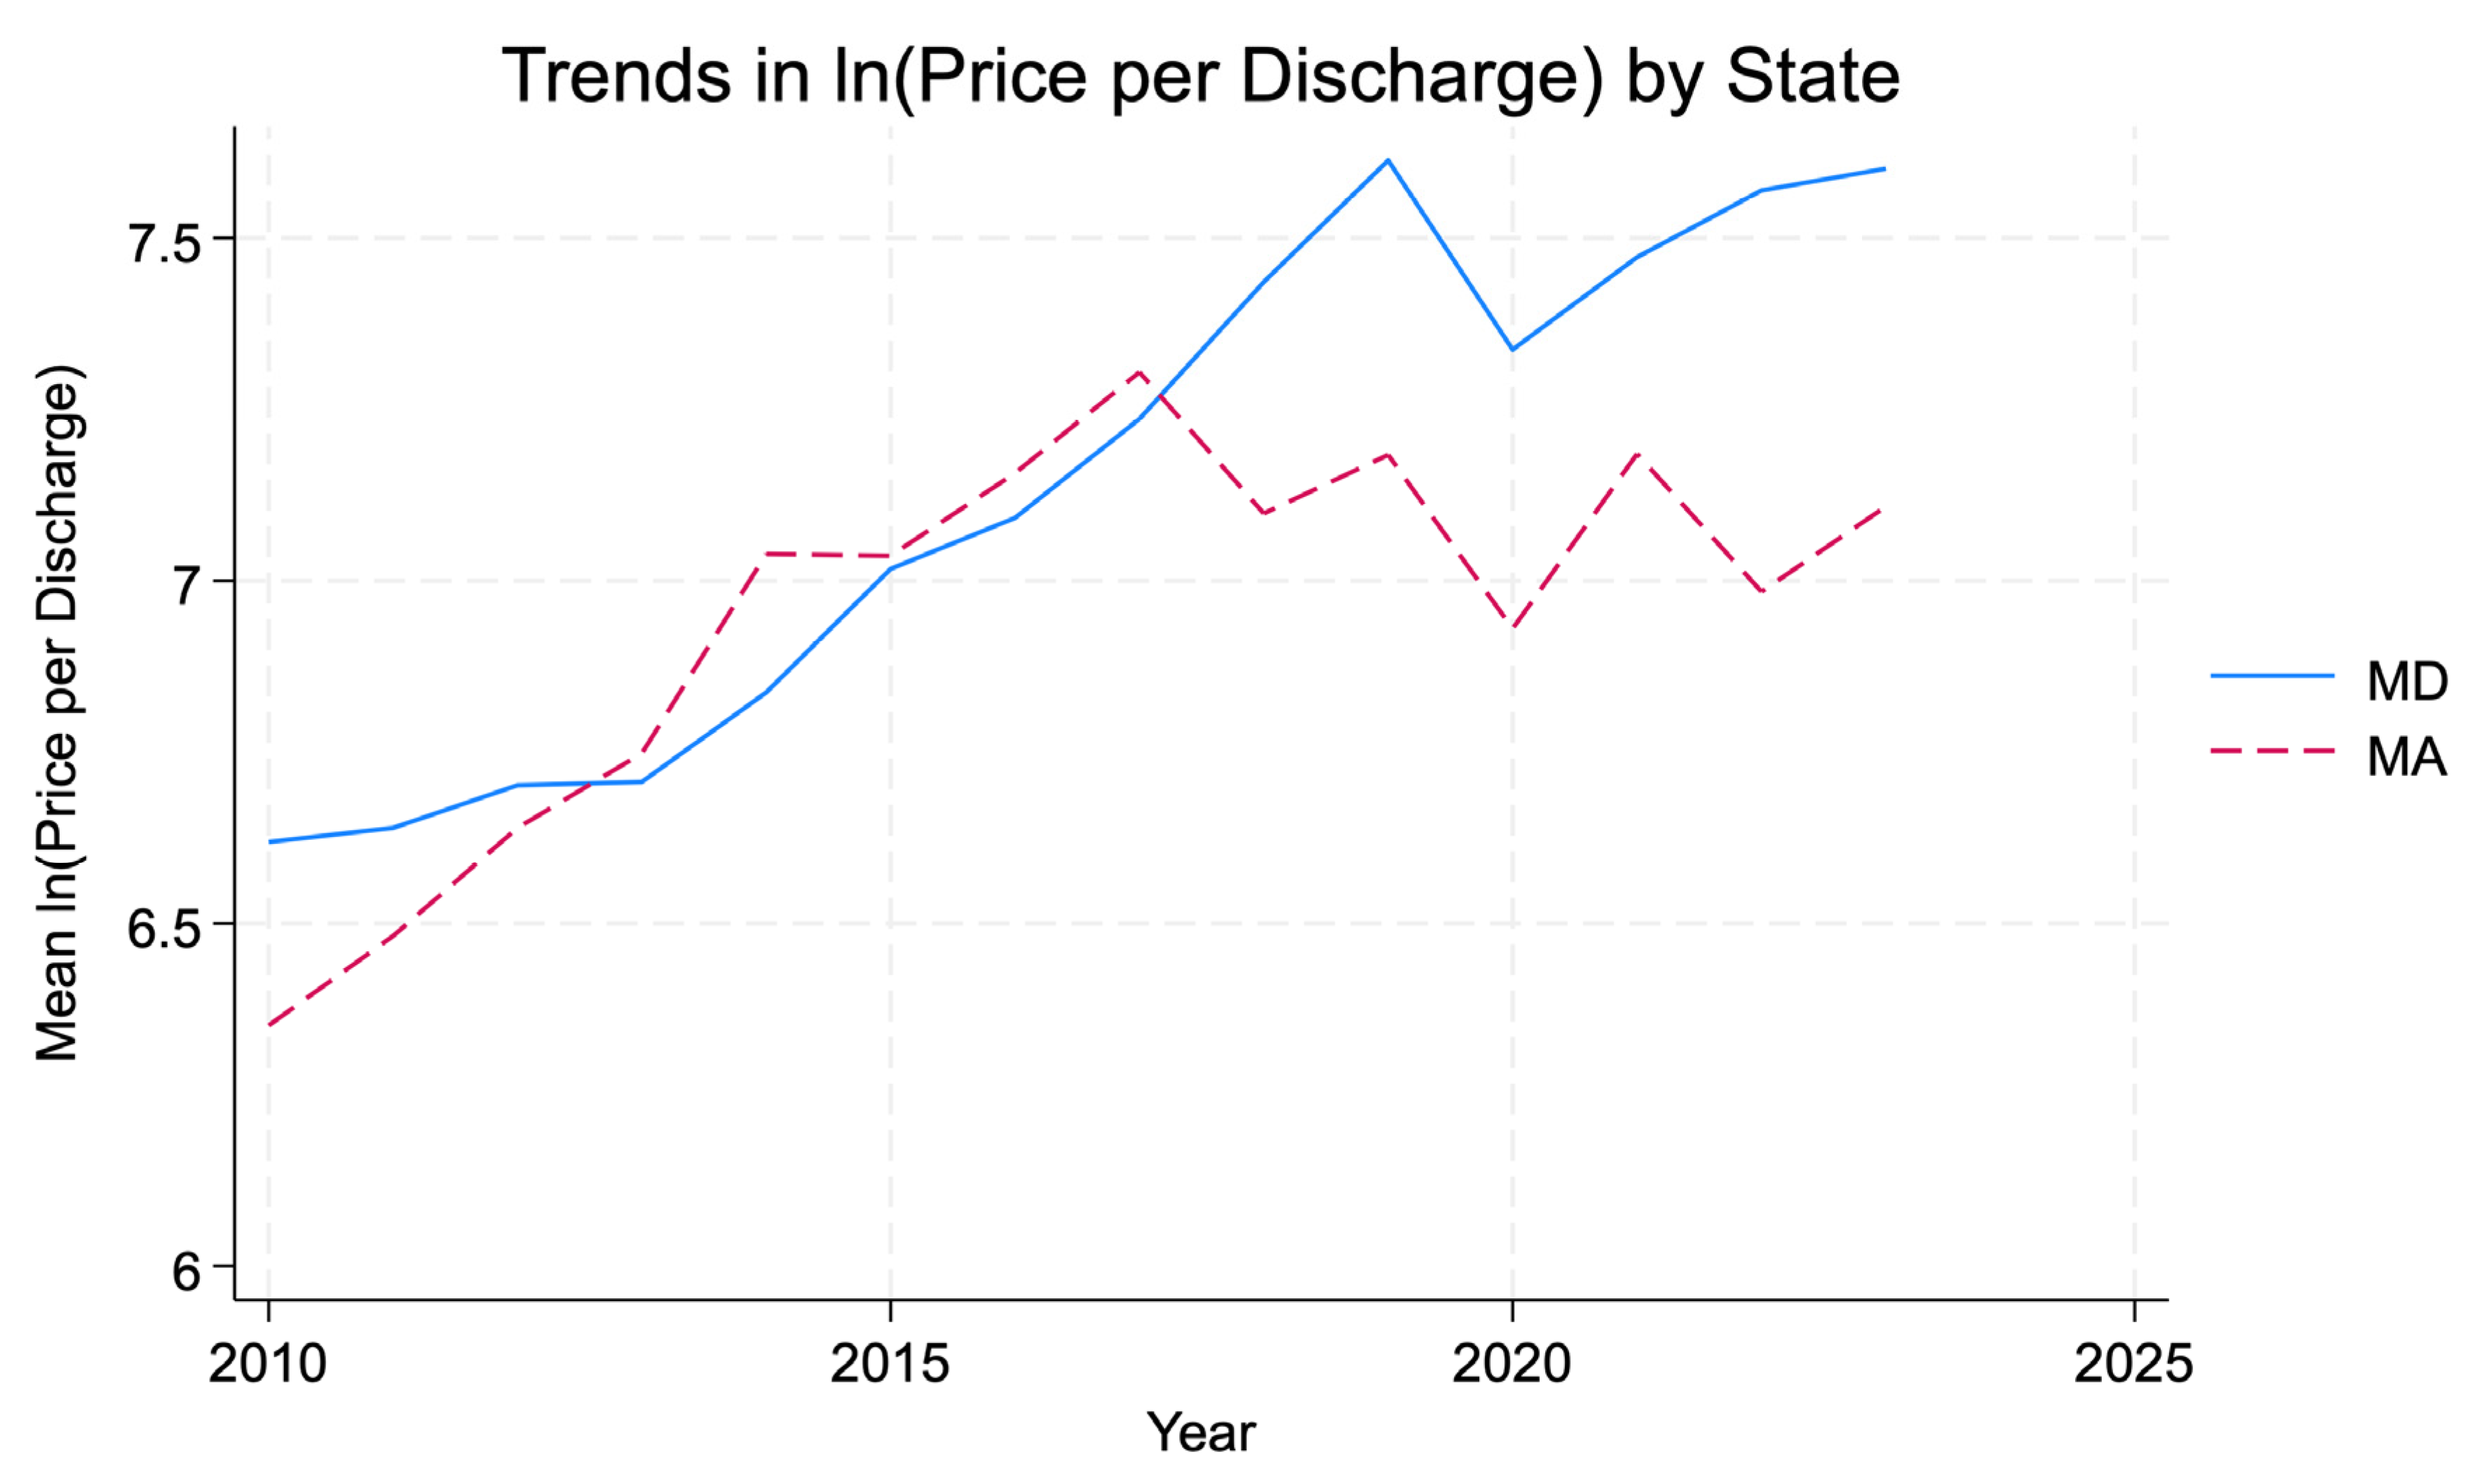
Figure 3 presents state-year trends in mean ln(revenue per discharge). The series diverge after the mid-2010s, with Maryland exhibiting higher ln(revenue per discharge) levels than Massachusetts in later years, consistent with the regression evidence of a positive post-2014 differential change.
Interpretation is intentionally descriptive: these plots summarize raw (unadjusted) means and do not account for hospital fixed effects or national shocks captured in the DiD framework.
5.2. Main DiD Estimates (Table 2; Primary Inferential Results)
Table 2 reports the fixed-effects DiD estimates with hospital and year fixed effects and standard errors clustered at the hospital level. [
11,
12] The coefficient of interest in each model is the interaction
MD × Post2014 (
md_post2014).
RQ1 / H2 (Margins).
In the total margin model, the estimated post-2014 differential for Maryland relative to Massachusetts was positive but not statistically distinguishable from zero (
β = 0.021, SE = 0.018;
p = 0.232) (
Table 2). This result does not support a detectable post-2014 change in operating profitability attributable to global budgets in the Maryland–Massachusetts comparison. Accordingly, the evidence is most consistent with no measurable margin effect, aligning with
H2.
RQ2 / H1 (Revenue per discharge).
In the ln(revenue per discharge) model, the post-2014 differential for Maryland relative to Massachusetts was positive and statistically significant (
β = 0.287, SE = 0.095;
p = 0.003) (
Table 2). Interpreted in log points, this corresponds to an approximate 33% increase in revenue per discharge for Maryland relative to Massachusetts after 2014 exp(0.287)−1. This finding supports
H1, consistent with higher unit revenue intensity under global budgets.
5.3. Event Study (Identification Diagnostic and Dynamics for Margins)
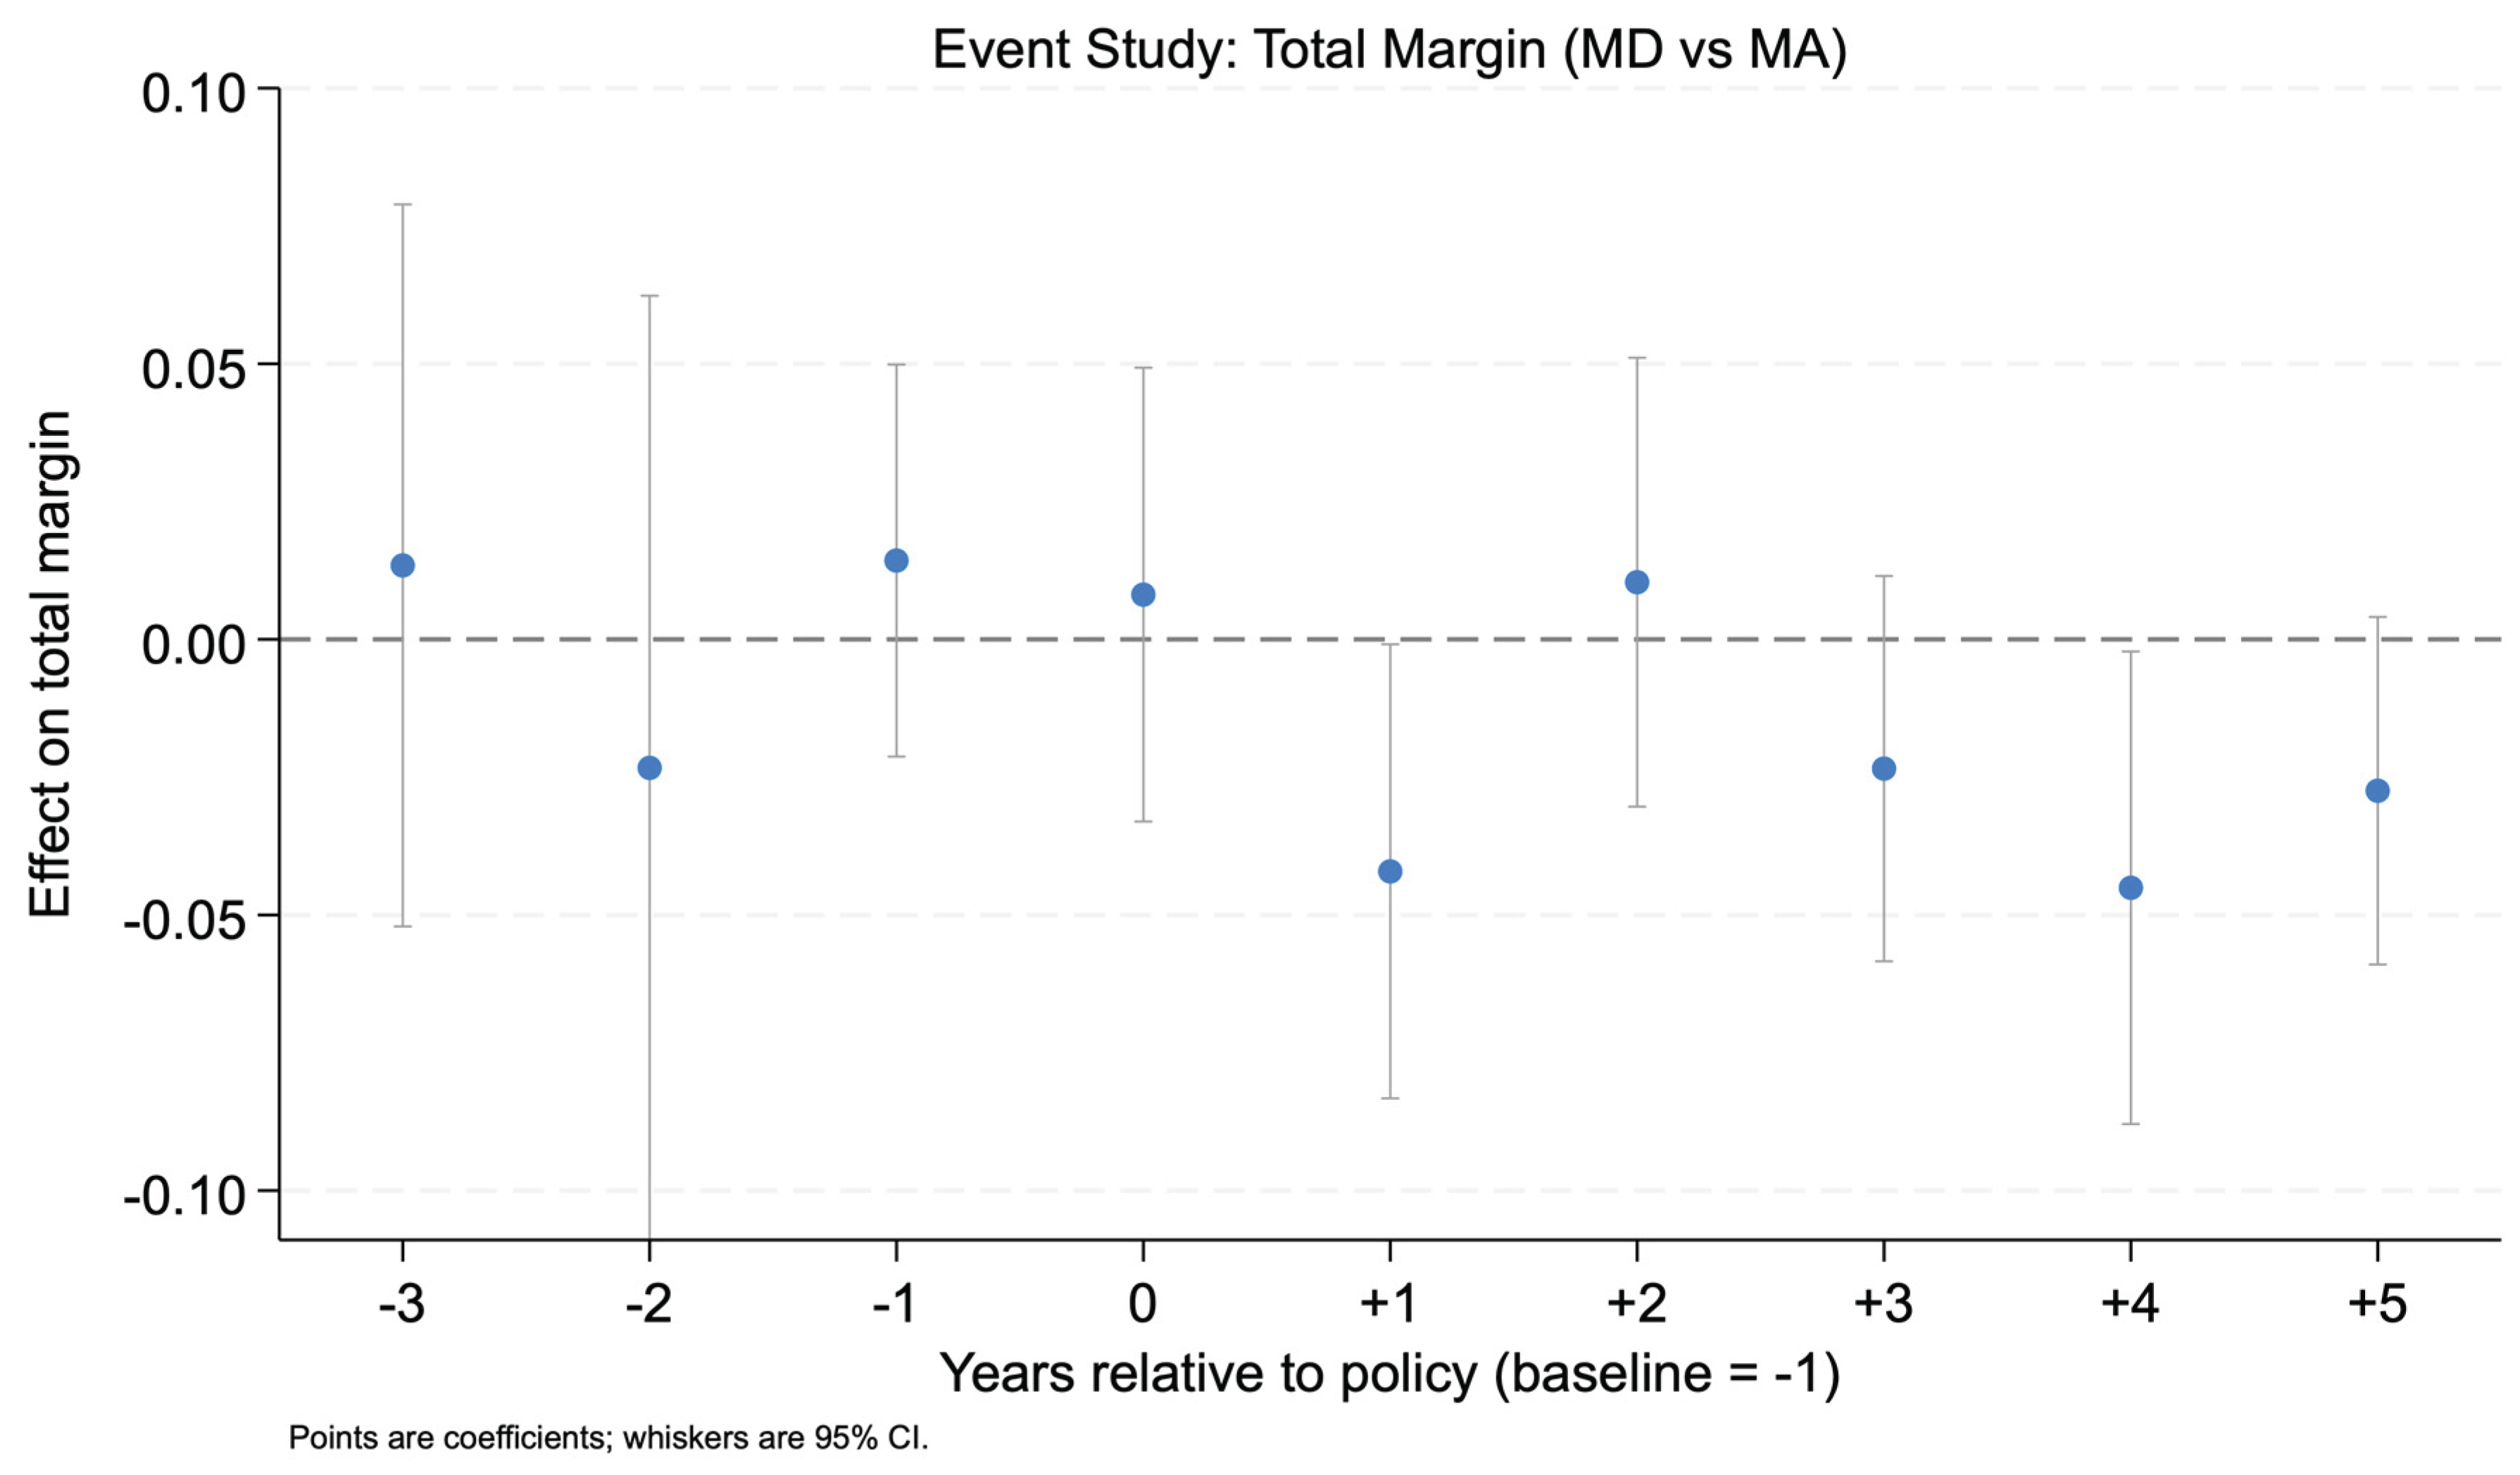
Figure 4 displays the event-study estimates for total margin, expressed as the
Maryland–Massachusetts differential at each event time relative to the omitted baseline year (baseline = −1). Pre-policy coefficients (e.g., −3 and −2) are close to zero and statistically non-significant, providing supportive (though not definitive) evidence that differential pre-trends are not apparent for margins in the event-time window examined (
Figure 4).
Post-policy estimates show some negative coefficients at select horizons, including statistically notable negatives at +1 and +4 in the event-study output. However, confidence intervals are wide at multiple horizons and the primary DiD estimate for margins is imprecise. Therefore, dynamic estimates are interpreted as
diagnostic and descriptive of potential heterogeneity over time, rather than as definitive effect sizing. [
13] The main conclusion remains anchored to the static DiD estimate in
Table 2: no statistically detectable average post-2014 margin effect.
5.4. COVID-Period Margin Volatility (RQ3/H3)
Table 3 reports fixed-effects models for margin volatility measured as the absolute year-to-year change in total margin for consecutive-year observations. The key coefficient is the interaction
MD × COVID (md_covid) for 2020–2022.
RQ3 / H3 (Volatility).
The estimated Maryland differential in volatility during COVID was negative but not statistically significant (
β = −0.018,
p = 0.161) (
Table 3), indicating
no evidence of differential volatility reduction in Maryland relative to Massachusetts during the COVID period. Winsorized variants of the volatility outcome (constructed to reduce sensitivity to extreme changes) yielded similarly null interaction estimates, reinforcing the conclusion that results are not driven by outliers.
5.5. Placebo Test (Validity Check)
Table 4 reports the placebo DiD estimate using a fake treatment date in 2012, restricted to the pre-policy period. The placebo interaction was near zero and not statistically significant (
β = −0.008,
p = 0.801) (
Table 4). This null finding supports the interpretation that the main results are unlikely to be driven by a spurious pre-period break unrelated to the 2014 implementation.
4A. Event study (Total margin): MD–MA differential by event time (baseline = −1).
Outcome: total_margin
Model: hospital FE + fiscal-year indicators; SE clustered by hospital (hid)
Displayed coefficients: Maryland–Massachusetts differential at each event time relative to the omitted baseline year (−1).
RQ1 / H1 (Margins / Stability):
Key diagnostic = pre-period leads (−3, −2): both are clearly null → supports plausibility of parallel trends for total margin (does not prove it).
Post-period pattern: some negative years (+1, +4, +5) suggests possible short/medium-run dips, but this is not consistently aligned with your main DiD estimate for margins (which is null).
Notes: Coefficients are from your es_margin specification using the relative-year-by-Maryland interaction terms (the same terms you plotted in event_study_margin_clean.png). Coefficients are in margin units (≈ percentage points).
4B. Placebo DiD (fake treatment year 2012; estimated on pre-period through 2013)
Outcome: total_margin Sample restriction: fiscal years ≤ 2013 Model: hospital FE + fiscal-year indicators; SE clustered by hospital (hid)
6. Discussion
6.1. Principal Findings
This comparative interrupted panel analysis examined whether Maryland’s all-payer global budget revenue (GBR) model—implemented in 2014—was associated with differential changes in hospital financial outcomes relative to Massachusetts from 2010–2023. Three findings stand out.
First, the results are consistent with
H1: Maryland’s GBR implementation is associated with a statistically significant increase in ln(revenue per discharge) relative to Massachusetts. Interpreted cautiously, this indicates a higher average inpatient revenue per discharge in Maryland after 2014, conditional on hospital and year fixed effects. This pattern is directionally compatible with theory and qualitative accounts suggesting that prospective revenue environments can change hospitals’ operational responses, including service mix, coding, and intensity decisions, even when overall revenue growth is regulated. [
3,
4,
5,
6,
10]
Second, the results do not reject H2: there is no statistically precise evidence that GBR produced a discrete shift in total margin relative to the comparator. The appropriate interpretation is not “no effect,” but rather no detectable average margin change given the observed variance, heavy tails in margins, and the identifying assumptions of the design. The result remains coherent with early evaluations emphasizing utilization and spending effects rather than clear profitability changes, and with the policy intent of GBR to constrain revenue growth and discourage volume-driven surplus generation. [
3,
4,
5,
10]
Third, the findings do not reject H3: during the COVID period (2020–2022), Maryland does not exhibit a statistically distinct change in year-to-year margin volatility relative to Massachusetts. This is an important negative result given the policy narrative that prospective payment arrangements may buffer hospitals against volume shocks. COVID-era evidence documents substantial financial stress and heterogeneity in hospital resilience, but comparative evidence separating payment structure from broader market and policy factors remains limited. [
1,
2] The present results indicate that any differential volatility buffering attributable to GBR is not clearly detectable in this two-state fixed-effects comparison.
6.2. Interpretation that Remains Within the Data
A central interpretive contribution is the combination of higher inpatient revenue per discharge (a revenue-intensity proxy) without a corresponding detectable margin shift. This is not contradictory. Revenue per discharge can rise while margins remain stable if costs, constraints, and accounting totals adjust in parallel. Under GBR, hospitals operate within a regulated revenue framework but still face internal incentives related to case mix, throughput management, staffing, and service line composition; some of these mechanisms may increase unit revenue measures while leaving net margins unchanged. [
3,
4,
5,
6,
10]
At the same time, the revenue-per-discharge outcome must be treated as a proxy, not a direct measure of negotiated or regulated prices. Hospital cost report revenue measures reflect a combination of accounting practices, payer mix, and service intensity; therefore, the analysis supports statements about revenue intensity rather than definitive claims about “prices.” This distinction is important for external validity and policy translation, particularly when comparing a rate-regulated state to a benchmark-oriented fee-for-service environment. [
4,
10]
The event-study and placebo checks strengthen interpretability but do not eliminate uncertainty. The placebo analysis does not indicate spurious pre-period breaks, consistent with design validity. The event-study estimates provide supportive diagnostics for pre-trends plausibility, though uncertainty in several periods warrants modest claims rather than dynamic over-interpretation. [
11,
12,
13]
6.3. Policy Implications
These findings have implications for states and federal initiatives evaluating prospective payment or budget-based approaches.
Monitor intensity and service-mix responses. If global budgets are associated with higher revenue per discharge without margin inflation, attention should shift to whether unit-revenue changes reflect desirable efficiency, coding shifts, or service substitution. Program governance may require complementary monitoring of case mix, coding, and service line patterns to prevent unintended incentives that increase revenue intensity without improving value. [
3,
4,
5,
6,
10]
Avoid assuming “automatic financial stabilization.” Prospective models are often described as stabilizing during shocks, yet the COVID volatility test does not show statistically clear differential buffering in Maryland relative to Massachusetts. The implication is not that stabilization does not occur, but that it should be treated as an
empirical question that may depend on implementation details, external relief policies, and hospital baseline risk exposure. [
1,
2,
4,
10]
Support careful scaling with guardrails. As policymakers consider broader models such as AHEAD, these results suggest that global budgets can coexist with stable margins while altering unit revenue patterns. Expansion strategies may need explicit guardrails and performance measures aligned with the intended mechanism—cost containment, access, and quality—rather than relying on margins as the primary indicator of success. [
8,
10]
Given the ongoing evolution of Maryland’s payment architecture and expansion pathways (TCOC; AHEAD), these findings motivate oversight mechanisms that explicitly track service mix and coding responses rather than relying on margins as the primary performance signal. [
7,
8] Evidence from Maryland’s GBR context also indicates that broad prospective revenue models can generate spillover effects beyond spending and utilization targets, including increased centralization of selected complex surgical procedures at high-concentration hospitals after 2014. [19] This pattern reinforces the need for complementary guardrails, monitoring service-line shifts and referral pathways, and assessing potential access and equity consequences when scaling global-budget approaches.
6.4. Limitations
Several limitations are material to causal interpretation and generalization.
6.5. Future Research
Several extensions are feasible and directly responsive to the above limitations.
Richer covariate adjustment and heterogeneity. Systematically include hospital characteristics (beds, teaching status, system membership, ownership) and test for heterogeneous effects, especially among hospitals with different baseline margins or market positions. [
12,
16]
Expanded comparator strategies. Augment Massachusetts with additional comparator states or use a multi-state donor pool to implement synthetic control–style sensitivity analyses, reducing reliance on a single comparator market. [
11,
12,
13]
Decomposition of revenue per discharge. Separate changes attributable to case mix and intensity (e.g., DRG weights, case-mix index proxies) versus accounting revenue shifts. This would clarify whether post-2014 effects reflect true unit price changes or compositional shifts.
Link financial outcomes to utilization and quality. Pair cost report outcomes with utilization, quality, and access measures to interpret whether revenue-per-discharge increases represent efficiency improvements, intensity increases, or coding behavior. [
3,
4,
5,
6,
10]
Conclusion
Maryland’s all-payer global budget revenue (GBR) model, implemented in 2014, was associated with a statistically significant increase in inpatient revenue per discharge relative to Massachusetts in a matched hospital-year panel from 2010–2023. In contrast, there was no statistically precise evidence of a differential change in total margins after 2014, and no detectable differential change in year-to-year margin volatility during the COVID-19 period (2020–2022). Taken together, the results indicate that GBR can coincide with higher unit-revenue measures without producing a clear shift in profitability or a measurable buffer against margin volatility during a major demand shock. This pattern is consistent with a regulated revenue environment in which hospitals may adjust service mix, coding, or intensity in ways that increase revenue per discharge while costs and constraints adjust such that margins remain broadly stable. These findings support a cautious interpretation of global budgets: they may change how revenue is generated per inpatient episode without necessarily improving profitability or guaranteeing financial stabilization during shocks. Policy discussions should therefore treat “financial stability” as an empirical outcome and pair budget-based payment with monitoring of revenue-per-discharge dynamics to distinguish price changes from compositional and intensity responses.
Author Contributions
Kola Adegoke (K.A.) was responsible for conceptualizing, designing the study, cleaning data, performing statistical analysis, creating visualizations, and preparing the manuscript. All aspects of methodology, validation, investigation, resources, data curation, and project management were carried out solely by the author. The author also managed the preparation, review, and editing of the manuscript, as well as supervising the analytical process and data handling. The author read and agreed to the published version of the manuscript.
Financial Support
This research received no specific grant from any funding agency, commercial, or not-for-profit sectors.
Data Availability Statement
The Medicare hospital cost report panel used in this study was obtained from RAND (HCRIS-derived files) under a data-use and license agreement. [
14] Licensing restrictions prevent redistribution of the RAND data; qualified researchers may obtain access directly from RAND under the same terms. The CMS Provider of Services (POS) File—Hospital & Non-Hospital Facilities is publicly available from CMS and was accessed in this study as the quarterly extract Hospital_and_other.DATA.Q4_2025.csv. [
16] Replication code and documentation sufficient to reproduce the analysis (conditional on obtaining access to the RAND data and downloading the public POS extract) are available via the Open Science Framework (OSF) associated project (
https://osf.io/hr6jy) and
Registration DOI: 10.17605/OSF.IO/4DGTM.
Conflicts of Interest
The author declares no conflict of interest.
References
- Orlando, AW; Field, RI. Measuring the COVID-19 financial threat to hospital markets. Inquiry 2021, 58. [Google Scholar] [CrossRef] [PubMed]
- Neupane, M; Warner, S; Mancera, A; et al. Association between hospital type and resilience during COVID-19 caseload stress. Ann Intern Med. 2024. [Google Scholar] [CrossRef] [PubMed]
- Rajkumar, R; Patel, A; Murphy, K; et al. Maryland’s all-payer approach to delivery-system reform. N Engl J Med. 2014, 370(6), 493–495. [Google Scholar] [CrossRef] [PubMed]
- Centers for Medicare; Medicaid Services. Maryland All-Payer Model. Available online: https://www.cms.gov/priorities/innovation/innovation-models/maryland-all-payer-model?utm (accessed on 31 Oct 2025).
- Beil, H; Haber, SG; Giuriceo, K; et al. Maryland’s global hospital budgets: impacts on Medicare cost and utilization for the first 3 years. Med Care 2019, 57(6), 417–424. [Google Scholar] [CrossRef] [PubMed]
- Kilaru, AS; Crider, CR; Chiang, J; Fassas, E; Sapra, KJ. Health care leaders’ perspectives on the Maryland All-Payer Model. JAMA Health Forum 2022, 3(2), e214920. [Google Scholar] [CrossRef] [PubMed]
- Health Services Cost Review Commission. Total Cost of Care (TCOC) Model. Available online: https://hscrc.maryland.gov/Pages/tcocmodel.aspx (accessed on 19 Nov 2025).
- Health Services Cost Review Commission. AHEAD Model. Available online: https://hscrc.maryland.gov/Pages/ahead-model.aspx?utm (accessed on 19 Nov 2025).
- Song, Z; Rose, S; Safran, DG; Landon, BE; Day, MP; Chernew, ME. Changes in health care spending and quality 4 years into global payment. N Engl J Med. 2014, 371(18), 1704–1714. [Google Scholar] [CrossRef] [PubMed]
- Commonwealth Fund. Hospital Global Budgeting: Lessons From Maryland and Selected Nations. June 2024. Available online: https://www.commonwealthfund.org/publications/fund-reports/2024/jun/hospital-global-budgeting-lessons-maryland-selected-nations?utm (accessed on 19 Nov 2025).
- Wing, C; Simon, K; Bello-Gomez, RA. Designing difference-in-difference studies: best practices for public health policy research. Annu Rev Public Health 2018, 39, 453–469. [Google Scholar] [CrossRef] [PubMed]
- Zeldow, B; Hatfield, LA. Confounding and regression adjustment in difference-in-differences studies. Health Serv Res. 2021, 56(5), 932–941. [Google Scholar] [CrossRef] [PubMed]
- Sun, L; Abraham, S. Estimating dynamic treatment effects in event studies with heterogeneous treatment effects. J Econometrics 2021, 225(2), 175–199. [Google Scholar] [CrossRef]
- RAND Corporation. Hospital Cost Report Information System (HCRIS) Data Files. 2025. Available online: https://www.rand.org/pubs/tools/TL303.html?utm (accessed on 19 Nov 2025).
- StatsAmerica. State Per Capita Personal Income, 2024. Available online: https://www.statsamerica.org/sip/rank_list.aspx?rank_label=pcpi1 (accessed on 31 October 2025).
- Centers for Medicare; Medicaid Services (CMS).
Provider of Services File – Hospital & Non-Hospital Facilities (dataset landing page)
. Available online: https://data.cms.gov/provider-characteristics/hospitals-and-other-facilities/provider-of-services-file-quality-improvement-and-evaluation-system.
- Offodile, AC, 2nd; Lin, YL; Shah, SA; Swisher, SG; Jain, A; Butler, CE; et al. Is the Centralization of Complex Surgical Procedures an Unintended Spillover Effect of Global Capitation? - Insights from the Maryland Global Budget Revenue Program. Ann Surg. 2023, 277(4), 535–41. [Google Scholar] [CrossRef] [PubMed]
|
Disclaimer/Publisher’s Note: The statements, opinions and data contained in all publications are solely those of the individual author(s) and contributor(s) and not of MDPI and/or the editor(s). MDPI and/or the editor(s) disclaim responsibility for any injury to people or property resulting from any ideas, methods, instructions or products referred to in the content. |
© 2026 by the authors. Licensee MDPI, Basel, Switzerland. This article is an open access article distributed under the terms and conditions of the Creative Commons Attribution (CC BY) license (http://creativecommons.org/licenses/by/4.0/).