1. Introduction
Stroke often results in motor paralysis, balance deficits, and cognitive dysfunction[
1,
2]. These impairments lead to gait deviations such as reduced walking speed, decreased cadence, shorter stride length, and decreased toe clearance on the affected side[
3,
4,
5]. These gait deviations contribute to an increased risk of falling[
6]. The fall incidence among post-stroke patients is high, reaching approximately twice that of age-matched healthy adults[
7,
8]. Falls in this population often result in injury and fracture, leading to reduced mobility[
9,
10,
11]. Furthermore, while the one-year mortality rate following a proximal femoral fracture is 10.8% for the general population, the rate for post-stroke patients with a femoral fracture is significantly higher, reaching 24.8%[
12]. Crucially, falls most frequently occur during walking; therefore, improving gait stability is a critical challenge in stroke rehabilitation.
Stable gait requires effective stance-limb control in response to environmental changes and sudden perturbations. Healthy individuals maintain this stability by increasing the magnitude of the ground reaction force (GRF) and modifying the GRF vector angle in response to walking perturbations[
13,
14]. Furthermore, a positive correlation has been reported between the vertical GRF of the paretic and non-paretic limbs during static standing and the Berg Balance Scale (BBS) score in post-stroke patients[
15]. Thus, GRF is a highly relevant indicator for evaluating balance and maintaining gait stability. Previous studies have reported reduced vertical (V) and anteroposterior (AP) GRF on the paretic side of post-stroke patients compared to healthy individuals[
16,
17]. V GRF and AP GRF have been shown to reduce, particularly during the latter half of the stance phase[
18,
19,
20,
21]. The latter half of the stance phase requires complex lower-extremity control as it simultaneously involves supporting limb propulsion and contralateral limb initial contact[
22,
23,
24]. Thus, post-stroke patients are expected to have greater difficulty with the complex kinetic control required during the latter half of the stance phase.
Maintaining movement stability requires adaptive modifications, necessitating a certain range of movement variability, which is influenced by aging, pathology, and neurological factors[
25,
26]. Among post-stroke patients, increased variability in trunk acceleration and stride time during walking has been linked to a history of falls, demonstrating its utility as an assessment for fall risk[
27,
28,
29]. Conversely, some studies suggest that increased variability in parameters like step width or V GRF may be tolerated as a stability mechanism, intrinsically linking variability to stability[
30,
31]. Furthermore, while post-stroke patients exhibit greater variability in maximum AP GRF during the latter half of the stance phase compared to healthy controls[
32], this prior investigation was limited to the variability of a single point (maximum AP GRF). A study that compared the entire support phase in elderly individuals and young, healthy adults—time-normalizing the data and examining whether variance differed across segments—demonstrated phase-specific differences in GRF variability[
33]. These results suggest the need to compare changes in GRF variability throughout the entire gait cycle. A comparison of GRF changes across stance phases revealed that post-stroke patients have exhibited an earlier onset of the AP GRF peak compared to healthy individuals[
34]. Thus, GRF variability in post-stroke patients may exhibit different patterns than those of healthy individuals during specific stance phases. To our knowledge, no prior study has examined the characteristics of GRF variability in the stance sub-phase in post-stroke patients or its relationship with balance ability. We hypothesized that post-stroke patients increase AP GRF variability during the terminal stance to pre-swing phase, a phase that requires complex propulsive control to maintain stability.
The objectives of this study were 1) to clarify the characteristics of GRF variability in the stance sub-phase in post-stroke patients by comparing their AP and V GRF variability during walking with that of age-matched controls,2) to investigate the relationship between GRF variability in stance sub-phase and relevant clinical balance assessments, and 3) t identify the characteristics of GRF variability of stance sub-phase in the faller and non-faller groups of post-stroke patients.
2. Materials and Methods
2.1. Participants
A total of 20 post stroke patients (13 males, age range of 55 – 88 years) admitted our convalescent rehabilitation ward and 20 age-matched controls (10 males, age range of 60 - 77) were included this study. The inclusion criteria for the post-stroke patients were follows: (1) hemorrhage or infarction in the supratentorial region on unilateral side by computed tomography (CT) or magnetic resonance imaging (MRI) and diagnosis of cerebral hemorrhage of infraction, (2) patients aged 20 years old or older, and (3) Patients who were able to walk in a straight line for 30 consecutive gait cycles at their self-selected optimal speed, without the assistance of another person and the use of lower limb orthoses. The inclusion criteria for age-matched controls also included (2) and (3). Exclusion criteria for post-stroke group were follows: (1) comorbid musculoskeletal disorders that impede walking performance, (2) difficulty in communicating and understanding instructions because of higher brain dysfunction, cognitive decline, or aphasia, makes executing the study challenging, (3) History of neurological disease. Exclusion criteria for age-matched control group were follows: (1), (2), (3), and (4) history of falls within the past year. Participants provided written informed consent.
2.2. Clinical Assessment
In post-stroke patients, motor function was assessed using Fugl-Meyer Assessment of lower extremity (FMA-L)[
35], and Stroke Impairment Assessment Set (SIAS) to determine scores for lower extremity motor function (hip flexion test, knee extension test, and foot tap test)[
36]. Balance ability was assessed using Berg Balance Scale (BBS)[
37]. Short Falls Efficacy Scale-International (Short FES-I) was using as measurement of fear of falling in post-stroke patients[
38]. Fall status was confirmed by telephone for every 1 month during 6 months in post-stroke patients, and post-stroke patients assigned faller group and non-faller group. We defined fall event as” contact between any part of the body, expect the soles of the feet, and the floor or ground during movement in daily life”[
39].
2.3. Gait Assessment
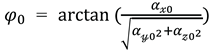
The motor task required participants to walk in a straight-line for 34 gait cycles at their self-selected comfortable speed. Participants completed one trials of the walking measurement. The continuous 30 gait cycles were subsequently used for analysis, excluding the initial and final two gait cycles immediately after the start and before the end of walking, respectively[
40] (
Figure 1.). This method was deemed valid for measuring GRF variability during gait, as previous research has indicated that recording 20 or more gait cycle enables the measurement of kinematic parameters variability during walking with high intra-rater reliability[
41].
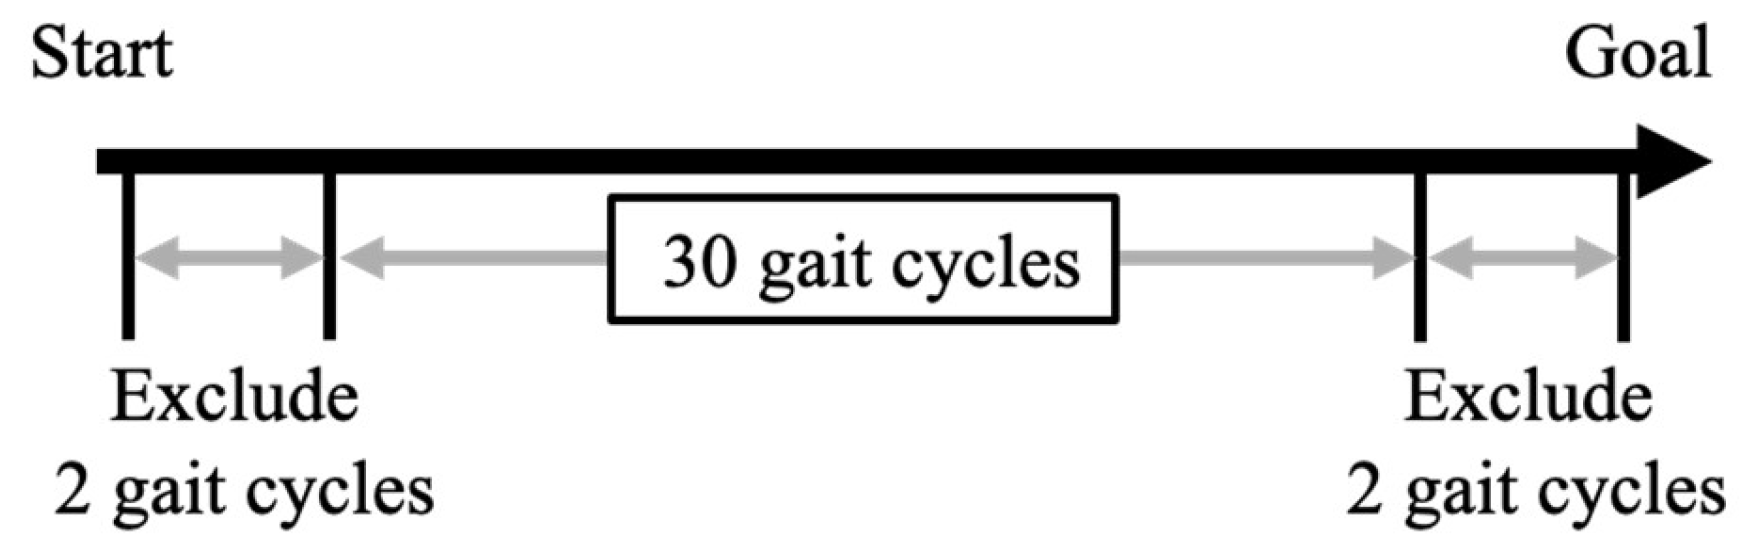
2.4. Shoe Sensor System
We assessed GRF during straight walking using the shoe sensor system[
42,
43] (
Figure 2.). This shoe sensor system has four triaxial force sensors (at the heel, first and fifth metatarsal heads, and toe) able to measure GRF outside of a laboratory setting [
42,
43]. The force sensor is composed of a stainless-steel housing and a force-sensing lever (Research Institute for Electromagnetic Materials, Tomiya, Japan). GRFs were measured along the anterior-posterior (AP), vertical (V), and medial-lateral axes. The sampling frequency was 400 Hz. The maximum measurement range of the force sensor was ± 500 N for the AP and medial-lateral axes, and ±1000 N for the V axis. The inter – rater reliability results for this shoe sensor system are presented in
Table A1.
The inertial measurement unit (IMU) (9-DOF Absolute Orientation IMU Fusion Breakout-BNO055; Aafruit, NY, USA) with a sampling frequency of 70 Hz, was mounted at the toe of the shoe. It was housed within polyethylene foam embedded in the sole of the shoe for protection from external impact. Both the force sensor and the IMU were connected to a microcontroller (Teensy 3.6, SparkFun, Electronics®, Niwot, CO, USA). The microcontroller was connected to a trigger that was activated by pressing a switch. The system allowed the measurement data to be recorded onto a secure digital card.
2.5. Data Processing
Data analysis in this study was performed using MATLAB R2023b (MathWorks, Massachusetts, USA). Data processing followed the methods of Yamaguchi et al. and Matsumoto et al., who used the same shoe sensor[
42,
43]. For calibration, the shoe sensor was connected to a personal computer and placed on a level surface prior to participant testing. Acceleration calibration was performed using the Newton iterative optimization algorithm [
43]. This aligned the resultant vector of the three-axis acceleration data (measured by the shoe sensor’s IMU in a static state) with the acceleration due to gravity (9.8m/s
2). The Newton iterative optimization algorithm is an iterative method that calculates the solution that minimizes the calibration coefficients and bias values. This minimizes the error between the resultant of the three-axis acceleration data and the acceleration due to gravity (9.8m/s
2). Using this algorithm, the sensor shoes were calibrated when placed on a level surface without a participant so that the resultant three-axis acceleration equaled the acceleration due to gravity (9.8m/s
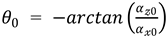
2). The corrected acceleration values for each axis (
) were thus determined. Next, the initial angles of the IMU
around the
’-axis and
around the
‘-axis at the initial static position of the IMU sensor were calculated using calibrated acceleration data (
、
、
) according to the following equations:
The initial angle around the ’-axis () was set to 0º.
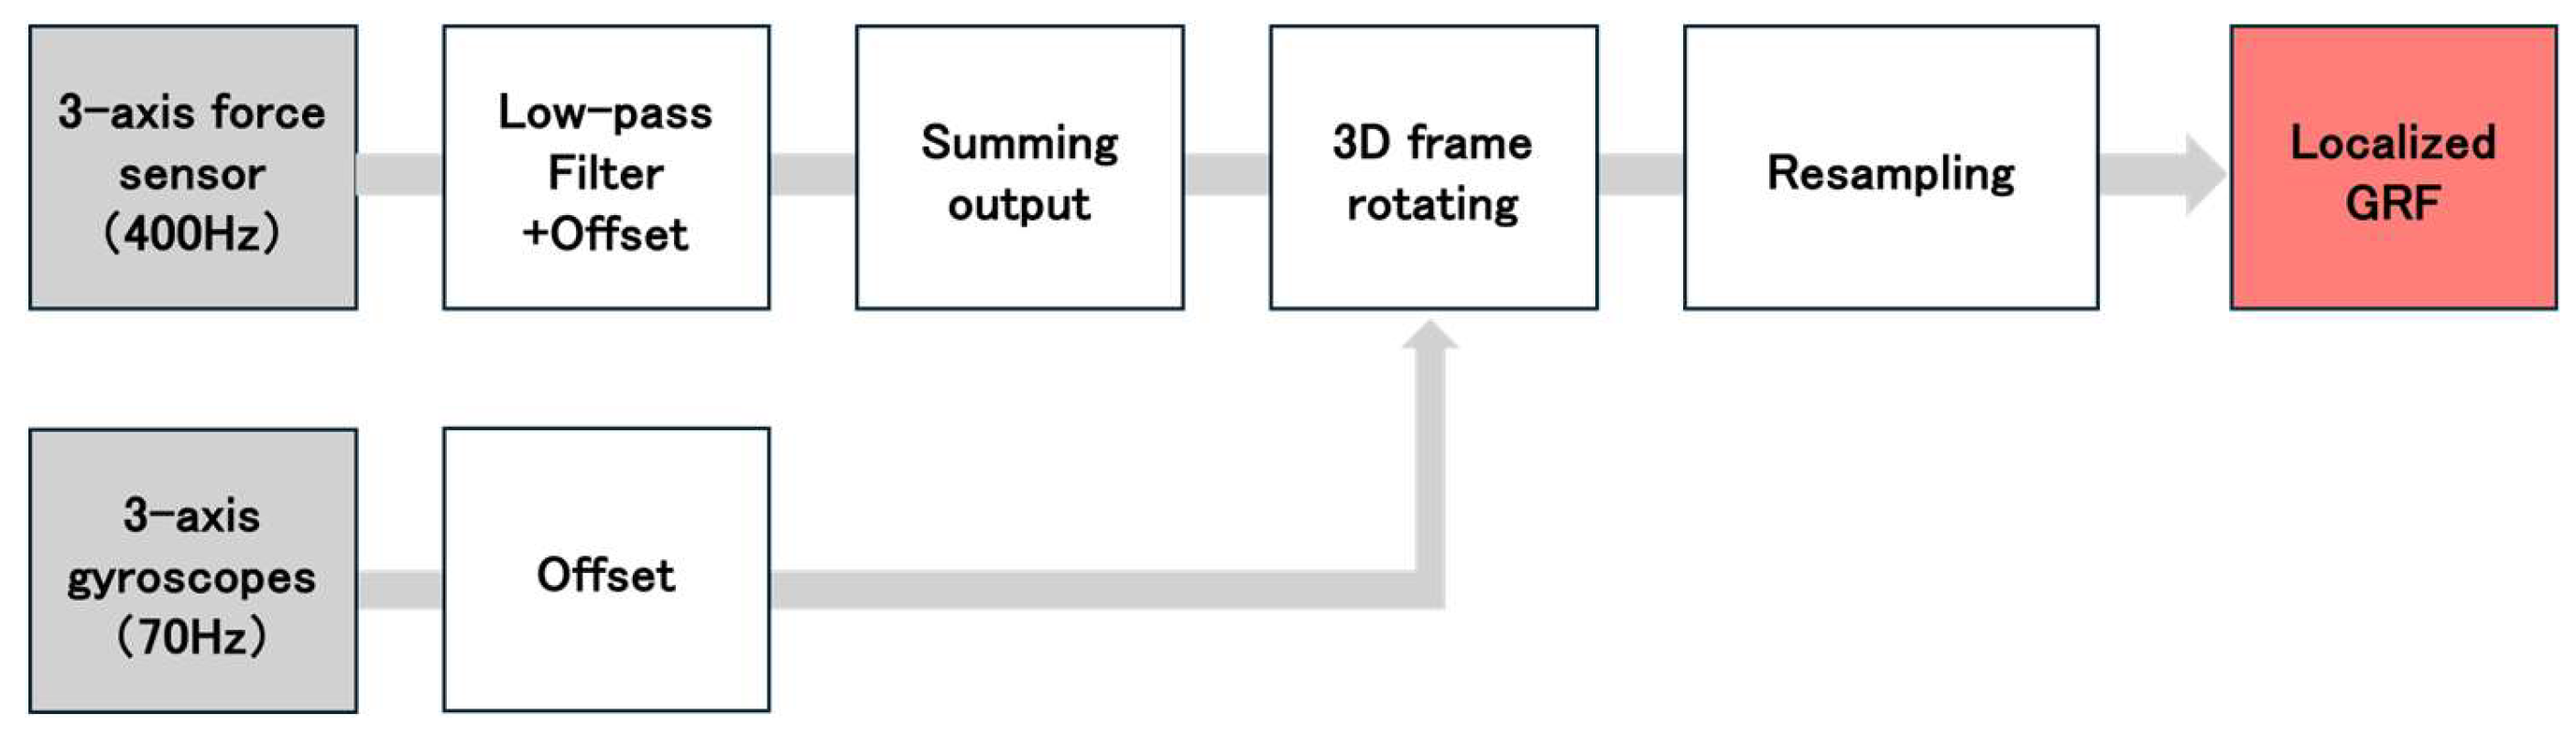
Figure 3 shows the analytical algorithm used to calculate the GRF obtained from the individual sensors at each location[
42,
43]. We analyzed the medial-lateral GRF (
), the AP GRF (
) and V GRF (
), which was recorded during the stance phase. The subscript i denotes the location of each sensor on the foot sole: 1 = heel, 2 = first metatarsal head, 3 = fifth metatarsal head, and 4 = toe. To remove noise from the data, a fourth-order Butterworth low-pass filter with a cutoff frequency of 50 Hz was applied. Next, the GRF data from each sensor location (
) were transformed into the global horizontal and vertical coordinate system (
) using the following equations[
43]:
The local GRF at each sensor location (
) were transformed into the global horizontal and vertical coordinate system. The GRF for entire sensor shoe (
、
、
) was calculated by summing the forces from all sensor locations using the following equation[
43]:
The stance phase of walking was identified using V GRF (
) from each sensor. Stance phase was defined as the moment when the V GRF (
) exceeded 15 N, and stance termination was defined as the moment when the V GRF (
) dropped below 15 N[
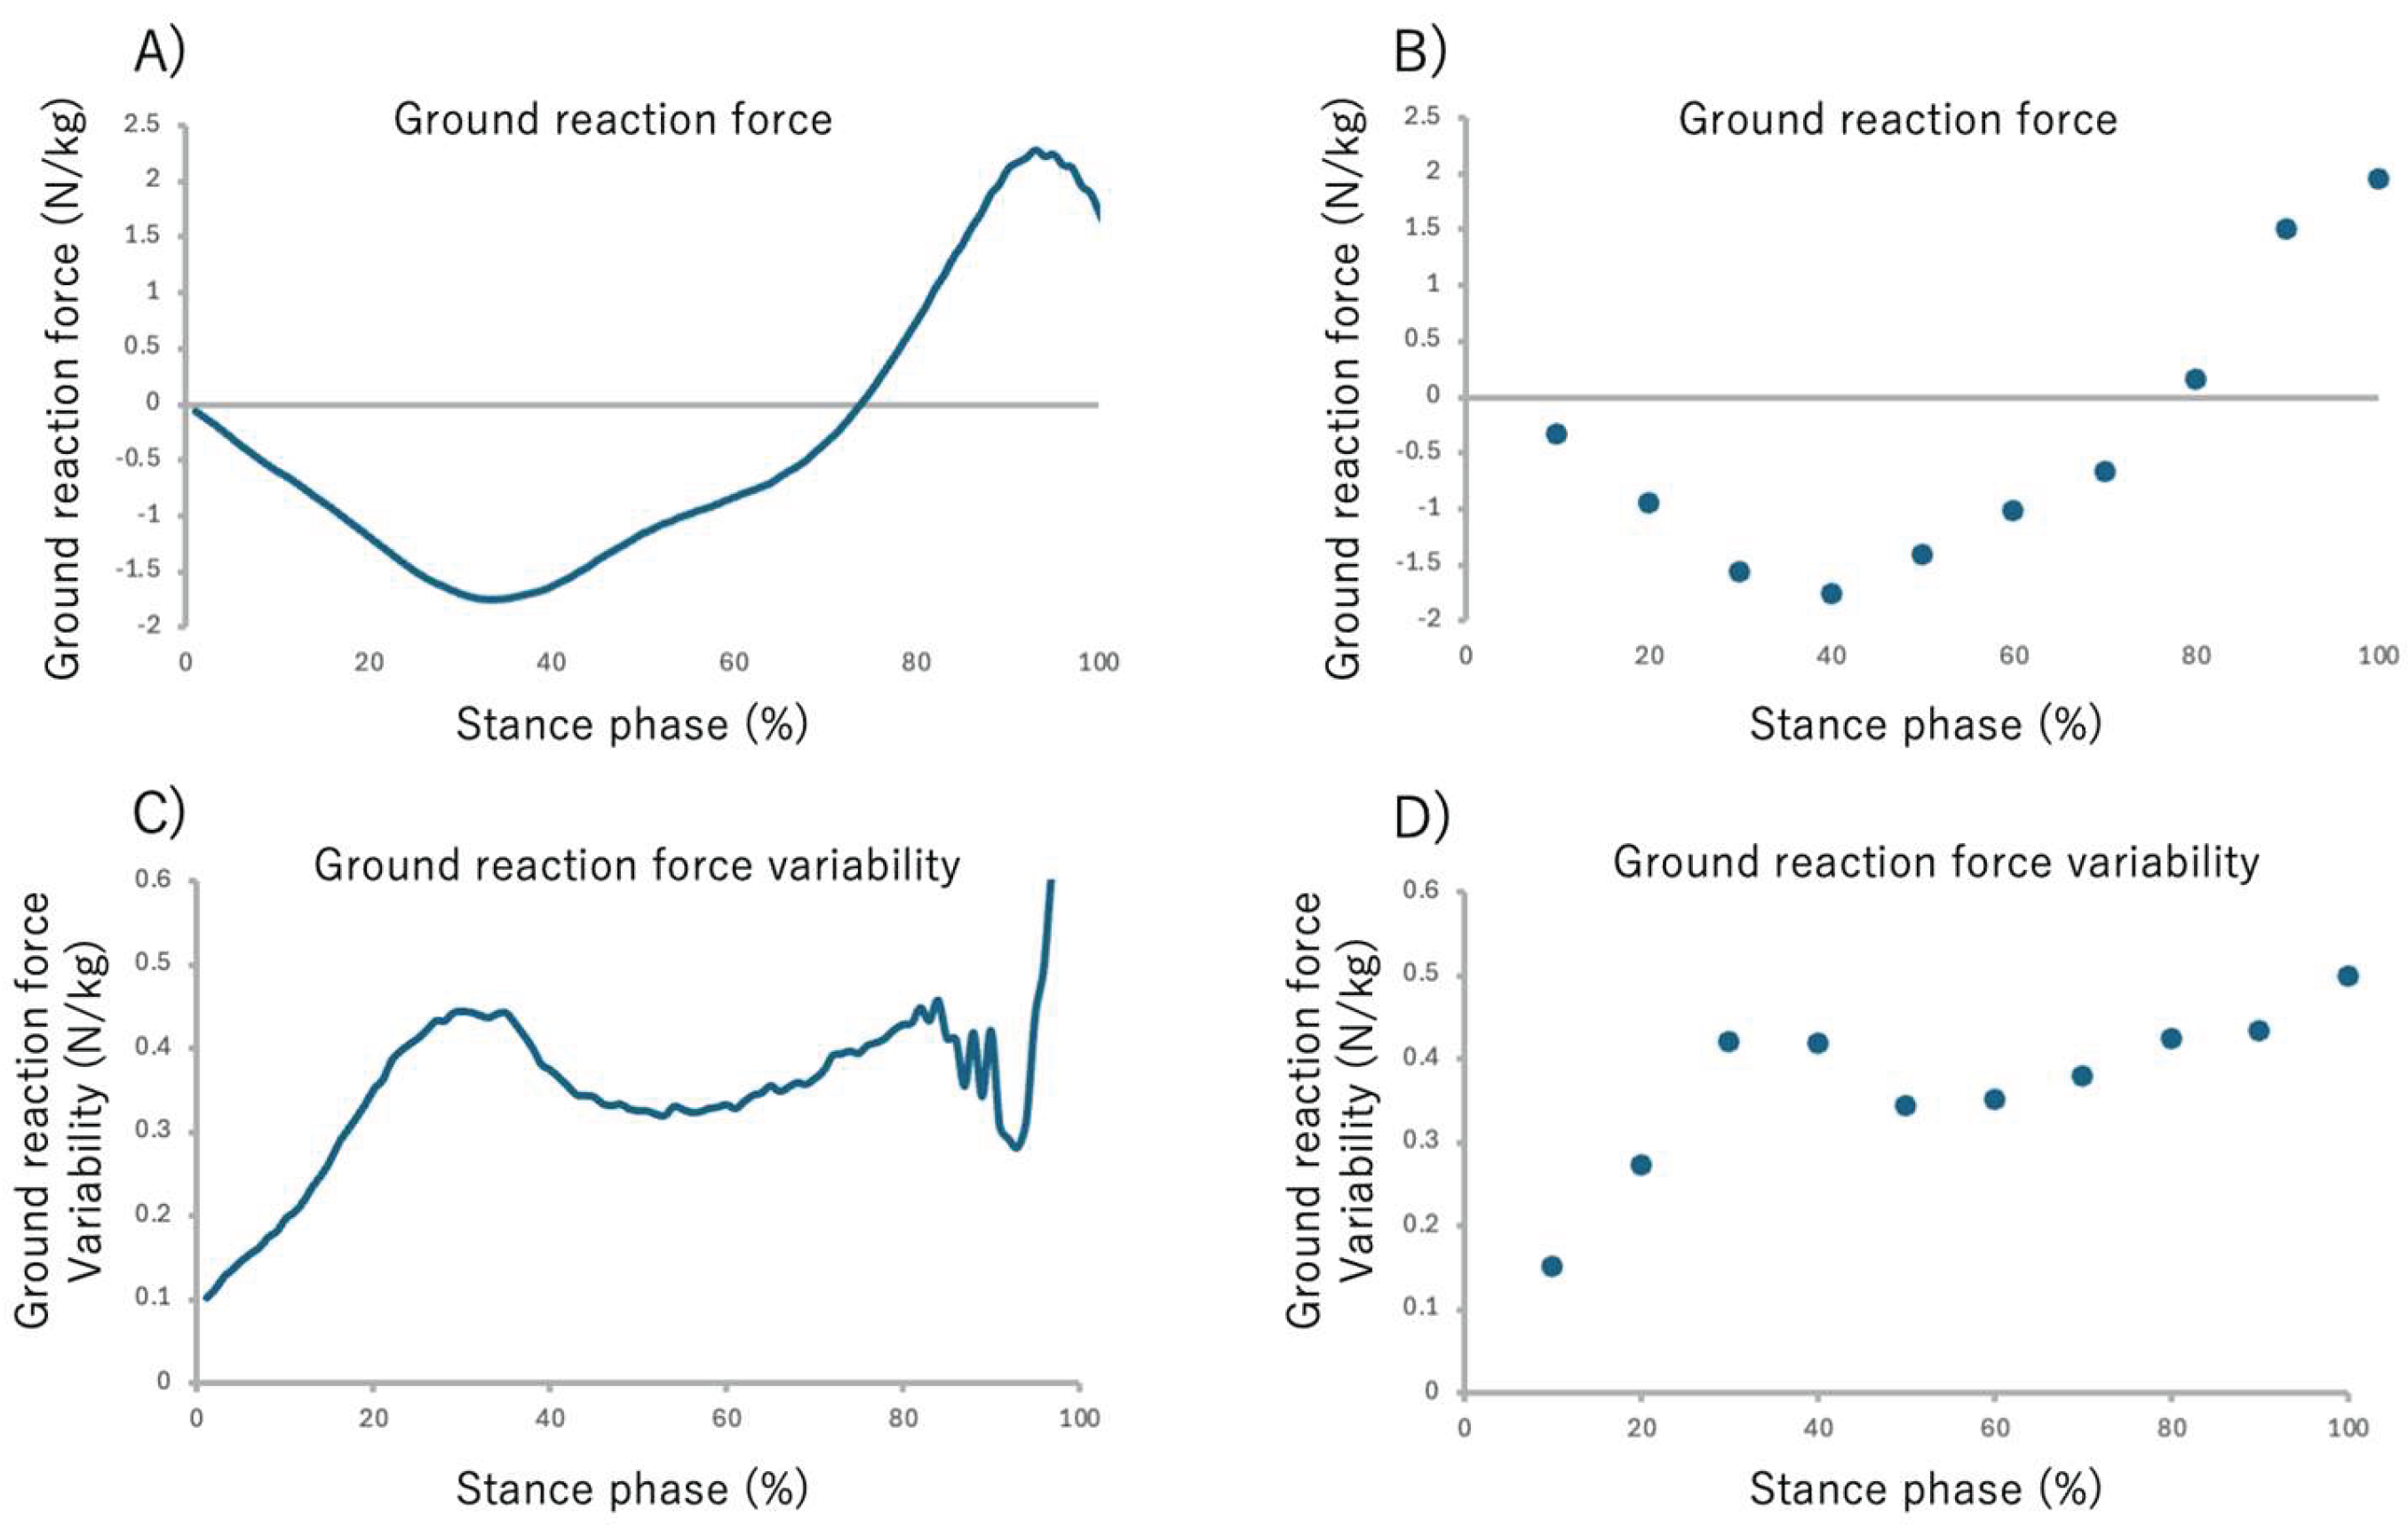
42]. The GRFs calculated for each sensor during the gait cycle were then time-normalized to 0% at heel strike and 100% at toe-off, and finally, the data were normalized by the participant’s body weight. The time-normalize GRF data for the stance phase (from 0% to 100%) were averaged into 10% intervals to facilitate comparison across the stance phase. This yielded ten data points representing the GRF at each 10% interval of the stance phase (
Figure 4 A, B).
2.6. Ground Reaction Force Variability
The GRF variability for each stance phase interval was calculated as follows: Initially, the standard deviation (SD) of the body-weight-normalized GRF was calculated across the 30 gait cycles. To quantify GRF variability within each stance sub-phase interval, the GRF SD data were divided into 10% intervals[
43], and the mean SD for each sub-phase was subsequently calculated. This yielded ten data points representing the GRF at each 10% interval of the stance phase. (
Figure 4 C, D).
2.7. Statistical Analysis
Statistical analyses in this study were performed using JMP Pro 17 (SAS Institute Inc., Cary, North Carolina, USA) and MATLAB R2023b (Math Works, Massachusetts, USA). An unpaired t-test was used to compare the following between post-stroke patients and controls: age, height, body weight, and gait speed. A χ2 test was used to compare sex and cane usage between the groups.
To clarify the differences in GRF and GRF variability across stance sub-phase during walking, we performed a three-group comparison using the paretic side, the non-paretic side, and the age-matched control’s left side as factors. Given that GRF and GRF variability in stance phase are related to gait speed[
44,
45], we used a linear mixed model (LMM) with gait speed as a fixed effect to exclude its influence from the GRF and GRF variability comparison across stance sub-phase. The effect size and statistical power were calculated for each value. The effect size (η
2) was defined as follows: large (
), medium (
) and small (
)[
46]. Sufficient statistical power (1 - β) was defined as
0.80[
46].A Tukey-Kramer multiple comparison test was performed for the post hoc analysis.
Spearman’s rank correlation coefficient, adjusted for gait speed, was used to examine the association between GRF variability of the significant stance sub-phase and total and sub-item scores on the BBS. The significant sub-phases were those identified in the comparison among the paretic side, the non-paretic side, and the age-matched control’s left side.
The BBS sub-items on which all post-stroke participants achieved the maximum score were excluded from the correlation analysis. The correlation coefficients were classified as weak (r
0.50), moderate (0.50
r
0.79), strong (0.80
r)[
47].
Post-stroke patients were divided faller group and non-faller group based on their fall status. Wilcoxon rank-sum test was used to compare the physical characteristics and clinical assessment results of these two groups. Furthermore, for stance sub-phase showing significant differences compared to the control’s left side, we performed group comparisons (faller group vs non-faller group) for GRF and GRF variability. For this comparison, the difference in characteristics was statistically adjusted by first calculating the residuals of the least squares method for any significantly different characteristics between the two groups and subsequently comparing these residuals using the Wilcoxon rank-sum test. The effect size (r) was defined as follows: large (
0.50), medium (
0.30), small (
0.10)[
48].
The p value 0.05 was considered significant.
3. Results
3.1. Participant Characteristics
A total of 20 post-stroke patients and 20 age-matched controls met the inclusion criteria and participated in the measurements. A robust regression analysis based on Huber estimation was performed to identify outliers in the AP and V GRF variability. Data with residuals greater than four times the standard deviation from the mean were excluded as outliers. The final analysis included 16 post-stroke patients and 19 age-matched controls.
Table 1 summarizes the demographic and clinical characteristics of the stroke survivors and age-matched controls. The groups were well-matched for age, sex ratio, height, and body weight.
Table 1 showed, cane use was significantly higher, and gait speed was significantly lower, in the stroke group. Specifically, five post-stroke patients and zero controls used a cane during measurement, and one post-stroke patient and zero controls regularly used a lower limb orthosis in daily life. Clinical diagnoses, along with FMA-L, BBS, and SIAS scores for the post-stroke patients, are also presented.
3.2. Comparison of GRF Across Stance Sub-Phase Among the Paretic Side, Non-Paretic Side and Control’s Left Side
Tables A2 show the results of comparing AP GRF among the three groups after adjusting for gait speed. There were no significant differences in AP GRF among the paretic side, the non-paretic side, and the age-matched control’s left side at any point in the stance sub-phase.
Tables A3 show the results of comparing V GRF among the three groups after adjusting for gait speed. No significant differences were observed in V GRF among the paretic side, the non-paretic side and the age-matched control’s left side at any point in the stance sub-phase.
3.3. Comparison of GRF Variability Across Stance Sub-Phase Among the Paretic Side, Non-Paretic Side and Control’s Left Side
Tables 2 show the results of comparing AP GRF variability across stance sub-phase for the three groups after adjusting for gait speed. AP GRF variability showed a significant intergroup difference during the 91 – 100% stance sub-phase as pre-swing phase (F = 3.721, p = 0.038). Post hoc analysis showed the paretic side was significantly lower than the age-matched control’s left side in the 91 – 100% stance sub-phase (p = 0.030).
Table 2.
Comparison of anteroposterior ground reaction force variability during gait among the paretic side, the non-paretic side in post-stroke patients and age-matched control’s left side, adjusted for gait speed.
Table 2.
Comparison of anteroposterior ground reaction force variability during gait among the paretic side, the non-paretic side in post-stroke patients and age-matched control’s left side, adjusted for gait speed.
| |
paretic side |
non-paretic side |
control |
F value |
p value |
η2
|
1 - β |
| Number |
16 |
19 |
|
|
|
|
| Stance phase (%) |
|
|
|
|
|
| 1 - 10% |
0.445(-0.414) |
0.411(0.387) |
0.284(0.349) |
0.971 |
0.389 |
0.042 |
0.227 |
| 11 - 20% |
1.027(0.800) |
0.967(0.654) |
0.487(0.542) |
1.068 |
0.355 |
0.027 |
0.163 |
| 21 - 30% |
1.222(0.999) |
1.192(0.776) |
0.605(0.704) |
1.111 |
0.341 |
0.029 |
0.169 |
| 31 - 40% |
1.222(1.131) |
1.226(0.826) |
0.543(0.804) |
1.324 |
0.280 |
0.041 |
0.227 |
| 41 - 50% |
1.128(1.274) |
1.152(0.836) |
0.324(0.910) |
1.798 |
0.181 |
0.062 |
0.336 |
| 51 - 60% |
1.100(1.443) |
1.054(0.935) |
0.148(1.124) |
1.171 |
0.322 |
0.039 |
0.215 |
| 61 - 70% |
1.049(1.701) |
0.895(1.142) |
0.178(1.357) |
0.473 |
0.627 |
0.017 |
0.113 |
| 71 - 80% |
0.668(1.845) |
0.611(1.322) |
0.815(1.435) |
0.240 |
0.789 |
0.001 |
0.054 |
| 81 - 90% |
0.324(1.350) |
0.139(1.043) |
1.387(0.989) |
1.327 |
0.283 |
0.021 |
0.135 |
| 91 - 100% |
0.479(0.551) |
0.463(0.661) |
1.167(0.781) |
3.721 |
0.038* |
0.232 |
0.937 |
| mean (Standard deviation), “Linear mixed model *: p < 0.05 |
Table A4 show the results of comparing V GRF variability across the stance sub-phase among the three groups after adjusting for gait speed. No significant differences were observed in the V GRF variability across the entire stance phase among the paretic side, the non-paretic side, and the age-matched control’s left side.
3.4. Association Between GRF Variability and Balance Ability Across Stance Sub-Phase in Post-Stroke Patients
Table 3 shows the results of the partial correlation analysis adjusted for gait speed between AP GRF variability and BBS scores. The analysis focused on the 91 – 100%stance sub-phase as pre-swing phase of the paretic side because this stance sub-phase showed a significant difference compared to the control’s left side. No significant correlation was found between AP GRF variability during the 91%-100% stance sub-phase on the paretic side and total or sub-item scores on the BBS in post-stroke patients.
3.5. Differences in GRF and GRF Variability Between the Faller Group and Non-Faller Group of Post-Stroke Patients
Table 4 shows the fall status and physical characteristics of the faller group and non-faller group of post-stroke patients. Four post-stroke participants were classified into the faller group. There were no significant differences between the two groups regarding age, height, body weight, cane usage, gait speed, diagnosis, days post-stroke, paretic side, use of an ankle-foot orthosis, or results for the FMA-L, BBS, Short FES-I, hip flexion and knee extension tests in SIAS.
The AP GRF variability was significantly lower in the faller group across several stance sub-phase: 11 – 20% stance sub-phase (p = 0.045), 41 - 50% stance sub-phase (p = 0.045), 51 - 60% stance sub-phase (p = 0.034) and 61 - 70% stance sub-phase (p = 0.034) (
Table 5).
No significant difference of GRF were between faller group and non-faller group (
Table A5).
4. Discussion
This study examined differences in ground reaction force (GRF) variability across the stance phase between the paretic and non-paretic sides of post-stroke patients and the left side of age-matched controls, as well as its relationship with balance ability. Our findings demonstrated that anteroposterior (AP) GRF variability on the paretic side was significantly lower than controls during the 91–100% stance phase. Furthermore, among post-stroke patients, those with a history of falls exhibited markedly lower AP GRF variability on the paretic side across the 11–70% stance phase than non-fallers. To our knowledge, this is the first study to reveal that reduced AP GRF variability during the late stance phase is a distinctive feature of post-stroke gait, and that further reductions across multiple stance sub-phases are associated with a history of falls.
4.1. GRF During Gait in Post-Stroke Patients
After adjusting for gait speed as a covariate, no significant differences were found in AP or V GRF between the paretic and non-paretic sides of post-stroke patients and the age-matched control’s left side. Previous findings showing that GRF increases with gait speed, with V GRF increasing in healthy individuals and AP GRF increasing in post-stroke patients[
44,
49,
50]. Given that the gait speed of our post-stroke patients was significantly lower than that of the age-matched controls, the absence of significant differences in AP and V GRF values can be attributed to the adjustment for gait speed as a covariate. While previous studies reported lower GRF in post-stroke patients compared to healthy adults, those investigations did not adjust for gait speed[
16,
17]. Our findings are considered different from these prior reports because our group comparisons controlled for gait speed as a covariate.
4.2. GRF Variability During Gait in Post-Stroke Patients
Contrary to our initial hypothesis of increased gait variability in post-stroke patients, our results revealed that AP GRF variability within the 91%-100% stance sub-phase in post stroke patients was significantly lower than age-matched control’s left side, with a large effect size. While previous research has shown that gait variability generally increases with walking speed in parameters such as V GRF and stride length[
45], the significant difference in AP GRF variability between the paretic side and the age-matched control’s left side persisted even after adjusting for gait speed. This finding suggests that the control system prioritizes suppressing GRF variability during the pre-swing phase on the paretic side, regardless of walking speed. This strategy of suppression appears consistent with reports that post-stroke patients prioritize mediolateral control during complex center of mass (COM) movements[
51], potentially reflecting a mechanism to reduce movement variability and increase stability in complex control phase [
51,
52]. The pre-swing phase is a complex control period[
22,
23,
24], requiring simultaneous forward propulsion via concentric plantarflexor power and shock absorption by increasing contralateral ankle plantarflexion moment[
53,
54,
55]. However, post-stroke patients demonstrate reduced ankle plantarflexion power during the pre-swing phase[
56]. Therefore, due to impaired control of the paretic ankle plantarflexor muscles, post-stroke patients may suppress AP GRF variability to maintain gait stability.
4.3. Association Between GRF Variability During Gait and Balance Ability
We found no direct association between paretic side AP GRF variability and balance ability in post-stroke patients. While studies of patients with spinal cord injuries have shown that greater gait variability is associated with reduced balance ability[
28], those analyses did not adjust for gait speed. In healthy individuals, V GRF variability increasing with increasing gait speed[
45]. Furthermore, a positive correlation has been observed between BBS scores and gait speed in post-stroke patients[
57]. This suggests that gait speed may act as a confounder for the relationship between AP GRF variability and the BBS. Additionally, the BBS is known to exhibit a ceiling effect when used with high-functioning subjects[
58]. The mean BBS score of our stroke survivors was higher than previously reported fall risk cut-off scores (49 points[
57]), the BBS may not have been sensitive enough to reflect subtle differences among the stroke survivors in our study. Therefore, the lack of an association found between AP GRF variability and the BBS score can be attributed to two main possibilities: 1) the potential action of walking speed as a confounding factor, and 2) the reduced sensitivity of the BBS due to its ceiling effect.
4.4. The Difference of GRF Variability Characteristics Between Faller and Non-Faller Groups
The AP GRF variability on the paretic side was significantly lower in the faller group during the 11 – 20%, 41 – 50%, 51 – 60%, and 61 – 70% stance sub-phases, these results were sufficient effect size. This finding contradicts previous research showing an increase in GRF variability when healthy individuals walk in unstable environments[
31]. The required coefficient of friction (RCOF), which is calculated as the ratio of horizontal GRF to vertical GRF (the horizontal GRF / the V GRF), serves as an index of fall risk due to slipping[
59,
60]. In healthy individuals, the RCOF increases during foot contact and lift-off, which consequently increases the risk of falling[
59,
61,
62]. In this study, the stance sub-phase in which AP GRF variability was reduced approximated the points at which the RCOF was known to increase in previous study[
60]. Therefore, maintaining a low RCOF may require strict control of AP GRF values, which was related to the horizontal GRF. In fact, it has been reported that an increase in the RCOF during walking increases the incidence of falls by approximately 1.7 times in healthy individuals[
59]. Furthermore, post-stroke patients who experience falls have also exhibited reduced gait speed variability[
63], suggesting an association between decreased variability during walking and the occurrence of falls. The decreased AP GRF variability observed in the faller group therefore suggests a strict control of the AP GRF pattern during each gait cycle, thereby potentially compensating for walking instability.
4.5. Limitation
This study has several limitations, 1) our cohort of stroke survivors presented with relatively mild motor and balance impairments. Given that the severity of motor paralysis significantly influences GRF[
49], the trends in GRF variability may differ in patients with more severe impairments. Future studies should investigate GRF variability stratified by the severity of motor dysfunction. 2) Although a significant difference was found between the faller and non-faller groups, the faller group had a smaller sample size. However, the result of this study demonstrated a sufficient effect size. While previous studies have shown a relationship between falling and gait variability[
27,
28], increasing the sample size and balancing the groups in future research may reveal new insights. 3) We did not standardize the condition of cane use during measurement. Given that cane use can improve walking speed and stride in patients with speeds between0.4 to 0.8m/sec[
64], future study designs should account for this influence by setting conditions with and without cane use. 4) The fixed sizing of the sensor shoes used may not have perfectly matched every participant’s foot dimensions. Given that the sensors are placed directly on the sole of the shoe, potential errors may exist between the anatomically defined sensor location and the actual sensor position. However, the portability of the sensor shoes allowed us to measure continuous variability over 30 gait cycles, a novel aspect of this study that is difficult to replicate using traditional force plates for measurement. 5) We used only the left-side GRF data from the healthy controls for comparison. While comparing both sides of healthy controls with the paretic and non-paretic sides of stroke patients might yield different trends, previous studies report that exhibits high bilateral symmetry during walking in healthy individuals[
65]. Therefore, using only the left side for group comparison is expected to have a minimal impact on our overall findings.
5. Conclusions
In post-stroke patients, AP GRF variability on the paretic side during the 91 – 100% stance sub-phase was significantly lower than in controls, and no significant correlation was found between AP GRF variability in this stance sub-phase and the BBS score. Furthermore, post-stroke patients who experienced falls exhibited a significant reduction in AP GRF variability during the 11 – 20%, 41 – 50%, 51 – 60%, 61 – 70% stance sub-phases on the paretic side. These findings suggested that post-stroke patients primarily control AP GRF variability during the critical transition from the stance phase to the swing phase. In contrast, in those who experienced falls, the suppression of AP GRF variability across approximately half of the stance phase intervals may suggest that this excessive suppression of variability is associated with decreased walking stability and increased fall risk.
Author Contributions
Conceptualization, T.Y. and S.E.; methodology, D.N., K.H., Y.S., T.K., T.N. and S.E.; software, D.N., K.H., Y.S, T.Y., H.M., Y.N., Y.S. and J.H. ; validation, D.N., K.H., and Y.S.; formal analysis, D.N., K.H., and Y.S.; investigation, D.N., K.H., and Y.S.; resources, D.N., K.H., Y.S., T.Y. and S.E.; data curation, D.N., K.H., Y.S.,T.Y., H.M., Y.N., D.H. and K.W.; writing—original draft preparation, D.N., K.H., and Y.S.; writing—review and editing, D.N., K.H., Y.S.,T.Y., and S.E.; supervision, S.E.; project administration, S.E.; funding acquisition, D.N. All authors have read and agreed to the published version of the manuscript.
Funding
This work was supported by JSPS KAKENHI, Grant Number JP 25H00362, and The APC was funded by Tohoku university.
Institutional Review Board Statement
The study was conducted in accordance with the Declaration of Helsinki, and the study protocol was approved in advance by the Ethics Committee of Tohoku university graduate school of medicine (approval number: 2024-1-086) and the Ethics Committee of Southern TOHOKU second hospital (approval number: 118 - B)
Informed Consent Statement
Written informed consent has been obtained from the patient(s) to publish this paper.
Data Availability Statement
The data, including graphs, within this paper are available from the corresponding author upon reasonable request.
Acknowledgments
We extend our deepest gratitude to the Department of Rehabilitation Medicine, Tohoku University Graduate School of Medicine, for their valuable advice and guidance throughout this study. We are also profoundly grateful to the members of the Graduate School of Engineering, Tohoku University, and the Research Institute for Electromagnetic materials for their technical guidance, assistance with the measurement and use of the shoe sensor, and support with the analysis program and its maintenance. Finally, we wish to thank the staff of the Department of Rehabilitation at southern Tohoku second hospital and all the participants who generously volunteered their time for this measurement.
Conflicts of Interest
The authors declare no conflicts of interest.
Table A1.
Intraclass Correlation Coefficients (ICC 1,2) for anteroposterior (AP) and vertical (V) Ground Reaction Force Values Measured by the shoe Sensor system.
Table A1.
Intraclass Correlation Coefficients (ICC 1,2) for anteroposterior (AP) and vertical (V) Ground Reaction Force Values Measured by the shoe Sensor system.
| Stance phase (%) |
Anteroposterior |
Vertical |
| 10% |
0.604 |
0.491 |
| 20% |
0.596 |
0.544 |
| 30% |
0.569 |
0.557 |
| 40% |
0.642 |
0.620 |
| 50% |
0.720 |
0.675 |
| 60% |
0.727 |
0.689 |
| 70% |
0.710 |
0.716 |
| 80% |
0.699 |
0.705 |
| 90% |
0.735 |
0.714 |
| 100% |
0.752 |
0.872 |
Intraclass correlation coefficients (1,2).
Table A2.
Comparison of anteroposterior ground reaction force during gait among the paretic side, the non-paretic side in post-stroke patients and age-matched control’s left side, adjusted for gait speed.
Table A2.
Comparison of anteroposterior ground reaction force during gait among the paretic side, the non-paretic side in post-stroke patients and age-matched control’s left side, adjusted for gait speed.
| |
paretic side |
non-paretic side |
control |
F value |
p value |
η2
|
1 - β |
| Number |
16 |
19 |
|
|
|
|
| Stance phase (%) |
|
|
|
|
|
| 1 - 10% |
0.445(-0.414) |
0.411(0.387) |
0.284(0.349) |
0.569 |
0.572 |
0.035 |
0.203 |
| 11 - 20% |
1.027(0.800) |
0.967(0.654) |
0.487(0.542) |
2.277 |
0.121 |
0.128 |
0.658 |
| 21 - 30% |
1.222(0.999) |
1.192(0.776) |
0.605(0.704) |
2.309 |
0.118 |
0.116 |
0.605 |
| 31 - 40% |
1.222(1.131) |
1.226(0.826) |
0.543(0.804) |
1.823 |
0.180 |
0.119 |
0.617 |
| 41 - 50% |
1.128(1.274) |
1.152(0.836) |
0.324(0.910) |
1.638 |
0.213 |
0.138 |
0.697 |
| 51 - 60% |
1.100(1.443) |
1.054(0.935) |
0.148(1.124) |
1.765 |
0.190 |
0.133 |
0.679 |
| 61 - 70% |
1.049(1.701) |
0.895(1.142) |
0.178(1.357) |
2.564 |
0.095 |
0.142 |
0.715 |
| 71 - 80% |
0.668(1.845) |
0.611(1.322) |
0.815(1.435) |
2.998 |
0.066 |
0.181 |
0.837 |
| 81 - 90% |
0.324(1.350) |
0.139(1.043) |
1.387(0.989) |
1.143 |
0.332 |
0.209 |
0.900 |
| 91 - 100% |
0.479(0.551) |
0.463(0.661) |
1.167(0.781) |
1.060 |
0.360 |
0.207 |
0.897 |
| mean (Standard deviation), Linear mixed model, *: p < 0.05 |
Table A3.
Comparison of vertical ground reaction force during gait among the paretic side, the non-paretic side in post-stroke patients and age-matched control’s left side, adjusted for gait speed.
Table A3.
Comparison of vertical ground reaction force during gait among the paretic side, the non-paretic side in post-stroke patients and age-matched control’s left side, adjusted for gait speed.
| |
paretic side |
non-paretic side |
control |
F value |
p value |
η2
|
1 - β |
| Number |
16 |
19 |
|
|
|
|
| Stance phase (%) |
|
|
|
|
|
|
|
| 1 - 10% |
0.825(0.228) |
0.759(0.209) |
0.858(0.201) |
0.311 |
0.735 |
0.038 |
0.218 |
| 11 - 20% |
2.178(0.928) |
1.800(0.659) |
2.153(0.504) |
2.160 |
0.131 |
0.057 |
0.313 |
| 21 - 30% |
2.977(1.033) |
2.664(0.927) |
2.957(0.793) |
1.750 |
0.191 |
0.024 |
0.151 |
| 31 - 40% |
3.379(0.792) |
3.229(1.048) |
3.412(0.898) |
0.582 |
0.565 |
0.008 |
0.080 |
| 41 - 50% |
3.653(0.988) |
3.518(1.176) |
3.789(0.916) |
0.112 |
0.895 |
0.013 |
0.099 |
| 51 - 60% |
4.112(1.289) |
4.204(1.439) |
4.287(0.959) |
0.074 |
0.929 |
0.004 |
0.063 |
| 61 - 70% |
4.720(1.288) |
5.383(1.282) |
4.691(1.208) |
0.772 |
0.470 |
0.063 |
0.340 |
| 71 - 80% |
4.941(1.193) |
6.198(1.928) |
4.832(1.420) |
1.640 |
0.208 |
0.144 |
0.722 |
| 81 - 90% |
3.621(0.790) |
4.752(1.955) |
4.104(1.053) |
1.710 |
0.196 |
0.106 |
0.561 |
| 91 - 100% |
1.106(0.217) |
1.332(0.999) |
1.504(0.420) |
2.192 |
0.127 |
0.068 |
0.368 |
| mean (standrd deviation), “Linear mixed model, *: p < 0.05” |
Table A4.
Comparison of vertical ground reaction force variability during gait among the paretic side, the non-paretic side in post-stroke patients and age-matched control’s left side, adjusted for gait speed.
Table A4.
Comparison of vertical ground reaction force variability during gait among the paretic side, the non-paretic side in post-stroke patients and age-matched control’s left side, adjusted for gait speed.
| |
paretic side |
non-paretic side |
control |
F value |
p value |
η2
|
1 - β |
| Number |
16 |
19 |
|
|
|
|
| Stance phase (%) |
|
|
|
|
|
|
|
| 1 - 10% |
0.825(0.228) |
0.759(0.209) |
0.858(0.201) |
0.140 |
0.870 |
0.016 |
0.114 |
| 11 - 20% |
2.178(0.928) |
1.800(0.659) |
2.153(0.504) |
0.090 |
0.914 |
0.004 |
0.063 |
| 21 - 30% |
2.977(1.033) |
2.664(0.927) |
2.957(0.793) |
0.027 |
0.974 |
0.003 |
0.063 |
| 31 - 40% |
3.379(0.792) |
3.229(1.048) |
3.412(0.898) |
0.396 |
0.676 |
0.024 |
0.149 |
| 41 - 50% |
3.653(0.988) |
3.518(1.176) |
3.789(0.916) |
1.001 |
0.378 |
0.045 |
0.253 |
| 51 - 60% |
4.112(1.289) |
4.204(1.439) |
4.287(0.959) |
0.753 |
0.479 |
0.036 |
0.205 |
| 61 - 70% |
4.720(1.288) |
5.383(1.282) |
4.691(1.208) |
0.453 |
0.640 |
0.030 |
0.175 |
| 71 - 80% |
4.941(1.193) |
6.198(1.928) |
4.832(1.420) |
0.593 |
0.560 |
0.042 |
0.233 |
| 81 - 90% |
3.621(0.790) |
4.752(1.955) |
4.104(1.053) |
0.597 |
0.556 |
0.036 |
0.204 |
| 91 - 100% |
1.106(0.217) |
1.332(0.999) |
1.504(0.420) |
1.341 |
0.275 |
0.055 |
0.302 |
| mean (standrd deviation), Linear mixed model, *: p < 0.05 |
Table A5.
Comparison of anteroposterior ground reaction force during gait between the faller and non-faller groups in post-stroke patients, adjusted for sex and orthosis.
Table A5.
Comparison of anteroposterior ground reaction force during gait between the faller and non-faller groups in post-stroke patients, adjusted for sex and orthosis.
| |
Faller |
non-Faller |
p value |
effect size r |
| Number |
4 |
12 |
|
|
| Stance phase (%) |
|
|
|
|
| 1-10% |
0.723 (0.217) |
0.352 (0.429) |
0.856 |
0.045 |
| 11-20% |
1.514 (0.310) |
0.865 (0.855) |
0.762 |
0.076 |
| 21-30% |
1.913 (0.594) |
0.992 (1.017) |
0.505 |
0.167 |
| 31-40% |
2.277 (0.624) |
0.871 (1.048) |
0.303 |
0.258 |
| 41-50% |
2.445 (0.738) |
0.689 (1.107) |
0.130 |
0.379 |
| 51-60% |
2.542 (0.646) |
0.619 (1.310) |
0.079 |
0.440 |
| 61-70% |
2.764 (0.581) |
0.477(1.558) |
0.102 |
0.409 |
| 71-80% |
2.596 (0.547) |
0.025 (1.661) |
0.130 |
0.379 |
| 81-90% |
0.997 (1.078) |
0.764 (1.151) |
0.163 |
0.349 |
| 91-100% |
0.063 (0.648) |
0.618 (0.463) |
0.671 |
0.106 |
| mean (standard deviation) , Wilcoxon rank-sum test, *: p < 0.05 |
References
- Vieira, E.R.; Palmer, R.C.; Chaves, P.H.M. Prevention of Falls in Older People Living in the Community. BMJ (Online) 2016, 353. [Google Scholar] [CrossRef]
- Sarah F Tyson; Marie Hanley; Joy Chillala; Andrea Selley; Raymond C Tallis Balance Disability After Stroke; 2006.
- Skvortsov, D. V.; Kaurkin, S.N.; Grebenkina, N. V.; Ivanova, G.E. Typical Changes in Gait Biomechanics in Patients with Subacute Ischemic Stroke. Diagnostics 2025, 15. [Google Scholar] [CrossRef]
- Herbert P. von, Schroeber; Richard D., Coutts; Patrick D., Lyden; Edmund Billings, Jr.; Vernon, L. A: Gait Parameters Following Stroke, 1995.
- Schmid, A.A.; Yaggi, H.K.; Burrus, N.; McClain, V.; Austin, C.; Ferguson, J.; Fragoso, C.; Sico, J.J.; Miech, E.J.; Matthias, M.S.; et al. Circumstances and Consequences of Falls among People with Chronic Stroke. J Rehabil Res Dev 2013, 50, 1277–1286. [Google Scholar] [CrossRef]
- Weerdesteyn, V.; De Niet, M.; Van Duijnhoven, H.J.R.; Geurts, A.C.H. Falls in Individuals with Stroke. J Rehabil Res Dev 2008, 45, 1195–1214. [Google Scholar] [CrossRef] [PubMed]
- Batchelor, F.A.; Mackintosh, S.F.; Said, C.M.; Hill, K.D. Falls after Stroke. International Journal of Stroke 2012, 7, 482–490. [Google Scholar] [CrossRef]
- Jørgensen, L.; Engstad, T.; Jacobsen, B.K. Higher Incidence of Falls in Long-Term Stroke Survivors Than in Population Controls Depressive Symptoms Predict Falls After Stroke; 2002.
- Goto, Y.; Otaka, Y.; Suzuki, K.; Inoue, S.; Kondo, K.; Shimizu, E. Incidence and Circumstances of Falls among Community-Dwelling Ambulatory Stroke Survivors: A Prospective Study. Geriatr Gerontol Int 2019, 19, 240–244. [Google Scholar] [CrossRef] [PubMed]
- Lee, D.; Cho, I.Y.; Chang, W.H.; Yoo, J.E.; Choi, H.L.; Park, J.; Shin, D.W.; Han, K. Fracture Risk among Stroke Survivors According to Poststroke Disability Status and Stroke Type. Stroke 2024, 55, 1498–1506. [Google Scholar] [CrossRef]
- Karisik, A.; Dejakum, B.; Moelgg, K.; Granna, J.; Felicetti, S.; Pechlaner, R.; Mayer-Suess, L.; Toell, T.; Buergi, L.; Scherer, L.; et al. Incidence, Characteristics, and Consequences of Fractures after Acute Ischemic Stroke and TIA—A Prospective Cohort Study. International Journal of Stroke 2025. [Google Scholar] [CrossRef]
- Feng, M.; Zhang, J.; Shen, H.; Hu, H.; Cao, L. Predictors of Prognosis for Elderly Patients with Poststroke Hemiplegia Experiencing Hip Fractures. Clin Orthop Relat Res 2009, 467, 2970–2978. [Google Scholar] [CrossRef] [PubMed]
- Brough, L.G.; Klute, G.K.; Neptune, R.R. Biomechanical Response to Mediolateral Foot-Placement Perturbations during Walking. J Biomech 2021, 116. [Google Scholar] [CrossRef]
- Debelle, H.; Maganaris, C.N.; O’Brien, T.D. Biomechanical Mechanisms of Improved Balance Recovery to Repeated Backward Slips Simulated by Treadmill Belt Accelerations in Young and Older Adults. Front Sports Act Living 2021, 3. [Google Scholar] [CrossRef] [PubMed]
- Cikajlo, I.; Matjačić, Z. Directionally Specific Objective Postural Response Assessment Tool for Treatment Evaluation in Stroke Patients. In Proceedings of the IEEE Transactions on Neural Systems and Rehabilitation Engineering; February 2009; Vol. 17; pp. 91–100. [Google Scholar]
- Pan, J.W.; Sidarta, A.; Wu, T.L.; Kwong, W.H.P.; Ong, P.L.; Tay, M.R.J.; Phua, M.W.; Chong, W.B.; Ang, W.T.; Chua, K.S.G. Unraveling Stroke Gait Deviations with Movement Analytics, More than Meets the Eye: A Case Control Study. Front Neurosci 2024, 18. [Google Scholar] [CrossRef]
- Jeon, H.M.; Chung, E.H.; Bak, S.Y.; Kim, H.; Shin, S.; Baek, H.; Kim, M.Y. Comparison of Biomechanical Parameters in Lower Limb Joints of Stroke Patients According to Conventional Evaluation Scores during Level Walking. Front Bioeng Biotechnol 2024, 12. [Google Scholar] [CrossRef] [PubMed]
- Chen, C.-Y.; Paul, ; Hong, W.-H.; Chen, C.-L.; Shih, ; Chou, W.; Wu, C.-Y.; Cheng, P.-T.; Tang, ; Fuk-Tan; Chen, H.-C. Ground Reaction Force Patterns in Stroke Patients with Various Degrees of Motor Recovery Determined by Plantar Dynamic Analysis; 2007; Vol. 30.
- Dean, J.C.; Bowden, M.G.; Kelly, A.L.; Kautz, S.A. Altered Post-Stroke Propulsion Is Related to Paretic Swing Phase Kinematics. Clinical Biomechanics 2020, 72, 24–30. [Google Scholar] [CrossRef]
- Ohta, M.; Tanabe, S.; Tamari, M.; Katsuhira, J. Patterns of Change in Propulsion Force and Late Braking Force in Patients with Stroke Walking at Comfortable and Fast Speeds. Sci Rep 2024, 14. [Google Scholar] [CrossRef]
- Ohta, M.; Tanabe, S.; Katsuhira, J.; Tamari, M. Kinetic and Kinematic Parameters Associated with Late Braking Force and Effects on Gait Performance of Stroke Patients. Sci Rep 2023, 13. [Google Scholar] [CrossRef]
- Rabuffetti, M.; Bovi, G.; Quadri, P.L.; Cattaneo, D.; Benvenuti, F.; Ferrarin, M. An Experimental Paradigm to Assess Postural Stabilization: No More Movement and Not yet Posture. IEEE Transactions on Neural Systems and Rehabilitation Engineering 2011, 19, 420–426. [Google Scholar] [CrossRef]
- La Scaleia, V.; Ivanenko, Y.P.; Zelik, K.E.; Lacquaniti, F. Spinal Motor Outputs during Step-to-Step Transitions of Diverse Human Gaits. Front Hum Neurosci 2014, 8. [Google Scholar] [CrossRef]
- Bizovska, L.; Svoboda, Z.; Kutilek, P.; Janura, M.; Gaba, A.; Kovacikova, Z. Variability of Centre of Pressure Movement during Gait in Young and Middle-Aged Women. Gait Posture 2014, 40, 399–402. [Google Scholar] [CrossRef] [PubMed]
- Hamacher, D.; Singh, N.B.; Van Dieën, J.H.; Heller, M.O.; Taylor, W.R. Kinematic Measures for Assessing Gait Stability in Elderly Individuals: A Systematic Review. J R Soc Interface 2011, 8, 1682–1698. [Google Scholar] [CrossRef]
- Chau, T.; Young, S.; Redekop, S. Managing Variability in the Summary and Comparison of Gait Data. J Neuroeng Rehabil 2005, 22. [Google Scholar] [CrossRef] [PubMed]
- Isho, T.; Tashiro, H.; Usuda, S. Accelerometry-Based Gait Characteristics Evaluated Using a Smartphone and Their Association with Fall Risk in People with Chronic Stroke. Journal of Stroke and Cerebrovascular Diseases 2015, 24, 1305–1311. [Google Scholar] [CrossRef] [PubMed]
- Yamasaki, Y.; Arai, T.; Takaishi, S.; Takamura, H.; Maruki, H. Increased Stride Time Variability Is Associated with a Higher Risk of Falls in Patients with Ataxia after Stroke. Physiother Theory Pract 2024, 40, 2916–2924. [Google Scholar] [CrossRef]
- Lord, S.; Howe, T.; Greenland, J.; Simpson, L.; Rochester, L. Gait Variability in Older Adults: A Structured Review of Testing Protocol and Clinimetric Properties. Gait Posture 2011, 34, 443–450. [Google Scholar] [CrossRef]
- Brach, J.S.; Berlin, J.E.; Vanswearingen, J.M.; Newman, A.B.; Studenski, S.A. Too Much or Too Little Step Width Variability Is Associated with a Fall History in Older Persons Who Walk at or near Normal Gait Speed. 2005. [Google Scholar] [CrossRef]
- Warmerdam, E.; Burger, L.M.; Mergen, D.F.; Orth, M.; Pohlemann, T.; Ganse, B. The Walking Surface Influences Vertical Ground Reaction Force and Centre of Pressure Data Obtained with Pressure-Sensing Insoles. Front Digit Health 2024, 6. [Google Scholar] [CrossRef]
- Liu, J.; Kim, H. Bin; Wolf, S.L.; Kesar, T.M. Comparison of the Immediate Effects of Audio, Visual, or Audiovisual Gait Biofeedback on Propulsive Force Generation in Able-Bodied and Post-Stroke Individuals. Applied Psychophysiology Biofeedback 2020, 45, 211–220. [Google Scholar] [CrossRef]
- Kowalski, E.; Catelli, D.S.; Lamontagne, M. A Waveform Test for Variance Inequality, with a Comparison of Ground Reaction Force during Walking in Younger vs. Older Adults. J Biomech 2021, 127. [Google Scholar] [CrossRef] [PubMed]
- Alam, Z.; Rendos, N.K.; Vargas, A.M.; Makanjuola, J.; Kesar, T.M. Timing of Propulsion-Related Biomechanical Variables Is Impaired in Individuals with Post-Stroke Hemiparesis. Gait Posture 2022, 96, 275–278. [Google Scholar] [CrossRef]
- Fugl-Meyer A R, J.L.L.I.S.S. The Post Stroke Hemiplegic Patient. 1. A Method for Evaluation of Physical Performance. Scand J Rehabil Med 1975, 7, 13–31. [Google Scholar] [CrossRef]
- Chino, N.; Sonoda, S.; Domen, K.; Saitoh, E.; Kimura, A. Stroke Impairment Assessment Set (SIAS)-A New Evaluation Instrument for Stroke Patients.
- Berg Katherine; Wood-Dauphinee Sharon; Williams J. I; Gayton David Measuring Balance in the Elderly: Preliminary Development of an Instrument. Physiotherapy Canada 1989, 41, 304–311. [Google Scholar] [CrossRef]
- Kempen, G.I.J.M.; Yardley, L.; Van Haastregt, J.C.M.; Zijlstra, G.A.R.; Beyer, N.; Hauer, K.; Todd, C. The Short FES-I: A Shortened Version of the Falls Efficacy Scale-International to Assess Fear of Falling. Age Ageing 2008, 37, 45–50. [Google Scholar] [CrossRef] [PubMed]
- Hauer, K.; Lamb, S.E.; Jorstad, E.C.; Todd, C.; Becker, C. Systematic Review of Definitions and Methods of Measuring Falls in Randomised Controlled Fall Prevention Trials. Age Ageing 2006, 35, 5–10. [Google Scholar] [CrossRef] [PubMed]
- Nagano, H.; Sparrow, W.A.; Mizukami, K.; Sarashina, E.; Begg, R. A Cross-Sectional Study of Foot-Ground Clearance in Healthy Community Dwelling Japanese Cohorts Aged 50, 60 and 70 Years. BMC Geriatr 2021, 21. [Google Scholar] [CrossRef] [PubMed]
- Riva, F.; Bisi, M.C.; Stagni, R. Gait Variability and Stability Measures: Minimum Number of Strides and within-Session Reliability. Comput Biol Med 2014, 50, 9–13. [Google Scholar] [CrossRef]
- Yamaguchi, T.; Takahashi, Y.; Sasaki, Y. Prediction of Three-Directional Ground Reaction Forces during Walking Using a Shoe Sole Sensor System and Machine Learning. Sensors 2023, 23, 8985. [Google Scholar] [CrossRef]
- Matsumoto, H.; Tomosada, M.; Nishi, T.; Sasaki, Y.; Sakurai, R.; Yamaguchi, T. Comparing the Ground Reaction Forces, Toe Clearances, and Stride Lengths of Young and Older Adults Using a Novel Shoe Sensor System. Sensors 2024, 24. [Google Scholar] [CrossRef]
- Keller TS; Weisberger AM; Ray JL; Hasan SS; Shiavi RG; Spengler DM Relationship between Vertical Ground Reaction Force and Speed during Walking, Slow Jogging, and Running. Clinical Biomechanics 1996, 11, 253–259. [CrossRef]
- Jordan, K.; Challis, J.H.; Newell, K.M. Walking Speed Influences on Gait Cycle Variability. Gait Posture 2007, 26, 128–134. [Google Scholar] [CrossRef] [PubMed]
- Cohen, J. QUANTITATIVE METHODS IN PSYCHOLOGY A Power Primer.
- Knorr, S.; Brouwer, B.; Garland, S.J. Validity of the Community Balance and Mobility Scale in Community-Dwelling Persons After Stroke. Arch Phys Med Rehabil 2010, 91, 890–896. [Google Scholar] [CrossRef]
- Cohen, J. Statistical Power Analysis for the Behavioral Sciences Second Edition.
- Bowden, M.G.; Balasubramanian, C.K.; Neptune, R.R.; Kautz, S.A. Anterior-Posterior Ground Reaction Forces as a Measure of Paretic Leg Contribution in Hemiparetic Walking. Stroke 2006, 37, 872–876. [Google Scholar] [CrossRef]
- Biere, J.; Groen, B.E.; Ensink, C.J.; Nonnekes, J.; Keijsers, N.L.W. Gait Speed-Dependent Modulation of Paretic versus Non-Paretic Propulsion in Persons with Chronic Stroke. J Neuroeng Rehabil 2025, 22. [Google Scholar] [CrossRef] [PubMed]
- Kuramatsu, Y.; Yamamoto, Y.; Izumi, S.I. Sensorimotor Strategies in Individuals with Poststroke Hemiparesis When Standing up without Vision. Motor Control 2020, 24, 150–167. [Google Scholar] [CrossRef] [PubMed]
- Todorov, E.; Jordan, M.I. Optimal Feedback Control as a Theory of Motor Coordination. Nat Neurosci 2002, 5, 1226–1235. [Google Scholar] [CrossRef]
- Fickey, S.N.; Browne, M.G.; Franz, J.R. Biomechanical Effects of Augmented Ankle Power Output during Human Walking. Journal of Experimental Biology 2018, 221. [Google Scholar] [CrossRef]
- Neptune, R.R.; Kautz, S.A.; Zajac, F.E. Contributions of the Individual Ankle Plantar Flexors to Support, Forward Progression and Swing Initiation during Walking; 2001; Vol. 34;
- Winter, D.A. THE BIOMECHANICS AND MOTOR CONTROL OF HUMAN GAIT: NORMAL, ELDERLY, AND PATHOLOGICAL; 1992; Vol. 25;
- Jonkers, I.; Delp, S.; Patten, C. Capacity to Increase Walking Speed Is Limited by Impaired Hip and Ankle Power Generation in Lower Functioning Persons Post-Stroke. Gait Posture 2009, 29, 129–137. [Google Scholar] [CrossRef]
- Blum, L.; Korner-Bitensky, N. Usefulness of the Berg Balance Scale in Stroke Rehabilitation: A Systematic Review; 2008.
- Pardasaney, P.K.; Latham, N.K.; Jette, A.M.; Wagenaar, R.C.; Ni, P.; Slavin, M.D.; Bean, J.F. Sensitivity to Change and Responsiveness of Four Balance Measures for Community-Dwelling Older Adults; 2012.
- Beschorner, K.E.; Albert, D.L.; Redfern, M.S. Required Coefficient of Friction during Level Walking Is Predictive of Slipping. Gait Posture 2016, 48, 256–260. [Google Scholar] [CrossRef]
- Rozin Kleiner, A.F. Effects of Flooring and Hemi Body on Ground Reaction Forces and Coefficient of Friction in Stroke Gait. Int J Neurorehabil 2014, 01. [Google Scholar] [CrossRef]
- Redfern, M.S.; Dipasquale, J. Biomechanics of Descending Ramps; 1997; Vol. 6;
- Mark, S. Redfern; Rakie Cham; Krystyna Gielo Perczak; Raoul Gronqvist; Mikko Hirvonen; Hakan Lanshammar; Mark Marpet; Clive Yi-Chung Pai; Christopher Powers Biomechanics of Slips. Ergonomics 2001, 44, 1138–1166. [Google Scholar] [CrossRef]
- Bower, K.; Thilarajah, S.; Pua, Y.H.; Williams, G.; Tan, D.; Mentiplay, B.; Denehy, L.; Clark, R. Dynamic Balance and Instrumented Gait Variables Are Independent Predictors of Falls Following Stroke. J Neuroeng Rehabil 2019, 16. [Google Scholar] [CrossRef]
- Nascimento, L.R.; Ada, L.; Teixeira-Salmela, L.F. The Provision of a Cane Provides Greater Benefit to Community-Dwelling People after Stroke with a Baseline Walking Speed between 0.4 and 0.8 Metres/Second: An Experimental Study. Physiotherapy (United Kingdom) 2016, 102, 351–356. [Google Scholar] [CrossRef] [PubMed]
- Walter Herzog; Benno M. Nigg; Lynda J. Read; Ewa Olsson Asymmetries in Ground Reaction Force Patterns in Normal Human Gait. 1988, 21, 110–114.
|
Disclaimer/Publisher’s Note: The statements, opinions and data contained in all publications are solely those of the individual author(s) and contributor(s) and not of MDPI and/or the editor(s). MDPI and/or the editor(s) disclaim responsibility for any injury to people or property resulting from any ideas, methods, instructions or products referred to in the content. |
© 2025 by the authors. Licensee MDPI, Basel, Switzerland. This article is an open access article distributed under the terms and conditions of the Creative Commons Attribution (CC BY) license (http://creativecommons.org/licenses/by/4.0/).