
Submitted:
23 October 2025
Posted:
24 October 2025
You are already at the latest version
Preprints on COVID-19 and SARS-CoV-2
Abstract
The study develops an updated national Social Accounting Matrix (SAM) for Greece, aiming to support targeted policy design through SAM multiplier analysis. Based on the 2020 Greek Input-Output Table, the SAM includes 14 aggregated subsectors, while its construction and multiplier analysis were implemented in Python, producing reusable modular code. Output, value-added, and income multipliers were estimated using the Moore-Penrose pseudo-inverse via Singular Value Decomposition (SVD). Findings highlight the substantial role of government transfers in supporting household and firm incomes, largely due to COVID-19 relief measures. The analysis shows that production expansion in energy, construction, and wholesale and retail trade can stimulate broad economic activity, while service-related sectors play a critical role in income generation and equity considerations. At the same time, firms in trade, hospitality, and real estate were heavily affected by the pandemic shock. The study contributes to the literature by addressing the gap in multiplier analysis for the Greek economy and enhancing the understanding of how exogenous shocks propagate through the system.
Keywords:
multiplier effect
; fiscal police
; macroeconomic modeling
; exogenous shock
; COVID-19 economic impact
1. Introduction
1.1. Social Accounting Matrix (SAM)
A way through which governments can improve their policy systems is by adopting solutions offered through data-driven analytical approaches. Informed decision-making has always been essential in effective policy design [1,2,3,4]. There are several data-driven analytical approaches that can be potentially exploited at informed decision-making.
The focus of the current paper is the Social Accounting Matrix (SAM) framework. SAM constitutes another tool that can be used to facilitate informed decisions as it captures the interdependent economic activities of four entities of a country’s economy (households, firms, the government, and the rest of the world), allowing further assessment in order to identify key areas that can be optimized to boost growth and equity [5,6,7,8,9,10,11]. SAM portrays the macroeconomic accounts of a socio-economic system, which record the transactions between all economic units in an economic system along with the income redistribution (i.e., through taxation, transfer payments, welfare benefits) over a predefined accounting year, usually one year [6,7,10,12,13,14,15,16,17].
Given the fact that SAM focuses on the interconnections of the main economic entities, it constitutes a very useful analytical tool regarding the depiction of a complete picture of the functioning of an economy, the evaluation of policy implementations impacts, and finally the support in the design of specific models assessing the economic activity of a country or a region [6]. Specific to the latter, SAM offers the necessary inputs to certain models, the most important of which is the fixed-price multiplier model, allowing the adaptation and configuration of simple linear fixed coefficient models, and the computable general equilibrium (CGE) models [5,6,7,18,19]. All the above result in an extensive use of the analytical framework of SAM not only for assessing and presenting the economic structure of a country [20,21,22,23,24,25,26,27,28] or a region [29,30,31,32,33], but also for evaluating the impact of sudden endogenous/exogenous shocks on the whole of an economy or some parts of it [7,34,35,36,37,38,39,40,41].
Based on all the above an adequately designed SAM, which summarizes information found in national/regional accounts and input-output tables, offers sufficient information about the structural characteristics and interdependencies in an economy, effectively bridging the macroeconomic framework with economic entities. It is clear, therefore, that the structure of a SAM can potentially change, exactly like an economy needs to change when it has to respond to an economic, social or political shock. Thus, the use of a SAM provides enough transparency in the impact of such endogenous or exogenous shocks on income distribution; hence on labor market and poverty [7,12] rendering it a valuable tool for addressing equity concerns. Along with the multipliers analysis that further quantifies the structural representation of SAM, policymakers have a robust mechanism for evaluating the broader economic impact of policy decisions and exogenous/endogenous shocks [32].
During the past two decades, Greece has been facing significant and prolonged economic and social challenges jeopardizing the country’s sustainable growth and equitable development. After an extended debt crisis, the country faces slow economic recovery with persistent high unemployment rates and increasing regional inequalities [42,43]. The recent healthcare crisis, faced due to COVID-19 pandemic, has further deepened the encountered difficulties, rendering targeted fiscal policies essential in order to soothe them through more adequate resource allocation and income distribution. Hence, policymakers are in high need of vigorous analytical tools utilization to facilitate informed decision-making.
1.2. Social Accounting Matrix (SAM) in Greece
In Greece there are only a few efforts in designing a SAM The first ever SAMs that were designed for the Greek economy over two decades ago [44,45]; works in which researchers focused also on the subsequent multiplier analysis. In [41] the author further utilised the SAM designed to assess the impact of exogenous income injections on companies and households. Researchers that followed used these initially constructed SAMs to further analyse fiscal discrepancies [46], the impact of endogenous or exogenous shocks on taxation and the labor market [47,48]. The most recent SAM constructed for the whole of the Greek economy used the National Input and Output (I-O) Matrix for the year 2010 [49]. This specific SAM has been further utilized in a subsequent research [50] to analyse the effect of reducing borrowing that has occurred through the decrease of government spending. However, no multipliers analysis is considered in either of these papers. At a regional level, one encounters focus on rural regions in Greece to assess policy incentives [33] and SAMs constructed specifically for Central Macedonia [31] and Western Greece [32] using the 2010 I-O Matrix and offering a subsequent multipliers analysis specific to the region under consideration.
This study aims at constructing an updated national SAM for the entire Greek economy and using the SAM framework as a basis to inform targeted policy making through subsequent multipliers analysis. Therefore the contribution of this research is threefold: a) while previous national SAMs for Greece rely on older data (2010), this research contributes to the literature by offering more current insights into Greece’s economy as it considers the structural changes that have occurred in the recent post debt crisis and the ever changing global economic environment (development of new technologies, digital transformation, changes in energy production and distribution), which lead to significant changes in fiscal policies, labor market conditions and government spending; b) since the most recent national SAM for Greece did not include a multiplier analysis, this research fills this multiplier gap, hence facilitating the understanding of how various shocks propagate through the economy; and c) this research offers also an updated tool to better manage and predict effects of policy changes, which is deemed necessary in decision-making within the current economic climate in Greece.
2. Data and Empirical Method
2.1. SAM Construction
The SAM constructed in this study was derived from the 2020 Greek input-output matrix, which includes 65 sectors based on the NACE Rev. 2 of the European Union. However, to increase interpretation clarity of macroeconomic relationships and enhance the applicability of the SAM for policy analysis, we have designed a SAM with 14 aggregated subsectors (Table 1). This aggregation followed the one suggested by authors at [30] and also considered the structural characteristics of the Greek economy. It needs to be pointed out that for summating the sectors the relevance and contiguity of some sectors (i.e., N77 and N79 contiguity to tourism) or the professionals involved in the activities were considered.
The re-dimensioning of the original matrix followed these steps: First, we established aggregation criteria by identifying economic activities and similarities across subsectors to guide their merging, grouping similar industries or functions accordingly. Next, we created a mapping table that assigns each of the 65 subsectors in the initial I-O matrix to one of the 14 target subsectors. Finally, we applied group-by functions on the mapping table to generate a SAM with reduced, yet analytically meaningful, dimensions that preserve the economic relevance of each aggregated subsector through targeted consolidation. To perform the above analysis, Python was the programming language of choice. Python has emerged as a powerful tool in economic analysis, offering practitioners and researchers a versatile platform for handling complex financial data and economic modeling. Its extensive libraries, particularly “pandas” for data manipulation and “numpy” for numerical computations, make it ideal for processing economic datasets. Moreover, Python's “matplotlib” and “seaborn” libraries are capable of creating compelling and insightful visualizations that can assist in the interpretation of the produced results.
For constructing the 2020 SAM for the Greek economy the authors adopted the same methodological approach as that described in [26]. The 2020 macro-SAM constructed for the Greek economy considers four main entities and their interactions are presented in 6 accounts: activities and commodities, production factors (labor and capital), households/firms, general government, capital accounts (saving/investment), rest of the world (RoW). Table 2 presents the structure of the 2020 macro-SAM, designating the cells in which a payment between entities occurs. To construct a SAM, data from a variety of official sources needs to be brought together [6,7]. One common challenge faced in SAM studies is that of a gap in terms of data availability [20]. To construct the SAM for the year 2020 (2020 SAM) for the Greek economy we used official secondary data published by the Hellenic Statistical Authority (national accounts, I-O matrix, supply and use table, budget performance report, household survey), the Hellenic Ministry of Economy and Finance (balance sheet and financial statements of the central administration), and the Bank of Greece (balance of payments). The latest I-O matrix is published for the year 2020; hence this is the year of focus for this research.
In constructing the SAM under consideration, households and firms were considered as one entity – merged into a single institutional account – due to significant data limitations. Detailed, disaggregated information on income flows, capital earnings and inter-institutional transfers, which are necessary for separating these two entities, are unavailable in the Greek context. This challenge becomes greater due to the prevalence of small, family-owned businesses and self-employment where firm and household activities are often intertwined. Hence, merging the two entities ensures internal consistency, avoids speculative estimations that could undermine the SAM’s reliability and maintains the matrix’s usability for macroeconomic analysis and modeling. Given the fact that all data were extracted from national statistics, such as the main source of this research the 2020 I-O matrix, or from reports composed by the Bank of Greece and the Ministry of Economy and Finance, the same classification and estimation procedures were adopted so data did not reveal inconsistencies.
2.2. SAM-Based Multiplier Analysis
As discussed above SAM illustrates the economic interconnections (payments/receipts) made between entities in an economy clarifying critical aspects like the distribution of production and income. Further analysis though is deemed necessary to quantify the way in which the exogenous impact is disseminated in the economy. Hence, the macroeconomic presentation offered by SAM does not provide insights into the effects of exogenous (policy determined or external; demand-side or supply side) shocks in the output of each sector, the total value added to the economy or the income distribution among households [12]. As suggested in [7], SAM-based multipliers account for three types of economic impacts; direct, indirect and induced. Direct impacts are generated by direct output changes due to demand shocks, indirect impacts are generated by indirect output changes (associated to intermediate products) and induced effects on income and outputs are generated due to the (Keynesian) income-expenditure multipliers [7].
In the SAM-based multiplier analysis, to ensure that the inverse of the coefficient matrix will allow the multipliers to be computed the exogenous and endogenous accounts needs to be designated. In the present study, following the approach suggested in [19] – a rule of thumb for SAM studies – we considered all the transactions that are outside the influence of the domestic system as exogenous. Therefore, the accounts of government, capital (saving/investment) and the ROW are considered exogenous. The endogenous accounts focus on transactions between two entities (households and firms), which are associated through the factor and commodity markets.
Three different types of SAM-based multipliers were calculated for the purposes of the present study: output multipliers, value-added multipliers, and income multipliers. Output multiplier captures the overall production impact (both final and intermediate goods are considered); it measures the total increase in output across all economic sectors resulting from an initial change in demand for the products of one sector. Value-added multiplier assesses how much additional value-added is generated by a change in government spending or investment in terms of GDP (intermediate products are excluded). Income multiplier provides information regarding the impact of an increase in a sector’s production or spending on households’ income.
2.3. SAM Multiplies Computational Framework
Let the be divided into blocks as follows:
: is the submatrix representing transactions between endogenous sectors (e.g., households, production sectors),
: is the submatrix reflecting transactions from endogenous to exogenous sectors (government, rest of the world, and investment minus capital),
: is the submatrix reflecting transactions from exogenous to endogenous sectors,
: is the submatrix representing the transactions among the exogenous sectors themselves.
Since the government, rest of the world, and investment minus capital are considered exogenous, we focus on , and ignore for the purpose of calculating multipliers. The Leontief inverse is typically used to compute the multipliers in SAM analysis, capturing how changes in one sector propagate through the economy. In this case, the multipliers are derived from the matrix , where I is the identity matrix and , consisting of the coefficients that describe how each endogenous sector depends on the others. However, may not be invertible using the traditional matrix inversion method. This is due to dependencies between the sectors, meaning some sectors are linearly dependent on others, leading to a singular or near-singular matrix. In such cases, we proceed with calculating the Moore-Penrose pseudo-inverse. The Moore-Penrose pseudo-inverse is computed using Singular Value Decomposition (SVD) [51]. The matrix , can be factored as:
where:
- Q is an m x m orthogonal matrix containing the left singular vectors.
- Σ is m x n diagonal matrix containing the singular values of Aee.
- B is an n x n orthogonal matrix containing the right singular vectors.
- BT is the transpose of B.
Singular values, in Σ, are non-negative and arranged in descending order. If any singular value is zero, it indicates that the matrix is singular and not invertible in the traditional sense. To compute the Moore-Penrose pseudo-inverse for each non-zero singular value the is computed while each zero-singular value is left unchanged. Thus, the diagonal matrix is constructed which is the pseudo-inverse of Σ. Accordingly, the pseudo-inverse of , say , takes the following form: giving the Moore-Penrose pseudo-inverse which can now be used in place of the traditional inverse. Once the pseudo-inverse is computed, 1 is subtracted from the result to isolate the indirect multiplier effects. The result is the multiplier matrix , which captures how a shock in one sector propagates through the economy based on the linkages within the endogenous accounts.
3. Results
3.1. Interpretation the 2020 Greek Macro-SAM
The resulting 2020 SAM for the overall Greek economy is presented in Table 3. Based on the information included in this macro-SAM various macroeconomic figures can be obtained providing a more complete picture of Greece’s economy during the year under investigation. Approximately 45% and 55% of the Greek GDP for 2020 are derived from labor and capital, respectively, indicating that the Greek economy relies almost equally on both factors for meeting its production needs. Also, 15% of the domestic production is exported, whereas one third of what was produced domestically covers intermediate consumption. Moreover, 70% of households and firms’ income came from the production factors’ added value (income) and the remaining 30% was covered through government transfers. Another interesting point is that 41% of government’s income is derived from taxation (direct/indirect taxes). In 2020, the Greek economy experienced a fiscal deficit as it is clearly illustrated in the SAM constructed for this study. The account of Government transfers to the RoW had also a negative figure indicating net receipts from the RoW.
The most capital-intensive was “FSC1-Agriculture, forestry and fishing” in which 86% of the value-added was paid to capital. All service related FSCs were labor-intensive, having up to 70% of the value-added in these sectors to be paid to capital. Estimating trade shares, “FSC2-Manufacturing” and “FSC1-Agriculture, forestry and fishing” presented the highest import penetration ratios (IPRs); 0.47 and 0.41, respectively. The “FSC6-Transportation and storage” and “FSC2-Manufacturing” were the two subsectoral categories showing the highest export intensities ratios (EIRs) of 0.58 and 0.46, respectively. Private savings-to-investments ratio was estimated at 0.29 (<1); indicating that private investment exceeds private savings. Fiscal balance-to-GDP ratio was -15% indicating a fiscal deficit, which was also clearly illustrated in the respective SAM cell. Current account-to-GDP ratio was estimated at -7.4% indicating a trade deficit; the country is importing more than it is exporting. Last but not least, the estimated trade-to-GDP ratio was 75% indicating a high level of economic openness.
3.2. SAM Multiplier Analysis
Table 4 presents the output, value-added and income multipliers derived from the inverse matrix of the 2020 SAM for Greece. Since no factor taxes are considered while constructing the Greek 2020 SAM, income and value-added multipliers are the same. In the absence of factor taxes, all the output produced in the economy is effectively distributed as income to factors of production (labor and capital). In the Greek 2020 SAM, focusing on production and income distribution without accounting for government intervention, factor taxes might be omitted for simplification. This assumption allows the model to focus on the direct relationship between production and income distribution without the complexities of tax systems. The fact that there are no factor taxes ensures that both multipliers capture the same effect, as there are no intermediate deductions (like taxes) that would otherwise cause a divergence between the two. Hence, income and value-added multipliers are the same under these conditions.
The results suggest that the output multiplier effects are more significant in FSC3, FSC4 and FSC5 (output multiplier=2.30) – for the exact content of each FSC please consult Table 1. Output multipliers for FSC7, FSC8 and FSC10-FSC14 were also above 2 but less than 2.30. Regarding the value-added and income multiplier effects are more significant in FSC10 and FSC12 (value-added/income multipliers of 1.49 and 1.44, respectively). The remaining subsectoral categories reveal multiplier values (either output or value-added/income) close to or even lower than 1, indicating that any output, GDP or income change brought by an increase in demand of these sectors will potentially have a negligible impact in other sectors and hence the overall economy.
In Figure 1 the heatmap of multipliers is presented. This heatmap shows the actual effects between the 14 subsectoral categories; hence how much does one subsector influences another. It is only the activities account of FSC2-Manufacturing that seems to influence to a very small degree, even negligible since it is much lower than 1, other subsectors. However, households/firms account seems to be impacted the most by the exogenous shock experienced during the year under investigation (COVID-19 pandemic).
4. Discussion
The year for which this updated Greek SAM was constructed coincides with the initiation of the extensive response measures imposed by the Greek government in an effort to reduce the impact of the COVID-19 spread [52]. The financial aid offered by the Greek government both to firms and households [53,54] is highly likely to be reflected in this 30% of the households/firms’ income deriving from government transfers. Based on authors’ calculations this % contribution was just 20% in 2015; a year for which an interim Greek SAM has also been constructed – not presented in this paper. A similar % contribution has been presented in [32] for Western Greece; further supporting such a figure as closer to the usual Greek standards.
Greece was a net importer in 2020 (trade deficit of -7.4%) since it exported 15% of the total consumption, while it imported 20% of the total output, indicating the low level of integration with the rest of the world (negative current accounts). Greece has been traditionally relying on imports to cover industrial and manufacturing needs, including energy resources and raw materials [55]. However, it is vital for the Greek economy to maintain imports at a sustainable level (balanced external sector) to avoid unsustainable levels of foreign debt. The value of government transfers to RoW cell was negative indicating that the government is receiving net transfers from foreign entities (RoW) impacting the balance between domestic and international accounts. For the year under consideration, it is most likely this negative figure to be due to the financial assistance Greece received from EU aiming to overcome the unexpected consequences of the COVID-19 pandemic [53,54]. The Greek government utilized these financial resources, freeing up resources for domestic use, which was essential to ensure that all payments made by government could be successful given the low overall output in the economy (lock-down measurements and ceasing firms’ operations.
The characteristic of the 2020 Greek economy is that of high level of economic openness and involvement in international trade (trade-to-GDP ratio is 75%). The latter provides market opportunities for domestic producers, who can also exploit economies of scales and improved efficiencies. However, due to this approach the Greek economy is vulnerable to global economic fluctuations. The fiscal deficit that characterizes the Greek economy in 2020 (fiscal balance-to-GDP ratio of -15%) is a sign of a counter-cyclical policy and more specifically of the expansionary fiscal policy adopted by the government to stimulate economic growth during the downturn economic period brought by the COVID-19 pandemic.
Based on IRPs and EIRs estimated, 47% and 41% of the total demand in manufacturing and agriculture/forestry/fishing industries is covered by imports. Surprisingly enough 46% of what is produced in the manufacturing sector is exported indicating a discrepancy in what is needed and what is produced overall in the economy. It would be very important in the future to identify areas in which the domestic production could focus to rely less on exports for intermediate products. The estimate of private savings-to-investments ratio (0.29<1) indicates that private investment exceeds private savings and hence to finance its investments the private sector relies on either borrowing or drawing from past savings. Even though a value less than one could signal robust economic growth expectations it also reveals dependency on foreign capital. If the ratio value remains low, it might raise concerns about the long-term financial stability of the private sector and economy’s reliance on external funding. So ultimately this ratio needs to increase by boosting savings.
The findings of the SAM based multiplier analysis of the present study, specifically the output multipliers, were similar to those discussed in [32] for Western Greece, and [31] for Central Macedonia. More specifically for the whole of the Greek economy, the analysis revealed that a production impact on energy related (FSC3), construction related (FSC4) and wholesale and retail industries (FSC5) will generate a substantial economic activity to other sectors and the overall economy. More specifically, if demand in these sectors will increase by €1 this will lead to increased production across related sectors of 1.3 additional units. Energy and construction related industries are characterized by extensive supply chains, significant employment and substantial procurement of materials and services from other sectors, therefore verifying indeed a considerable increase in economic output that can be generated by an additional unit of spending in this sector. Similarly, investing in wholesale and retail industries, goods and services flow across the economy will be facilitated offering a significant boost on the overall Greek economy. Industries operating in services-related sectors contribute significantly to households and firms’ income and hence require attention in income distribution and equity preservation discussions. Service-related industries are typically more labor-intensive than other sectors, so they can create more job positions per unit of output. This is crucial for reducing unemployment, a key in poverty reduction. Furthermore, job positions in service-related industries cover a wide range of skills levels (low-skill to high-skill jobs). This inclusiveness helps in an even income distribution across societal segments, enhancing overcoming income inequality. Investing in services-related industries apart from the above direct impact in income distribution has also a direct impact on improvement citizens’ living standards by providing necessary services linked to overall quality of life (healthcare, education, hospitality).
5. Conclusions
The SAM framework along with the subsequent multiplier analysis constitutes an analytical tool to assess complex economic systems and facilitate informed decision-making in terms of targeted policies design, resources allocation, income distribution and societal equity achievement. This paper describes the most updated SAM for Greece, using the most recently published I-O and SU matrices for the year 2020. The 2020 Greek SAM reveals the interrelations between four economic entities, households, firms, government, and RoW in terms of production, income, consumption and capital accumulation. Since the latest published SAM for the Greek economy, a great number of structural changes have occurred. The tremendous technological advancements, the development of alternative energy sources, the debt crisis experienced and finally the global healthcare crisis has impacted and changed Greek economy’s dynamics. Therefore, the current analysis can potentially serve as a guide for targeting policy interventions or understanding the effects of economic shocks in a clear intuitive way. In addition, given the exact year of focus, this paper provides valuable insights in terms of the economic impacts Greece experienced due to a profound global exogenous shock, that of COVID-19 pandemic, during the initial even stages of its outbreak.
Moreover, the analysis that proceeded can lead to conclusions in terms of the attention the Greek government should pay on specific sectors. Focus on energy, construction and wholesale/retail sectors could potentially drive a broad-based economic growth and ensure broad-based income distribution. Policies offering incentives to firms operating in these sectors (i.e., tax cuts, financial support, subsidies), targeted investment (i.e., to improve logistics supply chain management and distribution networks, support renewable energy projects), skills development schemes tailor-made to these sectors and policies fostering innovation will provide a significant boost in these sectors, which will be translated into an economic growth. Lastly, it needs to be further noted that due to the adopted programming language (Python) for the analysis, this research could easily constitute the empirical basis for future studies at either national or regional level. By adopting a programming approach to perform the necessary analysis, an adaptable and capable tool has been developed, which could be amended accordingly in the future to cater needs of similar research either for the whole of the economy or specific regions.
Lastly, the limitations of this research needs to be discussed. First, the multipliers analysis adopted assume linear relationships between sectors, hence they do not account for capacity constraints or distributional effects of policies. Second, due to data limitations households and firms were considered as one entity while constructing the 2020 Greek SAM (for more details please see above). In future research it is of utmost importance to assess these two entities separately. Within this framework further disaggregation of the leading sectors in the Greek economy or the tax structure could also lead to a more detailed picture of the economy. Third, the year under investigation coincides with the outbreak of a global pandemic with deep economic impact for Greece. Hence, much of what is observed is too specific for this year and not all findings discussed could be considered to generally present the Greek reality. All policies implemented were tailor made to tackle those impacts.
Author Contributions
Conceptualization, A.M., G.K. and K.K.; methodology, A.M., G.K. and C.G.; software, C.G.; formal analysis, A.M., G.K. and C.G.; resources, A.M.; data curation, A.M. and G.K.; writing—original draft preparation, A.M.; writing—review and editing, A.M. and G.K.; visualization, A.M. and G.K.; supervision, K.K.; project administration, K.K.; funding acquisition, K.K. All authors have read and agreed to the published version of the manuscript.
Funding
The corresponding author was supported by a post-doctoral research scholarship granted by the Hellenic Ministry of Education and Religious Affairs (N. 25076/B9/F11/121/B/894/05-03-21) project “80136-Enhancing Research at the Hellenic Open University Schools” and implemented by the Special Account for Research Funds of the Hellenic Open University add:
Data Availability Statement
The original data used in this study are openly available in the repository of the Hellenic Statistical Authority at https://www.statistics.gr/en/home/; the repository of the Bank of Greece at https://www.bankofgreece.gr/; and the depository of the Hellenic Ministry of Economy and Finance at https://minfin.gov.gr/en/.
Conflicts of Interest
The authors declare no conflicts of interest.
References
- Capano, G.; Howlett, M. The Knowns and Unknowns of Policy Instrument Analysis: Policy Tools and the Current Research Agenda on Policy Mixes. SAGE Open 2020, 10. [CrossRef]
- Samuelson, W.F.; Marks, S.G.; Zagorsky, J.L. Managerial Economics, 9th ed.; Hoboken: Wiley, 2021.
- van Buuren, A.; Lewis, J.M.; Peters, B.G.; Voorberg, W. Improving public policy and administration: exploring the potential of design. Policy Politi- 2020, 48, 3–19. [CrossRef]
- Head W.B. Toward more “evidence-informed” policy making? Public Adm. Rev. 2016, 76, 472-484. [CrossRef]
- Mainar-Causape, A.J.; Ferrari, E.; McDonald, S. Social Accounting Matrices: basic aspects and main steps for estimation, Publications Office of the European Union: Luxemburg, 2018.
- Miller, R.E.; Blair, P.D. Input-Output Analysis. Foundations and Extensions, 2nd ed.; Cambridge University Press: Cambridge, 2009.
- Round, J. Chapter 14: Social Accounting Matrices and SAM-Based Multiplier Analysis. In The Impact of Economic Policies on Poverty and Income Distribution. Evaluation Techniques and Tools; Bourguignon, F., Pereira da Silva, L.A. Eds.; Oxford University Press: New York, 2003; pp. 301-324.
- Robinson, S.; Cattaneo, A.; El-Said, M. Updating and Estimating a Social Accounting Matrix Using Cross Entropy Methods. Econ. Syst. Res. 2001, 13, 47–64. [CrossRef]
- Pyatt, G. A SAM approach to modeling. J. Policy Model. 1988, 10, 327–352. [CrossRef]
- Pyatt, G.; Round, J.I. (eds). Social Accounting Matrices: A Basis for Planning. The World Bank: Washington DC, 1985.
- Byron, R.P. The Estimation of Large Social Account Matrices. J. R. Stat. Soc. Ser. A (General) 1978, 141, 359. [CrossRef]
- Leadership Group SAM. Handbook on Social Accounting Matrices and Labour Accounts. European Commission: Brussels, 2003.
- Reinert, K. A.; Roland-Holst, D.W. Social Accounting Matrices. In Applied Methods for Trade Policy Analysis: A Handbook; Francois, J.F., Reinert K.A. Eds.; Cambridge University Press: Cambridge, 1997; pp. 94-121.
- Keuning, J.S.; de Ruijter, W.A. Guidelines to the Construction of a Social Accounting Matrix. Rev. Income Wealth 1988, 34(1), 71-100. [CrossRef]
- Pyatt, G.; Thorbecke, E. Planning Techniques for a Better Future: a summary of a research project on planning for growth, redistribution and employment; International Labour Office: Geneva, 1976.
- Stone, R. Measurement of national income and the construction of social accounts. Studies and Reports on Statistical Methods, No. 7. United Nations: Geneva, 1947.
- Leontief, W.W. Quantitative Input and Output Relations in the Economic Systems of the United States. Rev. Econ. Stat. 1936, 18, 105. [CrossRef]
- Defourny, J.; Thorbecke, E. Structural Path Analysis and Multiplier Decomposition within a Social Accounting Matrix Framework. Econ. J. 1984, 94, 111. [CrossRef]
- Pyatt, G.; Round, J.I. Accounting and Fixed Price Multipliers in a Social Accounting Matrix Framework. Econ. J. 1979, 89, 850. [CrossRef]
- Althumairi, I.A. Constructing a social accounting matrix for Saudi Arabia: sources and methods. Appl. Econ. 2021, 53, 3474–3498. [CrossRef]
- Mainar-Causapé, A.J.; Boulanger, P.; Dudu, H.; Ferrari, E. Policy impact assessment in developing countries using Social Accounting Matrices: The Kenya SAM 2014. Rev. Dev. Econ. 2020, 24, 1128–1149. [CrossRef]
- van Seventer, D.; Tarp, F.; San, N.N.; Nu Htwe, S.T.; Thandar. A 2017 Social Accounting Matrix for Myanmar. WIDER Working Paper. No. 2020/66. UNU-WIDER: Helsinki, 2020.
- Santos, S. A Matrix Approach to the Socioeconomic Activity of a Country. Theor. Econ. Lett. 2018, 08, 1083–1135. [CrossRef]
- Fuentes-Saguar, P.D.; Mainar-Causapé, A.J.; Ferrari, E. The Role of Bioeconomy Sectors and Natural Resources in EU Economies: A Social Accounting Matrix-Based Analysis Approach. Sustainability 2017, 9, 2383. [CrossRef]
- Debowicz, D. A social accounting matrix for Iraq. J. Econ. Struct. 2016, 5, 1–19. [CrossRef]
- Breisinger, C.; Thomas, M.; Thurlow, J. Social Accounting Matrices and Multiplier Analysis. An Introduction with Exercises Food Security in Practice; International Food Policy Research Institute: Washington, DC, 2009.
- Chung-I Li, J. A 1998 Social Accounting Matrix (SAM) for Thailand. TMD Discussion Paper No. 95. International Food Policy Research Institute: Washington, DC, 2002.
- Adelman, I.; Taylor, J.E.; Vogel, S. Life in a Mexican village: A SAM perspective. J. Dev. Stud. 1988, 25, 5–24. [CrossRef]
- Pfunzo, R.; Bahta, Y.T.; Jordaan, H. Insights into the Impact of Irrigation Agriculture on the Economy of the Limpopo Province, South Africa: A Social Accounting Matrix Multiplier Analysis. Agriculture 2024, 14, 1086. [CrossRef]
- García Rodríguez, A.; Lazarou, N.; Mandras, G.; Salotti, S.; Thissen, M.; Kalvelagen, E. A NUTS-2 European Union interregional system of Social Accounting Matrices for the year 2017: The RHOMOLO V4 dataset. JRC Working Papers n Territorial Modelling and Analysis, No. 01/2023, European Commission, Joint Research Centre (JRC): Seville, 2023.
- Maniati, A.; Loizou, E.; Psaltopoulos, D.; Mattas, K. The regional economy of Central Macedonia: an application of the social accounting matrix. Agric. Finance Rev. 2021, 82, 765–774. [CrossRef]
- Alikaj, M.; Alexopoulos, Y. Analysis of the Economy of Region of Western Greece. An Application of the Social Accounting Matrix (SAM). Procedia Econ. Finance 2014, 14, 3–12. [CrossRef]
- Psaltopoulos, D.; Thomson, K.J.; Efstratoglou, S.; Kola, J.; Daouli, A. Regional social accounting matrices for structural policy analysis in lagging EU. Eur. Rev. Agric. Econ. 2004, 31, 149–178. [CrossRef]
- Mbanda, V.; Bonga-Bonga, L. The impact of public infrastructure investment on South Africa’s economy: evidence from social accounting matrix and computable general equilibrium-based approaches. Qual. Quant. 2024, 58, 3535–3558. [CrossRef]
- Kotsopoulos, N.; Haitsma, G.; Connolly, M.P.; Standaert, B. Estimating the money flow in the economy attributed to rotavirus disease and vaccination in the Netherlands using a Social Accounting Matrix (SAM) framework. Expert Rev. Pharmacoeconomics Outcomes Res. 2019, 20, 603–612. [CrossRef]
- Aray, H.; Pedauga, L.; Velázquez, A. Financial Social Accounting Matrix: a useful tool for understanding the macro-financial linkages of an economy. Econ. Syst. Res. 2017, 29, 486–508. [CrossRef]
- Philippidis, G.; Sanjuán, A.I.; Ferrari, E.; M'BArek, R. Employing social accounting matrix multipliers to profile the bioeconomy in the EU member states: is there a structural pattern?. Span. J. Agric. Res. 2014, 12, 913–926. [CrossRef]
- Seung, C.K.; Waters, E.C. Calculating impacts of exogenous output changes: application of a social accounting matrix (SAM) model to Alaska fisheries. Ann. Reg. Sci. 2012, 51, 553–573. [CrossRef]
- Allan, G.; Mcgregor, P.; Swales, K. The Importance of Revenue Sharing for the Local Economic Impacts of a Renewable Energy Project: A Social Accounting Matrix Approach. Reg. Stud. 2011, 45, 1171–1186. [CrossRef]
- Hartono, D.; Resosudarmo, B.P. The economy-wide impact of controlling energy consumption in Indonesia: An analysis using a Social Accounting Matrix framework. Energy Policy 2008, 36, 1404–1419. [CrossRef]
- Skountzos, T. Social accounting matrix multipliers in a developing economy: the case of Greece. Econ. Chang. Restruct. 1988, 22, 57–70. [CrossRef]
- Petrakis, E.P. The new political economy of Greece up to 2030. Plagrave Macmillan, 2020.
- Chodorow-Reich, G.; Karabarbounis, L.; Kekre, R. The Macroeconomics of the Greek Depression. Am. Ec. Rev. 2023, 113(9), 2411–57. [CrossRef]
- Skountzos, T.; Touribabas, N.; Livas, P.; Mattheos, G.; Anastassakou, Z. Social Accounting Matrix for the Greek Economy for Year 1975. Centre of Planning and Economic Research (KEPE): Athens, 1985. [In Greek].
- Panethimitakis, A. Greek Manufacture, Sectoral Multipliers of Social Accounting Matrices and Structural Path Analysis for 1975. Gutenberg: Athens, 1991. [In Greek].
- Zografakis, S.; Spathis, P. The end of fiscal deviations and their implications. Meeting the Greek labor market: features, developments and challenges. Bank of Greece: Athens, 2010. [In Greek].
- Sarris, A.; Zografakis, S.; Karfakis, P. Macroeconomic and Redistributional Impacts on the Greek Economy from a Reform of the Tax System: Empirical Analysis with the use of a Multisectoral General Equilibrium Model. Centre of Planning and Economic Research (KEPE): Athens, 2004.
- Zografakis, S.; Kontis, A.; Mitrakos, T. The impact of the employment of immigrants on the Greek economy. Hellenic Migration Policy Institute: Athens, 2008. [In Greek].
- Economidis, C. and Economides, A. (2018), “Using the Social Accounting Matrix to understand the Greek economic crisis”, East-West Journal of Economics and Business. Vol. 21 No. 1-2, pp. 119-133.
- Economidis, C. The Social Accounting Matrix, the reduction of borrowing through the reduction of government consumption and its effect on the Greek economy. Soc. Cohes. Dev. 2021, 13, 139–158. [CrossRef]
- Paige, C.C.; Saunders, M.A. Towards a Generalized Singular Value Decomposition. SIAM J. Numer. Anal. 1981, 18, 398–405. [CrossRef]
- Economou, C.; Kaitelidou, D.; Konstantakopoulou, O.; Vildiridi, L.V. Physical distancing - (Re)Imposition of stricter measures. European Observatory on Health Systems and Policies, World Health Organization, 2021.
- ESRB. European Systematic Risk Board. Available online: https://www.esrb.europa.eu/home/search/coronavirus/countries/html/esrb.covidpmc_greece.en.html (accessed on 12 September 2025).
- European Commission. Available online: https://commission.europa.eu/strategy-and-policy/coronavirus-response/supporting-jobs-and-economy-during-coronavirus-pandemic/state-aid-cases/greece_en (accessed on 12 October 2025).
- IOVE. The Greek Economy 4/18. Quarterly Report. ISSN 1106-4315. Available online: https://iobe.gr/docs/economy/ECO_Q4_2018_REP_GR.pdf (accessed on 12 September 2025). [In Greek].
Figure 1.
Multipliers heatmap. Source: Authors’ calculations.
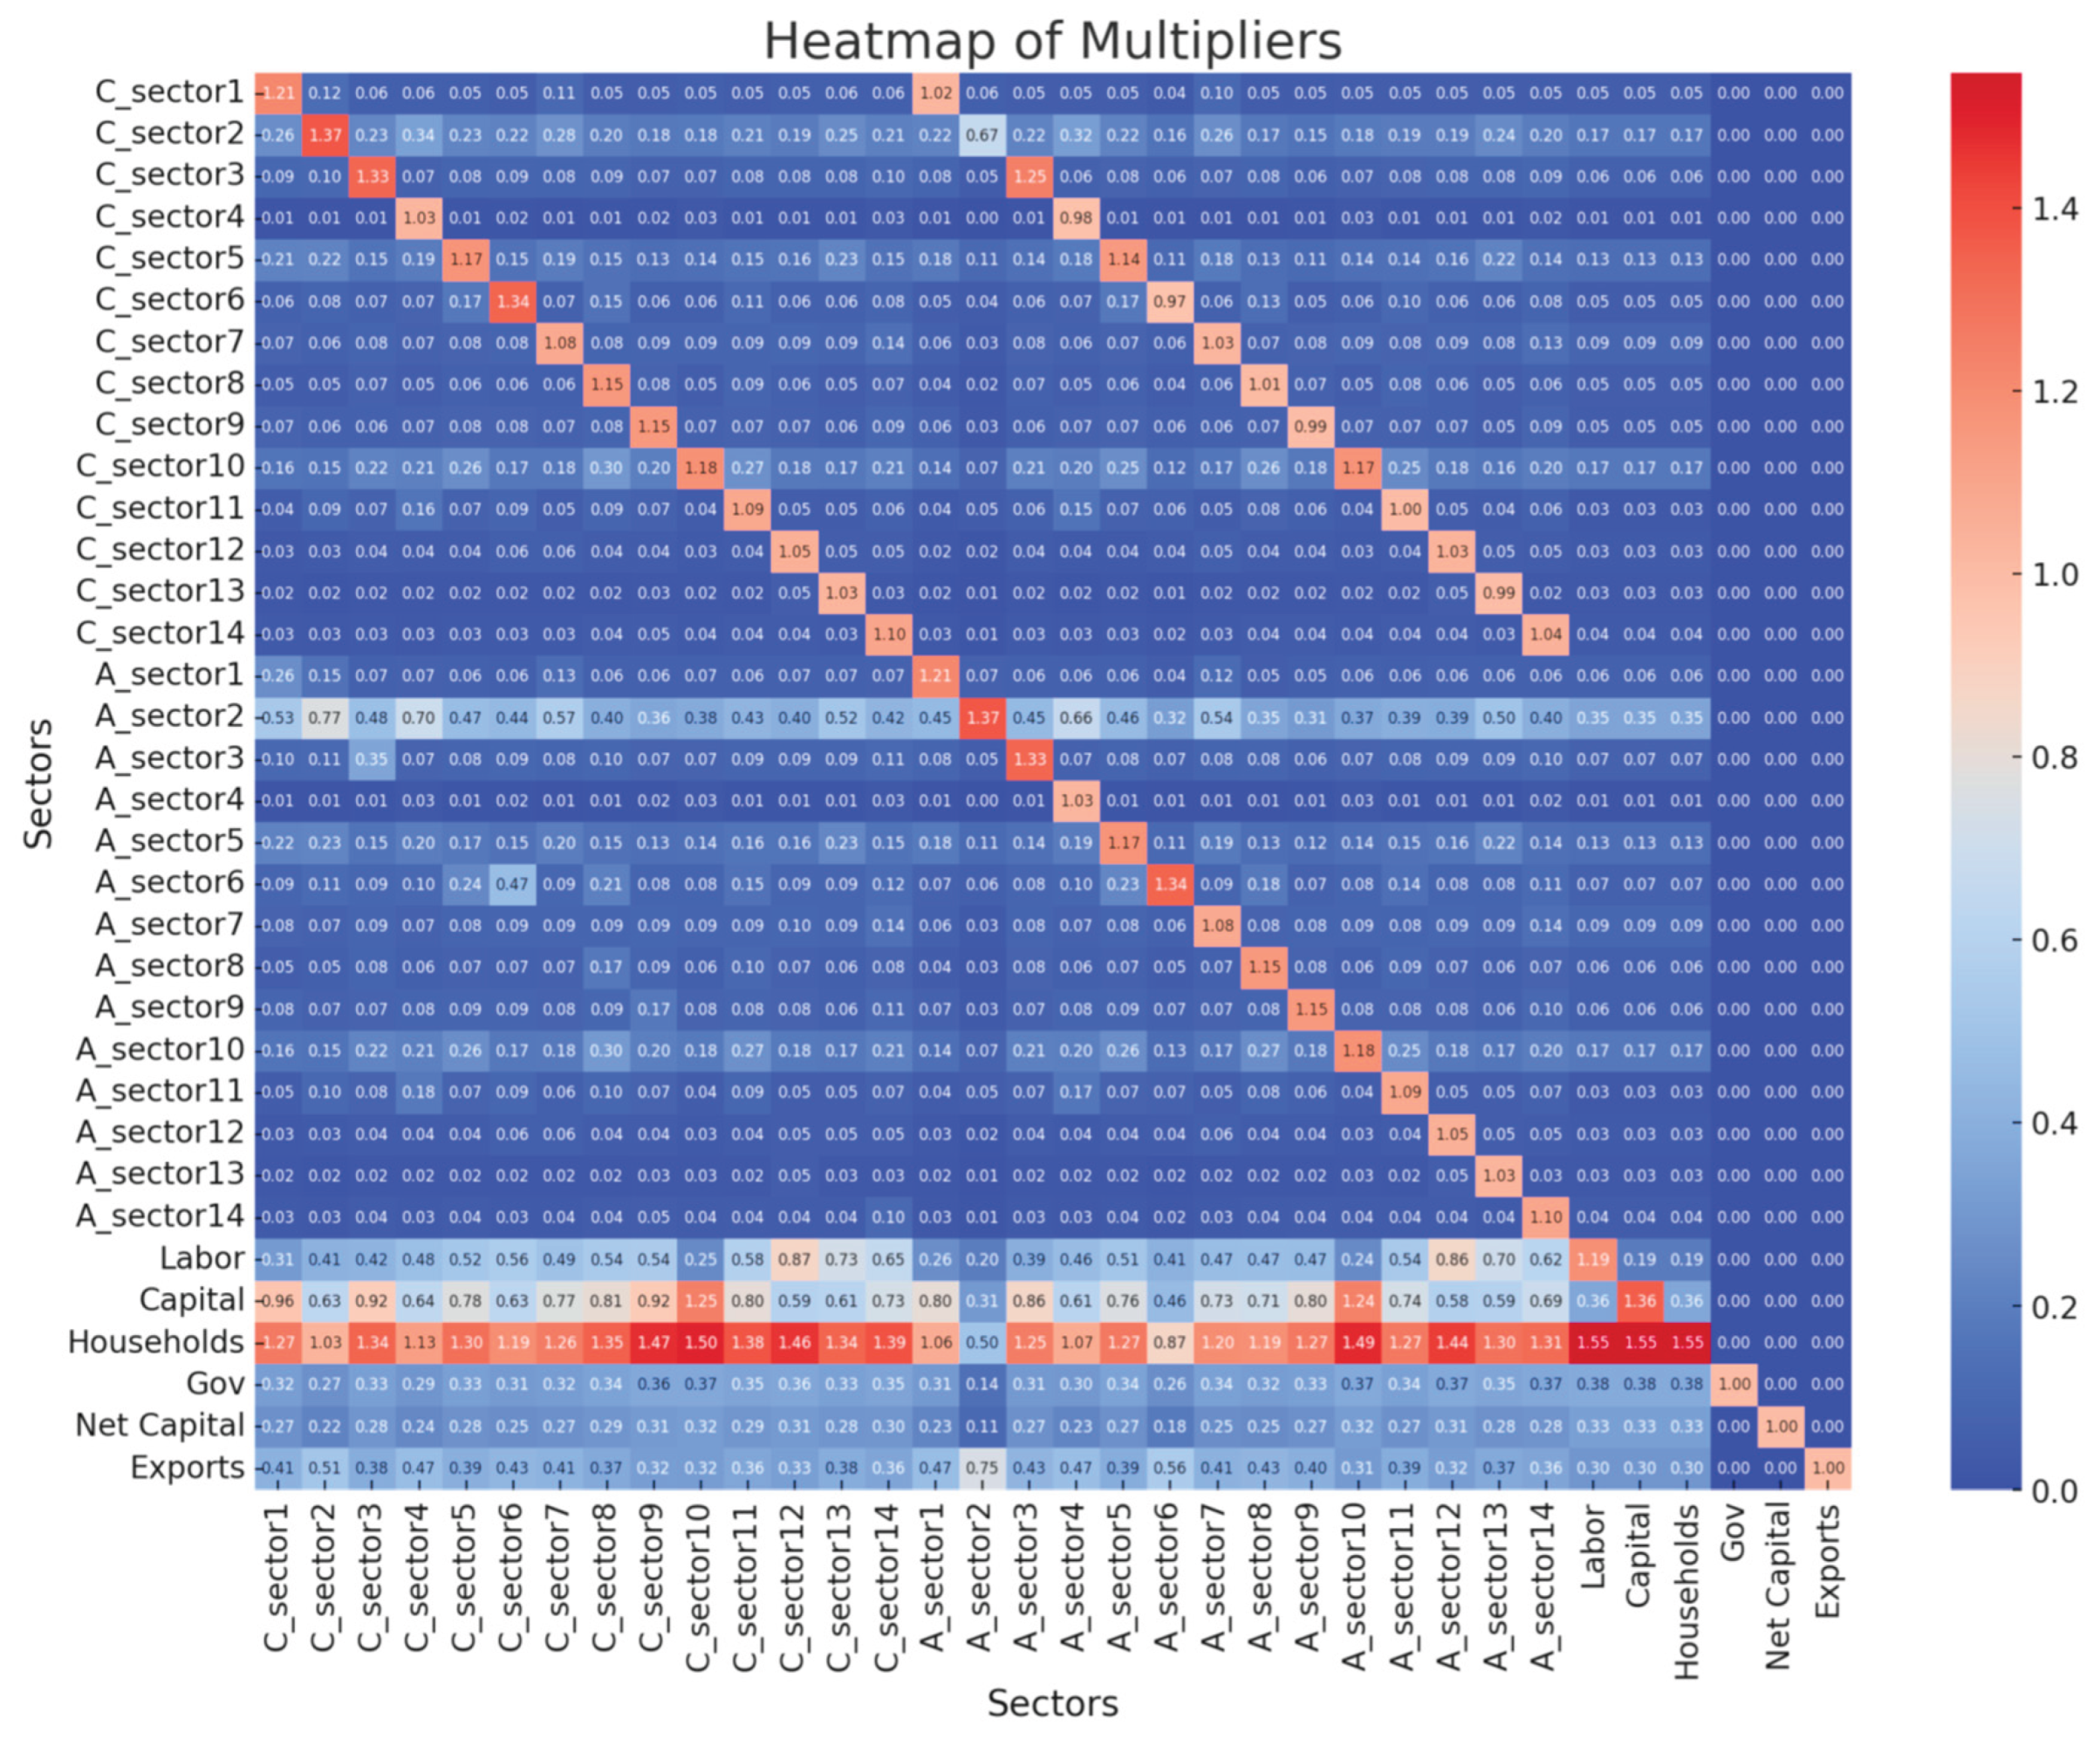

Table 1.
Sectoral categories (subsectors) considered in SAM construction.
| FSC # | Final Sectoral Category (FSC) | NACE Rev. 2 Sectors |
|---|---|---|
| 1 | Agriculture, forestry and fishing | A01-A03 |
| 2 | Manufacturing | C10-C33 |
| 3 | Mining, quarrying/ Electricity, gas, steam and air conditioning supply/ Water supply, sewerage, waste management and remediation activities | B, D35, E36-E39 |
| 4 | Construction | F |
| 5 | Wholesale and retail trade; repair of motor vehicles and motorcycles | G45-G47 |
| 6 | Transportation and storage | H49-H53 |
| 7 | Accommodation and food services activities/ Rental and leasing activities/ Travel agency, tour operator and other reservation service and related activities | I, N77, N79 |
| 8 | Information and communication | J58-J63 |
| 9 | Financial and insurance activities (except insurance and pension funding) | K64-K66 |
| 10 | Real estate activities | L68 |
| 11 | Professional, scientific and technical activities/ Employment activities | M69-M75, N78 |
| 12 | Administrative and support services activities/ Public administration and defense/ Education | N80-N82, O84, P85 |
| 13 | Human health and social work activities | Q86-Q88 |
| 14 | Arts, entertainment and recreation/ Other services activities/ Activities of households as employers; undifferentiated goods - and services - producing activities of households for own use (T)/ Activities of extraterritorial organizations and bodies (U) | R90-R93, S94-S96, T, U |
Source: Data research.
Table 2.
Basic Macro-SAM structure for the Greek Economy.
| Activities* | Commodities* | Labor | Capital | Households/ Firms* | Government* | Saving/Investment* | Rest of the World* | Total | |
|---|---|---|---|---|---|---|---|---|---|
| Activities* | Domestic Supply |
Activities Income (Gross Output) |
|||||||
| Commodities* | Intermediate Consumption | Consumption Expenditure | Government Expenditure | Investment Demand | Exports | Total Demand | |||
| Labor | Value-Added | Labor Income | |||||||
| Capital | Value-Added | Capital Income | |||||||
| Households/ Firms | Labor Income to households | Capital Income to firms | Social Transfers | Households/ Firms Income | |||||
| Government* | Taxes | Direct taxes | Government Income | ||||||
| Saving/ Investment* |
Savings |
Fiscal Surplus/Deficit | Foreign Savings | Savings | |||||
| Rest of the World (ROW) | Imports | Transfers to RoW | Government Transfers to RoW | Investment to/from ROW | Foreign Exchange Outflow | ||||
| Total | Activities Expenditure | Total Supply | Labor Expenditure | Capital Expenditure | Households/ Firms Expenditure | Government Expenditure | Investment Spending | Foreign Exchange Inflow |
*These accounts are disaggregated in order to further analyze the framework and continue with multipliers analysis. Activities and Commodities are divided into 14 sectoral categories (see Table 1). Government, Saving/Investment and Rest of the World are also divided based on these 14 sectoral categories. Source: Data research.
Table 3.
Macro-SAM for Greece in 2020 (millions of Euros).
| Activities* | Commodities* | Labor | Capital | Households/ Firms* | Government* | Saving/ Investment* | Rest of the World* | Total | |
| Activities* | 258,283 | 258,283 | |||||||
| Commodities* | 113,571 | 104,699 | 40,885 | 21,367 | 48,592 | 329,113 | |||
| Labor | 64,826 | 64,826 | |||||||
| Capital | 79,886 | 79,886 | |||||||
| Households/ Firms | 64,826 | 79,886 | 61,149 | 205,862 | |||||
| Government* | 5,985 | 47,228 | 53,214 | ||||||
| Saving/ Investment* | 43,470 | (22,596) | 11,165 | 32,309 | |||||
| Rest of the World (ROW) | 64,844 | 10,195 | (26,224) | 10,942 | 59,757 | ||||
| Total | 258,283 | 329,113 | 64,826 | 79,886 | 205,862 | 53,214 | 32,309 | 59,757 |
Source: Author’s calculations.
Table 4.
SAM-based Multipliers for Greece 2020.
| FSC # | Final Sectoral Category (FSC) | Output Multiplier | Value-Added Multiplier | Income Multiplier |
|---|---|---|---|---|
| 1 | Agriculture, forestry and fishing | 1.96 | 1.06 | 1.06 |
| 2 | Manufacturing | 1.17 | 0.50 | 0.50 |
| 3 | Mining, quarrying/ Electricity, gas, steam and air conditioning supply/ Water supply, sewerage, waste management and remediation activities | 2.30 | 1.25 | 1.25 |
| 4 | Construction | 2.29 | 1.07 | 1.07 |
| 5 | Wholesale and retail trade; repair of motor vehicles and motorcycles | 2.30 | 1.27 | 1.27 |
| 6 | Transportation and storage | 1.76 | 0.87 | 0.87 |
| 7 | Accommodation and food services activities/ Rental and leasing activities/ Travel agency, tour operator and other reservation service and related activities | 2.16 | 1.20 | 1.20 |
| 8 | Information and communication | 2.15 | 1.19 | 1.19 |
| 9 | Financial and insurance activities (except insurance and pension funding) | 1.91 | 1.27 | 1.27 |
| 10 | Real estate activities | 2.04 | 1.49 | 1.49 |
| 11 | Professional, scientific and technical activities/ Employment activities | 2.14 | 1.27 | 1.27 |
| 12 | Administrative and support services activities/ Public administration and defense/ Education | 2.12 | 1.44 | 1.44 |
| 13 | Human health and social work activities | 2.15 | 1.30 | 1.30 |
| 14 | Arts, entertainment and recreation/ Other services activities/ Activities of households as employers; undifferentiated goods - and services - producing activities of households for own use (T)/ Activities of extraterritorial organizations and bodies (U) | 2.24 | 1.31 | 1.31 |
Note: due to lack of factor taxes in the Greek SAM, income and value-added multipliers are the same. Source: Authors’ calculations.
Disclaimer/Publisher’s Note: The statements, opinions and data contained in all publications are solely those of the individual author(s) and contributor(s) and not of MDPI and/or the editor(s). MDPI and/or the editor(s) disclaim responsibility for any injury to people or property resulting from any ideas, methods, instructions or products referred to in the content. |
© 2025 by the authors. Licensee MDPI, Basel, Switzerland. This article is an open access article distributed under the terms and conditions of the Creative Commons Attribution (CC BY) license (http://creativecommons.org/licenses/by/4.0/).
Copyright: This open access article is published under a Creative Commons CC BY 4.0 license, which permit the free download, distribution, and reuse, provided that the author and preprint are cited in any reuse.


