2. Fruit Profiles for Bioethanol Production
The various characteristics of Tropical fruits like the diverse but correct degrees of acidity that further inspects the need of pre-treatment methods, vast proportion of fermentable sugars like fructose and sucrose and significant amount of water that lowers the processing requirements are a great start for the initial process. The major advantage of tropical fruits is its short growth cycle and their diverse as well as widespread availability in many areas which guarantees a consistent and dependable supply for the raw materials. The parts of tropical fruits used for the bioconversion task are peels, seeds, flesh etc. Also, by opening up new stores and outlets for unmarketable fruits, the use of tropical fruits can decrease waste in areas where tropical fruits are majorly grown and further boost the local economy.
2.1. Rambutan (Nephelium lappaceum)
Research has shown that rambutan pulp yields a high amount of ethanol (9.96% v/v) because of its high content of easily fermentable carbohydrates such as fructose and sucrose (Hossain et al., 2024; Khayyat et al., 2024). The naturally slightly acidic pH of rambutan flesh around 5.2–5.5 may help provide ideal conditions for fermentation. (Hossain et al., 2024; Khayyat et al., 2024). Because pulp has a lower cellulose concentration and greater access to fermentable sugars than skin and "maxi," it yields the most ethanol (Hossain et al., 2024). Rambutan is a valuable fruit source in Southeast Asia. The study done by Hadeel, A., et al., aimed to manage rambutan waste, minimize pollution, and contribute to waste disposal solutions. By fermenting rambutan waste with yeast like Saccharomyces cerevisiae under various conditions, researchers identified the optimal parameters for bioethanol yield containing 3 grams of yeast at 30°C and a pH of 6 for a two-day incubation period. The process began with measuring the initial weight, total soluble solids (TSS), and pH of the rambutan mixture. Yeast of around 4 g/litre was then added, and the mixture underwent fermentation under different conditions. The key parameters explored were incubation time (1, 2, and 5 days), temperature (28°C, 30°C, and 35°C), and pH (4, 5, and 6). Analysing the results revealed a cyclical relationship. Higher bioethanol yields were achieved at a pH of 5 and a temperature of 30°C. Fermentation time also played a role, with day 2 showing the highest yield (9.4%). The analysis of the produced bioethanol revealed that it met the American Society for Testing and Materials (ASTM) standards, with minimal hazardous chemicals and viscosity within acceptable ranges. Additionally, engine testing demonstrated a significant reduction in greenhouse gas emissions (hydrocarbons, Nitric oxide (NOₓ), and Sulphuric acid (SO ₂) when using blends of 5% and 10% bioethanol (E5 and E10) compared to pure gasoline in a multi-cylinder car (Khayyat et al., 2024). According to research done by (Imteaz et al., 2022), this paper addresses this challenge by proposing a new mathematical model. This model can estimate the amount of bioethanol that could be generated from rambutan waste, considering factors like pH, temperature, and fermentation time. The model was validated against existing experimental data and demonstrated high accuracy, with a correlation coefficient of 0.98 and low standard errors (Tanambell, 2015). Building on this success, a future framework to calculate the cost-benefit ratio for industrial production was proposed. This framework will consider production costs, yield value, and the time value of money.
2.2. Mango (Mangifera indica)
Mangoes have a high sugar content, especially in sucrose and maltose, which makes them potentially useful for producing bioethanol. However, variations in varietals and stages of ripening might affect the sugar content. It produces lower ethanol yield compared to rambutan but it is still promising. The naturally slightly acidic pH of mango flesh ranges from 4.5 to 5.0, which may be favourable for fermentation (Hossain et al., 2024). Mango pulp has an identical moisture level of 81.26% to the banana pulp, however, it has more protein (7.96%) and less ash (13.08%) (Arumugam and Manikanda, 2014). There was hardly much starch in any pulp. As pulp has less cellulose and is simpler to access fermentable sugars than skin and other components, it yields the maximum amount of ethanol. Pulp offers the highest ethanol yield compared to skin and “maxi”. Mango trees require significant water, especially during dry seasons. Mango peels have the highest dietary fibre content (73.04%) of any food. Mango peels had the highest concentration of polyphenols of 54.45% (Arumugam and Manikanda, 2014). The highest total sugar yield was obtained by mixed fruit pulps (64.27%). One potential approach to converting mango peels into bioethanol involves a cyclic enzymatic hydrolysis process (Awodi et al., 2022; Veeranjaneya and Vijaya, 2012). First, the peels undergo pre-treatment (likely water-steam treatment) to break down their cell walls and make cellulose and hemicellulose more accessible. Next, the pre-treated peels are combined with a cellulase and xylanase enzyme solution at a specific concentration (45 IU/g) and incubated at 45°C with gentle agitation (Palafox-Carlos et al., 2012; Jahid et al., 2018). During this enzymatic hydrolysis stage, cellulase breaks down cellulose into glucose, while xylanase targets hemicellulose to release simpler sugars including pentose sugars. The process continues for a set time (around 12 hours seems optimal) with sugar release being monitored. If sugar release stagnates, it might signify enzyme deactivation, necessitating a restart with fresh enzymes. Finally, the hydrolyzed mixture is filtered to separate the released sugars from the remaining solids. These recovered sugars can then be fermented to produce bioethanol, while the solids and potentially the used enzymes might be further processed, composted, or disposed of responsibly depending on the specific technology employed. As shown in
Table 1.
2.3. Banana (Musa paradisiaca Linn)
Glucose, sucrose, and fructose are among the easily digested carbohydrates that are present in bananas. However, the amount of easily available fermentable sugars may vary according to the ripeness, which can also impact the starch concentration. It produces a lower ethanol yield compared to rambutan but similar to mango. Of all the bananas produced, the majority with genomes from Musa acuminata are sweet or dessert bananas (68%) while the majority with hybrids from M. acuminata and M. balbisiana are cooking or plantain bananas (32%) (Waghamare and Arya, 2016). At a pH of 4.5 to 5.0, unripe bananas have a higher acidic pH, which may make fermentation easier. Banana pulp has a low starch content of 0.632% and a high moisture content of 76.63% (Ariff et al., 2021). High ash (19.75%), moderate protein (5.65%), low starch (0.632%), and high moisture (76.63%) are some of the characteristics of pulp (Ariff et al., 2021). Pulp treated with diluted acid before enzymatic hydrolysis produced a good sugar yield (57.58%). Peels had a promising sugar content of 36.67% as well. Fruit waste from banana peels has a high cellulose content and a low lignin level, making it ideal for producing bio-ethanol (Ariff et al., 2021). After 42 hours, peel hydrolysate produced a moderate amount of ethanol (13.84%) with a fermentation efficiency of 27.13% . As pulp has less cellulose and is simpler to access fermentable sugars than skin and other components, it yields the maximum amount of ethanol. Similar to mango peels, banana peels can be converted to bioethanol through enzymatic hydrolysis. Pre-treatment (likely water-steam) breaks down cell walls for enzyme accessibility. The pre-treated peels are then incubated with cellulase and xylanase enzymes (45 IU/g) at 45°C with agitation. Before treatment with NaOH, fresh feedstock produced the maximum glucose production (79.5±4.4%) (Prakash et al., 2018). Using H₂SO₄. for the drying of biomass saccharification obtained the greatest reducing sugar concentration (RS) in an hydrolyzed liquid (26.6±1.1 g/L) (Bardone et al., 2014).
The concentrate hydrolyzed liquid underwent fermentation, yielding 22.1±0.8 g/L of ethanol with good productivity (QP = 1.83±0.12 g/L.h), effectiveness (EP = 80.4±0.12%), and ethanol yield (YP/RS = 0.47±0.03 g/g) (Bardone et al., 2014).
2.4. Pineapple (Ananas comosus)
Fructose and sucrose are examples of simple sugars that are present in pineapple pulp. However, if it is not deactivated, the presence of the protein-breaking enzyme bromelain may reduce fermentation efficiency. It produces slightly higher ethanol yield compared to banana and mango, but lower than rambutan. Pineapples naturally have a pH of 4.2–4.5, which is somewhat acidic, which may be a good pH for fermentation (Hossain et al., 2024). On a dry basis, pineapple peels have a moisture content of 75.1%, cellulose content of 22.4%, hemicellulose content of 11.1%, lignin content of 6.5%, and 11.8% ash (Casabar et al., 2019). Without the use of catalysts, pineapple leaves were hydrothermally pre-treated for 20 minutes at 150°C. Following solid-liquid separation, the highest reducing sugar yield of 38.1 g/L was obtained in the liquid fraction (Casabar et al., 2019). For fermentation, Saccharomyces cerevisiae WLP300 was utilized . The fermentation process lasted 72 hours at 30°C. A noteworthy yield of ethanol was attained, with a fermentation efficiency above 91% (Casabar et al., 2019; Tropea, 2014)). As pulp has less cellulose and is simpler to access fermentable sugars than skin and other parts, it yields the maximum amount of ethanol. Pineapple cultivation increases soil acidity, requiring significant lime application to maintain fertility. This can disrupt soil ecosystems and limit future crop options (Gazey, 2019).
2.5. Jackfruit Rind (Artocarpus heterophyllus)
Jackfruit is relatively high in sugar content, particularly unripe jackfruit (Rangina and Ray, 2023). Due to their high percentage of carbohydrates and starch content especially in the ripe fruit, jackfruit seeds have the potential to be used as a feedstock for bioethanol. Studies show the sugar content can range from 10-20% depending on the variety and ripeness. Ripe jackfruit contains fructose, sucrose, and glucose. Ethanol yields of up to 4.5 g/L using jackfruit pulp have been achieved. Unripe jackfruit typically has a neutral pH of around 7, while ripe jackfruit can be slightly acidic around 6.5, a pH of 3 was found to be optimal for bioethanol production from jackfruit seeds (Sarangi et al., 2023). The study utilized certain materials and techniques to prepare the jackfruit seeds, which included cleaning, drying, and crushing them into a powder. The starch in the seeds was subsequently converted to glucose by chemical hydrolysis with H₂SO₄. Saccharomyces cerevisiae yeast was used for fermentation processes, and pH levels were varied to be 2, 3, 4, and 5. Anaerobic fermentation takes place for one to five days at a temperature of 30°C (Liu et al., 2019). The collected data showed that 75% of the glucose was still present following hydrolysis. Notably, the study showed that a pH of 3 was the ideal value for fermentation, yielding 57.94% of bioethanol. In contrast, pH 2 has the lowest bioethanol percentage, 14.99%, of any recorded pH (Arif et al., 2018). These results highlight the important effects that pH levels have on the fermentation process's ability to produce both glucose and bioethanol which can vary depending on ripeness. According to (Nuriana and Wuryantoro, 2015), two methods were used in the procedure to synthesize glucose from jackfruit stone flour, an enzyme method and an acid method. In 3 minutes, the acid approach produced a temperature of 135°C and a glucose concentration of 17.36% at pH 3.5. The enzyme approach, on the other hand, produced a 19.24% greater glucose content, reaching 19.43%. Saccharomyces cerevisiae , urea, and N-P-K were used in the fermentation process, and after three to six days, the ethanol content ranged from 11% to 13% (Trianik et al., 2022). Based on a composition analysis of jackfruit stones, the carbohydrate and starch content were 12.78%, protein was 15.26%, fat was 7.39%, fiber was 13.27%, and water made up 9.68% (Raju and Sidabutar, 2024). The most suitable settings for producing bioethanol from jackfruit straw waste were found to be a starting mass of 40 grams of Saccharomyces cerevisiae , 96 hours of fermentation, and a temperature range of 70–78°C for distillation (Nurhayati et al., 2023). A 30 mL distillate yield was achieved under these circumstances, and the bioethanol's physical characteristics—such as its density, boiling point, and refractive index—matched the industry standards (Ash et al., 2022).
2.6. Durian (Durio zibethinus L.)
The use of durian seed kernels offers a possible solution for addressing the significant waste caused by durian fruit consumption. Furthermore, compared to exotic fruits like sweet oranges, snake fruits, papayas, jackfruit, rambutans, and avocados, durian seeds have a higher carbohydrate content (Chriswardana et al., 2021). Only thirty percent of the durian fruit is edible; the remaining seventy percent comprises the shell (75%) and the seed (20–25%). But unlike many other fruits, durian seeds are remarkably useful, with at least 95% of the kernel being used, whereas many other fruits waste a large amount of their seed. This translates to the discharge of over 132,203 tonnes of durian kernel seed (Chriswardana et al., 2021). Key components of durian seed kernels include carbohydrates, proteins, ash, moisture, and fat. The composition of the seed varies based on factors like peeling and shape (powder). Carbohydrate composition varies from 43.60% to 76.80% (peeled, powder) and 73.90% (unpeeled, powder), protein from 2.600% to 9.080% with 7.600% (peeled, powder) and 6.00% (unpeeled, powder), ash from 3.100% (unpeeled, powder) to 4.440% and 3.800 (peeled, powder), moisture from 6.600% (peeled, powder) to 51.10% and 6.500% (unpeeled, powder), and fat from 0.400% (both peeled and unpeeled) and 0.550% (Ghazali et al., 2016). The most desirable parameters for producing bioethanol from durian seed waste were found to be 139.8°C, 1:30 solid-to-water ratio, 30 bar of pressure, and 3.58 hours of hydrolysis, which resulted in 32.37% reducing sugars (Purnomo et al., 2015). A 20 g/L reducing sugar concentration and a 72-hour fermentation period were found to be the ideal fermentation conditions, producing 9.85 g/L of ethanol (Seer et al., 2017). An essential first step in releasing the carbohydrates locked inside durian seeds is pre-treatment. The seeds are then carefully ground into a finely ground powder (to increase the surface area which makes processing easier) after being dried to prevent the growth of mould. The next phase, hydrolysis, marks the beginning of the transformation process. It involves the conversion of complex carbohydrates like cellulose and starch into simpler fermentable sugars such as glucose. Hydrolysis can be carried out in two main ways. Chemical hydrolysis is one method that uses an alkali solution, such as sodium hydroxide (NaOH), for a set amount of time and at a certain temperature (Chriswardana et al., 2021). The alkali solution is essential for breaking down the seeds' resistant cell walls and releasing the contained carbohydrates for additional processing. The use of enzymes as biological catalysts to break down complex carbohydrates into simpler sugars is known as enzymatic hydrolysis, which is an alternative technique. Even though enzymatic hydrolysis is usually thought to be more environmentally friendly than chemical hydrolysis, it can nonetheless be more expensive. When chemical hydrolysis is used, neutralization may be required to bring the solution's pH back to a range that is favourable for yeast fermentation, usually around pH 5 (Chriswardana et al., 2021). After hydrolysis, the solution high in sugar moves on to the fermentation stage, where it comes into contact with yeast usually Saccharomyces cerevisiae in a fermentation tank. This yeast strain efficiently breaks down the available simple sugars into carbon dioxide and ethanol, starting to produce ethanol. Distillation is then used to extract the ethanol from the fermentation broth, which also contains yeast cells and other by-products along with water. Since ethanol has a lower boiling point than water, it vaporizes first when heated. The heavier components stay inside the distillation device while the resulting ethanol vapor condenses back into liquid form. To improve the ethanol's concentration and purity for its intended uses, these procedures could entail removing any remaining contaminants or water content. Bioethanol yield from durian seeds ranges from 14.72% (alone) to 45.9% when combined with cassava (Dussap et al., 2019).
2.7. Guava (Psidium guajava L.)
The guava crop holds enormous commercial value in India and substantially contributes to the country's overall fruit production. However, a significant percentage of guava fruits are vulnerable to deterioration, especially in the rainy season. Guava leaves were identified as a promising source of bioactive compounds, particularly total phenols, which are plant-based antioxidants. It was found that using 25% or 50% ethanol extractions yielded the highest levels of these beneficial compounds from guava leaves. Interestingly, guava leaves exhibited the greatest content of total phenols compared to other guava residues analysed suggesting the potential of guava leaves as a valuable source of health-promoting antioxidants (Ramírez et al., 2020). Further research explores the potential of utilizing surplus guava pulp for bioethanol production, offering a sustainable solution for waste management and renewable biofuel generation. Their study delves into the fermentation efficiency of three yeast strains that is Saccharomyces cerevisiae MTCC 1972, Isolate-1, and Isolate-2 using guava pulp as the substrate (Srivastava et al., 1997). Isolate-2 exhibited the highest ethanol yield of 5.8% (w/v) at 36 hours of fermentation, followed by Isolate-1 of 5.3% w/v at 60 hours and Saccharomyces cerevisiae MTCC 1972 of 5.0% w/v at 36 h. All three yeast strains achieved their highest ethanol yields at the natural sugar concentration of 10% (w/v) present in guava pulp. Also, higher sugar concentrations of 15% and 20% w/v inhibited ethanol production by all the tested yeast strains. Pre-treatment methods can break down the cell wall components of the pulp, releasing trapped sugars and making them more accessible for fermentation by yeast. The enzymatic Hydrolysis method utilizes enzymes like cellulases and hemicellulases that act as biological catalysts. These enzymes specifically target and break down complex carbohydrates like cellulose and hemicellulose present in the guava pulp cell walls which releases simpler fermentable sugars like glucose that can be readily utilized by yeast during fermentation. The acid Hydrolysis method involves using diluted acids like sulfuric acid at specific temperatures and duration. The acid helps to break down the cell wall structure of the guava pulp, releasing the trapped sugars. Alkaline Hydrolysis which is similar to acid hydrolysis uses an alkaline solution like sodium hydroxide to break down the cell wall components of the guava pulp. The steam Explosion method involves exposing guava pulp to high-pressure steam for a short duration followed by a rapid pressure release. The sudden pressure change disrupts the cell wall structure, making the trapped sugars more accessible (Srivastava et al., 1997). After acid washing with acetic acid, rapid pyrolysis at 550°C was shown to be the ideal temperature for levoglucosan synthesis from guava seeds (Euripedes et al., 2020). Therefore, by eliminating hemicellulose and lignin fractions, alkali and alkaline earth metals, and other contaminants, acid washing greatly enhanced the production of levoglucosan. This enhanced the cellulose content and thermal stability of the biomass that was treated (Naik et al., 2023). Guava pulp might contain certain compounds that can be stressful for yeast during fermentation. Engineering yeast strains to be more tolerant to these stress factors could improve overall ethanol yields.
2.8. Dragon Fruit (Selenicereus undatus)
Red-fleshed dragon fruit trash has great potential as a long-term feedstock for bioethanol production. The peel of red dragon fruit, which belongs to the Cactaceae family of cacti, contains 8.4% sugar and 68.3% other complex carbohydrates, which includes cellulose (Widyaningrum and Parahadi, 2020). The fruit itself has high quantities of fermentable carbohydrates having 401 g/kg of glucose and 89.6 g/kg of oligosaccharides, thus a large percentage (36.94%) of the fruit is wasted in major dragon fruit-producing locations such as East Kalimantan, Indonesia. Research has demonstrated the effectiveness of combining yeast like Saccharomyces cerevisiae to ferment the resultant simple sugars into bioethanol and fungus like Aspergillus niger or Trichoderma reesei to break down complex sugars in the waste. Studies contrasting these methods discovered that after shorter incubation periods (2 weeks vs. 3 weeks), employing solely S. cerevisiae produced a greater concentration of bioethanol (64.5%) compared to co-culture (48.0%). A concentration of 0.67% yielded the maximum bioethanol yield (64.5%), suggesting that optimizing the concentration of S. cerevisiae is a crucial component. This result emphasizes how crucial it is to maximize the concentration of S. cerevisiae, which was measured in this study between 10 ml (3.33% v/v) and 60 ml (20.00% v/v), to produce bioethanol from red dragon fruit waste as efficiently as possible. The specific dragon fruit waste used consisted mainly of water (88.4% in the pericarp and 90.2% in the flesh), and the research employed whole dragon fruit waste for bioethanol production. The study also found that increasing the yeast concentration (up to 12% w/v) significantly reduced fermentation time (Sarungu et al., 2021). According to (Widyaningrum and M. Parahadi, 2020), they evaluated the synthesis of bioethanol from dragon fruit peels using enzymatic hydrolysis and fermentation. Using a 0.1% Tween 80 solution, crude cellulase enzymes were first isolated from cultures of Aspergillus niger and Trichoderma reesei. Following that, dragon fruit peel was incubated for 24 hours at 37°C with these enzyme extracts in a variety of ratios (1:0, 0:1, 1:1, 2:1, 1:2, 3:1, and 1:3). The efficiency of cellulose breakdown was determined by measuring the amount of reducing sugars released. The mixture of hydrolyzed dragon fruit peels was then fermented for ninety-six hours using Saccharomyces cerevisiae . A treatment with a ratio of Trichoderma reesei to Aspergillus niger of 3:1 resulted in the greatest reduction of sugar levels (49.68%), leading to the highest bioethanol yield (2.46%) observed in a treatment with a 2:1 ratio of these enzymes (Ali et al., 2015). The ideal ratio of Trichoderma reesei to Aspergillus niger enzymes for cellulose degradation and a concentration of 0.67% Saccharomyces cerevisiae for fermentation were found to be the ideal conditions for producing bioethanol from dragon fruit peel (Widmer et al., 2010). The co-culture of Saccharomyces cerevisiae yielded higher ethanol concentrations than the co-culture of Aspergillus niger, and the combination of these enzymes improved the reducing sugar yield (Anak et al., 2023).
2.9. Muskmelon (Cucumis melo)
Muskmelon peels emerge as a viable and cost-effective substrate for bioethanol synthesis due to their widespread availability, high worldwide production, and intrinsic sugar content such as glucose (67.33 g glucose/L), sucrose (12.02 g sucrose/L), and fructose (70.43 g fructose/L), also owing to their high contents in protein, cellulose, and minerals (Suhair et al., 2019). Pre-treatment methods included centrifugation of the initial product and autohydrolysis of the washed solid to recover a glucan-rich solid and sugar-rich liquid (Rico et al., 2023). After cleaning and potentially adding stale milk to add extra sugars and speed up the fermentation process, the peels are prepared for fermentation using microorganisms like Saccharomyces cerevisiae . Following fermentation, the bioethanol is purified using condensation, distillation, and sterilization. The medium-sized orange-bluish flame in the burning test burned cleanly and produced no smoke. The solution's pH was neutral at 7.52, and it had no colour. The presence of ethanol in the finished product was verified by gas chromatography-mass spectrometry, indicating that it has the potential to be used as a biofuel substitute. The muskmelon peels were sterilized and fermented to create a mixture enriched in carbohydrates. During fermentation, the carbohydrate content was expected to increase, potentially stabilizing the peels' protein and carbohydrate content. Saccharomyces cerevisiae yeast was then added and mixed thoroughly. The mixture was incubated for 8 hours at a constant 30°C, an optimal temperature for yeast growth and metabolism. After fermentation, the mixture was incubated for an additional 50 hours. Following fermentation, distillation was employed to separate the bioethanol from the mixture. The fermented solution was heated using fractional distillation equipment to vaporize the ethanol, which was then condensed back into liquid form. This process was carried out at a constant temperature of 78.37°C until all the bioethanol was effectively separated. The characteristics of the produced bioethanol were then compared to pure ethanol. Both exhibited clear, colourless solutions with a neutral pH (around 7.5). The burning test revealed an orange-bluish flame for both fuels, with minimal soot observed (Suhair et al., 2019). Interestingly, the bioethanol from muskmelon peels produced a slightly smaller flame and possessed a distinct fruity odour, likely due to trace components carried over from the peels. The bioethanol and pure ethanol solutions were both colourless liquids (200 μL) with a similar distillation time of 13 seconds and no visible residue or particles. Both exhibited viscosities, likely due to hydrogen bonding between the hydroxyl groups in ethanol molecules. Distinguishing bioethanol from water was achieved by observing the steam produced during distillation. The bioethanol produced a clearer, non-droplet-forming steam, unlike the water which formed droplets on the apparatus walls. The muskmelon bioethanol possessed a distinct fruity odour compared to the relatively odourless pure ethanol. This difference likely arose from trace components carried over from the fermented muskmelon peels during bioethanol production. One thing that all the tests had in common was how quickly sugars, especially glucose, were used in the first six hours. Liquid-to-solid ratios and cellulase enzyme concentrations can be adjusted to achieve high glucose concentrations and yield about 35 g/L after 24 hours (Rico et al., 2023). The greatest volumetric productivities, which ranged from 3.87 to 4.29 g/Lh, also occurred during this period (Carillo-Nieves et al., 2017). After six hours, the quantities of ethanol increased further, peaking at 22 hours at between 22 and 29.96 g/L. After 21 hours, the highest reported experimental ethanol concentration was 51.95 g/L, which is equivalent to a 68% ethanol yield. Finally, Gas Chromatography-Mass Spectrometry (GC-MS) analysis confirmed the presence of ethanol in the bioethanol solution. The chromatogram peaks for both standard ethanol and the bioethanol sample displayed a matching peak at the same retention time of 1 minute and peak area (100%), signifying the presence of ethanol. Interestingly, the analysis did not detect ethane but did reveal the presence of 2-propanol. Ethanol's lower boiling point due to fewer hydrogen bonds, allows it to readily enter the gas phase compared to the larger electron-rich 2-propanol molecule, which requires more energy to vaporize (Unal et al 2020). Consequently, the higher volatility of ethanol makes it more likely to evaporate during the analysis than 2-propanol. The ethanol output increased during fermentation at 30°C compared to 25°C. The fermentation of muskmelon juice at 30°C with nitrogen supplementation produced an elevated ethanol output of 0.502 g/g fermentable sugar (Chowdhury and Ümit, 2020). For watermelon and muskmelon, ethanol yields differed significantly across experiments whether or not there was nitrogen supplementation; however, this was not the case for waste bread hydrolysate. For all feedstocks, there were notable differences in the yields of ethanol between 25°C and 30°C (MC et al, 2023).
2.10. Mangosteen (Garcinia mangostana)
Peels from muskmelon have shown promise as a feedstock for bioethanol production. Mangosteen pericarp waste (MPW) amounts to 6 kg for every 10 kg of mangosteen harvested. As mangosteen is becoming more and more popular, some 30.8 million tonnes of MPW are discarded globally each year as a result (Cho et al., 2019). The primary bioactive ingredients in mangosteen peels are xanthones; one especially useful natural xanthone derivative is α-mangosteen (Eun et al., 2019). The peels of mangosteen are a rich source of flavonoids and phenolic acids that may find use in medications, cosmetics, and food supplements. They might also provide bioethanol. According to (Eun et al., 2019), the efficiency of popping pre-treatment in breaking down the peel structure is by facilitating the synthesis of bio-sugar and bioethanol. It is a two-step process that is followed by enzymatic hydrolysis before the actual extraction step. This approach significantly increased the α-mangosteen content in the extract, reaching a 1.46 times higher yield compared to chemical extraction from an untreated sample (Eun et al., 2019). These findings demonstrate the potential of fruit peels like muskmelon and mangosteen for the production of both biofuels and valuable bioactive compounds, promoting a circular bioeconomy approach to waste management. This is followed by enzymatic hydrolysis utilizing cellulase and pectinase enzymes. Using mangosteen peels as a biomass source for bioethanol synthesis, this method produced a promising ethanol yield after 24 hours, 75% of the theoretical maximum based on glucose levels (Eun et al., 2019). Furthermore, bioactive material extraction can be done with the solid residues that remain following enzymatic hydrolysis. The analysis revealed properties consistent with standard ethanol, including a colourless appearance, neutral pH, and a fruity odour. Gas Chromatography-Mass Spectrometry (GC-MS) analysis confirmed the presence of ethanol and provided insights into the presence of minor components. The most often used technique for purifying α-mangosteen is column chromatography using silica gel. Unfortunately, there are several disadvantages to this strategy, including its high expense and extensive usage of hazardous organic solvents. Researchers explored copper-doped magnetic nano matrix (Cu-MNM), a more environmentally friendly substitute. Reusability, an easy preparation procedure, minimal operating costs, and appropriateness for large-scale industrial production are only a few benefits of this magnetic nano matrix. Facilitating separation, the α-mangosteen bonds to the Cu2+ ions in the Cu-MNM (Nuriana and Wuryantoro, 2015). After purification, 1H NMR was used to confirm the isolated α-mangosteen's chemical structure. This revealed a high degree of purity (about 88.0%) that closely matched the standard α-mangosteen. For instance, according to (Zamila et al., 2015), a maximum yield of 17.84 g/100 g of peel was reported, while others achieved a concentration of 56.24 g/L using a concentrated juice medium. Based on the analysis, 164.7 g of glucose were retrieved from the initial 183.0 g of glucose present after popping pre-treatment and enzymatic hydrolysis. The hydrolyzed sugars were successfully fermented using Saccharomyces cerevisiae to produce 63.2 g of ethanol, with a fermentation yield of almost 75%. Eventually, 50.7 g of α-mangosteen was obtained from the residual solid residues following full enzymatic hydrolysis. These findings promote a circular bioeconomy approach to waste management by demonstrating the outstanding potential of mangosteen peels for the co-production of valuable goods, such as bio-sugar, bioethanol, and α-mangosteen. According to (Cho et al., 2019), it was revealed that MPW offers a promising mixture of bioconversion precursors containing pentose sugars (8.3%), hexose sugars (20.2%), and lignin (29.6%). MPW is well-suited for the conversion of glucose, which accounts for 18.3% of its dry mass, into reducing sugars, which are essential for the synthesis of bioethanol. However, pre-treatment is required due to the hardness of MPW, which has a thickness of 4-6 mm, to improve the effectiveness of future breakdown operations. MPW suspensions were supplemented with varying quantities of pectinase and cellulase that were manufactured on-site. Cellulase was shown to be more important in the hydrolysis process; at its maximum concentration of 25.1 mg/g MPW, 90% of the sugars were converted to reducing sugars (Zamila et al., 2015; Ahmad et al., 2013). When combined with the greatest cellulase concentration, pectinase demonstrated a minor increase in yield, but it still had little effect when used alone. These results imply that hydrolysis may be hampered by MPW's high lignin content, which can reach 33.7% (Gutierrez-Orozco et al., 2013). Additionally, MPW has γ-mangosteen, a bioactive xanthone derivative with anti-inflammatory, antimicrobial, and anticancer effects. However, γ-mangosteen is an expensive chemical to produce economically (Yodhnu et al., 2009). To tackle this difficulty, scientists investigated the possibility of converting the isolated α-mangosteen into γ-mangosteen by an o-demethylation reaction (Hermansyah et al., 2015).
2.11. Lychee (Litchi chinensis)
Lychee emerges as an interesting potential solution, not by utilizing the fruit itself, but by harbouring thermotolerant yeasts with valuable biofuel-producing characteristics. According to Nguyen, Phu Van, et al
., the possibility of using thermotolerant yeasts that were isolated from lychee fruits to produce bioethanol was major. A total of seven yeast strains from the species Saccharomyces cerevisiae , Meyerozyma guilliermondii, and Candida tropicalis were discovered. These yeasts were tolerant of moderate ethanol concentrations, 45°C temperatures, and fermentation inhibitors. These yeasts were first cultured by the researchers for a whole night in a shaking incubator. They then incubated them for 48 hours at different temperatures (37°C, 40°C, and 45°C) in broth with a high glucose concentration of 160 g/L (Nguyen et al., 2022). Using gas chromatography, the production of ethanol was tracked every 12 hours during the fermentation process. Researchers extracted, amplified, and sequenced the yeasts' DNA in order to identify them. They then used BLAST to compare the sequences with databases that are accessible to the public. Further, after isolating 75 yeast isolates from 15 lychee samples, they tested the isolates for growth at different temperatures and tolerance to ethanol. After this preliminary screening, 32 isolates showed signs of development at 37°C, while seven isolates were still flourishing at 40°C. Three isolates, H1, H19, and H23, in particular, showed growth at 45°C, the maximum test temperature (Maldonado-Celis et al., 2019). These results are consistent with other studies that found thermotolerant yeast can thrive at temperatures between 37°C and 45°C. Lastly, they used Wikerham medium with phenol red as an indicator to evaluate these yeasts' capacity to ferment a range of sugars, including glucose, galactose, fructose, saccharose, lactose, xylose, maltose, and arabinose. Remarkably, Meyerozyma guilliermondii H1 demonstrated the capacity to ferment not only glucose but also xylose and arabinose. It can be used to produce bioethanol from agricultural waste in the second generation (Hu et al., 2018). The greatest ethanol concentration of 11.12 g/L was obtained by the researchers utilising unrefined sugarcane bagasse hydrolysate with M. guilliermondii H1 at 40°C by optimising fermentation conditions (Bangar et al., 2021). Researchers used sulfuric acid to separate pentose-rich fractions from pre-treatment dried biomass, most likely sugarcane bagasse. Subsequently, yeast extract was added to the hydrolysate and the pH was corrected. Furthermore, xylose and glucose were added to the mixture to bring its total sugar content within a range of 20–40 g/L, with a final effective concentration of 15–40 g/L xylose and 5 g/L glucose. Lychee fruit doesn't directly contribute to the biofuel, but harbours yeasts with valuable properties. A study investigating the use of yeasts (UFLA CA11, UFLA CA1183, UFLA CA1174) for fermenting lychee wine provides indirect support for this concept (Yuwalee et al., 2019). The presence of various yeast strains capable of fermenting sugars in lychee aligns with isolating thermotolerant yeasts for bioethanol production. Finally, yeasts originating from lychees present a promising yet unexplored pathway for the generation of sustainable bioethanol. As shown in
Table 2.
3. Systematic Approaches for the Production of Bioethanol
3.1. Pre-Treatment Methods and Substrate Preparation
The peels of bananas, mangoes, and papayas were carefully pre-treated physically to maximize their readiness for conversion before bioethanol was produced. To guarantee a clean and well-prepared beginning material, several actions had to be taken. Initially, distilled water was used to properly wash the peels to get rid of any surface contaminants. It is possible that the researchers decided to eliminate the outer layers based on their makeup and possible effects on subsequent procedures. The peels were dried after being chopped into small, manageable pieces (1-2 cm) to reduce their size. Before a more regulated oven drying process at 65°C for 24 hours, some moisture content may have been removed by first air-drying at ambient temperature for a few days. This guaranteed a uniform degree of dryness across the peels. Eventually, an electronic grinder was used to reduce the oven-dried peels to a fine powder with a target particle size of 40 microns (0.04 mm) (Abambagade et al., 2020). To maximize efficiency during the next steps of hydrolysis and fermentation, this increased surface area is essential. Then, at 4°C in a refrigerator, each fruit peel powder was kept apart in sealed polyethylene bags. This refrigerated and regulated atmosphere reduced deterioration and spoilage before the powder's introduction into the bioethanol manufacturing process.
3.2. Acid Hydrolysis Technique
In the process of making bioethanol from papaya, mango, and banana peels, acid hydrolysis is an essential step that must occur before fermentation. By dissolving complicated carbohydrates (polysaccharides) into their more basic building parts, readily fermentable monosaccharides, it seeks to break down the full potential of these substances. The efficiency of the next fermentation step, in which brewer's yeast, Saccharomyces cerevisiae , uses readily accessible sugars to make bioethanol and this is greatly increased by the hydrolysis breakdown.
Sulphuric acid (H₂SO₄) is used as a catalyst in the hydrolysis process itself to accelerate the breakdown of polysaccharides. However, to optimize the transformation of these complicated carbohydrates into the intended fermentable sugars, scientists thoroughly examined several factors that might affect the result. The substrate concentration was one important parameter that was being assessed. The quantity of pre-treated fruit peel waste utilized in the hydrolysis procedure is indicated by this. It was evaluated how the amount of beginning material influences the ultimate yield of fermentable sugars by changing the number of peels. The acid content was another important metric that was examined. Sulphuric acid concentrations require careful balance. A low acid concentration may not be able to promote enough hydrolysis, whereas a high acid concentration may cause the target sugars to break down excessively and produce unwanted by-products. Consequently, to determine the ideal concentration of sulphuric acid that encourages effective hydrolysis without going overboard, the researchers experimented with a range of concentrations, from 0% (serving as a control) to 3% (v/v). The temperature has a considerable impact on the acid hydrolysis process. A range of reaction temperatures, from 60°C to 110°C (Alves et al., 2011), were examined. Through this analysis, it was determined that the ideal temperature range for the efficient breakdown of polysaccharides while avoiding unfavourable side effects that could arise at overly high temperatures. The reaction time was yet another parameter that was examined. There is a best time frame for maximizing sugar output, and the hydrolysis process is not instantaneous. Hydrolysis times ranging from three to forty-eight hours were tested by the researchers. Through a methodical assessment, the ideal period to produce sugar without overly hydrolysing the mixture was analysed. The generation of bioethanol may be hampered by chemicals formed as a result of over-hydrolysis that obstruct the fermentation process. Acid hydrolysis of fruit peels for bioethanol production:
General Breakdown of Polysaccharides:
- i.)
Cellulose (main polysaccharide in peels):
(C6H10O5) n + n H2O ---- (H2SO4) --> n C6H12O6 (glucose)
- ii.)
Hemicellulose (another polysaccharide in peels):
(C5H8O4) x + x H2O ---- (H2SO4) --> various monosaccharide (e.g., xylose, arabinose)
These original monosaccharides (glucose, xylose, etc.) may go through additional degradation processes at high temperatures or with an excess of acid concentration, resulting in the formation of undesired by-products like furfural or hydroxymethylfurfural. These by-products may hamper the fermentation process that follows. Determining the optimal parameters (acid content, temperature, and reaction time) to maximize the yield of fermentable sugars and minimize the generation of inhibitory by-products is the main goal.
3.3. pH Modulation Parameters
This phase is essential for maximizing the effectiveness of the subsequent stages, presumably fermentation. The mixed sample's original pH was measured with a digital pH meter. For the acid hydrolysis step, the researchers tried to produce a slightly acidic environment between 5.0 and 5.5 because the activity of enzymes involved in fermentation is frequently sensitive to pH. They most likely used a 1 M sodium hydroxide (NaOH) solution to reach this desired pH (Abambagade et al., 2020). When used as a base, sodium hydroxide can gently raise the pH to the appropriate level by neutralizing part of the acidity.
3.4. Fermentation Medium and Yeast Microorganism
The collected Saccharomyces cerevisiae was marked as "active dry," implying it needed to be activated before use. However, an extra activation step was used to guarantee the best possible viability and performance throughout fermentation. This activation medium supplied the necessary nutrients for the yeast to grow because it was made with peptone, urea, magnesium sulphate, and a 5% sterilized glucose solution. After being activated for an hour at 38°C, the yeast culture was cooled to 30°C, which is a temperature that is better for fermentation (Abambagade et al., 2020). Subsequently, the hydrolysate mixture-containing fermentation flasks were filled with the activated yeast. For sterility, these flasks were placed on a shaking incubator set to 30°C and 200 rpm for a full day. They were then covered with aluminium foil. The homogeneous culturing and distribution of oxygen across the fermentation broth were facilitated by the controlled environment of a shaking incubator, which maintained a constant temperature and agitation level. The pH of the fermentation medium was probably changed after this first culturing time to make sure it stayed in the ideal range for the yeast to produce bioethanol efficiently.
3.5. Fermentation Process
The ideal conditions for producing bioethanol from the pre-treated fruit peels were achieved through a small-scale batch fermentation procedure. Compared to larger-scale setups, this technique is simpler and easier to handle, which makes it useful for preliminary experiments. For determining the optimal conditions, several parameters were evaluated, including temperature of 22°C to 43°C, pH of 4.5 to 6, amount of yeast inoculums of 0.5 to 3.5 g/L, and fermentation period of 24 to 96 hours. Each fermentation run started with a mixture of 10% hydrolysate (produced from papaya, mango, and banana peels) and 1% media. The 500-millilitre Erlenmeyer flasks were then filled with these solutions. The flasks were wrapped with aluminium foil and kept in a shaking incubator adjusted to 200 rpm and 30°C for three days to guarantee enough aeration and avoid contamination (Abambagade et al., 2020). An even and regulated environment was supplied by the shaking incubator to promote the best possible fermentation. The ethanol concentration in the fermentation broths was tested regularly to monitor development and identify the conditions that produced the most bioethanol. The fermented samples were probably distilled to remove any remaining bioethanol after 72 hours. To promote yeast growth and ethanol production during fermentation, nutritional supplements like minerals and nitrogen may be required. Sterile conditions are essential in larger-scale industrial fermentation processes to avoid contamination by undesirable bacteria. It becomes essential to use methods like aseptic inoculation and to keep surroundings sterile at all times.
3.6. Distillation Method
The last step in the purification of the bioethanol is distillation. The completed broth is centrifuged for ten minutes at 6000 rpm after the fermentation process (Abambagade et al., 2020. The solid components spin off as a result, leaving behind the supernatant, a clear liquid. The distillation column is then filled with this supernatant. The difference in boiling points between ethanol and the other ingredients in the combination is what makes distillation work so magically. The boiling point of ethanol is 78°C, which is lower than the boiling points of the other chemicals. This difference enables the distillation column's heating process to evaporate ethanol selectively. The vaporized ethanol then ascends and passes through the column. This is where a few more things are relevant: Packing material is a unique substance that expands the surface area for vapor-liquid interaction may be used to pack the column. Encouraging more contact between the descending liquid mixture and the rising ethanol vapour improves the efficiency of the separation process. A reflux condenser may be used in some distillation systems. A fraction of the condensed vapour can return to the column thanks to this condenser, the liquid that has refluxed aids in the additional purification of the ascending ethanol vapour. The ethanol vapour is condensed back into liquid form on the opposite side of the column by a cooling system, which frequently uses cold water circulation. When the distillation process is complete, the refined bioethanol is gathered in a conical flask.
3.7. Quantification of Bioethanol Production
3.7.1. Dichromate Test
The Dichromate Test is a traditional method that uses potassium dichromate (K2CrO7)'s oxidizing capabilities in an acidic (sulfuric acid, H2SO4) environment to serve as a qualitative confirmation for ethanol. A reaction happens when a possible ethanol-containing sample (distillate) is added. Ethanol (CH3CH2OH) is oxidized to acetaldehyde (CH3CHO) by the orange dichromate, which is also reduced to chromium (III) ions (Cr·⁺) (Alves et al., 2011; Mohd et al., 2017). A significant shift in the colour of the solution from orange (dichromate) to green (chromium III) indicates this reduction (Zimmermann and Kaltschmitt, 2022; Mark et al., 2005). This colour shift indicates a positive ethanol test, but it's crucial to keep in mind that false positives can also be caused by other reducing agents. Since the Dichromate Test is qualitative, it should be performed in conjunction with other techniques to provide a conclusive identification of ethanol.
3.7.2. Gas Chromatography
A highly effective technique for measuring the amount of ethanol produced during the bioethanol production process from fruit wastes is gas chromatography (GC). The procedure includes straining and maybe diluting the fermented broth before serving it. To ensure precise quantification, an internal standard is frequently added. After being injected and vaporized, a tiny sample is sorted in a long column according to its interactions with a stationary phase. Based on its distinct retention period relative to the standard, ethanol is identified and quantified by a detector, such as a flame ionization detector (FID) (Alves et al., 2011; Mohd et al., 2017). GC has several benefits such as by separating ethanol from other fermentation products, it makes precise and accurate measurement possible.
3.7.3. High-Performance Liquid Chromatography (HPLC)
The fermented broth is prepared for HPLC examination by removing solids and maybe adjusting its concentration for best results. The HPLC system is filled with a little sample. The sample is driven by a pressurized liquid mobile phase through a column filled with stationary particles. Based on how they interact with the stationary phase, ethanol and other fermentation products separate. As the separated components elute from the column, detectors such as an ultraviolet (UV) or refractive index (RI) detector measure them (Jayakumar et al., 2022). Finally, the signal's comparison to a calibration curve created using ethanol standards at known values yields the ethanol concentration. The power of HPLC is found in its capacity to extract and measure the remaining sugars, organic acids, and other fermentation products from the broth in addition to ethanol.
3.7.4. Enzymatic Assays
Enzymatic assays use enzymes, nature's specialized catalysts, to identify and quantify essential components throughout the process of production. For instance, the breakdown of cellulose, a significant portion of plant biomass, into fermentable sugars depends on cellulase activity. This activity can be measured using an enzymatic test, which shows how well the process turns biomass into sugars that can be used (Ward and Singh, 2002). Similarly, assays are available for measuring the content of glucose directly as well as for β-glucosidase, an enzyme that converts complex sugars into easily fermentable glucose (Saini et al., 2022). Alcohol dehydrogenase and other enzyme-based enzymatic tests can be used to quantify even the end product, ethanol. Enzymatic assays offer several benefits, including negligible interference from other broth components due to their specificity, sensitivity, and ease of setup, which makes them suitable for usage in laboratories.
3.7.5. Near-Infrared (NIR) Spectroscopy
NIR provides quick insights without changing the sample by analysing a sample based on how it interacts with near-infrared light. The generation of bioethanol is one area where NIR spectroscopy is quite useful. Numerous studies by different groups have shown that NIR spectroscopy can be used to monitor numerous parameters that are important for the process. The amount of fermentable carbohydrates, such as glucose, and the fermentation broth's original composition can be monitored using NIR. It can also monitor vital nutrients needed by yeast and other fermenting microbes. Through the monitoring of nutrient depletion, researchers can guarantee the best possible circumstances for the manufacture of ethanol. Through the examination of variations in the spectral fingerprint of the broth over time, scientists can monitor the conversion of sugar into ethanol and spot possible problems such as partial fermentation (Muhammad, 2023). The ultimate ethanol concentration in the broth may be measured using NIR spectroscopy, although good precision may require calibration using conventional methods like HPLC.
3.8. Analysis of Ethanol Content
The density of the samples was measured with a specific gravity bottle (pycnometer) by the researchers to estimate the amount of ethanol present in them. To determine the weight difference, the empty bottle had to be carefully weighed, filled with the sample, and then weighed again. After carefully substituting water for the ethanol, the bottle was cleaned once more, and the weight was recorded (Abambagade et al., 2020). Ultimately, a formula derived from these weights produced a quantity known as "specific gravity," which functioned as a crucial signal for determining the sample's ultimate ethanol concentration.
A summary about the Bioethanol production is shown in
Table 3.
4. Comparative Studies of Different Strains of Saccharomyces cerevisiae
Saccharomyces cerevisiae (S. cerevisiae) commonly called baker's yeast or brewer's yeast is the most widely utilized yeast for bioethanol production due to its excellent sugar usage and well-established fermentation pathways (Silva et al., 2022). The primary industrial source of first-generation ethanol is Saccharomyces cerevisiae (Ruchala et al., 2020; Zhang et al., 2023). Its main function is to ferment sugars such as glucose, fructose, and sucrose into ethanol and CO2. According to a study by, investigated how temperature and pH influence fermentation in S. cerevisiae strains ATCC 9804 and ATCC 13007. Lower pH generally favourable red ethanol production, while higher temperatures led to more biomass production. Strain ATCC 9804 produced more glycerol than ATCC 13007, except at a specific condition. Acetate production peaked at lower temperatures and lower pH (Tse et al., 2021). However, the severe circumstances encountered during the synthesis of bioethanol such as high temperatures and the presence of chemicals that restrict growth in particular feedstock often provide a challenge to traditional S. cerevisiae strains. The possibility of producing bioethanol from different fruit wastes using a thermotolerant S. cerevisiae isolate is called Sc-Gr. According to (Khatun, F., et al., 2023) in comparison to other isolates, Sc-Gr showed better thermotolerance and efficiently produced bioethanol from diverse fruit wastes across a range of fermentation conditions (Khatun et al., 2023). Reference strains S288C and EC1118 were compared with the recently sequenced yeast strains L20 and Ethanol Red genomes. The genomes were aligned to observe synteny, gene content, and structural changes (Nicoletta et al., 2022). The wine yeast L20, which is frequently observed, has a large translocation between chromosomes VIII and XVI that has been linked to improved tolerance to sulfur dioxide (Nicoletta et al., 2022).
4.1. Characterization and Isolation
Nine fruit samples (grapes, papaya fruit, bananas, guava, orange, or pineapple) were used to screen for thermotolerant S. cerevisiae strains. From these samples, Sc-Gr was recovered. Sc-Gr was identified as S. cerevisiae based on colony morphology (white and creamy) and biochemical traits (fermenting glucose, sucrose, and xylose but not lactose). Polymerase chain reaction (PCR) is potentially used to amplify the RSP5-C allele, a dominant gene associated with thermotolerance in S. Cerevisiae. The RSP5-C allele is linked to a more robust thermotolerant phenotype (Htg+) in S. cerevisiae strains. This implies that if Sc-Gr possesses the RSP5-C allele, it could be one of the factors contributing to its superior thermotolerance observed at 41°C (Tse et al., 2021; Gocalves et al., 2016). In the case of the RK1 sample, fruit waste samples (banana, mango, and grapes) were used. The samples were suspended in a liquid growth medium suitable for yeasts, such as YPD broth or Yeast Extract Peptone Dextrose. After diluting the suspension, solid YPD agar plates were plated with it. For several days, plates were incubated at an appropriate temperature (about 30°C) to promote the growth of yeast colonies. To obtain pure cultures, individual colonies of yeast were separated and streaked onto brand-new YPD agar plates. Under a microscope, isolated yeast colonies were inspected for the typical Saccharomyces cerevisiae characteristics, which include an oval or round shape, budding cells (daughter cells linked to the parent cell), and a size range of 3–10 micro-meters (Shah et al., 2019).
4.2. Thermotolerant Properties
Thermotolerance refers to the ability of an organism to survive and grow at high temperatures. This might involve analysing gene expression profiles or specific cellular adaptations present in Sc-Gr that allow it to thrive at higher temperatures. Sc-Gr and other isolates were grown in liquid media at different temperatures (30°C, 37°C, 41°C, and 45°C) for a specific time period (Khatun et al., 2023). Sc-Gr stood out among the isolates due to its superior thermotolerance, growing well at 41°C and minimally at 45°C. Through PCR amplification, the study examined the possible function of the RSP5-C allele, which is linked to thermo tolerance. This superior thermotolerance is a significant advantage for bioethanol production as it allows Sc-Gr to function efficiently at elevated temperatures, potentially leading to a more efficient fermentation process. Yeast strains known as Saccharomyces cerevisiae RK1 were obtained from fruit waste. Acid and salts were added to the fruit pulp beforehand to convert complicated sugars into simpler forms. The pre-treatment solution was combined with water, inoculated with the identified yeast, and fermented for a few days at 28°C. Concentrated bioethanol was obtained by distilling the liquid that was separated from the fermenting mixture using centrifugation. Throughout the entire procedure, the yeast's sugar intake and the total quantity of bioethanol produced were evaluated. Lastly, FTIR analysis was used to verify that ethanol was present in the finished product. In the case of the RK1 strain, a specific region of the ribosomal RNA gene (18s rRNA) was amplified using Polymerase Chain Reaction (PCR) with specific primers designed for this gene region. The amplified DNA fragment was sequenced and compared to existing databases using tools like BLAST to identify the closest match. In this case, the sequence matched that of Saccharomyces cerevisiae (Shah et al., 2019).
4.3. Bioethanol Production Potential
Sc-Gr has a strong potential for bioethanol generation from diverse fruit wastes due to its efficient bioconversion capabilities. According to (Khatun, F., et al., 2023) the effect of fermentation time (24 hrs, 48 hrs, and 72 hrs) on bioethanol concentration from various fruit wastes at 37°C and pH 5.0. Grape waste achieved the highest yield (7.92%) at 48 hours, suggesting efficient sugar utilization by Sc-Gr. Apple waste showed a steady increase in yield, reaching 7.60% at 72 hours, indicating slower but potentially complete sugar conversion (Khatun, F., et al., 2023). Banana and papaya wastes produced lower bioethanol concentrations (2.45% - 2.86%) compared to grape and apple. This could be due to factors like lower sugar content, the presence of inhibitory compounds in the waste, or limitations in Sc-Gr's ability to utilize specific sugars present in these fruits. Using the RK1 strain, the highest bioethanol production was observed after 4 days of fermentation for fruit pulp with and without sucrose. Also, adding sucrose (table sugar) to the fruit pulp increased bioethanol yield compared to using fruit pulp alone (Shah et al., 2019).
4.4. Thermotolerant Property Detection by Molecular Screening
A modified PrestoTM Mini gDNA Yeast kit protocol was used to extract genomic DNA from S. cerevisiae isolates. PCR was performed with specific primers to amplify a 600bp fragment of the RSP5-C allele, potentially linked to thermotolerance. The breakdown of the steps that describe the process of isolating genomic DNA from yeast isolates for polymerase chain reaction:
4.4.1. Cell Lysis and Centrifugation
A suitable volume (e.g., 100 μL) of lysis buffer is combined with a volume of, say, 500 μL of yeast cell solution. Typically, this buffer includes a detergent (such as sodium dodecyl sulphate, or SDS) that breaks down DNA-degrading enzymes and cell membranes. In a centrifuge, the solution is centrifuged at a high speed of 13,000 rpm for a predetermined amount of time of 5 minutes [76]. In the bottom of the tube of the centrifuge, a pellet is formed after the heavier cellular debris—such as cell walls, membranes, and organelles—is separated in this way. Released proteins, DNA, and other cellular constituents may be present in the supernatant, or clear liquid, that remains above the pellet. This supernatant will be collected for additional processing.
4.4.2. Heat and Freeze-Thaw Cycles
Thermal Water Bath takes around 5 minutes. Once the particle has been disposed of, the collected supernatant roughly 400 μL is moved into a fresh tube. This tube is submerged in a hot water bath kept at a high temperature of 95°C. This heat treatment breaks down cell membranes even more and makes it easier for DNA to come free from cellular debris. The tube is immediately placed in an ice bath of -20°C after the hot water bath and left up until the solution inside is noticeably cold. This sudden shift in temperature can further lyse any remaining cell components and encourage DNA release. The full cycle of centrifugation (separating debris), hot water bath (additional cell lysis), and ice bath (stimulating DNA release) are done once more to guarantee complete cell lysis and maximum DNA yield (Khatun, F., et al., 2023).
4.4.3. Protein Removal and Centrifugation
Following the last freeze-thaw cycle, the supernatant is mixed with a predetermined amount (such as 200 μL) of protein removal buffer. Usually, this buffer has ingredients that precipitate and bind undesirable proteins to remove them from the mixture. The mixture is thereafter subjected to another centrifugation (for instance, 13,000 rpm for 5 minutes) to isolate the solution containing DNA from the one containing proteins (Khatun, F., et al., 2023).
4.4.4. Isopropanol Precipitation
The residual supernatant of 200 μL after protein removal is carefully mixed with a predetermined volume of 400 μL of isopropanol. Compared to DNA, the alcohol isopropanol has a lesser affinity for water to (Khatun, F., et al., 2023). The DNA precipitates clumps together out of the solution due to this affinity difference, generating a noticeable white pellet. To guarantee that the isopropanol and solution are well mixed, the solution is entirely tapped into the tube. After that, it is incubated at room temperature for a certain amount of time of 10 minutes to allow for complete DNA precipitation. The solution is centrifuged again (e.g., 13,500 rpm for 10 minutes) to collect the DNA pellet at the bottom of the tube.
4.5. Isolating a Stress-Resistant Yeast Strain for high-gravity (HG) fermentation
A mutagenesis method was used in a study to isolate a stress-resistant strain of yeast for high-gravity (VHG) fermentation. To introduce random mutations, Saccharomyces cerevisiae Y-1, the initial strain, was repeatedly frozen and thawed. After mutagenesis, colonies that demonstrated resistance to high glucose and ethanol concentration media—both of which stress yeast during VHG fermentation—were identified from the ensuing yeast population. When compared to the parental strain, YF10-5 showed superior tolerance to osmotic and ethanol stress, making it the best-performing colony among the screened ones (Zhang et al., 2019). Moreover, YF10-5 outperformed Y-1 in VHG fermentation efficiency, yielding a noticeably greater concentration of ethanol. The data in
Figure 1 indicate that YF10-5's enhanced stress tolerance and fermentation capacity would be a good option for industrial VHG fermentation procedures. As shown in
Figure 2.
4.6. Comparison of SC-GR Strain and RK1 Strain
4.6.1. Substrate Specificity and Sugar Utilization
SC-GR Strain: Exhibits exceptional versatility in sugar fermentation. Research suggests it can efficiently ferment various sugars like glucose, xylose, and arabinose. This is a significant advantage if the feedstock for bioethanol production contains a complex mixture of sugars. Studies have shown promising results for SC-GR about xylose fermentation, achieving high conversion rates to ethanol. This could be particularly beneficial for utilizing lignocellulosic biomass, a potential second-generation feedstock rich in xylose. RK1 Strain: A well-established strain known for its ability to ferment glucose to ethanol. While effective with glucose, RK1 may not be as versatile as SC-GR for handling a wider range of sugars like xylose and arabinose (Tesfaw and Assefa, 2014). A comparison is shown in
Table 4.
4.6.2. Ethanol Yield
SC-GR Strain: It can tolerate various stress factors, potentially translating to good ethanol yields under non-ideal fermentation conditions. However, specific yield values may vary depending on the strain variant, fermentation conditions, and the interplay between stress factors.
RK1 Strain: It is known for its reliability and consistent ethanol production, though yields might be lower compared to SC-GR (Yang et al., 2022; Varize et al., 2022).
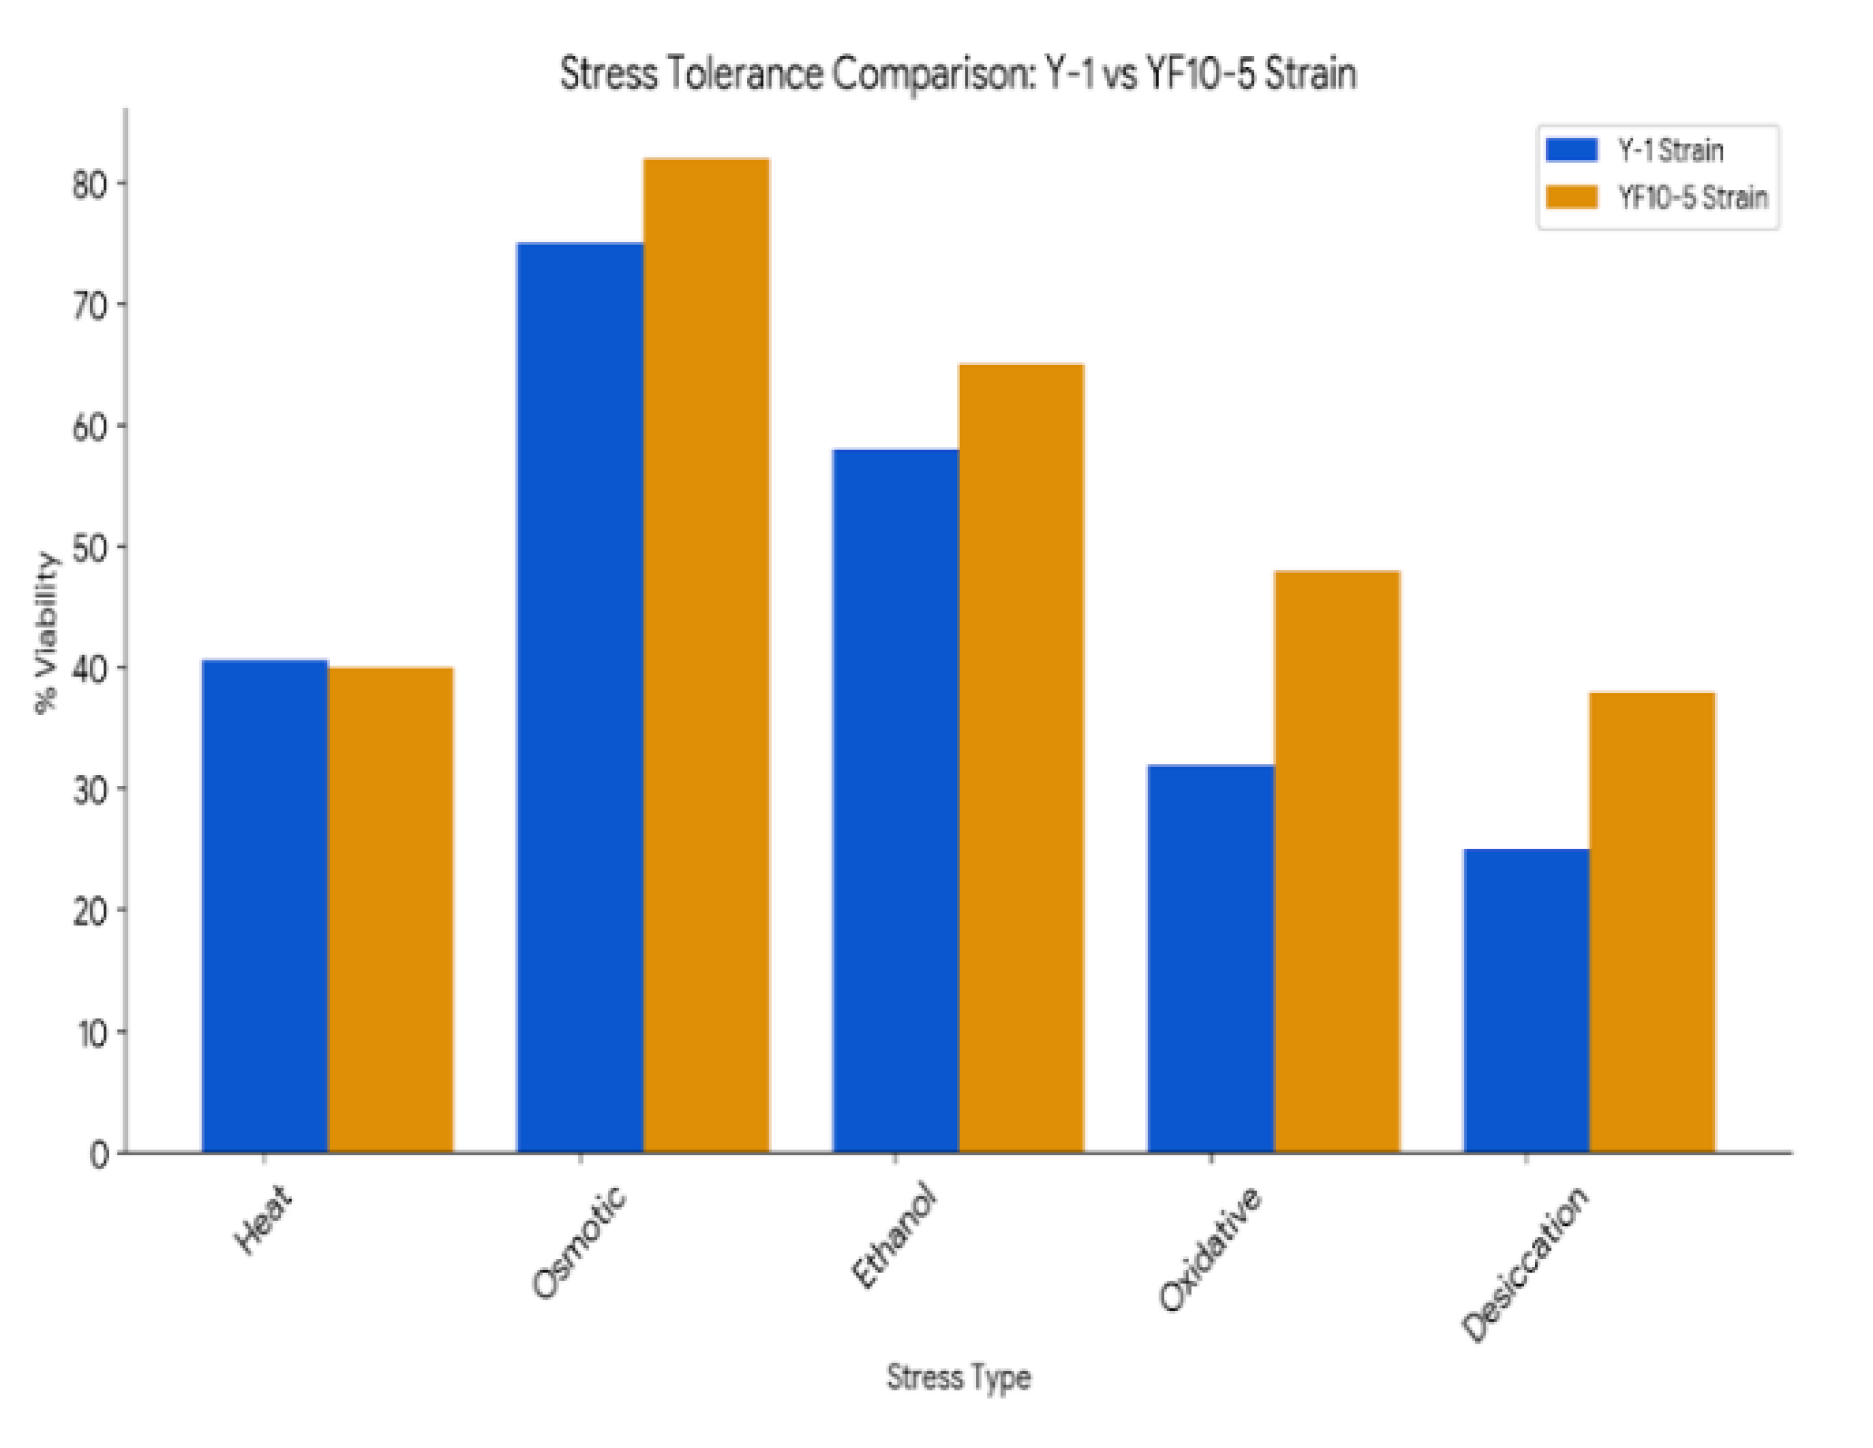
4.6.3. Stress Tolerance
SC-GR Strain: It can tolerate a wider range of fermentation stresses compared to RK1. This strain performs relatively better in acidic or alkaline fermentation conditions (Mulugeta et al., 2024) .
RK1 Strain: RK1 shows tolerance to inhibitors like furfural, a common by-product in lignocellulosic biomass conversion.
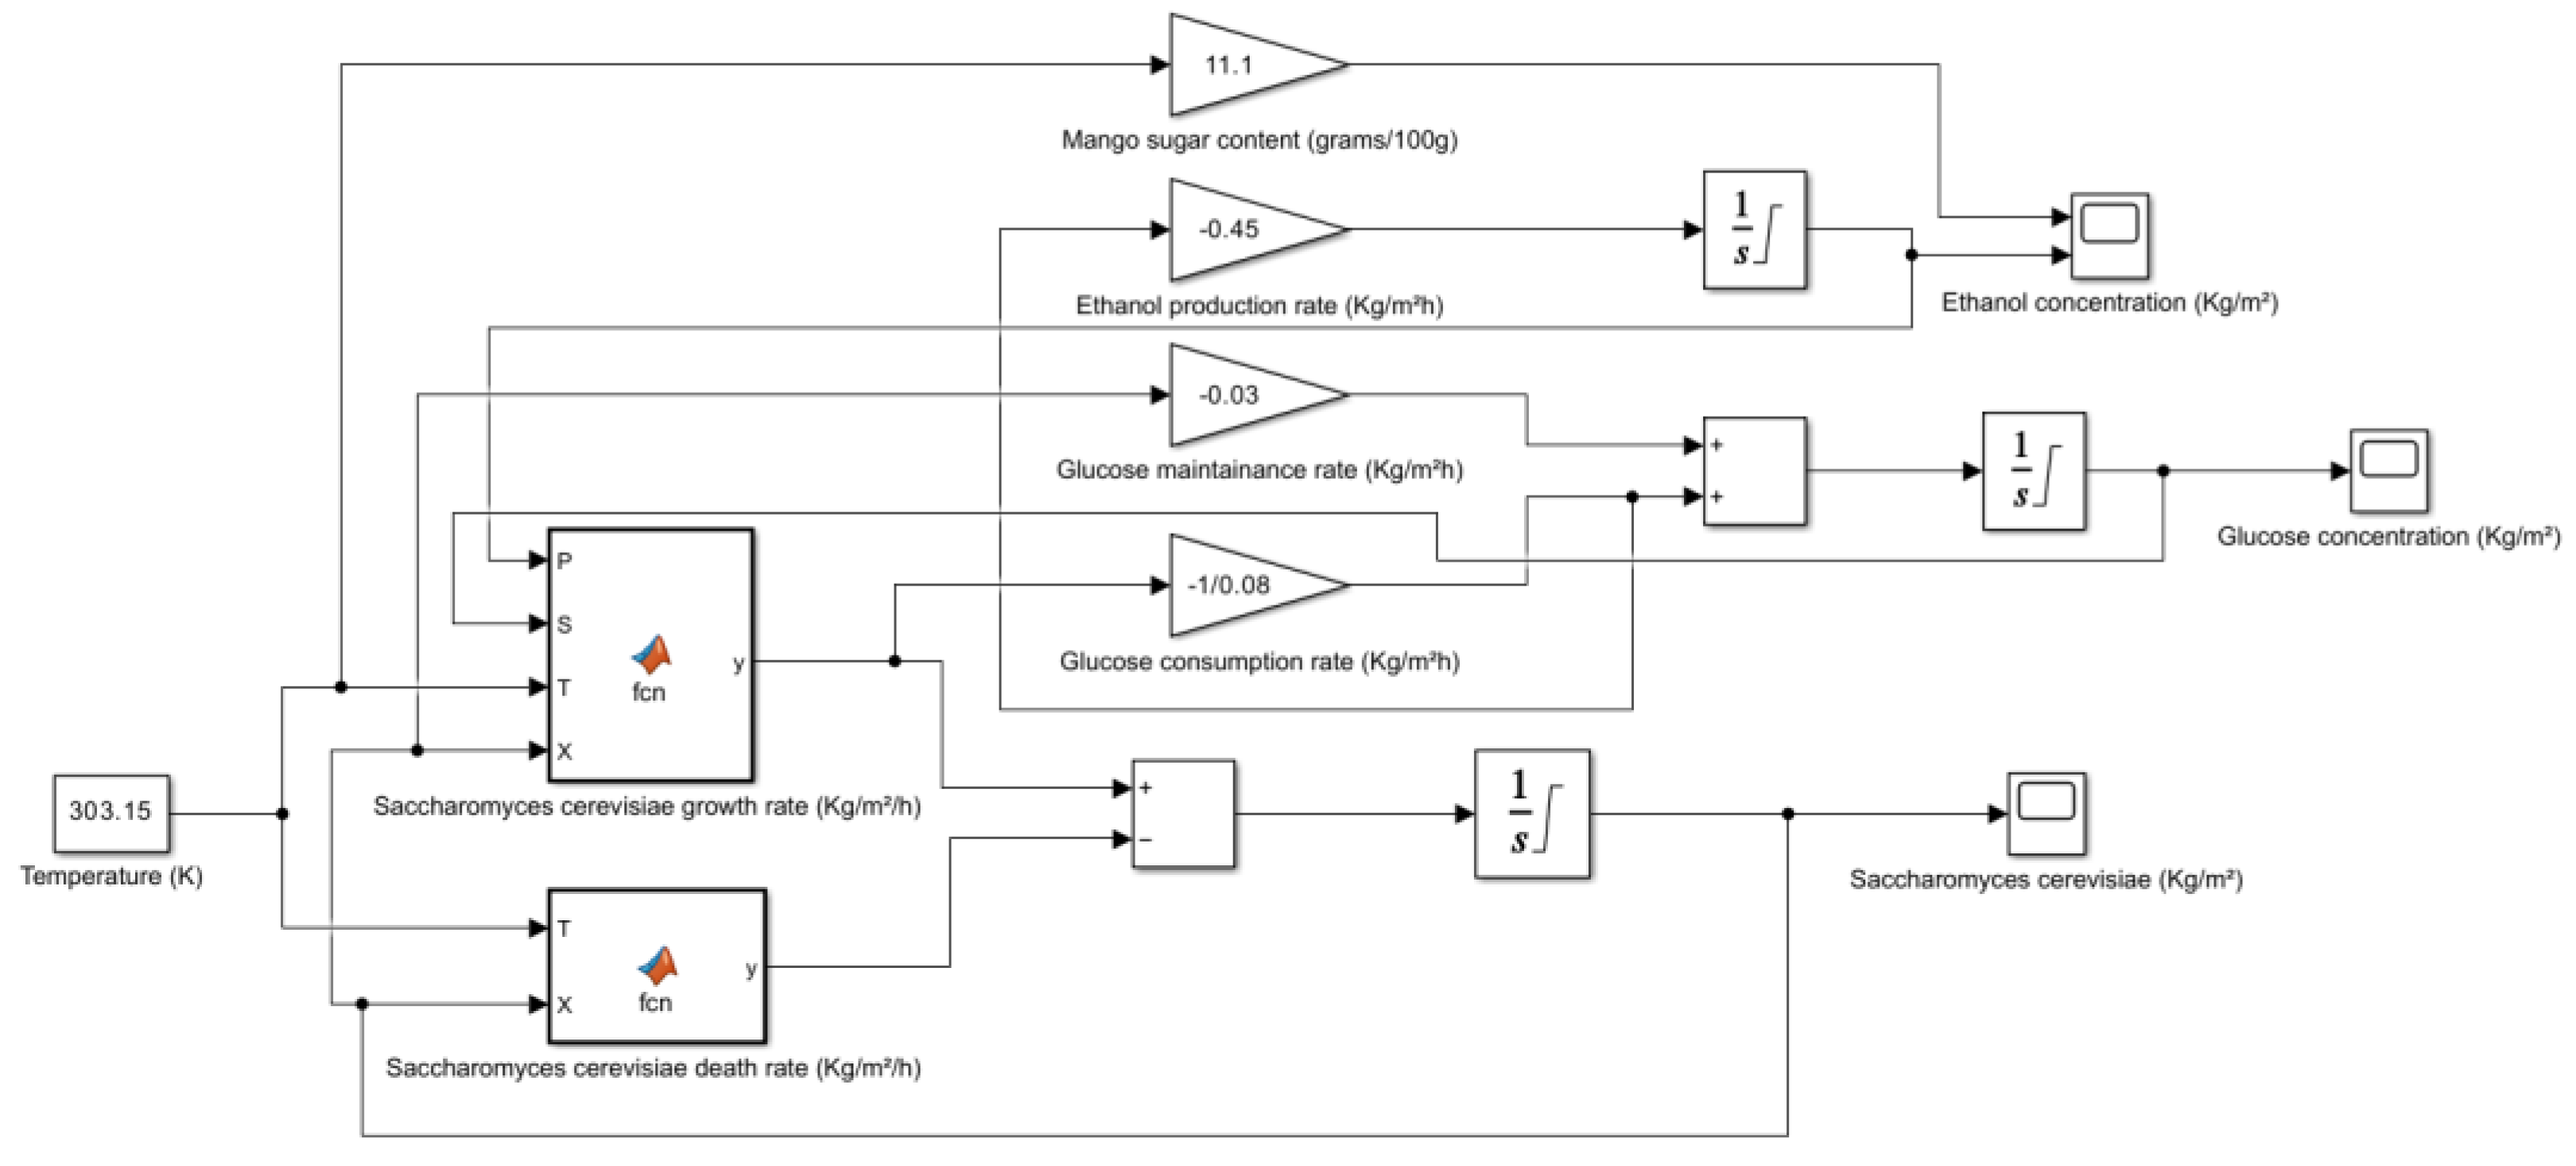
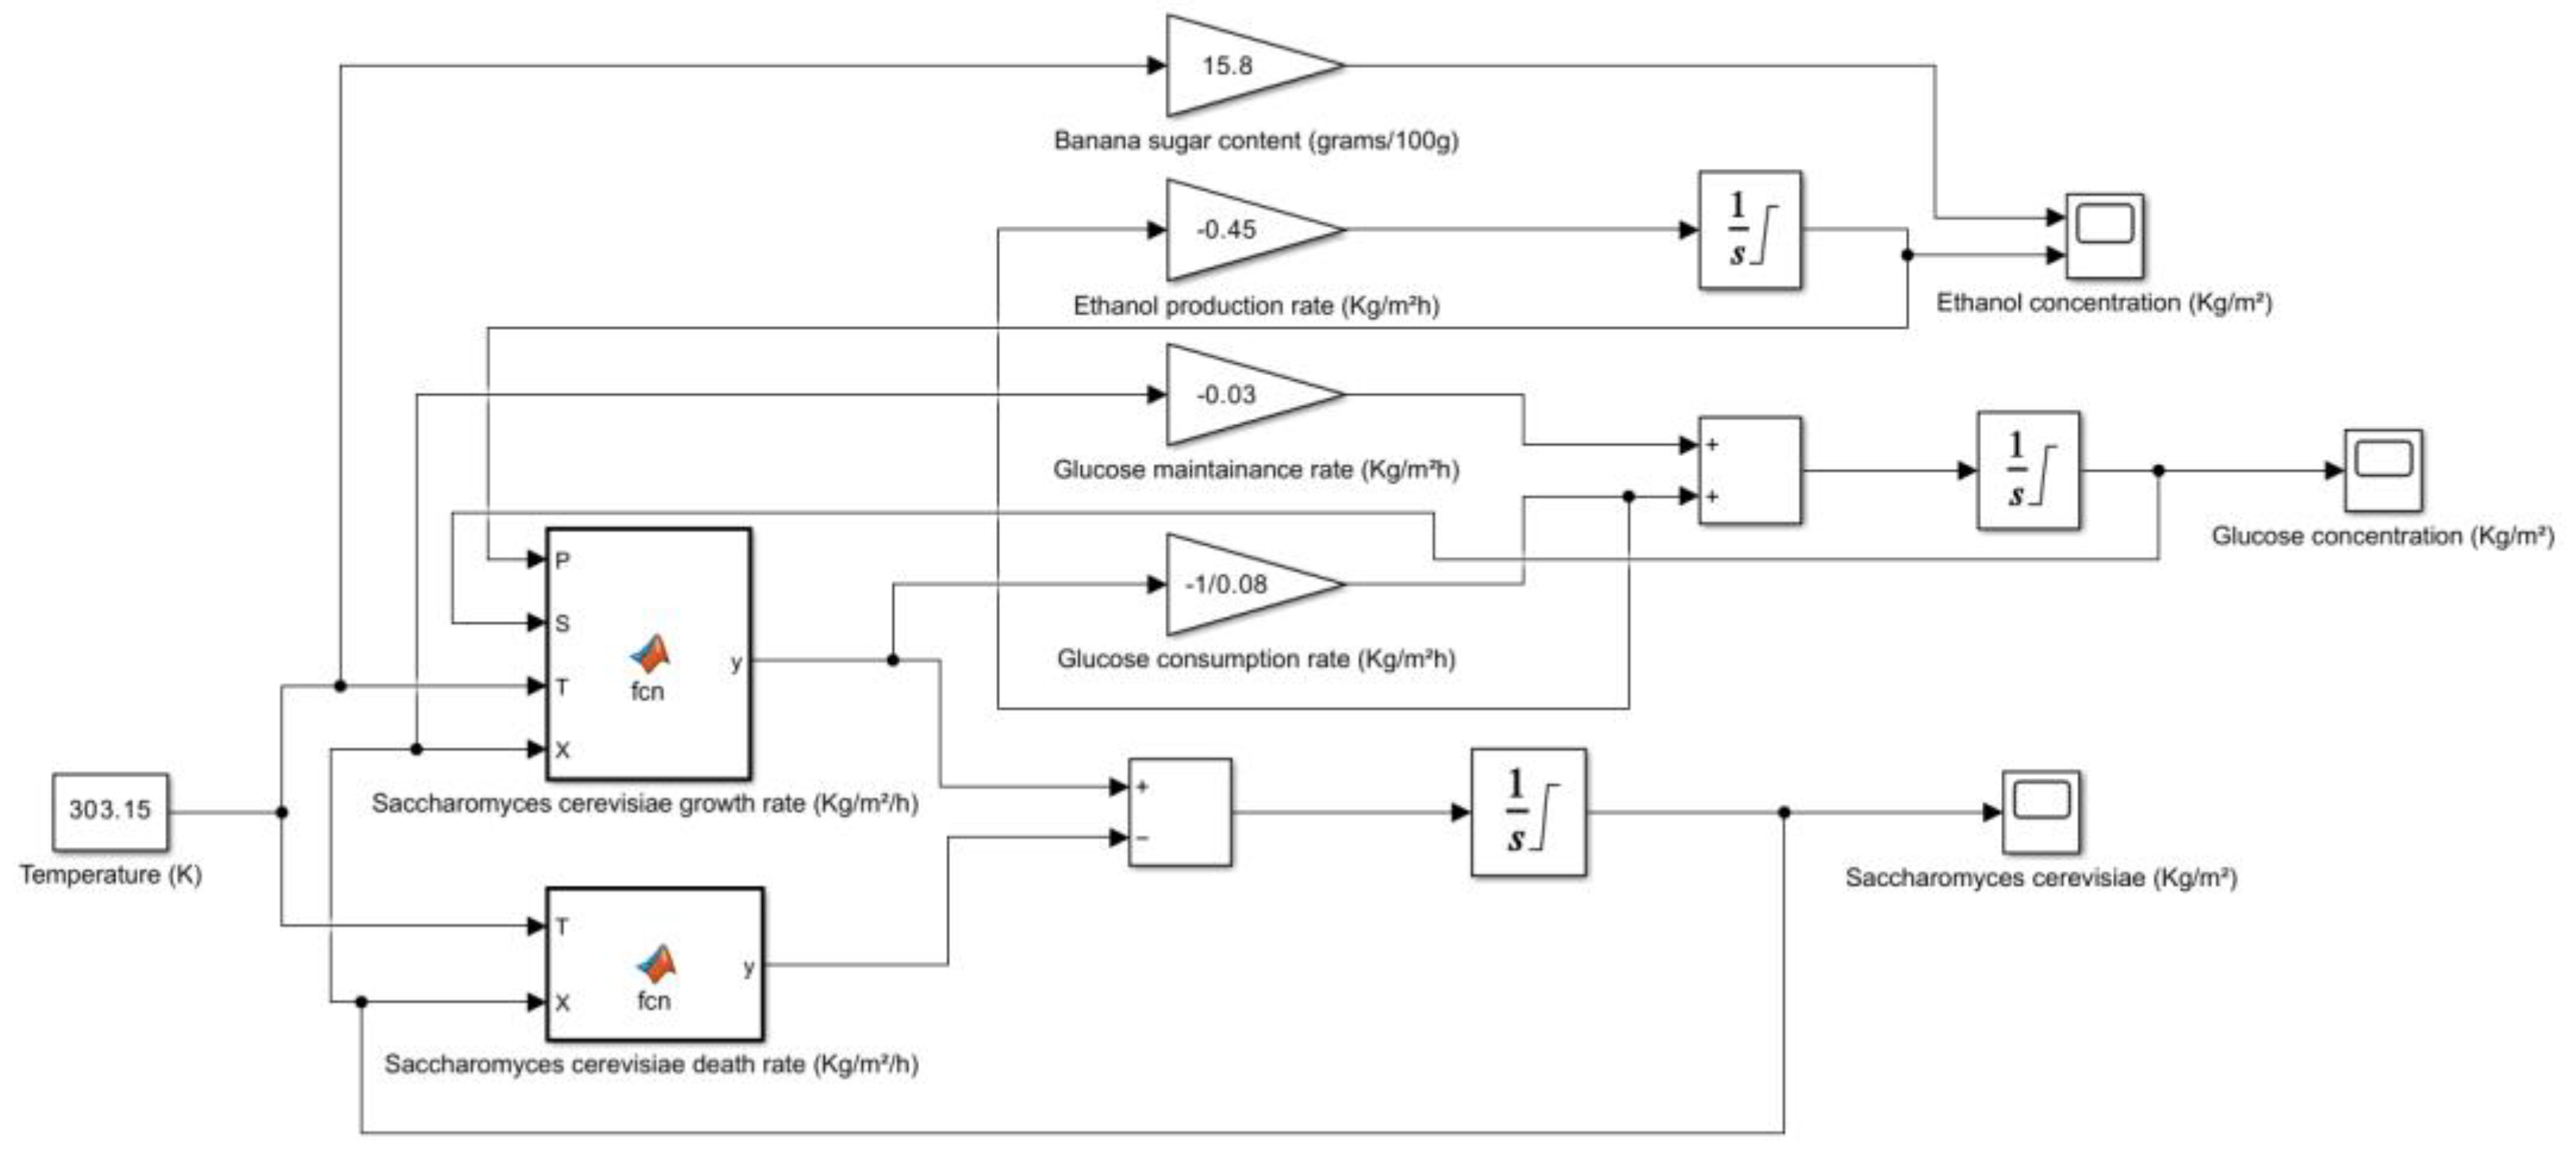
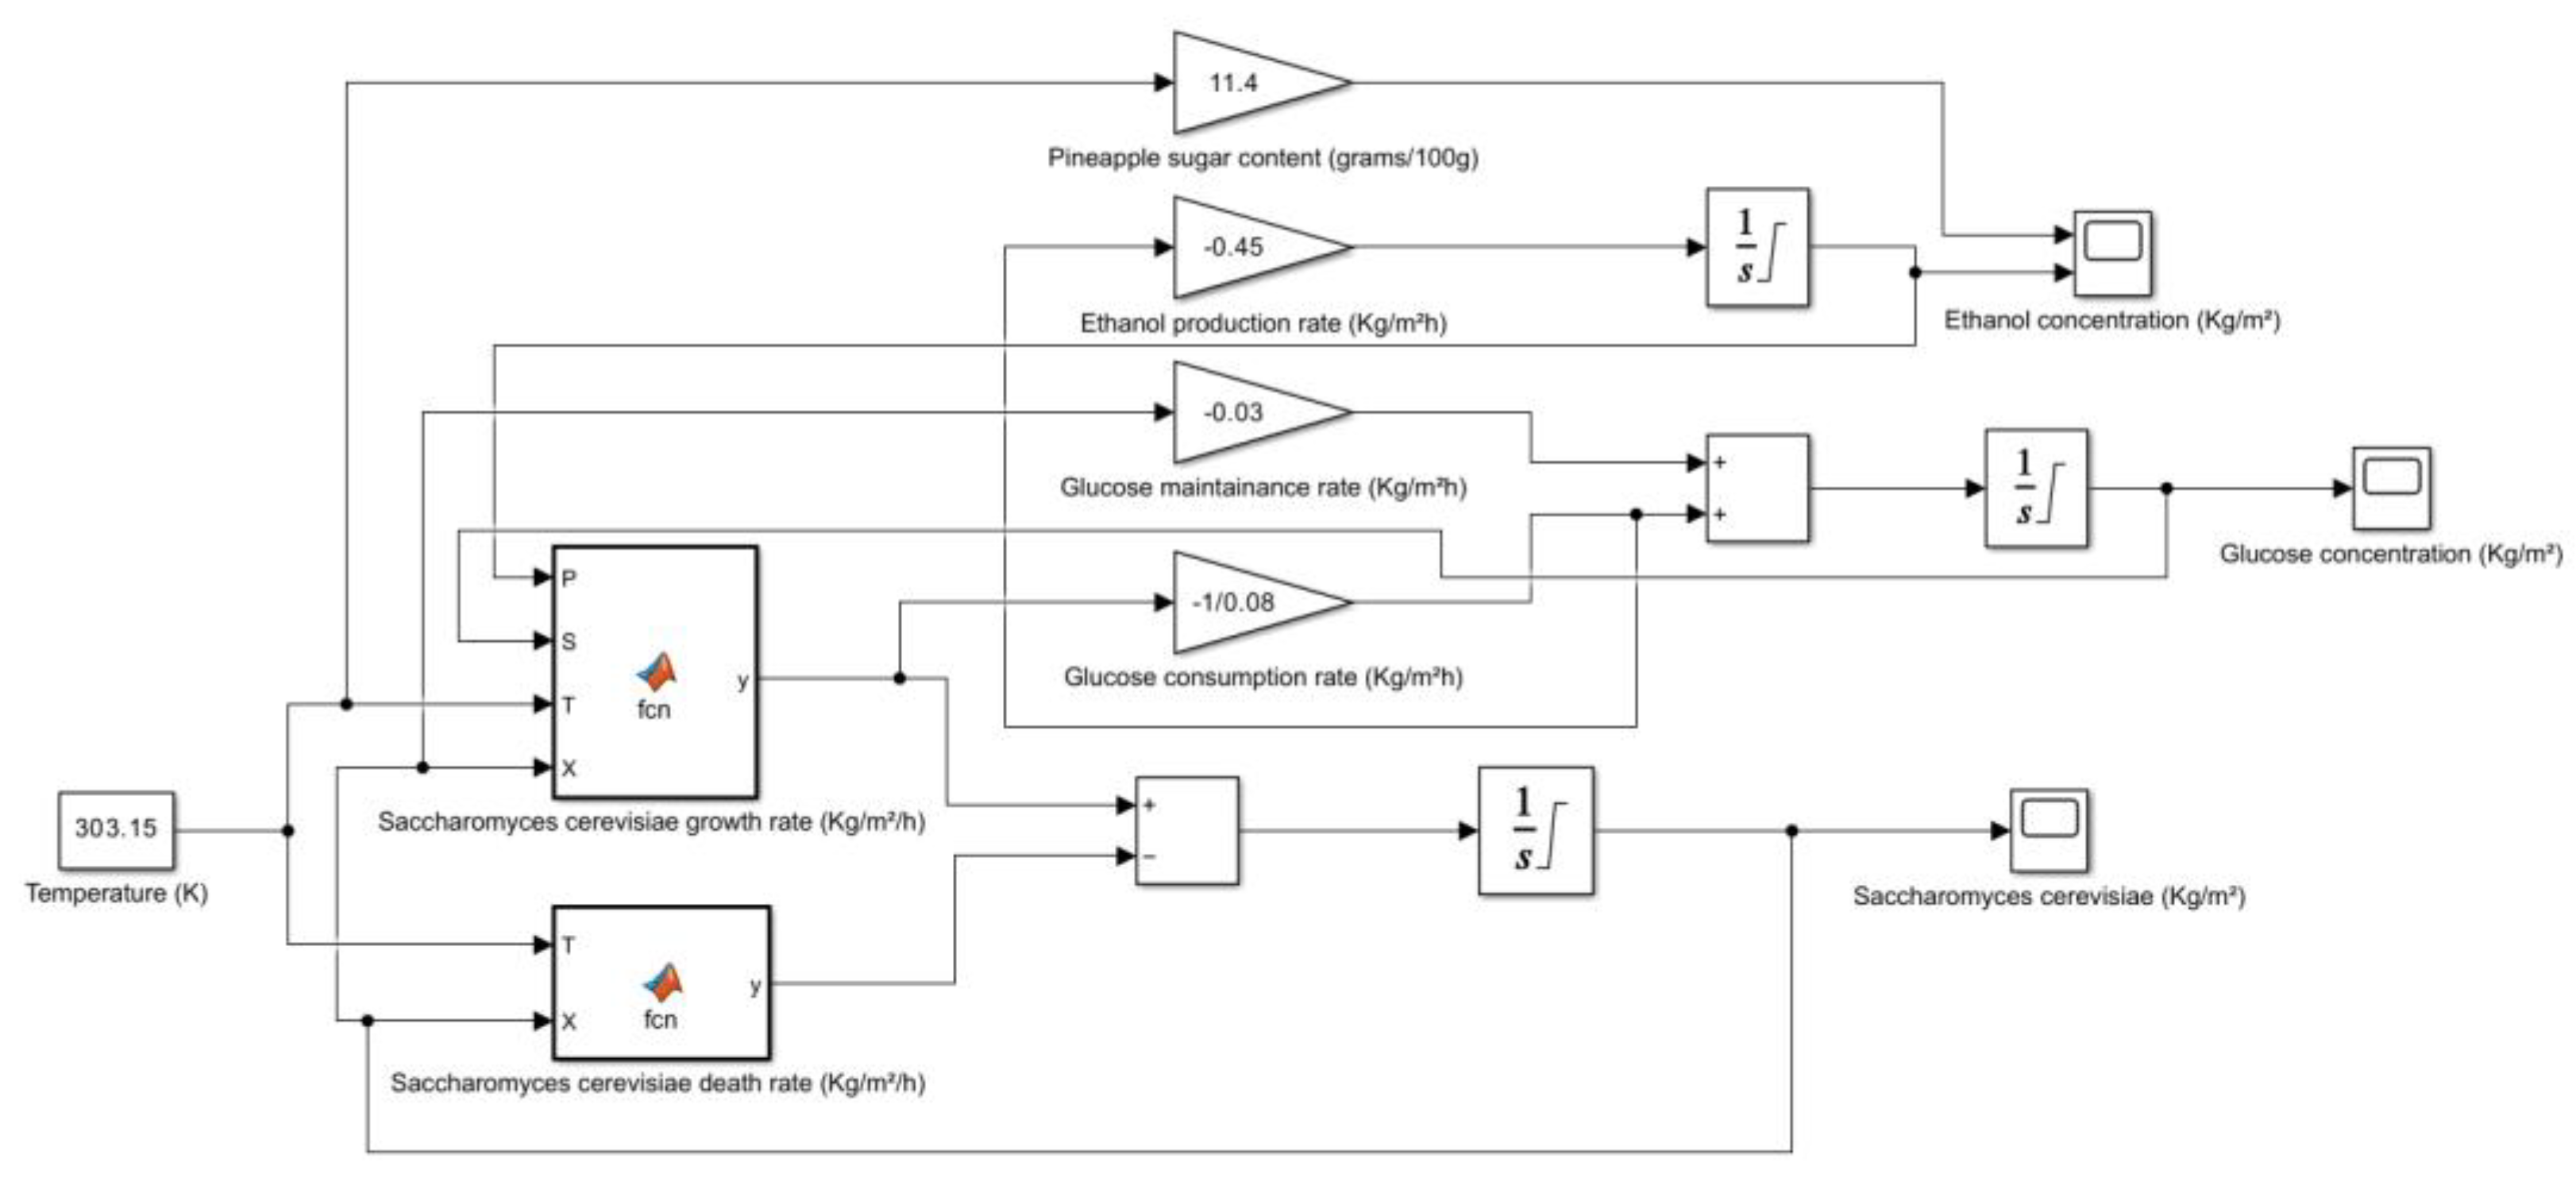
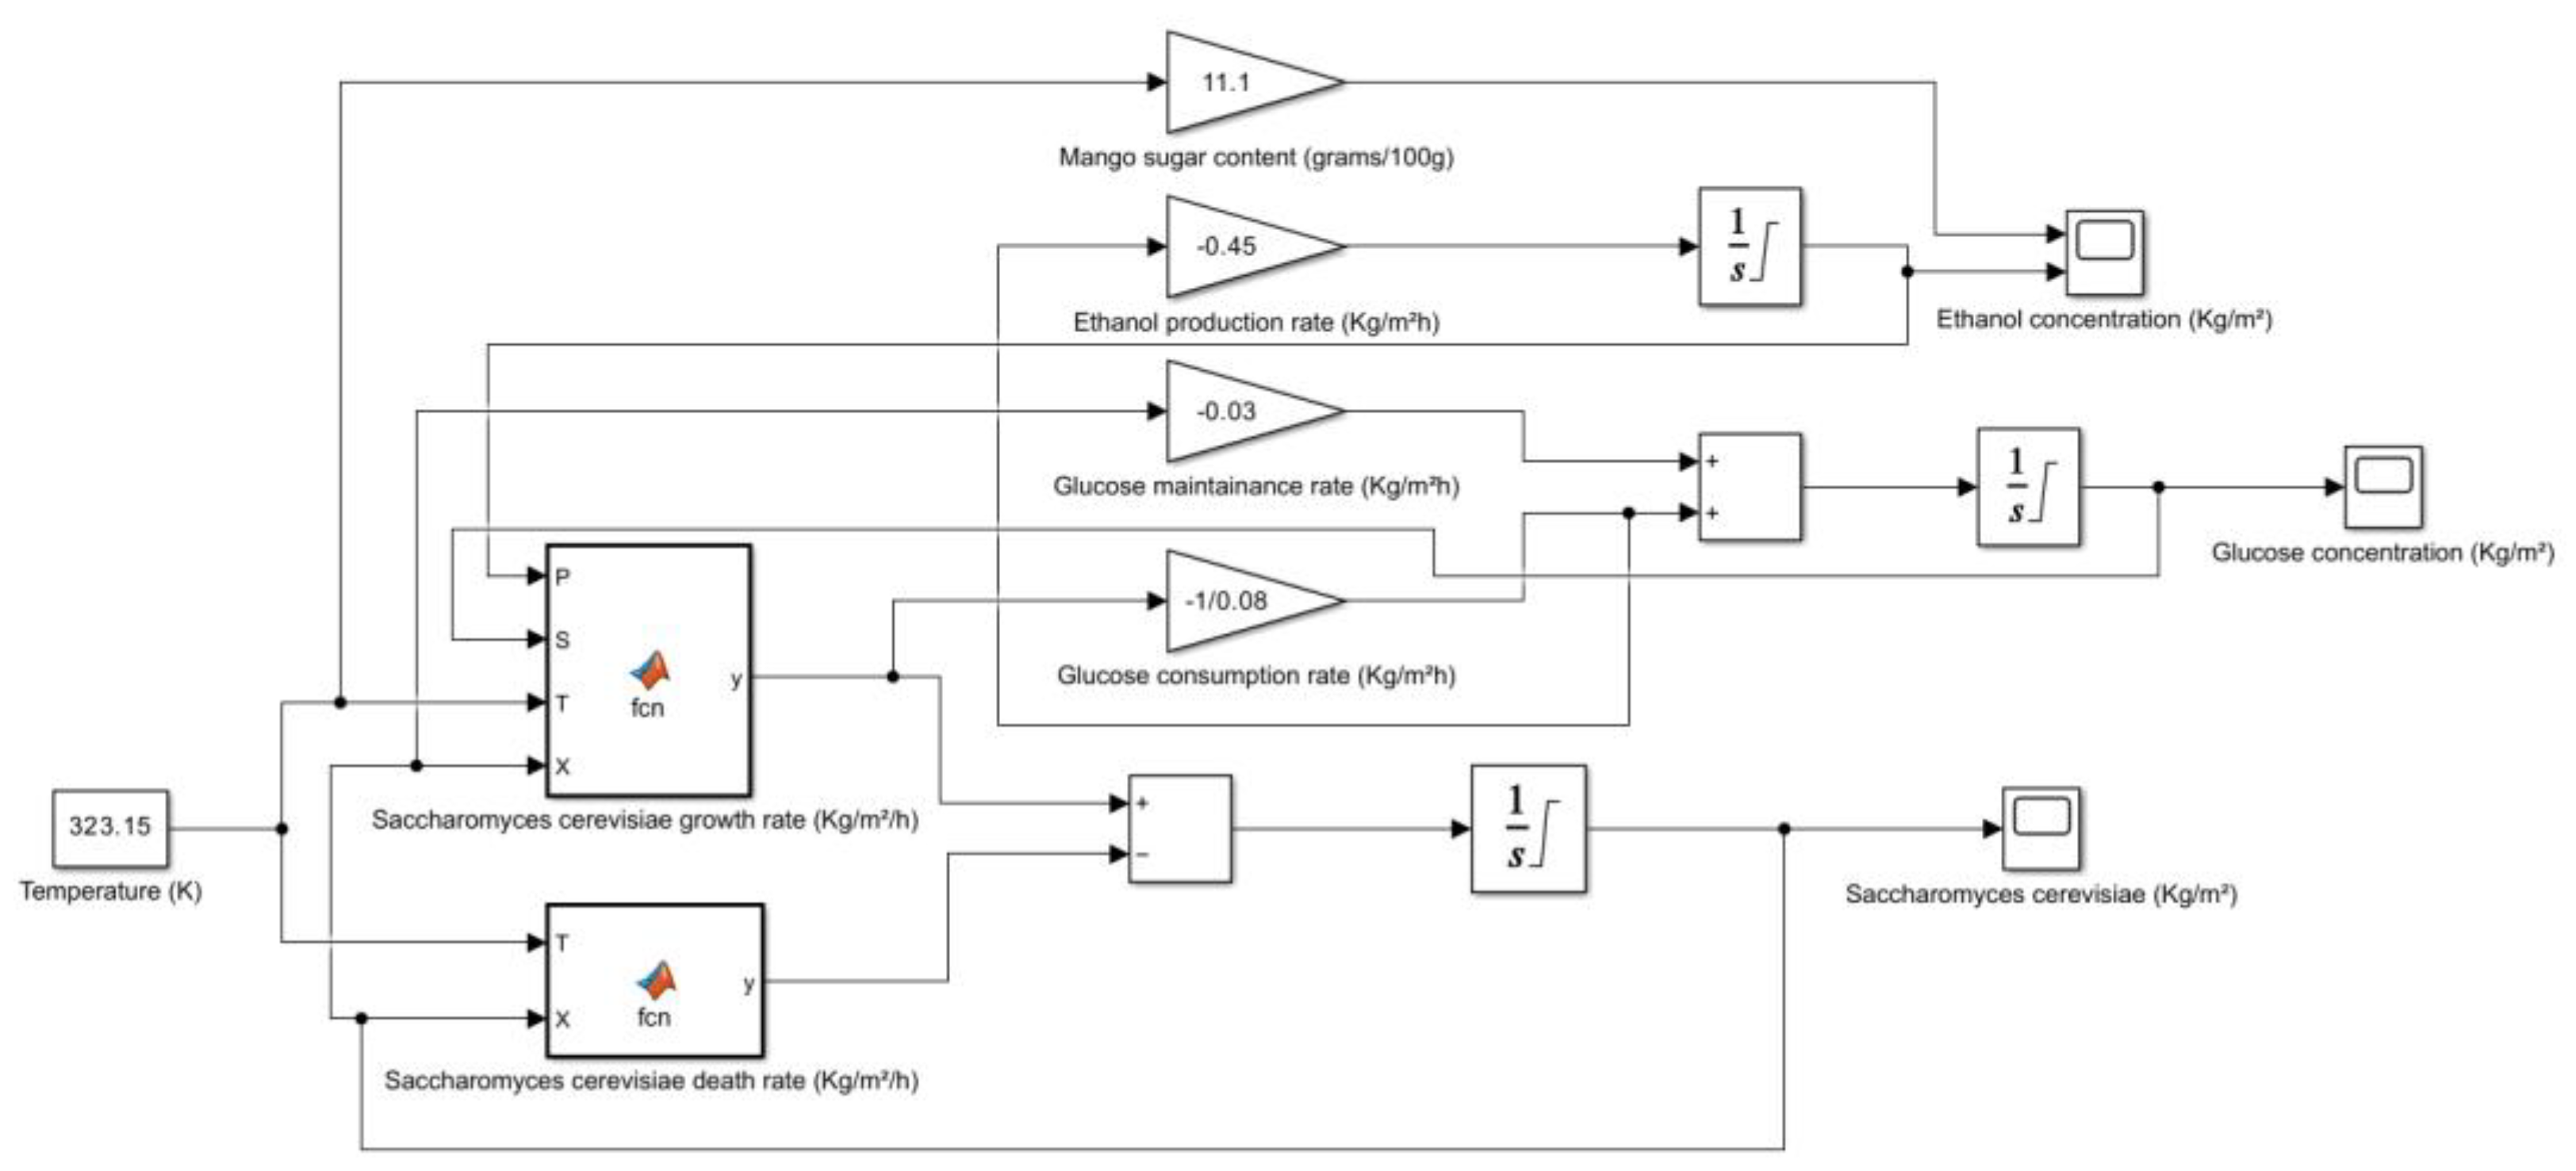
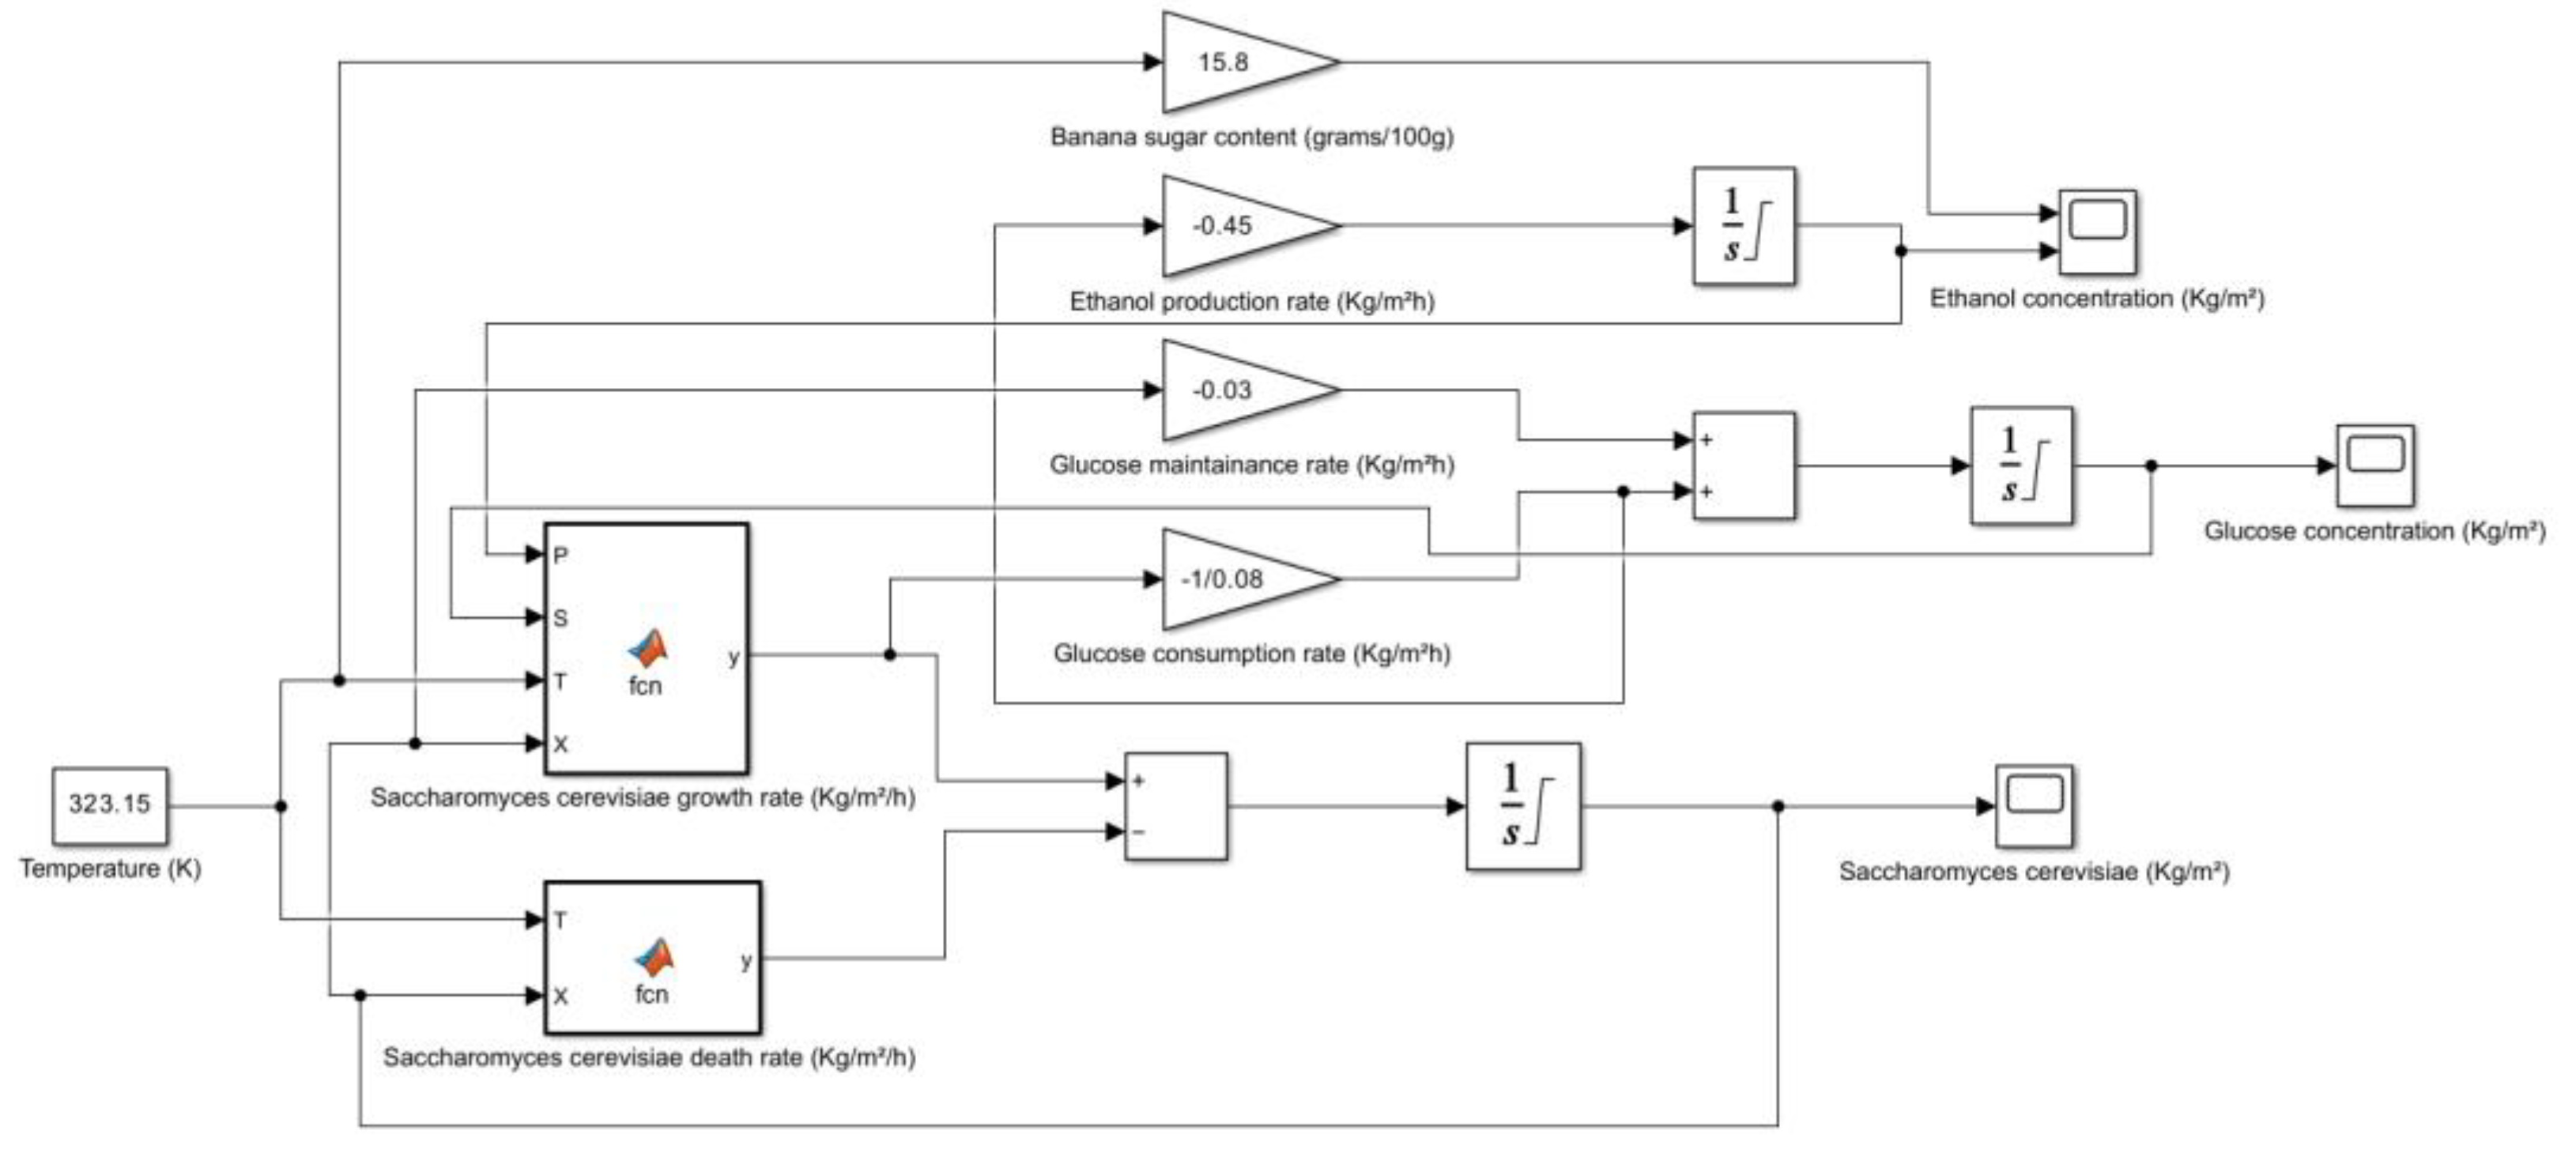
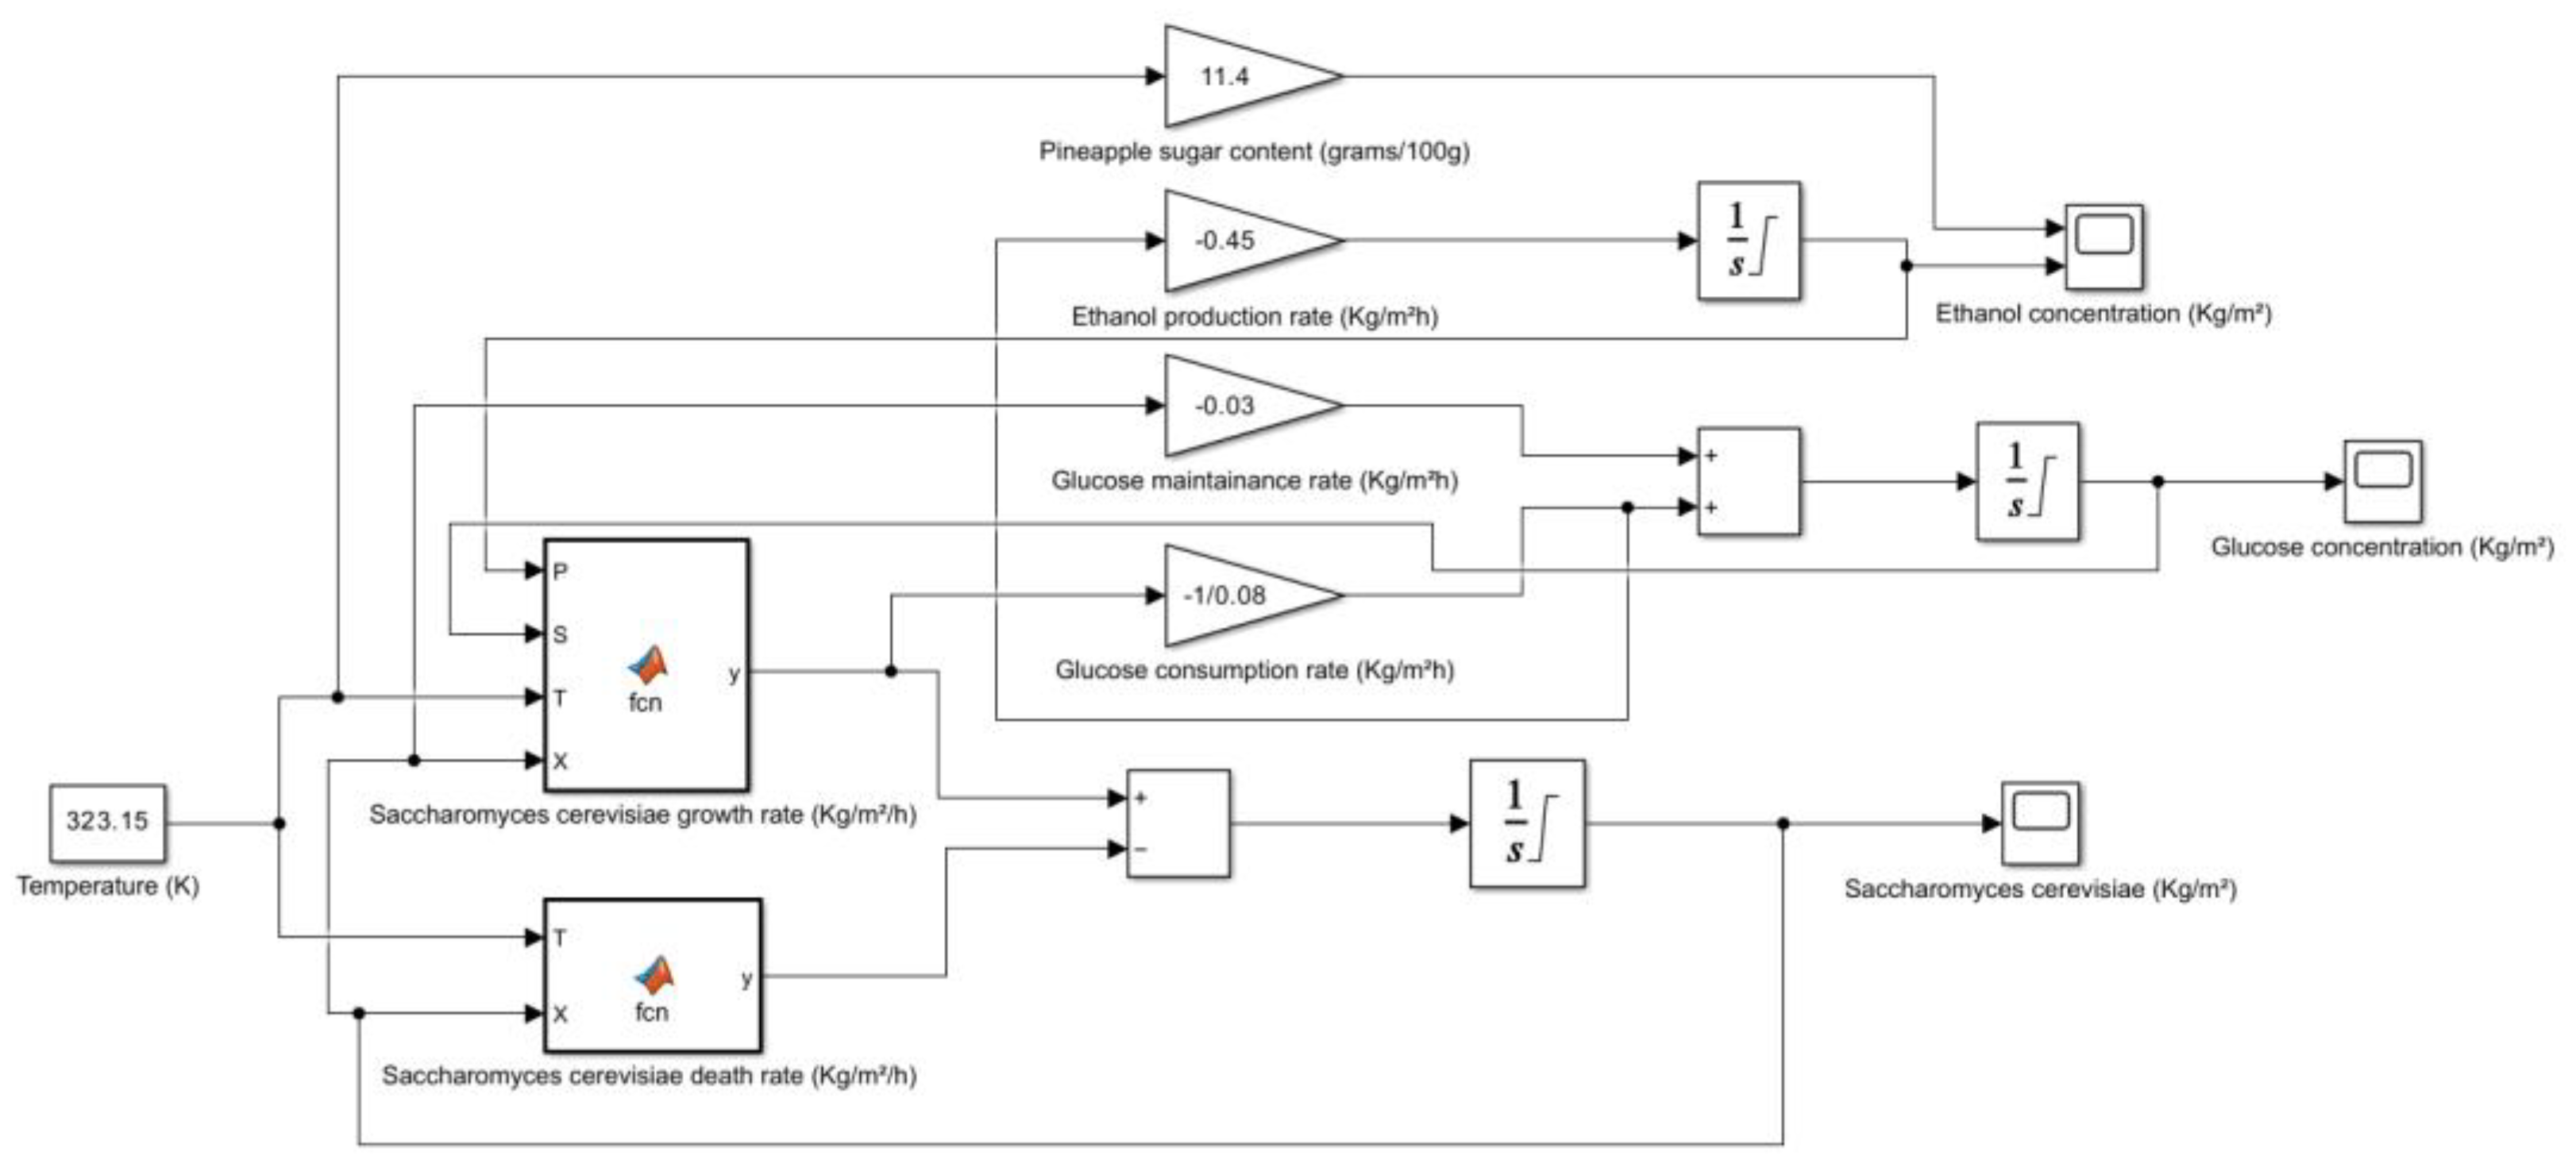
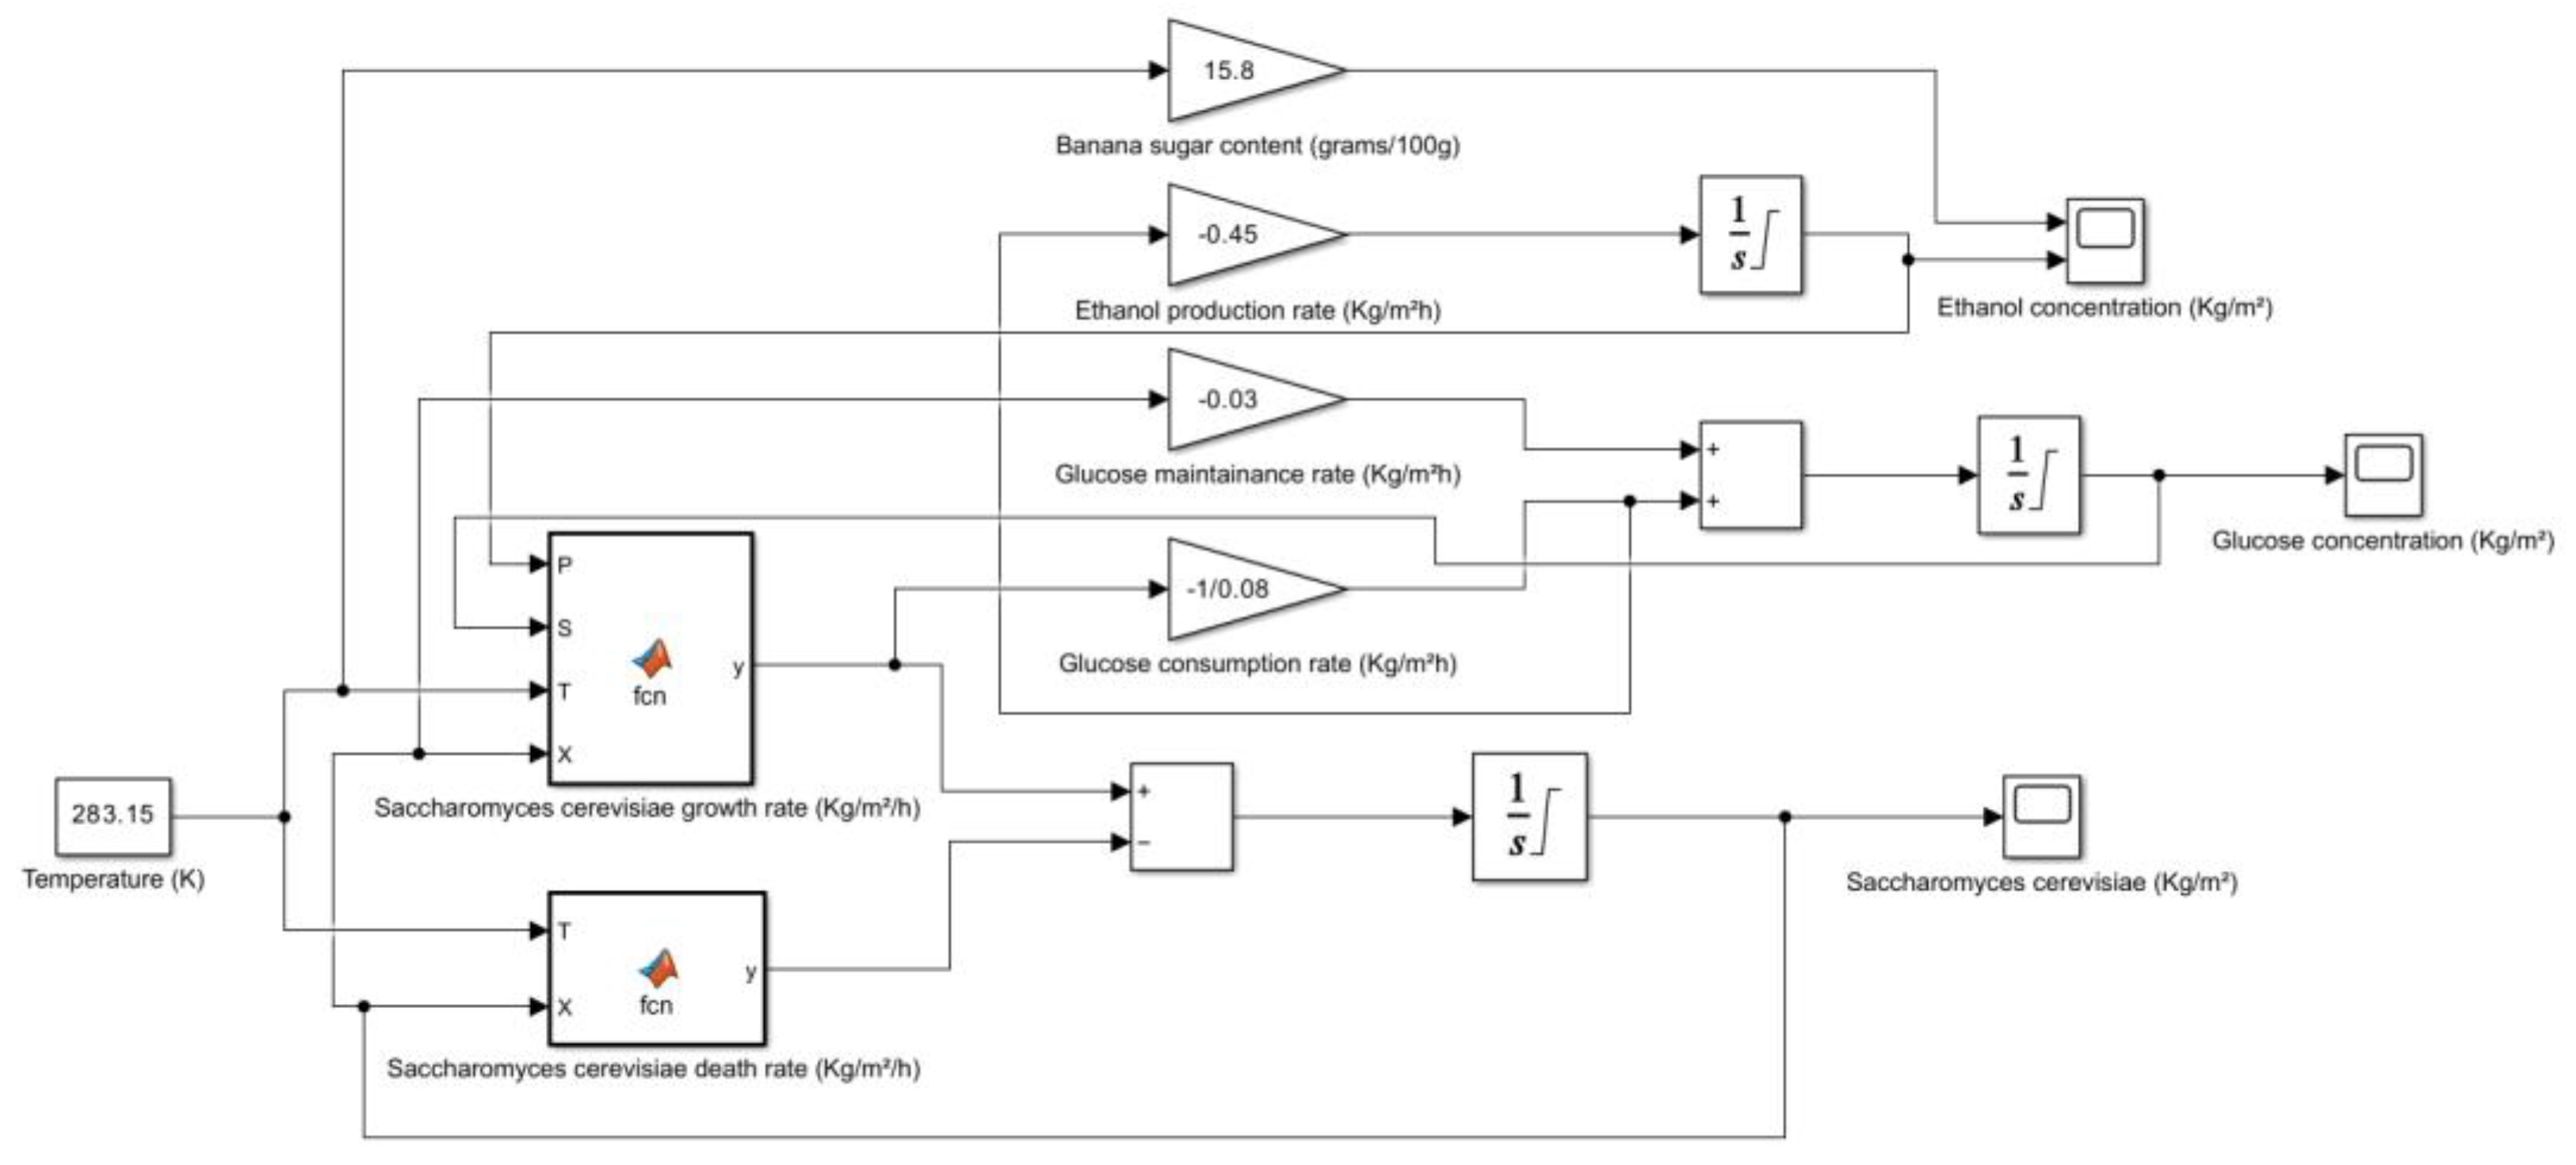
5. Kinetic and Simulation model of Saccharomyces cerevisiae for the production of Bioethanol
Understanding the growth dynamics and metabolic activities of Saccharomyces cerevisiae especially in commercial fermentation applications or industrial environment is important and it further requires kinetic modelling. The microbial growth kinetics has the following expression.
The above equation covers the dynamics of microbial growth in a thorough manner especially for organisms such as Saccharomyces cerevisiae . This model incorporates a number of chemical and biological processes that have an impact on product generation, growth, and substrate consumption. The rate at which the biomass concentration ([X]) changes over time is denoted by the expression d[X]/dt. It shows the evolution of the microbial population throughout time. When there is an abundance of substrate, the microorganisms' maximum specific growth rate, or the represents the quickest pace at which the population can increase. The concentration of the limiting substrate that is accessible for microbial growth is indicated by [S]. This substrate's availability is essential for growth. The substrate concentration at which the specific growth rate is half of is known as the half-saturation constant, or Ks. It shows the microorganism's affinity for the substrate. Therefore, the stronger affinity is indicated by lower values. [P] stands for the concentration of a product produced during microbial development which by estimating at a given level, may prevent more growth. The highest concentration of the product that can be tolerated before it begins to adversely impact growth is known as [P] max. The parameter n indicates how much growth is impacted by product inhibition. As product concentration rises, a larger n value denotes a stronger inhibitory action. The death rate constant, or kd term, indicates how rapidly cells in a culture die or lose their viability. The term [X] represents the biomass concentration, which is influenced by both growth and death processes. The Inhibition Model is a model that takes into account the effects of product inhibition, which are important in fermentation processes since products like ethanol can build up and prevent future growth.
The equation essentially combines several factors affecting microbial growth such as the first part, which follows a Monod-type relationship indicating that growth depends on substrate availability. The term accounts for product inhibition, suggesting that as product concentration increases, it negatively impacts growth. The subtraction of kd incorporates cell death into the model, allowing for a more realistic representation of microbial population dynamics. The Monod equation serves as the basis for most microbiological models and explains how microbial growth rates are influenced by substrate concentrations. Growth rates rise with substrate availability but plateau at high concentrations, a phenomenon known as the saturation effect.
The expressions for substrate consumption and product creation kinetics are critical to understanding microbial growth processes. The kinetics of substrate consumption can be written as follows.
In this case,
symbolizes the biomass yield coefficient from the substrate, while the energy cost of sustaining the microbial population during growth is taken into consideration by the maintenance coefficient, m. The product formation kinetics has the expression:
denotes the yield of product from substrate. Higher temperatures typically result in higher reaction rates because they cause more molecular collisions allowing enzymes and substrates to interact more frequently. The maximum specific growth rate can be represented as follows, also reflects this effect.
At ideal temperatures at about 30°C for fermentation operations, microbes like Saccharomyces cerevisiae grow more quickly, as indicated by the tendency for to increase with temperature. However, denaturation causes an enzyme's activity to decrease above a specific temperature threshold. This ultimately affects yield and efficiency by lowering the effective catalytic activity of the enzymes engaged in substrate conversion. This process is called as denaturation risk. Changes in Substrate Affinity is when the affinity of enzymes for their substrates can also be changed by temperature. Higher temperatures can have varying effects based on substrate concentration since they can decrease the affinity for insoluble substrates while simultaneously increasing the catalytic rate.
Overview of the Simulation Model
The development of a simulation model for predicting the dynamics of Saccharomyces cerevisiae -mediated microbial fermentation is described in this section. Numerous kinetic and process parameters that affect substrate consumption and product production are included in the model. One important kinetic parameter in the model is the Half-Saturation Constant (), which has a value of 1.7 kg/m3. The substrate concentration at which the microorganism's growth rate drops to half of its maximal value is indicated by this metric. A lower value shows the microorganism's stronger affinity for the substrate, in this case glucose. With a value of 93 kg/m3, the Maximum Product Concentration () is an important model parameter. This figure acts as a crucial modelling restriction and indicates the maximum product concentration that can be achieved during the process of fermentation.
The efficiency of converting substrates into biomass and product is determined by the Yield Coefficients, and . With a value of 0.08 for 0.08 kg of biomass is created for every kg of substrate that is consumed. Likewise, has a value of 0.45, meaning that for every kilogram of substrate consumed 0.45 kilograms of product are created. Predicting the overall productivity of the fermentation process requires the use of these coefficients. The energy necessary by microbial cells to sustain their fundamental operations in non-growing environments is measured by a metric called the Maintenance Coefficient (m). It shows the rate of energy consumption per unit of biomass and has an approximate value of The rate at which microbiological viability declines over time is indicated by the temperature-dependent Decay Rate Constant (kd). = 12.108 exp is its expression, where T is the Kelvin fermentation temperature. Since greater thermal stress speeds up cell death, a higher temperature results in a faster rate of decay. One measure that characterizes the connection between substrate concentration and substrate consumption rate is the Order of Reaction (n). A non-linear connection is shown by a value of 0.52, which means that as substrate concentration rises, the rate of substrate consumption rises less proportionately. The overall kinetics of the fermentation process and the yield of the finished product can be impacted by this.
The simulation's starting conditions are specified by the process parameters. The beginning point for microbial development is established by the initial concentration of 1.5 kg/m3 of Saccharomyces cerevisiae . For the purpose of calculating growth rates and product generation, the initial glucose concentration is 220 kg/m3. Overall fermentation efficiency is influenced by kinetic factors and microbial activity, which are both impacted by the fermentation temperature of 30 .
Table 5.
Parameters considered for building the model.
Table 5.
Parameters considered for building the model.
| Parameter |
Expression |
Description |
| Microbial Growth Rate |
|
Rate of change of biomass concentration |
| Substrate Consumption Rate |
|
Rate of change of substrate concentration |
| Product Formation Rate |
|
Rate of change of product concentration |
Table 6.
Values of the other Parameters considered.
Table 6.
Values of the other Parameters considered.
| Parameter |
Value |
|
1.7 kg/m³ |
|
93 kg/m³ |
| n |
0.52 |
|
12.108 exp
|
| m |
0.03 h−1 |
|
0.08 |
|
0.45 |
| Initial concentration of Saccharomyces cerevisiae |
1.5 kg/m³ |
| Initial concentration of glucose |
220 kg/m³ |
| Fermentation temperature |
30 ℃ |
Table 7.
Three diverse fruits and its various criteria.
Table 7.
Three diverse fruits and its various criteria.
| Fruit |
Sugar Content (grams/100g) |
Method of Measurement |
Other Notable Components |
**Potential Sources |
| Mango (Ataulfo, Peeled, Raw) |
11.1 |
HPLC |
Vitamin A, C, B6, E, potassium, magnesium, copper, folate, antioxidants, fiber |
USDA FoodData Central, Healthline, WebMD |
| Banana (Overripe, Raw) |
15.8 |
HPLC |
Potassium, Vitamin B6, Vitamin C, Fiber |
USDA FoodData Central, Healthline, WebMD |
| Pineapple (raw) |
11.4 |
HPLC |
Vitamin C, B6, thiamin, manganese, copper, potassium, bromelain |
USDA FoodData Central, Healthline, WebMD |
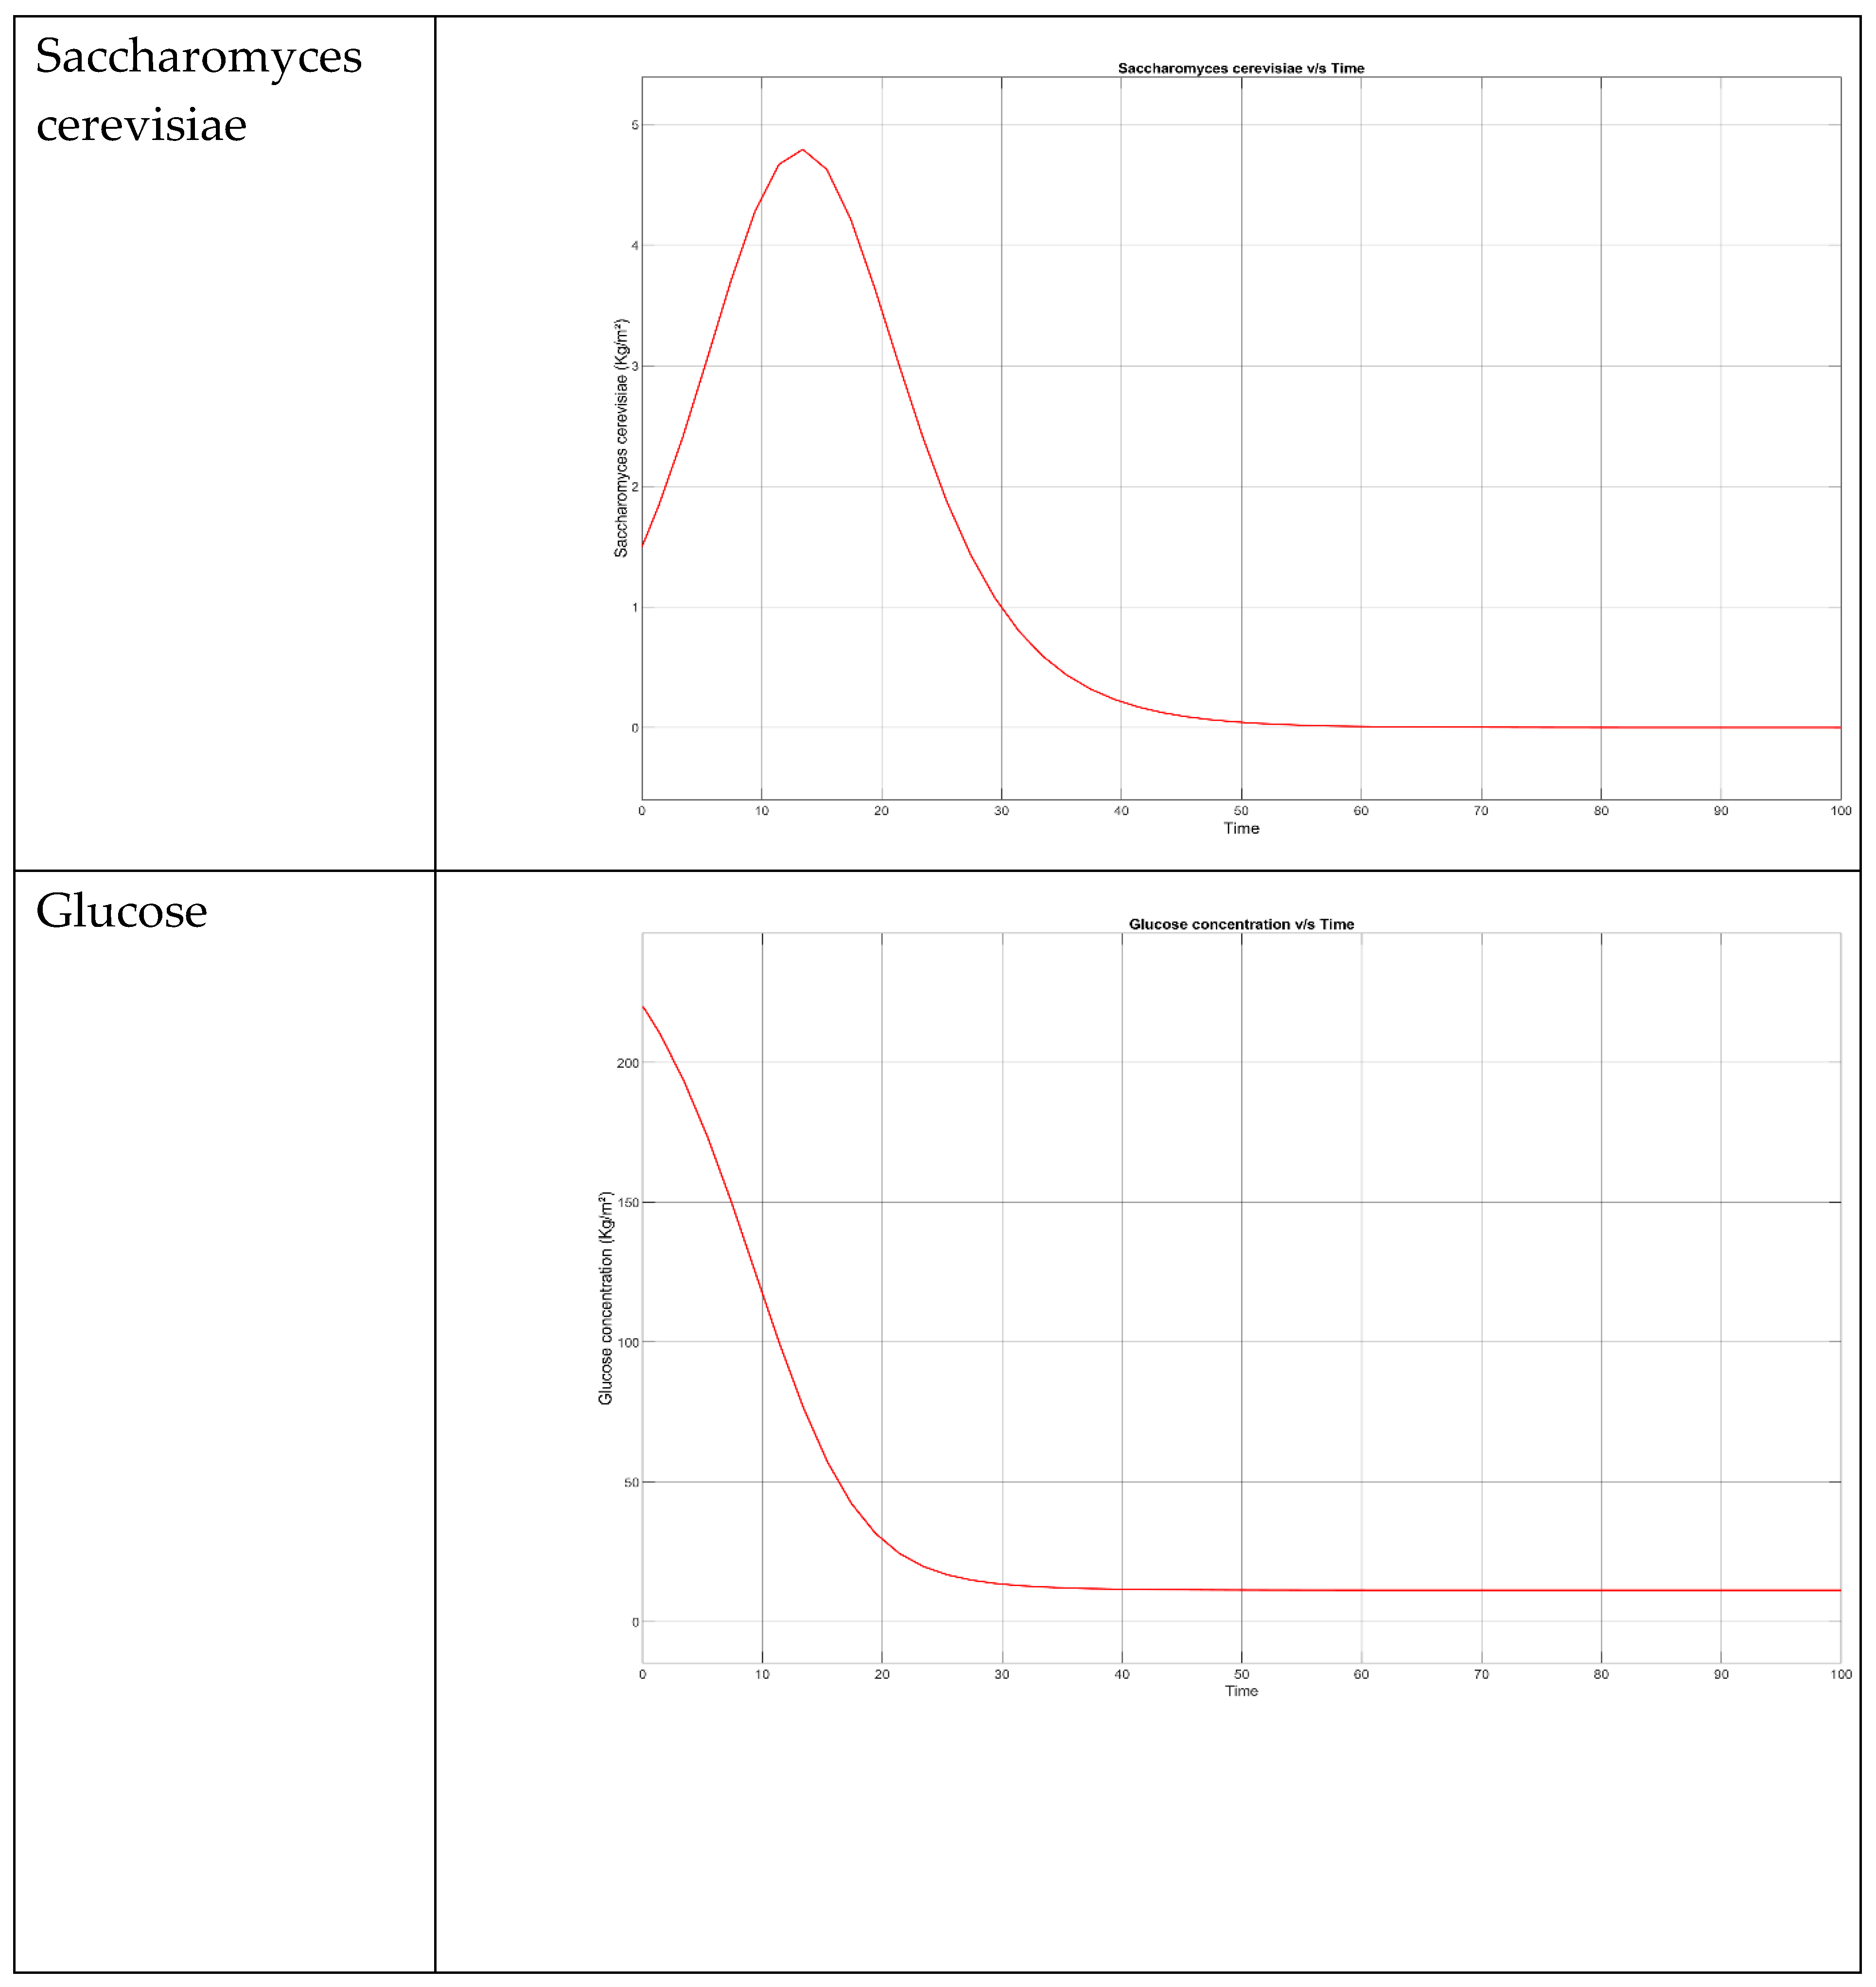
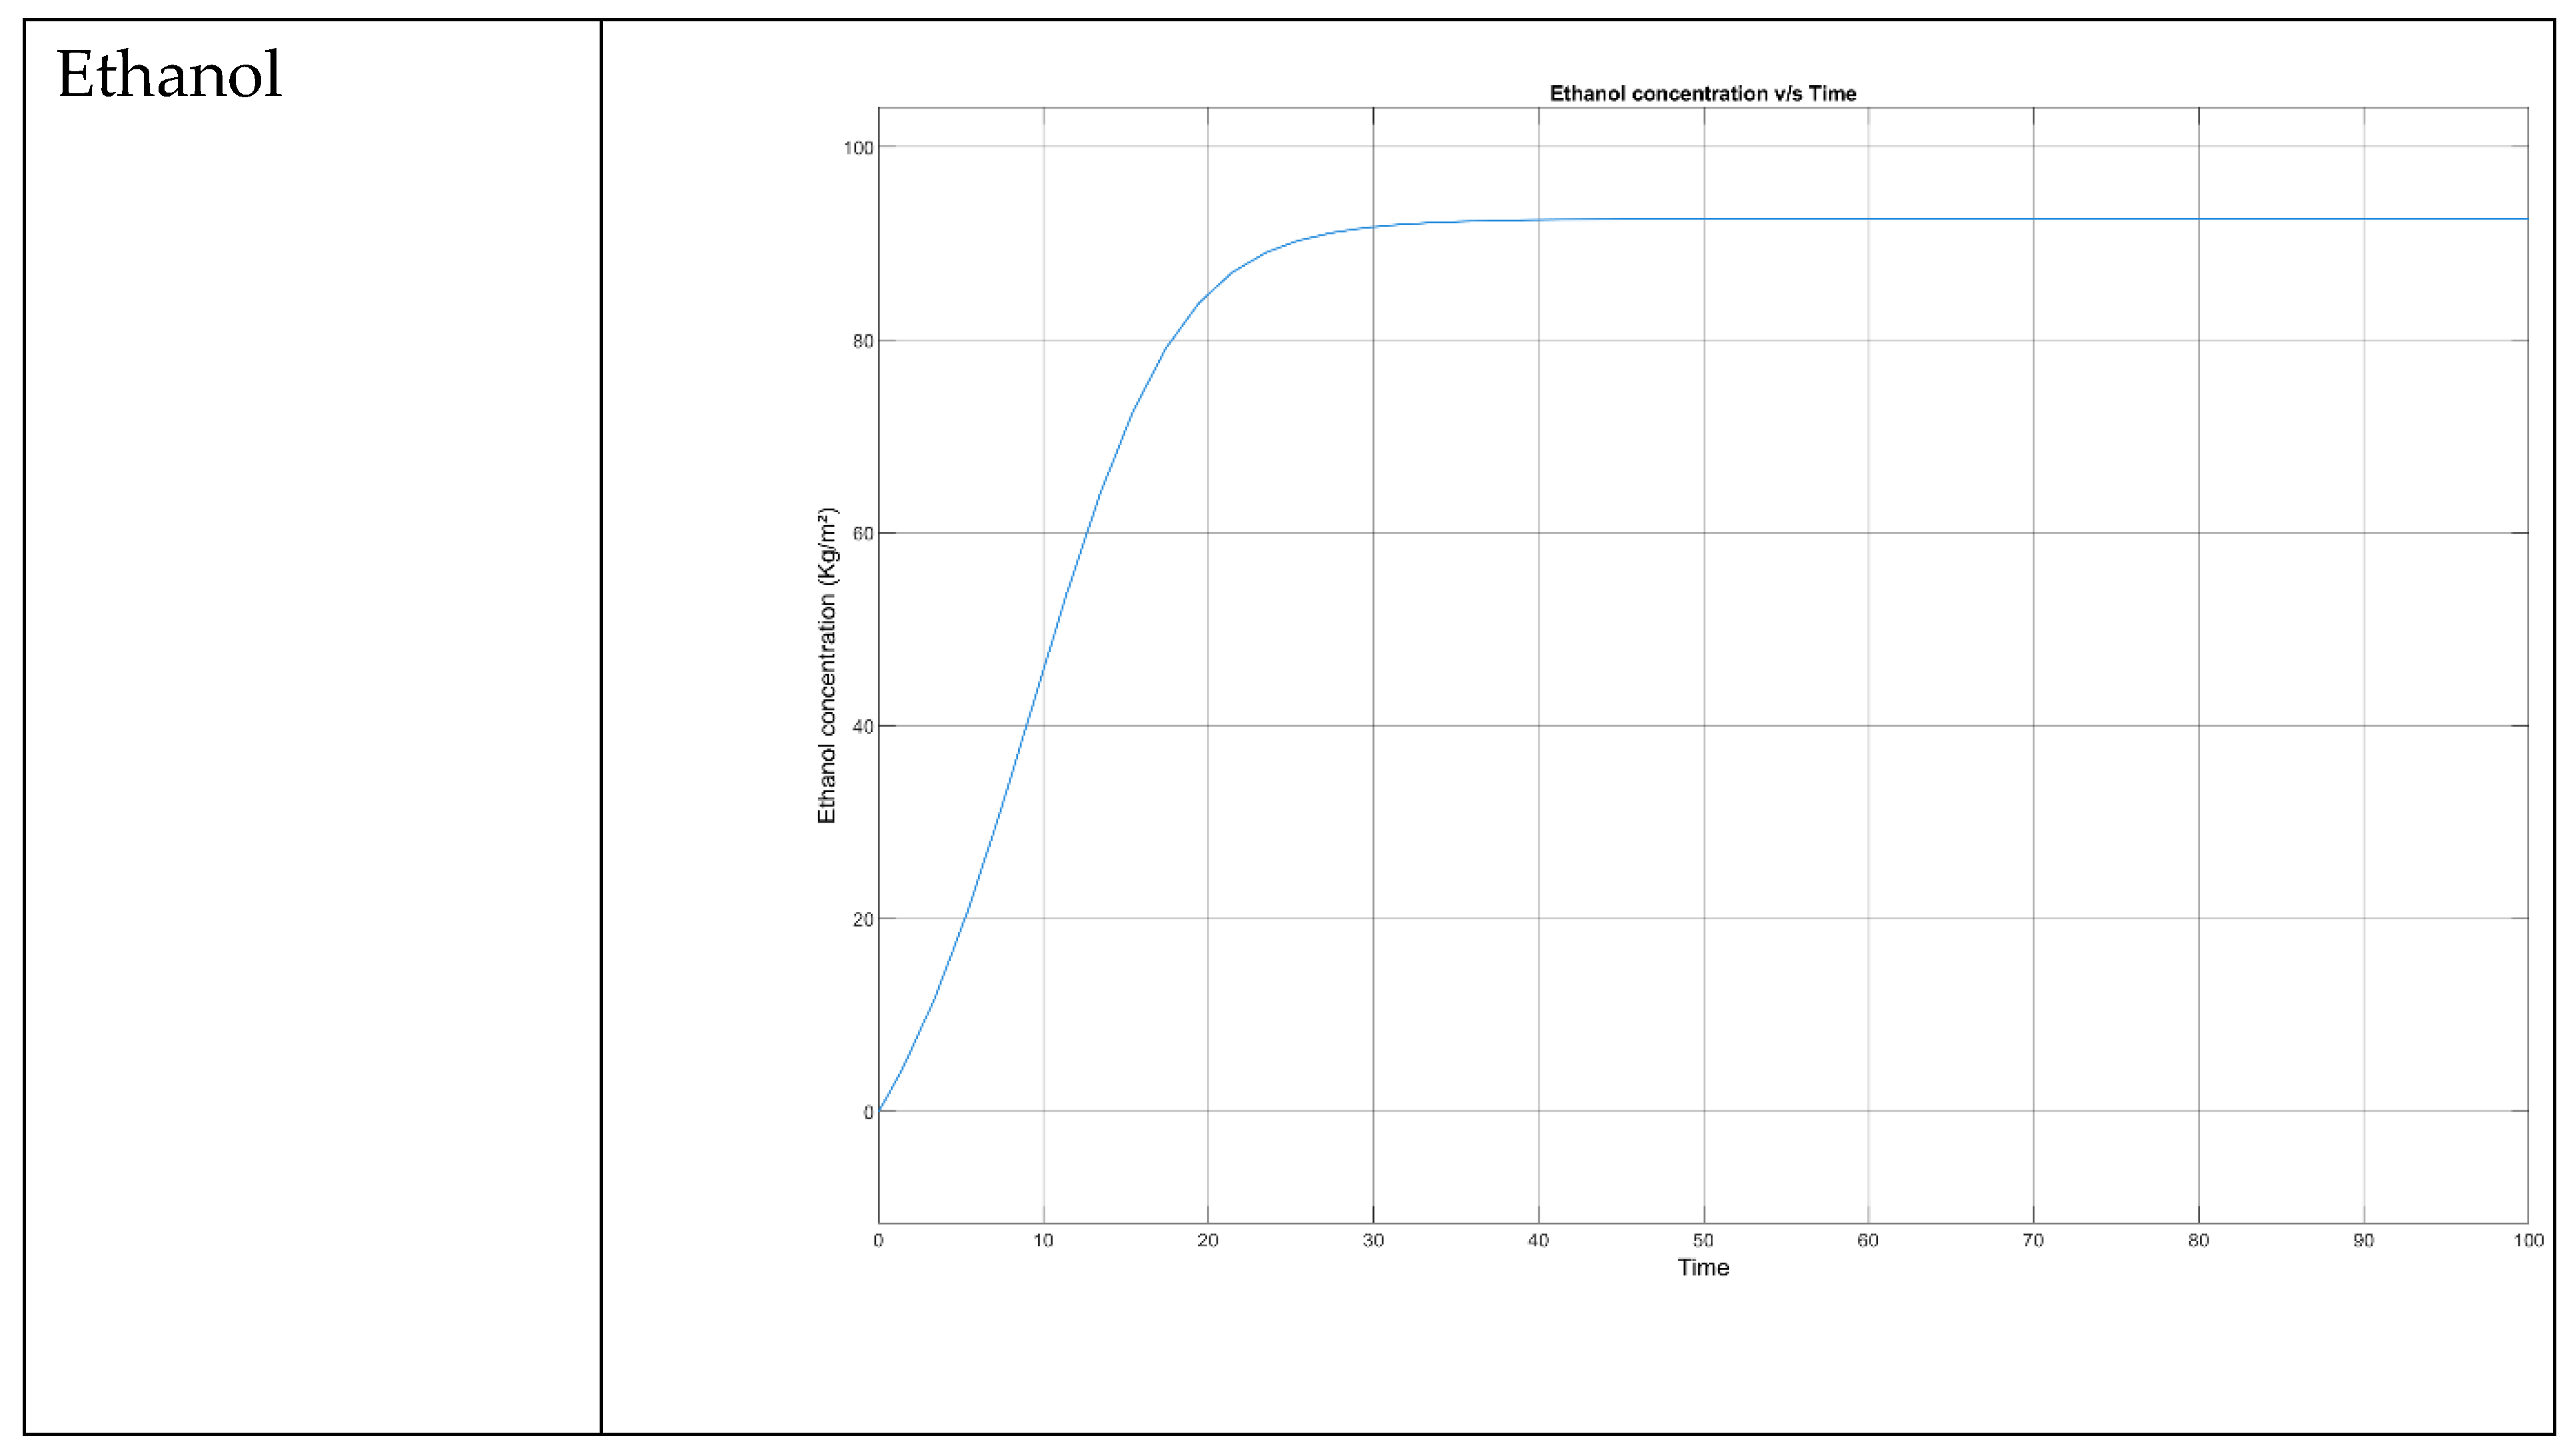
Case 1: When the stop time is 100 and the temperature is 30 or 303.15K.
Figure 3.
Mango (Ataulfo, Peeled, Raw) simulation model when temperature is 30
Figure 3.
Mango (Ataulfo, Peeled, Raw) simulation model when temperature is 30
Figure 4.
Banana (Overripe, Raw) simulation model when temperature is 30
Figure 4.
Banana (Overripe, Raw) simulation model when temperature is 30
Figure 5.
Pineapple (raw) simulation model when temperature is 30
Figure 5.
Pineapple (raw) simulation model when temperature is 30
In many models, including those for the production of bioethanol, the simulation usually ends when the stop time reaches 100 and the temperature is kept at 30°C (303.15 K). Several significant events could take place at this point in a bioethanol simulation, either product inhibition, where high ethanol concentrations impede yeast activity, or substrate depletion, where the fermentation process ends when the sugar is completely utilized. Additionally, if the system reaches a steady state where variables like substrate concentration, ethanol concentration, and cell density stabilize, or if the time limit of 100 units is met, the simulation may end. The particular code and model in MATLAB determine the precise termination behaviour. MATLAB's post-processing features can be used to examine results, create graphs, compute performance metrics, or carry out optimization studies. Other common outcomes include the simulation stopping and storing the final variable values, or exporting time-series data for additional analysis.
First, Mango (Ataulfo, Peeled, Raw), Banana (Overripe, Raw) and Pineapple (raw) serves as the substrate in the model setup for the bioethanol synthesis simulation which are taken separately when the model is run, while the microbe is Saccharomyces cerevisiae , also known as baker's yeast. Yeast cell density, ethanol concentration, and glucose content are important factors. Initial settings for the concentration of glucose, the density of yeast cells, and the concentration of ethanol are set to zero to determine the simulation parameters. Mass balance equations for glucose, ethanol, and biomass are included in the model, along with equations based on Monod kinetics to explain yeast growth as a function of glucose concentration and product inhibition to take into consideration the inhibitory effects of ethanol. The simulation is configured to run at 30°C (303.15 K) with an ideal pH of roughly 5.0 for 100-time units (e.g., hours).
The simulation begins by performing initialization based on the initial conditions. During the fermentation phase, yeast cells consume glucose and convert it into ethanol and biomass, increasing the number of yeast cells. Product inhibition slows down yeast growth and ethanol production as ethanol concentration rises, and the simulation eventually reaches a stationary phase, where glucose is almost completely depleted or product inhibition becomes significant, resulting in stable concentrations of glucose, ethanol, and yeast. Based on the results, it is anticipated that the concentration of glucose will decrease over time, the ethanol concentration will rise initially before plateauing or declining due to inhibition, and the density of yeast cells will increase initially before stabilizing or decreasing in response to the variables. For Mango (Ataulfo, Peeled, Raw), Banana (Overripe, Raw) and Pineapple (raw) it gave the same graph result due to their sugar and sweetness content being almost similar to each other.
Figure 6.
Result of the 3 fruits when all the 3 parameters concentrations (S. cerevisiae, Glucose and Ethanol) are employed.
Figure 6.
Result of the 3 fruits when all the 3 parameters concentrations (S. cerevisiae, Glucose and Ethanol) are employed.
Case 2: When the stop time is 50 and temperature is 50 or 323.15K.
Figure 7.
Mango (Ataulfo, Peeled, Raw) simulation model when temperature is 50
Figure 7.
Mango (Ataulfo, Peeled, Raw) simulation model when temperature is 50
Figure 8.
Banana (Overripe, Raw) simulation model when temperature is 50
Figure 8.
Banana (Overripe, Raw) simulation model when temperature is 50
Figure 9.
Pineapple (raw) simulation model when temperature is 50
Figure 9.
Pineapple (raw) simulation model when temperature is 50
For the majority of bacteria, the specified temperature of 50°C (323.15K) is higher than the ideal development temperature. The majority of microorganisms would suffer severe stress and perish at this temperature, while certain thermophilic bacteria may endure and even flourish there. Significant microbial growth is therefore extremely unlikely to take place in these circumstances. There would be a net decline in the microbial population since the death rate would probably be higher than the growth rate.
When the stop time is 50 and temperature is 10 or 283.15K. The productivity is relatively small due to the lower temperature.
Figure 10.
Mango (Ataulfo, Peeled, Raw) simulation model when temperature is 10
Figure 10.
Mango (Ataulfo, Peeled, Raw) simulation model when temperature is 10
Figure 11.
Banana (Overripe, Raw) simulation model when temperature is 10
Figure 11.
Banana (Overripe, Raw) simulation model when temperature is 10
Figure 12.
Pineapple (raw) simulation model when temperature is 10
Figure 12.
Pineapple (raw) simulation model when temperature is 10
A stop time of 50 units (presumably seconds) and a temperature of 10 degrees Celsius (283.15 Kelvin) are two parameters that are frequently used in MATLAB simulations to specify the duration of the simulation as well as a particular condition or input to the modelled system. The temperature may have an impact on the system's productivity during the 50 units of time that the simulation is scheduled to run. Since many processes are sensitive to temperature, a lower temperature, like 10°C, could result in decreased production. A lower production rate, higher energy consumption to maintain targeted outputs, or modifications in output quality or efficiency are just a few ways that this impact could show up. The type of simulated system determines the precise impacts.
The simulation findings show that variables like temperature and time have an impact on the bioethanol production process when Saccharomyces cerevisiae is used as the microorganism. The simulation proceeds as expected with the intake of glucose, ethanol production, and yeast growth at 30°C, the ideal temperature for yeast development. However, the high temperature of 50°C prevents microbial growth, which results in little to no bioethanol being produced. Likewise, the lower temperature of 10°C slows down the process, which lowers production. Despite taking into account various fruit substrates, the simulations yielded comparable trends for the amounts of glucose, ethanol, and yeast.