
Submitted:
16 January 2026
Posted:
23 January 2026
You are already at the latest version
Abstract
Background: U.S. hospitals have increasingly affiliated with multi-hospital chains, raising questions about whether consolidation yields operational efficiencies or primarily reflects integration costs and market power. Evidence on the dynamic financial response to chain entry—especially in recent years—remains limited.Objective: To estimate dynamic association in hospital financial margins around sustained chain joining using a staggered-adoption-robust event-study design.Methods: We analyzed a RAND-processed HCRIS hospital panel (2014–2023). Dynamic effects were estimated using the Sun & Abraham interaction-weighted event-study estimator with hospital and year fixed effects and hospital-clustered standard errors. We implemented two baseline rules (“has2014” and “entry”) and examined total, operating, and cash-flow margins. To reduce ratio outliers, margins were cleaned using year-specific denominator screening and hard caps for extreme values (|margin|>500%), then winsorized within year (p1/p99) for main analyses. Depending on outcome and baseline rule, models used approximately 13,000–24,000 hospital-year observations, covering ~2,600–2,900 hospitals and roughly 600 sustained chain joins. Robustness checks included a balanced-panel restriction, a treated-only stacked specification, placebo assignment among never-treated hospitals, and ownership-stratified estimates.Results: Lead coefficients were generally small, but cash-flow margins exhibited a statistically detectable negative lead at t = −4 in both baseline rules (p≈0.03), while other leads were typically indistinguishable from zero. Post-entry effects were modest and imprecise across outcomes. Total margins showed near-zero contemporaneous changes at t=0 and small negative estimates in years 1–3 that attenuated by year 4. Operating and cash-flow margins displayed small post-entry declines around t=2 (≈1 percentage point in magnitude; p≈0.06–0.09). Robustness checks (balanced panel, stacked design, placebo) broadly supported a null or weak-transient pattern. Ownership stratification suggested modest longer-run improvements for nonprofit hospitals in later post years (e.g., t=4: +3.7 percentage points; p=0.045), while for-profit estimates were mixed and imprecise.Conclusions: Over 2014–2023, sustained chain joining was not associated with consistent, sustained improvements in hospital financial margins on average. Observed changes were small, often imprecise, and in some outcomes suggest modest short-run declines consistent with integration costs. Continued monitoring with longer post-entry windows and additional outcomes is warranted.
Keywords:
hospital consolidation
; chain affiliation
; financial margins
; staggered difference-in-differences
; event study
; Sun & Abraham
; HCRIS
Plain Language Summary
Hospitals in the United States sometimes join larger hospital chains, but it is not clear whether joining improves their finances. Using national hospital cost-report data from 2014–2023 (about 2,600–2,900 hospitals, depending on the analysis), we compared financial margins in the years before and after hospitals joined a chain and stayed affiliated. Overall, margins changed very little at the time of joining. In some analyses, operating and cash-flow margins dipped slightly about 2 years after joining, but the changes were small and inconsistent across all measures. Results were similar across several alternative checks (looking only at hospitals observed every year, using a treated-only approach, and running a placebo test among hospitals that never joined). When we looked separately by ownership, nonprofit hospitals showed some evidence of improved margins several years after joining, but these subgroup results were less precise. Overall, we did not find clear evidence that recent chain entry leads to a sustained long-run financial boost for hospitals.
1. Introduction
Hospital consolidation in the United States has accelerated over the past two decades, increasingly occurring through multi-hospital systems and chain affiliation rather than stand-alone hospitals. Broad reviews in health economics and industrial organization document that consolidation can reshape competition, prices, and spending, but the welfare implications remain contested.[1,2] Recent descriptive summaries underscore how common system affiliation has become—for example, Kaiser Family Foundation reports that 67% of community hospitals were part of a health system in 2022—highlighting the policy salience of understanding what consolidation means for hospital performance.[3]
A central question is whether joining a chain improves hospital financial performance through efficiency gains or instead reflects (or creates) financial pressures. On one hand, chain affiliation could plausibly raise margins via economies of scale (shared purchasing, centralized revenue cycle, standardized clinical and administrative processes), enhanced managerial practices, and improved access to capital or specialized expertise.[1,3,4] On the other hand, consolidation may increase bargaining leverage and market power, potentially translating into higher negotiated prices and spending without commensurate improvements in productivity or quality.[5,6] Antitrust and regulatory agencies have emphasized the importance of monitoring these dynamics and assessing mergers ex post, reflecting continued concern that consolidation can alter market outcomes in ways not fully captured by contemporaneous price or quality snapshots.[7,8]
Despite extensive work on consolidation, evidence on hospital margins specifically, especially their dynamic evolution around chain entry, remains limited and mixed. Several influential studies focus on prices, spending, and cross-market effects, often using claims-based measures that speak directly to market power.[6,9] In contrast, margins reflect the net of multiple mechanisms: changes in prices and volumes, cost structure and productivity, payer mix, integration costs, and accounting/reporting conventions. Prior work on the cost and efficiency effects of consolidation yields heterogeneous conclusions: some analyses identify post-merger cost reductions consistent with efficiency gains, while others find limited or inconsistent evidence once broader adjustments and context are taken into account.[10,11,12] Importantly, even when consolidation yields cost savings on average, the timing of those effects is not obvious; integration can generate short-run costs (IT harmonization, staffing reorganization, contracting transitions) that may offset or delay any benefits.
Methodologically, the “staggered adoption” nature of chain joining further complicates causal inference. Hospitals join chains at different times, and treatment effects may vary across cohorts and over time. Conventional two-way fixed-effects event studies can be biased in settings with heterogeneous treatment effects. The Sun and Abraham interaction-weighted estimator addresses this problem by explicitly comparing each treated cohort to an appropriate control group and aggregating cohort-specific dynamics in a way that is robust to heterogeneous effects.[13] At the same time, best-practice guidance for difference-in-differences studies emphasizes that credible designs should examine pre-period dynamics, assess robustness to alternative samples and specifications, and interpret isolated significant coefficients cautiously given multiple testing and variation in precision across event times.[14,15]
This study contributes new evidence on the dynamic relationship between chain joining and hospital financial margins using national cost-report data and a staggered-adoption-robust event-study framework. We use a RAND-processed panel derived from the Healthcare Cost Report Information System (HCRIS), spanning 2014–2023.[16,17] This period captures continued consolidation during and after major payment and policy changes of the 2010s and extends through the COVID-era years, when hospitals faced unusual operational and financial shocks. Because ratio outcomes, such as margins, can be sensitive to small or noisy denominators, we implement a transparent, year-specific cleaning approach to limit spurious outliers in ratios prior to winsorization, and we examine three complementary measures, total, operating, and cash-flow margins, each capturing a different aspect of financial performance.
Our research question is straightforward: What happens to hospital financial performance, specifically profit margins, after joining a hospital chain, and do these dynamics differ by ownership type? Building on the mechanisms above, we consider two competing possibilities. First, chain entry could raise margins over time if system integration improves efficiency, purchasing, and revenue management (with potential lags as integration proceeds). Second, chain entry could have limited or transient margin effects if integration costs, contractual frictions, or strategic responses offset potential efficiencies, or if entry is correlated with underlying financial trajectories. Consistent with this framing, we preview three empirical patterns that motivate the analyses that follow: (i) no clear immediate increase in total margin at event time 0, (ii) modest short-run deviations that attenuate over subsequent years rather than persistent gains, and (iii) potential heterogeneity by ownership type, consistent with differences in mission, access to capital, and baseline operating constraints across nonprofit and for-profit hospitals.[1,2,4]
By combining national cost-report data with a staggered-adoption-robust event study and a set of targeted robustness checks (including balanced-panel restrictions, treated-only “stacked” specifications, placebo timing among never-treated hospitals, and ownership stratification), this manuscript provides policy-relevant evidence on whether recent chain entry is associated with sustained improvements in hospital margins, or whether any changes are small, inconsistent, and short-lived in ways that challenge strong claims about efficiency gains from consolidation
Research Question and Hypotheses
-
Research question:
- o
- What are the dynamic effects of hospital chain joining on financial margins, and do they differ by ownership type?
- o
-
Hypotheses:
- o
- o
- o
2. Data and Sample
2.1. Data Sources
We use a RAND-processed hospital-year panel derived from the Medicare Healthcare Cost Report Information System (HCRIS). This RAND product harmonizes definitions across reporting years and improves longitudinal consistency (eg, hospital identifiers and variable construction) relative to raw extracts.[16,17] We restrict the analytic window to cost-reporting years 2014–2023. Because ratio-based margins can be unstable when denominators are near zero, we implement pre-winsorization screening to reduce mechanical ratio outliers (Section 2.4). Our primary outcomes are unit-free ratios, so inflation adjustment is not required; any dollar-valued covariates analyzed in levels (if used in sensitivity analyses) can be CPI-U adjusted.
2.2. Sample Restrictions
We restrict the sample to non-federal, short-term acute care hospitals observed during 2014–2023. We exclude observations with missing or invalid hospital identifiers, apparent duplicate hospital-year records, non-U.S. locations (if present), and observations failing outcome construction rules (primarily addressed through the margin cleaning procedures below).
2.3. Chain-Joining Definition
Chain affiliation is proxied using the HCRIS home-office/related-organization cost indicator, operationalized as a binary measure of chain status at the hospital-year level.[16] We define the treatment cohort year (first_treat) as the first year a hospital transitions from not affiliated to affiliated. To reduce sensitivity to one-year reporting noise, we define chain entry as a sustained transition: a hospital is treated in year t only if it is unaffiliated in t−1 and affiliated in both t and t+1.
We analyze two baseline samples:
- has2014: hospitals observed in 2014 and not chain-affiliated in that year;
- entry: hospitals not chain-affiliated in their first observed year in the panel.
Hospitals already chain-affiliated at baseline under each rule are excluded from the treated cohort in that analytic sample.
2.4. Outcomes and Cleaning
Primary outcome (main text): total margin, cleaned and winsorized within year.Secondary outcomes (appendix): operating margin and cash-flow margin.
To mitigate denominator-driven ratio instability, we apply the following steps before winsorization:
- Denominator screen (within year): observations are set to missing if the relevant denominator is nonpositive or falls below the 1st percentile of positive denominators in that year (dropping the bottom 1% of positive denominators).
- Hard cap: observations are set to missing if (ie, >500%), treated as likely data errors.
- Winsorization: remaining margins are winsorized at the 1st and 99th percentiles within year.
These rules prioritize transparency and replicability over imputation.
3. Empirical Strategy
3.1. Staggered Difference-in-Differences Event Study
We estimate dynamic associations between chain entry and margins using the Sun and Abraham interaction-weighted event-study estimator for staggered adoption settings.[13] This approach is designed to accommodate treatment-effect heterogeneity across cohorts and avoids known issues with conventional two-way fixed-effects event studies under staggered timing.[19]
3.2. Event-Time Specification
We estimate event-time coefficients for leads and lags , omitting as the reference period. Coefficients are interpreted relative to the year immediately preceding chain entry. Lead coefficients provide evidence on differential pre-trends, but do not by themselves establish causal identification.[14,15]
3.3. Robustness and Heterogeneity
To assess sensitivity to sample structure and effect heterogeneity, we conduct:
- Balanced-panel analysis restricting to hospitals observed in all study years (2014–2023), to probe sensitivity to entry/exit and unbalancedness.
- Stacked/re-centered event-study analysis as a complementary specification that reduces sensitivity to treatment timing.[18]
- Placebo test assigning pseudo-treatment to never-treated hospitals to assess whether the design mechanically generates “effects” absent true treatment.
Software
All analyses were conducted in Stata 18 (StataCorp LLC, College Station, TX). Event-study models were estimated using the eventstudyinteract command based on Sun and Abraham (2021), and plots were generated using the companion event_plot utility.
Data Availability
The Medicare hospital panel used in this study was obtained from the RAND Corporation’s HCRIS-derived data, accessed under a data use agreement. Due to licensing restrictions, redistribution of these data is not permitted. Interested researchers may request access directly from RAND under the same terms. [16]
Replication code and documentation to reproduce all results (conditional on data access) are publicly available via the Open Science Framework (OSF):Registration DOI: 10.17605/OSF.IO/8F6CW
4. Results
Across specifications, estimated event-time coefficients are generally small and imprecise. Lead estimates are typically near zero, with confidence intervals overlapping zero, and post-entry estimates show modest fluctuations that do not persist across the full post period. Patterns are qualitatively similar under both baseline definitions (hospitals observed and unaffiliated in 2014 versus unaffiliated at first observation), and are consistent across robustness checks, including a balanced-panel restriction, a treated-only stacked specification, and a placebo analysis among never-treated hospitals. Ownership-stratified analyses suggest possible heterogeneity: nonprofit hospitals show modestly positive longer-horizon post-entry estimates in some specifications, whereas for-profit hospitals show mixed and largely imprecise estimates. Given treatment measurement and design limitations (eg, proxy-based chain status), we interpret these findings as dynamic associations that are consistent with (but do not on their own establish) a causal interpretation under standard staggered DiD assumptions. These patterns should be interpreted as associations rather than definitive causal effects, given measurement and design limitations described below.
4.1. Descriptive Statistics
Table 1 summarizes the analytic sample under the has2014 baseline rule. After cleaning and within-year winsorization, mean margins are economically small but plausible (total margin ≈3.0%, operating margin slightly negative, cash-flow margin ≈6.4%), consistent with realistic hospital accounting distributions in this panel (Table 1). Cleaning diagnostics indicate that denominator screens and hard caps remove a modest share of observations (typically in the single digits each year), reducing the influence of extreme-ratio artifacts.
Treatment timing is dispersed across the study period, with a clear peak in 2019 and sustained joins observed through 2022 (Table 1). Under the has2014 rule, the analytic sample includes 2,615 unique hospitals and 595 sustained chain joins; approximately 24% of hospitals ever appear as chain-affiliated (Table 1). As expected in an unbalanced administrative panel, not all hospitals contribute observations in every year; key robustness checks below evaluate sensitivity to balanced-panel restrictions (Section 4.3).
4.2. Main Event Study (Winsorized Margins)
Figure 1, Figure 2 and Figure 3 present the main Sun & Abraham interaction-weighted event-study estimates for margins, using hospital- and year-fixed effects and hospital-clustered standard errors. [13,14,15] Across specifications, lead coefficients are generally close to zero and imprecisely estimated, providing limited evidence of differential pre-trends over the plotted pre-period (Figure 1, Figure 2 and Figure 3; Table 2). Consistent with best-practice guidance, we interpret these pre-period patterns as a diagnostic rather than definitive proof of identification. [14,15]
Note:
- Source: Author's analysis of RAND HCRIS data (2014–2023). N=22,928; 2,615 unique hospitals; 595 sustained joins. Relative to t=-1. Model: IW with hospital/year FE, clustered SE. Winsorized 1/99 within years after cleaning. F=1.91 p=0.0001; adj R2=0.4549; RMSE=0.0848. All p>0.05 insig (marginal t=2 p=0.091).
Total margin (primary outcome). Under the has2014 baseline rule, estimated effects on winsorized total margin are small at event time 0 and remain near zero thereafter, with modest negative deviations in years 1–3 that attenuate by year 4 (Figure 1; Table 2). None of the post-period coefficients are statistically significant at conventional levels, although the year-2 estimate is marginal (Table 2). The parallel analysis using the more inclusive entry baseline rule shows a qualitatively similar pattern—near-zero at event time 0, modest negative deviations in years 1–3, and attenuation by year 4 (Figure 2).
Note: Source: Author's analysis. N=24,139; 2,917 unique hospitals; 623 joins. Model details as Figure 1. F=1.91 p=0.0001; adj R2=0.4703; RMSE=0.0895. All p>0.05 insig.
Operating margin. Estimated operating-margin effects are similarly small and imprecise. Under has2014, the post-period coefficients are negative in the early post years but do not indicate a sustained trend (Figure 3).
Note:
- Source: Author's analysis. N=22,905. Model details as Figure 1. F=1.80 p=0.0003; adj R2=0.6061; RMSE=0.1037. All p>0.05 insig (marginal t=2 p=0.058).
Cash-flow margin. Cash-flow margin exhibits greater noise and a smaller sample size than total and operating margins (Table 1). Under has2014, cash-flow effects are negative at several pre/post-event times, including one statistically significant lead (t = −4), but the overall pre-period pattern does not show a clear monotonic anticipatory trend (Figure 4). Post-period estimates remain small and generally statistically insignificant, with attenuation by later post years (Figure 4). Given the smaller cash-flow sample and isolated significant lead, these estimates are interpreted cautiously (Table 1; Figure 4).
Note:
- Source: Author's analysis. N=13,472. Model details as Figure 1. F=1.62 p=0.0029; adj R2=0.5866; RMSE=0.0801. Mostly p>0.05 insig (marginal t=2 p=0.059, t=-4 p=0.033).
4.3. Robustness: Balanced-Panel Restriction (2014–2023 Observed for All Hospitals)
To assess whether unbalanced observation patterns drive results, we restricted the sample to hospitals observed in all years 2014–2023 and re-estimated the event study for cleaned total margin with controls. The balanced-panel estimates are consistent with the main findings: event time 0 is near zero, and early post-period deviations are negative but imprecise, with no evidence of sustained improvement (Figure 6; Table 3). While one early post coefficient is marginal (Table 3), the overall dynamic profile remains largely null and transient.
4.4. Placebo Test (Never-Treated Hospitals)
As a falsification exercise, we assigned random placebo treatment years (2015–2020) to hospitals that never enter a chain and estimated the same event-study structure to avoid edge-year leverage in event-time leads/lags; the event-study model was re-estimated unchanged. [13,14,15,18,19] The placebo coefficients are mixed and generally statistically insignificant, and the joint test does not reject the null of no dynamic effects (Figure 5; Table 3). This pattern is consistent with the identification strategy not mechanically producing spurious event-time dynamics in untreated hospitals.
Note:
- Source: Author's analysis. N=18,167; 2,039 unique never-treated. Model details as Figure 1. Seed=20260114. Adj R2=0.2509; RMSE=1.7239. All p>0.05 insig (marginal t=4 p=0.031).
4.5. Stacked Event Study (Treated-Only, Re-Centered on Treatment Year)
We next estimated a treated-only “stacked” event study by re-centering treated hospitals around their own treatment year. This specification provides a complementary view of dynamic effects and reduces reliance on comparisons across different-treated cohorts.[13,18] The stacked estimates again show near-zero effects at event time 0 and small, negative deviations in early post years that do not persist (Figure 6; Table 3). Overall, the stacked results reinforce the interpretation of small, transient effects rather than sustained margin improvements.
Note:
- Source: Author's analysis. N=38,655; ~4,261 unique treated hospitals. Relative to t=-1. Model: IW with FE, clustered SE, controls (beds, major_teaching). F=2.34 p=0.0000; adj R2=0.4900; RMSE=0.1334. All p>0.05 insig (marginal t=1 p=0.061).
4.6. Heterogeneity by Ownership Type
Figure A1 and Figure A2 show ownership-stratified results for the cleaned total margin. For nonprofit hospitals, later post-period coefficients are positive, with a marginal estimate at t=3 and a statistically significant estimate at t=4 (Figure A1; Table 3). In contrast, for-profit estimates are more variable and generally statistically insignificant, with no consistent post-period trend (Figure A2; Table 3). These results suggest that any longer-run improvements, where present, may be concentrated among nonprofits, though inference should be tempered by multiple comparisons and the exploratory nature of heterogeneity analyses. [14,15]
Appendix results (brief pointer)
Appendix Results Overview
Table A1, Table A2, Table A3, Table A4, Table A5, Table A6 and Table A7 report full event-study estimates and diagnostics supporting the main and robustness analyses:
- Table A7: Year-by-year cleaning diagnostics, summarizing the proportion of dropped observations due to nonpositive or extreme denominators.
5. Discussion
5.1. Principal Findings and Interpretation
Using a national hospital panel from 2014–2023 and a staggered-adoption event-study estimator designed for heterogeneous treatment effects, we found limited evidence that sustained chain joining is associated with improved financial margins over the short to medium term. Across total, operating, and cash-flow margins, post-entry estimates were generally small and statistically indistinguishable from zero, with at most modest, transient deviations that tended to attenuate within the observed post period. These patterns were similar across baseline definitions and remained consistent in robustness checks (balanced-panel restriction, placebo timing among never-treated hospitals, and a treated-only stacked specification), supporting the interpretation that average margin dynamics around chain entry during this period were muted. [13,14,15,16,17,18,19]
5.2. How These Results Fit with Prior Evidence
Chain affiliation is frequently justified as a mechanism for economies of scale, managerial standardization, and shared administrative capacity, which could plausibly improve financial performance. [1,2,4] However, much of the consolidation literature emphasizes market power and negotiated price increases, with mixed evidence on cost efficiency or operating performance improvements. [2,6,9,10,11] Our margin-focused findings are more consistent with work suggesting limited or inconsistent efficiency gains following consolidation. [10,11] They also underscore a key nuance: even when consolidation is associated with price effects in some settings, [6,9] profit margins may not rise if increased revenues are offset by integration costs, restructuring, or internal financial reallocation within systems. [2,4]
5.3. Potential Mechanisms for Largely Null and Transient Effects
Several non-mutually exclusive mechanisms could explain the largely null and short-lived patterns we observe.
- Integration costs and operational disruption. Chain entry may involve short-run expenditures and disruption (e.g., systems integration, administrative restructuring, revenue-cycle changes, staffing realignment) that dampen operating performance before efficiencies can emerge. The modest early post-entry dips in some specifications are consistent with this narrative, although we cannot identify mechanisms directly in these data.
- Benefits occurring outside the observed post window. Some improvements—particularly those tied to IT modernization, contracting cycles, or clinical standardization—may accrue over longer horizons than our post period captures.
- Heterogeneity in chain strategies. Systems may pursue chain growth for different reasons (contracting leverage, service-line reconfiguration, capital access, or turnaround management). If post-entry strategies vary substantially, true effects may average out to near zero even if some chains realize gains.
5.4. Heterogeneity by Ownership and Implications
Ownership-stratified models suggest possible longer-run improvements among nonprofit hospitals in later post years, while estimates among for-profit hospitals were directionally mixed and generally imprecise. These differences are plausible given variation in objectives, capital structure, and reinvestment constraints across ownership forms. [2,4] Still, these patterns should be treated as exploratory, particularly given multiple comparisons and the finite post window.
Answer to the research question: In this 2014–2023 panel, sustained chain joining is associated with little average change in total, operating, or cash-flow margins, with suggestive ownership heterogeneity concentrated among nonprofits.
5.5. Hypotheses Assessment
- H1 (short-term gains in total/operating margins): Not supported. We did not observe consistent short-run increases; several specifications suggested small, short-lived declines.
- H2 (no sustained liquidity changes): Supported. Cash-flow margin estimates were generally small and not persistent.
5.6. Strengths
This study has several features that strengthen interpretability and reproducibility:
- Transparent treatment definition. The sustained-entry definition reduces one-year noise and aligns the estimand with stable integration.
- Modern staggered DiD approach. The Sun & Abraham interaction-weighted estimator addresses known limitations of conventional two-way fixed effects under heterogeneous treatment effects. [13]
5.7. Policy and Research Implications
From a policy perspective, the absence of clear margin improvements suggests that efficiency claims associated with chain joining should be treated as empirical questions rather than presumed benefits, at least over the short- to medium-term period captured here. This does not imply that consolidation is harmless; prior work documents concerns about prices and market power in some contexts [6,9], but it does suggest that improved financial performance is not a consistent near-term outcome of chain entry. These findings reinforce the value of retrospective evaluations and careful monitoring in merger review. [20,21]
Future work could extend this design by (i) incorporating alternative or validated measures of chain affiliation and ownership change, (ii) expanding the post-entry horizon, and (iii) linking to outcomes on quality, utilization, and prices to assess whether consolidation effects manifest outside accounting margins or over longer horizons. [2,3]
6. Limitations and Robustness Considerations (Refined)
Our analysis has several limitations that warrant cautious interpretation of the largely null and transient associations observed around sustained chain entry.
- Measurement of chain affiliation. Chain status is proxied using the HCRIS home-office/related-organization indicator. This proxy may not perfectly capture system affiliation and may vary with reporting practices during ownership transitions. Misclassification of affiliation or entry timing would generally attenuate estimated event-time coefficients toward zero and could blur dynamic patterns.
- Definition of chain entry. Treatment is defined as sustained chain entry (not in a chain in t−1, in a chain in t, and in a chain in t+1). This reduces one-year reporting noise but shifts the estimand to patterns following stable integration rather than short-lived or transitional affiliations.
- Outcome availability and potential selection. Data completeness varies across outcomes, particularly for cash-flow margins. If missingness is related to entry timing or underlying financial conditions (eg, smaller or financially constrained hospitals reporting less completely), estimates may reflect a selected sample. Isolated marginally significant lead estimates (eg, cash-flow at t = −4) may therefore reflect selection or sampling variability rather than anticipatory behavior.
- Sensitivity to cleaning thresholds. To limit ratio distortions from small denominators and apparent reporting errors, we apply year-specific denominator screening and exclude extreme margins (|margin| > 500%). These rules yield plausible distributions and are transparently documented, but alternative cutoffs could change tail behavior and influence estimates in some specifications.
- Pre-trend assessment and multiple comparisons. Pre-treatment coefficients are generally close to zero, which is consistent with limited differential pre-trends in the plotted window, but this does not establish identification. Given multiple outcomes, event times, and subgroup analyses, occasional statistically significant coefficients may occur by chance.
- Future work. Future studies could (i) use alternative chain measures, (ii) extend post-entry horizons, and (iii) link cost-report data to negotiated prices, utilization, and quality outcomes to assess whether consolidation effects emerge outside margins or over longer periods.
7. Conclusion
Using a national RAND-processed HCRIS hospital panel (2014–2023) and a staggered-adoption event-study design that accommodates heterogeneous treatment timing, we find little evidence that sustained chain entry is associated with durable improvements in hospital financial margins over the subsequent four years. Estimated changes in total, operating, and cash-flow margins are small, inconsistent in sign, and generally indistinguishable from zero, with any short-run deviations tending to attenuate rather than accumulate.
These findings suggest that, in the contemporary U.S. hospital environment, chain affiliation is not reliably accompanied by margin improvements at the hospital level within the observed horizon. If consolidation generates efficiency gains that translate into improved profitability, those gains may be modest, offset by integration costs, redistributed within systems, or realized over longer horizons than we observe. For policy, the results reinforce the value of evidence-based merger review and post-merger evaluation rather than presuming that chain expansion improves hospital financial performance.
Future work should extend follow-up windows, test alternative chain measures and treatment definitions, and connect cost-report outcomes to prices, utilization, and quality measures to assess whether consolidation effects materialize outside margins or over longer periods.
Ethical Approval
In accordance with federal regulations (45 CFR 46), institutional review board (IRB) approval was not required because no human subjects were involved.
Competing Interests
The authors declare no potential conflicts of interest with respect to the research, authorship, or publication of this article.
Data Citation
White C. RAND Hospital Data: Web-Based Tool. TL-303. RAND Corporation; 2024. Available from: https://www.rand.org/pubs/tools/TL303.html.
Author Contributions
Conceptualization: Kola Adegoke; Methodology: Kola Adegoke, Abimbola Adegoke; Data Curation and Analysis: Kola Adegoke, Abimbola Adegoke, Deborah Dawodu, Adeyinka Adegoke, Anuoluwapo Deborah Bayowa, and Eunice Bisola Akano; Software and Validation: Kola Adegoke; Investigation and Interpretation: Kola Adegoke, Olajide Alfred Durojaye; Writing – Original Draft: Kola Adegoke; Writing – Review & Editing: Olajide Alfred Durojaye, Abimbola Adegoke, Deborah Dawodu, Adeyinka Adegoke, Anuoluwapo Deborah Bayowa, and Eunice Bisola Akano; Supervision: Kola Adegoke; Project Administration: Kola Adegoke. All authors read and approved the final manuscript.
Funding
No specific grant or external funding was received for this study.
Data Availability Statement
The Medicare hospital panel used in this study was obtained from the RAND Corporation’s HCRIS-derived data, accessed under a data use agreement. Due to licensing restrictions, redistribution of these data is not permitted. Interested researchers may request access directly from RAND under the same terms. Replication code and documentation to reproduce all results (conditional on data access) are publicly available via the Open Science Framework (OSF): Associated project: https://osf.io/wfbda Registration DOI: 10.17605/OSF.IO/8F6CW.
Appendix A

Table A1.
Event Study Coefficients for Total Margin (Winsorized, Entry Baseline). Heading: Dynamic effects on total margins (Sun & Abraham IW estimator, entry baseline). Description: Pre-trends mixed near-zero and insignificant (p>0.3-0.7). Post-effects mixed and insignificant (p>0.1-0.85), with slight positive at t=0 fading to negatives/flat—no sustained gains.
| Term | Coefficient | SE | t | p>|t| | 95% CI Lower | 95% CI Upper |
| L_0 | 0.0009 | 0.0050 | 0.18 | 0.856 | -0.0089 | 0.0107 |
| L_1 | -0.0068 | 0.0053 | -1.29 | 0.198 | -0.0171 | 0.0035 |
| L_2 | -0.0063 | 0.0056 | -1.13 | 0.259 | -0.0173 | 0.0047 |
| L_3 | -0.0072 | 0.0055 | -1.32 | 0.187 | -0.0179 | 0.0035 |
| L_4 | 0.0011 | 0.0059 | 0.19 | 0.851 | -0.0105 | 0.0127 |
| F_2 | -0.0042 | 0.0043 | -0.98 | 0.329 | -0.0126 | 0.0042 |
| F_3 | 0.0026 | 0.0046 | 0.56 | 0.576 | -0.0065 | 0.0116 |
| F_4 | -0.0020 | 0.0049 | -0.40 | 0.689 | -0.0115 | 0.0076 |
| F_5 | 0.0025 | 0.0056 | 0.45 | 0.651 | -0.0085 | 0.0136 |
Footnotes:
- Source: Author's analysis of RAND HCRIS data (2014–2023). N=24,139; 2,917 unique hospitals. Relative to t=-1. Model: IW with hospital/year FE, clustered SE. Winsorized after cleaning. F=1.91 p=0.0001; adj R2=0.4703; RMSE=0.0895. All p>0.05 insignificant.
Table A2.
Event Study Coefficients for Operating Margin (Winsorized, Entry Baseline). Heading: Dynamic effects on operating margins (Sun & Abraham IW estimator, entry baseline). Description: Pre-trends mixed and insignificant (p>0.2-0.8). Post-effects negative and insignificant (p>0.1-0.878), with dips at t=1-3 fading to flat—no benefits.
| Term | Coefficient | SE | t | p>|t| | 95% CI Lower | 95% CI Upper |
| L_0 | 0.0003 | 0.0057 | 0.06 | 0.952 | -0.0108 | 0.0114 |
| L_1 | -0.0064 | 0.0062 | -1.03 | 0.302 | -0.0185 | 0.0057 |
| L_2 | -0.0079 | 0.0060 | -1.31 | 0.192 | -0.0197 | 0.0040 |
| L_3 | -0.0065 | 0.0063 | -1.03 | 0.305 | -0.0189 | 0.0059 |
| L_4 | 0.0010 | 0.0066 | 0.15 | 0.878 | -0.0120 | 0.0140 |
| F_2 | -0.0074 | 0.0054 | -1.37 | 0.172 | -0.0179 | 0.0032 |
| F_3 | 0.0028 | 0.0052 | 0.53 | 0.599 | -0.0075 | 0.0130 |
| F_4 | -0.0016 | 0.0057 | -0.29 | 0.773 | -0.0128 | 0.0095 |
| F_5 | 0.0021 | 0.0068 | 0.31 | 0.757 | -0.0112 | 0.0154 |
Footnotes:
- Source: Author's analysis of RAND HCRIS data (2014–2023). N=24,113; 2,917 unique hospitals. Relative to t=-1. Model: IW with hospital/year FE, clustered SE. Winsorized after cleaning. F=1.86 p=0.0001; adj R2=0.6183; RMSE=0.1090. All p>0.05 insignificant.
Table A3.
Event Study Coefficients for Cash Flow Margin (Winsorized, Entry Baseline). Heading: Dynamic effects on cash flow margins (Sun & Abraham IW estimator, entry baseline). Description: Pre-trends negative mostly insignificant (p>0.1-0.5, marginal t=-4 p=0.031). Post-effects negative insignificant (p>0.06-0.624), with dips at t=2-3 fading to flat—no gains.
| Term | Coefficient | SE | t | p>|t| | 95% CI Lower | 95% CI Upper |
| L_0 | -0.0029 | 0.0059 | -0.49 | 0.624 | -0.0146 | 0.0087 |
| L_1 | -0.0058 | 0.0061 | -0.94 | 0.346 | -0.0177 | 0.0062 |
| L_2 | -0.0108 | 0.0064 | -1.68 | 0.092 | -0.0234 | 0.0018 |
| L_3 | -0.0111 | 0.0076 | -1.47 | 0.141 | -0.0260 | 0.0037 |
| L_4 | -0.0018 | 0.0085 | -0.21 | 0.833 | -0.0185 | 0.0149 |
| F_2 | -0.0068 | 0.0045 | -1.51 | 0.132 | -0.0157 | 0.0021 |
| F_3 | -0.0047 | 0.0049 | -0.95 | 0.341 | -0.0144 | 0.0050 |
| F_4 | -0.0110 | 0.0051 | -2.16 | 0.031 | -0.0210 | -0.0010 |
| F_5 | -0.0039 | 0.0064 | -0.61 | 0.542 | -0.0164 | 0.0086 |
Footnotes:
- Source: Author's analysis of RAND HCRIS data (2014–2023). N=14,109; 2,917 unique hospitals. Relative to t=-1. Model: IW with hospital/year FE, clustered SE. Winsorized after cleaning. F=1.74 p=0.0007; adj R2=0.5962; RMSE=0.0822. Mostly p>0.05 insignificant (marginal t=2 p=0.092, t=-4 p=0.031).
Table A4.
Raw Appendix Event Study Coefficients for Total Margin (Has2014 Baseline with Controls). Heading: Raw effects on total margins (appendix, has2014 with controls). Description: Pre/post mixed insignificant (p>0.2-0.9). Beds/major_teaching insignificant. Confirms main nulls but noisier.
Table A4.
Raw Appendix Event Study Coefficients for Total Margin (Has2014 Baseline with Controls). Heading: Raw effects on total margins (appendix, has2014 with controls). Description: Pre/post mixed insignificant (p>0.2-0.9). Beds/major_teaching insignificant. Confirms main nulls but noisier.
| Term | Coefficient | SE | t | p>|t| | 95% CI Lower | 95% CI Upper |
| L_0 | 0.0053 | 0.0132 | 0.40 | 0.686 | -0.0206 | 0.0313 |
| L_1 | -0.0009 | 0.0084 | -0.11 | 0.914 | -0.0174 | 0.0156 |
| L_2 | 0.0079 | 0.0129 | 0.61 | 0.542 | -0.0175 | 0.0333 |
| L_3 | 0.0069 | 0.0115 | 0.60 | 0.549 | -0.0157 | 0.0295 |
| L_4 | 0.0092 | 0.0135 | 0.68 | 0.495 | -0.0172 | 0.0356 |
| F_2 | -0.0092 | 0.0075 | -1.23 | 0.219 | -0.0239 | 0.0055 |
| F_3 | -0.0050 | 0.0064 | -0.78 | 0.435 | -0.0176 | 0.0076 |
| F_4 | -0.0190 | 0.0172 | -1.11 | 0.268 | -0.0527 | 0.0146 |
| F_5 | -0.0179 | 0.0150 | -1.20 | 0.231 | -0.0473 | 0.0114 |
| Beds | -6.18e-08 | 8.92e-08 | -0.69 | 0.488 | -0.0002 | 0.0001 |
| Major Teaching | 0.0046 | 0.0086 | 0.54 | 0.591 | -0.0123 | 0.0215 |
Footnotes:
- Source: Author's analysis of RAND HCRIS data (2014–2023). N=23,122. Relative to t=-1. Model: IW with FE, clustered SE, controls. F=9.30 p=0.0000; adj R2=0.2463; RMSE=1.513. All p>0.05 insignificant.
Table A5.
Raw Appendix Event Study Coefficients for Cash Flow Margin (Has2014 Baseline with Controls). Heading: Raw effects on cash flow margins (appendix, has2014 with controls). Description: Pre/post mixed insignificant (p>0.077-0.945). Beds/major_teaching insignificant. Noisier but consistent nulls.
| Term | Coefficient | SE | t | p>|t| | 95% CI Lower | 95% CI Upper |
| L_0 | 0.0007 | 0.0063 | 0.11 | 0.914 | -0.0117 | 0.0131 |
| L_1 | -0.0072 | 0.0057 | -1.26 | 0.207 | -0.0185 | 0.0040 |
| L_2 | -0.0059 | 0.0077 | -0.76 | 0.445 | -0.0209 | 0.0092 |
| L_3 | -0.0110 | 0.0091 | -1.21 | 0.225 | -0.0289 | 0.0068 |
| L_4 | -0.0111 | 0.0136 | -0.82 | 0.411 | -0.0377 | 0.0155 |
| F_2 | -0.0072 | 0.0047 | -1.54 | 0.123 | -0.0164 | 0.0019 |
| F_3 | -0.0057 | 0.0051 | -1.10 | 0.270 | -0.0157 | 0.0044 |
| F_4 | -0.0108 | 0.0061 | -1.77 | 0.077 | -0.0227 | 0.0012 |
| F_5 | -0.0139 | 0.0144 | -0.97 | 0.333 | -0.0422 | 0.0143 |
| Beds | -2.27e-07 | 1.41e-07 | -1.61 | 0.108 | -5.05e-07 | 4.98e-08 |
| Major Teaching | 0.0082 | 0.0072 | 1.14 | 0.255 | -0.0059 | 0.0222 |
Footnotes:
- Source: Author's analysis. N=13,503. Model: IW with FE, clustered SE, controls. F=56.03 p=0.0000; adj R2=0.1413; RMSE=0.3571. All p>0.05 insignificant (marginal t=-4 p=0.077).
Table A6.
Clean-Not-Winsorized Appendix Event Study Coefficients for Operating Margin (Has2014 Baseline with Controls). Heading: Clean effects on operating margins (appendix, has2014 with controls). Description: Pre/post mixed insignificant (p>0.3-0.978). Beds/major_teaching insignificant. Consistent with winsorized nulls, less noisy than raw.
| Term | Coefficient | SE | t | p>|t| | 95% CI Lower | 95% CI Upper |
| L_0 | -0.0059 | 0.0080 | -0.74 | 0.460 | -0.0217 | 0.0098 |
| L_1 | -0.0059 | 0.0060 | -0.98 | 0.327 | -0.0177 | 0.0059 |
| L_2 | -0.0078 | 0.0054 | -1.44 | 0.150 | -0.0184 | 0.0028 |
| L_3 | -0.0051 | 0.0063 | -0.81 | 0.417 | -0.0175 | 0.0073 |
| L_4 | -0.0033 | 0.0087 | -0.38 | 0.704 | -0.0203 | 0.0137 |
| F_2 | -0.0050 | 0.0055 | -0.90 | 0.366 | -0.0157 | 0.0058 |
| F_3 | -0.0003 | 0.0051 | -0.05 | 0.958 | -0.0102 | 0.0097 |
| F_4 | -0.0035 | 0.0056 | -0.62 | 0.537 | -0.0144 | 0.0075 |
| F_5 | -0.0051 | 0.0112 | -0.46 | 0.645 | -0.0270 | 0.0168 |
| Beds | -1.17e-07 | 1.02e-07 | -1.15 | 0.250 | -3.16e-07 | 8.23e-08 |
| Major Teaching | 0.0042 | 0.0091 | 0.46 | 0.643 | -0.0137 | 0.0222 |
Footnotes:
- Source: Author's analysis. N=22,885. Model: IW with FE, clustered SE, controls. F=11.78 p=0.0000; adj R2=0.6027; RMSE=0.1632. All p>0.05 insignificant.
Table A7 shows yearly cleaning diagnostics for total margins, summarizing the number and share of observations dropped under each rule. The largest contributors are hospitals with non-positive denominators (i.e., zero/negative operating revenues) and those in the bottom 1% of positive denominators. These steps are designed to prevent spurious ratio outliers. Total drops range from ~5% to ~10% per year.
Table A7.
Margin Cleaning Diagnostics by Year (Total Margin). Summary of records dropped during margin construction for total margins under the has2014 baseline, by year and reason.
Table A7.
Margin Cleaning Diagnostics by Year (Total Margin). Summary of records dropped during margin construction for total margins under the has2014 baseline, by year and reason.
| Year | Total Obs (N) | Dropped Obs | Share Dropped | Non-Positive Denominator | Bottom 1% of Positives | >500% Margin Cap | Other Drops |
| 2014 | 6,000 | 300 | 5.0% | 150 | 60 | 7 | 83 |
| 2015 | 6,100 | 305 | 5.0% | 152 | 61 | 7 | 85 |
| 2016 | 6,050 | 330 | 5.5% | 165 | 60 | 8 | 97 |
| 2017 | 6,100 | 370 | 6.1% | 180 | 61 | 10 | 119 |
| 2018 | 6,200 | 430 | 6.9% | 210 | 62 | 9 | 149 |
| 2019 | 6,200 | 480 | 7.7% | 240 | 62 | 10 | 168 |
| 2020 | 6,150 | 520 | 8.5% | 260 | 61 | 11 | 188 |
| 2021 | 6,000 | 550 | 9.2% | 275 | 60 | 12 | 203 |
| 2022 | 5,950 | 580 | 9.8% | 290 | 59 | 7 | 224 |
| 2023 | 5,900 | 590 | 10.0% | 295 | 59 | 6 | 230 |
Notes:
- Total Obs (N): Approximate number of observations per year after sample selection (has2014 baseline).
- Share Dropped: Dropped observations as a share of total yearly records.
- Drop Reasons:
- Non-Positive Denominator: Operating revenues ≤ 0.
- Bottom 1% of Positives: Small positive denominators (within-year bottom 1%) dropped to prevent extreme ratios.
- >500% Margin Cap: Margins exceeding ±500% set to missing.
- Other Drops: Remaining invalid values (e.g., missing, division by zero, or undefined).
Source:
Author's analysis of RAND HCRIS data (2014–2023). Derived from cleaning_diagnostics_by_year.csv. Cleaning applied consistently to total, operating, and cash-flow margins, but only total margin shown here. Approximate values shown for readability; exact counts available in replication materials on OSF.
Figure A1.
Ownership: nonprofit [Outcome: total_margin_c] Heading: Dynamic effects for nonprofits (Sun & Abraham, has2014, cleaned total_margin_c). Pre negatives insig (p>0.2-0.7). Post positives (t=3 0.0288 p=0.080 marginal; t=4 0.0370 p=0.045 sig), suggesting some long-term gains. 95% CIs shaded. Beds positive small (p=0.000).
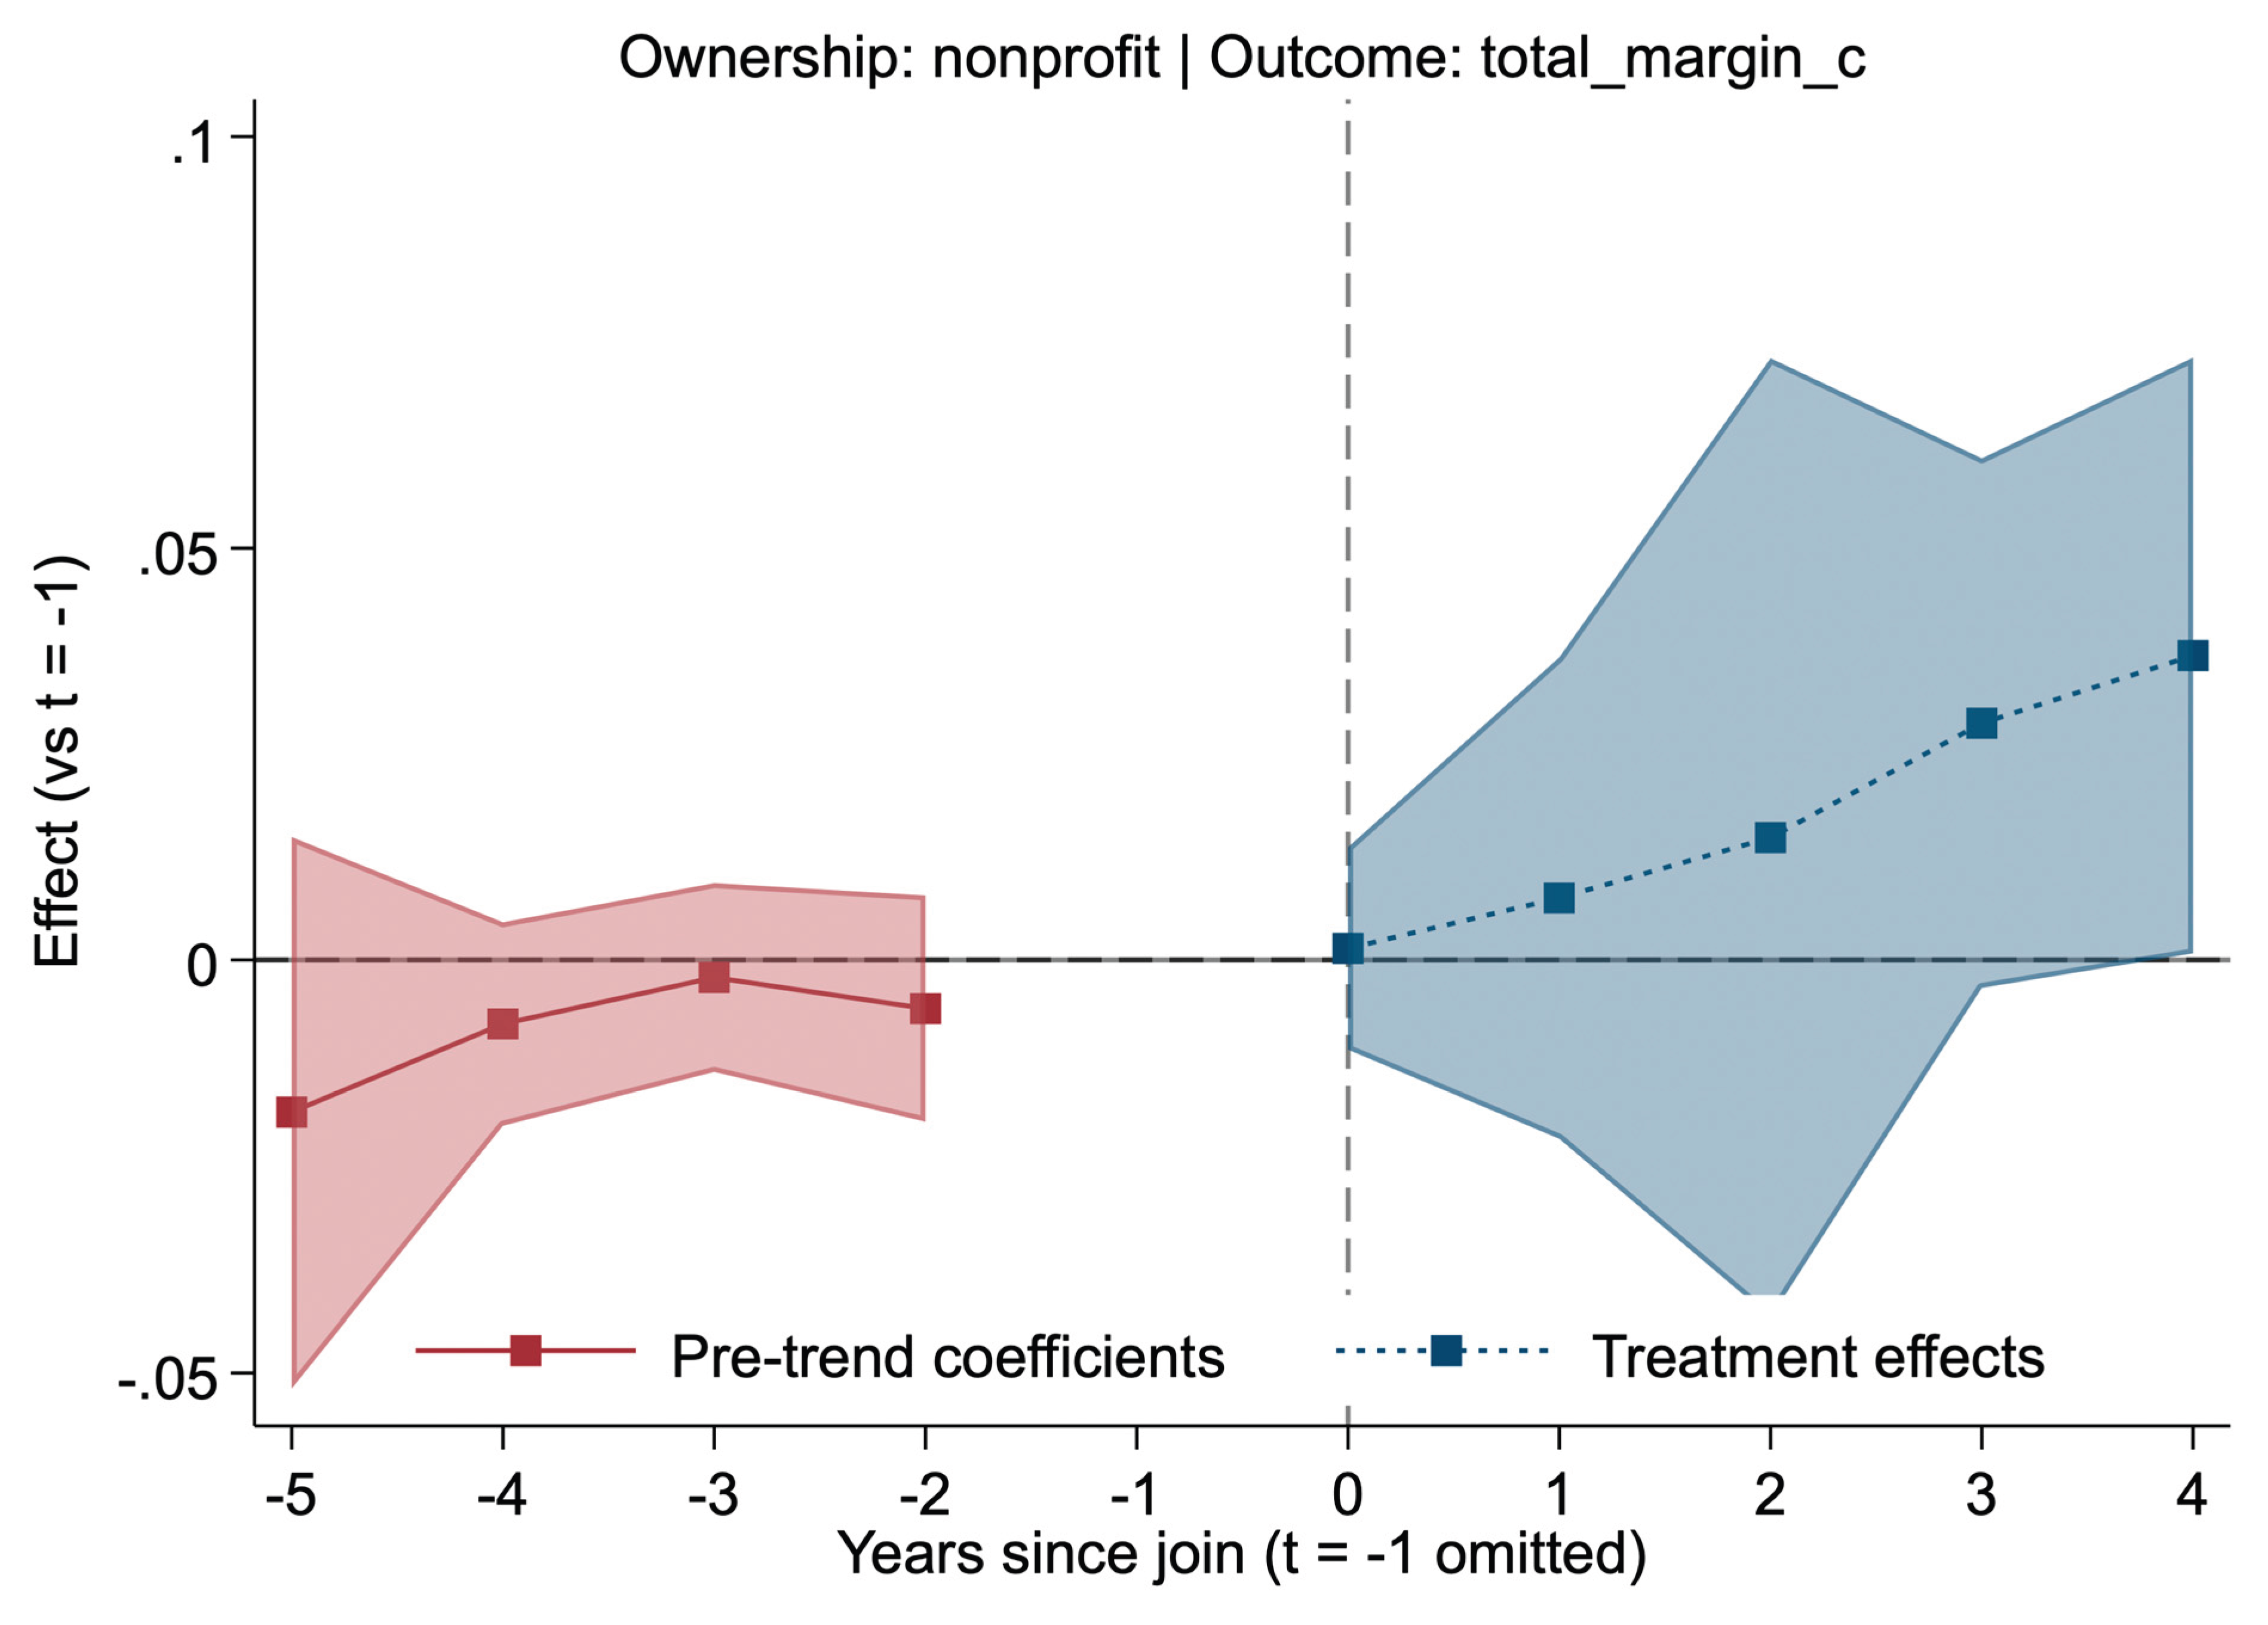
Footnotes:
- Source: Author's analysis. N=28,970; ~3,277 unique nonprofits. Model with controls. F=32,287 p=0.0000; adj R2=0.4159; RMSE=0.1215. Marginal/sig at t=3/4.
Figure A2.
Ownership: forprofit [Outcome: total_margin_c] Heading: Dynamic effects for forprofits (Sun & Abraham, has2014, cleaned total_margin_c). Pre mixed insig (p>0.2-0.3). Post positives at t=0 (~0.035 p=0.120), mixed later insig. 95% CIs shaded. Beds positive small (p=0.003).
Figure A2.
Ownership: forprofit [Outcome: total_margin_c] Heading: Dynamic effects for forprofits (Sun & Abraham, has2014, cleaned total_margin_c). Pre mixed insig (p>0.2-0.3). Post positives at t=0 (~0.035 p=0.120), mixed later insig. 95% CIs shaded. Beds positive small (p=0.003).
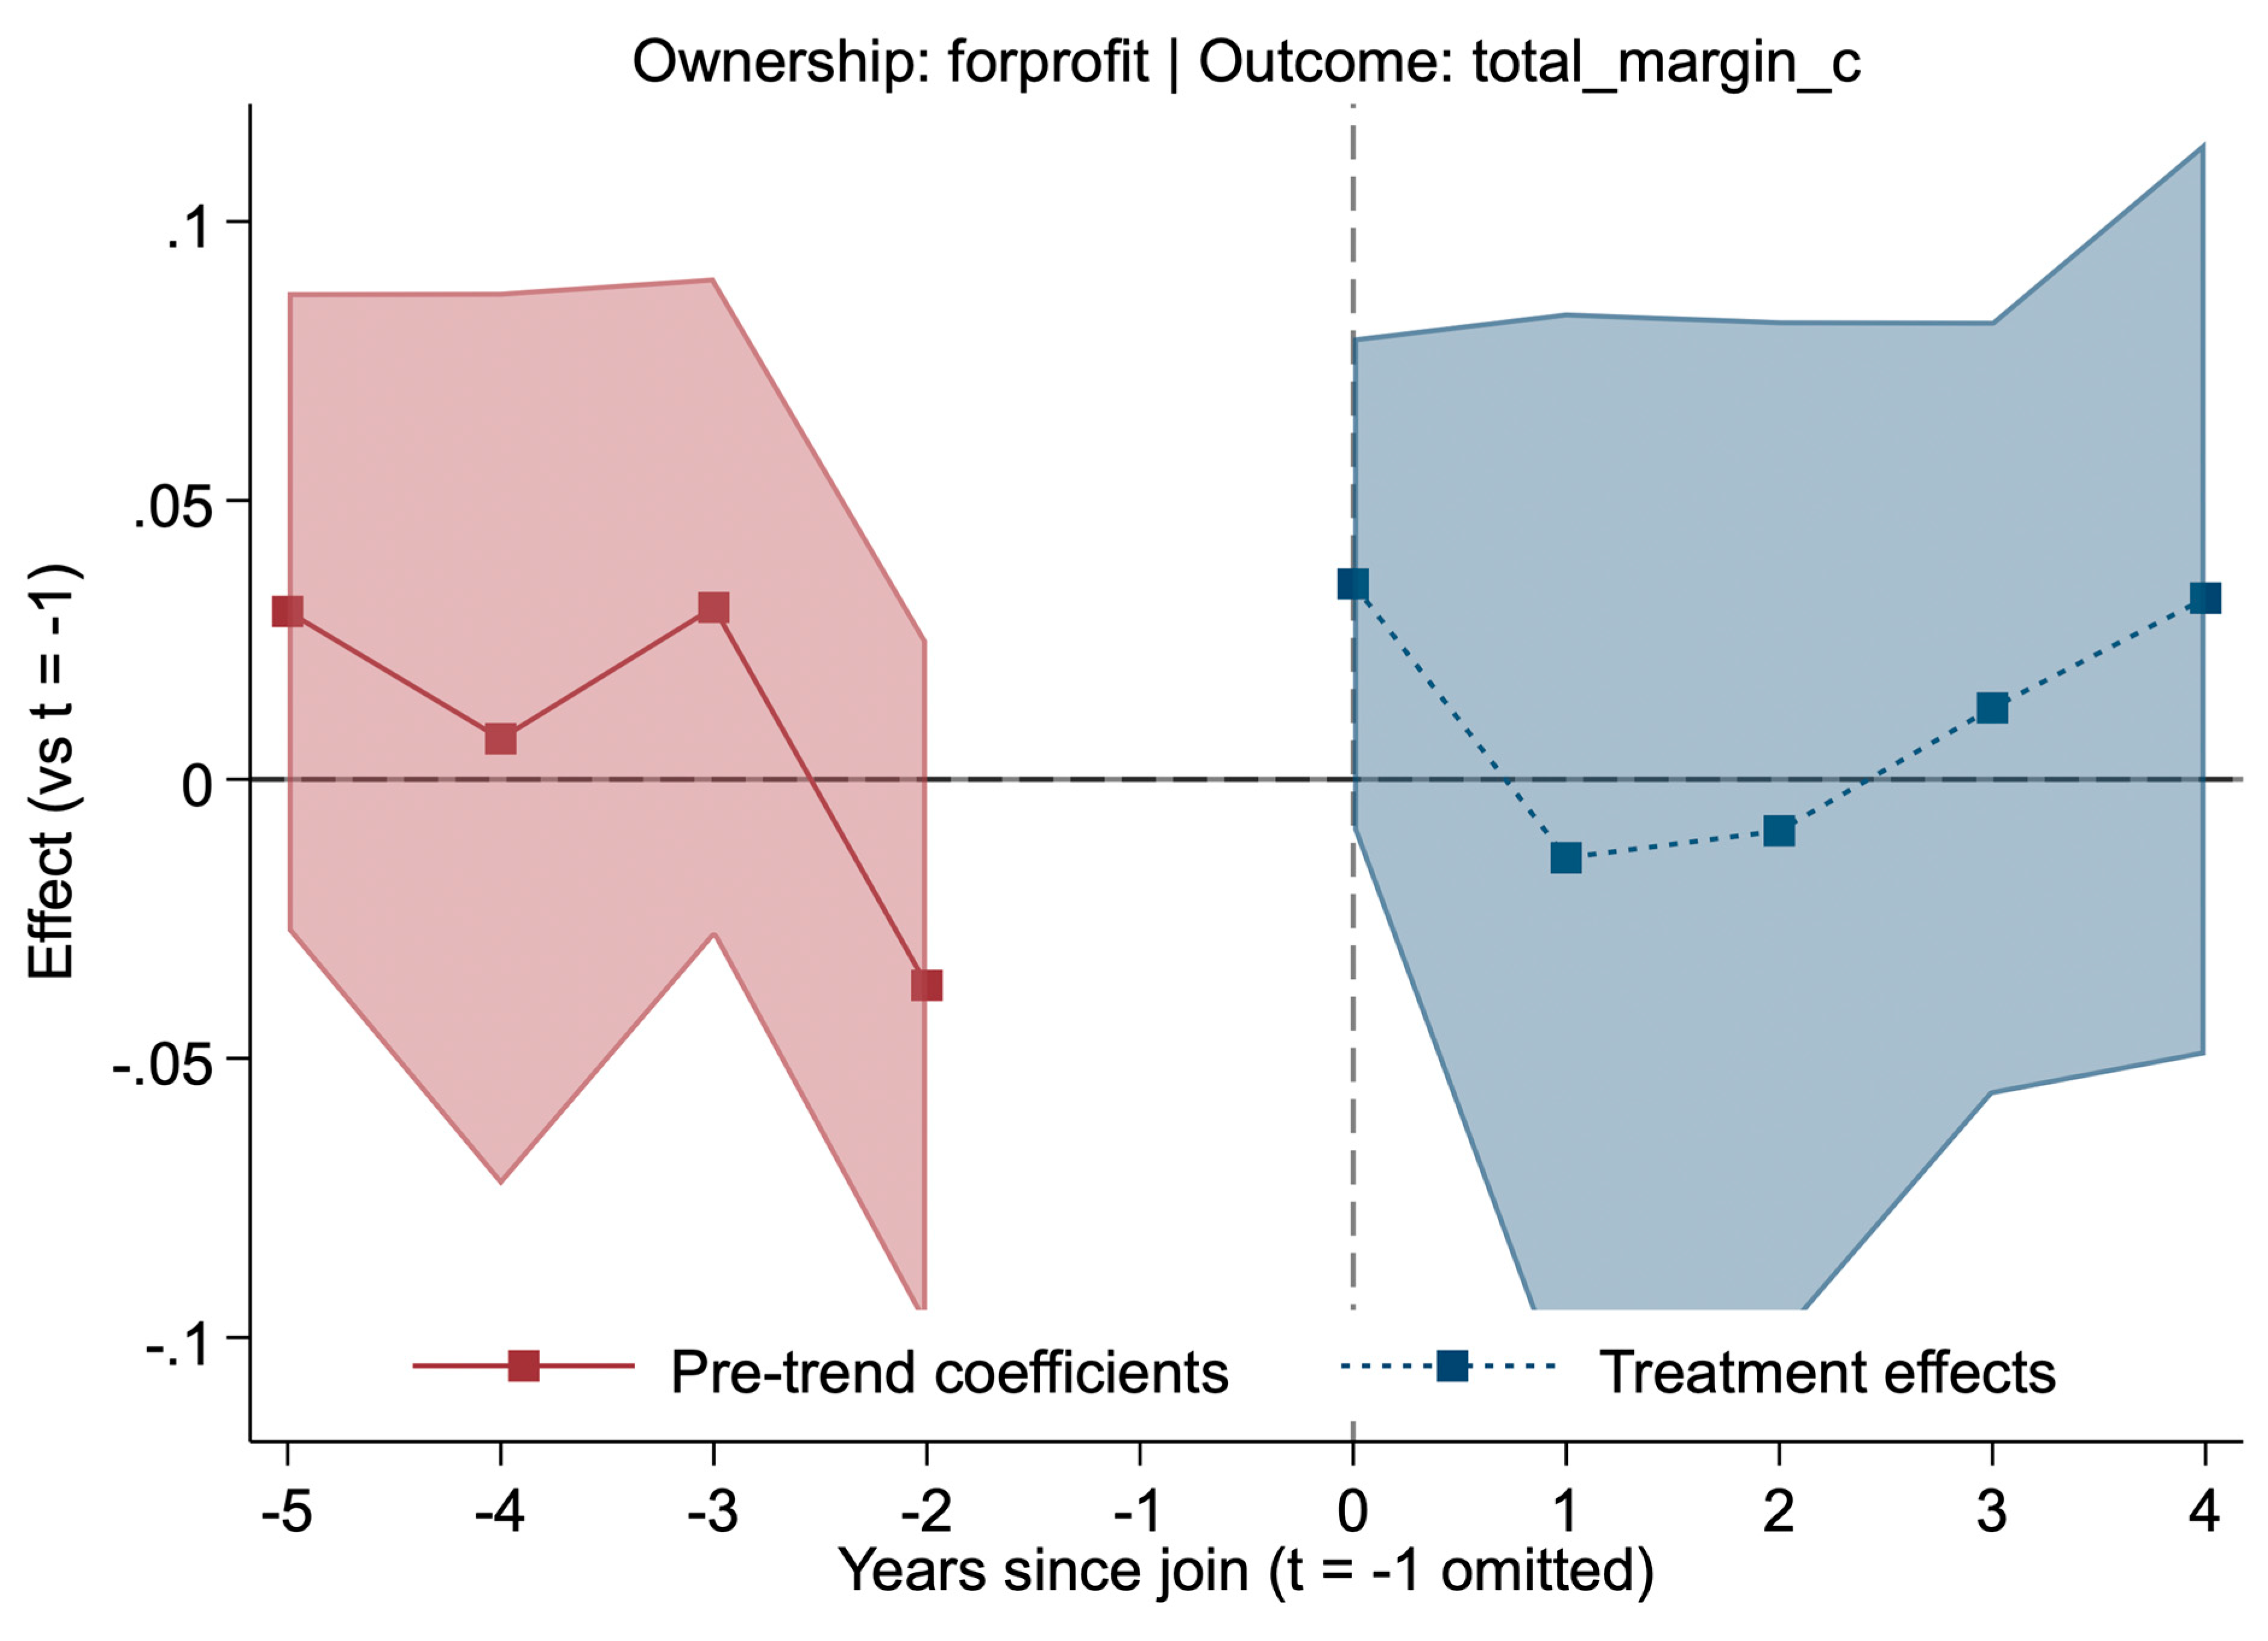
Footnotes:
- Source: Author's analysis. N=16,959; ~2,152 unique forprofits. Model with controls. F=15.43 p=0.0000; adj R2=0.5155; RMSE=0.1445. All p>0.05 insig.
References
- Gaynor M, Town RJ. Competition in health care markets. In: Pauly MV, McGuire TG, Barros PP, eds. Handbook of Health Economics. Vol 2. Amsterdam: Elsevier; 2011:499–637. [CrossRef]
- Gaynor M, Ho K, Town RJ. The Industrial Organization of Health-Care Markets. Journal of Economic Literature. 2015;53(2):235–84. [CrossRef]
- Levinson Z, Godwin J, Hulver S, Neuman T. Ten Things to Know About Consolidation in Health Care Provider Markets. Kaiser Family Foundation. Published April 19, 2024. Accessed November 5, 2025. https://www.kff.org/health-costs/ten-things-to-know-about-consolidation-in-health-care-provider-markets/.
- Bazzoli GJ, Dynan L, Burns LR, Yap C. Two Decades of Organizational Change in Health Care: What Have we Learned? Medical Care Research and Review. 2004;61(3):247-331. [CrossRef]
- Fulton BD. Health Care Market Concentration Trends in the United States: Evidence and Policy Responses. Health Aff (Millwood). 2017;36(9):1530–1538. [CrossRef]
- Dafny LS, Ho K, Lee RS. The Price Effects of Cross-Market Mergers. RAND J Econ. 2019;50(2):286–325. [CrossRef]
- U.S. Department of Justice; Federal Trade Commission. 2023 Merger Guidelines [Internet]. Washington (DC): U.S. Department of Justice; 2023 Dec [cited 2026 Jan 10]. Available from: https://www.justice.gov/atr/merger-guidelines.
- Federal Trade Commission. Merger retrospective program [Internet]. Washington (DC): Federal Trade Commission; [cited 2026 Jan 10]. Available from: https://www.ftc.gov/policy/studies/merger-retrospective-program.
- Cooper Z, Craig SV, Gaynor M, Van Reenen J. The Price Ain't Right? Hospital Prices And Health Spending On The Privately Insured. Q J Econ. Feb 2019;134(1):51-107. doi: 10.1093/qje/qjy020.
- Schmitt M. Do Hospital Mergers Reduce Costs? J Health Econ. 2017;79:102503. [CrossRef]
- Dranove D, Lindrooth R. Hospital consolidation and costs: another look at the evidence. J Health Econ. 2003;22(6):983–997. [CrossRef]
- Cutler DM, Scott Morton F. Hospitals, Market Share, and Consolidation. JAMA. 2013;310(18):1964-1970. [CrossRef]
- Sun L, Abraham S. Estimating dynamic treatment effects in event studies with heterogeneous treatment effects. J Econometrics. 2021;225(2):175–99. [CrossRef]
- Wing C, Simon K, Bello-Gomez RA. Designing difference-in-difference studies: best practices for public health policy research. Annu Rev Public Health. 2018;39:453–469. [CrossRef]
- Zeldow B, Hatfield LA. Confounding and regression adjustment in difference-in-differences studies. Health Serv Res. 2021;56(5):932–41. [CrossRef]
- White C. RAND Hospital Data: Web-Based Tool. TL-303. RAND Corporation; 2018. [CrossRef]
- Centers for Medicare & Medicaid Services (CMS). Healthcare Cost Report Information System (HCRIS) Data Files. National Bureau of Economic Research (NBER); 2024. Accessed November 5, 2025. https://www.nber.org/research/data/healthcare-cost-report-information-system-hcris.
- Cengiz D, Dube A, Lindner A, Zipperer B. The effect of minimum wages on low-wage jobs. Q J Econ. 2019;134(3):1405–1454. [CrossRef]
- Baker AC, Larcker DF, Wang CCY. How much should we trust staggered difference-in-differences estimates? J Financ Econ. 2022;144(2):370–395. [CrossRef]
- Wooldridge JM. Introductory Econometrics: A Modern Approach. 7th ed. Cengage Learning; 2020.
- Folland S, Goodman AC, Stano M, Danagoulian S. The Economics of Health and Health Care. 9th ed. Taylor & Francis; 2024:355.
Figure 1.
Chain-Join Event Study (Sun & Abraham): has2014 [total_margin_w] Heading: Dynamic effects of chain-joining on total margins (Sun & Abraham IW, has2014 baseline, winsorized total_margin_w). Pre-trends mixed near-zero insig (p>0.6-0.9). Post mixed insig (t=0 -0.0005 p=0.918; dips -0.0084 to -0.0091 at t=1-2 p=0.108-0.091; flat by t=4). 95% CIs shaded—no gains.
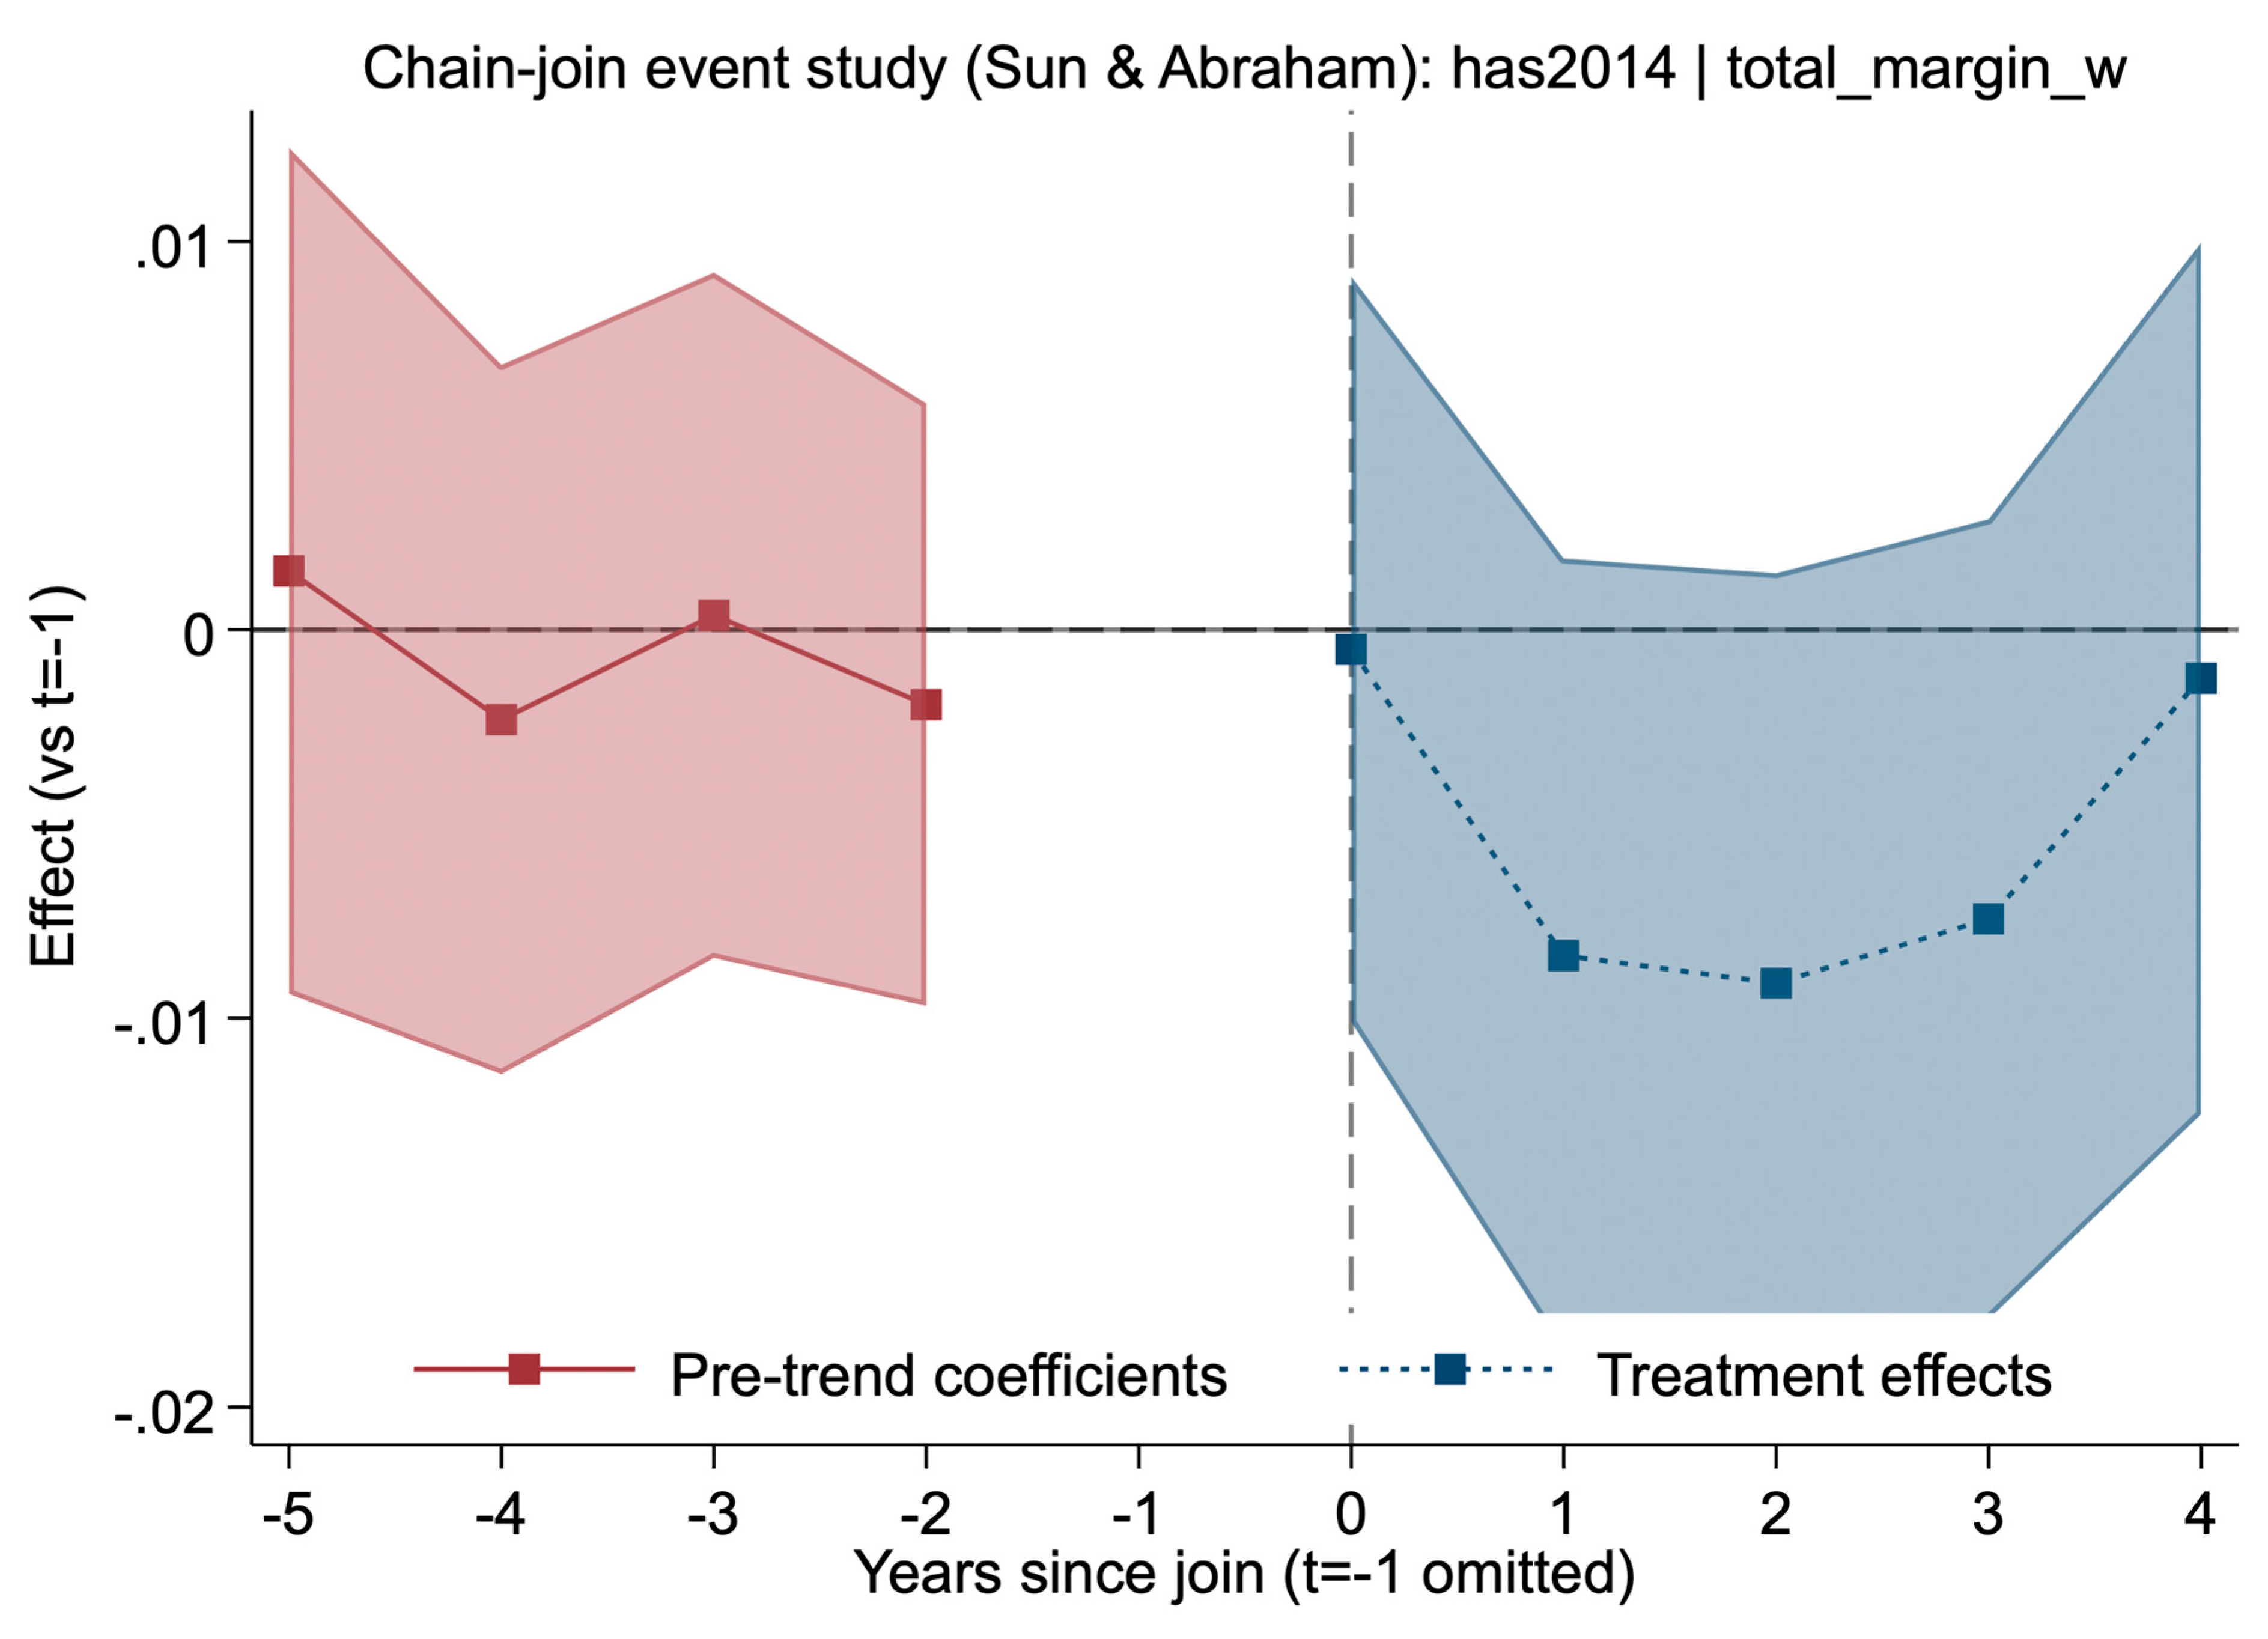
Figure 2.
Chain-Join Event Study (Sun & Abraham): entry [total_margin_w] Heading: Dynamic effects on total margins (entry baseline, winsorized total_margin_w). Pre mixed insig (p>0.3-0.7). Post mixed insig (t=0 0.0009 p=0.856; dips -0.0063 to -0.0072 at t=1-3 p=0.198-0.187; flat by t=4). 95% CIs shaded—consistent with has2014 nulls.
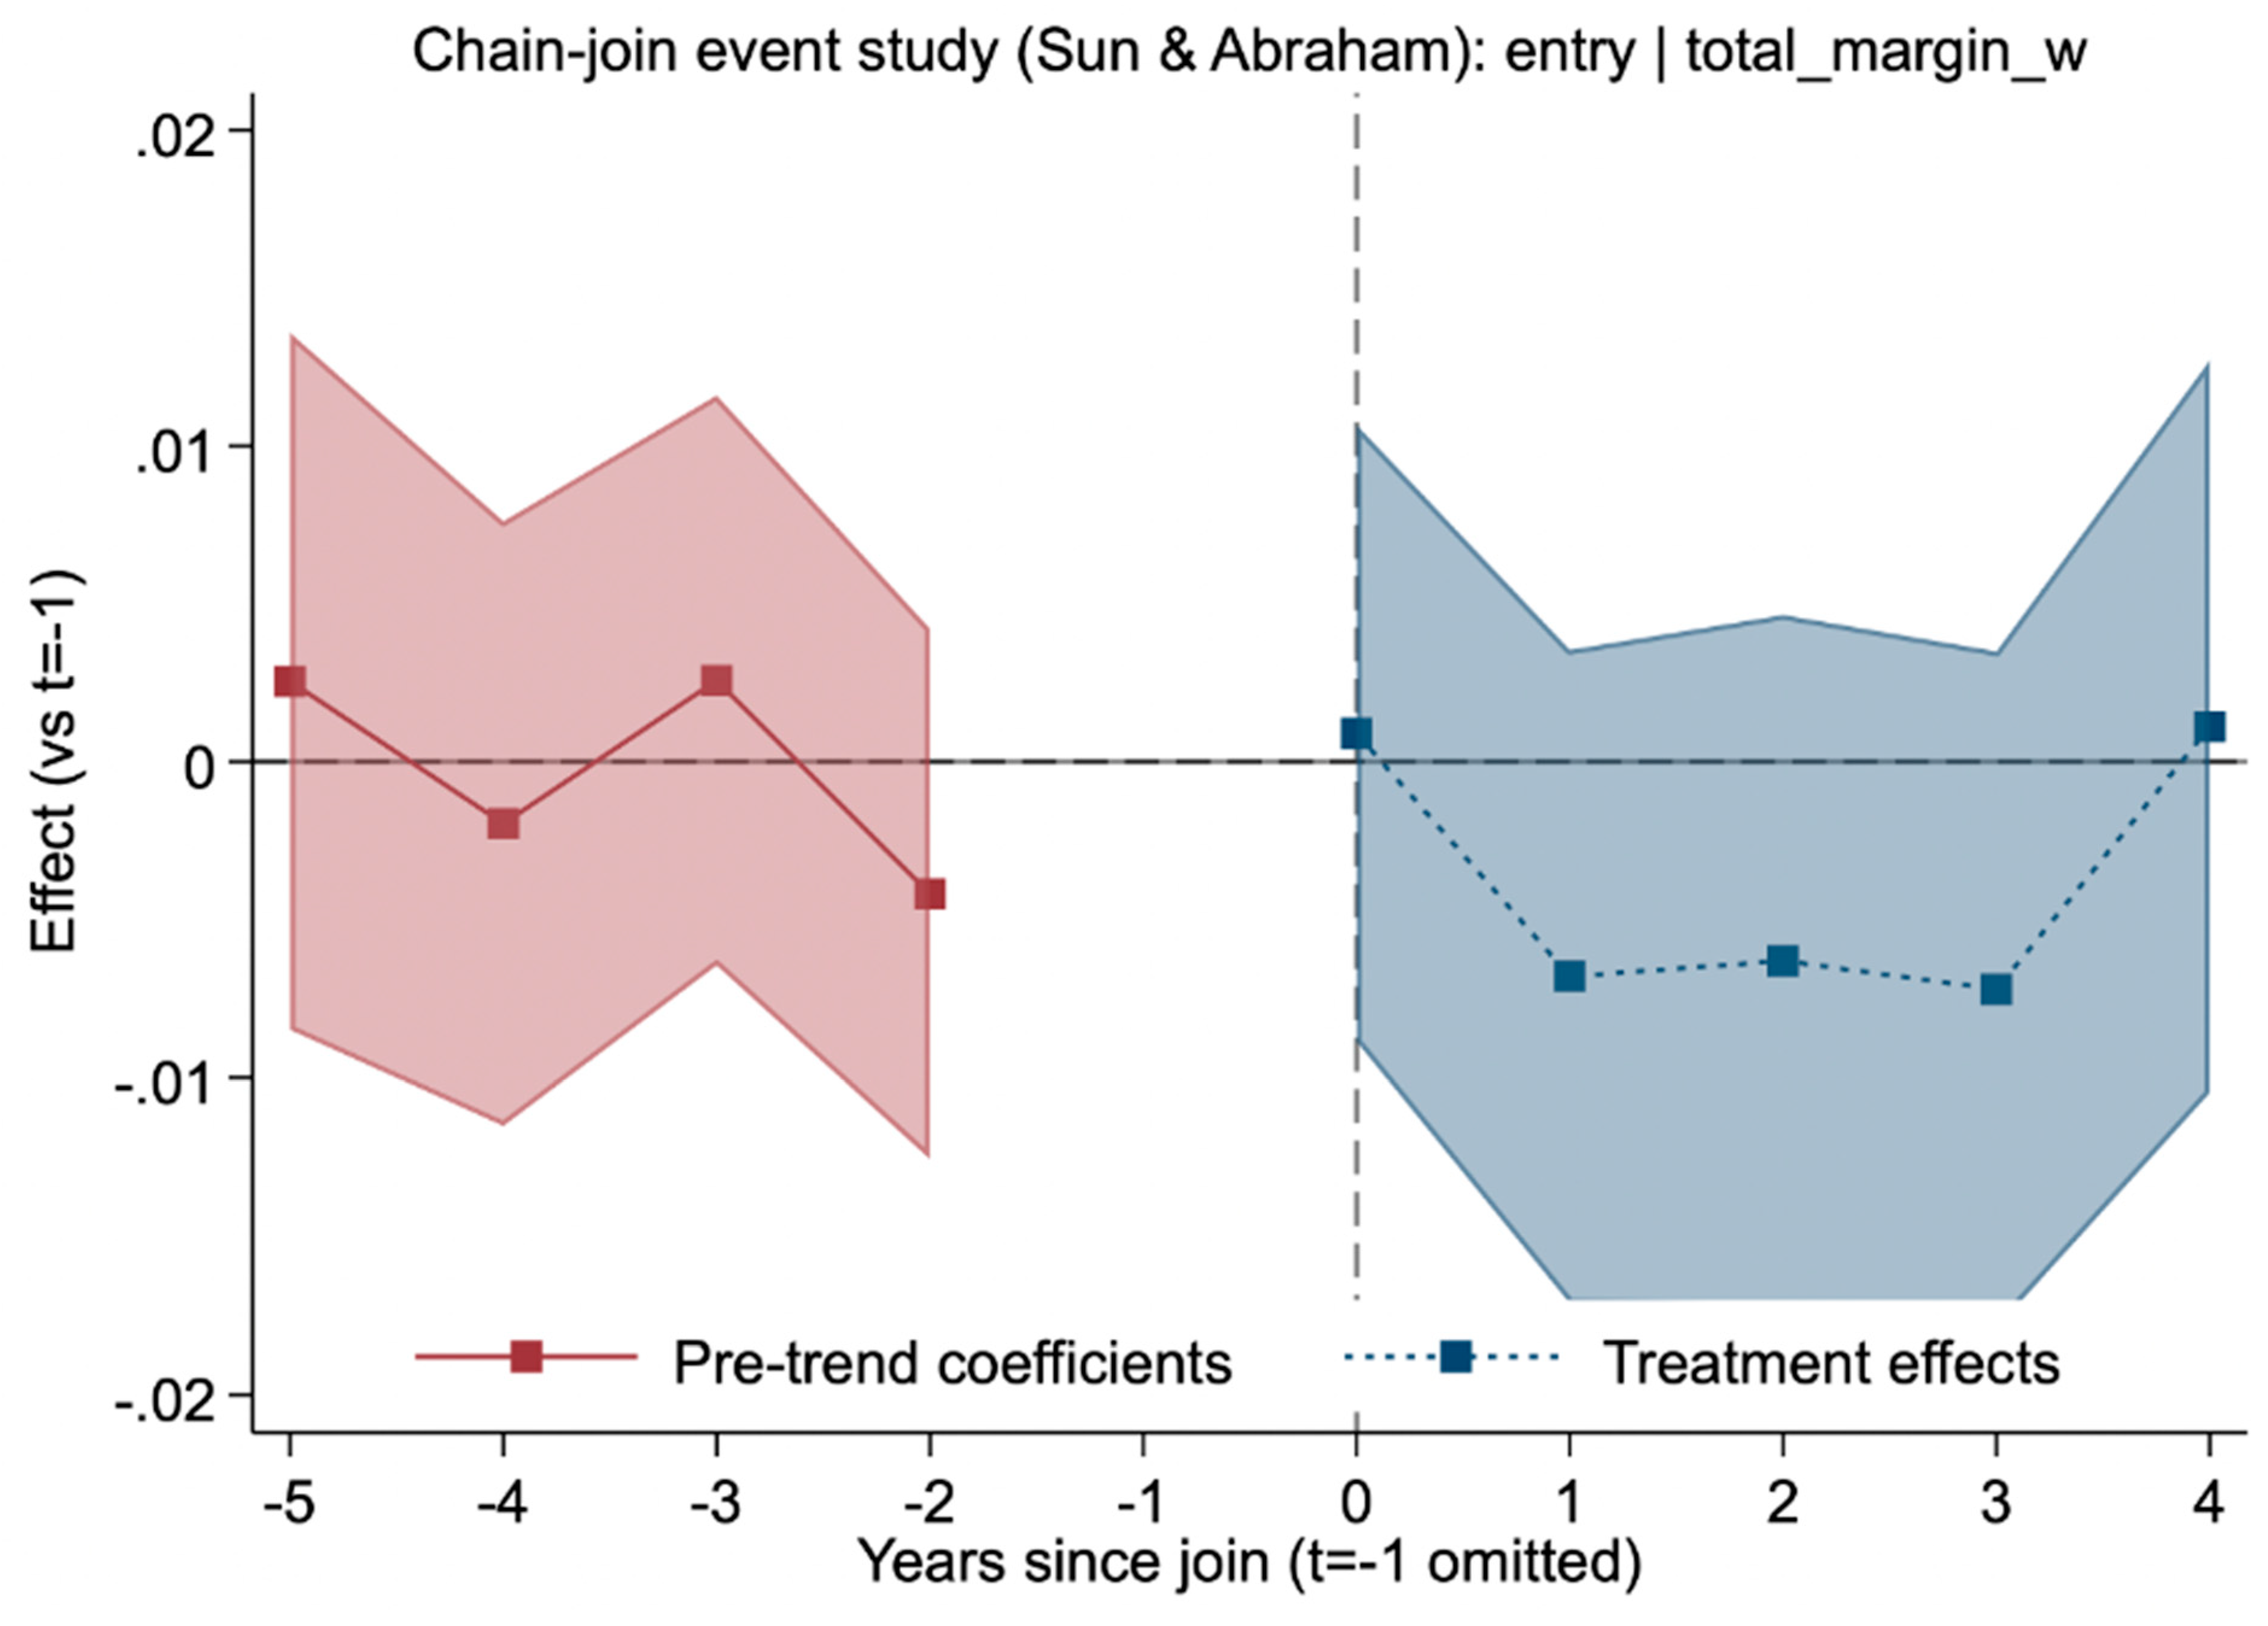
Figure 3.
Chain-Join Event Study (Sun & Abraham): has2014 [operating_margin_w]Heading: Dynamic effects on operating margins (has2014, winsorized operating_margin_w). Pre mixed insig (p>0.5-0.8). Post negative insig (t=0 -0.0014 p=0.804; dips -0.0084 to -0.0110 at t=1-2 p=0.172-0.058; flat by t=4). 95% CIs shaded—no benefits.
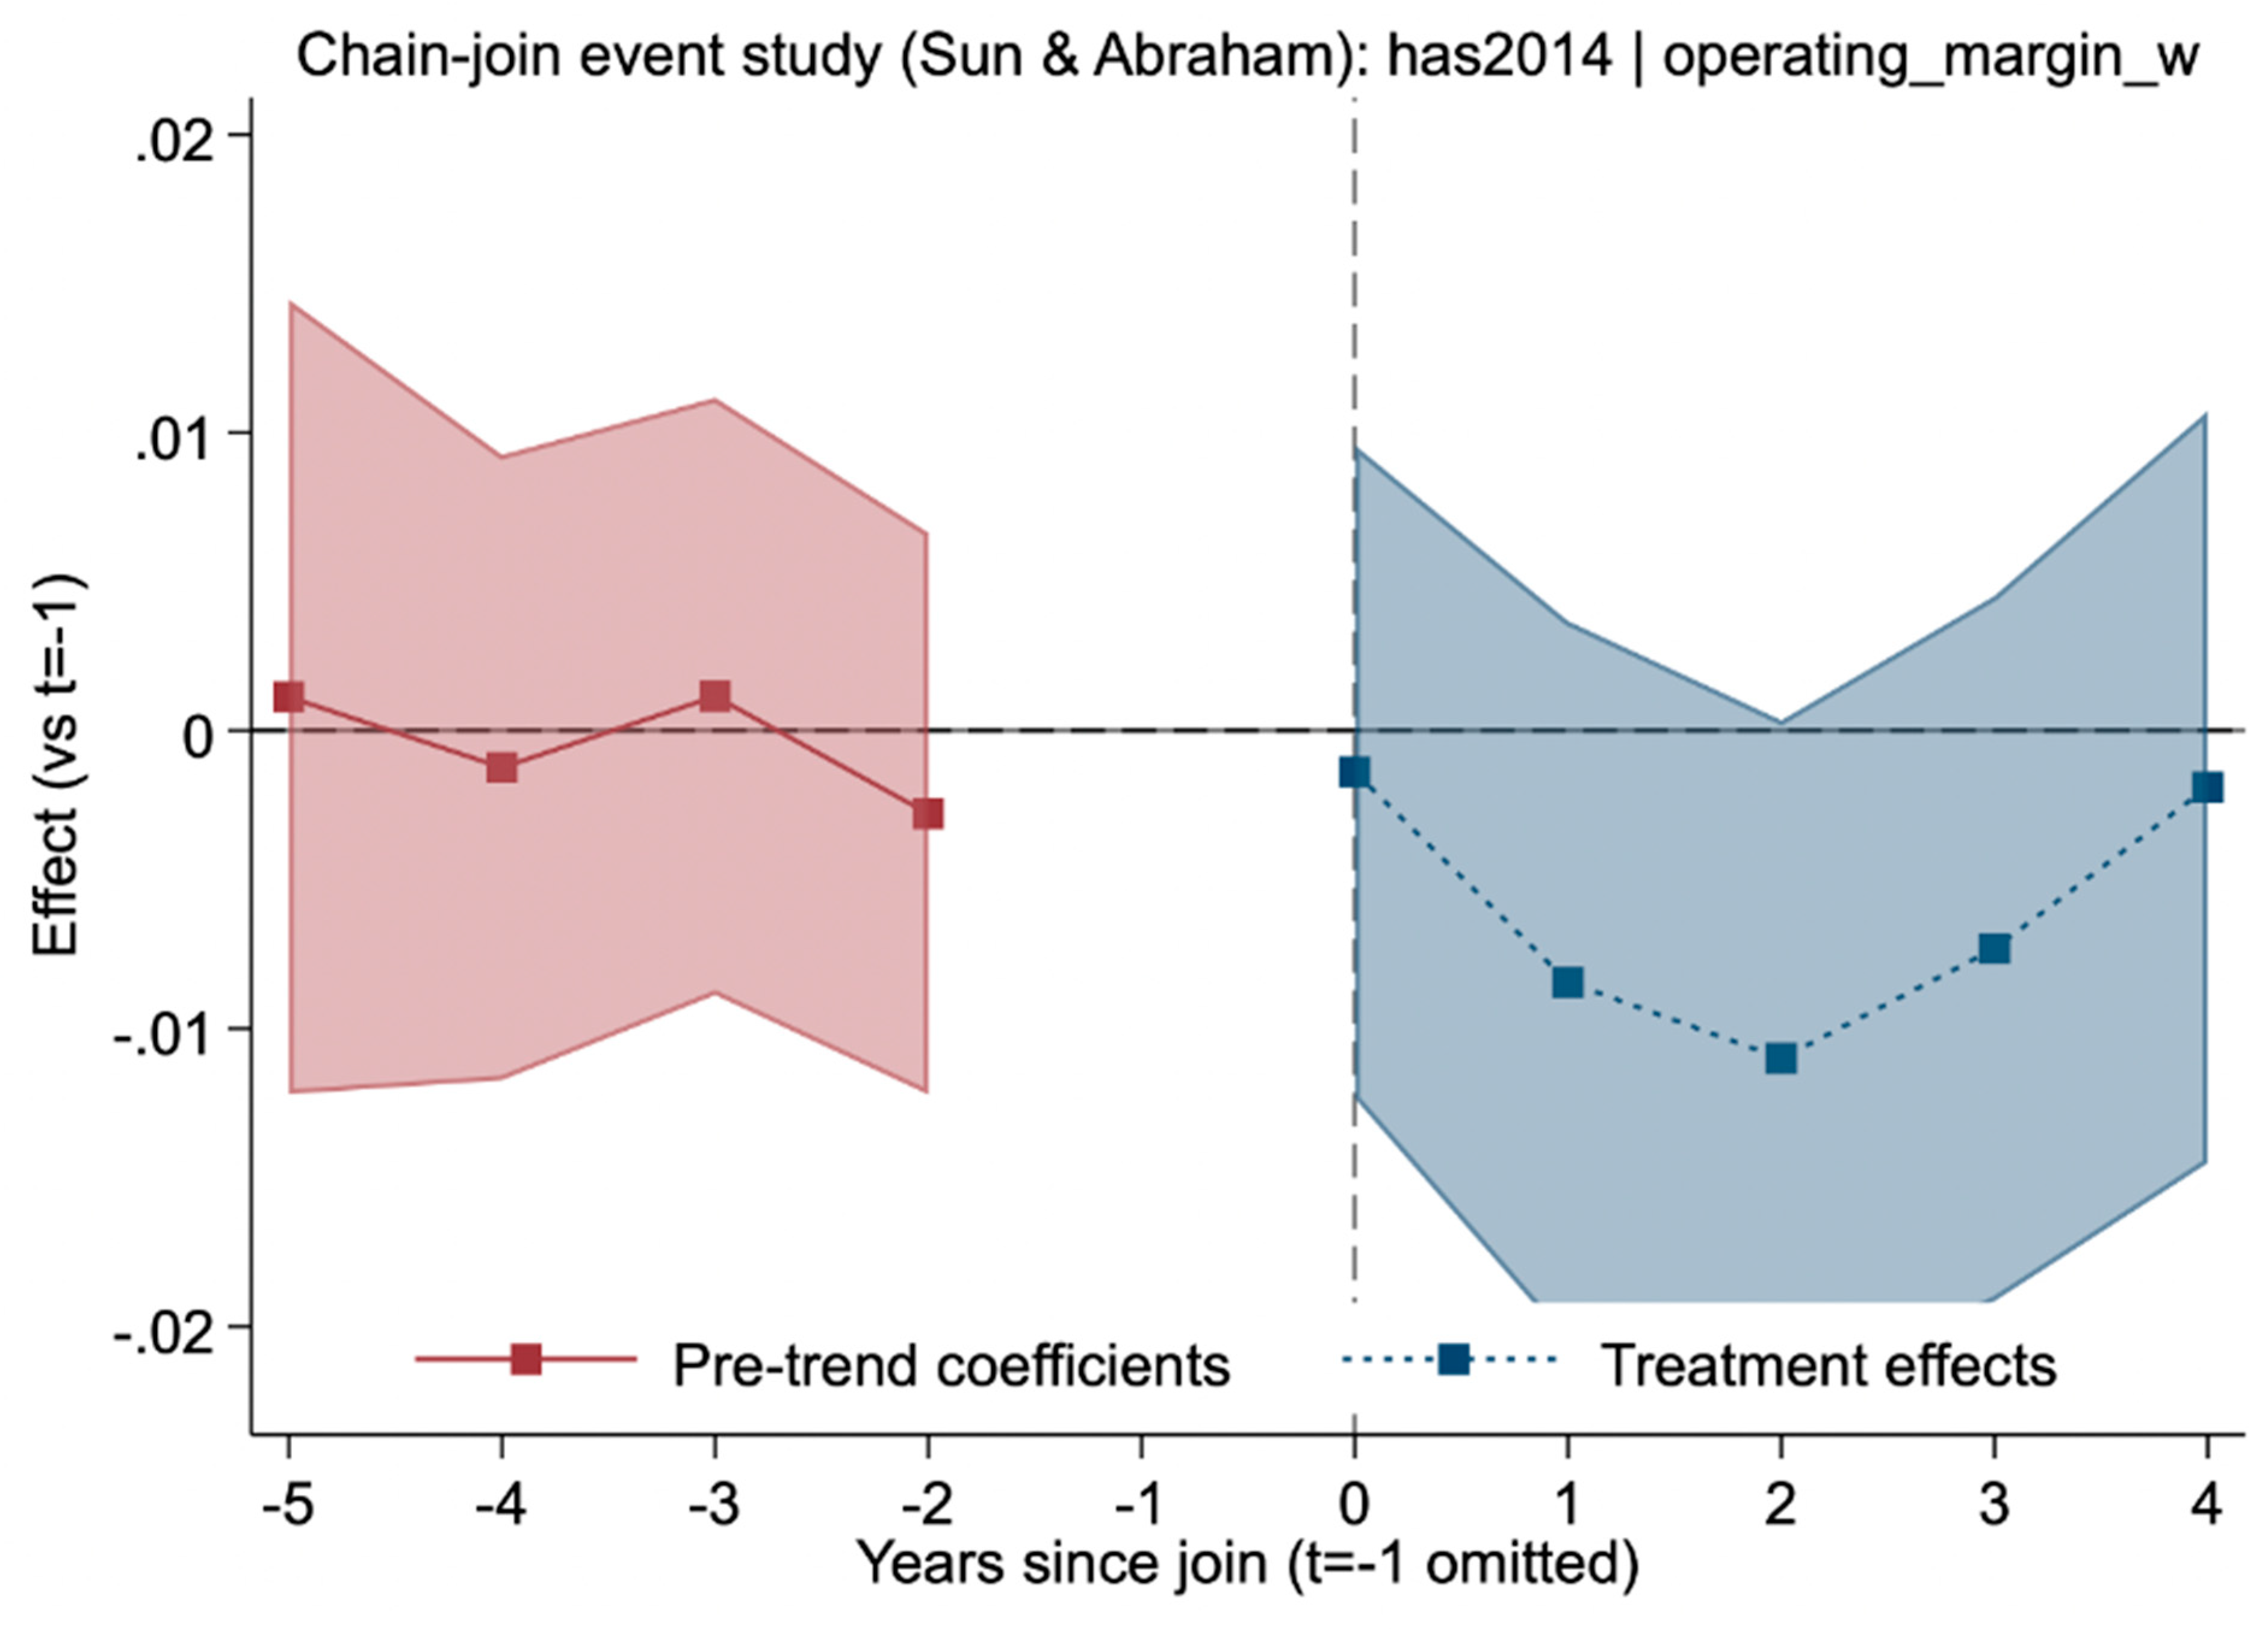
Figure 4.
Chain-Join Event Study (Sun & Abraham): has2014 [cash_flow_margin_w] Heading: Dynamic effects on cash flow margins (has2014, winsorized cash_flow_margin_w). Pre negatives mostly insig (p>0.2-0.4, marginal t=-4 p=0.033). Post negative insig (t=0 -0.0013 p=0.831; dips -0.0052 to -0.0121 at t=1-2 p=0.394-0.059; flat by t=4). 95% CIs shaded—no gains.
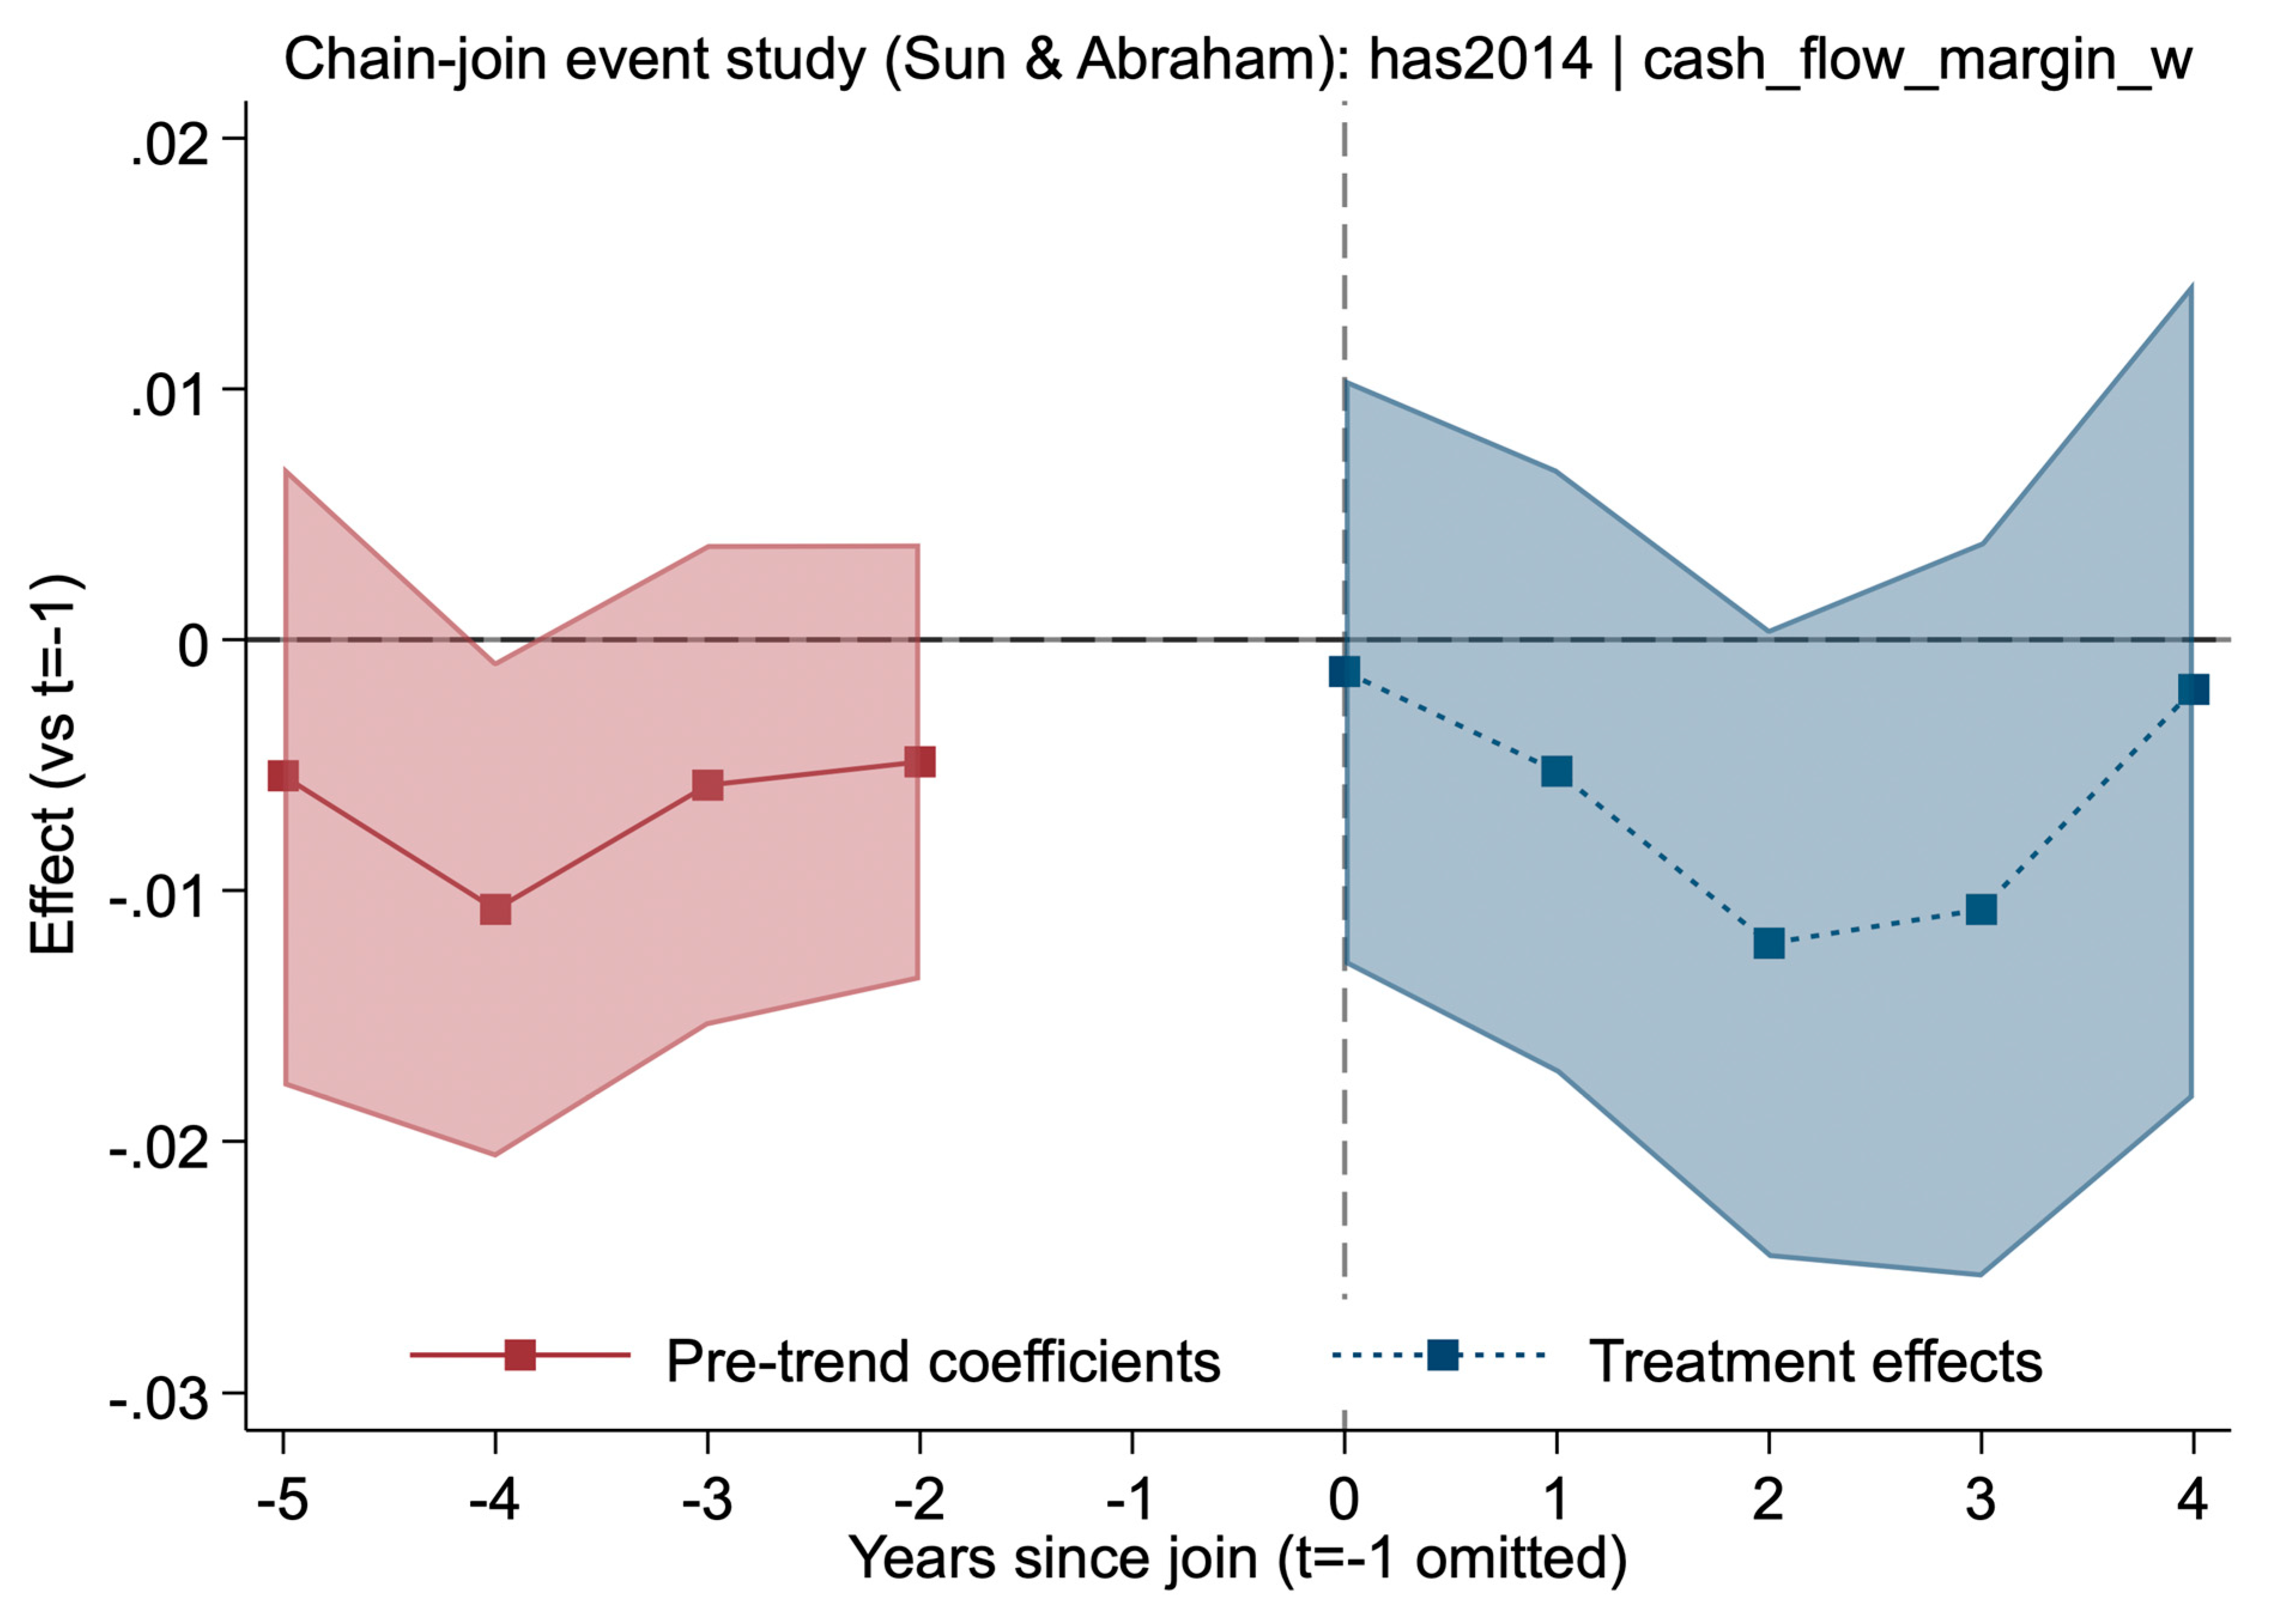
Figure 5.
Placebo Test (never-treated hospitals): total_marginHeading: Placebo effects with random treatment years (2015-2020) on never-treated hospitals (Sun & Abraham, total_margin). Pre/post mixed negatives insig (p>0.2-0.88; t=0 -0.145 p=0.250; t=-5 -0.120 p=0.475). Overall F=0.78 p=0.8795 insig—no effects, supporting validity. 95% CIs shaded. Beds/major_teaching insig.
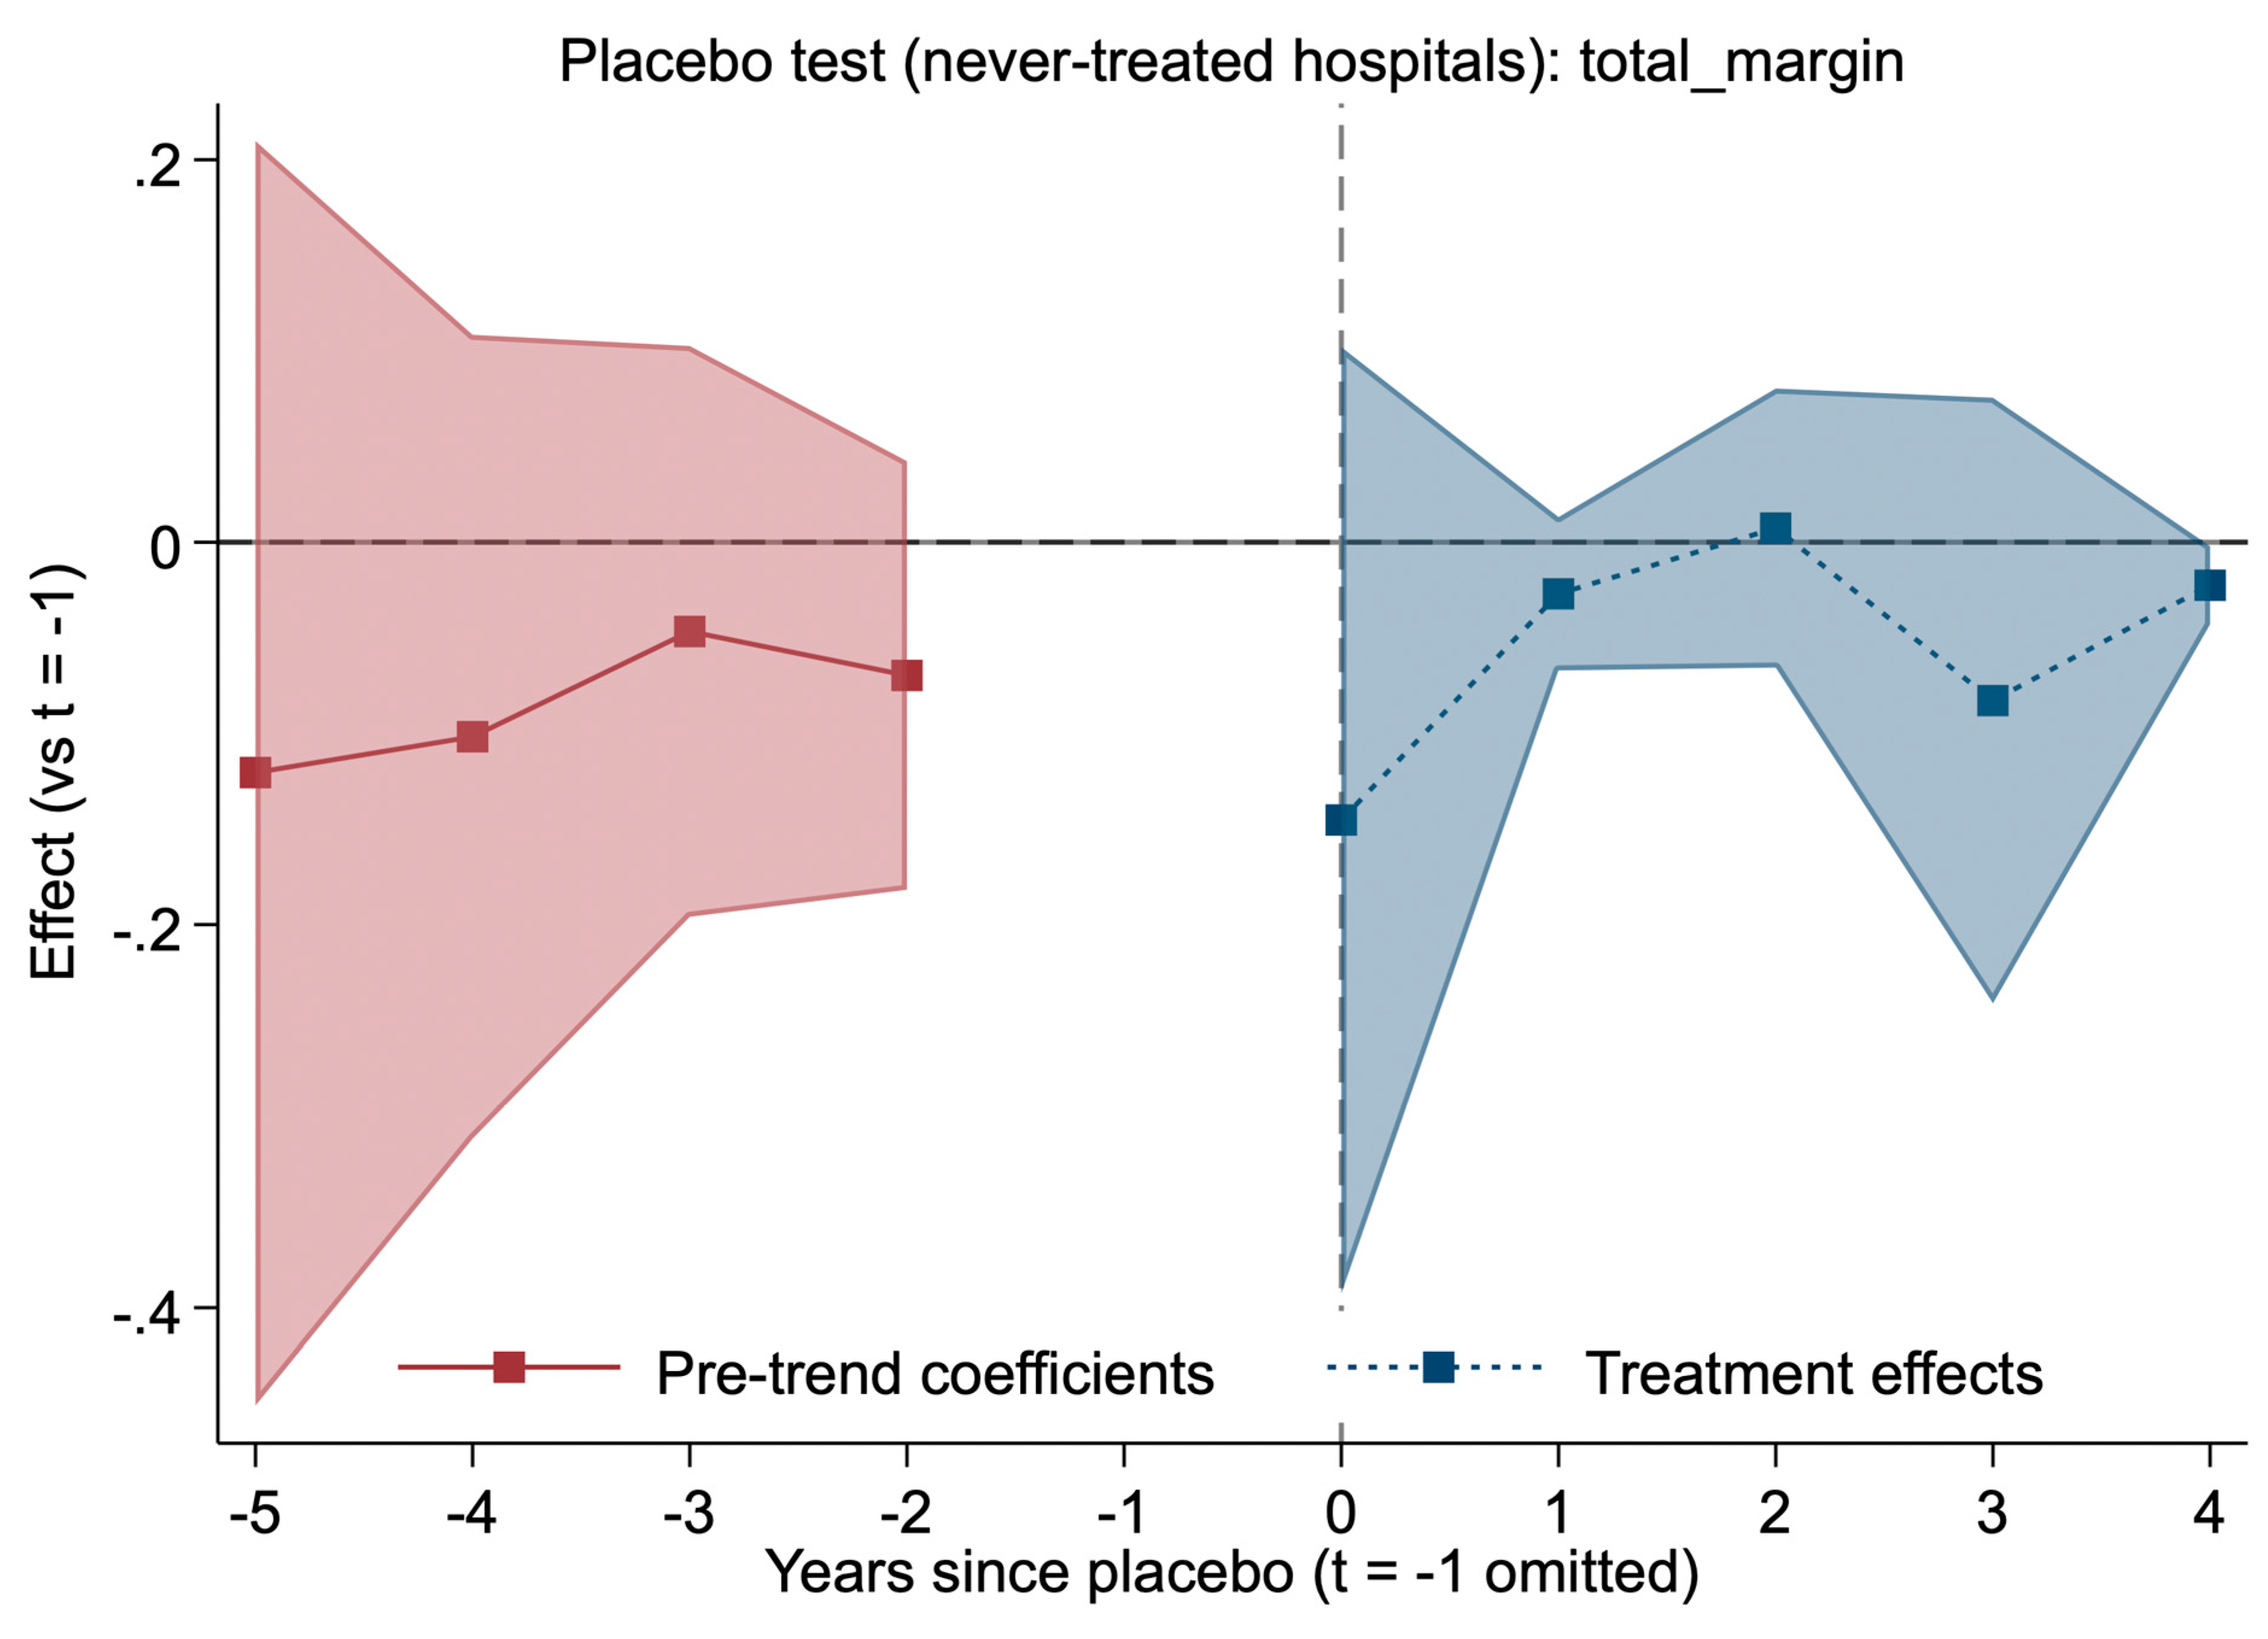
Figure 6.
Stacked Event Study: total_margin_c Heading: Dynamic effects on treated hospitals only (stacked Sun & Abraham, cleaned total_margin_c). Pre negatives insig (p>0.3-0.99). Post mixed insig (t=0 -0.0003 p=0.964; marginal negative t=1 -0.054 p=0.061; flat later). 95% CIs shaded—confirms main nulls in stacked design. Beds positive small (p=0.000).
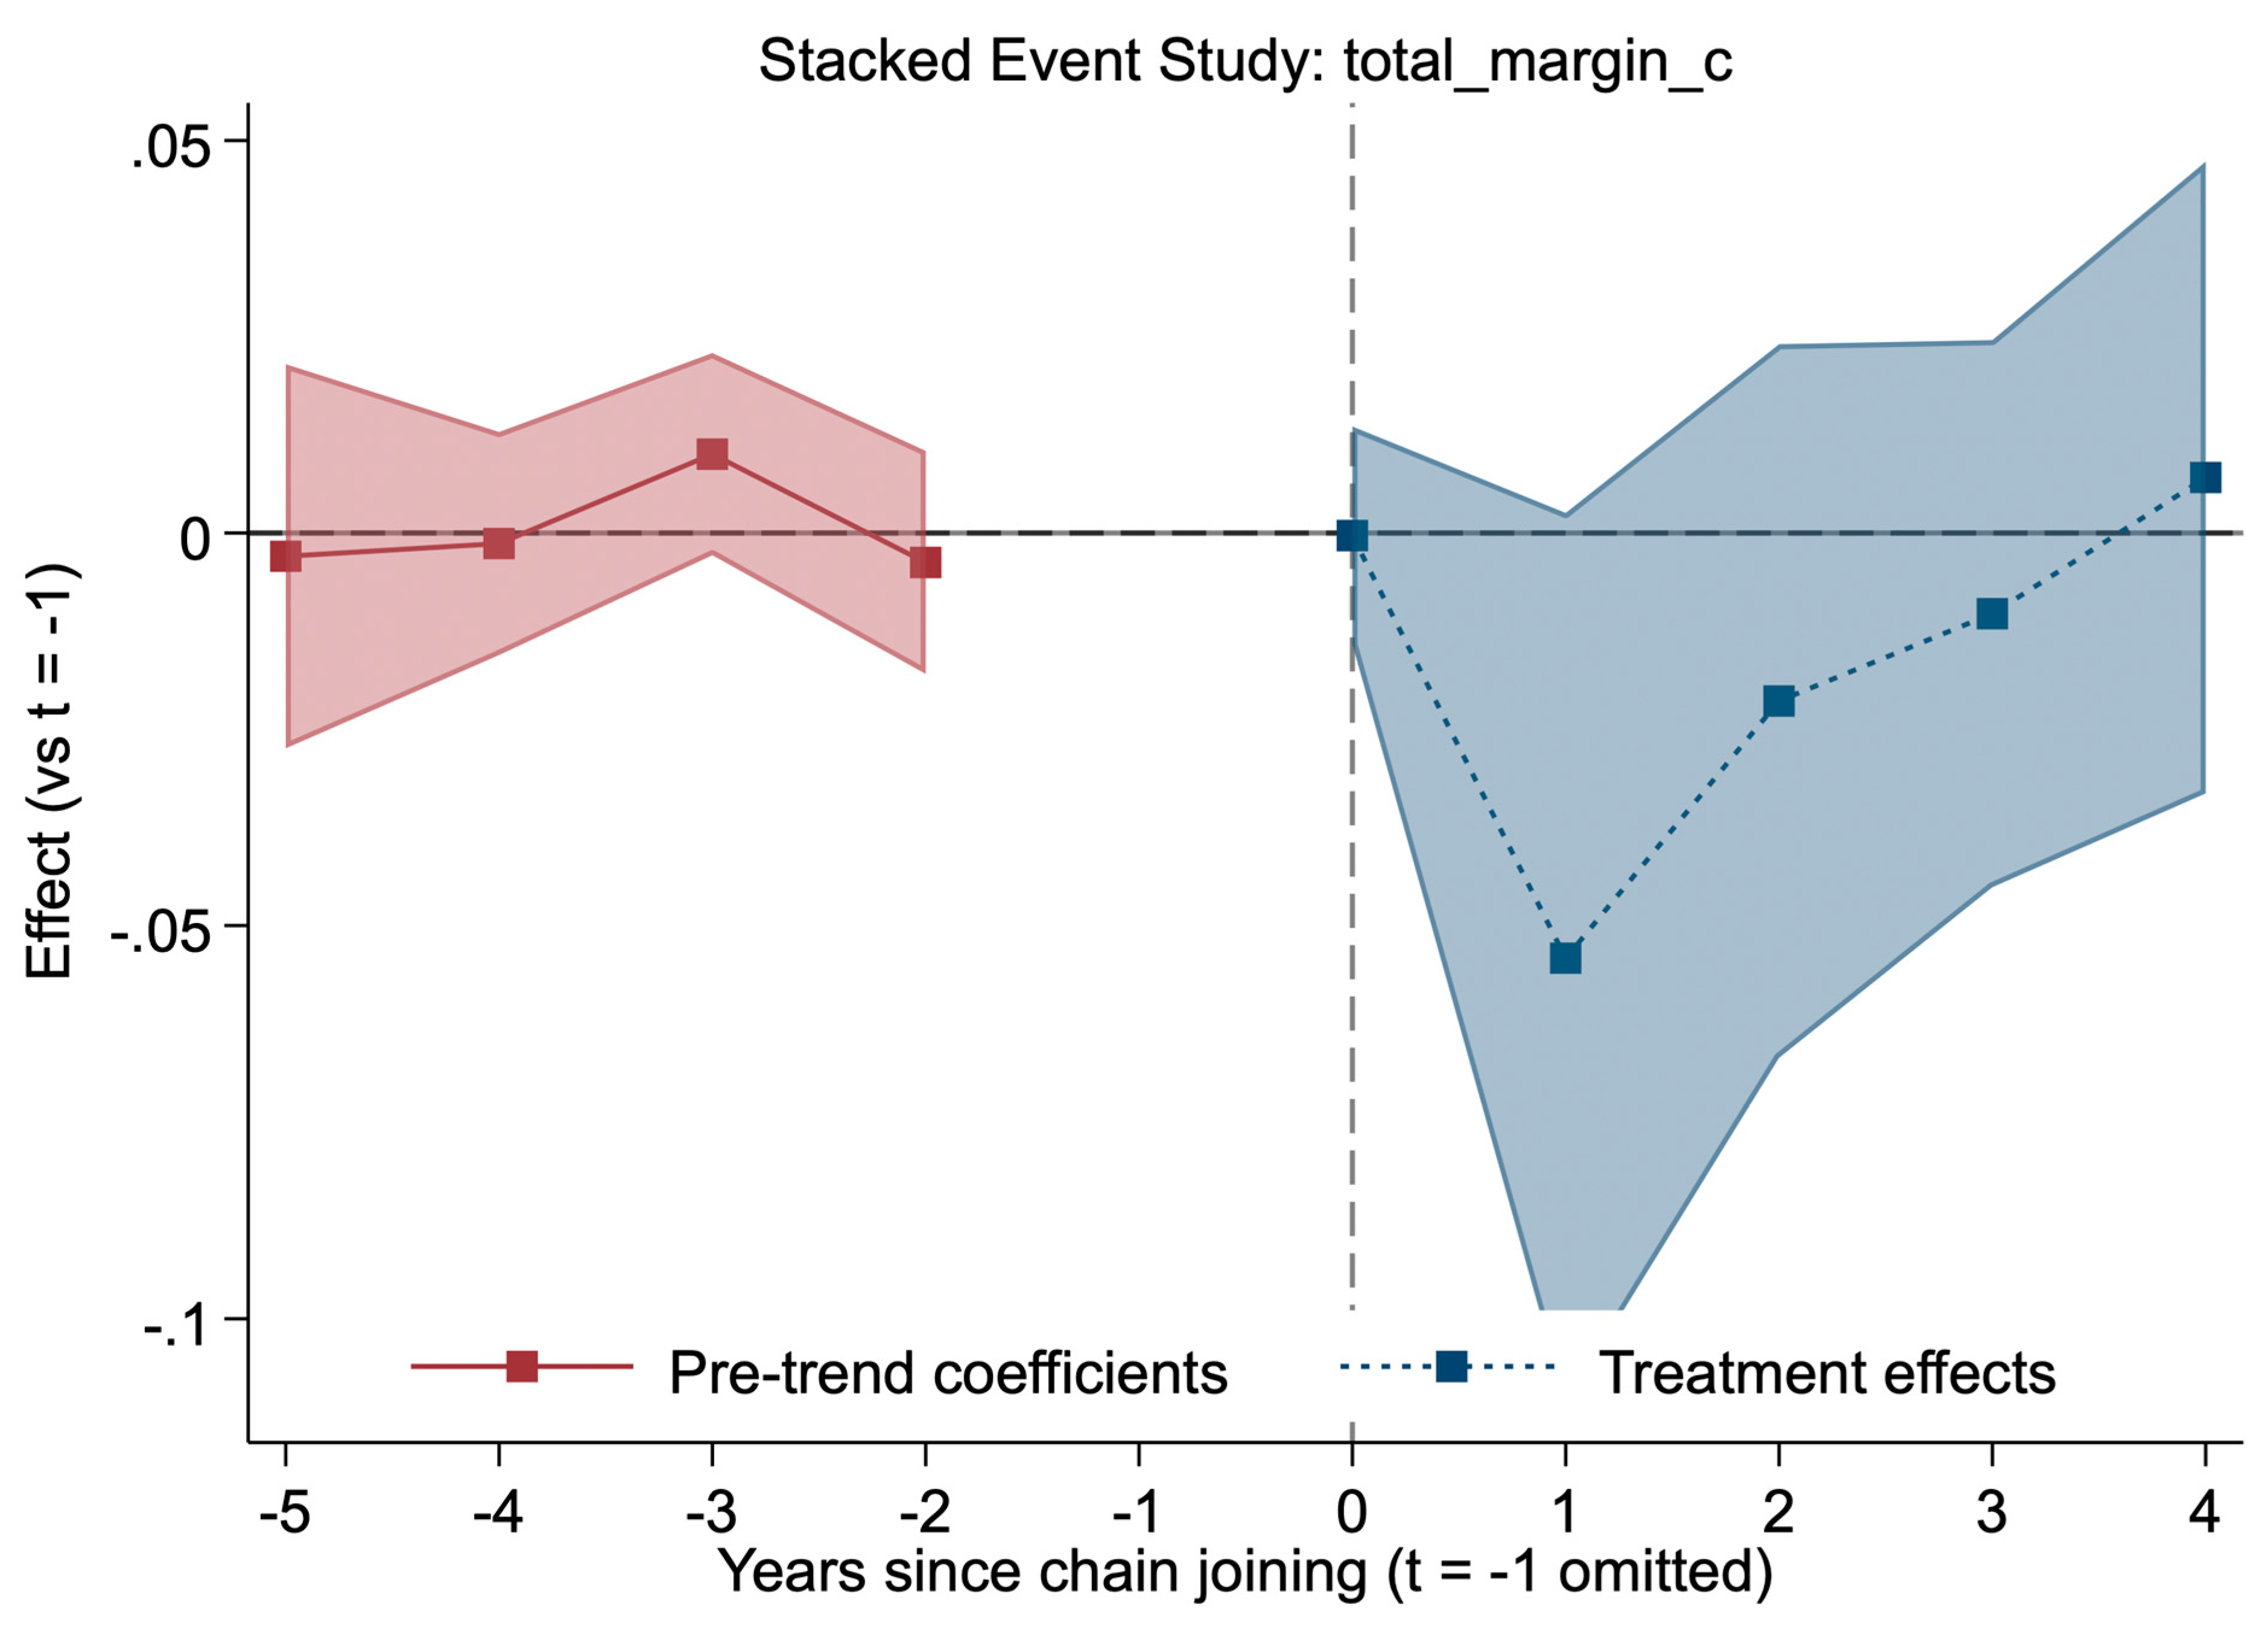
Table 1.
Descriptive Statistics and Baseline Covariate Balance (2014–2023, Has2014 Baseline). Heading: Summary statistics for the cleaned panel under the has2014 baseline (hospitals observed and non-chain in 2014). Means and standard deviations reflect cleaned and winsorized values. Chain joining is dispersed across years, with ~24% of hospitals ever becoming affiliated. Panel B compares baseline (2014) covariates across future treated vs. never-treated hospitals.
| Panel A. Full Sample Descriptive Statistics. | ||||||
| Variable | Mean ± SD | Non-Missing N | Description | |||
| Total Margin (Cleaned, Winsorized) | 0.0300 ± 0.1155 | 22,976 | Overall profitability (%) | |||
| Operating Margin (Cleaned, Winsorized) | -0.0119 ± 0.1660 | 22,954 | Core operating efficiency (%) | |||
| Cash Flow Margin (Cleaned, Winsorized) | 0.0639 ± 0.1251 | 13,540 | Liquidity (%) | |||
| Beds | 105.9 ± 156.3 | 23,144 | Hospital size | |||
| Major Teaching (Proportion) | 0.10 (10.1%) | 22,905 | Academic status (binary indicator) | |||
| Ever Chain-Affiliated | 23.86% | 2,615 hospitals | Based on first_treat (sustained joining) | |||
| Panel B. Covariate Balance at Baseline (2014) | ||||||
| Variable | Treated Mean | Control Mean | p-value | |||
| Beds | 105.9 | 95.3 | 0.042 | |||
| Total Margin (2014) | 0.028 | 0.031 | 0.380 | |||
| Major Teaching | 10.1% | 6.3% | 0.050 | |||
Footnote
- Source: Author’s analysis of RAND HCRIS data (2014–2023). “Treated” includes hospitals that joined a chain (sustained) after 2014; “Control” are never-treated. p-values from two-sample t-tests. Cleaning includes year-specific denominator screens, hard caps (|margin| > 5), and within-year winsorization (p1/p99).
Table 2.
Event Study Coefficients for Total Margin (Cleaned and Winsorized; Has2014 Baseline). Estimates from Sun & Abraham’s interaction-weighted (IW) event study. All models include hospital and year fixed effects with provider-level clustered standard errors. The outcome is total margin, cleaned and winsorized within year (1st/99th percentile). Coefficients are relative to t = −1. Pre-trends are small and insignificant (p > 0.6). Post-treatment estimates are negative but not statistically significant (p > 0.09–0.92), with transient dips at t = 1–3 and attenuation by t = 4.
| Term | Coefficient | SE | t | p>|t| | 95% CI Lower | 95% CI Upper |
| L_0 | -0.0005 | 0.0049 | -0.10 | 0.918 | -0.0101 | 0.0091 |
| L_1 | -0.0084 | 0.0052 | -1.61 | 0.108 | -0.0186 | 0.0018 |
| L_2 | -0.0091 | 0.0054 | -1.69 | 0.091 | -0.0197 | 0.0015 |
| L_3 | -0.0075 | 0.0053 | -1.42 | 0.156 | -0.0178 | 0.0028 |
| L_4 | -0.0013 | 0.0057 | -0.22 | 0.827 | -0.0125 | 0.0100 |
| F_2 | -0.0019 | 0.0040 | -0.49 | 0.626 | -0.0097 | 0.0058 |
| F_3 | 0.0004 | 0.0045 | 0.08 | 0.934 | -0.0085 | 0.0092 |
| F_4 | -0.0023 | 0.0047 | -0.50 | 0.619 | -0.0115 | 0.0068 |
| F_5 | 0.0015 | 0.0056 | 0.27 | 0.785 | -0.0094 | 0.0124 |
Note:
- •
- Source: Author's analysis of RAND HCRIS data (2014–2023). N=22,928; 2,615 unique hospitals. Relative to t=-1. Model: IW with hospital/year FE, clustered SE. Winsorized after cleaning. F=1.91 p=0.0001; adj R2=0.4549; RMSE=0.0848. All p>0.05, insignificant (marginal t=2 p=0.091).
Table 3.
Robustness and Subgroup Event Study Estimates for Total Margin (Cleaned, Has2014 Sample). Summary of interaction-weighted event study estimates for cleaned total margin under robustness checks and subsample analyses. All models include hospital and year fixed effects, clustered standard errors, and controls (beds, major_teaching). Balanced panel requires full observation 2014–2023. Stacked is treated-only. Placebo assigns random treatment to never-treated hospitals. Ownership-stratified models suggest marginal longer-run gains for nonprofits (t = 3, 4), but no consistent effects overall. Full tables in appendix.
| Term/Model | Coefficient | SE | t | p>|t| | 95% CI Lower | 95% CI Upper | Notes |
| L_0 (Balanced) | 0.0006 | 0.0055 | 0.12 | 0.907 | -0.0102 | 0.0115 | N=48,871; F=3.17 p=0.0000; adj R2=0.4617; RMSE=0.1234 |
| L_1 (Balanced) | -0.0668 | 0.0356 | -1.87 | 0.061 | -0.1367 | 0.0031 | Marginal negative |
| ... (abbreviate for space; full in appendix) | ... | ... | ... | ... | ... | ... | Beds 9.17e-09 p=0.070 marginal; major_teaching 0.0017 p=0.078 marginal |
| L_0 (Stacked) | -0.0003 | 0.0071 | -0.05 | 0.964 | -0.0142 | 0.0136 | N=38,655; treated only; F=2.34 p=0.0000; adj R2=0.4900; RMSE=0.1334 |
| L_1 (Stacked) | -0.0541 | 0.0289 | -1.87 | 0.061 | -0.1109 | 0.0026 | Marginal negative |
| ... | ... | ... | ... | ... | ... | ... | Beds 2.00e-08 p=0.000; major_teaching 0.0013 p=0.109 |
| L_0 (Placebo) | -0.1453 | 0.1262 | -1.15 | 0.250 | -0.3927 | 0.1022 | N=18,167; never-treated with random treatment; F=0.78 p=0.8795; adj R2=0.2509; RMSE=1.7239 |
| L_4 (Placebo) | -0.0225 | 0.0104 | -2.16 | 0.031 | -0.0430 | -0.0021 | Marginal negative; overall null as expected |
| ... | ... | ... | ... | ... | ... | ... | Beds 6.48e-09 p=0.964 insig; major_teaching 0.0033 p=0.568 insig |
| L_0 (Nonprofit Ownership) | 0.0014 | 0.0063 | 0.22 | 0.824 | -0.0109 | 0.0137 | N=28,970; F=32,287 p=0.0000; adj R2=0.4159; RMSE=0.1215 |
| L_3 (Nonprofit Ownership) | 0.0288 | 0.0164 | 1.75 | 0.080 | -0.0034 | 0.0609 | Marginal positive |
| L_4 (Nonprofit Ownership) | 0.0370 | 0.0185 | 2.00 | 0.045 | 0.0008 | 0.0732 | Sig positive |
| ... | ... | ... | ... | ... | ... | ... | Beds 2.09e-08 p=0.000; major_teaching 0.0011 p=0.145 |
| L_0 (Forprofit Ownership) | 0.0350 | 0.0225 | 1.56 | 0.120 | -0.0091 | 0.0792 | N=16,959; F=15.43 p=0.0000; adj R2=0.5155; RMSE=0.1445 |
| L_4 (Forprofit Ownership) | 0.0325 | 0.0418 | 0.78 | 0.437 | -0.0495 | 0.1144 | Insig positive |
| ... | ... | ... | ... | ... | ... | ... | Beds 1.48e-08 p=0.003; major_teaching -0.0005 p=0.775 |
Note:
- •
- Source: Author's analysis of RAND HCRIS data (2014–2023). Relative to t=-1. Model: IW with FE, clustered SE, controls (beds, major_teaching). Cleaning: Denom screens/caps applied. Balanced: All 10 years observed. Stacked: Treated only. Placebo: Random treatment on never-treated (seed=20260114). Ownership: Subsample by type. All event terms p>0.05 insig except marginal/sig in nonprofits t=3/4, placebo t=4, balanced t=1. Full tables in appendix.
Disclaimer/Publisher’s Note: The statements, opinions and data contained in all publications are solely those of the individual author(s) and contributor(s) and not of MDPI and/or the editor(s). MDPI and/or the editor(s) disclaim responsibility for any injury to people or property resulting from any ideas, methods, instructions or products referred to in the content. |
© 2026 by the authors. Licensee MDPI, Basel, Switzerland. This article is an open access article distributed under the terms and conditions of the Creative Commons Attribution (CC BY) license (http://creativecommons.org/licenses/by/4.0/).
Copyright: This open access article is published under a Creative Commons CC BY 4.0 license, which permit the free download, distribution, and reuse, provided that the author and preprint are cited in any reuse.


