
Submitted:
20 October 2025
Posted:
21 October 2025
You are already at the latest version
Abstract
Amplified Arctic warming has led to a pervasive decline in sea ice cover over recent decades, yet the pattern and governing mechanisms of sea-ice concentration (SIC) state transitions remain unclear. This study reveals a stepwise reduction in ice extent during 1979-1991, 1992-2006, and 2007-2024, with pronounced regional SIC contrasts in these transitions. September-mean sea ice in the 70°N-80°N Arctic belt undergoes sustained and significant retreat across three periods, while localized ice gains emerge north of Greenland. In February, the Greenland and Barents Seas exhibit persistent ice loss, whereas the central Arctic Ocean shows significant ice increases. Enhanced ice-albedo feedback, together with concurrent rises in 2-m air temperature and sea surface temperature, dominates ice loss across the 70°N-80°N Arctic belt and the Greenland and Barents Seas. Meanwhile, wind-driven ice convergence promotes localized ice gains north of Greenland in September and within the central Arctic Ocean in February, with both mechanisms amplified during 2007-2024. These findings underscore the spatial heterogeneity of Arctic SIC transitions and highlight the complex interplay of thermodynamic and dynamic processes shaping them.
Keywords:
arctic sea ice
; stepwise reduction
; spatial heterogeneity
; thermodynamic forcing
; dynamic convergence
1. Introduction
Arctic sea ice has undergone rapid and unprecedented decline in recent decades, with satellite and in-situ observations revealing a pronounced contraction of the ice cover [1,2,3], accompanied by pervasive thinning of sea ice [4,5,6,7]. These changes propagate through the Arctic climate system, altering atmospheric energy budgets, large-scale circulation and air-sea exchanges [8,9], ocean stratification and currents [10,11], as well as the marine ecosystem [12].
Arctic sea-ice extent (SIE) has followed a markedly non-stationary trajectory since the beginning of the satellite era. Between 2001 and 2007, the rate of retreat accelerated markedly relative to previous decades. In just two summers the September ice extent shrank by over a million square kilometres, plunging from an already low 2005 value to an unprecedented retreat in 2007 [13]. Five years later, the 2012 minimum shaved the footprint again, reaching an ice cover barely half the typical size of the 1990s [14]. A partial recovery occurred in 2013-2014, and subsequent summers have exhibited interannual variability confined to a low, narrow envelope that remains decisively separated from the pre-2007 steep decline [15].
Greenhouse gas emissions and the accompanying amplified rise in Arctic surface air temperature are the primary drivers of long-term ice loss [16,17], yet internal variability strongly modulate sea ice trends [18]. Atmospheric and oceanic processes dominate these modulations [19,20]. Anomalous large-scale circulation patterns, such as shifts in the position and intensity of cyclonic or anticyclonic centers, alter momentum and heat fluxes at the ice-ocean interface, thereby modulating both dynamic and thermodynamic ice changes [20,21,22,23,24,25]. Concurrently, anomalous poleward oceanic heat transport [26,27,28] and variability in upper-ocean stratification [15] exert a sustained influence on the sea ice cover.
Previous investigations have largely focused on the rapid summer decline of Arctic sea ice and its underlying causes. This study expands the perspective by examining how mean-state sea ice concentration (SIC) in September and February have changed through different periods, and by assessing the combined influence of atmospheric and oceanic conditions on these transitions. The paper is organized as follows. Section 2 provides an overview of the data used in the analysis. Section 3 characterizes the Arctic sea-ice state transition through a detailed examination of the spatiotemporal evolution of SIC. Section 4 explores the mechanisms driving these transitions by linking each period’s ice state to specific atmospheric and oceanic conditions. Section 4 presents the conclusions and discussion.
2. Data
The SIE and SIC data used in this study were obtained from the OSI-420, OSI-450-a and OSI-430-a products released by the Ocean and Sea Ice Satellite Application Facility (OSI-SAF) of the European Organisation for the Exploitation of Meteorological Satellites (EUMETSAT). These products are generated by merging multi-source passive microwave remote sensing data from the Scanning Multichannel Microwave Radiometer (SMMR), the Special Sensor Microwave Imager (SSM/I), and the Special Sensor Microwave Imager/Sounder (SSMIS), and by performing retrievals with the OSI-SAF algorithm [29,30]. Monthly mean SIC data on 25 km grid spacing for 1979-2024 are used here.
We used an enhanced monthly mean sea-ice motion vectors (ICDC-NSIDCv4.1) covering 1979-2023 on a 25 km Lambert-Azimuthal Equal Area Grid. This monthly mean data is derived from NSIDC-0116 [31] and provided in netCDF format (file version fv0.01) by the Integrated Climate Data Center (ICDC, University of Hamburg). This product integrates SMMR, SSM/I, SSMIS, the Advanced Very High Resolution Radiometer (AVHRR) and the Advanced Multichannel Scanning Radiometer Earth Observing System (AMSR-E) data, International Arctic Buoy Programme (IABP) velocity records, and NCEP/NCAR wind-derived ice-drift fields for the Arctic Ocean.
The diagnostic variables used in this study were sourced from the ERA5 global reanalysis [32] produced by the European Centre for Medium-Range Weather Forecasts (ECMWF) and distributed through the Copernicus Climate Change Service (C3S) Climate Data Store (CDS). Monthly mean fields from 1979 to 2024 were employed, including surface net shortwave radiation (SNSR), 2-m air temperature (T2m), sea surface temperature (SST), sea level pressure (SLP) and 10-m wind velocity.
3. Results
3.1. Pattern of Arctic Sea-Ice State Transitions
Under the pervasive influence of global warming, Arctic SIE has undergone sustained contraction, accompanied by pronounced regime shifts in sea ice state [15,33]. As shown in [15], the rate of summer ice extent decline slowed after 2007, with a weak, statistically insignificant trend during 2007-2021, in contrast to the much larger and significant negative trends during 1992-2006. Following [15], Figure 1 illustrates the temporal change of the September and February SIE from 1979 to 2024. During 1979-1991, September and February SIE decreased significantly from an elevated baseline at respective rates of -0.09×10⁶ km2 yr-1 and -0.05×10⁶ km2 yr-1, respectively. Regime shift to accelerated loss (-0.10×10⁶ km2 yr-1 in September and -0.07×10⁶ km2 yr-1 in February) characterized 1992-2006, after which the ice cover converged to a persistently low state devoid of statistically significant further decline during 2007-2004.
Transitions in Arctic sea-ice extent are evident during 1979-1991, 1992-2006 and 2007-2024, with a stepwise reduction persisting through all twelve months (Figure 2). Relative to the 1979-1991 baseline (blue), mean September extent contracted by 0.84×10⁶ km2 in 1992-2006 (orange) and by 2.55×10⁶ km2 in 2007-2024 (green), while the corresponding mean February reductions were 0.68×10⁶ km2 and 1.35×10⁶ km2, respectively. Accordingly, the spatial distribution of Arctic SIC state transitions across the three periods are investigated to determine whether the decline proceeds uniformly or exhibits regionally distinct trajectories.
The changes of Arctic SIC exhibits pronounced regional heterogeneity across the three periods (Figure 3). Inter-period differences in SIC significant at the 95% confidence level, as identified by a two-sample t-test, are denoted by black hatching in Figure 3. From the first to second period, the Chukchi and Beaufort seas experience significant SIC reduction (Figure 3b), extented to the third period, the zone of significant decline encompasses the entire 70°N-80°N circumpolar belt (Figure 3c). Within this Arctic belt (70°N-80°N, 180°W-180°E), the September-mean SIC falls from 0.36 in 1979-1991 to 0.13 in 2007-2024, yielding a period anomaly of -0.23. Conversely, north of Greenland (80°N-90°N, 310°E-360°E) exhibits a modest yet statistically significant increase in September-mean SIC, rising from 0.84 in 1979-1991 to 0.88 in 2007-2024 and producing a positive anomalies of 0.04.
Significant negative February-mean SIC anomalies emerge in the Greenland Sea (70°N-76°N, 10° W-0°) from the first to second period (Figure 3e). This signal intensifies and expands so that, by the third period, the domain of significant decline spans both the Barents Sea (70°N-80°N, 35°E-60°E) and the Greenland Sea (Figure 3f). Regionally, February-mean SIC in the Barents Sea drops from 0.55 in 1979-1991 to 0.26 in 2007-2024, producing a period anomaly of -0.29, while the Greenland Sea counterpart falls from 0.25 to 0.02, yielding an anomaly of -0.23. By contrast, the central Arctic Ocean (north of 84°N) exhibits sustained positive SIC anomalies, with area-averaged concentration rising from 0.95 in 1979-1991 to 0.99 in 2007-2024, equivalent to a 0.04 anomaly.
The stepwise contraction of Arctic sea-ice extent across the three periods is tightly connected to intensified melt within (i) the 70°N-80°N Arctic belt in September and (ii) the Barents and Greenland seas in February, with the most pronounced SIC retreat occurring during 2007-2024. The physical mechanisms responsible for the different regional changes in September and February SIC are examined in the following section.
3.2. Mechanisms of Sea-Ice Concentration State Transitions
The potential mechanisms behind sea-ice concentration state transitions during 1979-2024 are examined here. Mean September and February SNSR differences across three periods in Figure 4 are consistent with the SIC changes. Relative to 1979-1991 (Figure 4a), the increases of September-mean SNSR expand from the Chukchi and Beaufort seas in 1992-2006 to the 70°N-80°N Arctic belt in 2007-2024 (Figure 4b, c), which is consistent with the corresponding SIC decrease (Figure 3b, c). The 2007-2024 interval exhibits a poleward expansion and pronounced intensification of both SNSR enhancement and SIC decline relative to 1992-2006. The pervasive retreat of sea ice strengthens ice-albedo feedback through systematic lowering of surface albedo, which enhances net shortwave absorption and thereby accelerates ice melt [34].
To quantify the SNSR imprint on SIC, we performed regional averaging for the previously defined SIC change domains for each period. Within the 70°N-80°N Arctic belt, monthly mean SNSR from May to September exhibit consistent rises in the subsequent two periods (Figure 5a). September SNSR averages increase from 5.20 W m-2 in 1979-1991 to 5.54 W m-2 in 1992-2006 and 6.06 W m-2 in 2007-2024, translating to incremental gains of 0.34 W m-2 and 0.86 W m-2, respectively. This acceleration is consistent with the intensified SIC retreat between the second and third periods (Figure 3b, c). Meanwhile, June and July SNSR climbed by 0.70 W m-2 in 1992-2006 and 1.84 W m-2 in 2007-2024 relative to 1979-1991. This radiative surplus is stored within the ocean-ice column and exerts a delayed influence. Consequently, the amplified June and July forcing preconditions thinner, more fragmented ice that fosters the pronounced September SIC decline recorded in the subsequent two periods.
In the northern sector of Greenland, the average September SNSR decreased slightly in the subsequent two periods (Figure 4b, c), corresponding to the increase of SIC in this region (Figure 3b, c). September-mean SNSR north of Greenland drop marginally from 1.51 W m-2 to 1.46 W m-2 and 1.41 W m-2 across three periods, paralleling the modest SIC increase. The largest radiative deficit occurs in June, where SNSR falls by 0.27 W m-2 and 1.33 W m-2 relative to the first period. This early-summer SNSR decrease could precondition a thicker, more resilient ice cover, thereby reinforcing the September SIE.
It is noteworthy that the increase in SNSR in the 70°N-80°N Arctic belt in September was much larger than the decrease north of Greenland, which is also consistent with the pattern shown in Figure 3b and Figure 3c, where SIC decreased substantially across most of the Arctic, with only slight increases north of Greenland. Despite pronounced spatial heterogeneity, the pan-Arctic SNSR is dominated by positive anomalies that systematically outpace localized declines, mirroring an asymmetric sea ice change in which retreats exceed advances. Consequently, sea ice across most of the Arctic gradually melts under enhanced ice-albedo feedback, leading to a significant reduction in the mean SIE across three periods.
February-mean SNSR increases slightly from 0.26 W m-2 through 0.29 W m-2 to 0.33 W m-2 in the Barents Sea and the from 0.81 W m-2 to 0.92 W m-2 and then to 0.99 W m-2 in Greenland Sea across three periods (Figure 4e, f). These modest positive anomalies align with the contemporaneous SIC retreat, yet their amplitude is much smaller than the September signal (Figure 6a,b). The central Arctic Ocean experiences polar night and changes in SNSR in this region are negligible and cannot account for the modest yet significant SIC increase there. Consequently, the changes of winter sea ice concentraion must be interrogated through additional drivers, as discussed below.
To assess the influences of surface temprature on SIC changes, September and February mean T2m (Figure 7) and SST (Figure 8) during 1979-1991, along with differences in 1992-2006 and 2007-2024 relative to 1979-1991 are displayed respectively. September-mean T2m and SST exhibit significant warming in the latter two periods, and the anomalies intensify and expand in the 70°N-80°N Arctic belt from 1992-2006 to 2007-2024 (Figure 7b, c and Figure 8b, c). Monthly variations in T2m and SST confirm pronounced August-September increases in the latter two periods (Figure 5c, e). Relative to 1979-1991, September-mean T2m in the 70°N-80°N Arctic belt rises by 0.61 °C and 2.29 °C, while SST increases by 0.30 °C and 1.45 °C in 1992-2006 and 2007-2024, respectively. Amplified September thermal anomalies coincide with a much larger SIC decline in 2007-2024 relative to 1992-2006. In the northern sector of Greenland, the September-mean T2m (Figure 7b, c, and Figure 5d) and SST (Figure 8b, c and Figure 5f) changes across three periods are not significant. The observed September SIC increase north of Greenland is not linked to variations in T2m or SST.
In February, both T2m and SST exhibit significant warming in the Barents and Greenland seas during the latter two periods, and the anomalies intensify from the second to the third period (Figure 7e, f and Figure 8e, f). Monthly variations in T2m (Figure 6d, e) and SST (Figure 6g, h) confirm pronounced December-March increases in the latter two periods. Relative to 1979-1991, February-mean Barents Sea changes in 1992-2006 and 2007-2024 are 0.70 °C and 5.56 °C for T2m, and 0.23 °C and 0.78 °C for SST, respectively, while the corresponding Greenland Sea changes are 0.58 °C and 2.02 °C for T2m, and 0.41 °C and 1.05 °C for SST. Amplified February surface warming in 2007-2024 relative to 1992-2006 coincide with a much larger SIC decline in the Barents and Greenland seas during the same period.
In the central Arctic Ocean, February-mean T2m exhibits a -1.47 °C anomaly in 1992-2006 and a 1.91 °C increase in 2007-2024 relative to 1979-1991 (Figure 7e, f and Figure 6f). The cooling in 1992-2006 aligns with increased February SIC in this region, but this relationship breaks down in the third period. Meanwhile, February-mean cooling of SST is not significant in both periods (Figure 8e, f and Figure 6i). These thermal perturbations are insufficient to explain the observed February SIC increase in the central Arctic Ocean especially in 2007-2024.
In general, concurrent intensification of SNSR, T2m and SST exerts a synergistic control on the SIC decline in the 70°N-80°N Arctic belt in September and the Barents and Greenland Seas in February. All surface-energy anomalies strengthen from 1992-2006 to 2007-2024, coinciding with the most pronounced SIC decline in the latter period. In contrast, the September SIC gain north of Greenland and the February SIC increase in the central Arctic Ocean cannot be reconciled with the weak, and sometimes opposite, thermal perturbations, implicating dynamical processes (e.g., wind-driven ice convergence) beyond local surface temperature changes.
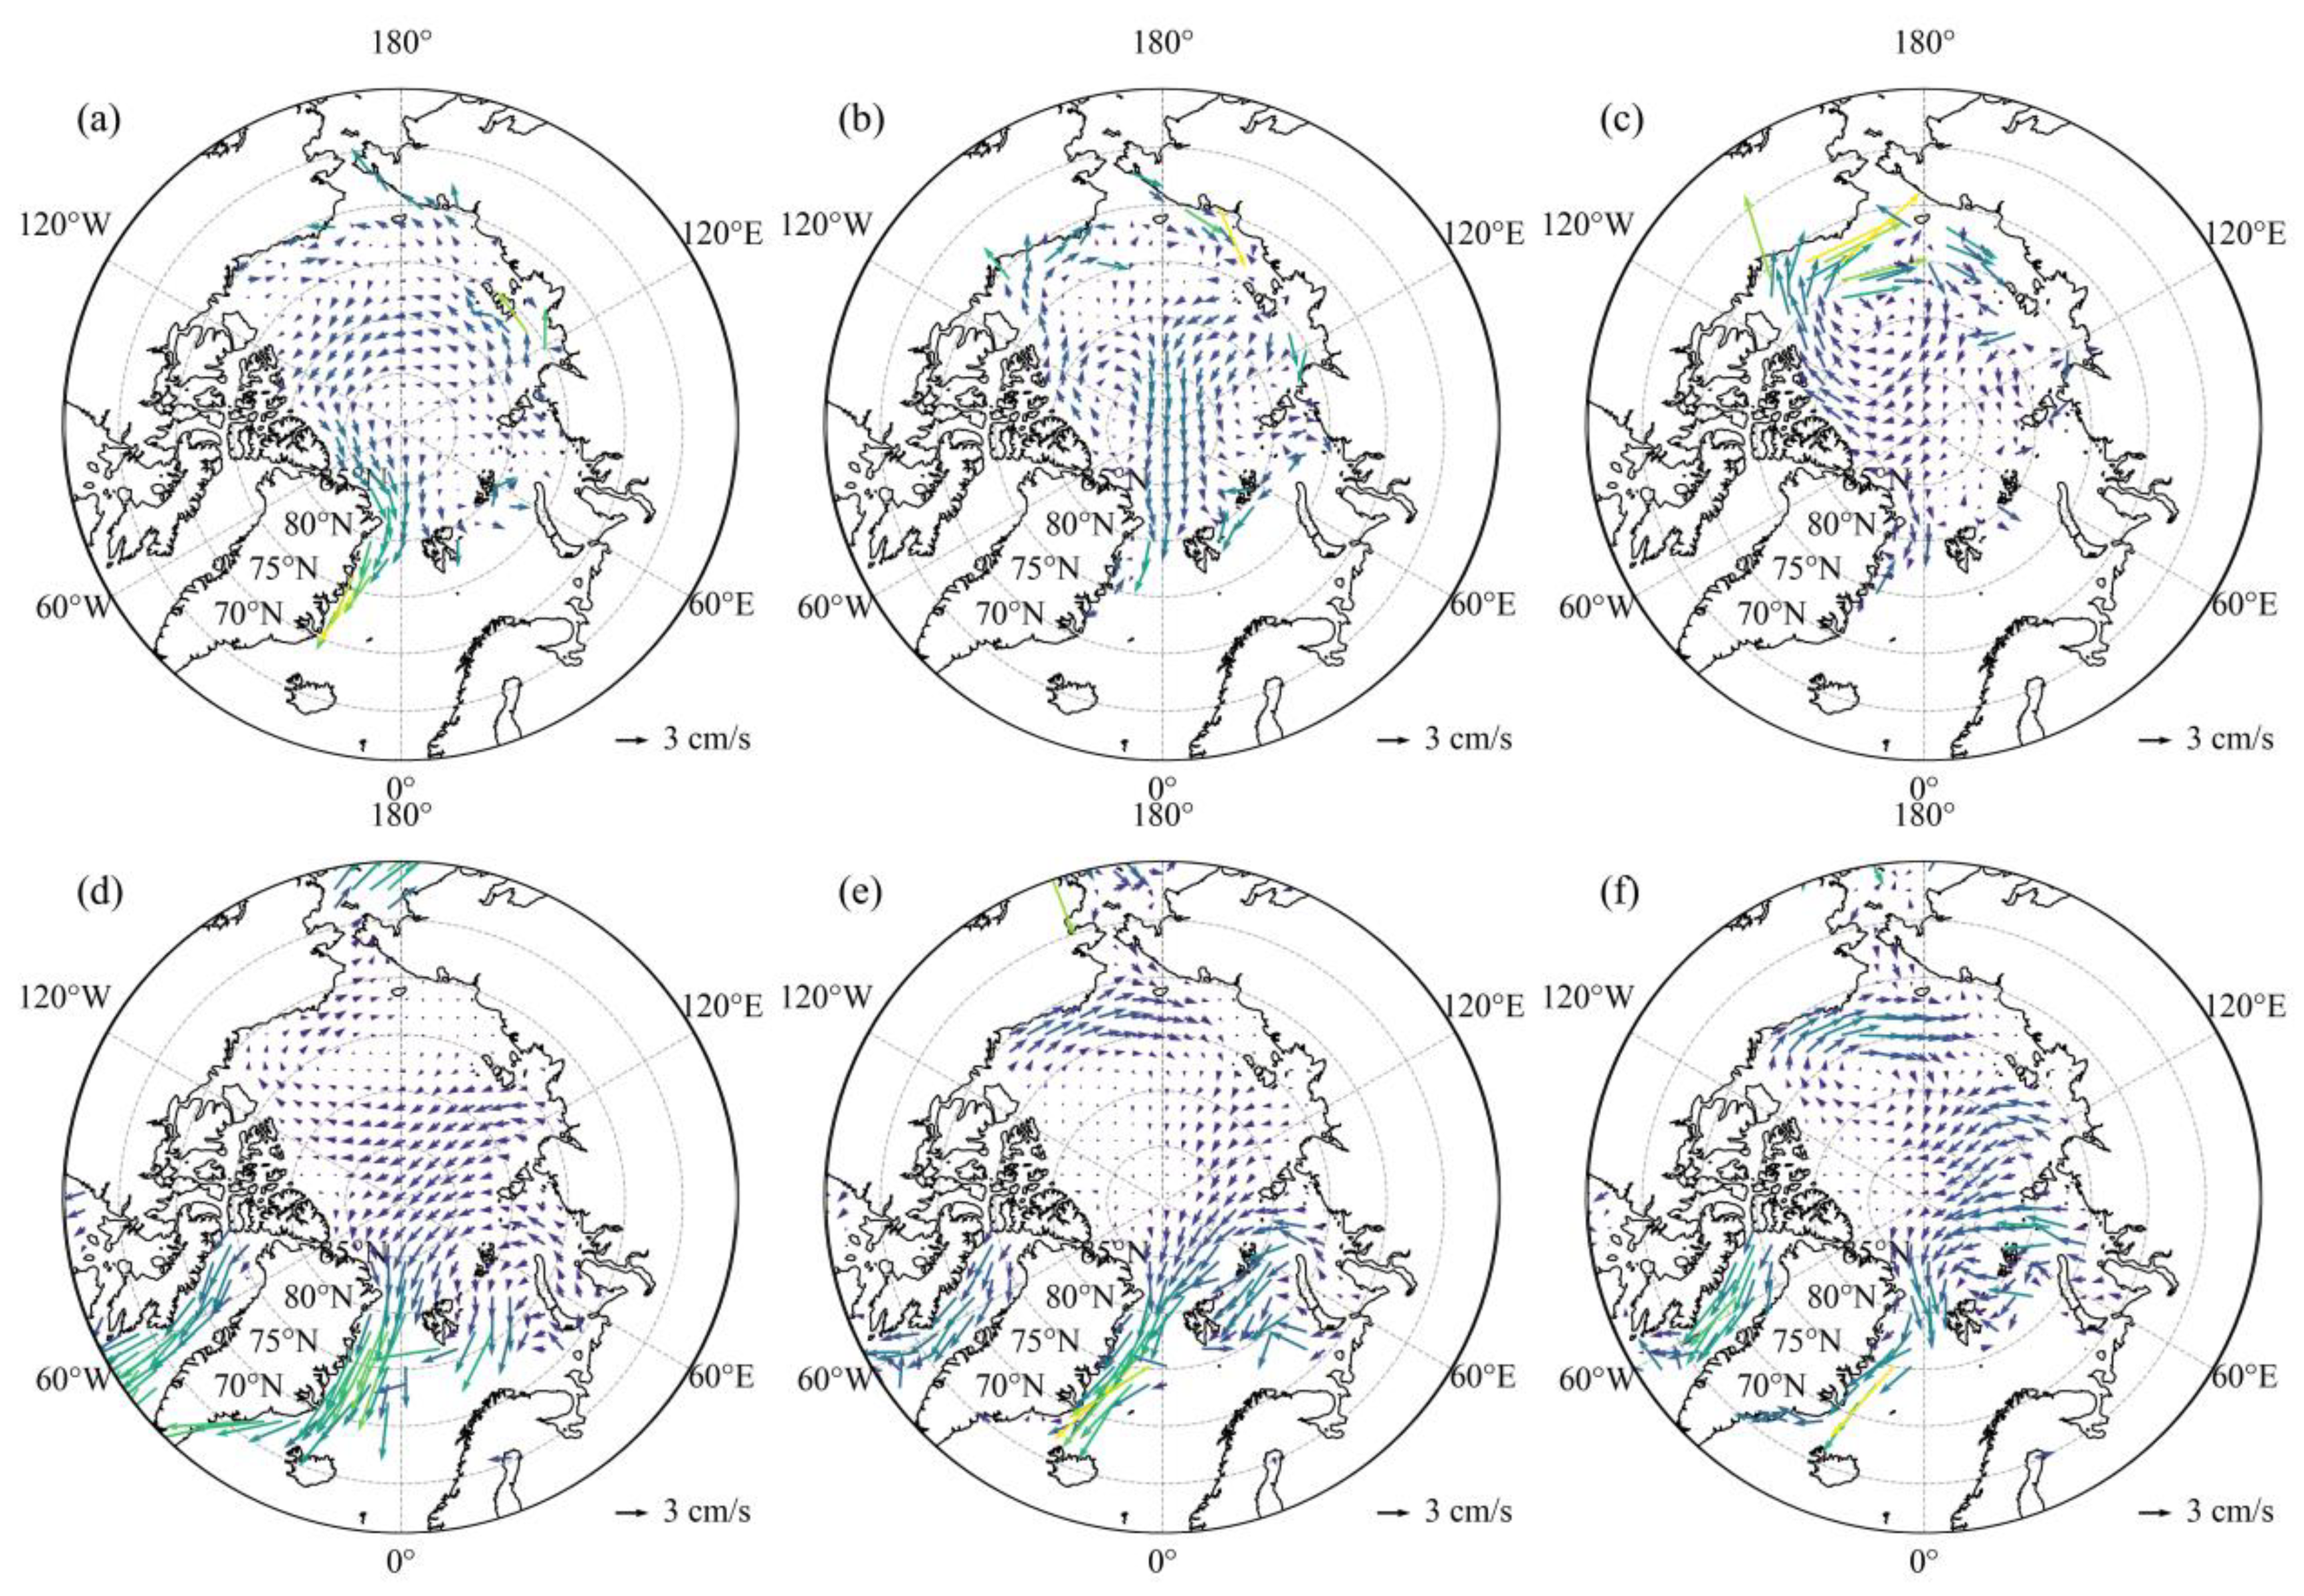
September and February mean SLP and 10-m wind vectors (Figure 9) together with satellite-derived sea-ice drift (Figure 10) reveal that the high-pressure anomaly established over the central Arctic after 1991 modulates sea ice advance in both seasons. In September, the SLP rise and wind convergence towards north of Greenland in 1992-2006 and 2007-2024 (Figure 9b,c) enhances the wind-driven sea ice convergence (Figure 10b,c) and raises September SIC there relative to 1979-1991. In February, an anomalous SLP increase over the Arctic Ocean (Figure 9e) intensifies basin-scale anticyclonic circulation, driving wind-driven ice convergence into the central Arctic Ocean (Figure 10e) and producing a corresponding SIC increase. As the high-pressure centre migrates north of Russia, both convergence and SIC are further amplified in 2007-2024 (Figure 9f and Figure 10f).
4. Conclusions and Discussion
Arctic SIE has shifted from gradual retreat during 1979-1991 to accelerated loss in 1992-2006, and subsequently stabilized at a persistently low level after 2007. A stepwise reduction in ice extent characterizes the three periods, each transition exhibiting pronounced regional heterogeneity in the magnitude and pattern of SIC change. This study quantifies the spatial distribution of the mean-state SIC in September and February across the three periods and investigates the physical mechanisms driving these transitions by synergistically analyzing SNSR, T2m, SST, SLP, 10-m wind fields and sea ice drift. The main findings are summarized below.
- The stepwise contraction of Arctic SIE across 1979-1991, 1992-2006 and 2007-2024 is primarily attributable to intensified melt within the 70°N-80°N Arctic belt in September and within the Barents and the Greenland seas in February, with the most pronounced SIC reductions occurring during 2007-2024. Over the same intervals, the September SIC north of Greenland and February SIC in the central Arctic Ocean exhibit a modest yet statistically significant increase.
- Concurrent increases in SNSR, T2m, and SST prevail across the 70°N-80°N Arctic belt in summer and Barents and Greenland seas in winter across three periods, with accelerations most pronounced in 2007-2024. These synchronized surface-energy anomalies drive the observed stepwise SIC retreat, culminating in the record ice losses of 2007-2024.
- The SIC increase north of Greenland and in the central Arctic Ocean is inconsistent with weak or opposing thermal anomalies, implicating dynamical drivers. High-pressure anomaly over the central Arctic in 1992-2006 and 2007-2024 intensifies anticyclonic circulation, driving wind-driven ice convergence into these regions and sustaining the observed SIC increase. As the high-pressure centre migrates north of Russia, both convergence and SIC are further amplified in the central Arctic Ocean in 2007-2024.
Arctic sea ice change is not simply a linear response to external forcing but is modulated by complicated internal variability. Our study reveals marked regional heterogeneity in mean-state SIC changes across three periods, with enhanced ice-albedo feedback and surface temperature dominating the basin-wide decline, while localized increases coincide with wind-induced ice convergence. This study focuses on the mean-state SIC changes across three periods, while the divergent rates of change are not addressed here and will be investigated further. Since 2007, pan-Arctic ice extent has remained at a persistently low level without significant reduction, implying a quasi-equilibrium state maintained by the compensating effects of internal variability and regional feedback processes [33,35]. Quantifying the mechanisms that sustain this low state and disentangling the relative contributions of atmospheric versus oceanic drivers remain essential steps toward refined projections of future Arctic sea ice change.
Author Contributions
Conceptualization, X.L.; methodology, X.L., M.J., X.W., J.W.; software, X.L., Y.Z., W.L., J.H., X.G., Z.L.; validation, X.L., Y.Z., W.L., J.H., X.G.; formal analysis, X.L., Y.Z., W.L., J.H., X.G.; investigation, X.L., Y.Z., W.L., J.H., X.G.; resources, X.L.; data curation, X.L., Y.Z., W.L., J.H., X.G.; writing—original draft preparation, X.L., Y.Z., W.L., J.H., X.G., Z.L.; writing—review and editing, X.L., M.J., X.W., J.W.; visualization, X.L., Y.Z., W.L., J.H., X.G.; supervision, X.L.; project administration, X.L.; funding acquisition, X.L. All authors have read and agreed to the published version of the manuscript.
Funding
This research was funded by the Startup Foundation for Introducing Talent of Nanjing University of Information Science and Technology, grant number 2024r005. Jianfei Wei is supported by the Natural Science Foundation of the Jiangsu Higher Education Institutions of China, grant number 23KJB170024 and the Talent Start-up Fund of Wuxi University, grant number 2023r038.
Data Availability Statement
The OSI-SAF SIE and SIC data could be downloaded at https://osi-saf.eumetsat.int/products/sea-ice-products accessed on 17 Octorber 2025. The ICDC-NSIDCv4.1 sea-ice motion vectors could be found at https://www.cen.uni-hamburg.de/icdc accessed on 17 Octorber 2025. The ERA5 data are available at https://cds.climate.copernicus.eu accessed on 17 Octorber 2025.
Acknowledgments
Thanks to EUMETSAT OSI-SAF for providing satellite-derived SIE and SIC data, the ICDC/CEN, University of Hamburg for sea ice drift data support and the ECMWF for providing ERA5 reanalysis data.
Conflicts of Interest
The authors declare no conflicts of interest.
References
- Stroeve, J. C.; Serreze, M. C.; Holland, M. M.; Kay, J. E.; Malanik, J.; Barrett, A. P. The Arctic’s rapidly shrinking sea ice cover: a research synthesis. Clim. change 2012, 110, 1005-1027. [CrossRef]
- Cavalieri, D. J.; Parkinson, C. L. Arctic sea ice variability and trends, 1979-2010. Cryosphere 2012, 6(4), 881-889. [CrossRef]
- Meier, W. N.; Stroeve, J. An updated assessment of the changing Arctic sea ice cover. Oceanography 2022, 35(3/4), 10-19. [CrossRef]
- Maslanik, J. A.; Fowler, C.; Stroeve, J.; Drobot, S.; Zwally, J.; Yi, D.; Emery, W. A younger, thinner Arctic ice cover: Increased potential for rapid, extensive sea-ice loss. Geophys. Res. Lett. 2007, 34(24). [CrossRef]
- Lei R.; Xie H.; Wang J.; et al. Changes in sea ice conditions along the Arctic Northeast Passage from 1979 to 2012. Cold Reg. Sci. Technol. 2015, 119, 132-144. [CrossRef]
- Kwok, R. Arctic sea ice thickness, volume, and multiyear ice coverage: losses and coupled variability (1958-2018). Environ. Res. Lett. 2018, 13(10), 105005. [CrossRef]
- Sumata, H.; de Steur, L.; Divine, D.V.; Granskog, M. A.; Gerland, S. Regime shift in Arctic Ocean sea ice thickness. Nature 2023, 615, 443-449. [CrossRef]
- Krikken, F.; Hazeleger, W. Arctic energy budget in relation to sea ice variability on monthly-to-annual time scales. J. Climate 2015, 28(16), 6335-6350. [CrossRef]
- Smith, D. M.; Dunstone, N. J.; Scaife, A. A.; Fiedler, E. K.; Copsey, D.; Hardiman, S. C. Atmospheric response to Arctic and Antarctic sea ice: The importance of ocean–atmosphere coupling and the background state. J. Climate 2017, 30(12), 4547-4565. [CrossRef]
- Sévellec, F.; Fedorov, A. V.; Liu, W. Arctic sea-ice decline weakens the Atlantic meridional overturning circulation. Nat. Clim. Change 2017, 7(8), 604-610. [CrossRef]
- Meneghello, G.; Marshall, J.; Timmermans, M. L.; Scott, J. Observations of seasonal upwelling and downwelling in the Beaufort Sea mediated by sea ice. J. Phys. Oceanogr. 2018, 48(4), 795-805. [CrossRef]
- Qi, D.; Ouyang, Z.; Chen, L.; et al. Climate change drives rapid decadal acidification in the Arctic Ocean from 1994 to 2020. Science 2022, 377(6614), 1544-1550. [CrossRef]
- Stroeve, J.; Serreze, M.; Drobot, S.; et al. Arctic Sea Ice Extent Plummets in 2007. Eos Trans. AGU 2008, 89(2), 13–14. [CrossRef]
- Holland, M. The great sea-ice dwindle. Nat. Geosci. 2013, 6(1), 10-11. [CrossRef]
- Polyakov, I. V.; Ingvaldsen, R. B.; Pnyushkov, A. V.; et al. Fluctuating Atlantic inflows modulate Arctic atlantification. Science 2023, 381(6661), 972-979. [CrossRef]
- Kay, J. E.; Holland, M. M.; Jahn, A. Inter-annual to multi-decadal Arctic sea ice extent trends in a warming world. Geophys. Res. Lett. 2011, 38(15). [CrossRef]
- Notz, D.; Stroeve, J. Observed Arctic sea-ice loss directly follows anthropogenic CO2 emission. Science 2016, 354(6313), 747-750. [CrossRef]
- Swart, N. C.; Fyfe, J. C.; Hawkins, E.; Kay, J. E.; Jahn, A. Influence of internal variability on Arctic sea-ice trends. Nat. Clim. Change 2015, 5(2), 86-89. [CrossRef]
- Carmack, E.; Polyakov, I.; Padman, L.; et al. Toward quantifying the increasing role of oceanic heat in sea ice loss in the new Arctic. Bull. Amer. Meteor. Soc. 2015, 96(12), 2079-2105. [CrossRef]
- Ding, Q.; Schweiger, A.; L’Heureux, M.; et al. Influence of high-latitude atmospheric circulation changes on summertime Arctic sea ice. Nat. Clim. Change 2017, 7(4), 289-295. [CrossRef]
- Ding, Q.; Schweiger, A.; Baxter, I. Nudging observed winds in the Arctic to quantify associated sea ice loss from 1979 to 2020. J. Climate 2022, 35(20), 6797-6813. [CrossRef]
- Francis, J. A.; Wu, B. Why has no new record-minimum Arctic sea-ice extent occurred since September 2012? Environ. Res. Lett. 2020, 15(11), 114034. [CrossRef]
- Baxter, I.; Ding, Q. An optimal atmospheric circulation mode in the Arctic favoring strong summertime sea ice melting and ice–albedo feedback. J. Climate 2022, 35(20), 6627-6645. [CrossRef]
- Liang, X.; Li, X.; Bi, H.; et al. A comparison of factors that led to the extreme sea ice minima in the twenty-first century in the Arctic Ocean. J. Climate 2022, 35(4), 1249-1265. [CrossRef]
- Zhang, F.; Lei, R.; Zhai, M.; et al. The impacts of anomalies in atmospheric circulations on Arctic sea ice outflow and sea ice conditions in the Barents and Greenland seas: case study in 2020. Cryosphere 2023, 17(11), 4609-4628. [CrossRef]
- Årthun, M.; Eldevik, T.; Smedsrud, L. H.; Skagseth, Ø.; Ingvaldsen, R. B. Quantifying the influence of Atlantic heat on Barents Sea ice variability and retreat. J. Climate 2012, 25(13), 4736-4743. [CrossRef]
- Auclair, G.; Tremblay, L. B. The role of ocean heat transport in rapid sea ice declines in the Community Earth System Model Large Ensemble. J. Geophys. Res. Oceans 2018, 123(12), 8941-8957. [CrossRef]
- Docquier, D.; Koenigk, T. A review of interactions between ocean heat transport and Arctic sea ice. Environ. Res. Lett. 2021, 16(12), 123002. [CrossRef]
- Lavergne, T.; Sørensen, A. M.; Kern, S.; et al. Version 2 of the EUMETSAT OSI SAF and ESA CCI Sea-Ice Concentration Climate Data Records. Cryosphere 2019, 13, 49–78. [CrossRef]
- Lavergne, T.; Sørensen, A. M.; Tonboe, R.; et al. Global Sea Ice Concentration Climate Data Records, Algorithm Theoretical Basis Document. EUMETSAT OSI SAF: Oslo, Norway, 2022.
- Tschudi, M.; W. N. Meier; J. S. Stewart; C. Fowler; J. Maslanik. Polar Pathfinder Daily 25 km EASE-Grid Sea Ice Motion Vectors, Version 4.1. Boulder, Colorado USA, 2024. NASA National Snow and Ice Data Center Distributed Active Archive Center. Available online: https://nsidc.org/data/nsidc-0116; (accessed on 17 October, 2025). [CrossRef]
- Hersbach, H.; Bell, B.; Berrisford, P. et al. The ERA5 global reanalysis. Quarterly journal of the royal meteorological society 2020, 146(730), 1999-2049. [CrossRef]
- Stern, H. L. Regime shift in Arctic Ocean sea-ice extent. Geophys. Res. Lett. 2025, 52(8), e2024GL114546. [CrossRef]
- Stroeve, J. C.; Notz, D. Changing state of Arctic sea ice across all seasons. Environ. Res. Lett. 2018, 13(10), 103001. [CrossRef]
- England, M. R.; Polvani, L. M.; Screen, J.; Chan, A. C. Minimal Arctic sea ice loss in the last 20 years, consistent with internal climate variability. Geophys. Res. Lett. 2025, 52(15), e2025GL116175. [CrossRef]
Figure 1.
Changes of Arctic sea ice extent (SIE, 106 km2) in September (a) and February (b) from 1979 to 2024. The grey dashed lines show the trends of SIE during 1979-1991, 1992-2006 and 2007-2024.
Figure 1.
Changes of Arctic sea ice extent (SIE, 106 km2) in September (a) and February (b) from 1979 to 2024. The grey dashed lines show the trends of SIE during 1979-1991, 1992-2006 and 2007-2024.
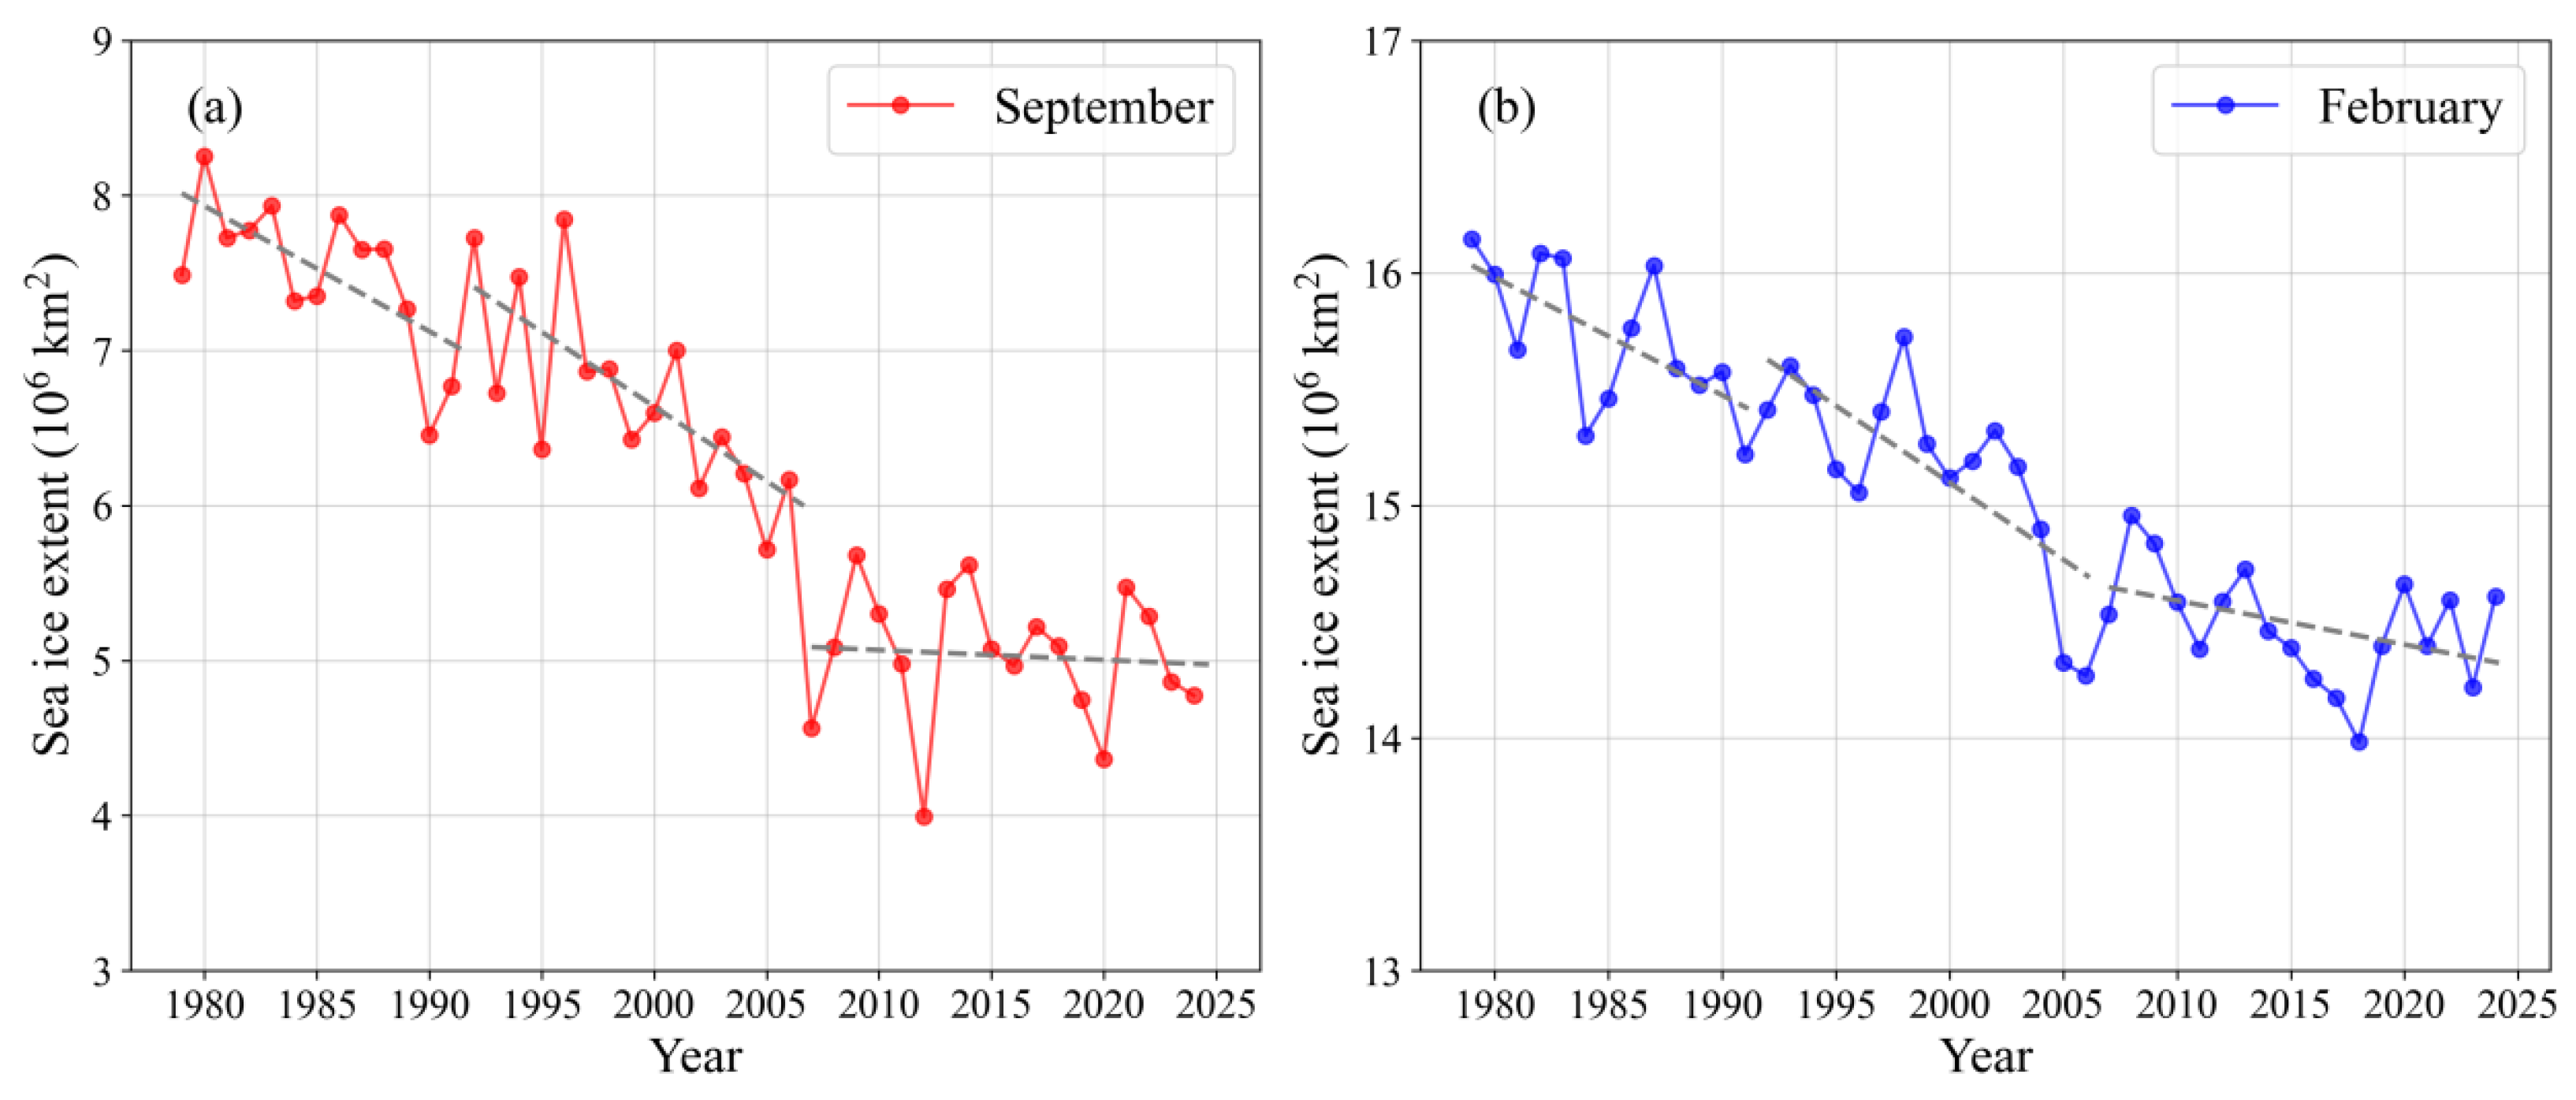
Figure 2.
1979-1991, 1992-2006 and 2007-2024 monthly mean Arctic SIE (106 km2).
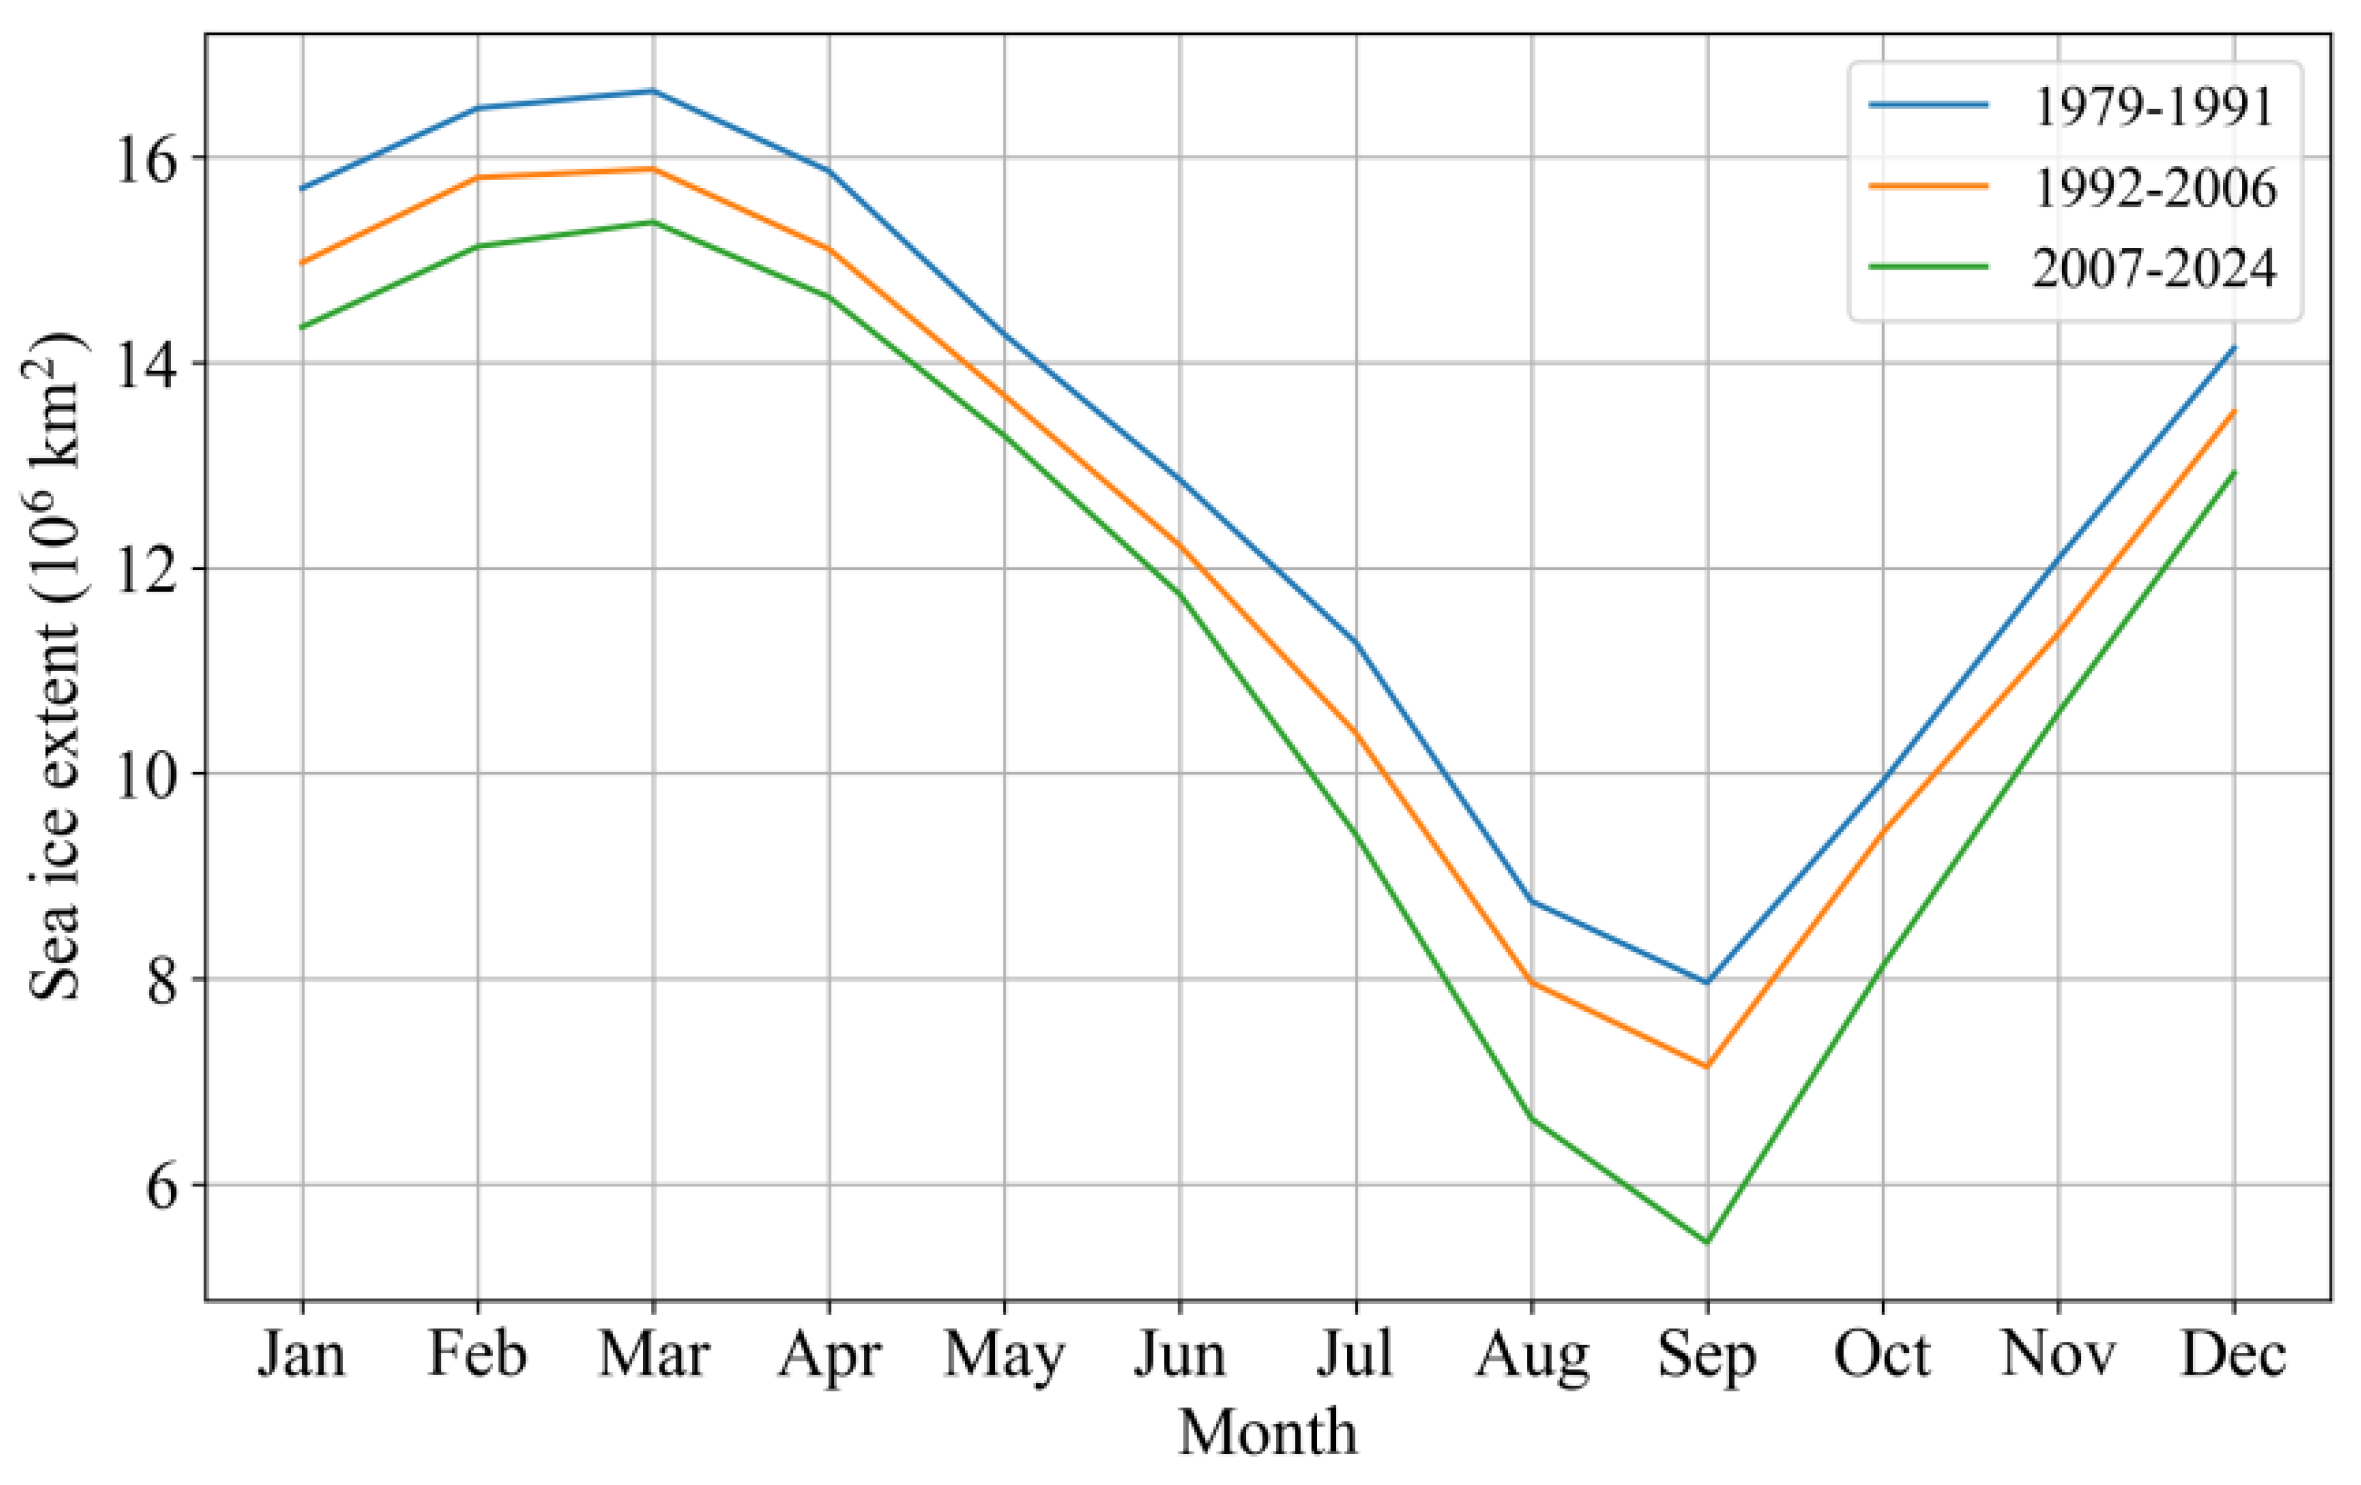
Figure 3.
Mean September Arctic sea-ice concentration (SIC, %) for 1979-1991 (a), SIC differences for 1992-2006 (b) and 2007-2024 (c) relative to 1979-1991. The second row presents the same information for February (d-f). Black hatching denotes grid cells where the difference is significant at the 95% confidence level.
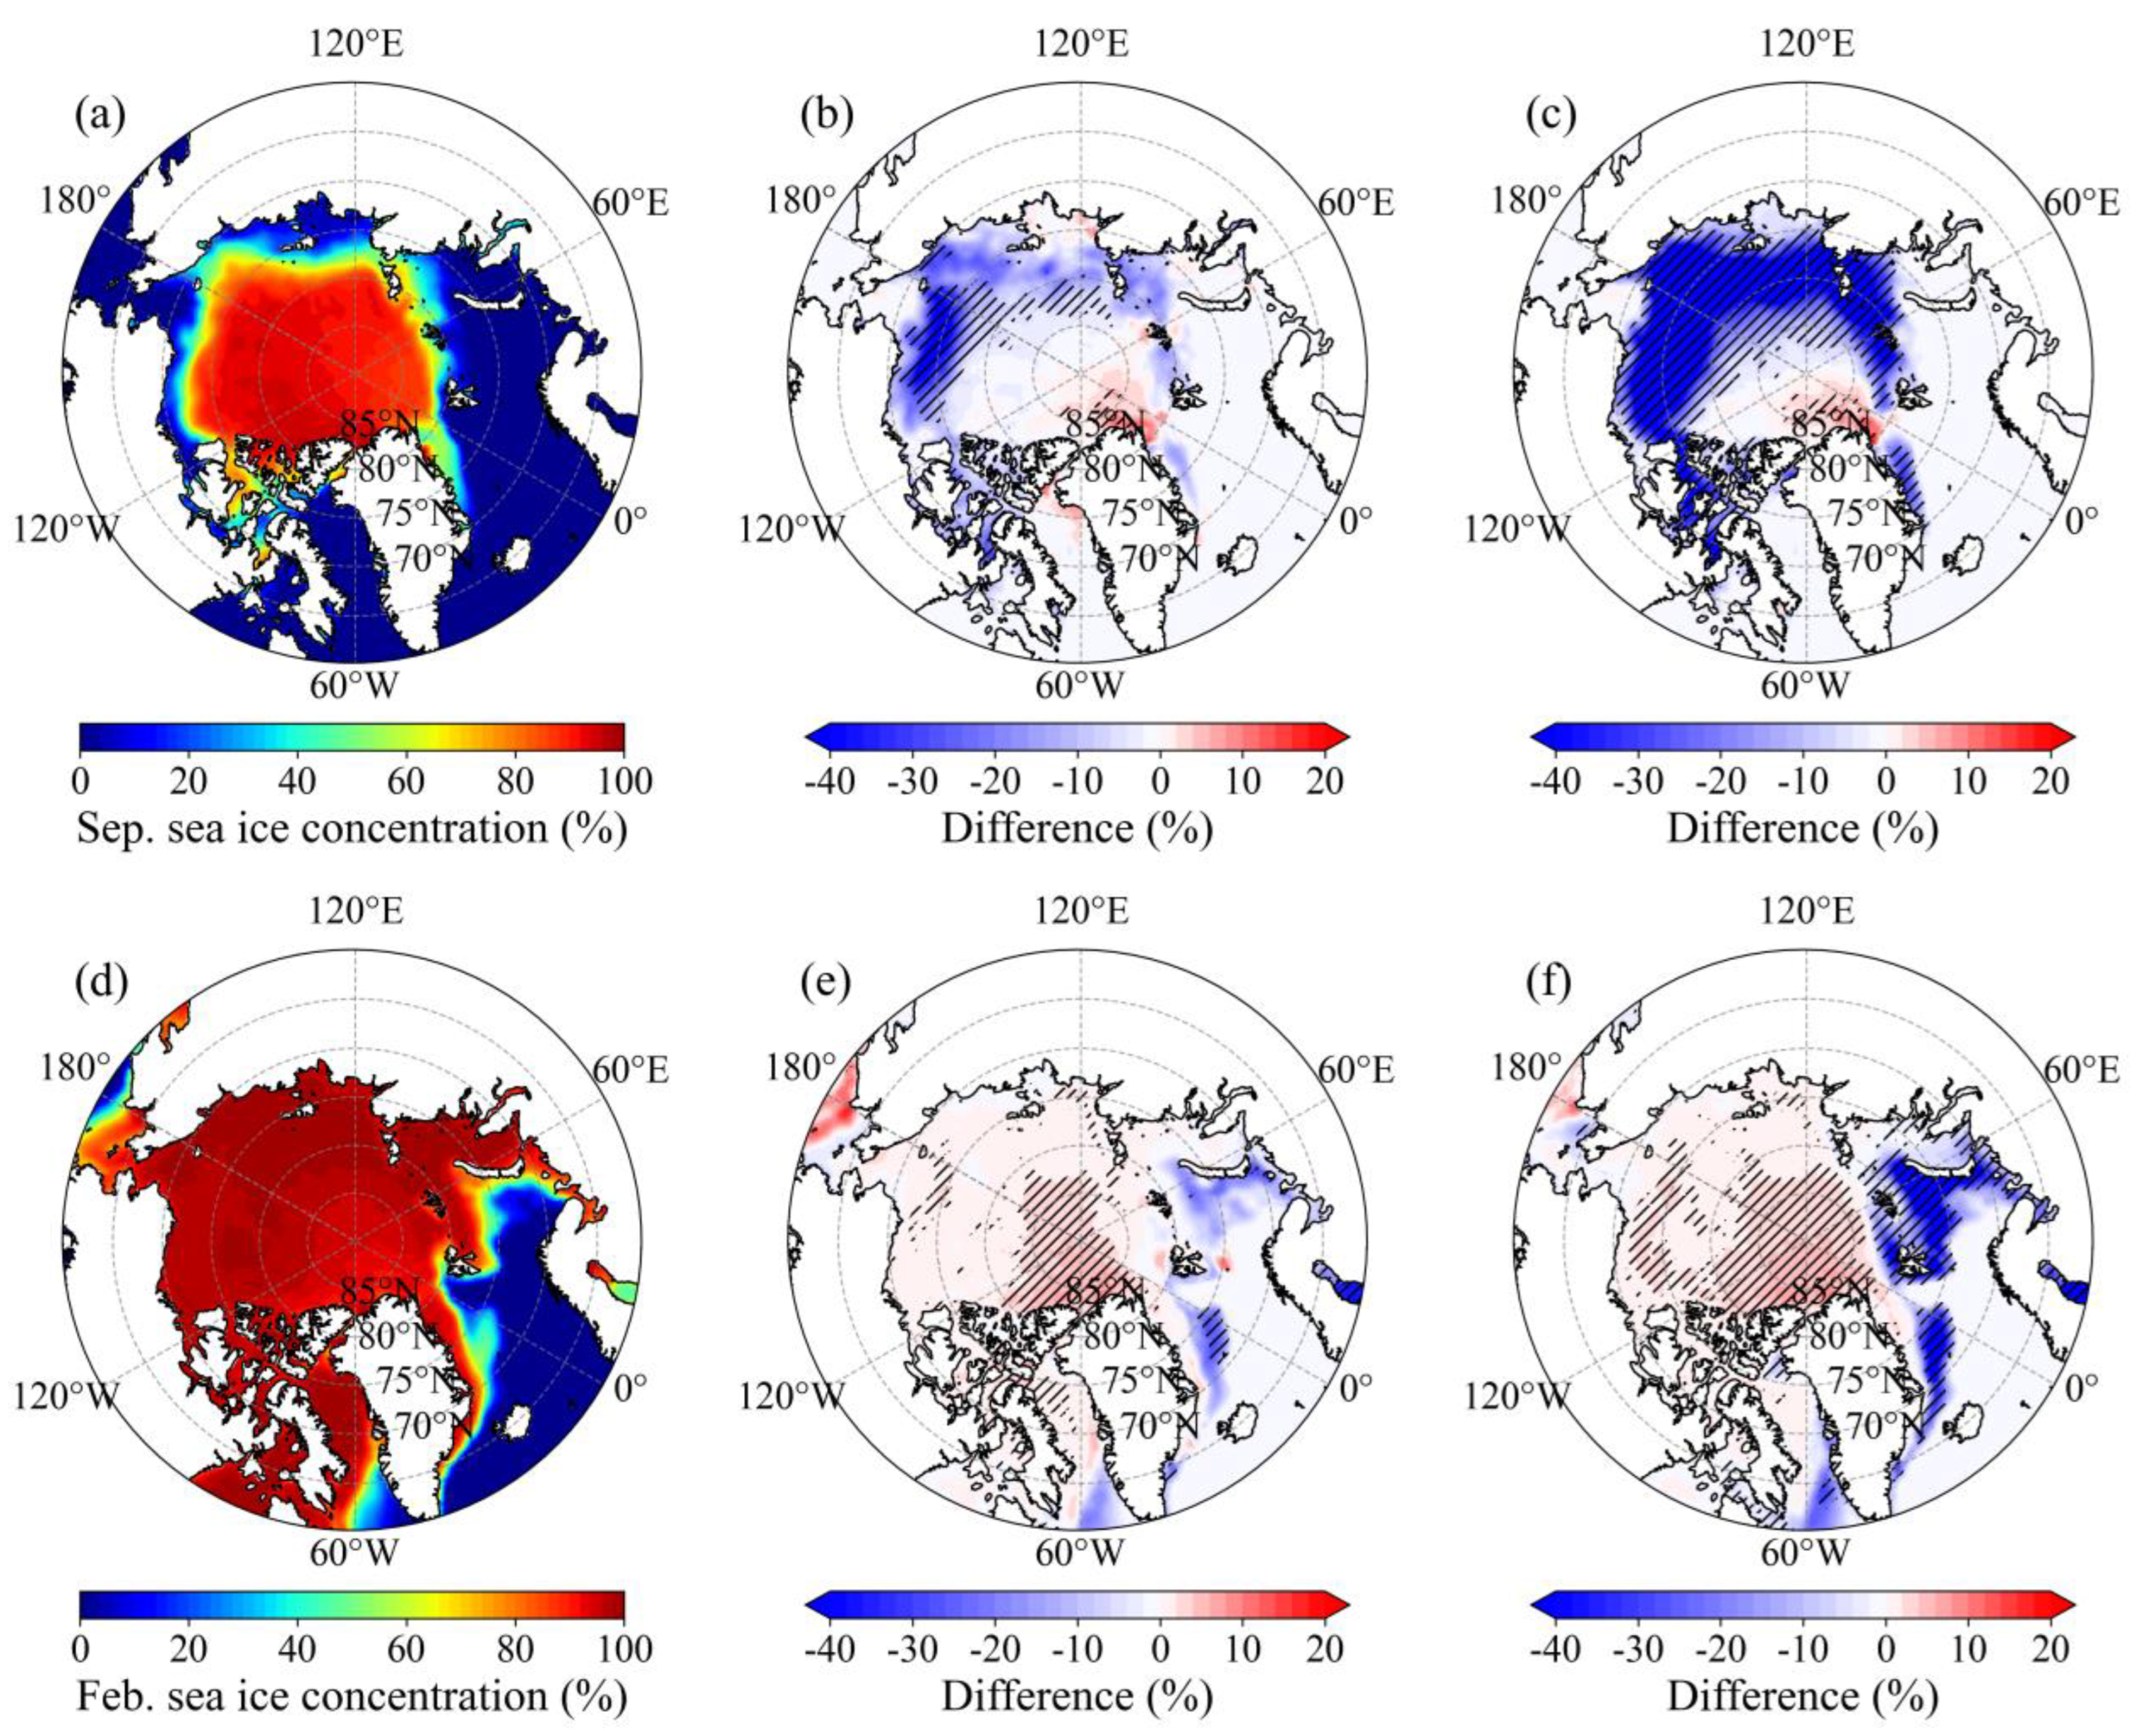
Figure 4.
Mean September surface net shortwave radiation (SNSR, W m-2) for 1979-1991 (a), SNSR differences for 1992-2006 (b) and 2007-2024 (c) relative to 1979-1991. The second row presents the same information for February (d-f). Black hatching denotes grid cells where the difference is significant at the 95% confidence level.
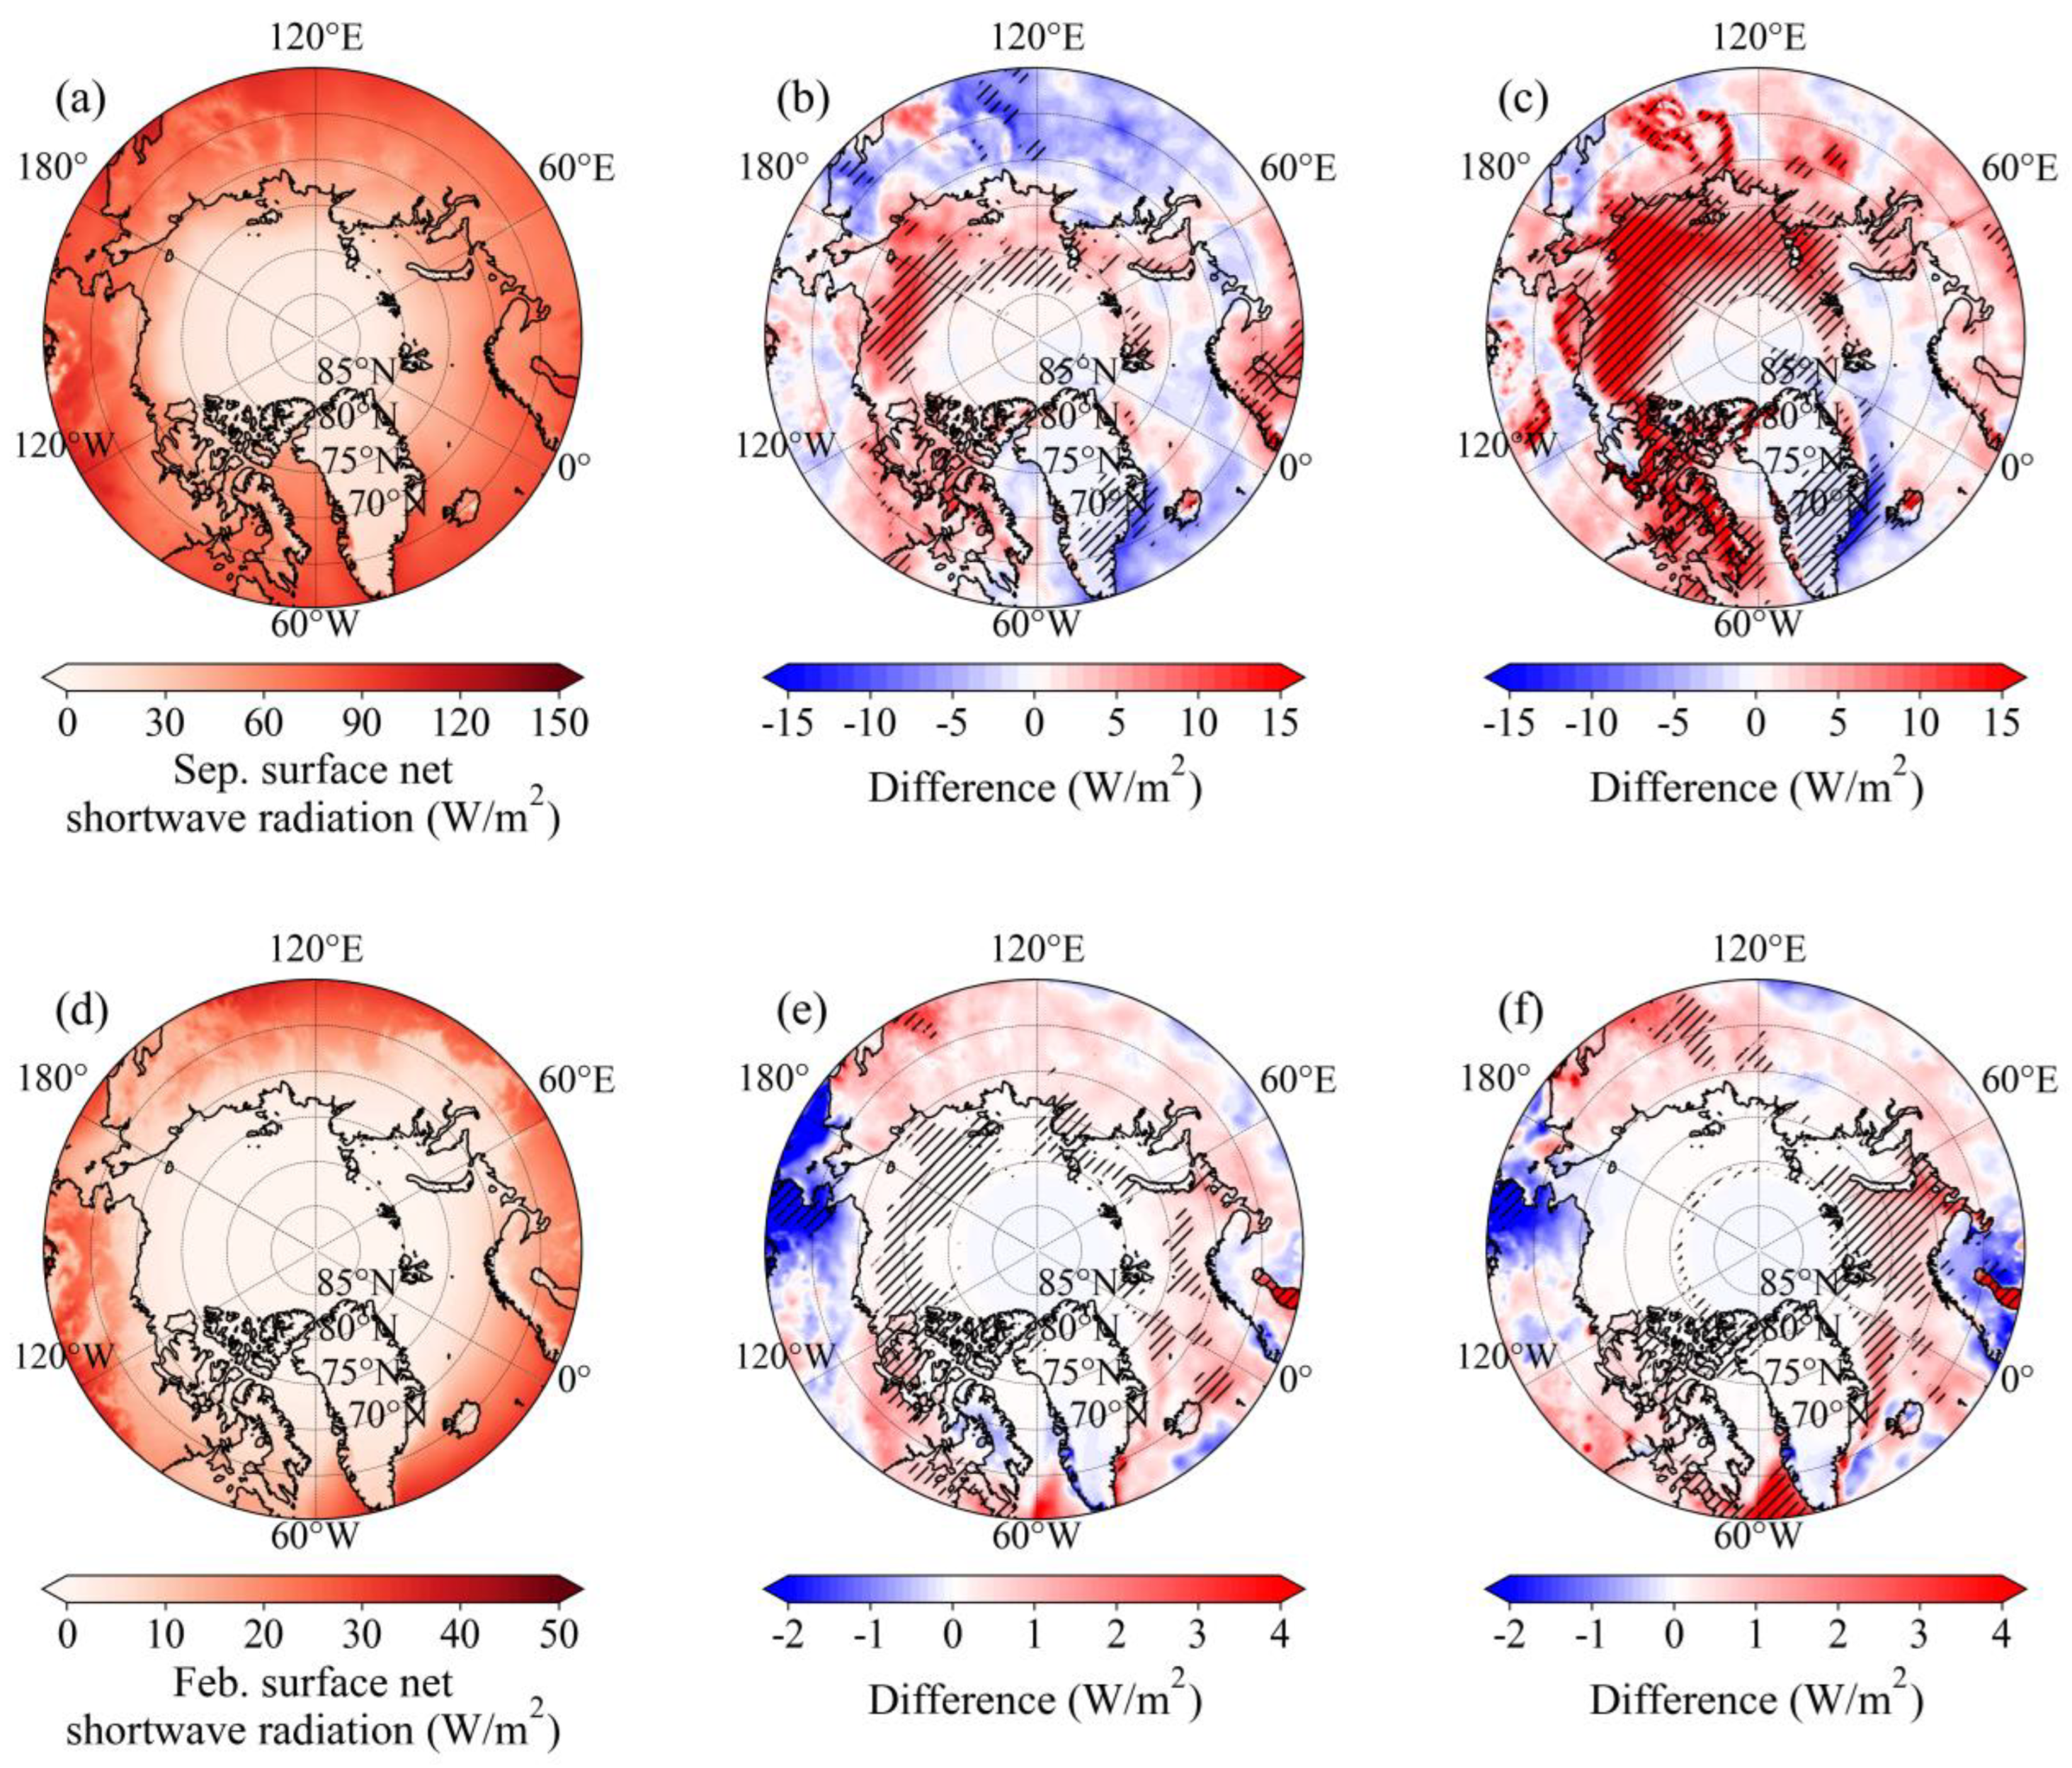
Figure 5.
Monthly mean SNSR (a-b), 2-m air temperature (T2m, c-d) and sea surface temperature (SST, e-f) in 1979-1991 (blue lines), 1992-2006 (orange lines) and 2007-2024 (green lines). The first and second columns are spatial average over the Arctic belt zone and the northern sector of Greenland, respectively.
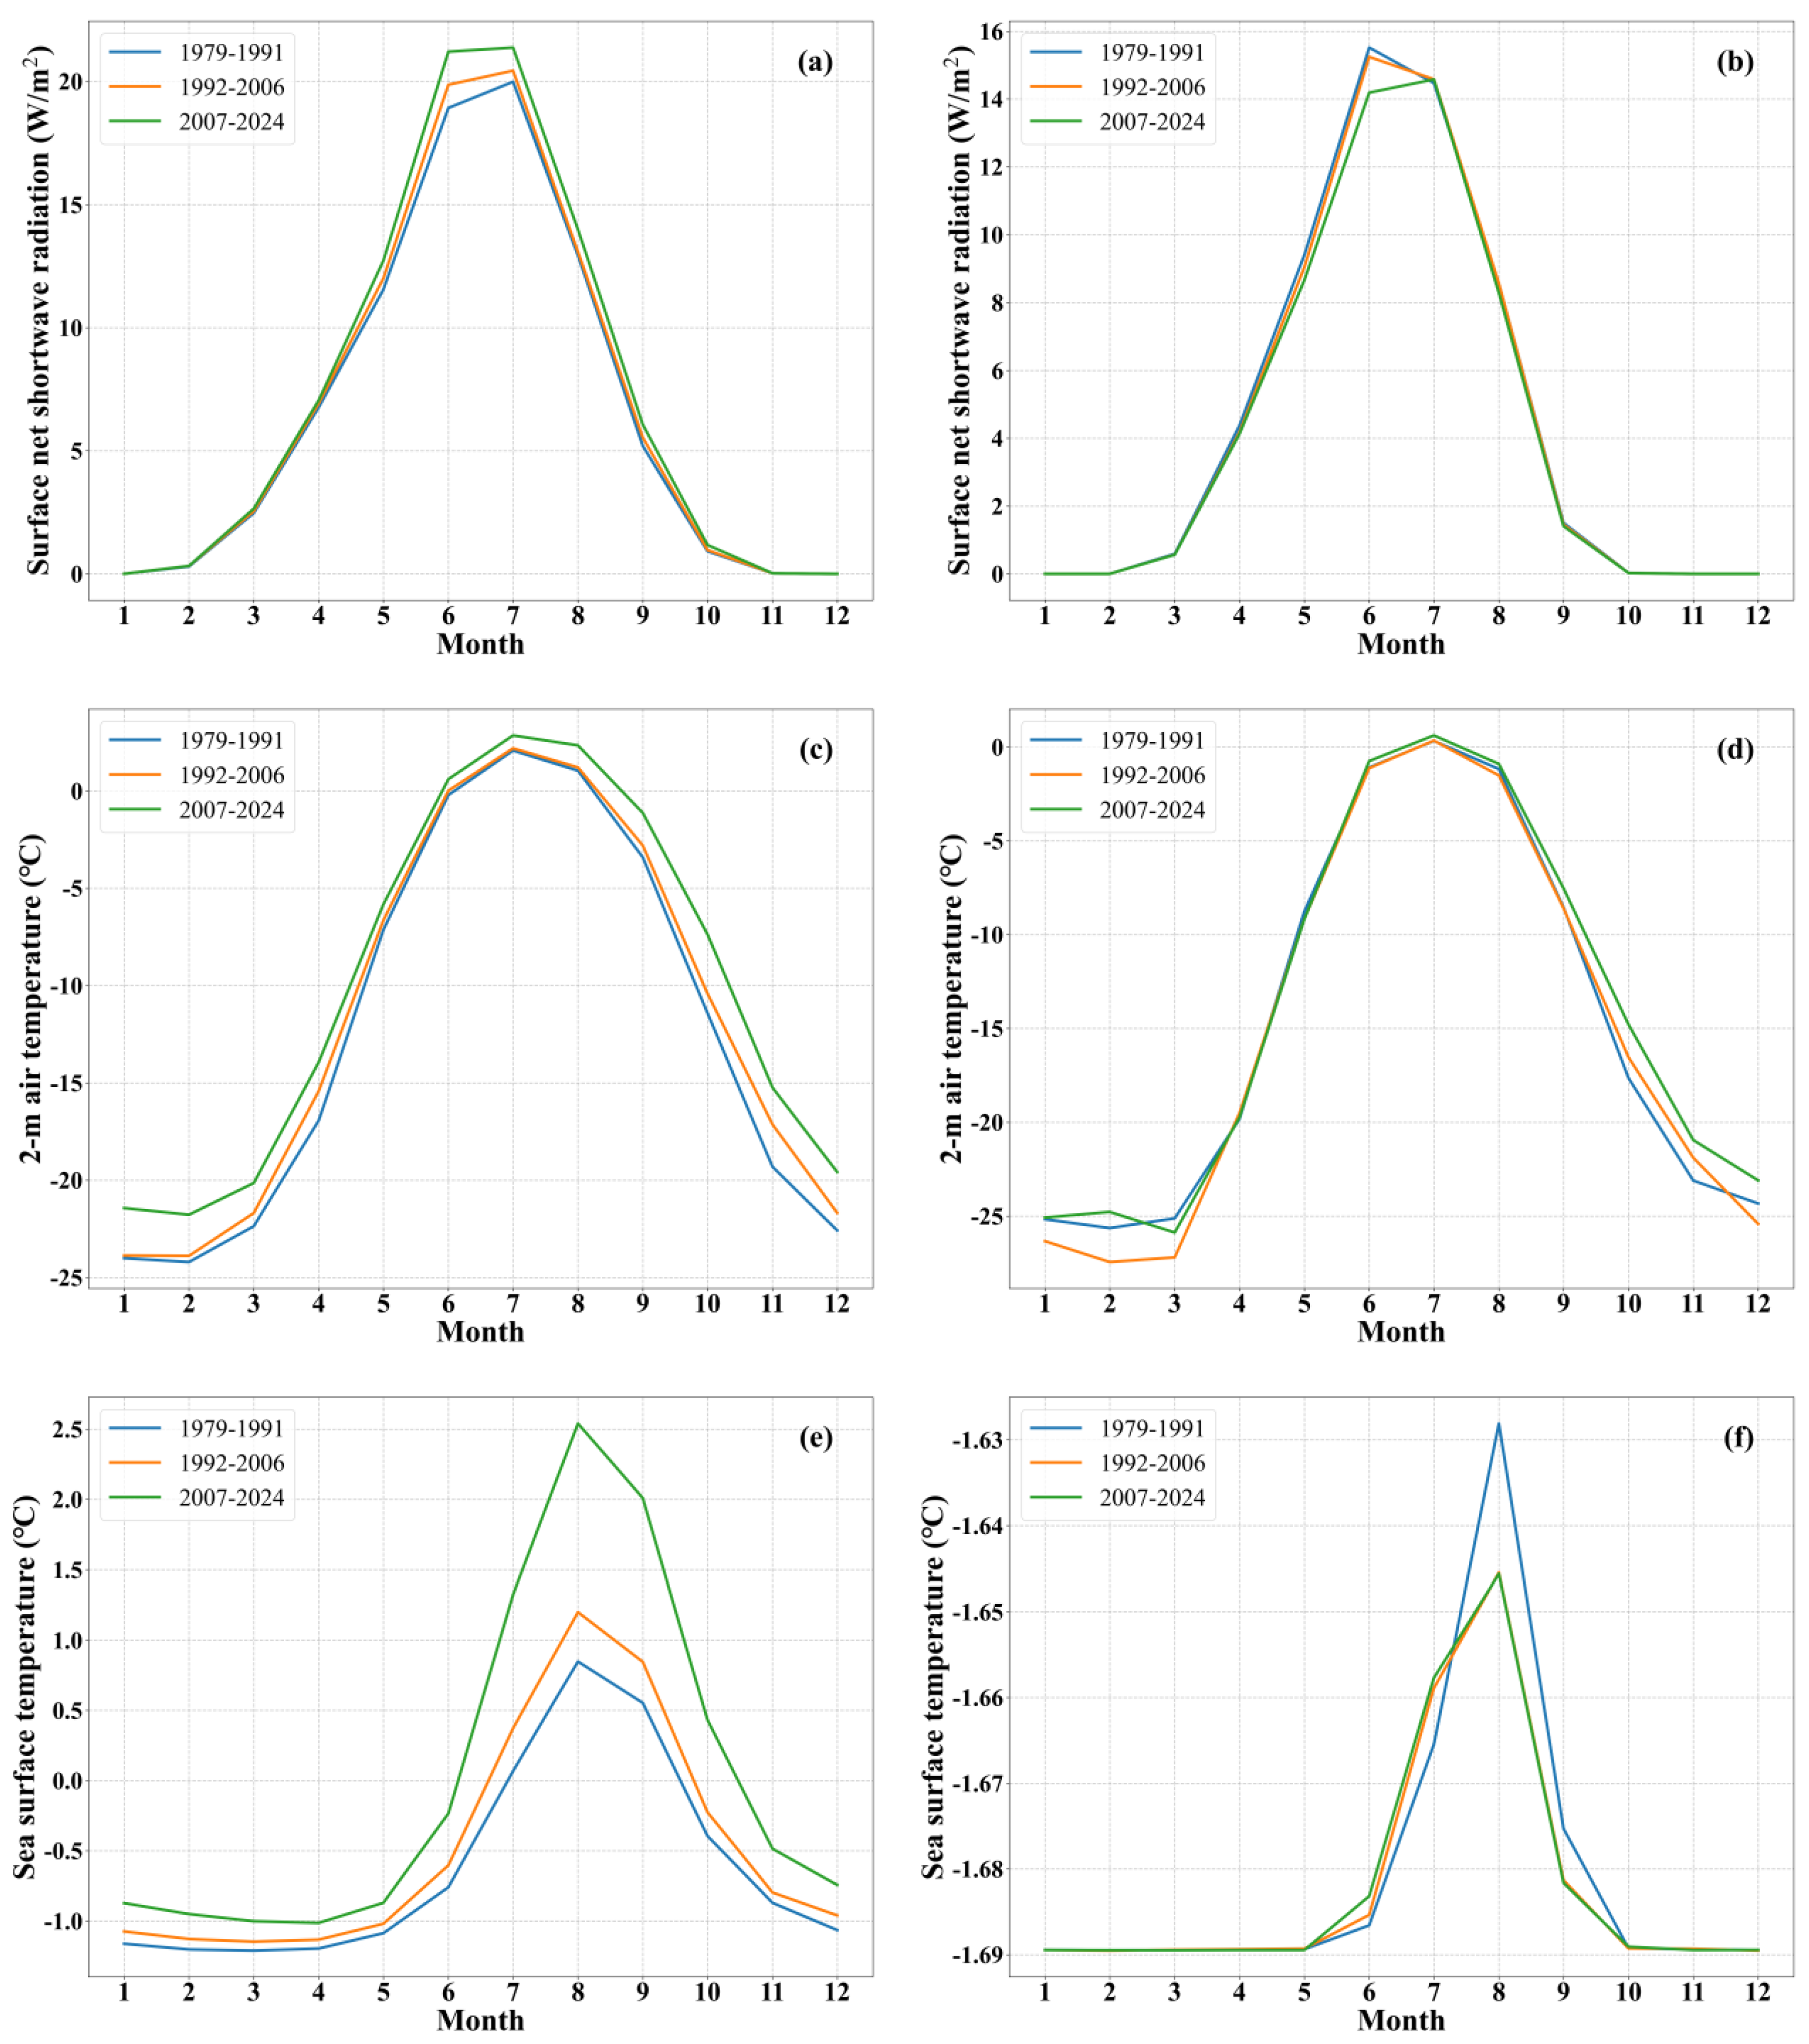
Figure 6.
Monthly mean SNSR (a-c), T2m (d-f), SST (g-i) in 1979-1991 (blue lines), 1992-2006 (orange lines) and 2007-2024 (green lines). The first, second and third columns are spatial average over the Barents Sea, the Greenland Sea and the central Arctic Ocean, respectively.
Figure 6.
Monthly mean SNSR (a-c), T2m (d-f), SST (g-i) in 1979-1991 (blue lines), 1992-2006 (orange lines) and 2007-2024 (green lines). The first, second and third columns are spatial average over the Barents Sea, the Greenland Sea and the central Arctic Ocean, respectively.
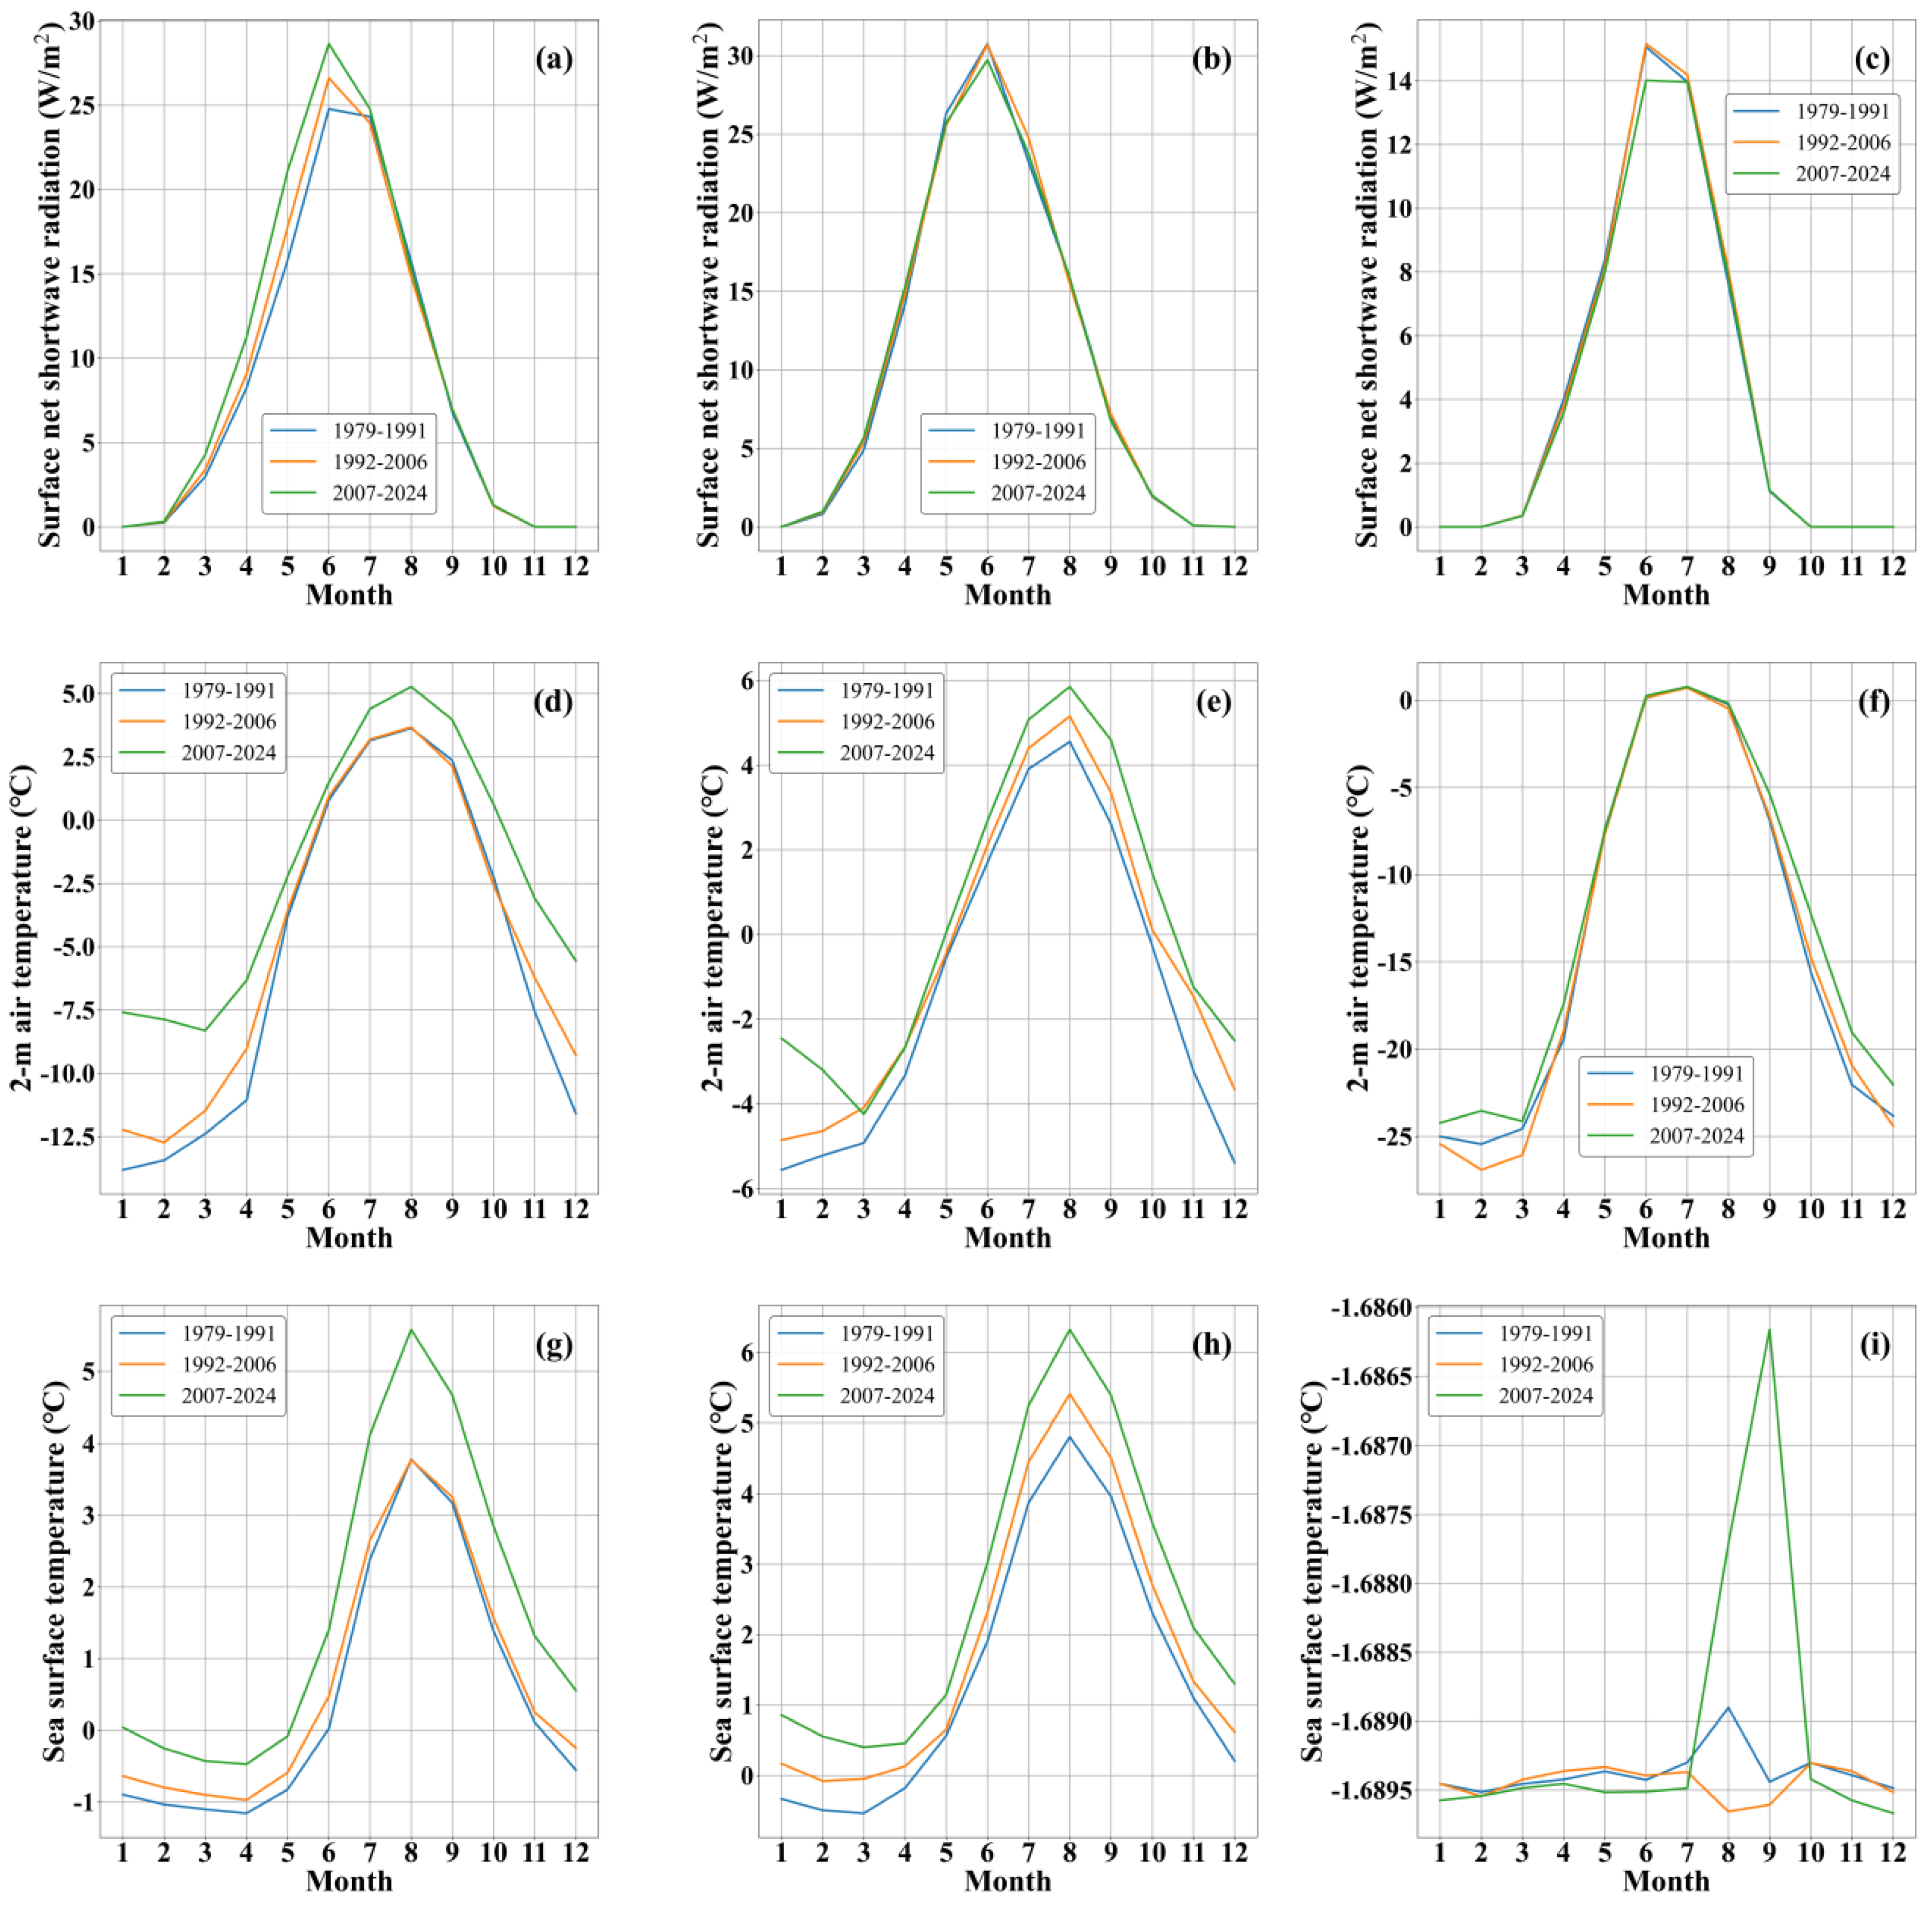
Figure 7.
Mean September T2m (℃) for 1979-1991 (a), T2m differences for 1992-2006 (b) and 2007-2024 (c) relative to 1979-1991. The second row presents the same information for February (d-f). Black hatching denotes grid cells where the difference is significant at the 95% confidence level.
Figure 7.
Mean September T2m (℃) for 1979-1991 (a), T2m differences for 1992-2006 (b) and 2007-2024 (c) relative to 1979-1991. The second row presents the same information for February (d-f). Black hatching denotes grid cells where the difference is significant at the 95% confidence level.
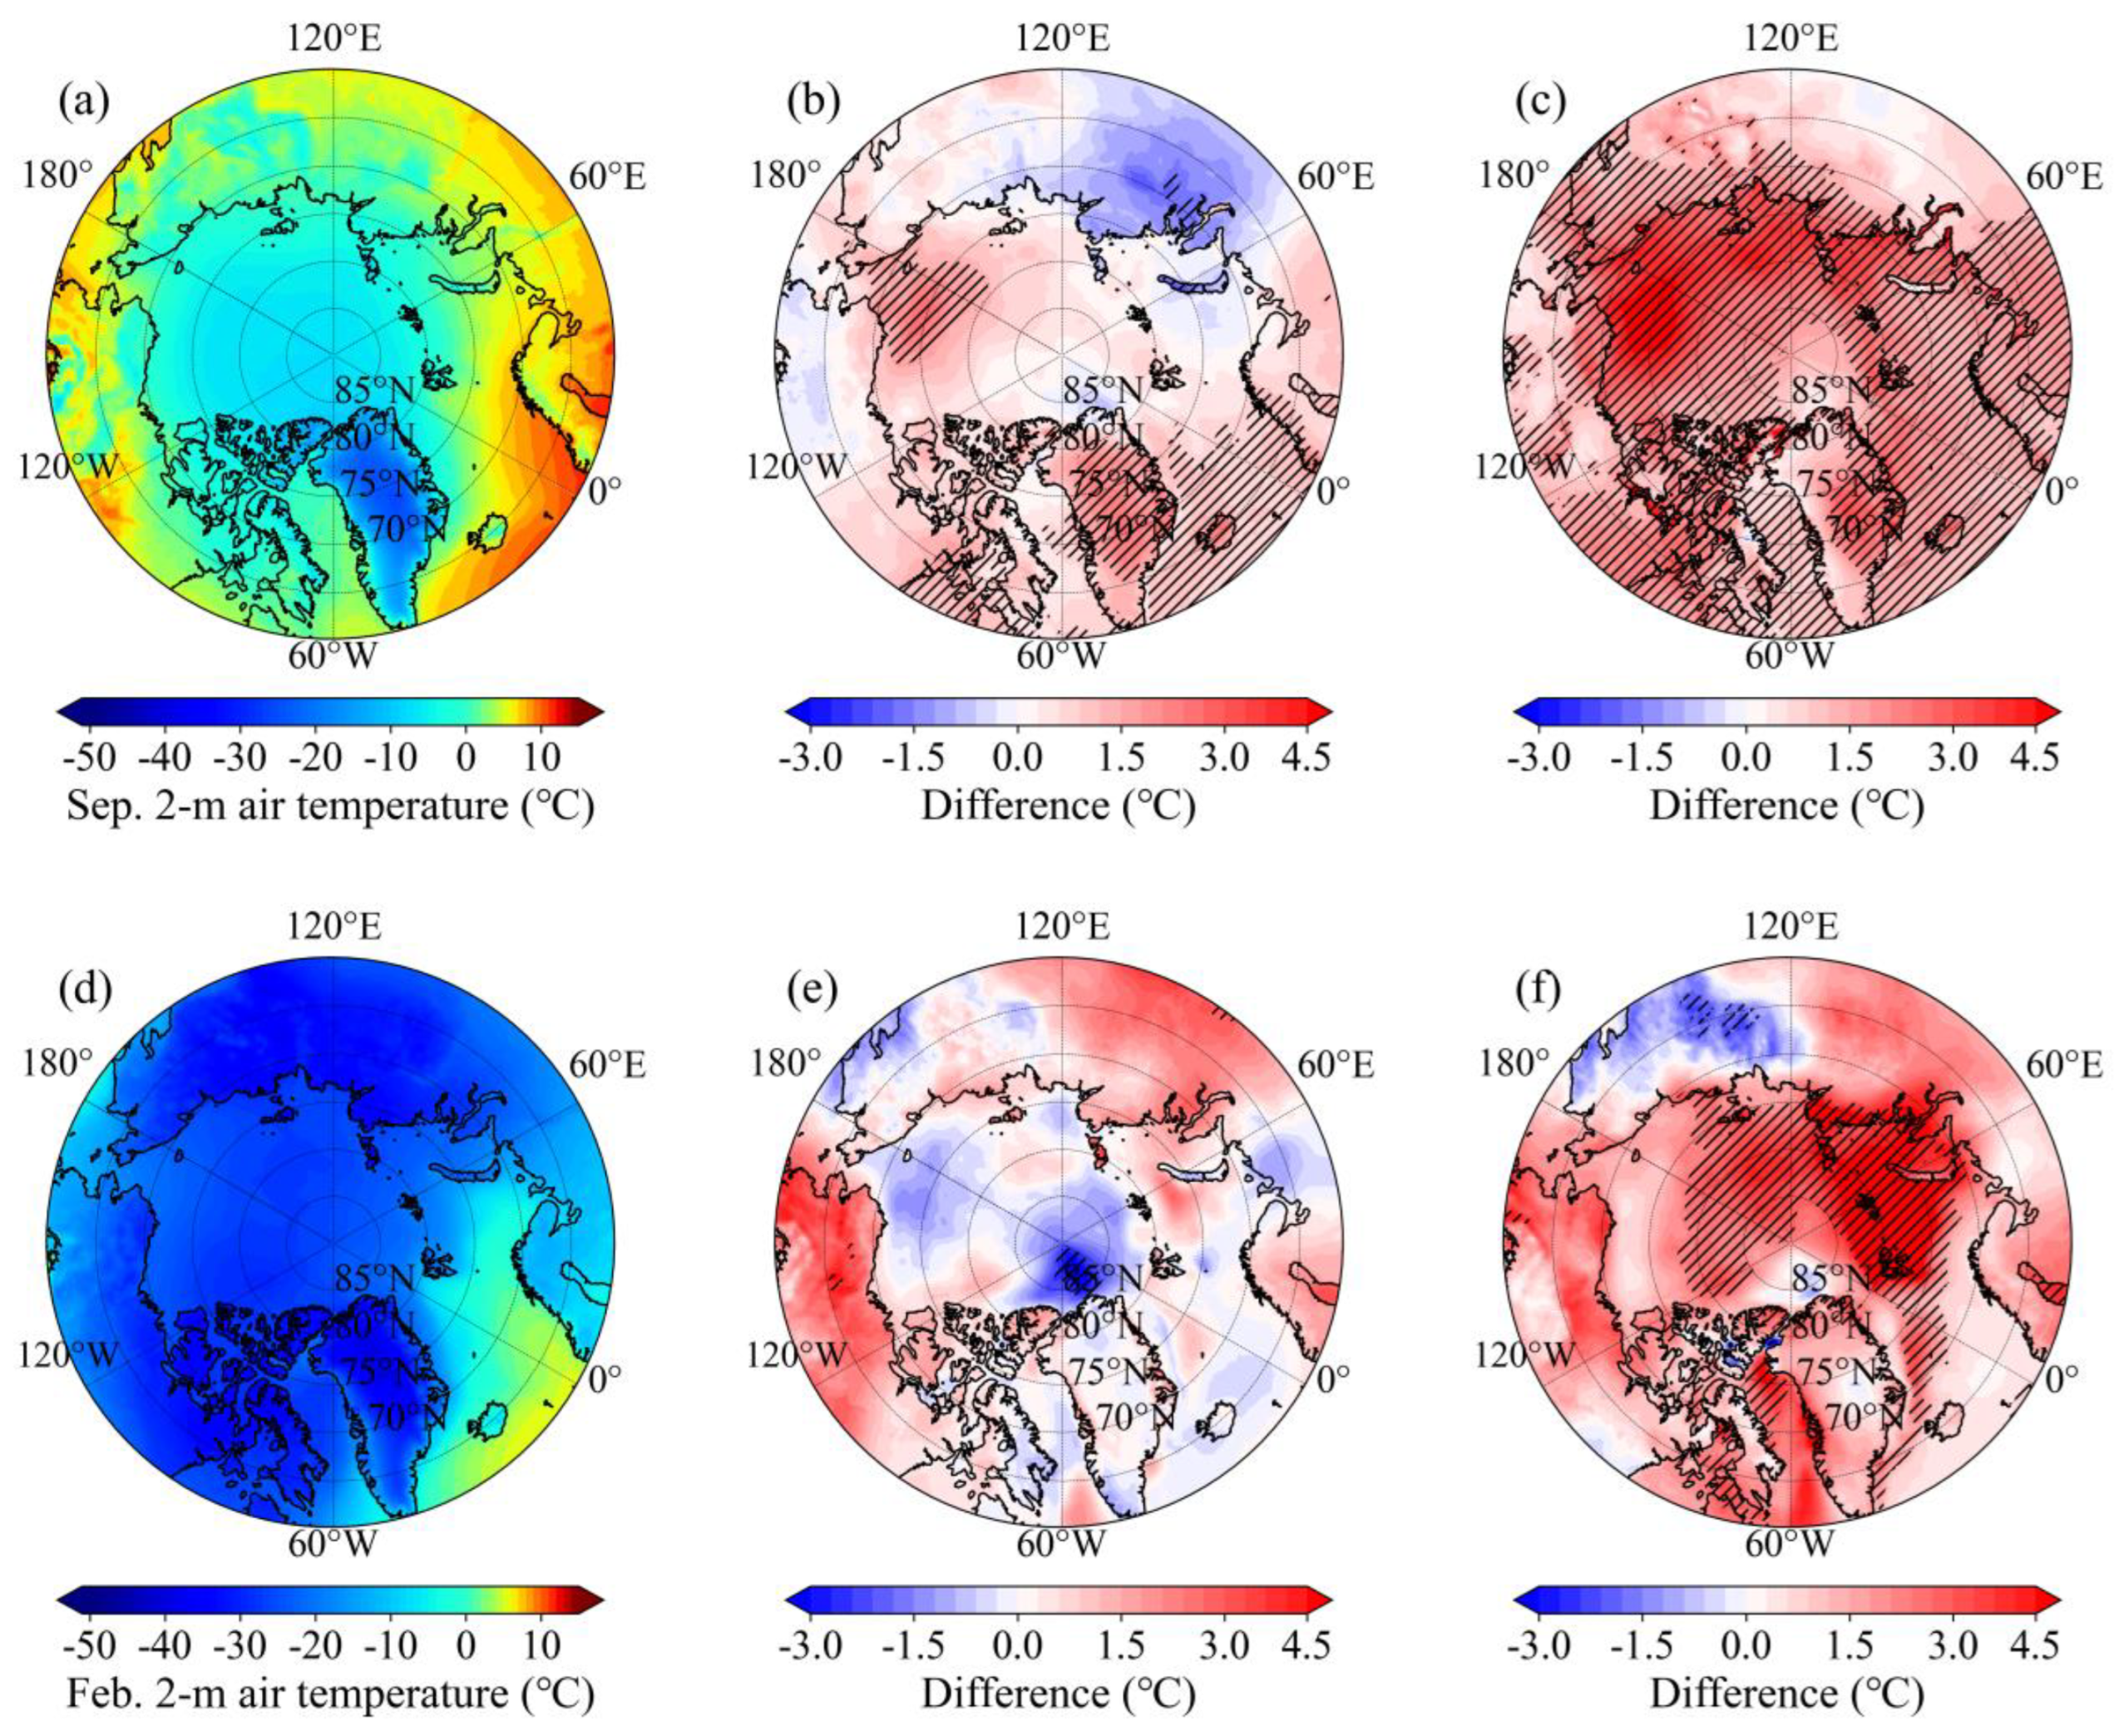
Figure 8.
Mean September SST (℃) for 1979-1991 (a), SST differences for 1992-2006 (b) and 2007-2024 (c) relative to 1979-1991. The second row presents the same information for February (d-f). Black hatching denotes grid cells where the difference is significant at the 95% confidence level.
Figure 8.
Mean September SST (℃) for 1979-1991 (a), SST differences for 1992-2006 (b) and 2007-2024 (c) relative to 1979-1991. The second row presents the same information for February (d-f). Black hatching denotes grid cells where the difference is significant at the 95% confidence level.
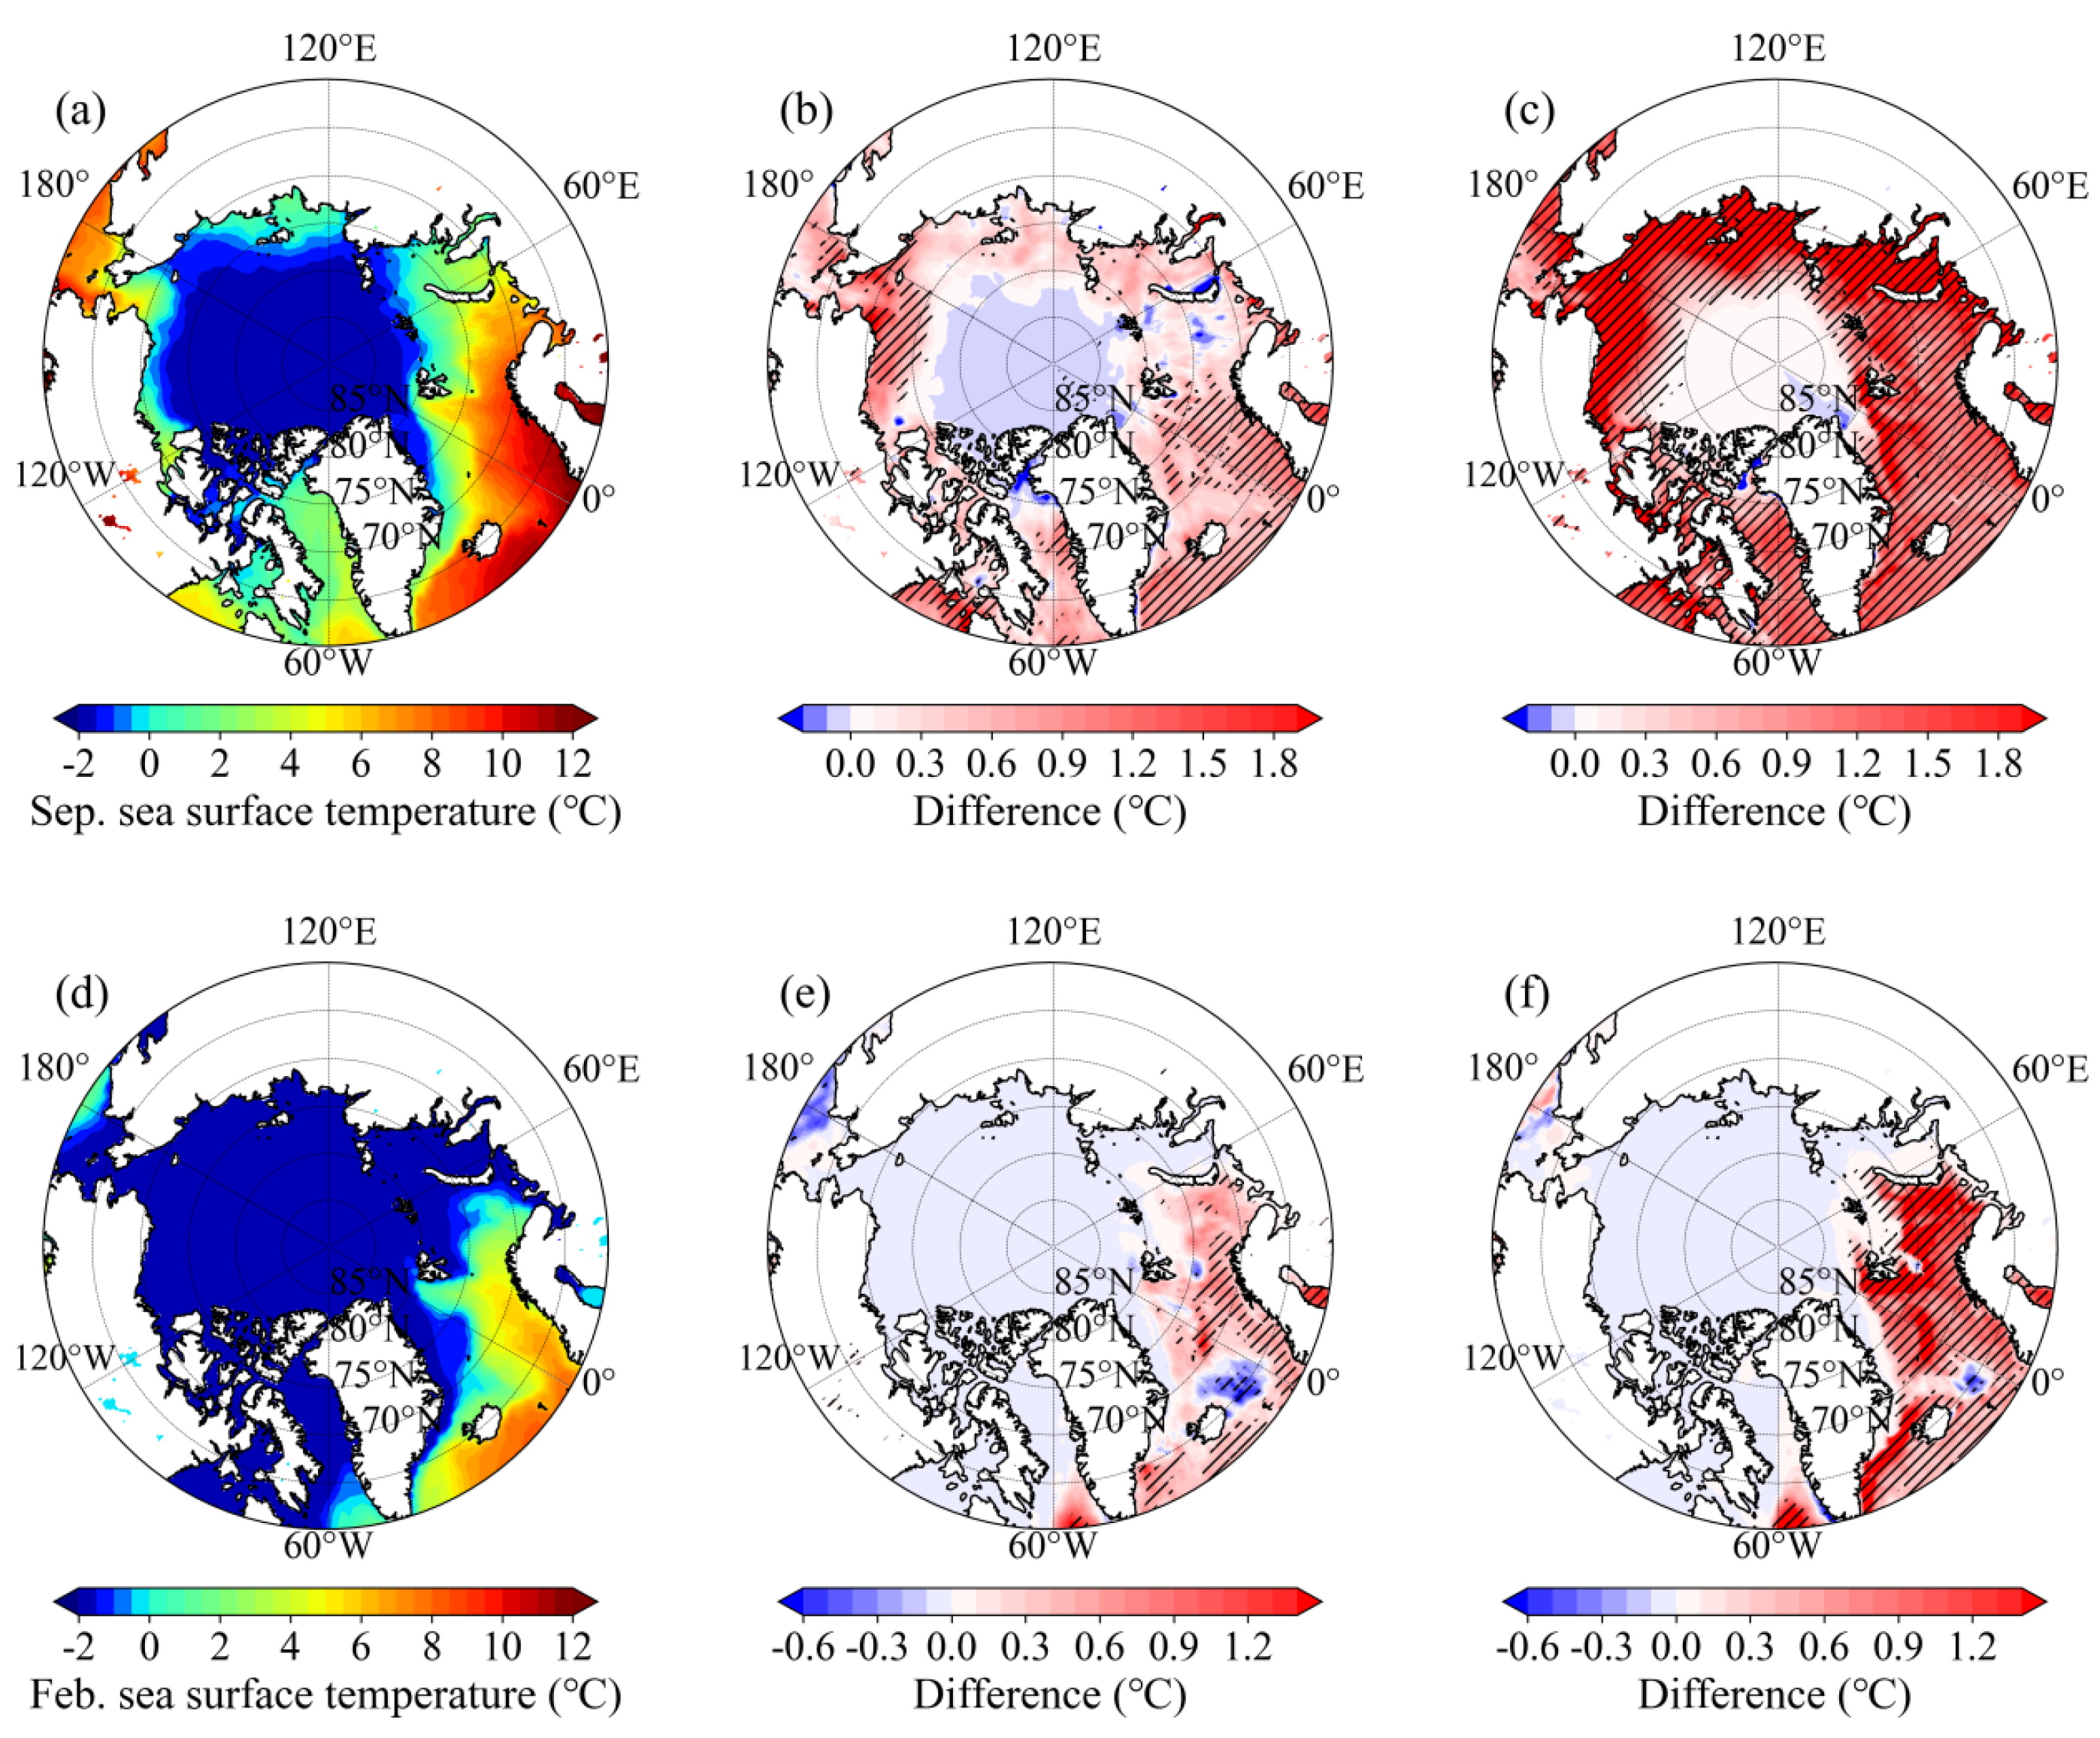
Figure 9.
Mean September sea level pressure (SLP, hpa, shaded) and 10-m wind velocity (m s-1, vectors) for 1979-1991 (a), SLP and 10-m wind velocity differences for 1992-2006 (b) and 2007-2024 (c) relative to 1979-1991. The second row presents the same information for February (d-f).
Figure 9.
Mean September sea level pressure (SLP, hpa, shaded) and 10-m wind velocity (m s-1, vectors) for 1979-1991 (a), SLP and 10-m wind velocity differences for 1992-2006 (b) and 2007-2024 (c) relative to 1979-1991. The second row presents the same information for February (d-f).
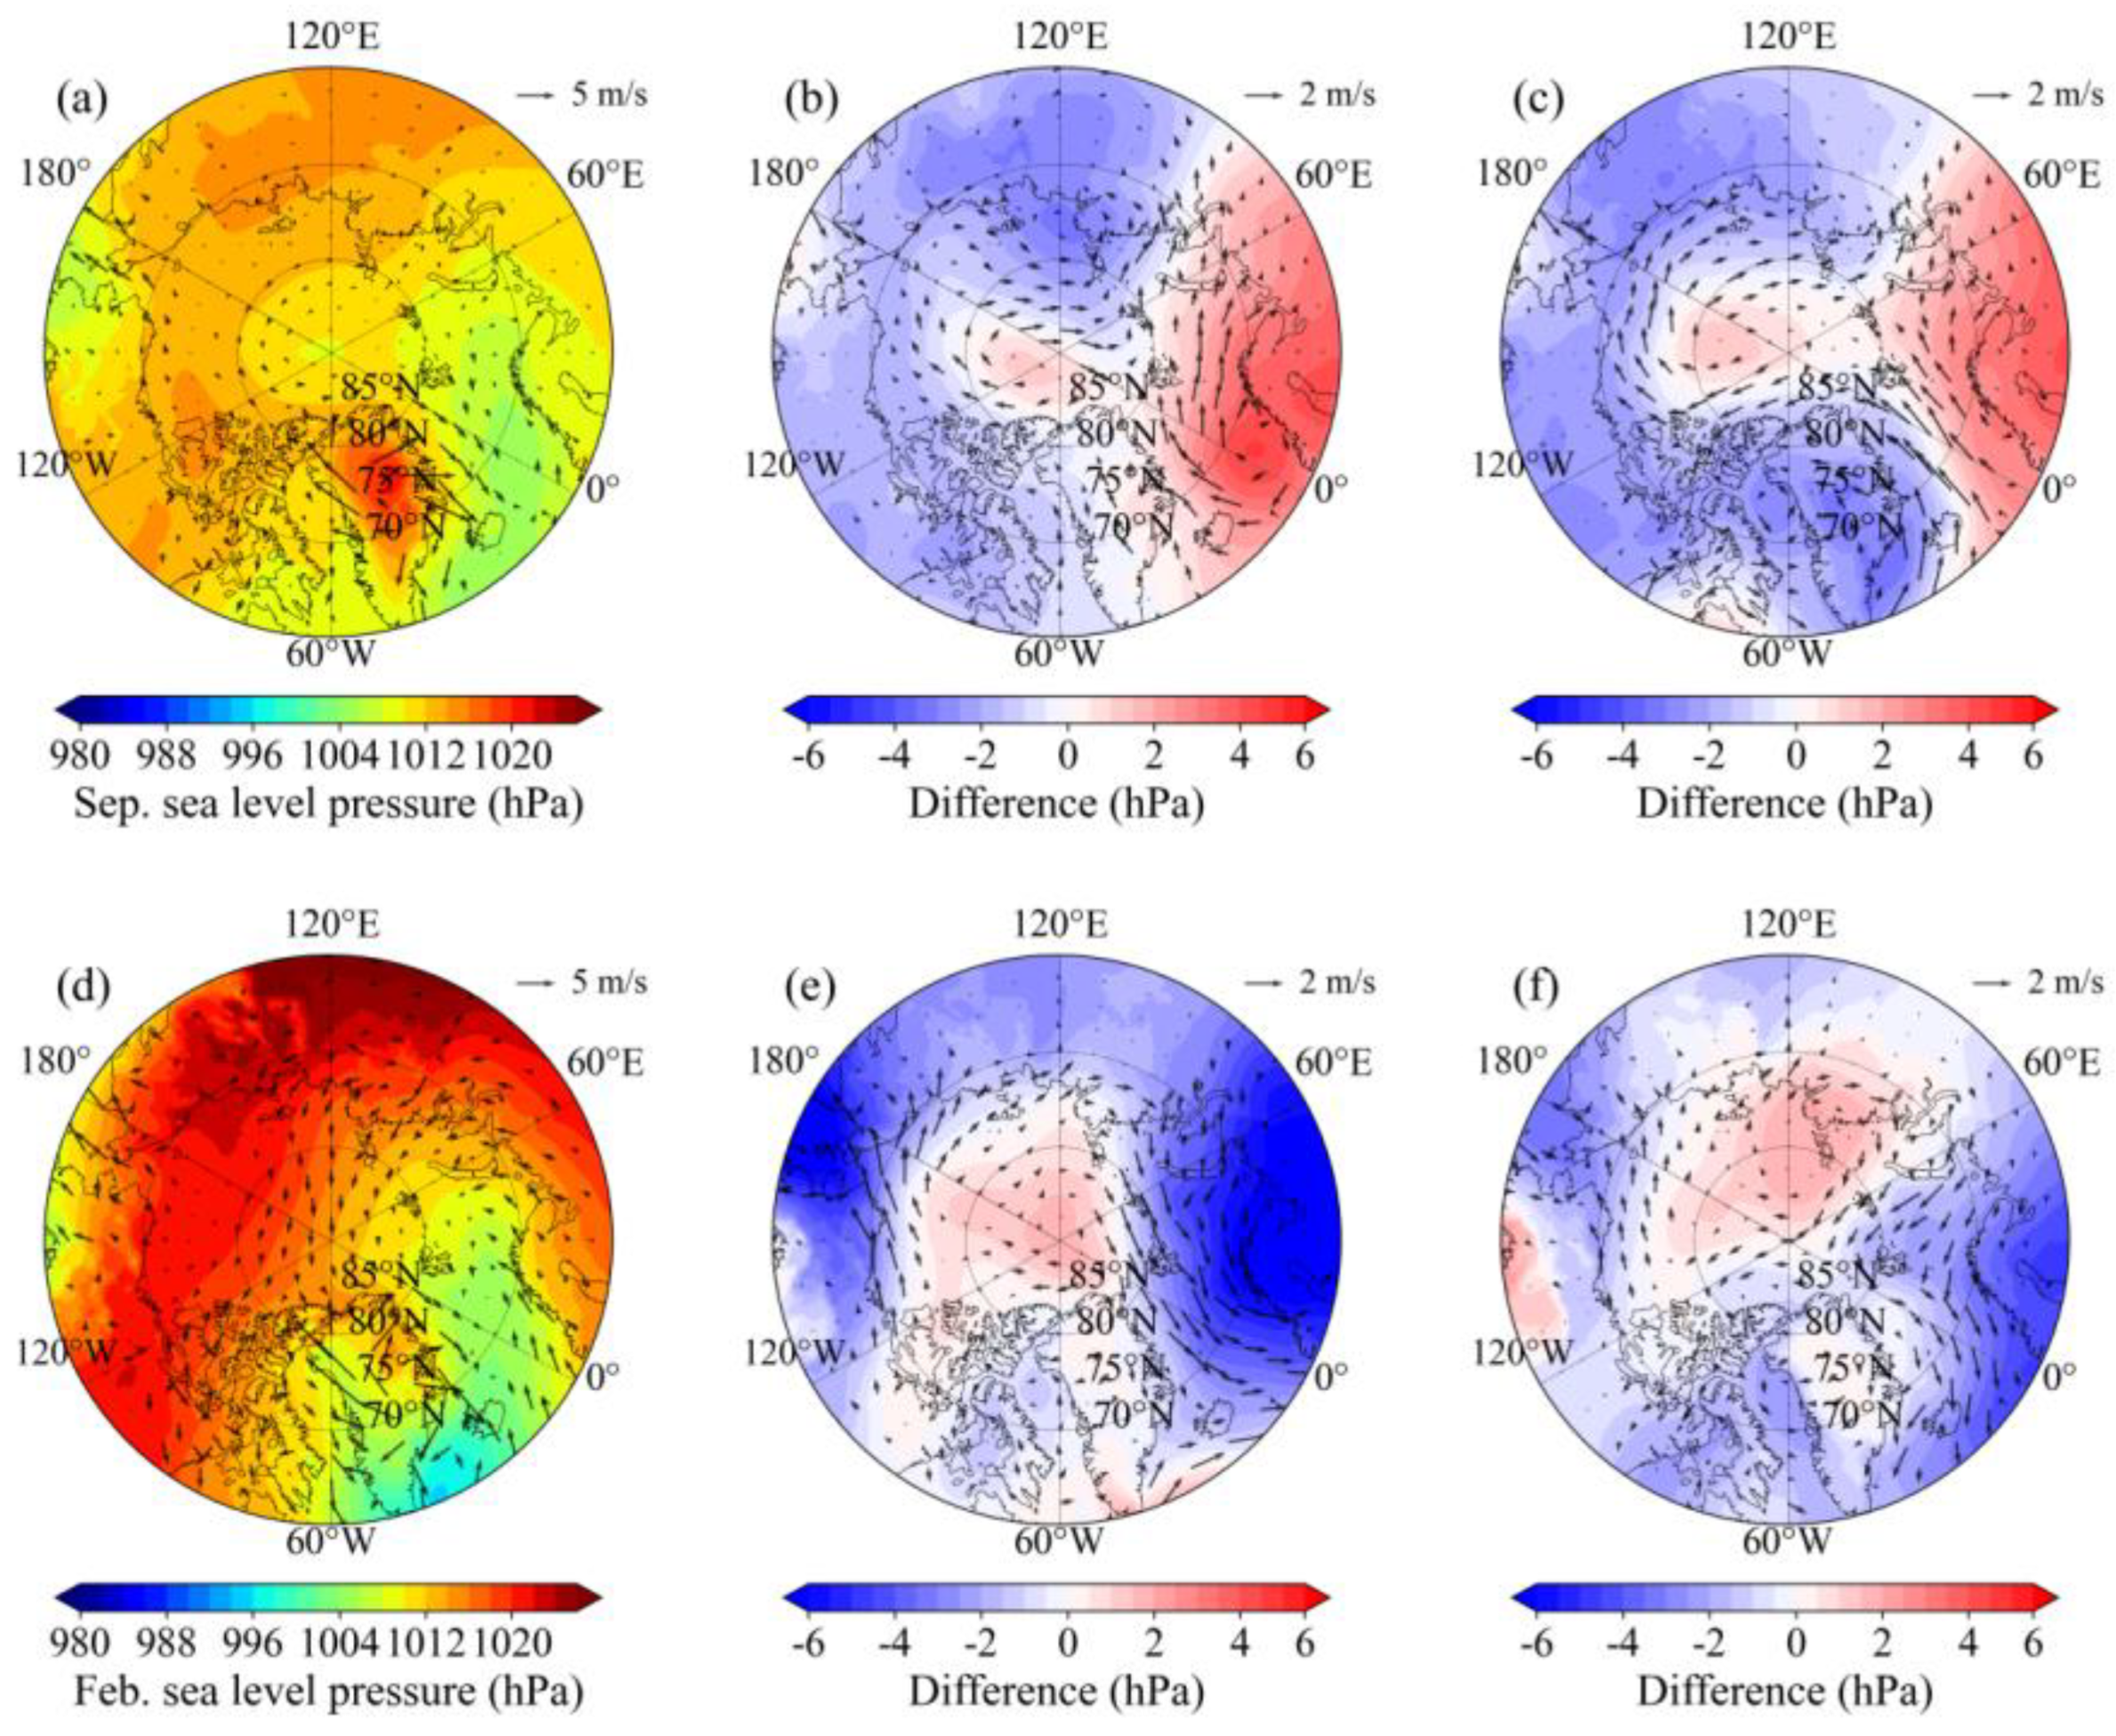
Figure 10.
Mean September sea ice velocity (m s-1, vectors) for 1979-1991 (a), sea ice velocity differences for 1992-2006 (b) and 2007-2024 (c) relative to 1979-1991. The second row presents the same information for February (d-f).
Figure 10.
Mean September sea ice velocity (m s-1, vectors) for 1979-1991 (a), sea ice velocity differences for 1992-2006 (b) and 2007-2024 (c) relative to 1979-1991. The second row presents the same information for February (d-f).
Disclaimer/Publisher’s Note: The statements, opinions and data contained in all publications are solely those of the individual author(s) and contributor(s) and not of MDPI and/or the editor(s). MDPI and/or the editor(s) disclaim responsibility for any injury to people or property resulting from any ideas, methods, instructions or products referred to in the content. |
© 2025 by the authors. Licensee MDPI, Basel, Switzerland. This article is an open access article distributed under the terms and conditions of the Creative Commons Attribution (CC BY) license (http://creativecommons.org/licenses/by/4.0/).
Copyright: This open access article is published under a Creative Commons CC BY 4.0 license, which permit the free download, distribution, and reuse, provided that the author and preprint are cited in any reuse.


