1. Introduction
Amidst expanding multinational operations and intensifying regulatory pressures, corporate compliance management is shifting from post-event auditing to real-time monitoring, necessitating a digital risk control system with instant perception and dynamic feedback capabilities. Process compliance, a critical dimension of internal controls, has long been constrained by issues such as high process opacity, delayed violation detection, and fragmented response chains. These challenges make it difficult for traditional governance methods to cover potential risks within high-frequency interactions and complex process nodes. With the accumulation of multi-source business logs—including ERP, approval workflows, and service tickets—process mining and anomaly detection technologies now provide the data foundation and modeling support for embedding risk control mechanisms. However, accurately characterizing process deviations, structurally identifying risky behaviors, and establishing a dashboard-style real-time intervention framework through explainable mechanisms remain critical challenges in the digital upgrade of compliance governance. To address this, a closed-loop technical approach integrating process modeling, behavioral recognition, and causal assessment must be developed, propelling organizational risk response from static compliance to proactive governance.
2. Building and Implementing the Compliance Risk Control Closed Loop
2.1. Overall Research Framework Design
Against the backdrop of compliance and risk management systems increasingly relying on digital platforms, constructing a closed-loop feedback mechanism has become a critical objective for many enterprises’ compliance governance. The overall framework designed in this study is as follows: a full-process closed-loop control spanning Process Log Collection → Compliance Deviation Identification → Anomaly Risk Detection → Intervention Effect Evaluation → Operational Feedback Adjustment [
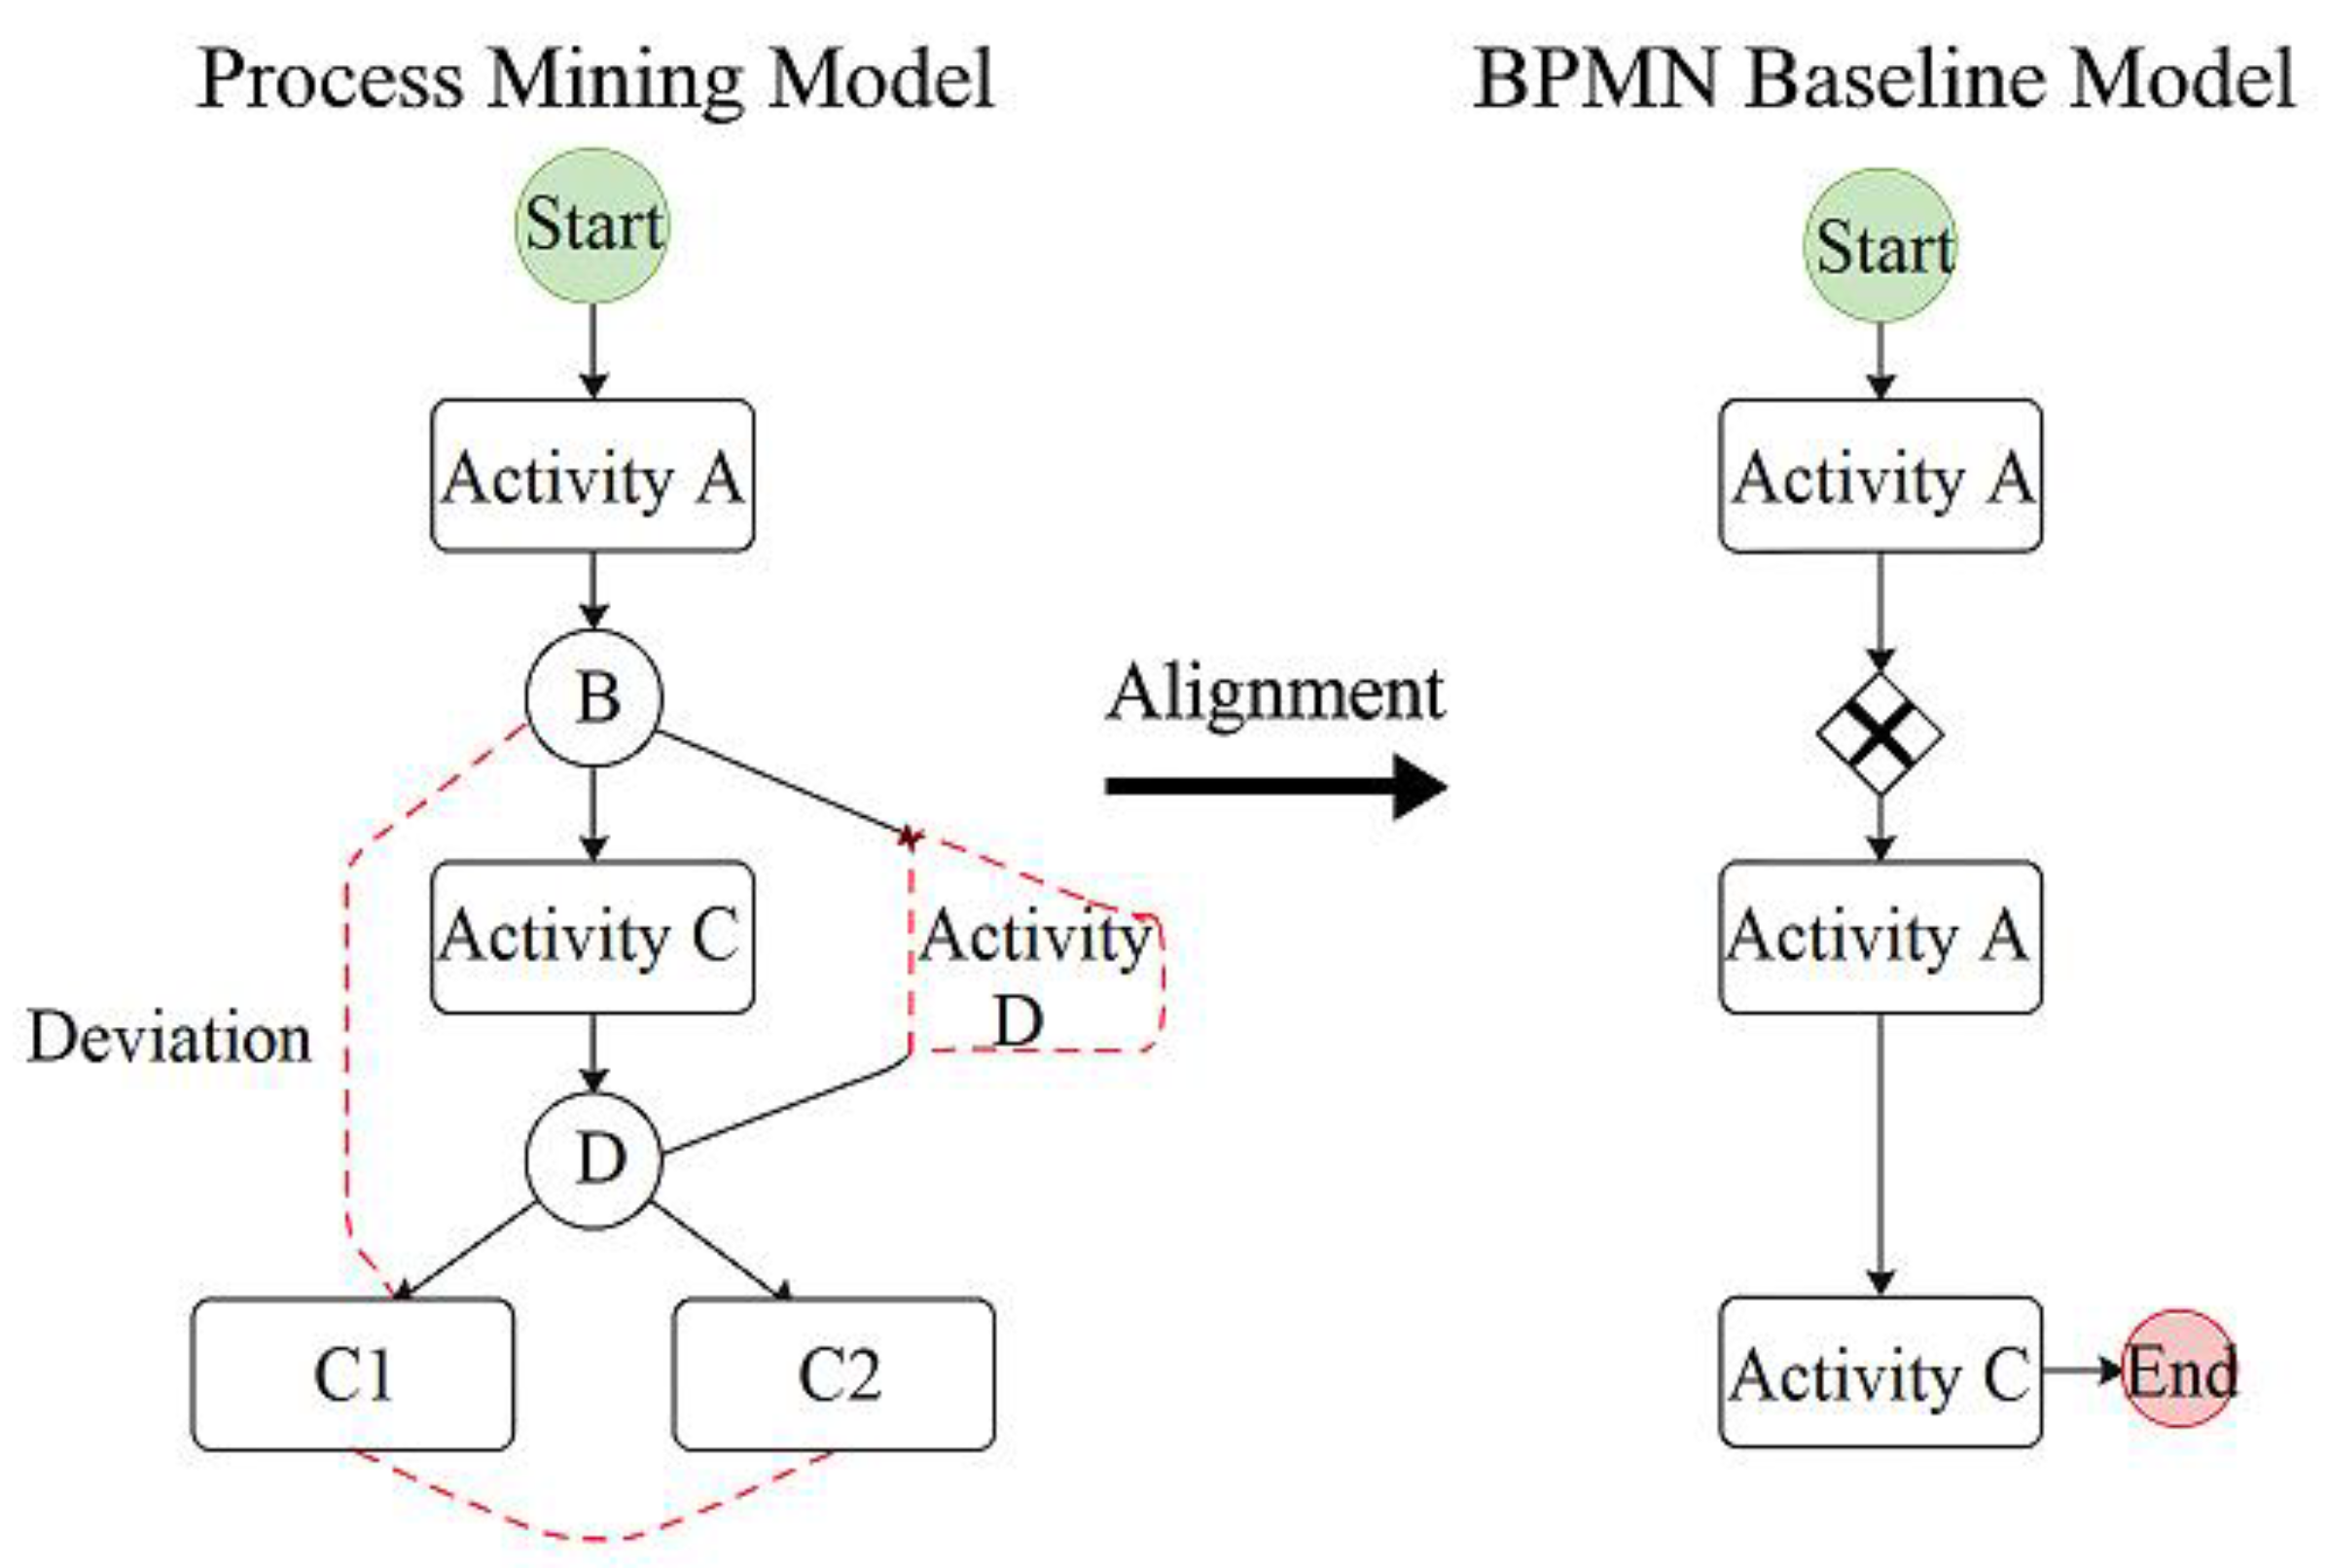
1]. First, standardized event sequences containing timestamps, activity tags, and resource fields are uniformly extracted from multi-source event logs (ERP operation flows, approval flows, service tickets, etc.), providing structured inputs for subsequent modeling. Based on this, actual process models are constructed using Heuristics Miner and aligned with predefined BPMN baseline models. The conformance cost is then calculated to quantify the degree of process deviation. Subsequently, transaction behavior and process anomalies are identified using anomaly detection modules (LSTM-AE and Isolation Forest). A quantifiable risk score is generated via a risk scorer (XGBoost + Platt Scaling), enabling risk significance ranking and prioritized intervention [
2]. Finally, utilize interruption time series models and the double difference method to identify causal relationships in key metric changes before and after Kanban implementation. Feed these findings back into model threshold optimization and audit resource allocation strategies, forming a dynamic learning loop.
2.2. Data Sources and Preprocessing
The foundational dataset comprises multi-source, heterogeneous event logs from 34 cross-border projects spanning 2018–2023, sourced from Aiku Communications and its five multinational partners. These projects cover multiple industries—including communications, cloud services, and manufacturing—representing diverse process structures and approval hierarchies. The dataset includes ERP operation logs, approval workflow records, and operational work order data. While this sample provides a rich cross-organizational and cross-domain process landscape, the relatively limited number of projects (n = 34) introduces potential constraints on the statistical generalizability of the findings. Cross-border projects often differ in compliance regimes, cultural process norms, and approval depth, which may influence the comparability of behavioral deviations and risk exposure intensity. To mitigate this, the study employed heterogeneity control through stratified sampling, ensuring balanced coverage of different enterprise scales and process types. The discussion section further acknowledges these limitations and highlights that future extensions will incorporate additional multinational datasets to enhance external validity. The preprocessing phase designed a unified event standardization workflow, including timestamp format normalization, activity label standardization, and resource field aggregation [
3]. All events were organized into a standardized structure (case_id, activity, timestamp, resource) to support process mining reconfigurability. The system employs an incremental ETL scheduling strategy for cross-platform log sources and incorporates an anomaly handling mechanism. Process fragments with temporal discontinuities are repaired using a longest common subsequence-based filling algorithm.
2.3. Process Mining and Compliance Consistency Analysis
The design objective of the process mining and compliance consistency analysis module is to construct actual execution processes from standardized event logs and align them structurally and behaviorally with predefined compliant BPMN models. This identifies critical compliance risk points such as process deviations, bypasses, and redundant steps [
4]. To enhance model adaptability across multi-enterprise heterogeneous process scenarios, Heuristics Miner and α-Miner algorithms are employed for visual modeling of log sequences. Activity frequencies and transition probabilities are embedded within the generated Petri net structure to augment expressiveness in process path reconstruction. For compliance consistency measurement, an Alignment Cost model is introduced to construct the following deviation penalty function:
where ai denotes the actual activity sequence, pi represents the expected process path, d(⋅) indicates the activity deviation distance, and wi is the activity weight. Based on this design, deviation score matrices can be generated at both the case-level (per process instance) and activity-level (per node), serving as critical input variables for subsequent risk scoring and anomaly detection models [
5].
Figure 1 illustrates the structural comparison between the actual process diagram and the BPMN baseline model, visually depicting the distribution characteristics of branch paths exhibiting compliance deviations. This effectively supports the design of dashboards for “process transparency” and “risk visualization.”
2.4. Multi-Modal Anomaly Detection Model Construction
The anomaly detection layer is designed around the “process deviation → behavioral signals → risk presentation” pathway: Alignment deviation and wait time anomalies serve as structural features, overlaid with temporal window features from transaction sequences. An LSTM-Autoencoder is constructed to reconstruct error capture and detect case-level anomalies, while an Isolation Forest absorbs nonlinearity and multi-enterprise heterogeneous distributions [
6]. The calibrated outputs from both models are fused with XGBoost risk scores trained on audit labels at the dashboard level to generate interpretable unified alert scores:
Where rt denotes LSTM-AE reconstruction error, ft represents Isolation Forest path length score, ct is the normalized metric for process mining consistency/wait deviation, and pt is the Platt-calibrated XGBoost risk probability; z(⋅) indicates standardization, and wi denotes weights determined offline via cost-sensitive learning and audit resource constraints. The model updates thresholds and black/white list features online via streaming window Δt. Alerts are routed through the dashboard to human review and process intervention channels. The unified score St and its components serve as intervention intensity and exposure inputs in the ITS/DiD framework within the causal effect assessment model, enabling a closed-loop causal identification of “deployment-behavior-risk.”
2.5. Causal Effect Evaluation Model
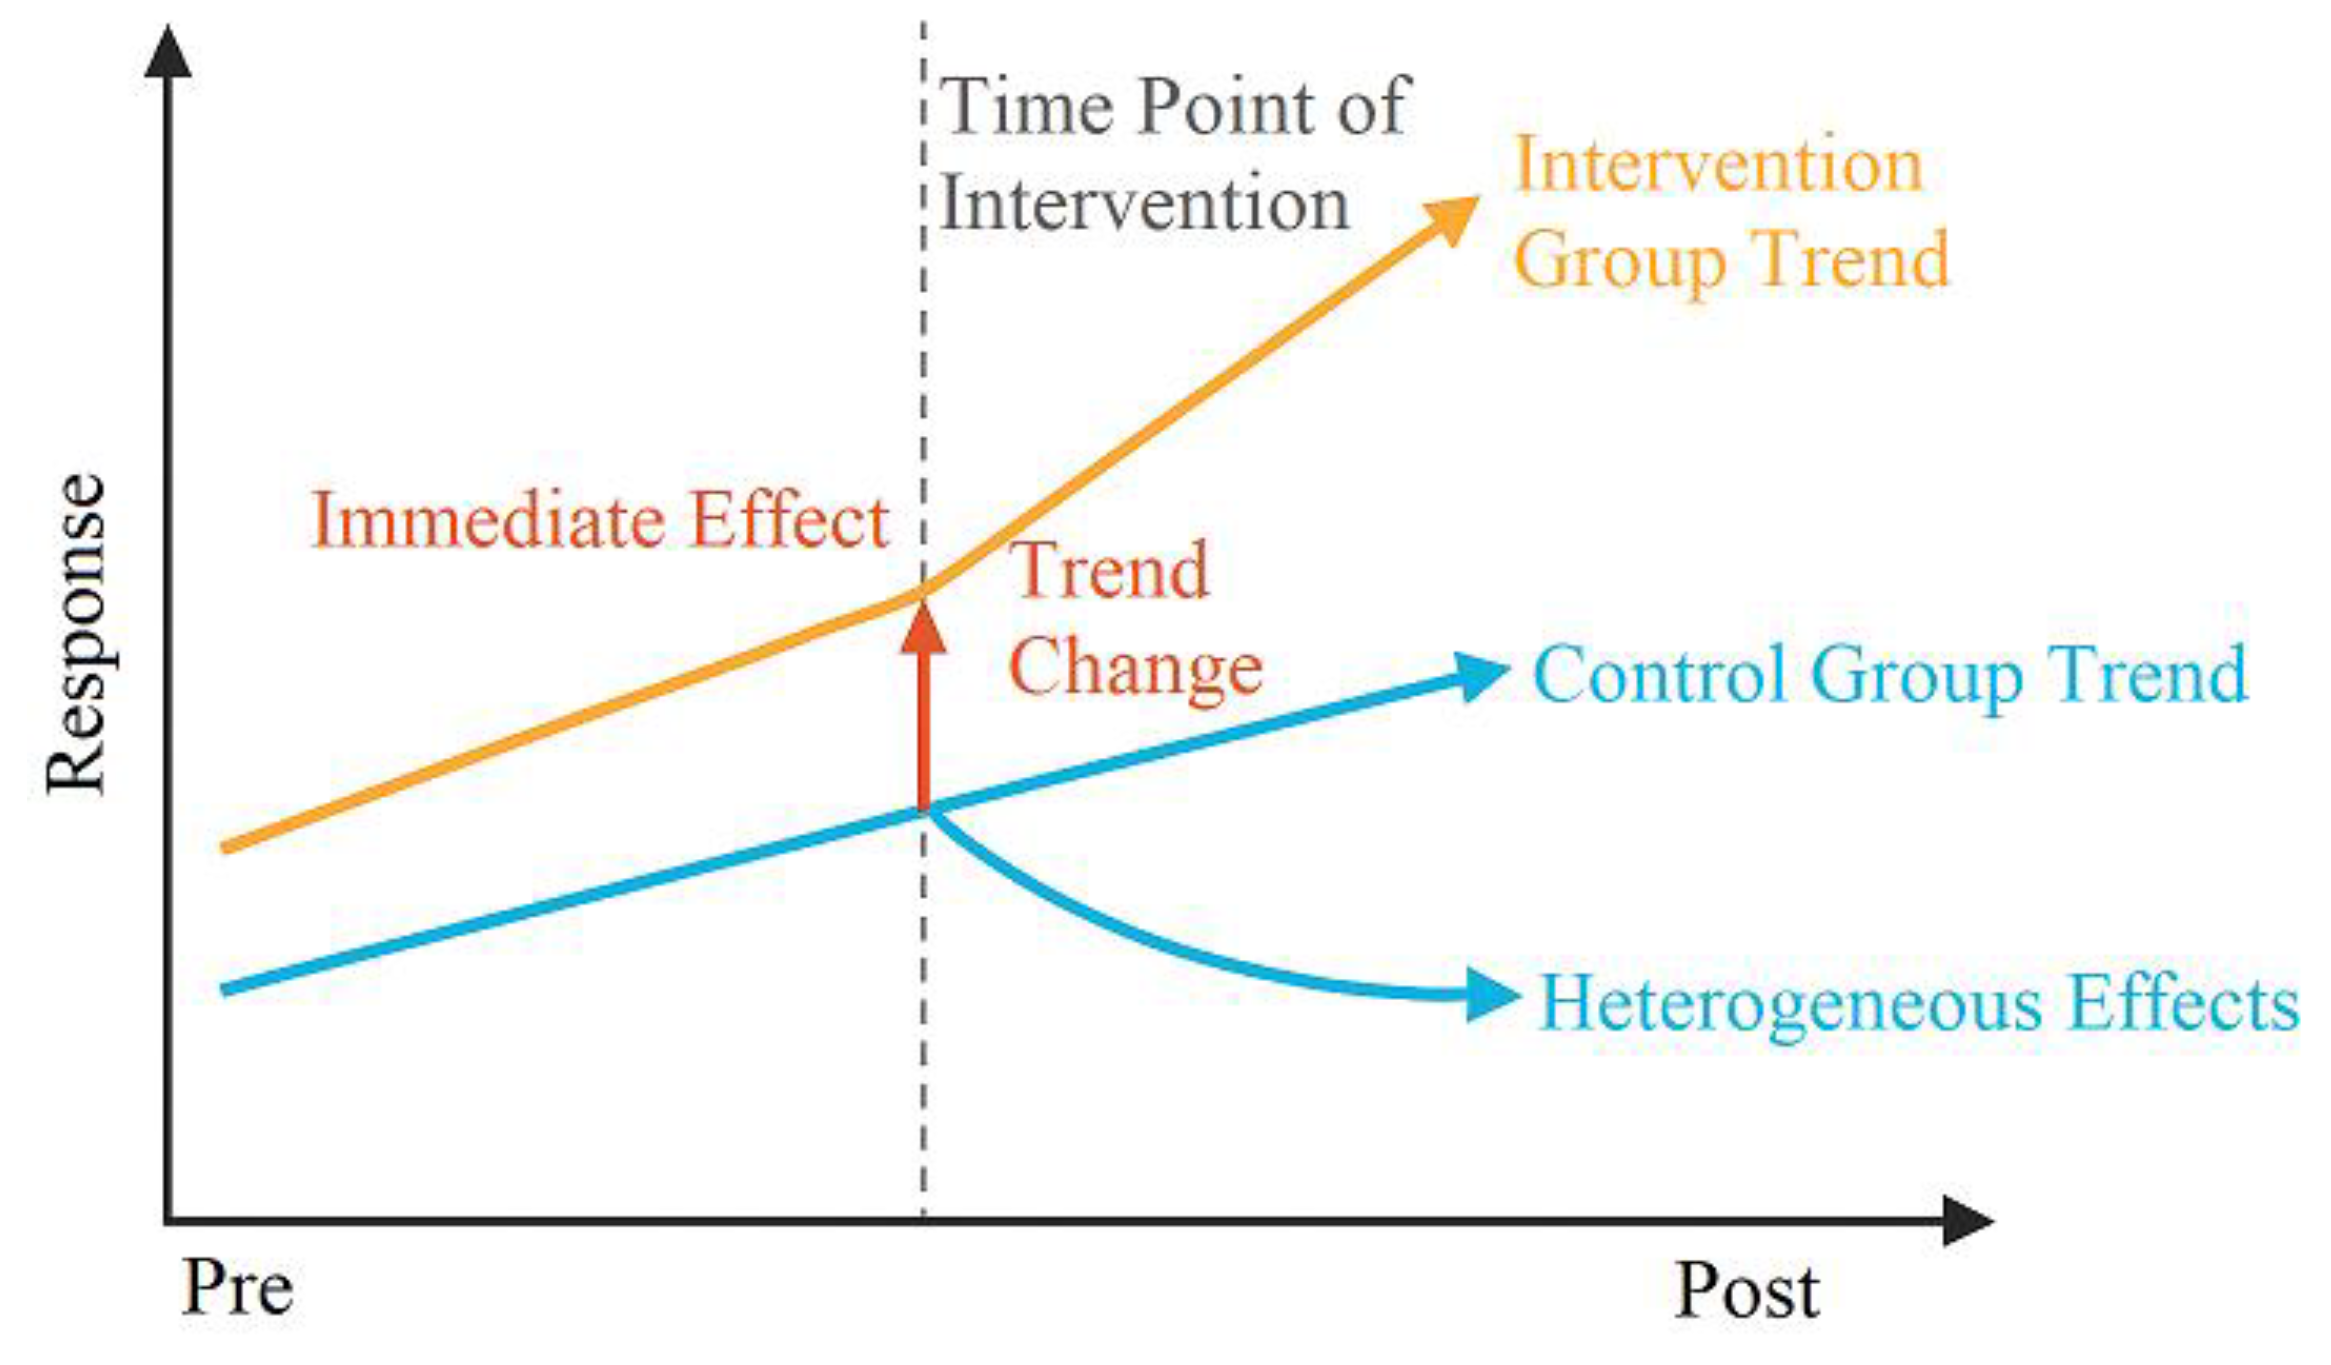
To identify the intervention effects of the digital compliance dashboard launch on key risk indicators, this study designs a causal evaluation framework combining interrupted time series (ITS) and double difference (DiD) methods (
Figure 2). It incorporates multidimensional response variables such as process deviation, anomaly scores, and risk event rates to capture both immediate effects and sustained trend changes [
7]. First, within an ITS model constructed under stationarity conditions, we employ Newey–West robust standard error correction for least squares estimation to effectively address autocorrelation and heteroskedasticity. The model structure is as follows:
where Yit represents the response indicator for firm i at time t, Postt is the dummy variable for Kanban implementation, and the interaction term β3 reflects trend changes. To control for firm heterogeneity and exogenous shocks, a panel model incorporating fixed effects and a double difference term was constructed. Abnormal alert intensity St and process deviation indicator Ct were included as mediating variables to validate the mechanism along the “exposure-response” pathway [
8]. All models employ rolling regression with 30-day sliding subsamples to assess robustness and provide a structural foundation for indicator analysis and path interpretation.
3. Empirical Results Analysis
3.1. Descriptive Statistics and Process Mining Findings
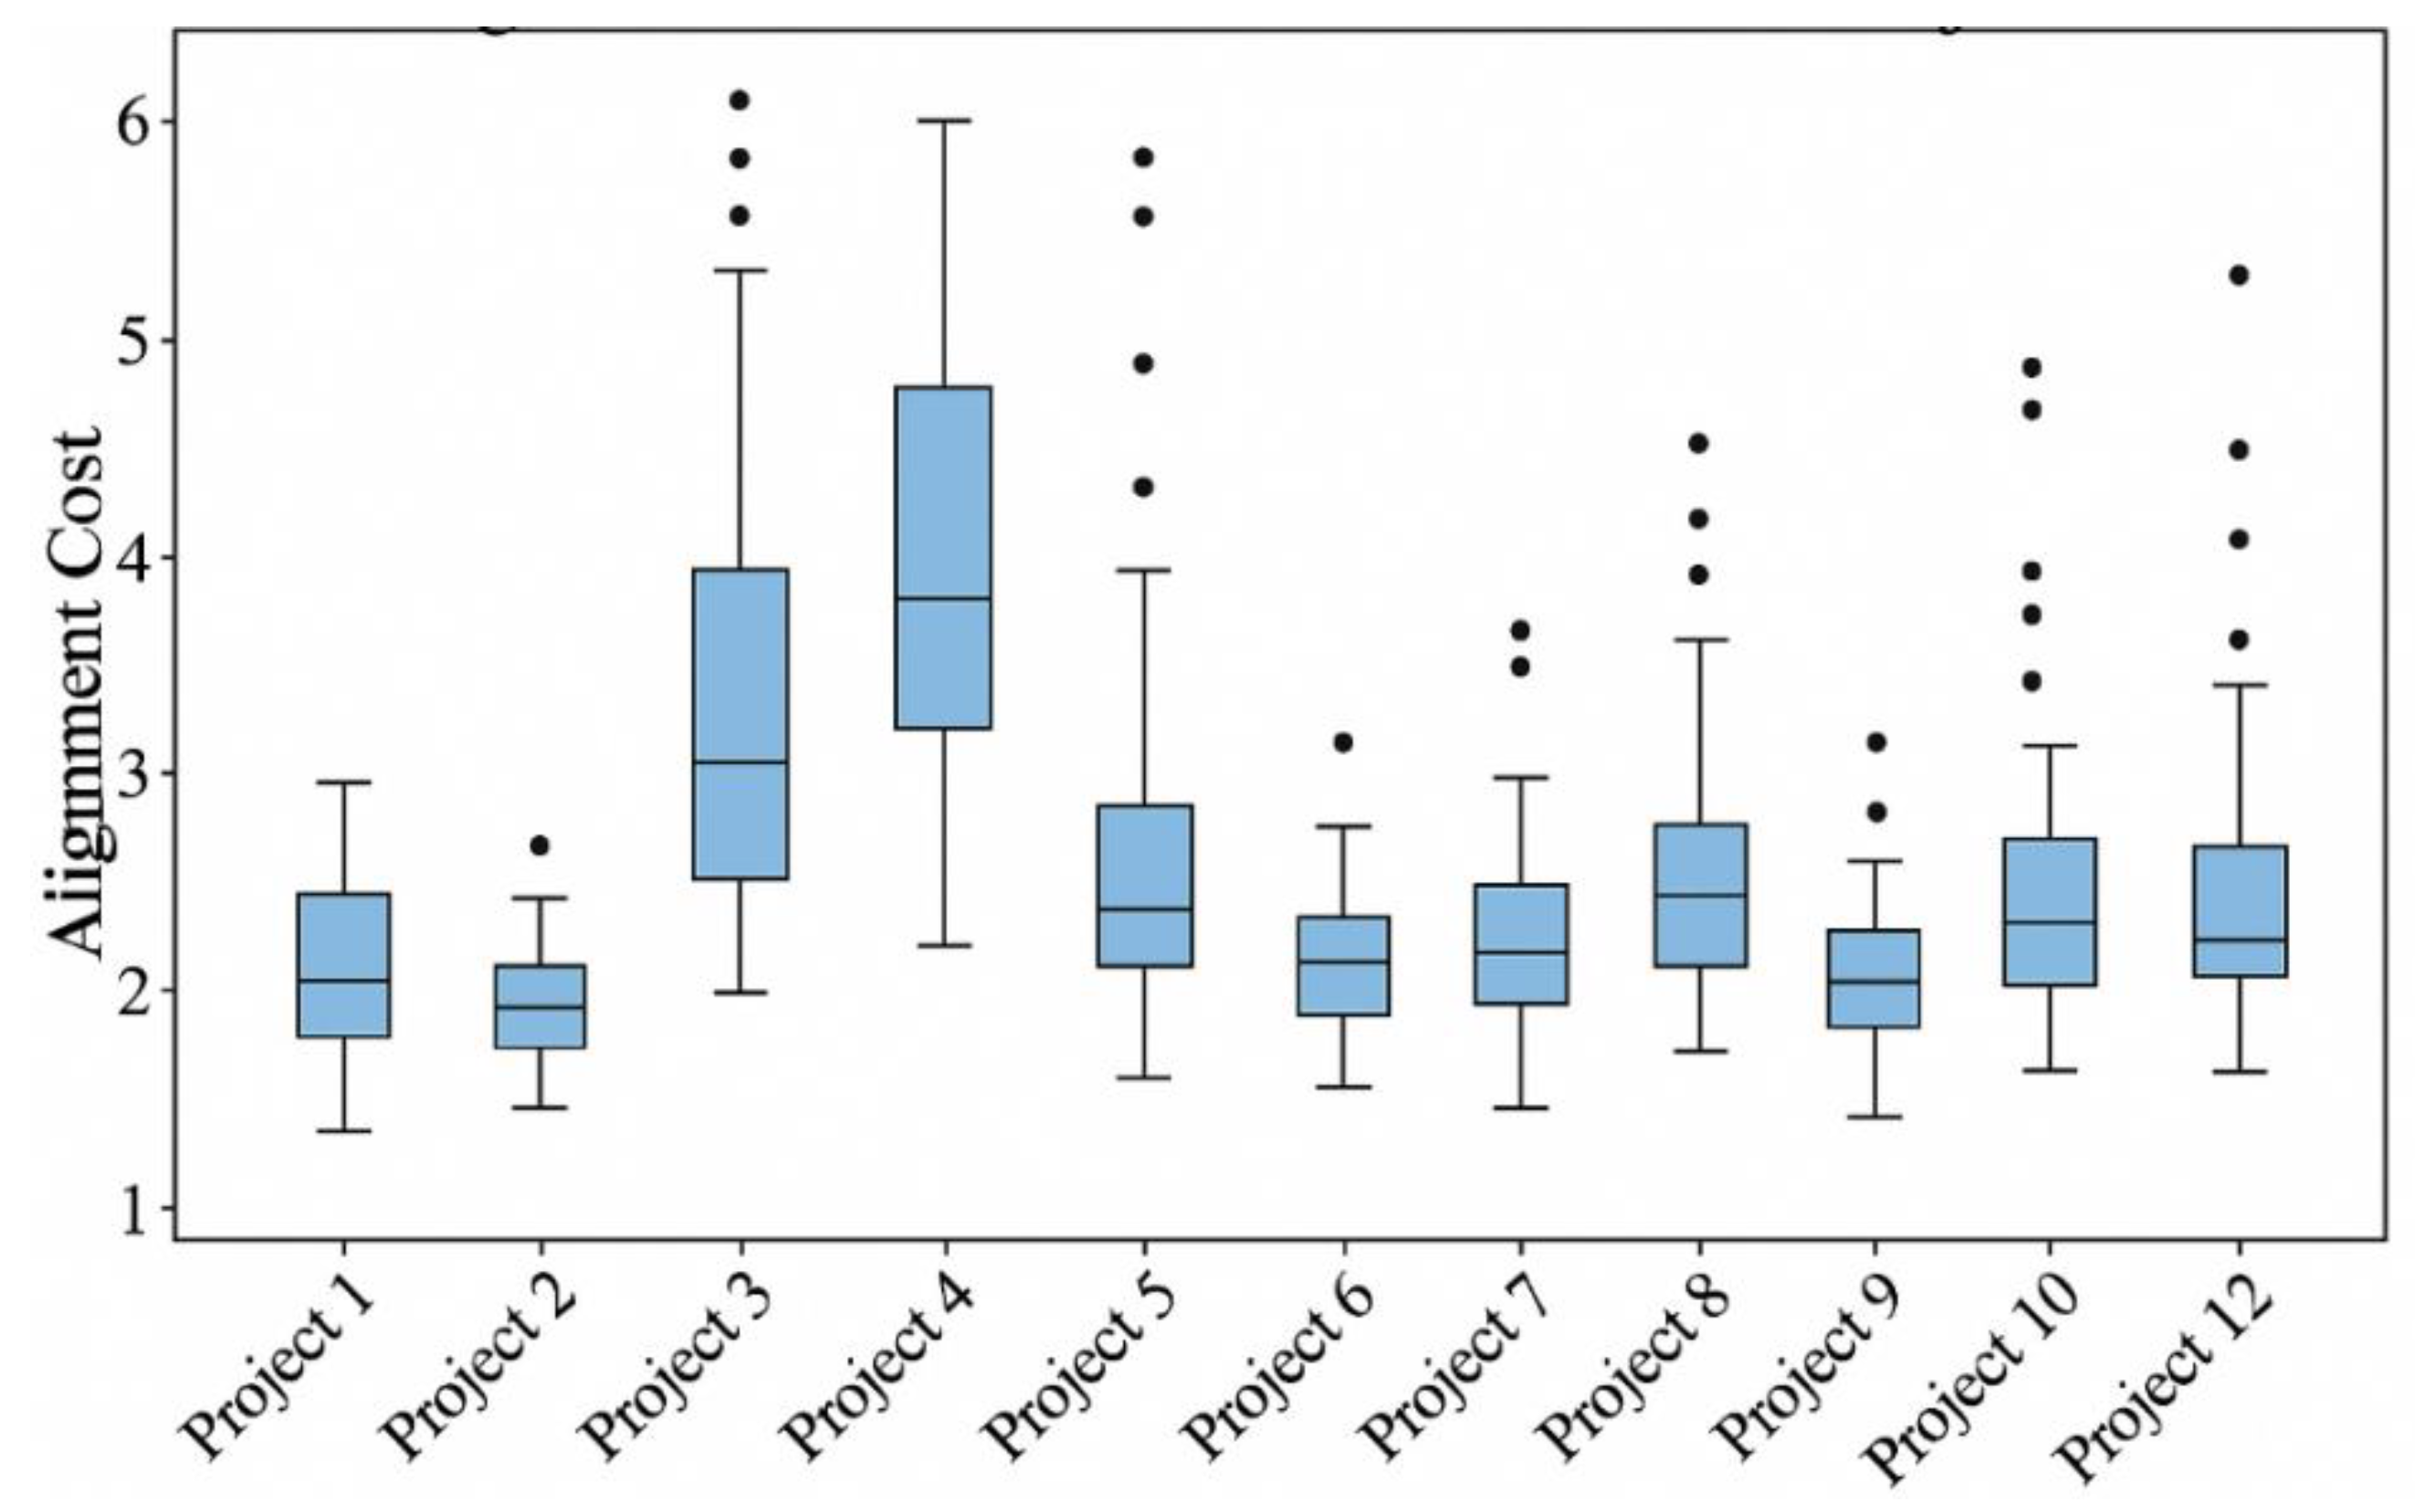
This study analyzes 11.03 million standardized event logs from 34 cross-border projects between 2018 and 2023, covering three core business processes: ERP operations, approval workflows, and maintenance tickets. To characterize the data foundation and process behavior distribution, we first provide statistical descriptions of fundamental attributes such as event duration, activity type, and number of resource nodes. Actual process diagrams reconstructed using Heuristics Miner and α-Miner algorithms were aligned with predefined BPMN models, calculating the Alignment Cost [
9] for each process instance. As shown in
Figure 3, median alignment costs were significantly elevated in some enterprise projects, indicating concentrated compliance deviations within multinational approval workflows. Specifically, common bypass behaviors in processes manifest as skipping “Review and Approval” nodes or advancing “Authorized Initiation” to upstream branches, significantly altering the topological structure of process paths. These deviation paths are systematically embedded into feature construction for subsequent anomaly detection models. They serve as critical input dimensions for judging whether transaction or process behaviors deviate from standards, while also providing behavioral foundations for intervention effect analysis.
3.2. Anomaly Detection Model Performance
To comprehensively evaluate the effectiveness of the multi-model anomaly detection framework, we conducted ablation experiments to isolate and compare the performance of individual components—namely, LSTM-Autoencoder (LSTM-AE) and Isolation Forest (IF)—against the full fusion model. Each model was trained and validated independently using the same cross-enterprise stratified dataset split (70% training, 30% validation), with consistent labeling criteria derived from manual audit annotations and process deviation flags.
Table 1 presents the comparative results of four configurations: (1) LSTM-AE alone, (2) Isolation Forest alone, (3) XGBoost-based risk scorer without fusion, and (4) the full fusion model combining calibrated outputs from LSTM-AE, Isolation Forest, and process mining features. The fusion model significantly outperformed standalone models, particularly in PR-AUC (0.62 vs. 0.56 for LSTM-AE and 0.48 for IF) and true positive rate (TPR@95% recall improved from 0.79/0.74 to 0.87). This confirms that the collaborative model achieves a real gain in detecting sparse and behaviorally diverse anomalies. Moreover, component-wise attribution analysis revealed that the fusion architecture can dynamically adjust weights depending on anomaly types. For instance, in approval-skipping scenarios, Isolation Forest’s path length score was dominant, while in timeout-related anomalies, LSTM-AE reconstruction error contributed more significantly. This differentiated contribution enables interpretable alert generation and explains the performance gain beyond naive ensemble averaging. Nevertheless, it should be noted that while the fusion model achieved a relatively high AUC of 0.87, the PR-AUC remained at 0.62, indicating suboptimal performance in scenarios with significant class imbalance. This suggests that the model’s detection capability under skewed positive-negative sample distributions is still constrained. To address this limitation, future work will explore integrating imbalance-aware strategies such as focal loss, instance-weighted cost-sensitive learning, or synthetic oversampling techniques (e.g., SMOTE) into the model training pipeline. Additionally, adaptive thresholding methods based on risk distribution density may further enhance early-warning sensitivity without sacrificing precision. These enhancements aim to improve the model’s robustness across diverse anomaly patterns and sample distributions.
3.3. Intervention Effects of the Digital Compliance Dashboard
Using a combined framework of interrupted time series and double difference analysis, the launch date serves as the breakpoint. The treatment group comprises enterprises/projects that have launched the system, while the control group consists of industry peers that have not yet launched or delayed implementation. Abnormal exposure intensity (St) and process deviation (Ct) are incorporated into the panel regression to control for channel effects.
Table 2 presents core estimates corresponding to γ and δ: compliance issue detection efficiency increased by 42%, process transparency scores rose by 29%, and operational risk incident rates decreased by 36%. Regarding the “early warning lead time” metric, this study defines lead time (Lt) as the average time difference between the model-generated risk alert and the actual occurrence of a validated operational incident (e.g., rule violation, unresolved ticket escalation, or audit finding), as recorded in retrospective event logs. Specifically, we compute:
Where Talerti is the timestamp of the system-generated alert for case i, Tincidenti is the timestamp of the corresponding validated risk event, and N is the total number of alert-incident matched pairs. In cases where multiple risk types are involved (e.g., process bypass, SLA violations, anomalous access), the lead time is computed per category and then averaged. Across all 34 projects, the mean lead time was 5.6 days, with lower variance in approval-related anomalies (SD = 1.2 days) and higher variance in multi-hop service disruptions (SD = 3.4 days).
3.4. Robustness Tests
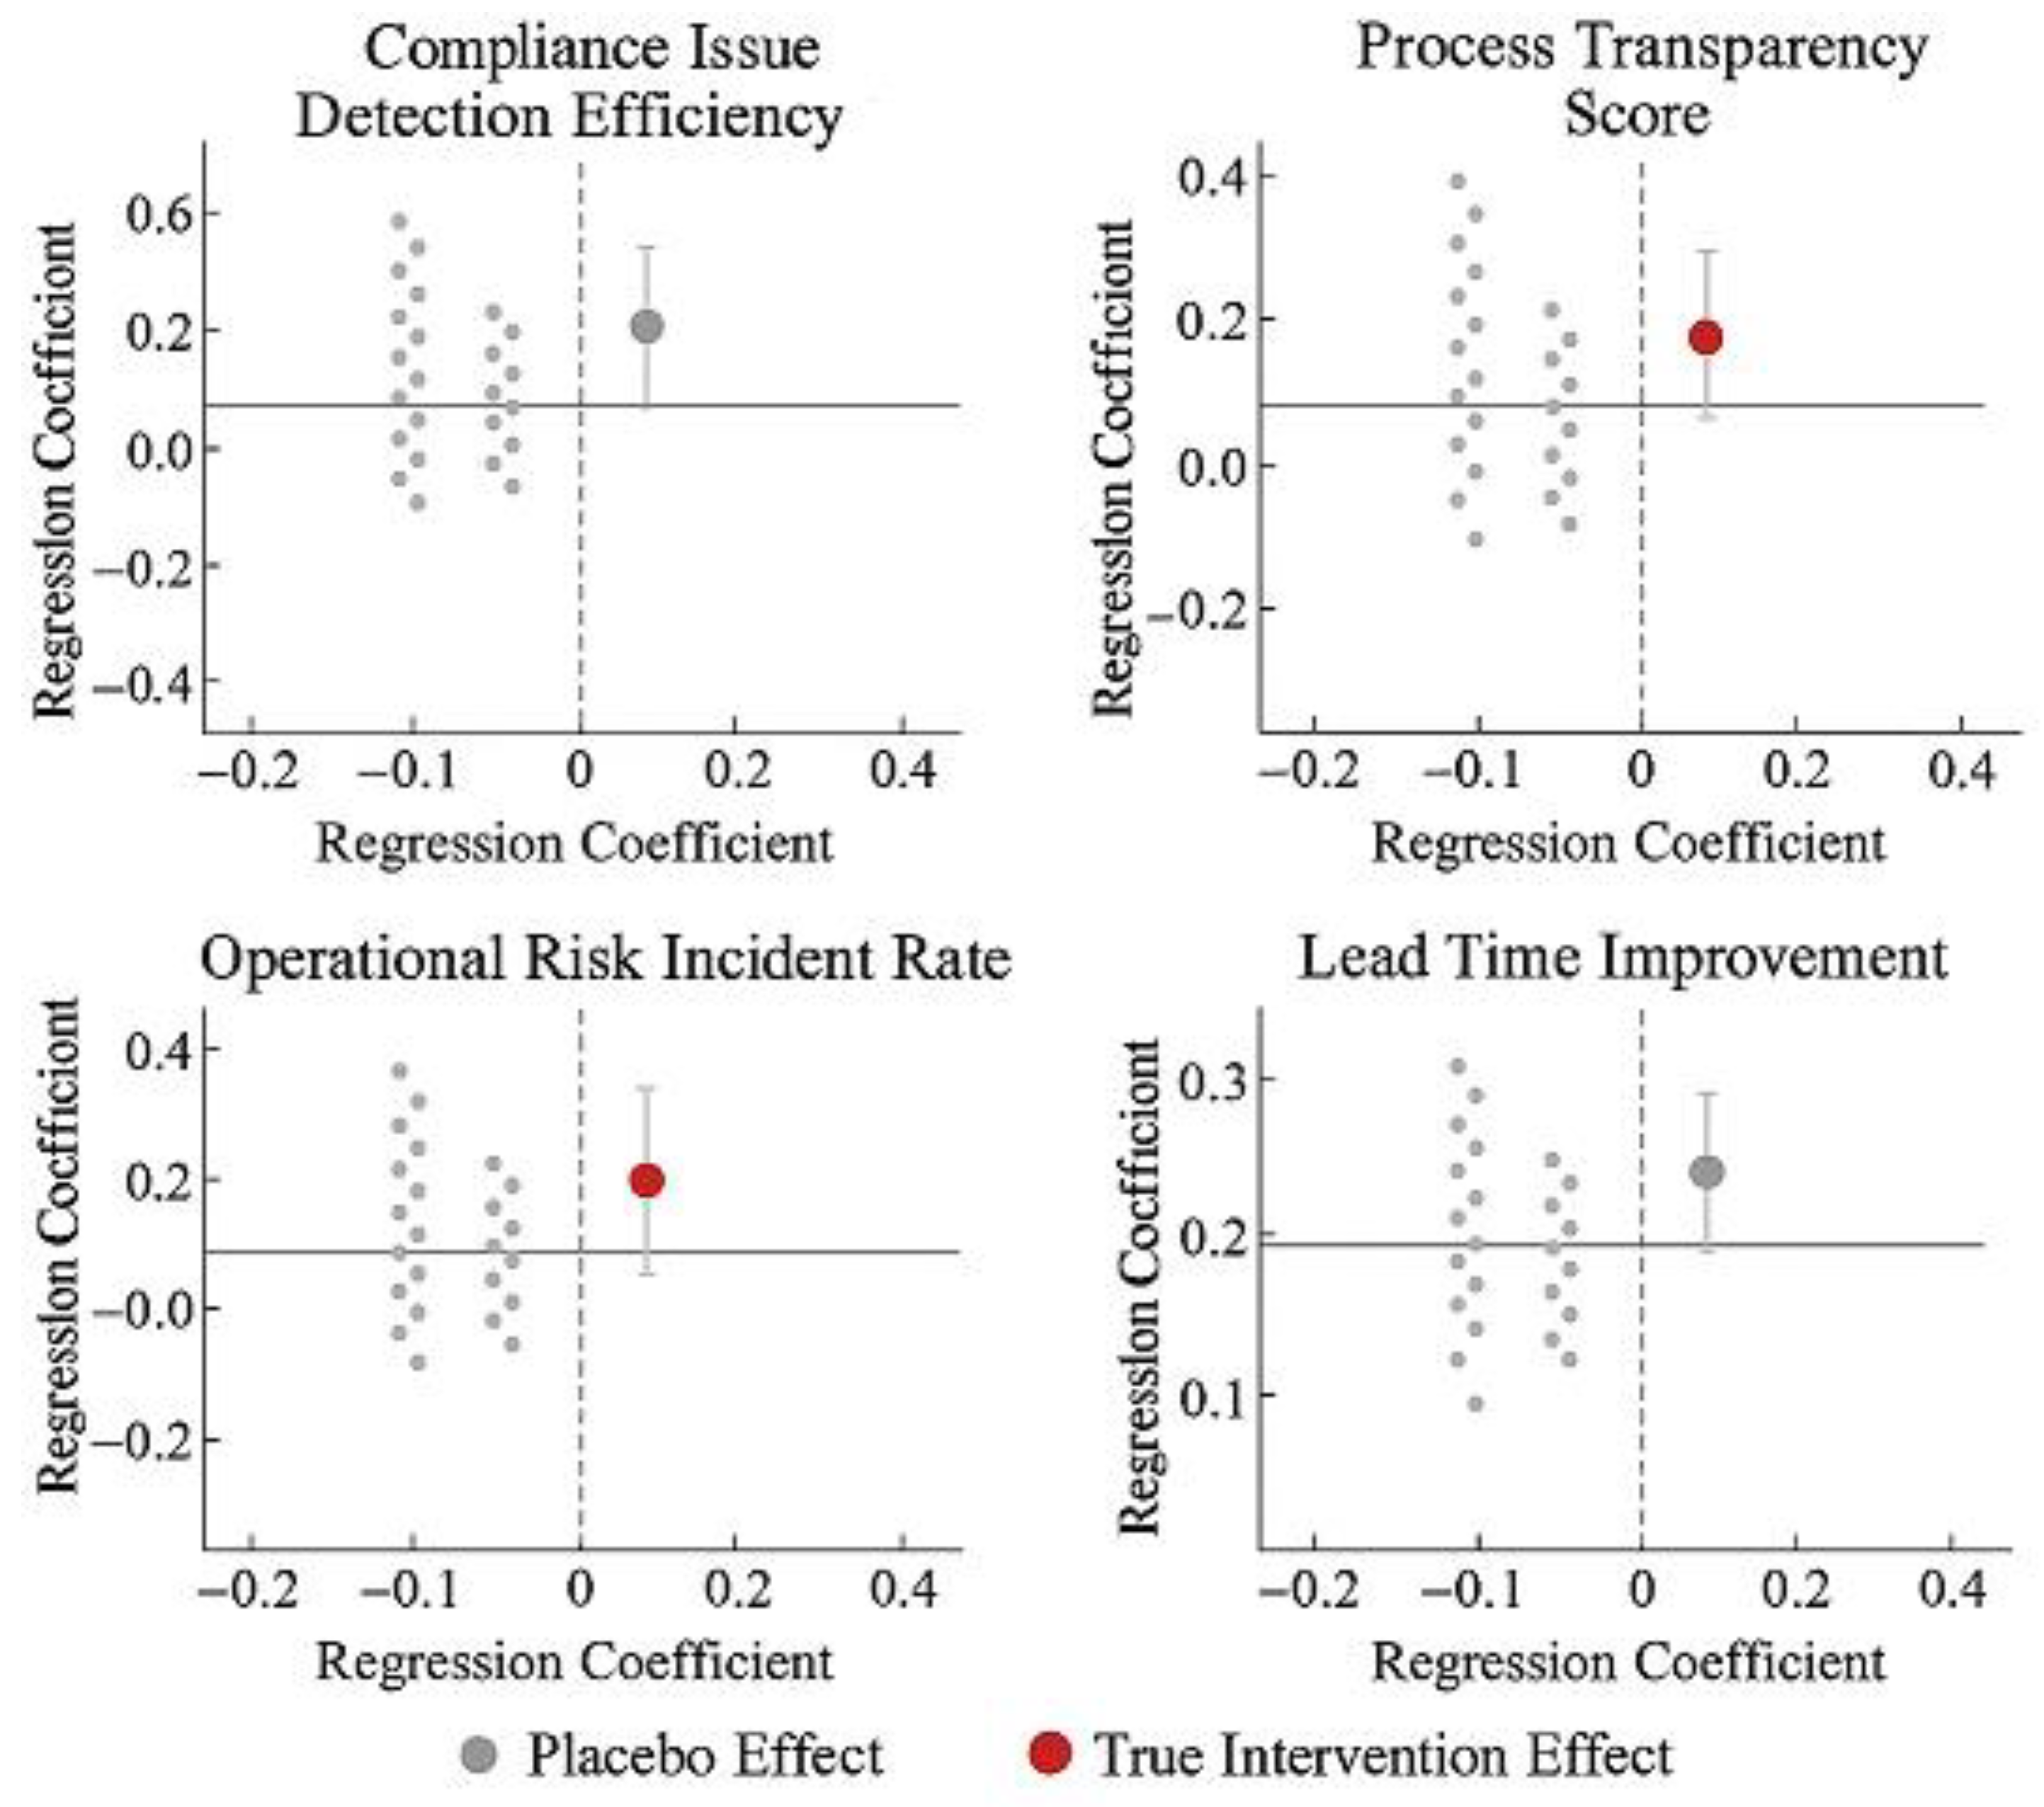
To ensure methodological robustness and structural stability in identifying the causal effects of kanban interventions, a multi-strategy test was introduced to rule out potential model specification errors and misinterpretation of time trends. First, replacing the original ITS+DiD regression framework with a log-linear model and generalized estimating equations (GEE) yielded consistent results in both direction and significance, indicating that core conclusions are independent of specific model structures. Second, extending the intervention window to include the period immediately preceding and following the launch (±2 periods) maintained coefficient significance, validating the time-lag robustness of the intervention effect. Furthermore, constructing multiple sets of “pseudo-intervention” timepoints and running regressions revealed that their corresponding coefficients did not significantly deviate from zero, supporting the validity of the breakpoint identification that “only genuine interventions produce behavioral changes.”
Figure 4 compares regression coefficients between the main model and pseudo-timepoint tests. The four KRI categories show concentrated deviations at the actual launch point, while coefficients at non-intervention timepoints exhibit non-systematic fluctuations, further reinforcing the structural credibility of the event-driven mechanism.
4. Conclusions
The digital compliance dashboard demonstrates pronounced real-time risk control effects across multi-enterprise heterogeneous process environments, establishing a closed-loop governance mechanism spanning log collection, process deviation identification, anomaly detection, and causal feedback. The integrated methodology combining process mining, consistency analysis, and multi-model anomaly scoring not only enhances process transparency and compliance identification efficiency but also provides structural support for causal identification between intervention actions and risk events. Research innovations include unified quantification of compliance deviation and anomaly exposure intensity, alongside synergistic modeling of ITS and dual-difference models, significantly enhancing traceability and interpretability of risk control interventions. Limitations include model parameter sensitivity to corporate heterogeneity, which may be addressed by introducing domain-adaptive mechanisms to improve generalization. Additionally, expanding anomaly type label coverage and strengthening long-term tracking of behavioral rebound effects post-intervention are recommended to build a more sustainably responsive compliance risk monitoring system.
References
- Tadi, S. Process Mining Driven by Deep Learning for Anomaly Detection in Intelligent Automation Systems. Journal of Scientific and Engineering Research 2024, 11, 317–329. [Google Scholar]
- Hu, L. Hybrid Edge-AI Framework for Intelligent Mobile Applications: Leveraging Large Language Models for On-device Contextual Assistance and Code-Aware Automation. Journal of Industrial Engineering and Applied Science 2025, 3, 10–22. [Google Scholar] [CrossRef]
- Adekunle, B.I.; Chukwuma-Eke, E.C.; Balogun, E.D.; et al. Developing a digital operations dashboard for real-time financial compliance monitoring in multinational corporations. International Journal of Scientific Research in Computer Science. Engineering and Information Technology 2023, 9, 728–746. [Google Scholar]
- Cardoni, A.; Kiseleva, E.; De Luca, F. Continuous auditing and data mining for strategic risk control and anticorruption: Creating “fair” value in the digital age. Business Strategy and the Environment 2020, 29, 3072–3085. [Google Scholar] [CrossRef]
- Rane, J.; Chaudhari, R.A.; Rane, N.L. Time Monitoring. Enhancing Sustainable Supply Chain Resilience Through Artificial Intelligence and Machine Learning: Industry 4.0 and Industry 5.0 in Manufacturing, 2025: 73.
- Rahman, M.A.; Alam, M.S.; Mrida, M.S.H. How interactive dashboards improve managerial decision-making in operations management. American Journal of Advanced Technology and Engineering Solutions 2025, 1, 122–146. [Google Scholar] [CrossRef]
- Liang, S.; He, Y. Real-Time Operational Dashboards for Executive Leadership to Drive Agile Decision-Making in Multisite Health Systems. International Journal of Advanced Computational Methodologies and Emerging Technologies 2023, 13, 1–11. [Google Scholar]
- Le, T.D.; Le-Dinh, T.; Uwizeyemungu, S. Cybersecurity Analytics for the Enterprise Environment: A Systematic Literature Review. Electronics 2025, 14, 2252. [Google Scholar] [CrossRef]
- Limon, G.Q. Workforce analytics in manufacturing: A review of MIS tools for labor planning, absenteeism monitoring, and productivity optimization. Journal of Sustainable Development and Policy 2025, 1, 90–114. [Google Scholar] [CrossRef]
- Hasan, M.; Faruq, M.O. AI-Augmented Risk Detection in Cybersecurity Compliance: A GRC-Based Evaluation in Healthcare and Financial Systems. ASRC Procedia Global Perspectives in Science and Scholarship 2025, 1, 313–342. [Google Scholar] [CrossRef]
|
Disclaimer/Publisher’s Note: The statements, opinions and data contained in all publications are solely those of the individual author(s) and contributor(s) and not of MDPI and/or the editor(s). MDPI and/or the editor(s) disclaim responsibility for any injury to people or property resulting from any ideas, methods, instructions or products referred to in the content. |
© 2025 by the authors. Licensee MDPI, Basel, Switzerland. This article is an open access article distributed under the terms and conditions of the Creative Commons Attribution (CC BY) license (http://creativecommons.org/licenses/by/4.0/).