
Submitted:
19 October 2025
Posted:
20 October 2025
You are already at the latest version
Abstract
Mie voids have been recently demonstrated as a promising nanophotonic platform for light manipulation and optical sensing. Moreover, the detection volumes of Mie void cavities exceed those of optical nanoantennas, making them appropriate for low-concentration single-molecule fluorescence biosensing. However, the fluorescence enhancement quantification of diffusing molecules in such optical antenna systems has not been addressed. Here, we explore the Mie void ability to enhance single-molecule fluorescence of diffusing fluorophores AF647 with the help of fluorescence correlation spectroscopy. The optimized structure confines 635 nm laser light within a well-defined excitation volume in the Mie void and numerically promotes the excitation gain. We monitor the reduction of the number of molecules, signifying the detection volume reduction in the Mie void and an increase in single-molecule brightness up to 2.8 times. However, we reveal that the observed fluorescence enhancement appears limited owing to the azimuthally symmetric emission direction away from the optical axis when the molecules diffuse in the vicinity of the Mie-void entrance. Altogether, this study demonstrates exploration of Mie-void-based nanoantenna potential for single-molecule fluorescence spectroscopy applications.
Keywords:
fluorescence correlation spectroscopy
; fluorescence enhancement
; light confinement
; large mode volume
; confocal microscopy
1. Introduction
Single-molecule fluorescence spectroscopy provides unprecedented capabilities for the optical observation of molecules within a natural aqueous medium and under ambient conditions [1,2,3]. Specifically, the monitoring of fluorescence fluctuations from individual molecules represents an effective methodology for determining molecular concentrations [4] and for interrogating fast interaction and conformational dynamics [5,6]. Fluorescence correlation spectroscopy (FCS) facilitates the monitoring of numerous single-molecule events over the acquisition timeframe, enabling the capture and interpretation of the system’s most significant fluorescence fluctuations. FCS enables to determination number of molecules, sizes, and monitors binding interactions which could be potent as a pathology analysis method [7,8,9]. The efficacy of such single-molecule analyses would be significantly augmented by fluorescence enhancement, as it would permit faster event capture and reduce overall analysis time [10,11]. Currently, optical plasmonic nanoantennas are a well-established technology for achieving substantial fluorescence enhancement through the confinement of light within a localized “hot spot” [12,13,14,15,16,17,18]. A key advantage of these structures is their small optical mode volume, which is particularly advantageous for studying single molecules at high concentrations for molecular dynamics studies [19,20]. However, these nanoantenna configurations are subject to significant limitations, as the nanogap antennas typically exhibit considerable Ohmic losses due to the close proximity of the emitter to the metal surface [12,13,21,22]. Furthermore, the dimensions of the enhanced-field region or a “hot spot” are generally insufficient to accommodate large nanoparticles [23,24,25], as even zero-mode waveguide size typically resides at about 100 nm [13,22,26]. These constraints hinder the application of plasmonic nanoantennas in diffusion-based biosensing at the single-particle and single-molecule level, where a large detection volume and a low-loss resonator are often preferable for comprehensive analysis [27,28,29]. For example, achieving single-molecule sensitivity is critical for the accurate analysis of cargo molecules in extracellular vesicles like exosomes. Techniques such as fluorescence burst analysis require the precise determination of burst location with microsecond temporal accuracy [30,31] to validate the coincidence of events in multiple color channels. While large-mode volume photonic structures, such as photonic crystal cavities, offer an alternative for fluorescence enhancement [32,33], their implementation is often hampered by complex design and fabrication requirements, in addition to a typically narrow operational bandwidth. Hybrid plasmonic-dielectric systems feature potential for light manipulation within the nanoantennas with reduced fluorescence quenching [34]; however, typically, the cavities are still associated with nanometer-scale gap sizes [35,36].
In contrast, voids inside high-index dielectric materials, known as Mie-voids, present a class of resonant nanophotonic structures capable of confining light externally to the dielectric host medium due to refractive index contrast. Theoretically studied decades ago [37,38,39], Mie voids have recently re-emerged with experimental implementations in silicon [40] and van der Waals materials [41]. The presence of losses in the host medium results in drastic quality factor enhancement in the vicinity of resonance and, as a consequence, stronger light confinement within the voids. Utilization of high-loss materials naturally pushes the operational spectral range to UV. Alongside diameter- and depth-dependent resonant behavior, these unique properties make Mie voids a robust and multifaceted platform for manipulation of light-matter interactions, including applications in nanoscale color printing [40,42] and sensing [43]. With characteristic mode volumes on the order of a wavelength [43], they hold promise for emission-enhancing sensors with large detection volumes. However, their potential for boosting fluorescence, to the best of our knowledge, has yet to be experimentally realized.
In this work, we explore Mie voids as a novel class of optical antennas for single-molecule fluorescence sensing at an excitation wavelength of 635 nm. The confocal microscope’s focal spot was precisely aligned with the Mie void to efficiently couple the laser excitation. A moderate numerical aperture (NA=0.6) objective lens was utilized to simultaneously provide a large detection volume suitable for biosensing and fully cover the Mie void cavity by the focal beam. The designed Mie voids effectively confine light within their cavity when immersed in an aqueous solution containing fluorescent molecules or nanoparticles. Using fluorescence correlation spectroscopy (FCS), we confirm a significant reduction in the effective detection volume and a concomitant increase in single-molecule fluorescence brightness. The observed fluorescence enhancement reaches a factor of approximately 2.8 compared to a standard glass slide and 1.4 relative to a silicon reflecting substrate. These results, which account for the excitation gain, quantum yield gain, and the large confocal volume relative to the Mie void size, are in agreement with numerical simulations. Furthermore, we successfully extend the application of the Mie void platform to large emitters, including streptavidin-conjugated AF647 molecules and quantum dots. Altogether, these findings demonstrate the significant potential of Mie voids for fluorescence-enhanced biosensing applications down to the single-molecule level.
2. Materials and Methods
2.1. Design and Fabrication of Mie-Voids
The optimization of Mie voids has been carried out via FDTD simulation software. The Mie-voids are represented by nanowells on the silicon surface with a defined radius and depth. By monitoring the axial electric field profile inside the Mie void, we reveal the region of suitable geometries with a well-confined mode at the laser wavelength of 635 nm that dominates over other hot-spots near the silicon-water interface. In such a resonant structure, emission enhancement is mainly owing to (i) molecule absorption enhancement proportional to excitation field intensity, and (ii) Purcell emission enhancement stemming from the local density of optical states (LDOS) peak in the vicinity of a resonator. Therefore, the absorption enhancement and Purcell factor can be obtained directly by solving for quasi-normal modes (QNMs) of the void with eigenfrequencies within excitation and absorption regions, estimating field confinement from QNMs field patterns and Purcell enhancement via LDOS ratio ,
where is
the position of the molecule within the void, and
are
respectively LDOS with and without voids. LDOS, corresponding to an isotropic
emitter, can be obtained through the optical theorem as the imaginary part of
the trace of Green’s tensor. In turn, Green’s tensor can be obtained with
eigenmode decomposition. This approach allows relatively easy calculation of
absorption and emission enhancement as an eigenfrequency problem with PML
boundaries, and averaging over the void volume.
Silicon wafers with a resistivity of 0.005 Ohm‧cm have been utilized as a host medium for Mie voids, which can be easily visualized through scanning electron microscopy (SEM). The wafers are diced into 1 cm square silicon substrates with a side of 1 cm. Mie-voids have been carved with a focused-ion beam microscope combined with SEM (FIB-SEM, HELIOS 660). The FIB-SEM setup emits gallium ions at a current value of 18 pA. The correct current selection and the pressure minimization down to 10-5 Pa are required to make rather straight side walls with a constant diameter. The current values up to 89 pA produce smooth Mie void side walls, making the output geometry less predictable as well as textured side walls. Clusters of 3 by 3 Mie-voids with a pitch size of 10 μm have been prepared for the excitation/emission characteristics of our confocal fluorescence microscope and the AF647 benchmark fluorophores.
2.2. Single-Molecule Detection Setup
The excitation light source is a continuous wave laser of 635 nm (Lasermasters). The laser light is filtered through a short-pass filter and then is reflected by a dichroic mirror (DM10-638LP, LBTEK) toward a stationary microscope body. The incident laser power is measured after the reflection from the dichroic mirror. A mounted objective lens (NA=0.6, air immersion, OPTO-EDU) is used to focus light into the fluorescent solution and the Mie voids. A 3-axis piezo stage (Nano-T225, MadCityLabs) is leveraged to accurately focus the beam onto a Mie void. The aqueous solution is prepared in the PDMS wells on top of the Mie void substrate and covered by a glass coverslip to prevent leakage. The fluorescence light is collected by the same objective lens and passes through a dichroic mirror, where the excitation and emission lines are decoupled. A long-pass filter (GCC-211106, Daheng Optics) and a band-pass filter 660 – 740 nm (GCC-203006, Daheng Optics) are incorporated to filter the target fluorescence emission and minimize the background noise level. The fluorescence light is spatially filtered via focusing light onto a pinhole of 80 μm with the tube lens (achromatic doublet with focal length of 200 mm, GCL-010606, Daheng Optics). Then, the light was collimated and tightly focused onto an active area of a single-photon counter (SPCM-AQRH, Excelitas). Photon time-tagged data are generated from TTL electrical pulses delivered from the single-photon counters to the time-tagging electronics module (Time Tagger Ultra Value, Swabian Instruments) with a time resolution of 42 ps. The module is synchronized with the piezo stage with a position-change marker signal to perform high-magnification imaging with nanometer-scale step sizes. The collected photon time-tagged data are analyzed and fitted in Python-based programs.
3. Results
The principle of the Mie-void sensor application is shown in Figure 1a. As molecules diffuse into the Mie void cavity, they experience enhanced excitation within the modal volume. The cavity’s geometry is optimized to support a single resonant mode, which serves to precisely define the effective detection volume. Notably, the confined mode is localized near the center of the cavity (Figure 1b, c), in contrast to plasmonic nanoantennas, where the hot spot is typically constrained to the metal surface. In such metallic structures, a substantial portion of energy is dissipated non-radiatively into the metal, which inherently limits the maximum achievable enhancement, particularly for emitters with high intrinsic quantum yield. Furthermore, the mode volume of the Mie void is sufficiently large to accommodate nano-objects several hundred nanometers in size, such as quantum dots, polymeric nanoparticles, or exosomes [30]. The simulated field distribution exhibits a characteristic electric dipole emission pattern. A significant fluorescence enhancement is anticipated for emitters within the Mie void when compared to both a standard glass substrate and a silicon reflecting surface. The fluorescence enhancement in the presence of the Mie void resonator is expected to be represented as [44]:
where – gain in collection efficiency, is excitation gain, – radiative rate enhancement, and denotes the total rate enhancement. Given that the total rate
in the absence of a resonator can be represented as , where is the non-radiative rate of the fluorescent emitter. The
excitation gain is considered to be identified via the intensity enhancement in
the confocal volume of a Mie void. Considering the light confinement averaged
across the Mie void volume, we deduce the excitation gain of 2.75. The Purcell
factor represents the metric of the influence on the radiative and
non-radiative rate enhancement which allows to deduce the quantum yield
enhancement of AF647 ()in the presence of a Mie void. Given the emission properties of the analyzed fluorophore (Figure 1d), the Purcell factor exhibits values up 1.6 above the excitation wavelength (Figure S1). Given the evolution of the quantum yield gain as a function of the Purcell factor we determined the quantum yield enhancement of about 1.12 times. As for the collection efficiency, we determine the ratio of maximum power of the z-propagating waves emitted by a dipole in the center of the Mie void mode volume and the above the silicon substrate (Figure 1e). The directionality of the emission is optimal for the collection by the objective lens when the dipole is within the mode volume (Figure S2). The collection efficiency gain is verified through sweeping the strictly upward emission for dipole in mesh nodes within the Mie void volume. The collection efficiency at the cavity entrance drops drastically, and recovers slowly upon the dipole lifting above the Mie void. Considering large detection volume constrained by the microscope point spread function size and the pinhole-based spatial filtering, the overall fluorescence enhancement that experimentally we could detect can be approximated by ~3 times as compared to the glass slide reference.
The optimal geometrical parameters for the Mie void consist of a depth of 480 nm and a radius of 450 nm. This size is sufficient to accommodate most exosomes found in biofluids—though not larger entities such as microvesicles or apoptotic bodies—thereby functioning as a large-mode-volume resonator capable of achieving a low molar limit of detection in optical single-molecule sensing. Focused ion beam (FIB) patterning was used to accurately control the size and depth of the Mie voids and to fabricate arrays suitable for statistical analysis (Figure 2a). The actual dimensions of the fabricated structures averaged 447 nm in radius and 488 nm in depth (Figure 2b). These are further characterized using optical microscopy. For single-molecule fluorescence measurements, a 500 pM solution of AF647 was deposited onto the Mie void substrate. A moderate numerical aperture (NA = 0.6) objective lens is employed to focus the excitation light and collect emission from the confocal volume. A pinhole placed in the conjugate plane of the detection path provided spatial filtering (Figure 2c). Although a higher-NA objective would offer greater sensitivity, the resulting reduction in detection volume increases the limit of detection, making such configurations less suitable for sensing at pM or fM concentrations [45]. A 635 nm laser beam is focused through the sample onto the silicon interface. Using a piezo nanopositioning stage, individual Mie voids are located by identifying global changes of AF647 fluorescence signal in the Mie void center.
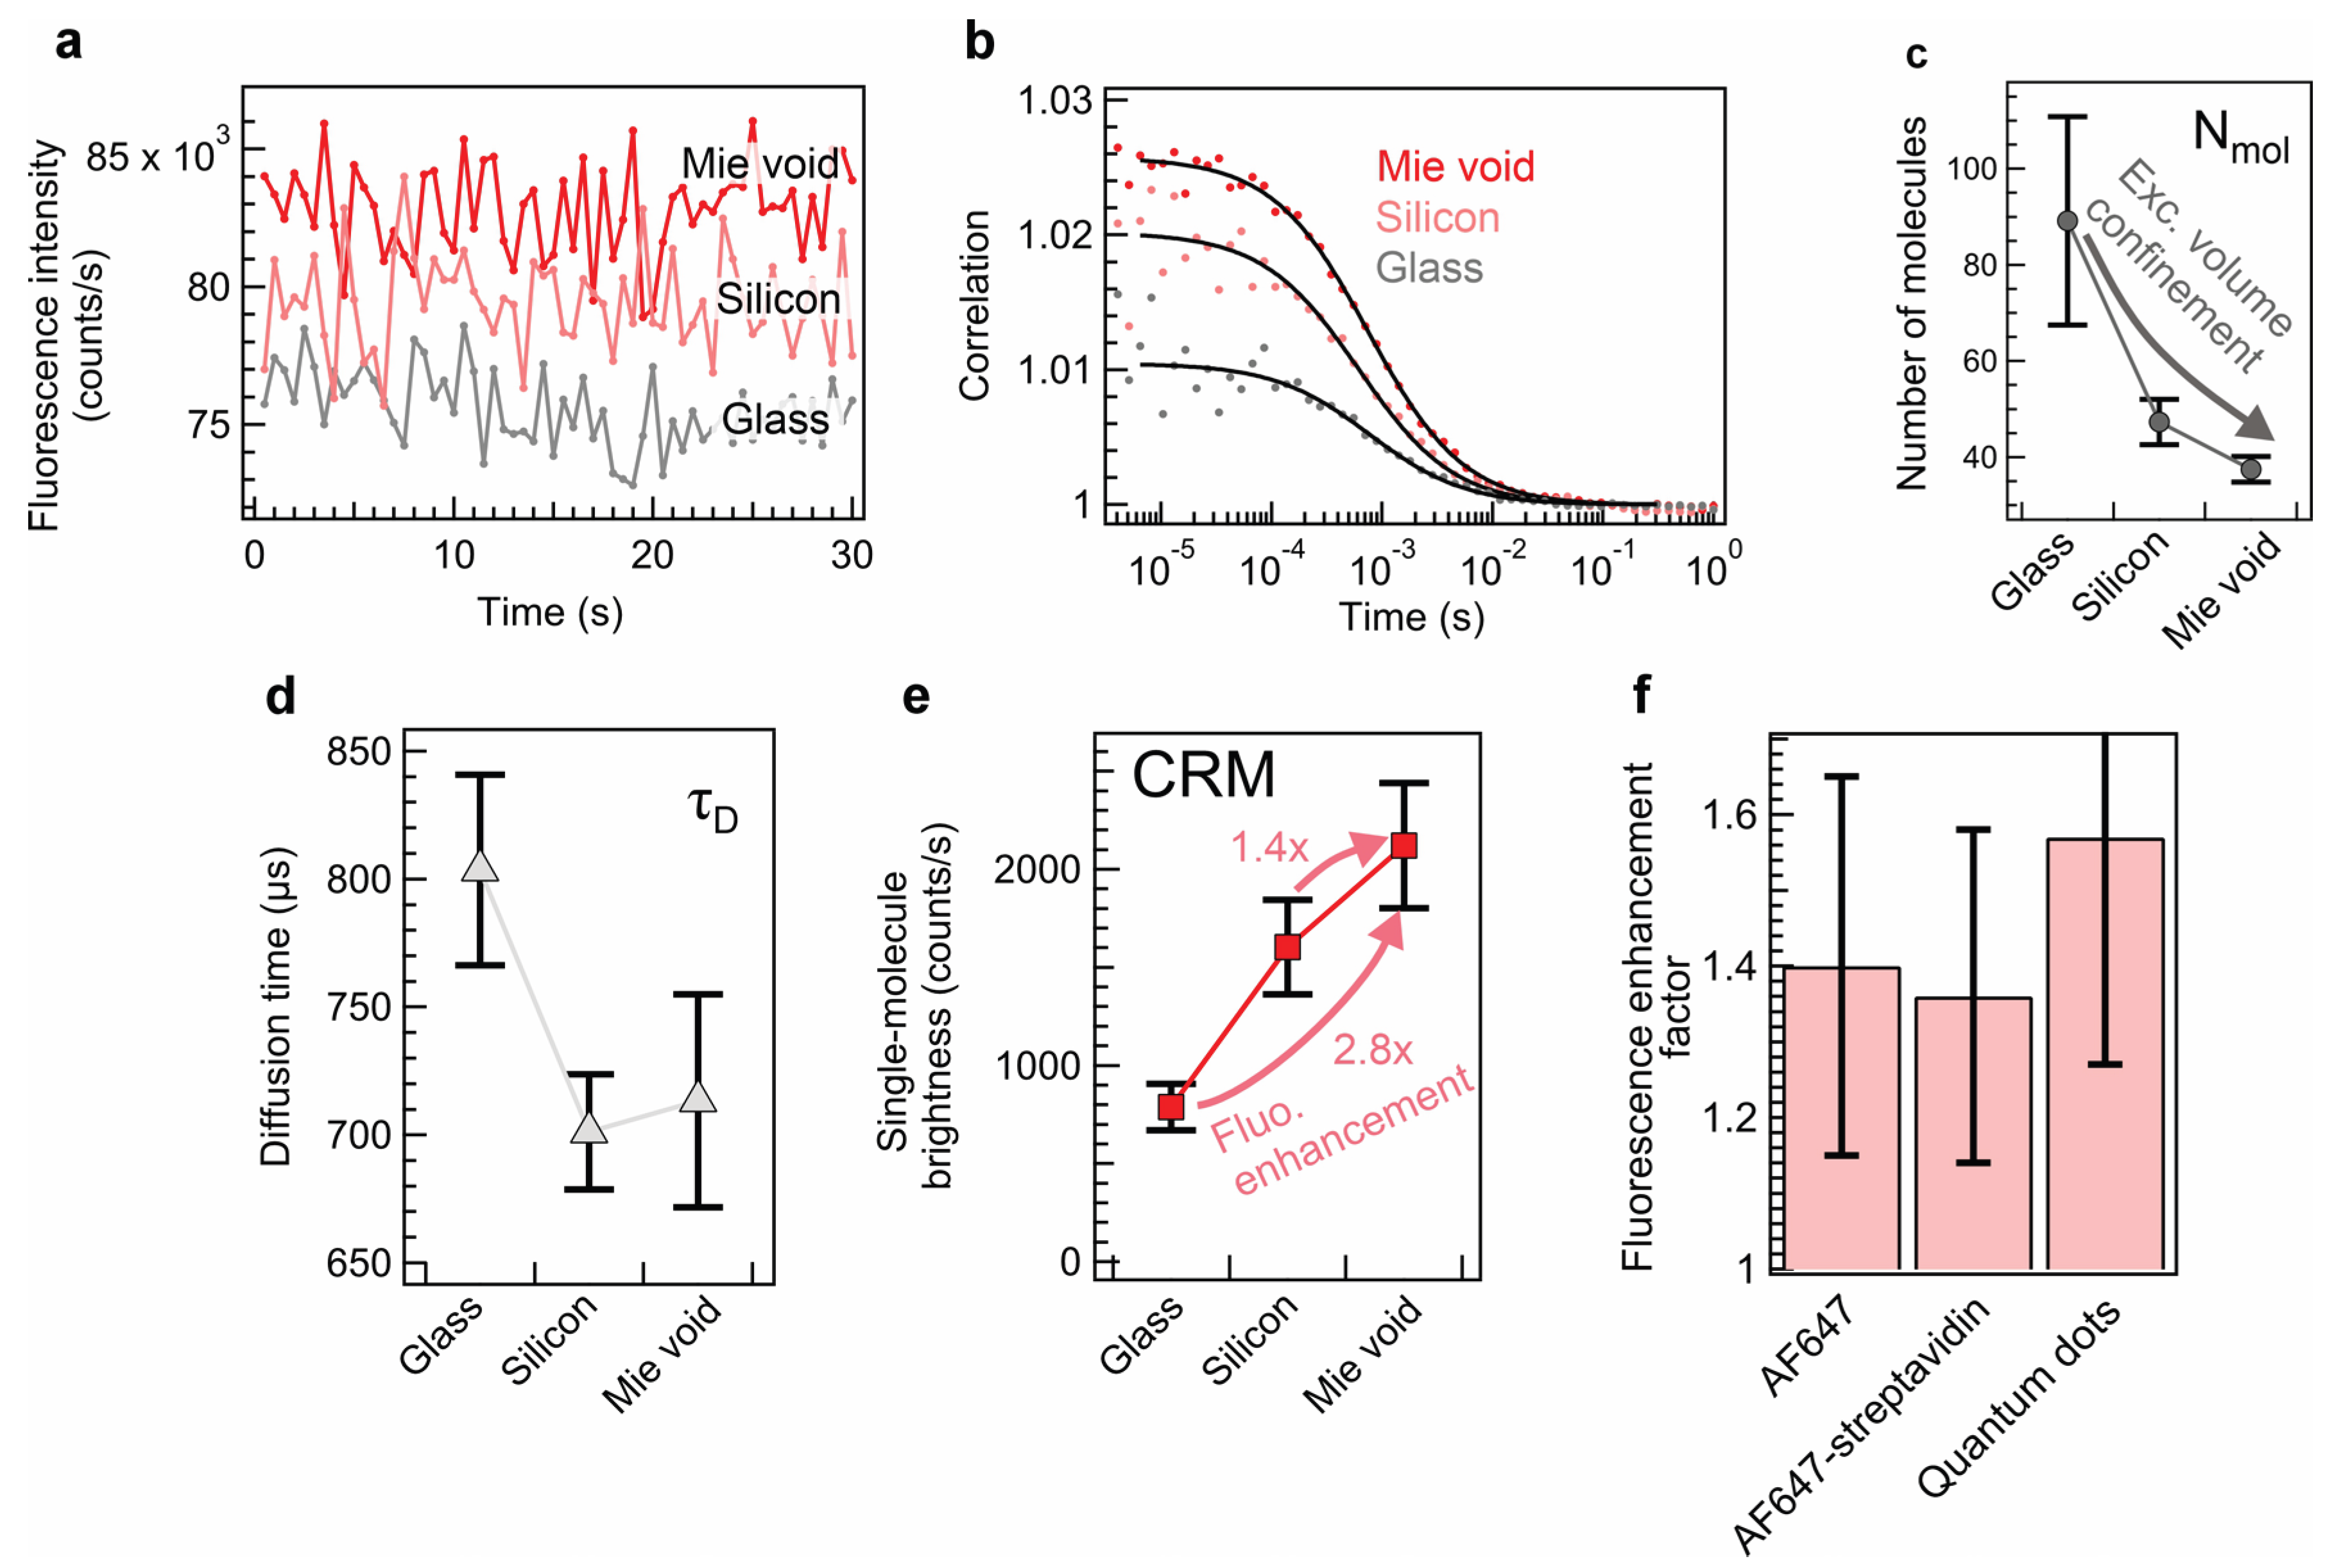
The photon time-tagged data are recorded by the time tagging electronics module connected to a single-photon avalanche diode. The fluorescence time traces of AF647 diffusing though the Mie void demonstrates higher average intensity as compared to the case of focusing onto the bare silicon interface (Figure 3a). Moreover, silicon interface seems to enable higher fluorescence intensity as compared to conventional glass slide case, because of the collection efficiency gain in fluorescence back reflection by silicon (reflectance of ballistic photons of ~62% within the detection band). We compute the autocorrelation function from the photon time-tagged data to monitor the diffusion of AF647 molecules through the detection volume as follows:
Where – is the lag time values, F(t) – fluorescence intensity as a function of time, while brackets 〈 〉 denote the average operator. In the case of a Mie-void, we monitor the increase of the autocorrelation amplitudes at near-zero lag times for the same molecule concentrations, which corresponds to the shrinkage of the mode volume within the Mie-void cavity (Figure 3b). Also, the signal-to-noise ratio (SNR) of the autocorrelations increases as compared to the glass and silicon slide case. The autocorrelation SNR is proportional to single-molecule brightness as follows [46]:
CRM stands for count rate per molecule (single-molecule brightness), T – acquisition time, ∆τ – time channel width, – number of fluorescent molecules present in the detection volume, and B is background noise intensity. The background noise intensity doesn’t exceed 5% of the total fluorescence signal (); therefore, we omit the influence of the background in the further experimental analysis. Therefore, the reduction of autocorrelation function noise serves as a confirmation of the single-molecule brightness enhancement in the presence of the Mie void cavity. We fit the autocorrelation functions by the 3D Brownian diffusion model as follows:
with being the diffusion time, is the detection volume aspect ratio. The FCS-determined number of molecules represents an effective metric to assess either the molecule concentration or the detection volume. When the silicon substrate is used, the number of molecules reduces as the measurement effectively occurs exactly at the reflective interface with present light confinement at the surface (Figure 3c). While in the case of a Mie void, the light is further confined within the void cavity, leading to further reduction of AF647 molecule number in the detection volume. Although the apparent Mie-void-induced detection volume reduction is about 30% as compared to bare silicon, the number of molecules within the inherent confocal volume still contributes significantly to the determined value. The diffusion time shows a decrease in the case of the silicon case as compared to free solution on a glass slide, which we attribute to the significant reduction of the detection volume dimension along the optical axis (Figure 3d). Mie void doesn’t seemingly reduce the diffusion time further as compared to the silicon substrate. We attribute this to slight deviation of stochastic 3D Brownian diffusion, as the molecules reaching the mode volume can linger at the well sides before they leave the cavity which leads to a slight slowdown of the diffusion. Nevertheless, it allows tracking the emitter presence longer time, which improves the accuracy of the analysis and doesn’t undermine the limit of detection. As FCS is an inherently single-molecule analysis relying on the fluorescence fluctuation monitoring within the mean signal, we can directly find the single-molecule brightness enhancement. CRM is deduced via the ratio of in the bulk of the fluorescence solution, at the silicon interface, and in the Mie void cavity. The single-molecule brightness is enhanced from 0.8 kcounts/s by 2 times in the presence of silicon. The Mie void adds an extra enhancement factor of 1.4 with respect to the silicon substrate (Figure 3e). One of the reasons for the moderate enhancement factor value seems to stem from the loss of the collection efficiency at the Mie-void entrance and above it (Figure S2). The emission pattern appears toroidal in the vicinity of the Mie void entrance, which is non-optimal for the efficient fluorescence collection. Whereas bare silicon exhibits ordinary emission when the dipole is placed above the interface. Experimentally, a majority of fluorophores within the confocal volume are present above the Mie void; therefore, their emission is preferentially sorted away from the optical axis direction. Such emission patterns lead to the reduction of the emission intensity outside the Mie void mode volume; the molecule emission detection efficiency might be dumped outside the mode volume, leading to bright edges and the center of the Mie void with the toroidal dip of the signal intensity in between (Figure S3). Moreover, we demonstrate that a similar enhancement factor can be maintained by measuring single-molecule brightness of streptavidin-AF647 conjugate biomolecule (size of ~5nm) and quantum dots of core-shell structure CdSe/ZnS of sizes ~10-20 nm (Figure 3f). Therefore, we demonstrate the experimental validation of fluorescence enhancement of non-quenched fluorophores in Mie voids with large mode volumes.
4. Discussion
In summary, we demonstrate a Mie-void antenna application for fluorescence enhancement of diffusing non-quenched fluorophores AF647 in aqueous solution. The size of the Mie-void is suitable to accommodate nanoparticles of a few hundred nanometers in size and induce an excitation gain within one intense wavelength-scale excitation volume at the laser wavelength. The Purcell factor enhancements within the band allow for accelerating the photodynamics of molecules and promoting the radiative rate. Additionally, the collection efficiency within the Mie void is enhanced in the vicinity of the Mie void, while the emitters above the Mie void undergo a drastic reduction of collection efficiency that diminishes the total fluorescence enhancement factor making the single-molecule fluorescence brightness similar to a bare silicon reference. Nevertheless, the single-molecule brightness remains significantly higher with respect to the glass reference. The large mode volumes, signal enhancement, and facile operation at pM concentrations make the platform rather applicable for biosensing applications of low-concentration or large objects, e.g., exosomes or plastic nanoparticles. Although plasmonic nanogap antennas exhibit substantially larger enhancement factors [47,48], the gap sizes appear too small for accommodating large nanoobjects, which could be relevant for sensing applications of organic and inorganic species. Moreover, nanogap antenna extremely confined mode volume makes them applicable for molecular dynamics monitoring at micromolar concentrations [19,49] rather than for low concentration sensing. We utilize a modest NA objective lens with about a 2 μm focal spot size. In principle, a higher NA objective lens could be employed to enhance excitation intensity and collection efficiency for single-molecule fluorescence, however the confocal volume should be still larger than the Mie void to preserve the enhancement effect occurrence and keep low limit of detection for the system. Altogether, Mie void antenna formalism enables an alternative single-molecule enhancement platform for characterization of large nanoobjects at ultimate sensitivity. The azimuthally symmetric emission at the Mie void entrance limits the fluorescence enhancement factor when measured from single diffusing molecules. Such methodology may be applied for precise single-molecule counting within single particles, or for fast fluorescent nanoparticle detection and characterization in the framework of precision medicine and environmental monitoring.
Author Contributions
Conceptualization, A.B., E.B., A.C.; methodology, A.B., I.K., D.B.; formal analysis, I.K., F.S., E.B., E.R.; investigation, F.S., A.B., I.K., E.R.; resources, A.B., A.C.; data curation, A.B., I.K.; writing—original draft preparation, all co-authors; writing—review and editing, all-co-authors; visualization, A.B., E.B., F.S.; supervision, A.B., A. C., D.B.; project administration, A.B. All authors have read and agreed to the published version of the manuscript.
Funding
This work was financially supported by the Ministry of Science and Higher Education of the Russian Federation (Agreement No. 075-15-2025-017).
Data Availability Statement
Data are contained within the article.
Conflicts of Interest
The authors declare no conflicts of interest.
References
- Cordes, T.; Blum, S.A. Opportunities and Challenges in Single-Molecule and Single-Particle Fluorescence Microscopy for Mechanistic Studies of Chemical Reactions. Nature chemistry 2013, 5, 993–999.
- Moerner, W.; Fromm, D.P. Methods of Single-Molecule Fluorescence Spectroscopy and Microscopy. Review of Scientific instruments 2003, 74, 3597–3619.
- Sahl, S.J.; Hell, S.W.; Jakobs, S. Fluorescence Nanoscopy in Cell Biology. Nature reviews Molecular cell biology 2017, 18, 685–701.
- Hwang, J.; Banerjee, M.; Venable, A.S.; Walden, Z.; Jolly, J.; Zimmerman, C.; Adkisson, E.; Xiao, Q. Quantitation of Low Abundant Soluble Biomarkers Using High Sensitivity Single Molecule Counting Technology. Methods 2019, 158, 69–76. [CrossRef]
- Patra, S.; Claude, J.-B.; Naubron, J.-V.; Wenger, J. Fast Interaction Dynamics of G-Quadruplex and RGG-Rich Peptides Unveiled in Zero-Mode Waveguides. Nucleic Acids Research 2021, 49, 12348–12357.
- Chowdhury, A.; Nettels, D.; Schuler, B. Interaction Dynamics of Intrinsically Disordered Proteins from Single-Molecule Spectroscopy. Annual review of biophysics 2023, 52, 433–462.
- Du Nguyen, D.; Shuklin, F.; Barulina, E.; Albitskaya, H.; Novikov, S.; Chernov, A.I.; Kim, I.; Barulin, A. Recent Advances in Dynamic Single-Molecule Analysis Platforms for Diagnostics: Advantages over Bulk Assays and Miniaturization Approaches. Biosensors and Bioelectronics 2025, 117361.
- Brown, J.W.P.; Bauer, A.; Polinkovsky, M.E.; Bhumkar, A.; Hunter, D.J.B.; Gaus, K.; Sierecki, E.; Gambin, Y. Single-Molecule Detection on a Portable 3D-Printed Microscope. Nature Communications 2019, 10, 5662. [CrossRef]
- Webb, W.W. Fluorescence Correlation Spectroscopy: Inception, Biophysical Experimentations, and Prospectus. Applied Optics 2001, 40, 3969–3983.
- Grabenhorst, L.; Sturzenegger, F.; Hasler, M.; Schuler, B.; Tinnefeld, P. Single-Molecule FRET at 10 MHz Count Rates. J. Am. Chem. Soc. 2024, 146, 3539–3544. [CrossRef]
- Tiwari, S.; Roy, P.; Claude, J.-B.; Wenger, J. Achieving High Temporal Resolution in Single-Molecule Fluorescence Techniques Using Plasmonic Nanoantennas. Advanced Optical Materials 2023, 11, 2300168. [CrossRef]
- Punj, D.; Mivelle, M.; Moparthi, S.B.; Van Zanten, T.S.; Rigneault, H.; Van Hulst, N.F.; García-Parajó, M.F.; Wenger, J. A Plasmonic ‘Antenna-in-Box’Platform for Enhanced Single-Molecule Analysis at Micromolar Concentrations. Nature nanotechnology 2013, 8, 512–516.
- Baibakov, M.; Barulin, A.; Roy, P.; Claude, J.-B.; Patra, S.; Wenger, J. Zero-Mode Waveguides Can Be Made Better: Fluorescence Enhancement with Rectangular Aluminum Nanoapertures from the Visible to the Deep Ultraviolet. Nanoscale Advances 2020, 2, 4153–4160.
- Bharadwaj, P.; Deutsch, B.; Novotny, L. Optical Antennas. Advances in Optics and Photonics 2009, 1, 438–483.
- Novotny, L. Effective Wavelength Scaling for Optical Antennas. Physical review letters 2007, 98, 266802.
- Novotny, L.; Van Hulst, N. Antennas for Light. Nature photonics 2011, 5, 83–90.
- Taminiau, T.; Stefani, F.; Segerink, F.B.; Van Hulst, N. Optical Antennas Direct Single-Molecule Emission. Nature photonics 2008, 2, 234–237.
- Akselrod, G.M.; Argyropoulos, C.; Hoang, T.B.; Ciracì, C.; Fang, C.; Huang, J.; Smith, D.R.; Mikkelsen, M.H. Probing the Mechanisms of Large Purcell Enhancement in Plasmonic Nanoantennas. Nature Photonics 2014, 8, 835–840.
- Flauraud, V.; Regmi, R.; Winkler, P.M.; Alexander, D.T.; Rigneault, H.; Van Hulst, N.F.; García-Parajo, M.F.; Wenger, J.; Brugger, J. In-Plane Plasmonic Antenna Arrays with Surface Nanogaps for Giant Fluorescence Enhancement. Nano letters 2017, 17, 1703–1710.
- Nüesch, M.F.; Ivanovic, M.T.; Claude, J.-B.; Nettels, D.; Best, R.B.; Wenger, J.; Schuler, B. Single-Molecule Detection of Ultrafast Biomolecular Dynamics with Nanophotonics. Journal of the American Chemical Society 2021, 144, 52–56.
- Barulin, A.; Claude, J.-B.; Patra, S.; Bonod, N.; Wenger, J. Deep Ultraviolet Plasmonic Enhancement of Single Protein Autofluorescence in Zero-Mode Waveguides. Nano Letters 2019, 19, 7434–7442.
- Baibakov, M.; Patra, S.; Claude, J.-B.; Moreau, A.; Lumeau, J.; Wenger, J. Extending Single-Molecule Forster Resonance Energy Transfer (FRET) Range beyond 10 Nanometers in Zero-Mode Waveguides. ACS nano 2019, 13, 8469–8480.
- Regmi, R.; Berthelot, J.; Winkler, P.M.; Mivelle, M.; Proust, J.; Bedu, F.; Ozerov, I.; Begou, T.; Lumeau, J.; Rigneault, H. All-Dielectric Silicon Nanogap Antennas to Enhance the Fluorescence of Single Molecules. Nano letters 2016, 16, 5143–5151.
- Jiang, Q.; Roy, P.; Claude, J.-B.; Wenger, J. Single Photon Source from a Nanoantenna-Trapped Single Quantum Dot. Nano Letters 2021, 21, 7030–7036.
- Gao, Q.; Zang, P.; Li, J.; Zhang, W.; Zhang, Z.; Li, C.; Yao, J.; Li, C.; Yang, Q.; Li, S.; et al. Revealing the Binding Events of Single Proteins on Exosomes Using Nanocavity Antennas beyond Zero-Mode Waveguides. ACS Appl. Mater. Interfaces 2023, 15, 49511–49526. [CrossRef]
- Barulin, A.; Roy, P.; Claude, J.-B.; Wenger, J. Ultraviolet Optical Horn Antennas for Label-Free Detection of Single Proteins. Nature Communications 2022, 13, 1842. [CrossRef]
- Skolrood, L.; Wang, Y.; Zhang, S.; Wei, Q. Single-Molecule and Particle Detection on True Portable Microscopy Platforms. Sensors and Actuators Reports 2022, 4, 100063.
- Macchia, E.; Torricelli, F.; Caputo, M.; Sarcina, L.; Scandurra, C.; Bollella, P.; Catacchio, M.; Piscitelli, M.; Di Franco, C.; Scamarcio, G. Point-Of-Care Ultra-Portable Single-Molecule Bioassays for One-Health. Advanced Materials 2024, 36, 2309705.
- Macchia, E.; Torricelli, F.; Bollella, P.; Sarcina, L.; Tricase, A.; Di Franco, C.; Osterbacka, R.; Kovacs-Vajna, Z.M.; Scamarcio, G.; Torsi, L. Large-Area Interfaces for Single-Molecule Label-Free Bioelectronic Detection. Chemical Reviews 2022, 122, 4636–4699.
- Sanaee, M.; Sandberg, E.; Ronquist, K.G.; Morrell, J.M.; Widengren, J.; Gallo, K. Coincident Fluorescence-Burst Analysis of the Loading Yields of Exosome-Mimetic Nanovesicles with Fluorescently-Labeled Cargo Molecules. Small 2022, 18. [CrossRef]
- Silva, A.M.; Lázaro-Ibáñez, E.; Gunnarsson, A.; Dhande, A.; Daaboul, G.; Peacock, B.; Osteikoetxea, X.; Salmond, N.; Friis, K.P.; Shatnyeva, O.; et al. Quantification of Protein Cargo Loading into Engineered Extracellular Vesicles at Single-vesicle and Single-molecule Resolution. J of Extracellular Vesicle 2021, 10, e12130. [CrossRef]
- Singh, A.; de Roque, P.M.; Calbris, G.; Hugall, J.T.; van Hulst, N.F. Nanoscale Mapping and Control of Antenna-Coupling Strength for Bright Single Photon Sources. Nano letters 2018, 18, 2538–2544.
- Xiong, Y.; Huang, Q.; Canady, T.D.; Barya, P.; Liu, S.; Arogundade, O.H.; Race, C.M.; Che, C.; Wang, X.; Zhou, L.; et al. Photonic Crystal Enhanced Fluorescence Emission and Blinking Suppression for Single Quantum Dot Digital Resolution Biosensing. Nature Communications 2022, 13, 4647. [CrossRef]
- Sun, S.; Li, M.; Du, Q.; Png, C.E.; Bai, P. Metal–Dielectric Hybrid Dimer Nanoantenna: Coupling between Surface Plasmons and Dielectric Resonances for Fluorescence Enhancement. The Journal of Physical Chemistry C 2017, 121, 12871–12884.
- Milichko, V.A.; Zuev, D.A.; Baranov, D.G.; Zograf, G.P.; Volodina, K.; Krasilin, A.A.; Mukhin, I.S.; Dmitriev, P.A.; Vinogradov, V.V.; Makarov, S.V. Metal-dielectric Nanocavity for Real-time Tracing Molecular Events with Temperature Feedback. Laser & Photonics Reviews 2018, 12, 1700227.
- Dmitriev, P.A.; Lassalle, E.; Ding, L.; Pan, Z.; Neo, D.C.; Valuckas, V.; Paniagua-Dominguez, R.; Yang, J.K.; Demir, H.V.; Kuznetsov, A.I. Hybrid Dielectric-Plasmonic Nanoantenna with Multiresonances for Subwavelength Photon Sources. ACS Photonics 2023, 10, 582–594.
- Mundy, W.; Roux, J.; Smith, A. Mie Scattering by Spheres in an Absorbing Medium. Journal of the Optical Society of America 1974, 64, 1593–1597.
- Vanecek, M.; Holoubek, J.; Shah, A. Optical Study of Microvoids, Voids, and Local Inhomogeneities in Amorphous Silicon. Applied physics letters 1991, 59, 2237–2239.
- Chen, C.-C. Electromagnetic Resonances of Immersed Dielectric Spheres. IEEE Transactions on Antennas and Propagation 1998, 46, 1074–1083.
- Hentschel, M.; Koshelev, K.; Sterl, F.; Both, S.; Karst, J.; Shamsafar, L.; Weiss, T.; Kivshar, Y.; Giessen, H. Dielectric Mie Voids: Confining Light in Air. Light: Science & Applications 2023, 12, 3. [CrossRef]
- Sarbajna, A.; Danielsen, D.R.; Casses, L.N.; Stenger, N.; Bøggild, P.; Raza, S. Encapsulated Void Resonators in Van Der Waals Heterostructures. Laser & Photonics Reviews 2025, 19, 2401215.
- Graydon, O. Mie Voids Generate Miniature Artworks. Nature Photonics 2023, 17, 133–133.
- Arslan, S.; Kappel, M.; Canós Valero, A.; Tran, T.T.H.; Karst, J.; Christ, P.; Hohenester, U.; Weiss, T.; Giessen, H.; Hentschel, M. Attoliter Mie Void Sensing. ACS Photonics 2025, 12, 3950–3958.
- Barulin, A.; Roy, P.; Claude, J.-B.; Wenger, J. Purcell Radiative Rate Enhancement of Label-Free Proteins with Ultraviolet Aluminum Plasmonics. J. Phys. D: Appl. Phys. 2021, 54, 425101. [CrossRef]
- Kayyil Veedu, M.; Wenger, J. Breaking the Low Concentration Barrier of Single-Molecule Fluorescence Quantification to the Sub-Picomolar Range. Small Methods 2025, n/a, 2401695. [CrossRef]
- Barulin, A.; Kim, I. Hyperlens for Capturing Sub-Diffraction Nanoscale Single Molecule Dynamics. Optics Express 2023, 31, 12162–12174.
- Punj, D.; Mivelle, M.; Moparthi, S.B.; Van Zanten, T.S.; Rigneault, H.; Van Hulst, N.F.; García-Parajó, M.F.; Wenger, J. A Plasmonic ‘Antenna-in-Box’Platform for Enhanced Single-Molecule Analysis at Micromolar Concentrations. Nature nanotechnology 2013, 8, 512–516.
- Kinkhabwala, A.; Yu, Z.; Fan, S.; Avlasevich, Y.; Müllen, K.; Moerner, W.E. Large Single-Molecule Fluorescence Enhancements Produced by a Bowtie Nanoantenna. Nature photonics 2009, 3, 654–657.
- Regmi, R.; Winkler, P.M.; Flauraud, V.; Borgman, K.J.; Manzo, C.; Brugger, J.; Rigneault, H.; Wenger, J.; García-Parajo, M.F. Planar Optical Nanoantennas Resolve Cholesterol-Dependent Nanoscale Heterogeneities in the Plasma Membrane of Living Cells. Nano letters 2017, 17, 6295–6302.
Figure 1.
Mie-voids for single-molecule fluorescence enhancement. (a) Scheme of Mie void accommodating single AF647 diffusing molecules within the mode volume. (b) Simulation results of the intensity enhancement within the Mie-void in the XZ plane. The incident plane wave is polarized along the X-axis. (c) Simulation results of the intensity enhancement within the Mie-void in the XY plane indicated by the dashed line in panel (b). The results of (a) and (b) are represented for a 635 nm wavelength. (d) Absorbance and fluorescence spectrum of AF647. The gray line designates the employed laser wavelength, while the shaded region corresponds to the detection band of the fluorescence. (e) Computed enhancement factors, including excitation gain, quantum yield gain within the detection band, and collection efficiency gain, when averaged across the Mie void volume.
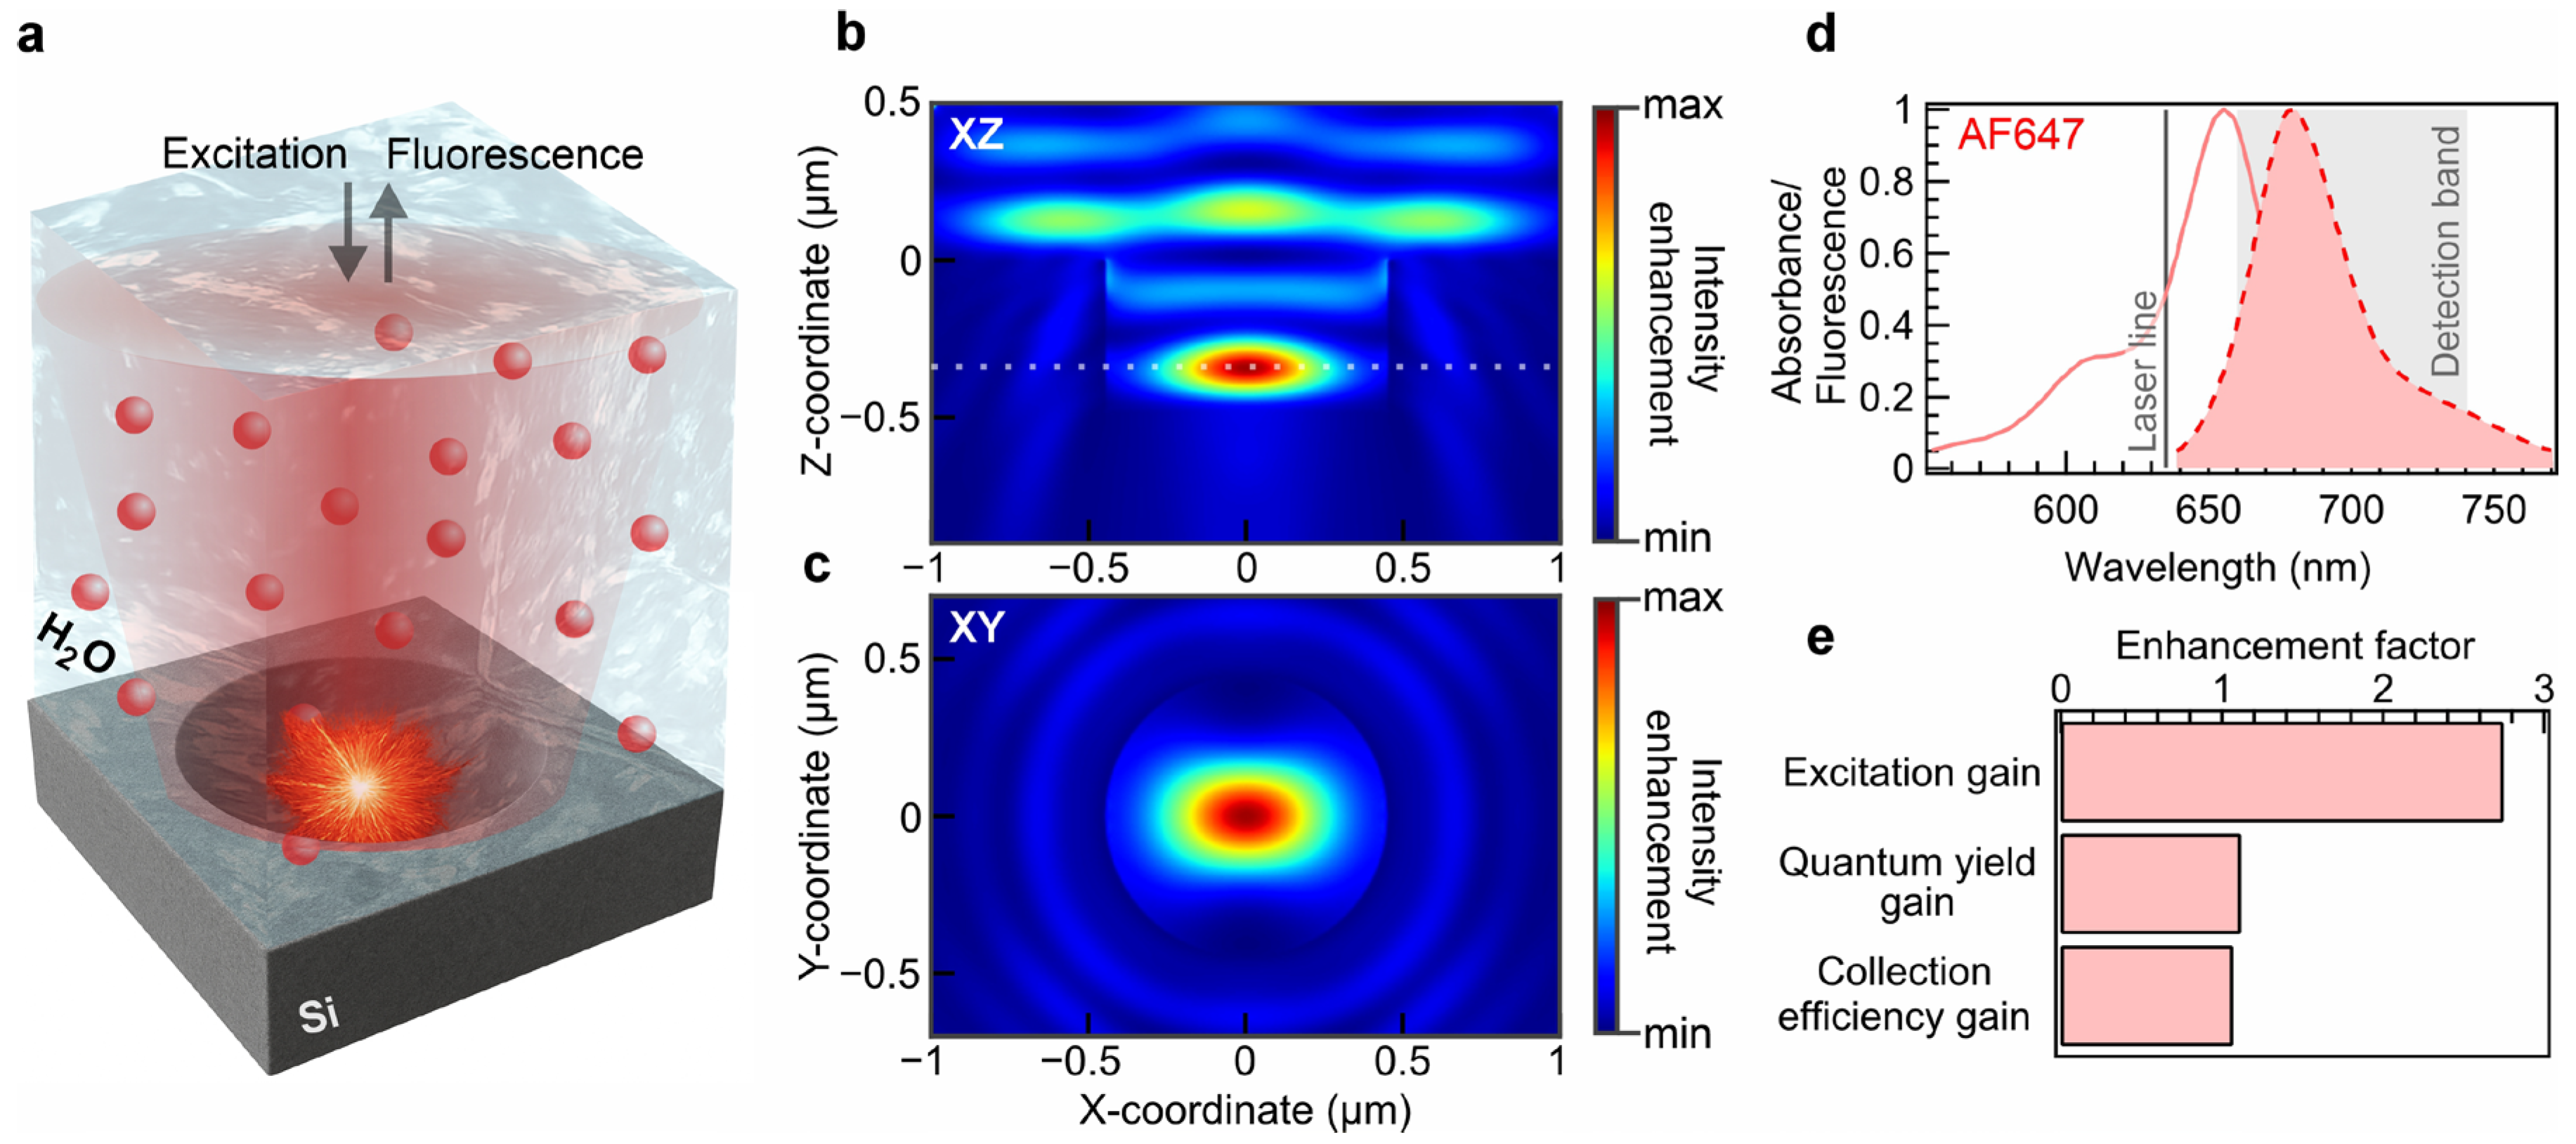
Figure 2.
Mie-void application for epi-fluorescence microscopy. (a) Scanning electron microscopy image of the Mie-void cluster. (b) SEM of one of the Mie voids (i) at the oblique angle view (52 o) and (ii) from the top view. (c) Fluorescence confocal microscope with time-tagging electronics to detect single-molecule analysis (in particular, fluorescence correlation spectroscopy). SPAD: single-photon avalanche diode; BP: bandpass filter; SP: shortpass filter; LP: longpass filter; DM: dichroic mirror; PBS: polarizing beamsplitter; HWP: half-waveplate.
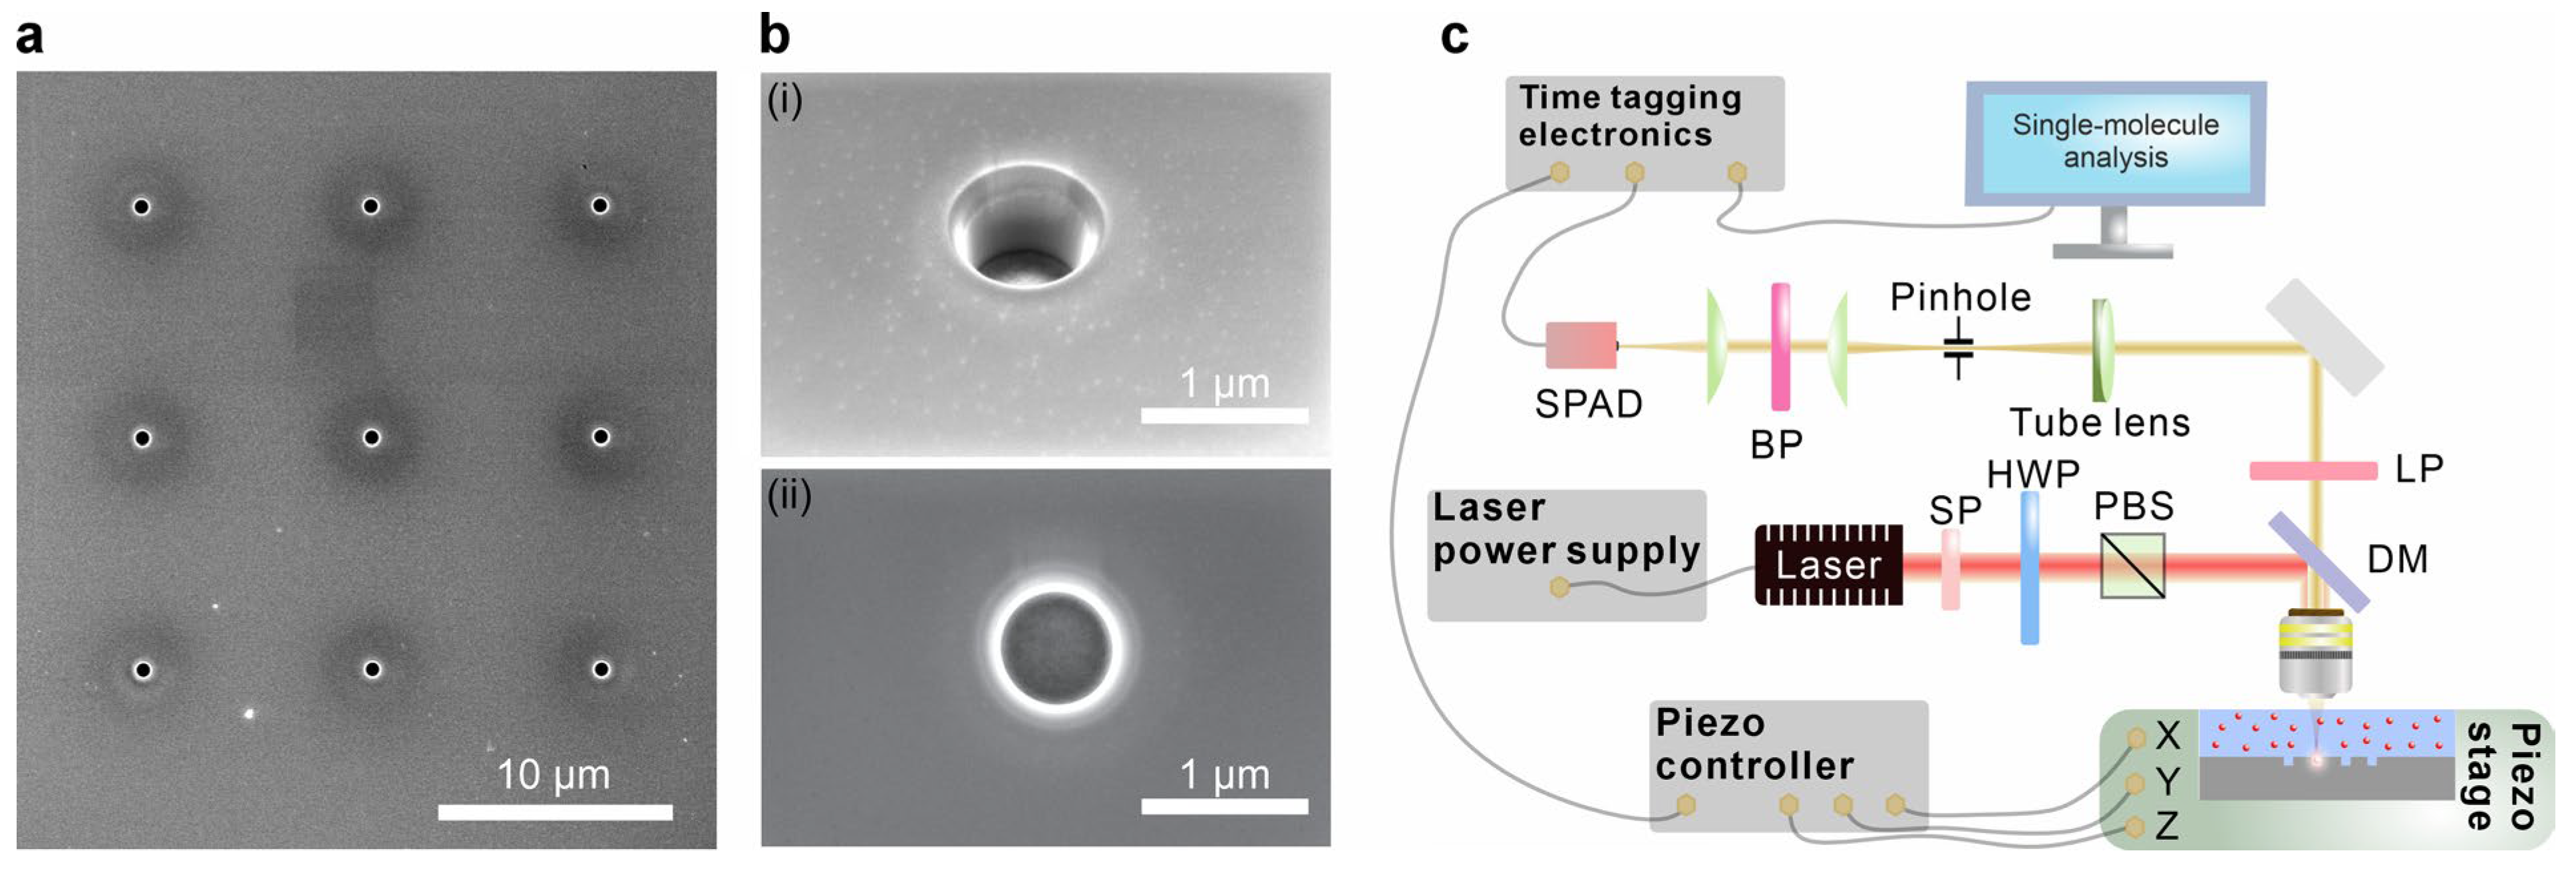
Figure 3.
Mie-void-enhanced FCS of diffusing AF647. (a) Fluorescence time traces of AF647 at 500 pM concentrations. (b) FCS autocorrelation functions retrieved from time-tagged data corresponding to panel (a). (c) Number of molecules change in the presence of glass slide, at the silicon substrate without Mie-void and after localization of a Mie void. (d) Diffusion time change in the presence of glass slide, at the silicon substrate without Mie-void and in the Mie void. (e) Diffusion time change in the presence of glass slide, at the bare silicon substrate and in the Mie void. The increase of single-molecule brightness corresponds to the fluorescence enhancement. Error bars for data points in panels (c-e) correspond to the standard deviation of the FCS measurements. (f) Experimental fluorescence enhancement factors in Mie-voids from diffusing AF647, streptavidin conjugated with AF647, and quantum dots CdSe/ZnS.
Disclaimer/Publisher’s Note: The statements, opinions and data contained in all publications are solely those of the individual author(s) and contributor(s) and not of MDPI and/or the editor(s). MDPI and/or the editor(s) disclaim responsibility for any injury to people or property resulting from any ideas, methods, instructions or products referred to in the content. |
© 2025 by the authors. Licensee MDPI, Basel, Switzerland. This article is an open access article distributed under the terms and conditions of the Creative Commons Attribution (CC BY) license (http://creativecommons.org/licenses/by/4.0/).
Copyright: This open access article is published under a Creative Commons CC BY 4.0 license, which permit the free download, distribution, and reuse, provided that the author and preprint are cited in any reuse.


