
Submitted:
17 October 2025
Posted:
20 October 2025
You are already at the latest version
Abstract
The high electricity and water consumption in industrial textile dyeing processes represents an environmental and economic challenge, requiring optimization strategies to reduce costs and impacts, in the direction of cleaner production. This work proposes an optimization model aimed at minimizing the costs associated with water and electricity consumption in industrial textile dyeing processes. The model has a Mixed Integer Linear Programming (MILP) formulation. The objective function to be minimized is the total process costs. The constraints consider production capacity, daily production limits, and specific costs per material. A case study was conducted in a real industrial process for three types of tissue: cotton, polyester, and polyamide. The model was coded in GAMS, and the CPLEX solver was used to solve the problem. The results showed that water consumption contributes 78.2% to the total cost of the process, for the optimal solution obtained. Using the same model, an alternative simulation was performed, replacing four smaller-capacity machines with a single larger-capacity machine, resulting in a marginal reduction in total costs. Simulations were also performed involving the complete replacement of the current machines with highly efficient automated HT machines, which indicated a potential 71.39% reduction in water consumption costs. The conclusion is that the proposed model is effective for optimizing textile dyeing processes, balancing operational efficiency and sustainability, with applicability in complex industrial scenarios.
Keywords:
process optimization
; textile dyeing
; MILP
; water consumption
; energy efficiency
1. Introduction
Drinking water is essential for sustaining life. Adequate water availability for drinking, sanitation, and industrial use is one of the greatest challenges of the 21st century. The rapid increase in the global population and industrialization puts significant pressure on society regarding the use of natural resources and poses enormous challenges to our ecosystem. This scenario reinforces the urgency of adopting sustainable practices and effective measures to protect water resources against contamination and overexploitation, especially in industrial and agricultural sectors.
In addition to water scarcity in various areas of the world, industrial processes, in general, have been facing several problems, such as the declining availability of raw materials, the large volume of effluents produced, rising labor costs, environmental legislation governing effluents, and growing consumer awareness of environmental issues. These factors are forcing industries to review, restructure, and reduce their environmental impact (Hussain; Wahab, 2018). Cleaner production approaches aim to avoid excessive resource consumption and the generation of pollutants resulting from inefficiency in production processes. Such approaches optimize production by considering environmental aspects, promoting sustainability and reducing waste (Ozturk et al., 2016).
In industrial processes, environmental impacts and effluent generation can be significant and compromise environmental quality and human health. Furthermore, industries face an increasingly dynamic and competitive market, and those who can stay ahead of the curve in these aspects will certainly secure a positive advantage in this competitive situation (El Hachemi et al., 2013).
As one of the most traditional industries in the world, the textile industry is a significant market, primarily due to the various production links within its supply chain. The global textile market finds room to continue growing in both production volumes and foreign trade. In 2022, global textile fiber consumption reached over 120 million tons, highlighting the sector's significant environmental impact on climate change, energy consumption, land use, and water demand (IEMI, 2023; Roos, 2019). This sector contributes significantly to the pollution of more than a quarter of the planet's water bodies (Estevez et al., 2024).
Brazil is one of the world's largest producers and consumers of textiles, so much so that in 2022, approximately 2.1 million tons were produced. In the finishing segment alone, 407,052 tons of tissues were finished (IEMI, 2023).
With the increase in textile production in recent decades, the need for modern and efficient designs has become evident. Lean manufacturing principles, such as the pursuit of quality from the outset, waste minimization, continuous improvement, and flexibility, have been applied to address the sector's challenges (Saravanan et al., 2023). However, processes such as textile dyeing continue to pose significant challenges due to high water and electricity consumption, in addition to the generation of complex effluents that hinder adequate treatment (Zhou et al., 2017). The need for more sustainable dyeing has driven water conservation efforts in various segments of the textile industry, including the treatment, recycling, and reuse of wastewater for industrial purposes, as well as machine innovations, process innovations, chemical innovations, advanced water analysis, and water-saving tools (Hussain; Wahab, 2018).
Chemical replacement and reduction practices in textile factories have shown promise for increasing production efficiency, meeting regulatory standards, minimizing environmental impacts, and protecting the health of workers and consumers (Ozturk et al., 2020). Numerous techniques have also been adopted to treat textile dyeing wastewater, including physicochemical, biochemical, and biological treatments, combined treatment processes, and other technologies. Conventional biological treatment processes commonly used are time-consuming, require large operational footprints, and are ineffective for effluents containing toxic elements. Advanced oxidation techniques result in high treatment costs and are generally used to obtain high-purity water. Chemical coagulation is slow and generates large amounts of sludge (Khandegar; Saroha, 2013).
One alternative to reducing water and electricity consumption, and consequently reducing the generation of industrial wastewater at the source, is the application of optimization techniques. This is an important and strategic step toward achieving sustainable development, particularly with potential environmental, economic, and social benefits (Hansen et al., 2018). According to Klemeš et al. (2013), the adoption of these measures in industries is estimated to reduce consumption by 25–30% compared to current consumption levels.
Minimizing the use of natural resources, such as water and energy, has gained prominence in modern industries, driven by the need to reduce costs and promote environmental sustainability. Batch sizing, a production planning and control technique, has been widely studied as an effective approach to minimizing the consumption of these resources in industrial processes. According to Wagner and Whitin (1958), batch sizing allows determining the optimal size of production batches, considering operational and environmental constraints, resulting in reduced waste and increased overall process efficiency. This technique is particularly relevant in sectors such as chemicals and manufacturing, where intensive water and energy use can be significantly optimized through appropriate planning strategies.
Recent studies have advanced the application of optimization techniques to textile dyeing. For example, Gao et al. (2024) proposed a genetic algorithm (GA) to optimize dyeing scheduling in multi-machine systems, maximizing profits with constraints on water, machine capacity, and deadlines. The results demonstrated efficiency, validating the balance between productivity and sustainability. However, the GA presented scalability limitations for large order volumes, suggesting the use of reinforcement learning as an alternative.
Another significant advance was the mixed-integer programming (MIP) model proposed by Sung and Maravelias (2008) for the general capacitated lot-sizing problem (GCLSP). This model relaxed traditional assumptions, allowing greater flexibility in production planning and demonstrating effectiveness in reducing costs and improving resource utilization. Villas Boas et al. (2021) also contributed a MIP model to solve the integrated lot-sizing and production scheduling problem, applied to complex industrial contexts. Their approach, based on heuristics such as Relax-and-Fix and Fix-and-Optimize, proved viable for large-scale problems, balancing solution quality and computational time.
The textile industry stands out among the most important industrial sectors globally (Hashim et al., 2022). However, its operations face significant challenges, such as high resource consumption, low operational efficiency, and pollutant emissions (Zhang et al., 2023). In particular, production processes require significant amounts of water and energy (Çifçi, 2023), highlighting the urgent need to adopt sustainable and innovative practices.
Given this scenario, this research aims to contribute to reducing this gap by proposing the integration of economic and environmental objectives in textile dyeing processes. In this context, the main objective of this study is to develop a mathematical model to minimize electricity and water costs in textile fabric dyeing plants, aiming to optimize the decision-making process within production scheduling. To achieve this objective, an optimization model was developed to define how much to produce (batch size), the time required to process these batches, and the detailed planning of the task sequence (scheduling) to determine when and in what order these batches will be processed, considering machine availability, capacity constraints, and the need to minimize costs by reducing energy consumption and wastewater generation. Furthermore, there is currently good computational tools (software and hardware) for implementing mathematical programming techniques to solve this type of optimization problem, ensuring the viability and efficiency of the solutions found.
2. Materials and Methods
In this work, a quantitative production planning model was developed, described by a batch sizing and sequencing optimization problem in the textile industry, during the processing of knitted fabrics during the dyeing stage. The dyeing stage is highly important, given its high water and electricity consumption. Dyeing takes place in machines called HT (High Temperature), which facilitate the interaction between the textile meshes and the chemicals used, whose activation is mediated by mechanical and thermal processes, which are responsible for the dyeing. Another factor considered in the model was the composition of the tissues, as it affects processing times and, in turn, causes fluctuations in electricity and water consumption. Cotton, polyester, and polyamide are the most dominant compositions in the industrial and commercial markets and, therefore, were the subjects of this analysis. The model's constraints consider initial inventory control and product availability for processing, maximum and minimum daily production limits for each product type, the maximum and minimum capacities of each machine, compatibility and balance between the quantities processed on the HT machines, restrictions to ensure that only one process is selected per machine and per cycle, and the calculation of costs for each cycle and process. These constraints ensure that quantities and availability are consistent with the system's needs, while the binary variables represent allocation decisions. Other constraints, such as those related to costs and quantities, are essential to ensure the system's economic and operational viability.
The indices, sets, parameters, continuous, and binary variables used in the proposed mathematical model are:
| Indices | |
| M | Pieces in kg (m=1,...,M) |
| i | Product type (i=1,...,I) |
| j | HT dyeing machines (j=1,...,J) |
| C | Planning cycles (c=1,...C) |
| Sets | |
| m ∈ M | Set of all tissues |
| i ∈ I | Set of all products |
| j ∈ J | Set of all HT dyeing machines |
| c ∈ C | Set of all cycles |
| Parameters | |
| Production forecast for mesh m | |
| Electricity cost to process product i on machine j | |
| Water cost to process product i on machine j | |
| Maximum capacity to process product i on machine j | |
| Minimum capacity to process product i on machine j | |
| Maximum daily production limit for product i | |
| Minimum daily production limit for product i | |
| Processing time (in hours) per batch of product i | |
| Continuous variables | |
| Total dyeing cost (objective variable) | |
| mass (kg) of product type i processed on machine j in cycle c | |
| mass (kg) of mesh m available at the beginning of cycle c | |
| mass (kg) of mesh m actually processed in cycle c | |
| Total mass of product type i processed in cycle c | |
| Total mass of product type i processed in all cycles | |
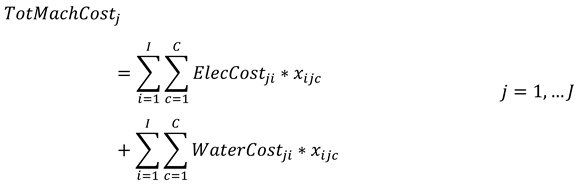
| Total cost related to machine j in all cycles | |
| Total cost of electricity | |
| Total cost of water | |
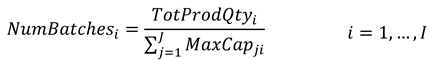
| Number of batches required to process product i | |
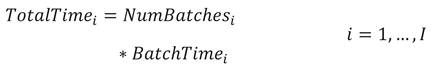
| Total time (h) required to process product i | |
| Binary variable | |
| It is equal to 1 if product i is processed on machine j in cycle c, and equal to 0 otherwise |
The objective function to be minimized relates the costs associated with the consumption of electricity and water during the dyeing process:
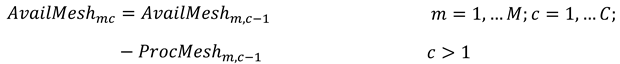
The assignment of start, progression, and end points for various processes depends on process constraints. Constraints (2a) and (2b) define the inventory balance for each loop m over cycles c. Equation (2a) establishes the initial boundary condition, in which material availability (AvailMesh) for the first period is parametrically defined by the production forecast. Equation (2b), in turn, formulates the recursive relationship for subsequent periods. In each cycle, the available inventory is what remains from the previous cycle, connecting production decisions and ensuring that consumption does not exceed inventory.

Constraint (3) ensures that the quantity of mesh to be processed does not exceed the mass available in stock.
Constraint (4) imposes the balance of the material flow within each cycle c. This equality ensures that the total quantity of material entering the production area in a cycle is precisely equal to the sum of the quantities processed by all machines in that same cycle.
Constraint (5) establishes a global consumption condition for the entire planning horizon. It requires the model to ensure that the total cumulative production across all machines and all cycles is exactly equal to the total inventory that entered the system through the initial forecast.
Constraints (6) and (7) impose maximum and minimum daily production limits for each type of product.
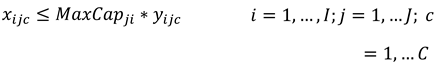
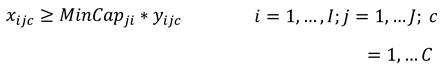
Constraints (8) and (9) ensure that, if a machine is used, the quantity processed respects its capacity limits. If the machine is not used, production must be zero.
Constraint (10) imposes that only one type of product i is processed on each of the machines j. Thus, the constraint ensures that mixed production with more than one type of product per machine will not be considered.
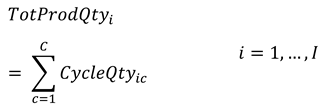
Constraints (11) and (12) are definition equations that calculate the total mass processed by product type in each cycle and in the total planning horizon, respectively.

Equation (13) calculates the cost associated with each dyeing machine over the entire horizon.
Equation (14) establishes the cost related to electricity consumption.
Equation (15) stipulates the total cost associated with water use.
Equation (16) calculates the number of batches required for the entire processed quantity of a product type, and equation (17) allow the calculation of the total time required to process these batches, rounding the number of batches to the nearest higher integer.
The subsequent expressions establish the non-negativity conditions for all continuous variables in the model.
Thus, the optimization problem consists of minimizing the objective function, given by Equation (1), subject to constraints (2) to (28), and presents an MILP formulation. Batch sizing is addressed in the model by defining the optimal batch size, the number of batches required to process each product type, and the processing time. Production scheduling can be identified in the allocation of resources (how products will be allocated to the HT machines) throughout the production cycles, in the sequencing of tasks (considering the availability of products for processing in each cycle and defining the quantity of mesh to be processed on each machine), and in the capacity constraints, all of which minimize total production costs. This integration between batch sizing and production scheduling is essential to optimize production efficiency in complex environments, such as the textile dyeing plant described in the model.
3. Case Study
The industrial-scale study presented in this article was based on a Brazilian textile dyeing unit located in the northwestern region of Paraná, responsible for most of the region's knitwear dyeing. The model's input parameters were collected based on the unit's industrial operations, focusing specifically on the dyeing process on HT machines, supplemented by technical information from machine suppliers and literature data.
The study considered 16 HT machines and 24 operating cycles. Three types of raw materials were analyzed: cotton, polyester, and polyamide, covering the main fibers processed by the industry under study. Daily processing limits were established for each type of raw material. Cotton has a maximum capacity of 46,000 kg and a minimum of 35,000 kg. Polyester has a maximum capacity of 35,500 kg and a minimum of 22,000 kg. Polyamide has a maximum mass of 33,000 kg and a minimum of 20,000 kg. Total production for the day was estimated at 109,000 kg of mesh. Regarding water consumption, there are specific demands for each type of raw material. Processing 1 kg of cotton mesh requires 90 L of water, while polyester and polyamide require 102 L and 74 L, respectively (Pinto; Leão, 2005). In Brazil, a criterion adopted by SABESP (2023) attributes a cost of R$ 13.79/m3. The values per kg processed are equivalent to R$ 1.24 (cotton), R$ 1.41 (polyester), and R$ 1.02 (polyamide). To determine the electricity costs during the batch dyeing process on HT machines, a processing time of 8 hours was assumed for cotton, 5 hours for polyester, and 6 hours for polyamide. The kWh cost for the industry was obtained from the National Electric Energy Agency, considering an average value of R$ 684.77 per MWh (ANEEL, 2023). For the power (kWh) of each machine, according to the selected capacity, the catalog of the HT machine manufacturer Dilmenler Makine Sanayi was used as a reference. Regardless of the type of product to be processed, the machines will be the same. Regarding the production volume of the HT dyeing machines, equipment with different capacities were selected, aiming for more efficient batch sizing and sequencing. Table 1 presents the maximum and minimum production capacities of the HT machines for processing product i and their respective power outputs (kW/h).
The costs associated with the consumption of electricity for processing product i on machine j are presented in Table 2.
The optimization model was coded and solved in GAMS v49. As the problem has an MILP formulation, the CPLEX optimization solver was used for this specific case. The program was executed on a Windows 11 computer with an 11th Gen Intel® Core™ i5-1135G7 CPU @ 2.40/2.42 GHz, and 8GB RAM. The optimal integer solution found for the problem has an objective function value of R$ 170,114.44. Of this total, R$ 37,132.79 corresponds to the cost of electricity, while R$ 132,981.65 is associated with the cost of water, demonstrating that the latter represents the component with the greatest impact on the total cost. The model was solved in 0.19 seconds, with a total of 1,852 iterations of the simplex method and 36 iterations in post-processing. The low number of iterations suggests that the solver faced no numerical difficulties.
No branch-and-bound nodes were required, indicating that the entire solution was found directly from linear relaxation.
Optimality gap analysis revealed that the solution found is very close to the theoretical lower bound (best possible value), with an absolute gap of R$ 1.38 and a relative gap of 0.0008% of the best possible value. Since the relative gap is below 0.1%, it can be concluded that the CPLEX solver demonstrated effectiveness in solving the problem, providing an optimal solution within the established tolerance and with minimal computational time. The results meet the defined tolerances and validate the application of the proposed model to the scenario under study.
Regarding the results analysis, Table 3 shows the production distribution by tissue type, representing the best batch sizing and sequencing in twenty-four work cycles. This number of cycles was defined considering the expected production and the total capacity of the dyeing machines. In the table one can also see the number of rounded batches and the total processing time.
The total mass (kg) processed for each raw material remained within the daily limits, complying with one of the modeling constraints. Figure 1 illustrates the production hierarchy of the dyeing machines, highlighting the disparity in volumes processed per unit over the 24 operating cycles. The graphical representation of accumulated production by machine clearly highlights the production hierarchy. Machine HT16 was the most productive unit in the industrial park, with a constant capacity of 600 kg per cycle, demonstrating high operational reliability and contributing significantly to the total production volume. Machines HT1 and HT2 were the only ones that showed reduced production, both with capacities of 20 to 25 kg per cycle.
This quantitative analysis offers valuable insights into optimizing the industrial park, suggesting possible adjustments in resource allocation and load redistribution between machines with similar capacities, aiming to increase the overall efficiency of the production system. The observed variation in production patterns between machines designed for similar materials indicates room for productivity gains through improvements in operational planning. Regardless of the allocation of machines by material, the larger units (HT12-HT16) were largely used for cotton processing, while the medium-sized machines (HT7-HT11) and the smaller-capacity machines (HT1-HT6) were mostly used for polyamide and polyester, respectively. This distribution is in line with the principle of energy efficiency, as larger machines have a lower cost per kilogram processed, medium-sized machines are better suited to the specific conditions required for polyamide, while smaller machines are more efficient for polyester due to their shorter processing time.
It can be seen that this batch distribution may indicate a higher cost for polyamide and polyester meshes, considering that the smaller the machine capacity, the higher the electricity costs, although polyamide offered economic advantages due to its shorter dyeing time and water consumption. Regarding the processing costs per kg of mesh per machine, Figure 2, show the results achieved.
The HT16 machine was expected to have a lower cost for processing cotton, since machines with larger capacities consume less electricity. However, dyeing cotton requires a significant amount of water, approximately 90 L/kg, in addition to a longer dyeing time of 8 h. On the other hand, the HT7 and HT11 machines, designed for polyamide, stand out as the most economical, likely because they consumed less water (approximately 74 L/kg) and a shorter dyeing time, despite operating at higher temperatures (130 °C), which implies greater thermal energy consumption. Both machines have a maximum capacity of 300 kg of fabric per production cycle.
The HT3-HT6 and HT9 machines, both designed for polyester, have similar costs, ranging from R$ 1.69 to R$ 1.67 per kg. Processing this fiber requires approximately 102 L of water per kg of fabric, and cycles are shorter, approximately 5 h, but at high temperatures (between 120 °C and 130 °C), as mentioned by Clark (2011).
The HT1 and HT2 (polyester) machines are in the least efficient group, costing R$ 2.34 per kg of dyed fabric. Therefore, it is recommended to prioritize machines HT3 to HT6, which, despite being designed for larger batches, are more economical than machines with lower production capacities.
To reduce total production costs and based on previous results, a new simulation was performed, replacing the machines with lower production efficiency (HT1, HT2, HT3, HT4, and HT9) with a single, higher-capacity machine (HT17, with 750 kg of processing capacity). The results demonstrated a marginal reduction in electricity costs, which now totaled R$ 35,672.70, while total costs reached R$ 168,654.35. Although this reduction is not statistically significant in terms of energy and water consumption, it is important to note that the replacement eliminated four machines from the production process. Furthermore, if indirect costs associated with labor and maintenance were considered, the optimization could have more significant impacts, suggesting the need for additional analyses that integrate operational and logistical variables for a more comprehensive assessment.
A complementary cost reduction strategy involved the application of real operational data from modern equipment. Current machines, developed with technological innovations, are more efficient in the use of natural resources and significantly reduce production costs. Recent data provided by the machine manufacturer (Dilmenler Makine Sanayi) show that the average water consumption in textile dyeing is 35.5 L/kg for cotton, 20 L/kg for polyester, and 16 L/kg for polyamide, values substantially lower than those observed in conventional equipment.
In a new simulation comparing the scenario initially studied, an optimized value for the objective function of R$ 75,182.22 was obtained, distributed as R$ 37,132.79 for electricity consumption and R$ 38,049.43 for water use. This result represents a 71.39% reduction in water costs compared to previous parameters, demonstrating that theoretical data in the literature for water consumption per kg of fabric are outdated and do not reflect the technological advances recently implemented in the sector, in which machines consume less water.
4. Conclusions
In this work, an optimization model was developed to minimize electricity and water costs in textile fabric dyeing plants. The model was coded and solved in GAMS using the CPLEX solver. A case study was conducted to test the applicability of the developed model.
The results demonstrated the effectiveness of the model for optimizing the textile dyeing process, highlighting the achievement of an optimal solution of R$ 170,114.44, solved in a reduced computational time (0.19 seconds), for a daily production of 109,000 kg of fabric. The analysis revealed that water consumption represents the main cost component (78.2% of the total), significantly exceeding electricity costs. Production distribution showed that larger-capacity machines, such as the HT16, presented better operational performance, while smaller-capacity machines (HT1-HT2) had a marginal share of the total processed volume. The simulation with high-efficiency dyeing machines indicated a potential 71.39% reduction in water costs, highlighting the obsolescence of conventional theoretical parameters. Although replacing four machines with a single high-capacity machine (HT17) generated limited direct savings (0.86%), this strategy demonstrated significant indirect benefits, such as reduced physical space, simplified production flow, and reduced labor. The results reinforce the importance of integrating the developed model with the use of up-to-date operational data for decision-making in the industrial environment.
Furthermore, the identified trade-offs—between production capacity, processing time, and specific costs per material—suggest that optimizing batch sizing and prioritizing equipment can generate additional gains. The small optimality gap and reduced processing time validated the efficiency of the proposed model. As future perspectives, it is recommended to evaluate the economic feasibility of replacing current machines with others with greater water efficiency, incorporating the setup times required for switching between different fabric types into the model, and applying the method to other industrial equipment with similar demands. The developed approach proved promising for optimizing textile processes and can be adapted to other industrial contexts with similar resource allocation and cost management challenges.
Author Contributions
Both authors contributed to the study conception and design, material preparation, data collection, and analysis.
Acknowledgments
This work was supported by the National Council for Scientific and Technological Development (CNPq), processes 309026/2022-9 and 406544/2023-9.
Competing Interests:
The authors have no relevant financial or non-financial interests to disclose.
References
- Ahmetović, E., Ibrić, N., Kravanja, Z. and Grossmann, I.E., 2015. Water and energy integration: A comprehensive literature review of non-isothermal water network synthesis. Computers and Chemical Engineering, 82, pp.144-171. 144–171. [CrossRef]
- ANEEL - Agência Nacional de Energia Elétrica, 2023. Reajuste tarifário da COPEL 2024. Processo nº 48500.010990/2023-17. Disponível em: https://www2.aneel.gov.br/cedoc/reh20243336ti.pdf [Acesso em: 10 jul. 2024].
- Çifçi, D.İ., 2023. Fe-Mn-textile waste synthesis for COD and color removal from textile wastewater by UV/S2O82− oxidation. International Journal of Environmental Science and Technology, v. 20, p. 7313–7324. [CrossRef]
- Clark, M. (ed.), 2011. Handbook of Textile and Industrial Dyeing: Principles, Processes and Types of Dyes. v. 1. Cambridge: Woodhead Publishing.
- El Hachemi, N. , Saddoune, M., El Hallaoui, I. and Rousseau, L.-M., 2013. Production scheduling and routing problem in the textile industry. In: Industrial Engineering and Systems Management (IESM), Proceedings of 2013 International Conference On, pp.1-4.
- Estévez, S., Mosca Angelucci, D., Moreira, M.T. and Tomei, M.C., 2024. Techno-environmental and economic assessment of color removal strategies from textile wastewater. Science of the Total Environment, 913, 169721. [CrossRef]
- Gao, S. et al., 2024. Dyeing scheduling optimization in a multi-machine system with resource constraints. Journal of Physics: Conference Series, v. 2853, p. 012058. [CrossRef]
- Hansen, É., Rodrigues, M.A.S., Aragão, M.E. and De Aquim, P.M., 2018. Water and wastewater minimization in a petrochemical industry through mathematical programming. Journal of Cleaner Production, 172, pp.1814-1822. [CrossRef]
- Hashim, M. et al., 2022. Modeling supply chain sustainability-related risks and vulnerability: insights from the textile sector of Pakistan. Autex Research Journal, v. 22, p. 123–134. [CrossRef]
- Hussain, T. and Wahab, A., 2018. A critical review of the current water conservation practices in textile wet processing. Journal of Cleaner Production, 198, pp.806-819. [CrossRef]
- IEMI – Inteligência de Mercado, 2023. Relatório Setorial da Indústria Têxtil Brasileira – Brasil Têxtil 2023. v.23. São Paulo: IEMI, ABIT, Senai CETIQT.
- Khandegar, V. and Saroha, A.K., 2013. Electrocoagulation for the treatment of textile industry effluent - A review. Journal of Environmental Management, 128, pp.949-963. [CrossRef]
- Klemeš, J.J., Varbanov, P.S. and Kravanja, Z., 2013. Recent developments in Process Integration. Chemical Engineering Research and Design, 91(10), pp.2037-2053. [CrossRef]
- Ozturk, E., Koseoglu, H., Karaboyacı, M., Yigit, N.O., Yetis, U. and Kitis, M., 2016. Sustainable textile production: cleaner production assessment/eco-efficiency analysis study in a textile mill. Journal of Cleaner Production, 138, pp.248-263. [CrossRef]
- Ozturk, E., Cimperi, N.C. and Kitis, M., 2020. Environmental Science and Pollution Research, 27(36), pp.45358-45373. [CrossRef]
- Pinto, N.M.C. and Leão, M.M.D., 2005. Produção mais Limpa na indústria têxtil de acabamento de malhas: uso da água. In: Congresso Brasileiro de Engenharia Sanitária e Ambiental, 23., 2005. Anais. Campo Grande: ABES. Disponível em: http://www.bvsde.paho.org/bvsacd/abes23/II-408.pdf [Acesso em: 25 mar. 2022].
- Roos, S. et al., 2019. An inventory framework for inclusion of textile chemicals in life cycle assessment. The International Journal of Life Cycle Assessment, 24, pp.838-847. [CrossRef]
- SABESP - Companhia de Saneamento Básico do Estado de São Paulo, 2023. Comunicado – 5/23: Tarifas e condições para fornecimento de água e coleta de esgotos no Município de Lins a partir de 26 de janeiro de 2024. 28 de dezembro de 2023. Disponível em: https://www.sabesp.com.br/assets/pdf/servicos/para-voce/comunicado_5_23.pdf.
- Saravanan, S., Chakraborty, P.S., Nallusamy, S. and Kumar, V., 2023. A proposed model for productivity improvement by implementation of lean manufacturing techniques in a textile industry. International Journal of Mechanical Engineering, 10(8), pp.31-48. [CrossRef]
- Sung, C. e Maravelias, C.T., 2008. A mixed-integer programming formulation for the general capacitated lot-sizing problem. Computers and Chemical Engineering, v. 32, n. 1-2, p. 244–259. [CrossRef]
- Villas Boas, B.E., Camargo, V.C.B. e Morabito, R., 2021. Modeling and MIP-heuristics for the general lotsizing and scheduling problem with process configuration selection. Pesquisa Operacional, v. 41, n. spe, p. 1–29. [CrossRef]
- Wagner, H. and Whitin, T., 1958. Dynamic version of the economic lot size model. Management Science, 5, pp.89-96. [CrossRef]
- Zhang, S. et al., 2023. Environmental assessment of fabric wet processing from gate-to-gate perspective: comparative study of weaving and materials. Science of the Total Environment, v. 857. [CrossRef]
- Zhou, L., Xu, K., Cheng, X., Xu, Y. and Jia, Q., 2017. Study on optimizing production scheduling for water-saving in textile dyeing industry. Journal of Cleaner Production, 141, pp.721-727. [CrossRef]
Figure 1.
Total production per HT machine (kg) in all cycles and by material.
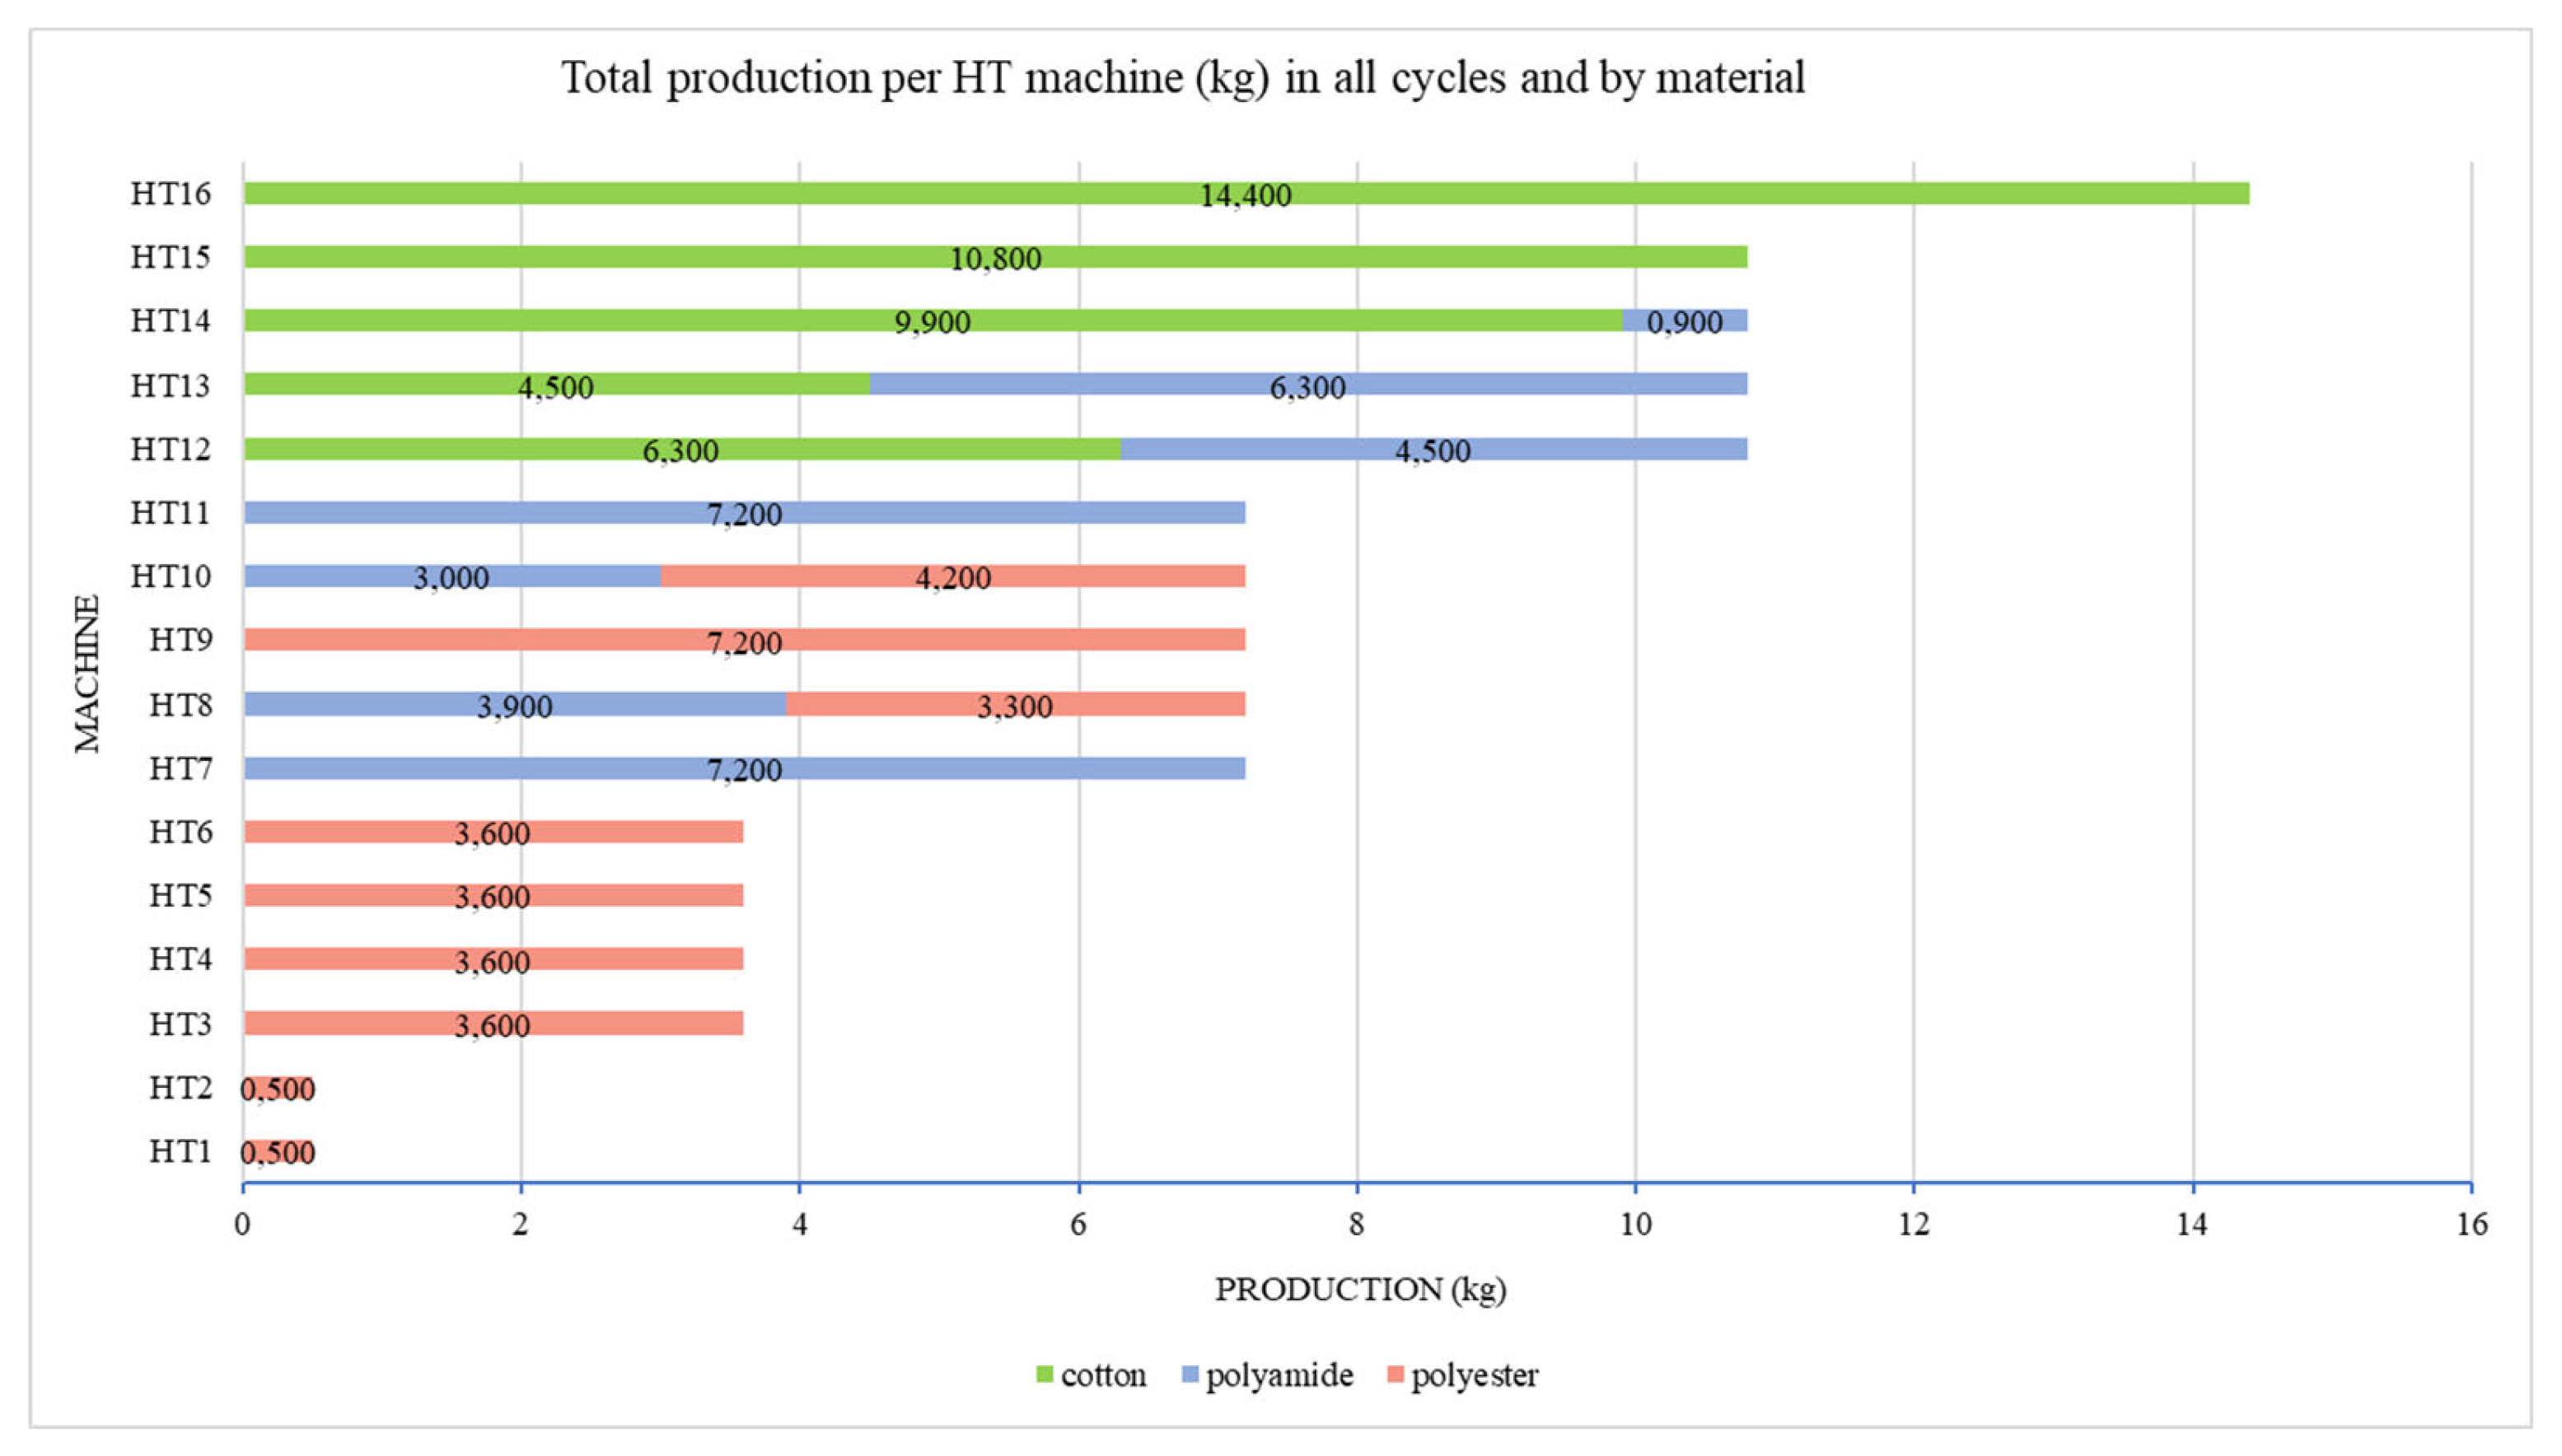
Figure 2.
Processing cost of knitted fabric per HT machine.
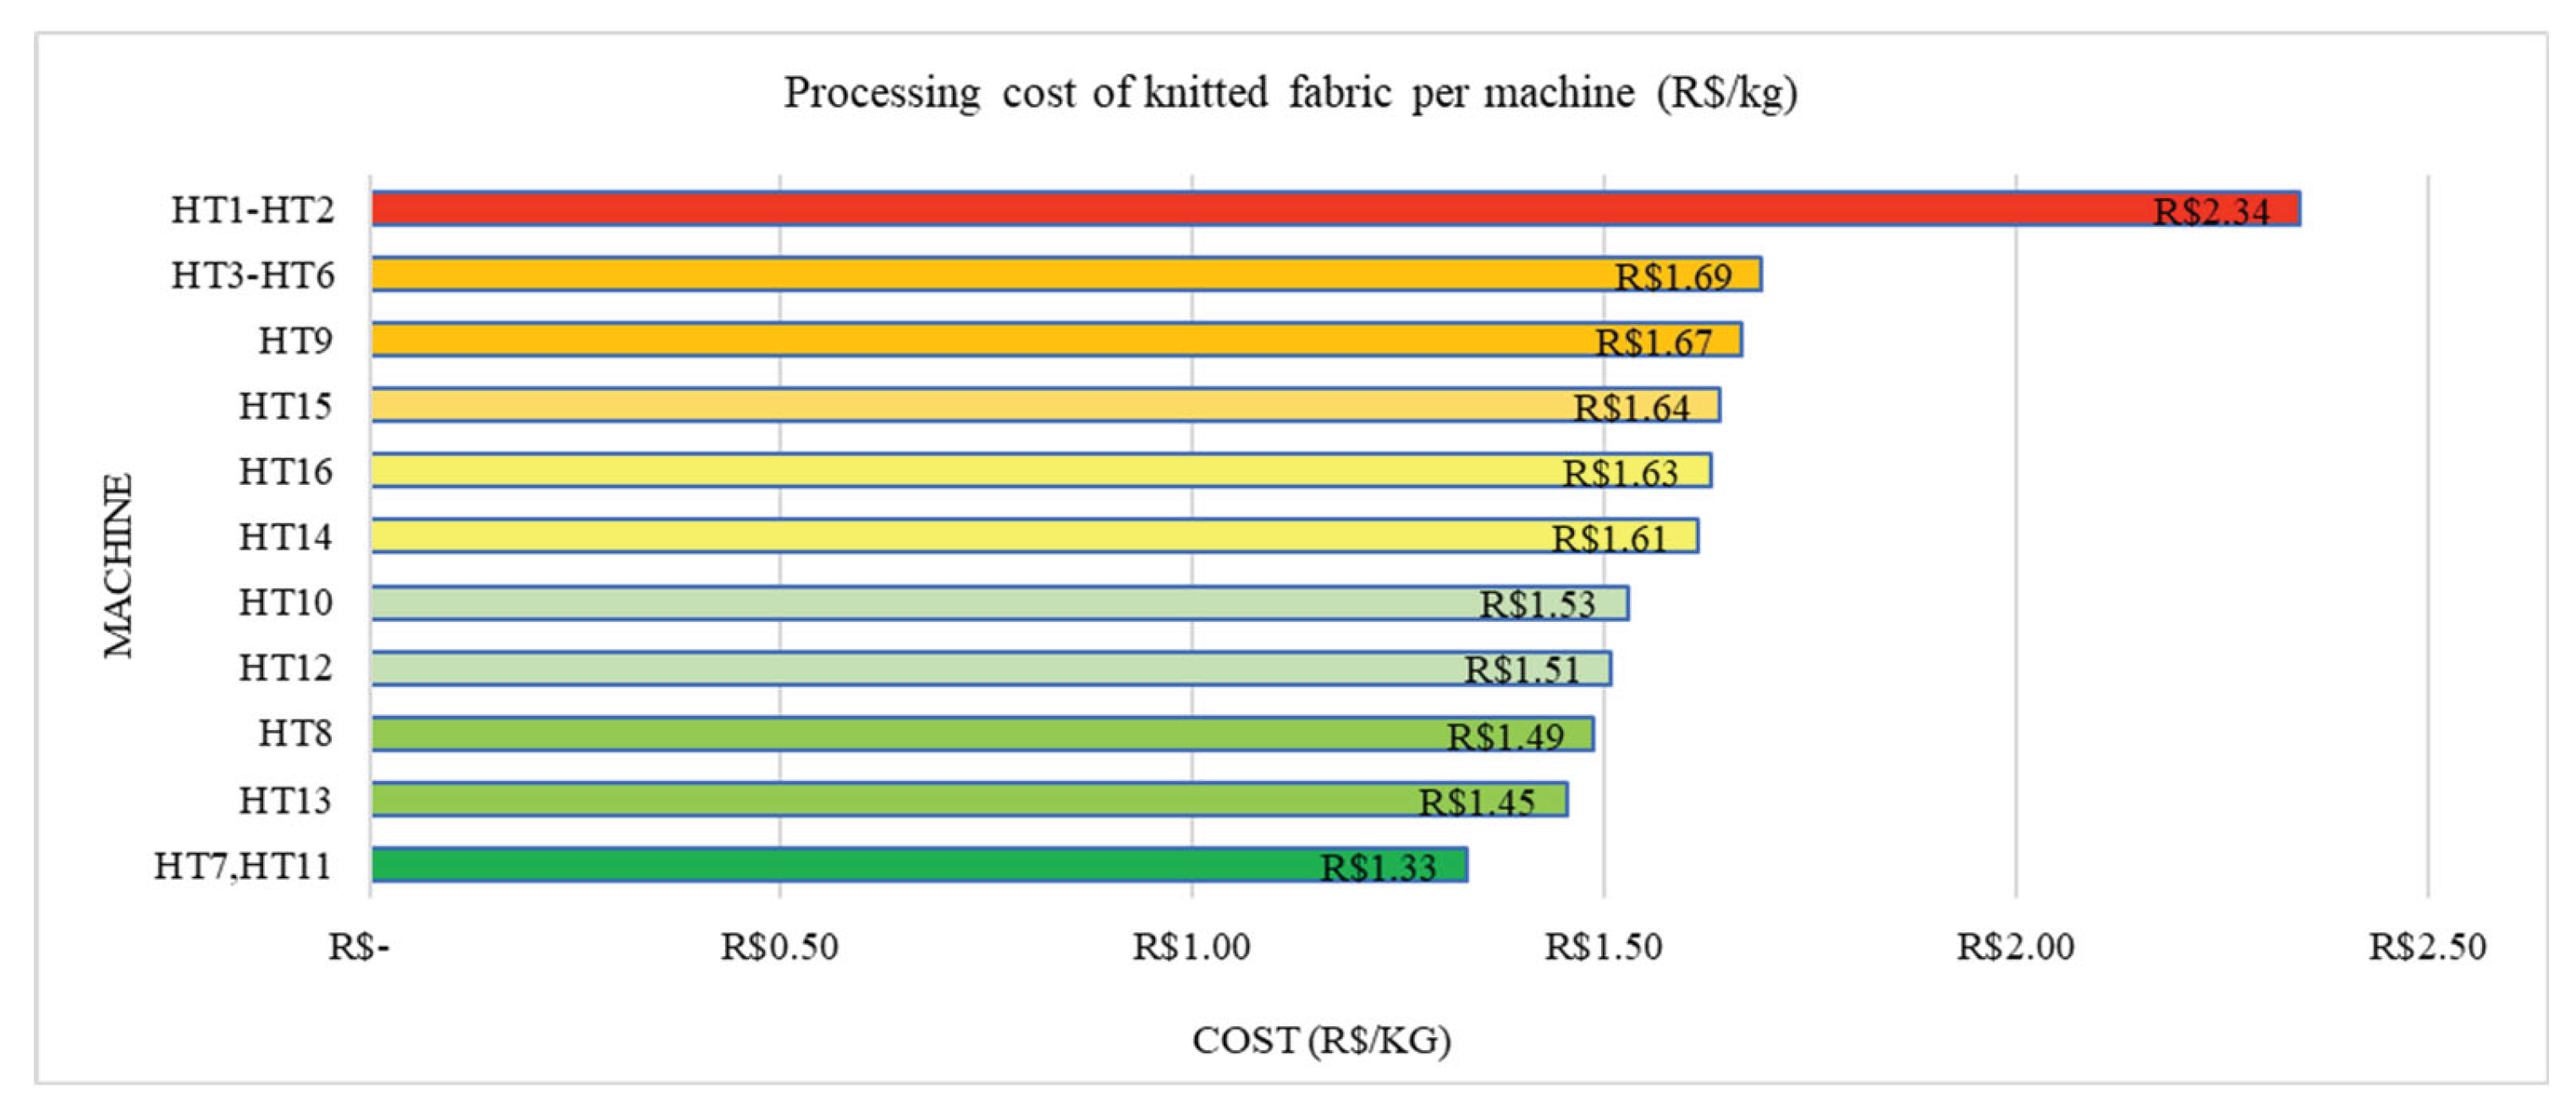

Table 1.
Capacity and power of HT machines.
| Machine | Mass (kg) |
Power (kW/h) |
|
| Minimum | Maximum | ||
| HT1 - HT2 | 20 | 25 | 6.84 |
| HT3 - HT6 | 120 | 150 | 12.45 |
| HT7 - HT11 | 240 | 300 | 22.78 |
| HT12 - HT15 | 360 | 450 | 32.77 |
| HT16 | 480 | 600 | 42.36 |
Table 2.
Electricity cost per kilogram of mesh to process i on machine j.
| Machine | Cotton | Polyester | Polyamide |
| HT1 - HT2 | R$1.50 | R$0.94 | R$1.12 |
| HT3 - HT6 | R$0.46 | R$0.28 | R$0.34 |
| HT7 - HT11 | R$0.42 | R$0.26 | R$0.31 |
| HT12 - HT15 | R$0.40 | R$0.25 | R$0.30 |
| HT16 | R$0.39 | R$0.24 | R$0.29 |
Table 3.
Distribution of production by fabric type.
| Tissue | total mass (kg) | % of the production | Number of lots | Total time (h) |
| Cotton | 45,900 | 42.1% | 11 | 88 |
| Polyester | 30,100 | 27.6% | 7 | 35 |
| Polyamide | 33,000 | 30.3% | 8 | 48 |
| Total | 109,000 | 100% | 26 | 171 |
Disclaimer/Publisher’s Note: The statements, opinions and data contained in all publications are solely those of the individual author(s) and contributor(s) and not of MDPI and/or the editor(s). MDPI and/or the editor(s) disclaim responsibility for any injury to people or property resulting from any ideas, methods, instructions or products referred to in the content. |
© 2025 by the authors. Licensee MDPI, Basel, Switzerland. This article is an open access article distributed under the terms and conditions of the Creative Commons Attribution (CC BY) license (http://creativecommons.org/licenses/by/4.0/).
Copyright: This open access article is published under a Creative Commons CC BY 4.0 license, which permit the free download, distribution, and reuse, provided that the author and preprint are cited in any reuse.


