1. Introduction
Body weight gain associated with antiretroviral therapy (ART), particularly with integrase strand transfer inhibitors like Dolutegravir (DTG), has raised significant concerns in clinical practice (Hill et al., 2019; Sax et al., 2020) DTG, a cornerstone in HIV treatment, is linked to unintended weight gain, with studies indicating varying susceptibility among patient groups (Bourgi et al., 2020; Norwood et al., 2017). Identifying distinct patterns of weight gain trajectories is critical to understanding the heterogeneous responses to Dolutegravir (DTG), as not all individuals experience weight changes in the same way following treatment initiation (Venter et al., 2019). Some patients may gain weight rapidly, others more gradually, while a subset may experience little to no weight gain or even weight loss (Bourgi et al., 2020; Sax et al., 2019). These differences are influenced by a complex interplay of factors including baseline body mass index (BMI), sex, age, genetic predispositions, metabolic profiles, and co-existing medical conditions (Koethe et al., 2020; Lake et al., 2020). By classifying patients into distinct trajectory groups based on their longitudinal weight change patterns, researchers and clinicians can move beyond average treatment effects and gain a more nuanced understanding of how DTG affects individuals over time (Berlin et al., 2014). Traditional longitudinal analysis methods such as repeated measures ANOVA or linear mixed-effects models, typically focus on estimating the average weight trajectories across entire study populations. While they are useful for assessing overall trends, these methods often overlook the existence of unobserved subgroups with distinct growth patterns, that highlight the need for person-centered approaches capable of identifying latent classes subpopulations with unique weight gain trajectories (Jung & Wickrama, 2008; Nagin, 2005). The person-centered approaches such as group-based trajectory modeling identifies subgroups following similar trajectories over time and can be expanded to include time-invariant and time-dependent covariates (Sereika et al., 2017; Nagin, 2005). Advanced statistical techniques such as Latent Class Analysis (LCA), Latent Class Growth Analysis (LCGA),
Latent Growth Curve Modeling (LGCM), and Growth Mixture Models (GMM) are increasingly used to identify hidden subgroups in longitudinal data (Berlin et al., 2014; Ram & Grimm, 2009). For instance, LCA has been employed to classify HIV-positive patients into adherence behavior subgroups based on multiple indicators (Yu et al., 2018). LCGA has been used to model distinct trajectories of body weight gain among people living with HIV initiating ART, revealing subgroups with rapid, moderate, and minimal weight gain (Lake et al., 2020). LGCM has been applied to understand changes in depression symptoms over time in HIV-infected populations (Choi et al., 2016), while GMM has been used to identify heterogeneous patterns of metabolic changes and weight trajectories among patients on Dolutegravir-based regimens (McLaughlin et al., 2018McLaughlin et al., 2020). These person-centered modeling approaches allow researchers to capture unobserved heterogeneity in longitudinal outcomes, facilitating more targeted and effective clinical interventions.
While various statistical methods exist to identify latent subgroups in longitudinal data, selecting the most appropriate technique has significant implications for designing interventions tailored to patients at higher risk for substantial body weight gain (Jung & Wickrama, 2008). Dolutegravir’s introduction as a core component of the first-line ART regimen has been transformative, improving viral suppression rates and patient outcomes (WHO, 2019). However, an emerging body of evidence links DTG to excessive weight gain, raising concerns among clinicians, healthcare workers, and researchers (Lake et al., 2020). Not all patients respond uniformly to DTG; some experience minimal weight gain, while others show substantial increases. For example, Bourgi et al. (2020) found that women and Black patients experienced significantly more weight gain after switching to DTG compared to other ART regimens. Similarly, Sax et al. (2019) observed that patients initiating DTG-based therapy gained more weight over 96 weeks than those on non-DTG-based regimens, with greater increases in women and those with lower baseline BMI. These findings underscore the presence of unobserved subgroups with distinct responses to DTG. Understanding this heterogeneity requires advanced statistical tools to identify latent subgroups with distinct weight gain trajectories, enabling a more precise and personalized approach to HIV care.
Several approaches have been developed to classify individuals and model growth trajectories over time. Latent Class Growth Analysis (LCGA) is a widely used method for identifying subgroups with distinct longitudinal patterns. Unlike Growth Mixture Models (GMM), which allow for within-class variability, LCGA assumes homogeneity within each latent class, making it computationally efficient and interpretable (Jung & Wickrama, 2008). This makes LCGA particularly useful in identifying meaningful subgroups in clinical research, where capturing distinct but stable trajectories is essential.
While the study by Nkhoma et al. (2024) systematically compared the performance of four statistical approaches Latent Class Analysis (LCA), Latent Class Growth Analysis (LCGA), Latent Growth Curve Modeling (LGCM), and Growth Mixture Models (GMM), using the same dataset and found LCGA to be the best-fitting model, it did not delve deeper into evaluating the optimal number of latent classes within the LCGA framework. This represents a critical gap, as determining the most appropriate class structure is essential for accurately capturing the diversity of weight gain trajectories among Dolutegravir (DTG)-treated individuals. Therefore, this study builds on the findings of Nkhoma et al. by narrowing the focus to LCGA and systematically assessing multiple class solutions to identify the optimal number of latent classes. By doing so, the study aims to enhance the precision and clinical relevance of trajectory-based classification in DTG-related weight gain. By using LCGA this study was aimed at classifying individuals on DTG based regimen into subgroups with distinct weight gain trajectories by systematically evaluating different LCGA models with varying numbers of latent classes.
By identifying distinct body weight gain trajectories using LCGA, this study will enable clinicians to pinpoint subgroups of patients at higher risk for accelerated weight gain. Early identification of such individuals can facilitate timely interventions, including nutritional counselling, lifestyle modifications, metabolic screening, and treatment adjustments (Koethe et al., 2020). These predictive processes could significantly improve patient outcomes by mitigating both metabolic and immunological complications, ensuring a better quality of life while maintaining viral suppression.
To rigorously assess the appropriate number of latent classes in body weight gain trajectories among DTG-treated individuals, we implement a comparative methodological framework within LCGA. Specifically, we fit and evaluate multiple LCGA models with varying class structures, comparing their model fit indices, classification accuracy, and interpretability. This systematic approach ensures a robust statistical foundation for capturing the complexity of weight gain patterns, ultimately guiding the selection of the most appropriate classification for predictive modeling and clinical decision-making. Building on Nkhoma et al. (n.d.) This study aimed to identify and characterize distinct body weight gain trajectories among PLHIV, comparing DTG treatment-naïve and treatment-experienced individuals. Identifying the most appropriate number of latent classes is crucial for ensuring that the model adequately captures the diversity of weight gain trajectories while maintaining interpretability for clinical and public health applications.
By identifying distinct body weight gain trajectories using LCGA, this study will enable clinicians to pinpoint subgroups of patients at higher risk of accelerated weight gain. Early identification of such individuals can facilitate timely interventions, including nutritional counseling, lifestyle modifications, metabolic screening, and treatment adjustments. These predictive processes could significantly improve patient outcomes by mitigating both metabolic and immunological complications, ensuring a better quality of life while maintaining viral suppression.
2. Materials and Methods
This retrospective observational study utilized secondary data from 40 health facilities located in eight districts across southern and central Malawi, all supported by the Elizabeth Glaser Pediatric AIDS Foundation (EGPAF). The study population comprised people living with HIV (PLWH) who either initiated or transitioned to Dolutegravir (DTG)-based antiretroviral therapy (ART) and were alive between 2018 and 2021. The selected health facilities included both government-owned and Christian Health Association of Malawi (CHAM) establishments. Body weight measurements were routinely recorded at treatment initiation (baseline) and at 3-month intervals over a 24-month follow-up period to enable longitudinal assessment of health outcomes. Retrospective data were extracted from both electronic and paper-based registers using routinely collected patient-level HIV treatment information.
The study population comprised adolescents and adults aged 15 years and older who were either initiating or transitioning to a DTG-based regimen during the study period. Data abstraction was conducted between 2017 and 2020, prior to the full national rollout of DTG. Stratified random sampling was used to select ART patients receiving care between January 2017 and March 2020. Children under 15 years of age were excluded. Additionally, patient records without documented weight or with data quality concerns, such as extreme weight or height outliers—were excluded from the analysis.
To identify distinct subgroups of patients with similar patterns of body weight change over time, we applied Latent Class Growth Analysis (LCGA). LCGA is a person-centered statistical technique that uncovers unobserved (latent) classes of individuals based on their longitudinal trajectories. In this study, patients were classified into latent subgroups according to their unique trajectories of weight change over the 24-month follow-up period. The LCGA model estimated two key parameters for each individual: the intercept, representing the baseline (initial) weight, and the slope, indicating the rate of weight change over time. These parameters were used to define and distinguish the trajectory classes. The intercepts reflected patients’ starting weights at the time of DTG initiation or switch, while the slopes captured the direction and magnitude of weight change during the follow-up period. To ensure meaningful interpretation, the clinical relevance of each latent class was assessed by examining the derived weight trajectories in the context of real-world treatment experiences. Special attention was given to differentiating patterns between ART-naïve and ART-experienced individuals, allowing for a more nuanced understanding of treatment effects on weight gain.
2.1. Sample and Data Source
The study sample comprised 3525 adolescent and adult HIV-positive patients receiving DTG-based ART. Eligibility criteria for receiving DTG required participants to be aged 18 years or older and have at least three recorded body weight measurements during the study period. Two groups were compared in this study: patients who switched to DTG from another regimen, (ART-experienced = 1299) and patients who initiated treatment with DTG as their first regimen, (ART-naïve patients = 2229: Clinical parameters were extracted from medical records, including patient cards, ART registers, CD4 count logbooks, and laboratory registers. “Time 0” was defined as the point of regimen change to DTG for ART-experienced patients or the initiation of DTG-based ART for ART-naïve patients. We utilized two main data sources: the Malawi District Health Information Software version 2 (DHIS2) and facility-based ART electronic medical records systems (EMRS).
The parameters retrieved included: demographics: gender, and date of birth. Anthropometrics: weight (kg) at ART initiation and during follow-up, height (cm) at ART initiation date, ART Data: regimen type, regimen start and stop dates, ART start date, and treatment outcome, HIV-Related Data: date of confirmed HIV diagnosis, date of treatment initiation, viral load results and viral load capture date, CD4 cell counts, and duration of viral suppression until Time 0.
Data were obtained from ART registers, patient cards, laboratory logbooks, HIV Testing and Counseling (HTC) registers, viral load registers, CD4 count registers, and electronic medical records (EMR). The facilities were sampled from districts in the central region (Mchinji, Dedza, Ntcheu) and southern region (Blantyre, Neno, Thyolo, Zomba, Chiradzulu).
2.2. Data Collection
We obtained routinely collected DTG based regimen treatment patient-level data for people receiving HIV care in EGPAF-supported ART facilities in Malawi. Data collection tools, developed in accordance with the study protocol, were digitized and deployed online for use across the sampled health facilities. Twenty-one nurses and clinicians were recruited to collect the data using tablets configured with ODK-X software for quick and secure online data transfer. Data were synchronized to a central server every two days after verification and proofreading by field supervisors. Quality control measures included: embedded logic checks during data entry and random sampling of data by supervisors to ensure accuracy, completeness, and protocol adherence. A standardized data extraction was designed and administered to ensure consistent and comprehensive data captured across all 40 targeted health facilities.
2.3. Inclusion and Exclusion Criteria
Patients were included into the study if they were on ART and alive between 2018 and 2021 and data values for the following key variables were available at all data capture points: weight, regimen type, age, and sex. Patients were excluded from this study if they enrolled on ART after November 2020, had missing data values on the key variables (weight, regimen type, age, and sex) at any data capture point.
2.4. Sampling Techniques and Sample Size Determination
A single-stage sampling technique using probability proportional to size (PPS) was employed to select 40 health facilities from the 179 EGPAF-supported sites across eight districts in southern and central Malawi. Facilities were stratified by district, and within each district, sites were randomly selected with the probability of selection proportional to the number of ART patients served. Although this was a retrospective record review, we applied standard sample size estimation principles to determine the number of patient records to abstract from the selected sites. The minimum sample size was guided by an assumed prevalence of 50% for significant weight gain, a 95% confidence level, a 2% margin of error, and a design effect of 2.0 to account for clustering at facility level. An additional 10% inflation was applied to address possible exclusions due to missing or implausible values. Based on these considerations, we aimed to extract at least 3500 records, ultimately selecting 3525 patient records from 40 health facilities.
2.5. Statistical Analysis
Descriptive statistics were used to summarize patient characteristics, with means, medians, and standard deviations (SDs) for continuous variables, and proportions for categorical variables. Group differences in mean body weight gain were assessed using independent t-tests, stratified by gender, ART experience (ART-naïve vs. ART-experienced), and age categories.
To evaluate the performance of different models in capturing heterogeneity in body weight gain among individuals on dolutegravir (DTG)-based regimens, we applied and compared latent variable models: within Latent Class Growth Analysis (LCGA),. LCGA extends LCA by incorporating a longitudinal dimension, allowing for trajectory-based classification while assuming class-specific fixed effects for intercepts and slopes (Jung & Wickrama, 2008). LCGA included fixed and random effects for class membership and estimated posterior probabilities to assign individuals to latent classes. Model selection was guided by statistical fit indices, including Akaike Information Criterion (AIC), Model performance was systematically compared using multiple evaluation criteria, including model fit indices (Akaike Information Criterion (AIC), Bayesian Information Criterion (BIC), log-likelihood, and entropy), classification quality (posterior probabilities), and the interpretability of the identified trajectories. The objective was to determine the most robust approach for capturing heterogeneity in weight gain patterns.
To explore heterogeneity further, the study examined potential differences in latent class membership across ART status (ART-naïve vs. ART-experienced), sex (male vs. female), and age groups (categorized into age bands). A series of comparative analyses were conducted to assess how the distribution of latent classes varied across these subgroups. Chi-square tests were used to test for significant associations between latent class membership and ART status, sex, and age. Classification accuracy was evaluated using Average Posterior Probability (AvePP), which measures the certainty of individuals being assigned to their respective latent class. AvePP values greater than 0.7 indicated high classification certainty. Bayesian Information Criterion (BIC), and log-likelihood ratio tests (Nylund et al., 2008), ensuring an optimal balance between goodness-of-fit and model interpretability.
“T-tests were conducted to compare mean body weight gain between male and female patients, and between treatment-naïve and treatment-experienced individuals All models were implemented in R (R Core Team, 2019), utilizing the tidyLPA (Rosenberg et al., 2018) lcmm (Proust-Lima et al., 2017)), and lavaan (Rosseel, 2012) packages. Missing data were handled using Full Information Maximum Likelihood (FIML) estimation under the assumption of Missing at Random (MAR) (Enders & Tofighi, 2008). Descriptive analyses for key demographic variables and all statistical tests were performed at a 5% significance level.
Latent Class Growth Analysis (LCGA)
Five latent class LCGA models were fitted to identify distinct body weight gain trajectories among individuals on DTG-based regimens. LCGA is a special case of Growth Mixture Modeling (GMM) that assumes no within-class variability in individual trajectories by fixing random effects (intercepts and slopes) to zero within each class. The lcmm package (Proust-Lima et al., 2017) was used to estimate models with fixed variances and covariances within classes. This assumption allows for the identification of distinct, homogeneous subgroups while simplifying model estimation. The model included linear and quadratic slopes, enabling the capture of both steady and accelerating (or decelerating) weight gain trajectories over time. The best fit model with LCGA was determined using model fit indices such as the Akaike Information Criterion (AIC), Bayesian Information Criterion (BIC), sample-size adjusted BIC (SSBIC), and entropy, alongside the interpretability of the estimated trajectories. Class membership was assigned probabilistically using posterior probabilities, ensuring that individuals were optimally classified into the most appropriate latent trajectory.
Since LCGA does not allow individual variation within classes, residual variances were fixed to zero, and all individuals within a given class followed the same growth trajectory. To address missing data, Full Information Maximum Likelihood (FIML) estimation was employed under the assumption of Missing at Random (MAR).
This LCGA approach enabled the identification of distinct subpopulations with differential weight gain trajectories while maintaining a parsimonious model structure. The findings underscore the heterogeneity in body weight changes associated with DTG-based ART regimens and highlight the utility of LCGA in identifying meaningful patient subgroups based on growth patterns
2.6. Sensitivity Analysis
Sensitivity analyses were conducted to assess the robustness of the identified trajectory classes and to determine the optimal number of latent classes. Competing LCGA models ranging from two to five classes were evaluated using multiple statistical criteria, including the Akaike Information Criterion (AIC), Bayesian Information Criterion (BIC), entropy values, and the Lo–Mendell–Rubin (LMR) likelihood ratio test. The indices were examined alongside the clinical as well as substantive interpretability of the classes. While models with additional classes yielded marginal improvements in AIC and BIC values, they resulted in small or poorly defined subgroups with limited practical relevance. Conversely, models with fewer number of classes over-simplified the observed heterogeneity in body weight gain. The four-class solution demonstrated the most appropriate balance between statistical fit, classification accuracy, and clinical interpretability, and was therefore retained as the final model for subsequent analyses.
2.7. Ethical Considerations
Ethical approval for the study was obtained from the National Health Sciences Research Committee (NHSRC) of Malawi’s Ministry of Health, (protocol V2.09 # 18/09/2139), and registered with USA’s Office of the Human Research Protections (OHRP) IRB # IRB00003509, FWA 99999576. Ethical review authorities in 40 of the participating health facilities independently reviewed and approved the data collection protocols from their facilities. No Individual written consent was required because this was a retrospective data collection process where there was no direct contact with patients. No identifiers (ART numbers, names, home addresses, or phone numbers) were extracted from any of the data sources used. Data was collected anonymously and solely from hospital records.
3. Results
3.1. Descriptive Analysis of the Sampled Participants
Table 1 presents the descriptive characteristics of the study’s 3525 participants. The demographic profile summarizes the cohort’s age, sex, body weight, and treatment outcomes using median and interquartile ranges. The median age was 33 years, with an interquartile range (IQR) of 19 years, indicating moderate variability. Females comprised 62.6% (n = 2208) of the cohort, while males accounted for 37.4% (n = 1317). The median body weight was 53 kg, with an IQR of 13 kg, reflecting moderate dispersion in body weight value.
Most participants (84.9%, n = 2991) were alive and actively receiving treatment, suggesting high levels of treatment retention. A smaller proportion of the cohort (7.5%, n = 265) had defaulted on treatment, while 0.7% (n = 26) were reported as deceased. Additionally, 0.1% (n = 2) had stopped treatment, and 6.8% (n = 239) had transferred out to other facilities. An analysis of body weight trajectories within the cohort revealed that Class 3, representing minimal or no body weight gain, was the largest subgroup, comprising 84.3% (n = 2972) of participants. Class 1, (moderate body weight gain), accounted for 8.8% (n = 310), while Class 2, (rapid body weight gain), included 5.9% (n = 211). Class 4, (unique weight gain patterns), was the smallest subgroup, comprising at 0.9%. These diverse patterns in body weight gain trajectories may be influenced by individual variations in treatment response, adherence to treatment, and other demographic or clinical factors.
Error! Reference source not found. presents the baseline demographic and body weight characteristics of the 3525 study participants, stratified by DTG treatment-naive and treatment-experienced status. Among the treatment-experienced group (n = 1296), the median age was 36 years, with an interquartile range (IQR) of 27 years. The treatment-naive group (n = 2229 participants) were younger on average, with a median age of 31 years and a narrower IQR of 15 years, reflecting less variability in age distribution as compared to the treatment naïve patients. At the first ART clinic visit(baseline), body weights differed between the two groups. Treatment-experienced patients had a median weight of 50.1 kg with IQR of 16, while treatment-naive participants had a median baseline body weight of 54.4 kg, with a smaller IQR of 11 kg, reflecting less variability in body weight. These differences in baseline body weight are likely to be associated with differences in treatment history, disease progression, or other underlying factors. Sex distribution showed that females constituted the majority in both groups. Among treatment-experienced participants, 64.7% (n = 839) were females, compared to 61.4% (n = 1369) in the treatment-naive group.
Table 2.
Descriptive Characteristics by Treatment Status.
Table 2.
Descriptive Characteristics by Treatment Status.
| (N = 3525) |
|---|
| Variable |
Category |
Treatment Experienced (n = 1296) |
Treatment Naive (n = 2229) |
| Age (Years) |
Mean (SD) |
35.0 (14.9) |
32.6 (1.3) |
| Min < Median < Max |
15 < 36 < 81 |
15 < 31 < 81 |
| IQR |
27 (0.4) |
15 (0.3) |
| Sex |
Male |
457 (35.3) |
860 (38.6) |
| Female |
839 (64.7) |
1369 (61.4) |
| Overall Weight (kg) |
Mean (SD) |
49.6 (13.0) |
54.5 (10.4) |
| Min < Median < Max |
20.1 < 50.1 < 105 |
21 < 54.4 < 125 |
| IQR (CV) |
16 (0.3) |
11 (0.2) |
| Patient Treatment Outcome on Data Collection Date |
Alive and on Treatment (0) |
1610 (89.6) |
1831 (82.2) |
| Dead (1) |
10 (0.8) |
16 (0.72) |
| Defaulted (2) |
62 (4.8) |
203 (9.1) |
| Stopped (3) |
2 (0.2) |
0 |
| Transferred Out (4) |
61 (4.7) |
178 (7.9) |
| Proportion of Patients by Class |
Class 1 |
289 |
21 |
| Class 2 |
128 |
83 |
| Class 3 |
1796 |
1176 |
| Class 4 |
16 |
16 |
3.2. Determining the Number of Latent Classes of Weight Gain Patterns
To identify the most suitable model for our data, we fitted 2- to 5-class Latent Class Growth Analysis (LCGA) models and evaluated their performance using key model fit statistics.
Table 3, presents the model fit results. Specifically, we used Akaike Information Criterion (AIC), Bayesian Information Criterion (BIC), and log-likelihood values and Entropy values to guide model selection. These criteria allowed us to assess the trade-off between model complexity and goodness of fit. By systematically comparing fit indices and log-likelihood values across the different models, we aimed to determine the optimal number of latent classes that best captures the underlying patterns in body weight trajectories.
Table 3 compares key model fit statistics for LCGA models with different numbers of latent classes (2 to 5). We used AIC, BIC, and log-likelihood values to assess fit and parsimony of each model. Lower AIC and BIC and high log likelihood values suggest a better balance between model complexity and data fit. Among the fitted models, the 4-class solution (AIC = 41,786.47; BIC = 41,866.65) achieved the best fit while maintaining interpretability. The 5-class model, which has higher AIC (42,150.67) and BIC (42,249.35) when compared with 4-class model also failed to converge, indicating instability. Contrary, the 2-class model, while more parsimonious, shows a poorer fit with higher AIC and BIC values (42,173.45 and 42,216.62), implying that it oversimplifies the underlying heterogeneity in the data. 5-class became too complex and failed to converge.
Based on the comparison of fit indices, the 4-class model emerged the best-fit model for this dataset. It demonstrates the lowest AIC and BIC values, implying that it adequately captures the underlying variability in weight gain trajectories while avoiding excessive complexity. Additionally, the 4-class solution converged successfully, supporting its stability and robustness as compared to the 5-class model, where convergence was not achieved despite additional parameters. These results indicate that the 4-class model achieved the optimal balance between parsimony and model fit, making it the most appropriate choice for describing the heterogeneity in weight trajectories among individuals on antiretroviral therapy (ART) in this study.
3.2.1. Latent Classes Membership
Table 4 summarizes the class membership and distribution of participants according to the latent classes identified through the LCGA model. The analysis reveals that Class 3 (Minimal/No Body Weight Change) contains the largest proportion of individuals (84.3%, n = 2972), followed by Class 1 (Moderate Body Weight Gain) at 8.9% and Class 2 (Rapid Body Weight Gain) at 5.9%. Class 4 (Unique Weight Gain Trajectory) represents the smallest proportion, comprising only 0.9% of participants.
3.2.2. Assessing Confidence in Latent Class Membership
The mean of posterior probabilities provides insight into the confidence of class membership assignments. Higher probabilities indicate more distinct and well-defined latent classes. Class 3 exhibits the highest posterior probability (0.9605), reflecting a clear distinction from other classes and high confidence in assigning individuals to this group. Class 1 also shows a strong mean posterior probability (0.8770), indicating reliable classification. Conversely, Class 4 has a posterior probability of 0.8060, suggesting that while most individuals in this class are correctly classified, there may be some ambiguity due to potential overlap with other classes due to lack of strong confidence in membership allocation as shown by its low mean posterior probability. Class 2, with a posterior probability of 0.8242, also shows moderate certainty, although lower than that of Class 3 and Class 1.
Table 5 highlights that Class 3 is the most distinct and confidently identified, while Class 4 displays a somewhat weaker differentiation.
3.2.3. Demographic Characteristics for Each Latent Class
Error! Reference source not found. provides descriptive statistics for each of the four latent classes derived from the analysis of body weight gain trajectories. Class 1, representing 310 individuals, has a mean body weight of 55.0 kg (SD = 9.92) and an average age of 33.2 years with 37.1% of the class membership being males. The majority (93.2%) of patients in Class1 are ART-experienced implying that this class may reflect individuals with minimal or moderate body weight gain after ART switch. Class 2, with 211 individuals, has the lowest mean body weight at 51.2 kg (SD = 12.3) with a mean age of 32.5 years. In this class, females constitute a larger proportion (68.7%), and 39.3% of its membership are ART-naïve, relatively higher as compared to Class 1. This classpotentially reflects those patients experiencing notable initial weight gain after ART initiation.
Class 3, the largest group with 2972 patients in that class, shows moderate weight levels, with a mean weight of 52.5 kg (SD = 11.8) and a mean age of 33.7 years. A notable 39.6% of individuals in this class are ART-naive, suggesting a mixed trajectory of moderate weight gain. The male-to-female ratio is consistent with the other classes, with 62.1% females. Class 4, the smallest class (n = 32), is characterized by a mean weight of 54.0 kg (SD = 11.8) and a younger mean age of 30.3 years. Interestingly, this class has an equal split between ART-naive and ART-experienced individuals (50.0% each) and a higher proportion of females (68.8%). This group may represent patients with unique or extreme body weight trajectories. Overall, these distinct classes reflect varying patterns of weight gain influenced by ART exposure, age, and sex distributions, offering valuable insights into body weight trajectories among people living with HIV.
Table 6.
Demographic characteristics by Latent Class.
Table 6.
Demographic characteristics by Latent Class.
| Class |
Mean Weight (SD) |
Mean Age |
n |
Male, n (%) |
Female, n (%) |
Naive, n (%) |
Experienced, n (%) |
| 1 |
55.0 (9.92) |
33.2 |
310 |
115 (37.1%) |
195 (62.9%) |
21 (6.8%) |
289 (93.2%) |
| 2 |
51.2 (12.3) |
32.5 |
211 |
66 (31.3%) |
145 (68.7%) |
83 (39.3%) |
128 (60.7%) |
| 3 |
52.5 (11.8) |
33.7 |
2972 |
1126 (37.9%) |
1846 (62.1%) |
1176 (39.6%) |
1796 (60.4%) |
| 4 |
54.0 (11.8) |
30.3 |
32 |
10 (31.2%) |
22 (68.8%) |
16 (50.0%) |
16 (50.0%) |
3.2.4. Fitting the Class 4 Latent Class Growth Analysis Model
Based on the AIC and BIC values, the class 4 model provided the best balance between model fit and complexity. AIC = 41,786.47 and BIC = 41,866.65 for 4 = class were the lowest for the class 4 model, as compared to Classes 2, 3 and 5.
Table 7 presents parameter estimates for the class 4 LCGA model.
Table 7 presents the fixed and random effect estimates for body weight trajectories, focusing on Class 4. At baseline, individuals in Class 4 have the highest predicted weight, with an intercept estimate of 90.07 (SE = 3.996). This is significantly greater than the intercepts observed in the other classes, suggesting that members of Class 4 start at a substantially higher weight. The period effect for Class 4 is 0.076 (SE = 0.085), indicating a slight positive trend in weight over time; however, this effect is not statistically significant (
p = 0.373), suggesting minimal overall change in weight within this class. The variance of the random intercept is 25.24, highlighting notable between-individual differences in baseline weight within Class 4 that are not explained by the fixed effects alone. Additionally, the residual standard error is 5.03 (
SE = 8.96), reflecting a moderate level of within-person variability that remains unexplained by the model. These results suggest that Class 4 represents a group with high baseline body weight and relatively stable weight gain trajectories over time, with substantial individual variability.
3.3. Weight Gain Analysis of TG Treatment Naive and Experienced Patients
3.3.1. Treatment-Naïve Patients
Weight gain among treatment-naïve patients vary widely, highlighting the importance of understanding distinct weight gain patterns in this group. This analysis identified four latent classes of weight gain trajectories, each with unique baseline characteristics and different patterns of weight gain over time. The findings as shown Error! Reference source not found. reveal clear differences in weight gain trajectories across the four classes. The model indicates that Class 1 (b = -1.99, SE = 0.48, p < 0.001) and Class 3 (b = 1.76, SE = 0.49, p < 0.001) have statistically significant intercepts, reflecting distinct initial weight differences compared to the reference Class 4. Class 2 has a non-significant intercept (b = -0.27, SE = 0.53, p = 0.61), implying that its baseline weight is similar to that of Class 4.
Table 8.
Treatment Naive Parameter estimates.
Table 8.
Treatment Naive Parameter estimates.
| Class |
Intercept (b) |
Standard Error (SE) |
p-value |
Statistical Significance status |
Interpretation |
| Class 1 |
-1.99 |
0.48 |
<0.001 |
Significant |
Lower baseline weight compared to Class 4 |
| Class 2 |
-0.27 |
0.53 |
0.61 |
Not Significant |
Similar baseline weight to Class 4 |
| Class 3 |
1.76 |
0.49 |
<0.001 |
Significant |
Higher baseline weight compared to Class 4 |
| Class 4 |
Reference |
– |
– |
– |
Reference group for comparison |
The analysis results as presented in
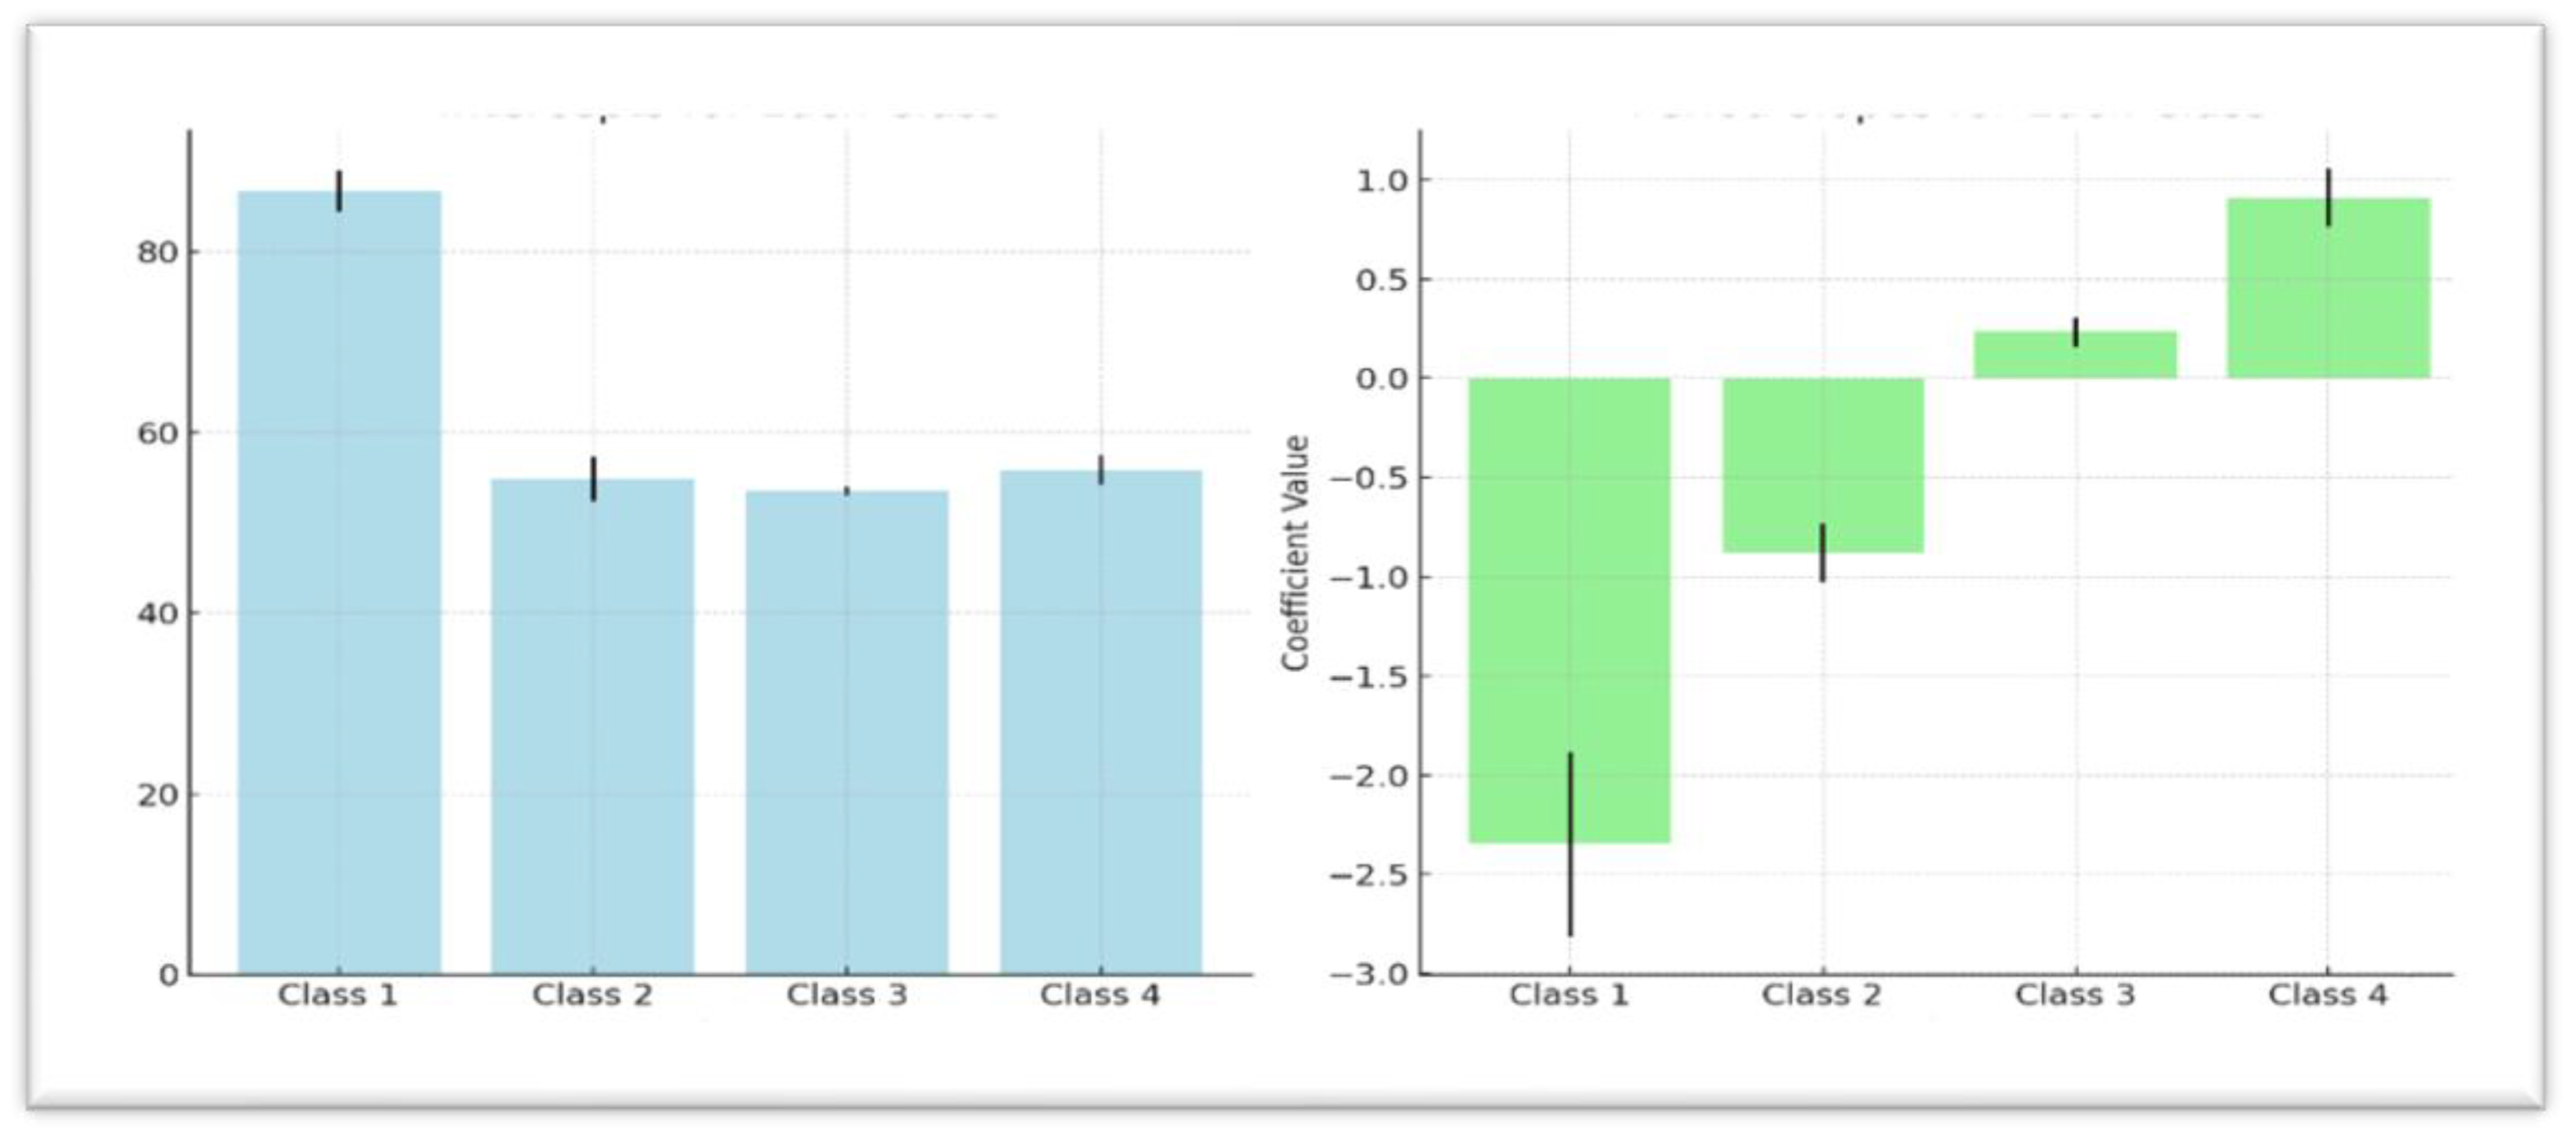
Table 10 further showed that Class 1 starts with the highest baseline weight (Mean = 86.71, SE = 2.32,
p < 0.001) but experiences significant weight loss over time, as indicated by a negative period slope (b = -2.35, SE = 0.46,
p < 0.001). Similarly, Class 2 begins with a lower baseline weight (Mean = 54.88, SE = 2.47,
p < 0.001) and also demonstrates a downward weight trend (b = -0.88, SE = 0.15,
p < 0.001) over time. Classes 3 and 4 exhibit more stable or increasing weight gain trajectories, with Class 3 showing a modest but significant weight gain over time (b = 0.23, SE = 0.07,
p = 0.001), with Class 4 having a stronger upward trajectory (b = 0.91, SE = 0.15,
p < 0.001). The quadratic term (b = -0.0064, SE = 0.0033,
p = 0.055) is near significance, suggesting a potential slowing in the rate of weight change over the observed period.
Variance estimates from the analysis indicated considerable heterogeneity in initial baseline weight, as evidenced by a high random intercept variance of 78.14 suggesting notable differences in starting weights across individuals within classes. The residual error of 3.07 (SE = 0.17) points to unexplained within-class variability in weight measurements over time underscoring significant individual-level differences.
Table 9 presents summaries of the findings while
Figure 1 show the baseline mean weights for each class with error bars in comparison with trajectory period slope. The error bars represent uncertainty of the estimates for each of the classes.
3.3.2. Weight Gain Analysis of DTG Treatment Naïve Group Adjusted for Sex and Age
Table 10 presents the effects of sex and age on body weight trajectories across the four latent classes among treatment-naïve patients. In Class 1, neither sex nor age had a significant effect on weight trajectories. A small, non-significant weight gain was observed for sex (
b = 0.20, 95% CI [-3.47, 3.87]), and age showed no meaningful influence. In Class 2, both predictors had significant effects. Age was positively associated with weight gain (
b = 0.28, 95% CI [0.16, 0.40]), and sex played a notable role, with males gaining significantly more weight than females (
b = 4.94, 95% CI [2.12, 7.76]). In Class 3, sex had a substantial negative effect on weight (
b = -2.81, 95% CI [-3.65, -1.97]), while age had a modest, yet statistically significant, negative effect (
b = -0.05, 95% CI [-0.09, -0.01]).
In Class 4, both sex and age exerted strong, statistically significant influences on weight trajectories. Males experienced a large increase in weight (b = 15.32, 95% CI [7.50, 23.14]), and age was positively associated with weight gain (b = 1.03, 95% CI [0.64, 1.42]), suggesting that older individuals in this class gained more weight.
Table 9.
Parameter Estimates for Weight Trajectories among Treatment Naive Patients.
Table 9.
Parameter Estimates for Weight Trajectories among Treatment Naive Patients.
| Parameter |
Class 1 |
Class 2 |
Class 3 |
Class 4 |
| Intercept |
86.71 (2.32) *** |
54.88 (2.47) *** |
53.56 (0.49) *** |
55.82 (1.60) *** |
| Period Slope |
-2.35 (0.46) *** |
-0.88 (0.15) *** |
0.23 (0.07) ** |
0.91 (0.15) *** |
| Quadratic Term (Period2) |
-0.006 (0.003) |
-0.006 (0.003) |
-0.006 (0.003) |
-0.006 (0.003) |
Table 10.
Weight Gain Analysis Adjusted for Sex and Age.
Table 10.
Weight Gain Analysis Adjusted for Sex and Age.
| Parameter |
Class 1 |
Class 2 |
Class 3 |
Class 4 |
| |
Estimates b (se) |
95% CI |
Estimates b (se) |
95% CI |
Estimates b (se) |
95% CI |
Estimates b (se) |
95% CI |
| Intercept |
30.75 (2.77) *** |
[25.31, 36.19] |
47.66 (3.95) *** |
[39.91, 55.41] |
59.06 (1.09) *** |
[56.92, 61.20] |
29.29 (11.43) ** |
[6.89, 51.69] |
| Period |
-0.27 (0.20) |
[-0.66, 0.12] |
-1.75 (0.18) *** |
[-2.10, -1.40] |
0.18 (0.09) * |
[0.01, 0.35] |
-3.55 (0.82) *** |
[-5.16, -1.94] |
| Sex: Male |
0.20 (1.87) |
[-3.47, 3.87] |
4.94 (1.44) *** |
[2.12, 7.76] |
-2.81 (0.43) *** |
[-3.65, -1.97] |
15.32 (3.98) *** |
[7.50, 23.14] |
| Sex: Female (ref) |
– |
– |
– |
– |
– |
– |
– |
– |
| Age |
-0.04 (0.06) |
[-0.16, 0.08] |
0.28 (0.06) *** |
[0.16, 0.40] |
-0.05 (0.02) ** |
[-0.09, -0.01] |
1.03 (0.20) *** |
[0.64, 1.42] |
3.3.3. Treatment-Experienced Patients
LCGA model was fitted on the sub-dataset of DTG-experienced patients to investigate the trajectories of weight changes over time. This four-class model, fitted with 1,296 subjects, revealed significant variations in baseline weight levels across the classes, as evidenced by the statistical significance of the intercepts for all classes (Class 1: b = 1.48, p < 0.001; Class 2: b = 2.45, p < 0.001; Class 3: b = 2.24, p < 0.001), indicating distinct baseline differences relative to the reference class. An examination of the effect of the period on weight gain within each class shows that Classes 1, 2, and 3 did not exhibit significant weight changes over time (Class 1: b = -0.02, p = 0.48; Class 2: b = 0.01, p = 0.69; Class 3: b = 0.05, p = 0.17). In contrast, Class 4 displayed a statistically significant weight gain over the observed period (b = 0.20, ** p = 0.00196), suggesting a distinct upward trajectory in this subgroup.
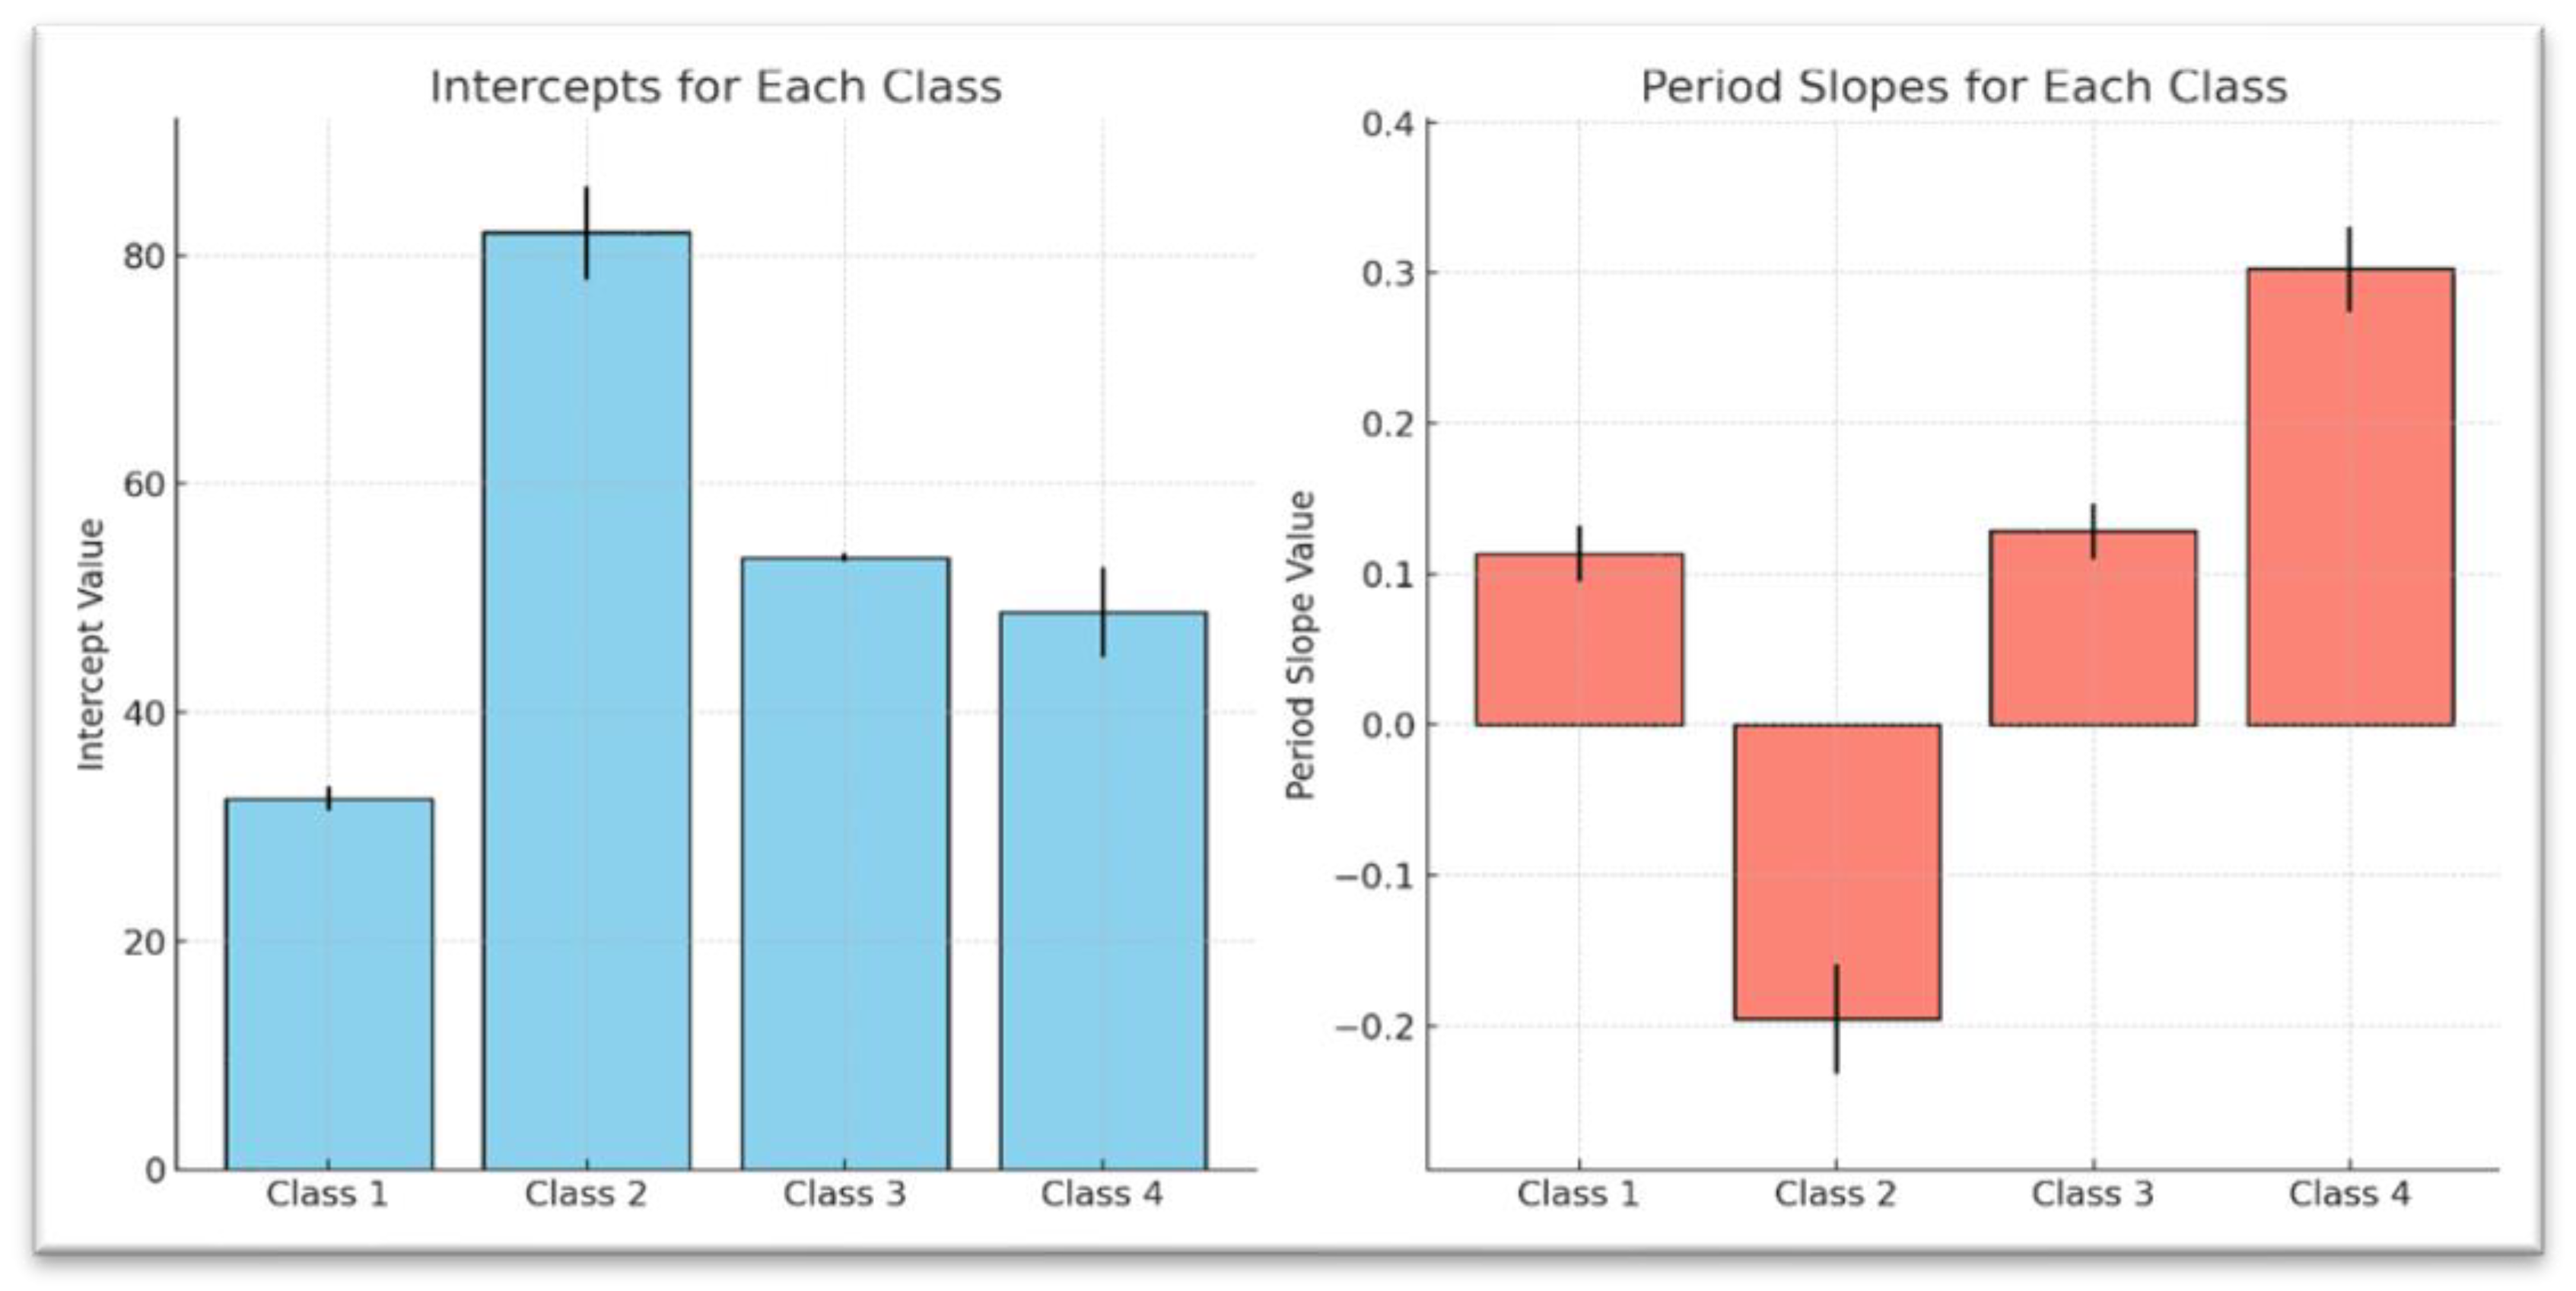
As presented in
Table 11, results further highlight these distinct weight trajectories across the four latent classes. Class 1 begins with a relatively lower baseline weight (Intercept: M = 28.93, SE = 0.82,
p < 0.001) and demonstrates a slight but nonsignificant downward trend over time (Period Slope: b = -0.02, SE = 0.03,
p > 0.05). Class 2, which starts with a higher baseline weight (Intercept: M = 56.90, SE = 1.07, ***
p < 0.001), exhibits a stable weight trajectory over time (Period Slope: b = 0.01, SE = 0.03,
p > 0.05). Class 3, with an intermediate baseline weight (Intercept: M = 46.98, SE = 1.59,
p < 0.001), shows a modest, nonsignificant upward trend (Period Slope: b = 0.05, SE = 0.04,
p > 0.05). By contrast, Class 4 starts with the highest baseline weight (Intercept: M = 78.49, SE = 1.75,
p < 0.001) and experiences a statistically significant weight gain over time (Period Slope: b = 0.20, SE = 0.07,
p < 0.001). Interestingly, all four classes share a similar negative quadratic term (Quadratic Term: b = -0.006, SE = 0.003), suggesting a potential deceleration in the rate of weight change over time, although it was not statistically significant (
p = 0.055). These findings emphasize distinct baseline weight levels and varying long-term trends, with Class 4 standing out due to its notably steeper upward trajectory.
Variance-covariance estimates reveal significant heterogeneity in baseline weights across individuals, as indicated by a random intercept variance of 19.70 (95% CI 95% CI: [18.27, 21.31] suggesting meaningful heterogeneity in baseline weight. The residual standard error of 4.43 suggests that there remain some unexplained variations in the data. Approximately 49.9% of the variability in body weight remains unexplained by the model and is attributed to within-individual fluctuations not captured by sex, age, or random intercepts
These findings highlight the heterogeneous nature of body weight gain trajectories in DTG-experienced patients and provide a foundation for further research into class-specific factors influencing weight changes in this population. A summary of the results is presented in
Table 12, while
Figure 2 illustrate the baseline mean weights for each class with error bars, showing the uncertainty of the estimates and providing a visual comparison of the trajectory period slopes.
3.4. Weight Gain Analysis of DTG Treatment Experienced Group Adjusted for Sex and Age
When we adjusted for sex and age, the model results as presented in.
Table 13 revealed significant differences in weight trajectories across classes. Sex had a notable effect on weight changes, particularly in Class 2, Class 3, and Class 4. Males in Class 2 showed a positive association with weight (b = 4.30,
p = 0.002), while males in Class 3 experienced a significant negative association (b = -6.55,
p < 0.001). In Class 4, males had a significant positive association with weight gain (b = 13.87,
p < 0.001). These findings suggest that sex plays a key role in shaping weight trajectories, with male patients in certain classes exhibiting notable differences in weight changes over time.
Age also influenced weight gain trajectories, especially in Class 2 and Class 4. In Class 2, older individuals showed a significant positive relationship with weight (b = 0.36, p < 0.001), while in Class 4, the association was even stronger (b = 0.63, p < 0.001), indicating that age contributed to more weight gain over time in aged population. These adjustments highlight the importance of considering both sex and age when examining weight changes in DTG-experienced patients.
4. Discussions
This retrospective analysis examined weight gain patterns among treatment-naive and treatment-experienced individuals on dolutegravir (DTG)-based antiretroviral therapy. The study identified four distinct latent classes of weight gain trajectories, differentiated by baseline body weight and the direction and magnitude of weight change over time. Class 4, which comprised individuals with the highest baseline weight primarily treatment-experienced showed a statistically significant upward trajectory, indicating continued weight gain. In contrast, the other three classes, which included a mix of naive and experienced patients, exhibited either stable or statistically non-significant weight changes over the follow-up period.
4.1. Baseline Characteristics Between DTG Treatment-Naive and Experienced Groups:
This study found that treatment-naïve patients were relatively younger (M = 32.6 years) than treatment-experienced individuals (M = 35.0 years), suggesting that the former group may consist of more recently diagnosed individuals or those yet to be initiated on antiretroviral therapy (ART). Additionally, treatment-naïve participants exhibited a higher median baseline body weight (54.4 kg) compared to their treatment-experienced counterparts (50.1 kg), although the latter demonstrated greater variability in weight. These findings are consistent with reports by Lake et al. (2020) who noted that treatment-experienced individuals often present with weight profiles shaped by prolonged ART exposure and possible drug-related metabolic changes.
The latent class trajectory analysis revealed distinct differences in weight gain patterns between treatment-naïve and treatment-experienced patients on dolutegravir (DTG)-based regimens. Among treatment-naïve individuals, greater heterogeneity in weight change was observed, with some classes experiencing notable weight loss (e.g., Class 1: M = 86.71 kg, b = -2.35, p < 0.001), and others demonstrating significant weight gain (Class 4: b = 0.91, p < 0.001). This variability aligns with previous findings suggesting that immune reconstitution and initial metabolic adaptation after ART initiation may contribute to dynamic weight changes (Bourgi et al., 2020). Furthermore, the impact of sex and age was more pronounced in the naïve cohort, particularly in Classes 2 and 4, where older males exhibited greater weight gain; supporting similar conclusions drawn in studies from sub-Saharan Africa
In contrast, treatment-experienced patients exhibited more stable or plateauing weight trajectories. Among this group, only Class 4 demonstrated a statistically significant increase in weight over time (b = 0.20, p < 0.001). Baseline weight levels were generally higher and less variable compared to treatment-naïve individuals, which may indicate that prior ART exposure moderates subsequent physiological responses to DTG. These findings are in line with the observations of Norwood et al. (2020) and Sax et al. (2021), who found attenuated weight gain among patients switching to DTG after prior ART use, suggesting a potential ceiling effect or metabolic homeostasis following extended therapy. Notably, age and sex effects were more consistent in the experienced group, with older males again showing significant associations with increased weight gain, particularly in Class 4. This observation is supported by (Maphosa et al., 2024) who found that age-related metabolic changes and sex-specific fat distribution may influence ART-related weight dynamics.
Overall, these findings suggest that treatment-naïve individuals are more susceptible to rapid and variable changes in body weight ranging from weight loss to substantial gain likely driven by immune reconstitution, initial regimen effects, and metabolic adaptation. Meanwhile, treatment-experienced individuals exhibit more stable trajectories, potentially due to prior ART-related metabolic adaptations or drug-class transitions that influence weight response upon switching to DTG-based therapy
4.2. Majority of Patients Experience Minimal or No Weight Gain
A key finding of this study is that the largest latent class (Class 3), comprising 84.3% of the cohort, experienced minimal or no change in body weight over time, regardless of treatment status. This result aligns with findings from other cohort studies and randomized controlled trials suggesting that while dolutegravir (DTG)-based regimens are associated with weight gain, the effect is not uniform across all patients. For instance, Sax et al. (2020) and Norwood et al. (2020) reported that a substantial proportion of individuals on DTG exhibit stable weight, particularly among those who are treatment-experienced or have higher baseline body mass index (BMI).
This trajectory may reflect a stabilization effect among individuals with prior ART exposure, whose metabolic profiles have adjusted over time, or among those with no underlying risk factors for rapid weight gain. Moreover, W. D. F. Venter et al. (2020) in the ADVANCE trial observed that while significant weight gain was evident in some subgroups particularly younger women and those with low baseline BMI; the majority of participants experienced either modest or no substantial change in body weight. Conversely, studies such as (Bourgi, Rebeiro, et al., 2020) and (Lake & Trevillyan, 2021) have highlighted that DTG initiation, especially in ART-naïve populations, can result in pronounced weight increases for some patients. These studies caution that focusing on average effects may mask clinically meaningful subgroup variation. Therefore, while our finding reinforces the notion that significant weight gain is not universal, it also underscores the importance of identifying and closely monitoring subgroups at higher risk for metabolic complications.
Understanding that the majority of patients are unlikely to experience extreme weight changes may provide reassurance to both clinicians and patients initiating DTG. However, this does not diminish the need for routine weight monitoring and metabolic assessment, particularly in resource-limited settings where changes may go unnoticed without structured follow-up.
4.3. Differential Weight Gain Trajectories Between Treatment Groups:
This study revealed divergent weight gain trajectories between treatment-naive and treatment-experienced individuals. Among treatment-naive patients, some exhibited substantial weight loss (Class 1), while others followed stable or increasing trajectories (Classes 3 and 4). In contrast, a greater proportion of treatment-experienced individuals fell into the minimal weight change category (Class 3), suggesting a moderating effect of prior antiretroviral therapy (ART) exposure on subsequent weight trends following initiation of dolutegravir (DTG)-based regimens.
These findings align with previous studies indicating that treatment-naive individuals are more likely to experience pronounced weight changes upon initiating DTG. For instance, Bourgi et al. (2020) and McCann et al. (2021) observed greater weight gain among ART-naive patients, particularly those starting integrase strand transfer inhibitor (INSTI)-based regimens, compared to those switching from non-INSTI-based therapies. The ADVANCE trial (Venter et al., 2022) similarly reported that treatment-naive individuals especially women and those with lower baseline body mass index (BMI) were more susceptible to substantial weight gain.
Conversely, treatment-experienced patients often exhibit more stable metabolic profiles, possibly due to physiological adaptation to ART or prior use of agents known to suppress appetite or alter metabolism, such as efavirenz (Norwood et al., 2020; Sax et al., 2020). Nonetheless, weight gain following a switch to DTG has also been reported among experienced individuals, particularly when transitioning from weight-suppressive regimens (Lake et al., 2020).
Sex- and age-adjusted analyses from this study revealed differential patterns of weight change, with male patients more frequently associated with weight gain than females. This finding is supported by ((Bourgi et al., 2020;Taramasso et al., 2020), who observed higher weight gain among males in specific trajectory classes. However, this contrasts with other studies (Bourgi et al., 2020; Hill et al., 2019); Lake et al., 2020), which identified female sex as a stronger predictor of DTG-associated weight gain. Additionally, older individuals in Class 4 experienced progressive weight increases over 24 months, raising concerns about age-related metabolic risks and potential adverse health outcomes an observation that echoes findings from Sax et al. (2020).
Taken together, these results underscore the importance of considering ART history, demographic characteristics, and baseline metabolic profiles when evaluating weight-related outcomes among people living with HIV. Tailored clinical guidance and continued longitudinal research are needed to better understand how ART combinations influence weight trajectories over time, particularly in resource-limited, high-burden settings.
4.4. Significant Weight Gain in Some Treatment-Naive Patients:
Within the treatment-naive group, considerable heterogeneity in weight trajectories was observed, with a subset of individuals (Class 4) experiencing significant weight gain over time (b = 0.91, SE = 0.15, p < 0.001). This pattern may reflect a physiological rebound in patients with lower baseline body weight, potentially driven by viral suppression, improved appetite, and metabolic restoration following ART initiation. Several studies have documented substantial weight gain among ART-naive individuals initiating dolutegravir (DTG)-based regimens, particularly in populations with advanced disease or malnutrition at baseline ((Bourgi, Rebeiro, et al., 2020; McCann et al., 2021).
D. Venter et al. (2022) during ADVANCE trial found that weight gain was most pronounced in treatment-naive individuals, especially among women and those with lower BMI at ART initiation. The authors attributed this to both drug-related metabolic changes and a return-to-health effect. This aligns with the current findings, which suggest that rapid weight gain in a subset of patients may represent a combination of therapeutic benefit and metabolic vulnerability. However, other studies have raised concerns that such weight gain may not simply reflect healthy recovery. For example, Norwood et al. (2020) and Kousari et al. (n.d.) reported increased risks of developing metabolic syndrome and cardiovascular complications in patients experiencing rapid weight increases after initiating INSTI-based regimens. These findings underscore the importance of differentiating between healthy weight recovery and potentially harmful weight gain.
Overall, the presence of a high-gaining subgroup within the treatment-naive population emphasizes the need for individualized monitoring strategies. Early identification of patients on a trajectory toward excessive weight gain could allow for timely nutritional counselling, lifestyle interventions, and assessment of cardiometabolic risk markers. Future research should explore the biological, behavioural, and contextual factors that predispose certain individuals to substantial weight gain upon ART initiation
4.5. Latent Class Growth Analysis (LCGA) Identified Optimal Weight Gain Models:
This study employed Latent Class Growth Analysis (LCGA) to uncover heterogeneity in body weight trajectories, with a 4-class model offering the best fit. The majority of patients fell into the minimal weight change category (Class 3), while smaller subsets (Classes 1 and 2) exhibited moderate to rapid weight gain. These findings emphasize the importance of recognizing patient subgroups who may be at heightened risk of excessive weight gain, which can inform targeted monitoring and interventions. This heterogeneity aligns with findings from McCann et al. (2021) who reported that weight changes on dolutegravir (DTG)-based regimens are not uniform across populations but vary significantly based on individual characteristics.
Age emerged as a significant predictor of weight gain, particularly in Classes 2 and 4. In Class 2, older age was positively associated with weight gain (b = 0.36, p < 0.001), and this relationship was even more pronounced in Class 4 (b = 0.63, p < 0.001), suggesting that older individuals may be more vulnerable to sustained weight increases over time. These results corroborate findings from (Tse et al., 2023), who reported that individuals aged 60 and above on INSTI-based regimens were more likely to gain weight, potentially due to age-related metabolic changes or comorbidities. However, age was not a significant factor in Classes 1 and 3, indicating that age-related effects on weight may be confined to specific trajectory patterns.
Overall, the identification of distinct weight gain classes underscores the need for personalized clinical management that accounts for prior ART exposure, age, and other demographic factors. Further research should explore how these trajectories relate to long-term metabolic outcomes and whether tailored interventions could mitigate adverse effects in high-risk subgroups.
4.6. Study Limitations
This study provides important insights into body weight gain trajectories among people living with HIV (PLHIV) on DTG-based ART, but several limitations need to be considered when interpreting the findings.
4.7. Selection Bias Due to Geographical Scope
The study included only people living with HIV (PLHIV) receiving care at EGPAF-supported health facilities in Malawi’s central and southern regions. This excludes the northern region entirely, limiting the representativeness of the sample and potentially introducing regional bias due to differences in demographics, nutrition, and healthcare access.
4.8. Limited Covariate Information
Key variables such as dietary intake, physical activity, socioeconomic status, and hormonal status (especially for women) were not available in this study. This limitation reduces the ability to fully explain weight changes and their underlying causes, as these factors could significantly influence body weight trajectories.
4.9. Inconsistent Weight Measurement Intervals
The follow-up weights in the study were recorded at irregular intervals, which may have reduced the precision of the growth trajectory models. More consistent measurements would have allowed for a clearer understanding of the rate and pattern of weight changes over time.
4.10. Possible Misclassification of ART Status
Treatment interruptions or regimen switches that were not recorded could have led to misclassification of ART status, affecting trajectory assignments. This misclassification could introduce error into the analysis, particularly in distinguishing between treatment-naïve and treatment-experienced patients.
5. Conclusions
This study identified four distinct latent classes of body weight gain trajectories among treatment-naïve and treatment-experienced individuals, highlighting important variations in metabolic responses associated with DTG exposure. The most common trajectory, characterized by minimal or no body weight gain, was predominantly observed among treatment-experienced patients, suggesting that extended antiretroviral therapy (ART) may contribute to metabolic stabilization over time. In contrast, trajectories marked by rapid weight gain or unique patterns were more variable and pronounced, particularly among treatment-naïve individuals. These patterns may reflect early physiological changes following ART initiation and underscore the need for vigilant clinical monitoring during the early stages of treatment. Notably, upward trends in weight gain among certain subgroups especially by age and sex—raise important concerns about emerging metabolic risks. Overall, these findings underscore the importance of individualized patient management and the need for targeted strategies to identify and support individuals at risk of adverse metabolic outcomes during ART.
5.1. Implications of Study Findings
Baseline Differences Between Treatment-Naive and Experienced Groups
Treatment-naive patients were younger and had higher baseline body weight than experienced patients, who showed greater weight variability. This suggests that naive individuals are likely early in their HIV care journey, potentially requiring tailored counselling on expected weight changes. Policy should emphasize baseline weight and age assessments to inform individualized nutritional and metabolic monitoring upon ART initiation.
Majority of Patients Exhibited Minimal or No Body Weight Gain
Most participants (84.3%) experienced little to no weight gain. While this finding reassures that DTG does not universally cause weight gain, it underscores the need to avoid generalized assumptions. Routine weight and metabolic monitoring should still be standard, particularly in low-resource settings where early risk detection may be limited.
Distinct Weight Trajectories by Treatment Group
Treatment-naive patients showed more diverse weight trajectories, including both gain and loss, while experienced patients had more stable patterns. This reflects potential immune reconstitution or metabolic adaptation after ART initiation. Programs should prioritize close follow-up for naive patients, especially those with low baseline BMI, and adapt ART counselling accordingly.
Significant Weight Gain in a Subgroup of Treatment-Naive Patients
A subset of naive patients (Class 4) experienced significant weight gain, likely due to both therapeutic rebound and metabolic susceptibility. While some weight gain may indicate treatment success, excessive increases may raise cardiometabolic risks. Clinical guidelines should integrate early screening and preventive interventions; such as diet and exercise counselling; for high-risk patients.
Age and Sex Effects on Weight Gain Trajectories
Older males were more likely to gain weight, especially in Classes 2 and 4. These demographic patterns suggest that age- and sex-specific strategies are needed to manage weight gain risk. Policymakers should consider updating ART monitoring protocols to include age-stratified guidance and community messaging.
Latent Class Growth Analysis (LCGA) Reveals Patient Heterogeneity
The LCGA identified four distinct weight trajectories, with most patients falling in the minimal-change group. Recognizing this heterogeneity supports precision care approaches. Clinicians should move beyond average weight outcomes and use trajectory-based risk stratification to tailor follow-up and interventions for those likely to gain excessive weight.
Author Contributions
Mr. Harrid Nkhoma, the corresponding author, led the conceptualization, methodology design, data curation, formal analysis, investigation, and drafting of the manuscript. Dr. Mulaga, Prof. Kamndaya, and Prof. Kumwenda provided validation, critical review, and overall supervision throughout the study. All authors contributed to the refinement of the manuscript, approved the final version for submission, and agree to be accountable for all aspects of the work.
Funding
This study did not receive any specific grant from funding agencies in the public, commercial, or not-for-profit sectors. All analyses and manuscript preparation were conducted as part of routine research activities within the authors’ institutional roles. The authors remain solely responsible for the content and interpretation of the findings presented.
Acknowledgments
During the preparation of this work the author(s) used ChatGPT in order to [improve language and readability of part of the manuscript. After using this tool/service, the author(s) reviewed and edited the content as needed and take(s) full responsibility for the content of the publication.
Conflicts of Interest
The authors declare that there are no conflicts of interest related to this study. No author has any financial or personal relationships that could have influenced the conduct or reporting of this research. The study was conducted independently, with full adherence to ethical research and publication standards.
References
- Berlin, K. S., Parra, G. R., & Williams, N. A. (2014). An introduction to latent variable mixture modeling (Part 2): Longitudinal latent class growth analysis and growth mixture models. Journal of Pediatric Psychology, 39(2), 188–203. [CrossRef]
- Bourgi, K., Jenkins, C. A., Rebeiro, P. F., Palella, F., Moore, R. D., Altoff, K. N., Gill, J., Rabkin, C. S., Gange, S. J., Horberg, M. A., Margolick, J., Li, J., Wong, C., Willig, A., Lima, V. D., Crane, H., Thorne, J., Silverberg, M., Kirk, G., … Koethe, J. R. (2020). Weight gain among treatment-naïve persons with HIV starting integrase inhibitors compared to non-nucleoside reverse transcriptase inhibitors or protease inhibitors in a large observational cohort in the United States and Canada. Journal of the International AIDS Society, 23(4). [CrossRef]
- Bourgi, K., Rebeiro, P. F., Turner, M., Castilho, J. L., Hulgan, T., Raffanti, S. P., Koethe, J. R., & Sterling, T. R. (2020). Greater Weight Gain in Treatment-naive Persons Starting Dolutegravir-based Antiretroviral Therapy. Clinical Infectious Diseases, 70(7), 1267–1274. [CrossRef]
- Enders, C. K., & Tofighi, D. (2008). The impact of misspecifying class-specific residual variances in growth mixture models. Structural Equation Modeling, 15(1). [CrossRef]
- Hill, A., Venter, W. F., Delaporte, E., Sokhela, S., Kouanfack, C., Moorhouse, M., McCann, K., Simmons, B., & Calmy, A. (2019). Progressive rises in weight and clinical obesity for TAF/FTC/DTG and TDF/FTC/DTG versus TDF/FTC/EFV: ADVANCE and NAMSAL trials. JOURNAL OF THE INTERNATIONAL AIDS SOCIETY, 22.
- Jung, T., & Wickrama, K. A. S. (2008). An Introduction to Latent Class Growth Analysis and Growth Mixture Modeling. Social and Personality Psychology Compass, 2(1), 302–317. [CrossRef]
- Koethe, J. R., Lagathu, C., Lake, J. E., Domingo, P., Calmy, A., Falutz, J., Todd, •, Brown, T., & Capeau, J. (2020). HIV and antiretroviral therapy-related fat alterations.
- Kousari, A. E., Wilson, M. P., Hawkins, K. L., Bandali, M. M., Henao-Martínez, A. F., Gardner, E. M., & Erlandson, K. M. (n.d.). Weight change with antiretroviral switch from integrase inhibitor or tenofovir alafenamide-based to Doravirine-Based regimens in people with HIV Affiliations Expand.
- Lake, J. E., & Trevillyan, J. (2021). Impact of Integrase inhibitors and tenofovir alafenamide on weight gain in people with HIV. In Current Opinion in HIV and AIDS (Vol. 16, Issue 3). [CrossRef]
- Lake, J. E., Wu, K., Bares, S. H., Debroy, P., Godfrey, C., Koethe, J. R., McComsey, G. A., Palella, F. J., Tassiopoulos, K., & Erlandson, K. M. (2020). Risk Factors for Weight Gain following Switch to Integrase Inhibitor-Based Antiretroviral Therapy. Clinical Infectious Diseases, 71(9), E471–E477. [CrossRef]
- Maphosa, T., Dunga, S., Makonokaya, L., Woelk, G., Maida, A., Wang, A., Ahimbisibwe, A., Chamanga, R. K., Zimba, S. B., Kayira, D., & Machekano, R. (2024). Unlocking the potential: exploring the impact of dolutegravir treatment on body mass index improvement in underweight adults with HIV in Malawi. BMC Public Health, 24(1). [CrossRef]
- McCann, K., Shah, S., Hindley, L., Hill, A., Qavi, A., Simmons, B., Serenata, C., Sokhela, S., & Venter, W. D. F. (2021). Implications of weight gain with newer anti-retrovirals: 10-year predictions of cardiovascular disease and diabetes. AIDS, 35(10), 1657–1665. [CrossRef]
- McLaughlin, M., Walsh, S., & Galvin, S. (2018). Dolutegravir-induced hyperglycaemia in a patient living with HIV. In Journal of Antimicrobial Chemotherapy (Vol. 73, Issue 1). [CrossRef]
- Nagin, D. (2005). Group-based modeling of development. Choice Reviews Online, 43(02). [CrossRef]
- Nkhoma, H., Mulaga, A., Kumwenda, S., & Kamndaya, M. (n.d.). Measuring the performance of LCA, LCGA, LCGM, and GMM in identifying the homogenous subgroups (Latent Classes) within the wider heterogeneous population of patients on DTG.
- Norwood, J., Turner, M., Bofill, C., Rebeiro, P., Shepherd, B., Bebawy, S., Hulgan, T., Raffanti, S., Haas, D. W., Sterling, T. R., & Koethe, J. R. (2017). Weight gain in persons with HIV switched from efavirenz-based to integrase strand transfer inhibitor-based regimens. Journal of Acquired Immune Deficiency Syndromes, 76(5). [CrossRef]
- Nylund, K. L., Asparouhov, T., & Muthén, B. O. (2008). Erratum: Deciding on the number of classes in latent class analysis and growth mixture modeling: A Monte Carlo simulation study (Structural Equation Modeling (2007) 14:4 (535)). In Structural Equation Modeling (Vol. 15, Issue 1). [CrossRef]
- Proust-Lima, C., Philipps, V., & Liquet, B. (2017). Estimation of extended mixed models using latent classes and latent processes: The R package lcmm. Journal of Statistical Software, 78. [CrossRef]
- R Core Team. (2019). R: A language and environment for statistical computing. In R Foundation for Statistical Computing.
- Ram, N., & Grimm, K. J. (2009). Growth Mixture Modeling: A Method for Identifying Differences in Longitudinal Change Among Unobserved Groups. PubMed, 33(6), 565–576. [CrossRef]
- Rosenberg, J., Beymer, P., Anderson, D., van Lissa, C. j., & Schmidt, J. (2018). tidyLPA: An R Package to Easily Carry Out Latent Profile Analysis (LPA) Using Open-Source or Commercial Software. Journal of Open Source Software, 3(30). [CrossRef]
- Rosseel, Y. (2012). Lavaan: An R package for structural equation modeling. Journal of Statistical Software, 48. [CrossRef]
- Sax, P. E., Erlandson, K. M., Lake, J. E., McComsey, G. A., Orkin, C., Esser, S., Brown, T. T., Rockstroh, J. K., Wei, X., Carter, C. C., Zhong, L., Brainard, D. M., Melbourne, K., Das, M., Stellbrink, H. J., Post, F. A., Waters, L., & Koethe, J. R. (2020). Weight gain following initiation of antiretroviral therapy: Risk factors in randomized comparative clinical trials. Clinical Infectious Diseases, 71(6), 1379–1389. [CrossRef]
- Sereika, S. M., Zheng, Y., Hu, L., & Burke, L. E. (2017). Modern Methods for Modeling Change in Obesity Research in Nursing. Western Journal of Nursing Research, 39(8). [CrossRef]
- Taramasso, L., Bonfanti, P., Ricci, E., Orofino, G., Squillace, N., Menzaghi, B., De Socio, G. V., Madeddu, G., Pellicanò, G. F., Pagnucco, L., Celesia, B. M., Calza, L., Conti, F., Martinelli, C. V., Valsecchi, L., Cascio, A., Bolla, C., Maggi, P., Vichi, F., … Di Biagio, A. (2020). Factors associated with weight gain in people treated with dolutegravir. Open Forum Infectious Diseases, 7(6). [CrossRef]
- Tse, J., Prajapati, G., Zhao, X., Near, A. M., & Kumar, P. N. (2023). Weight gain following switch to integrase inhibitors from non-nucleoside reverse transcriptase or protease inhibitors in people living with HIV in the United States: analyses of electronic medical records and prescription claims. Current Medical Research and Opinion, 39(9), 1237–1246. [CrossRef]
- Venter, D., Bosch, B., Sokhela, S., Akpomiemie, G., Chandiwana, N., Tembo, A., Qavi, A., Simmons, B., McCann, K., & Hill, A. (2022). IAS_ADVANCE_W192POSTER_2022_AQ13JUL22.
- Venter, W. D. F., Sokhela, S., Simmons, B., Moorhouse, M., Fairlie, L., Mashabane, N., Serenata, C., Akpomiemie, G., Masenya, M., Qavi, A., Chandiwana, N., McCann, K., Norris, S., Chersich, M., Maartens, G., Lalla-Edward, S., Vos, A., Clayden, P., Abrams, E., … Hill, A. (2020). Dolutegravir with emtricitabine and tenofovir alafenamide or tenofovir disoproxil fumarate versus efavirenz, emtricitabine, and tenofovir disoproxil fumarate for initial treatment of HIV-1 infection (ADVANCE): week 96 results from a randomised, phase 3, non-inferiority trial. The Lancet HIV, 7(10), e666–e676. [CrossRef]
- WHO. (2019). Update of recommendations on first- and second-line antiretroviral regimens. Geneva, Switzerland:World Health Organization; Who, July.
|
Disclaimer/Publisher’s Note: The statements, opinions and data contained in all publications are solely those of the individual author(s) and contributor(s) and not of MDPI and/or the editor(s). MDPI and/or the editor(s) disclaim responsibility for any injury to people or property resulting from any ideas, methods, instructions or products referred to in the content. |
© 2025 by the authors. Licensee MDPI, Basel, Switzerland. This article is an open access article distributed under the terms and conditions of the Creative Commons Attribution (CC BY) license (http://creativecommons.org/licenses/by/4.0/).