
Submitted:
17 October 2025
Posted:
20 October 2025
You are already at the latest version
Abstract
Here we present the results of an integrated targeting study covering the central-eastern Archean Yilgarn Craton of Western Australia, a region that is known for its substantial gold endowment of >40 Moz Au. The cornerstones of our study included custom built geophysical and remote sensing targeting tools, a new lithostructural interpretation of the area, a new targeting model structured according to the mineral systems approach, and a best practice approach to mineral potential modeling (MPM) that involved the use of five complimentary modeling techniques. The geophysical targeting tools served to identify proximity, association and abundance relationships between gold mineralization and gravity ridges ± edges as well as 95th percentile K/Th radiometric and remotely sensed goethite-clay-iron feature depth index ratio anomalies. The lithostructural interpretation unraveled structural trends that are oblique, or orthogonal, to the NNW-SSE-striking greenstone belts and likely represent important structural controls on the location of gold mineralization. Fry analysis, a method used to analyze the spatial distribution of geological point patterns, revealed similar directions of maximum gold occurrence alignment. Together, these new observations served as excellent predictors of gold prospectivity in the MPM component of this targeting study. The MPM not only identified most of the known gold occurrences but also several areas of gold potential that are underexplored. The highest priority MPM targets represent an order of magnitude reduction of the search space, the hallmark of a well-performing, practically useful targeting technique.
Keywords:
exploration targeting
; gold
; mineral potential modeling (MPM)
; mineral systems
; Yilgarn Craton
; Western Australia
1. Introduction
The central-eastern Yilgarn Craton of Western Australia (Figure 1), subject to this study, hosts a gold endowment of >40.0 Moz Au [1] that is mainly contained within 11 orogenic gold deposits, or deposit clusters, of Archean age. Given this significant endowment, the presence of 78 operating gold mines and the potential for new discoveries, interest in the area has been considerable, both in terms of gold exploration [2] and gold-related research activities [3,4,5,6,7,8,9,10,11,12,13].
Despite the economic importance of the region, published targeting studies for orogenic gold deposits in all, or part, of the central-eastern Yilgarn Craton are scarce, limited to the works of [14,15,16,17,18]. In 2000, Groves et al. [14] established a comprehensive conceptual targeting model that served to inform a knowledge-driven vectorial fuzzy logic approach [19] to mineral potential modeling (MPM), covering an area of ~17,000 km2 in the southern Kalgoorlie Terrane (as such, spatial overlap with our study area is minimal). The model was based on only two types of input data: The known gold occurrences and a lithostructural (solid) geology map. The authors interpreted the MPM results in terms of gold mineralization being controlled by only a handful of critical factors such as proximity to NW-SE-striking granitoid-greenstone contacts, crustal-scale faults, in particular NW-SE-striking fault segments, NW-SE-striking lithological contacts, proximity to anticlinal hinges, and chemically-reactive rocks.
In contrast to [14], a 2010 study by Czarnota et al. [15], which covered both the Kalgoorlie and Kurnalpi terranes (~130,000 km2), benefited from a decade of progress in computing power, significant advances in the capabilities of geographic information systems (GIS) as well as MPM, a vastly improved understanding the geology of the Yilgarn Craton and its orogenic gold deposits, and the emergence of the mineral systems concept [20,21,22], which introduced a shift in targeting by moving away from descriptive, deposit-centric constructs to a broader, scale-integrated approach focused on the processes of mineral deposit formation and their geodynamic context. In contrast to the earlier study by [14], Czarnota et al. [15] developed numerous geological, geochemical and geophysical predictor maps, believed to represent mappable features of the targeted gold systems. However, rather than using mathematical algorithms (i.e., MPM) to combine these predictors, the authors employed what was described as a “simple additive GIS treatment.” Unfortunately, this pseudo-MPM approach prevented the use of spatial statistics to assess the validity and performance of the input predictor maps and the model as a whole. Instead, [15] defined an arbitrary buffer zone around areas of high gold prospectivity, which they claimed captured 75% of the known gold endowment in 5% of the modelled area.
The most recently published MPM study by Witt et al. [16] developed gold prospectivity maps for both the Eastern Goldfields Superterrane (EGST) (~235,000 km2) as well as the Yilgarn Craton as a whole (~680,000 km2). The authors quantified spatial relationships between known gold endowment and a comprehensive set of regional geological, structural, geochemical and geophysical criteria, from the best of which they built prospectivity maps utilizing a knowledge-driven fuzzy logic approach [23,24]. The best predictors of gold potential at the regional scale, as highlighted by the authors’ spatial statistical analyses, were as follows: Proximity to mafic granite intrusions, areas of high fault density, regional fault bends, and greenstone belts.
This MPM-assisted targeting study, undertaken over an area of ~27,150 km2, differs from the earlier work in three key ways: (i) It is geophysically driven, using enhanced gravity and magnetics to map structural architecture, including cryptic basement structures; (ii) it uses enhanced radiometrics and remotely sensed image data to map prospective alteration systems; (iii) it creates a new, internally consistent lithostructural framework that integrates those datasets into a single solid geology base for MPM; and (iv) it applies and cross-validates five complementary MPM techniques, spanning knowledge-driven, data-driven and continuous methods. Together these steps allowed us to reduce the search space by an order of magnitude and identify underexplored gold prospective corridors largely blind to traditional outcrop-biased methods.
2. Materials and Methods
2.1. Study Background
The study described in this paper took place in late 2021. It was commissioned by Australian mining company St Barbara Limited, which also determined the layout of the study area. At the time, the central-eastern Yilgarn Craton was home to St Barbara Limited’s Leonora operations, consisting of the Gwalia underground mine and 1.4 Mtpa processing plant, as well as nearby gold development and exploration opportunities. In 2023, the Leonora operations were sold to fellow Australian gold miner Genesis Minerals Limited [25].
2.2. Methodology
The approach taken in this study entailed six principal steps:
- A review of the orogenic gold deposit model with a focus on deposits of this type within the study area and broader Yilgarn Craton.
- A solid geology (lithostructural) interpretation based on all available geological, structural and geophysical information.
- Mineral potential modeling (MPM), adopting a multi-technique approach that entailed the use of continuous as well as data- and knowledge-driven mathematical techniques and, thereby, facilitated the cross-validation and comparison of the resulting prospectivity maps [31].
- The identification of gold exploration targets.
2.3. Supporting Data
The geoscience and exploration data used in this study had two principal sources (Table 1): Open-access repositories maintained by the Geological Survey of Western Australia (GSWA) and proprietary company data.
2.4. Processing and Interpreation of Geophysical and Remote Sensing Data
2.4.1. Geophysical Data and Processing
Geophysical data were downloaded in grid format (as per Table 1) and windowed to the study area, allowing for adequate buffer zones. Minimal processing (preparation of the data for filtering) was required as the data were available as merged products with the appropriate data reduction complete, providing blanket coverage of the study area at various spatial resolutions (i.e., cell sizes). Access to objective, ‘blanket coverage’ geophysical data of adequate spatial resolution is essential for exploration targeting in areas where prospective bedrock is masked by significant cover like in the central-eastern Yilgarn Craton. In addition, geophysical data are ideally suited to mapping expressions of mineralising processes and, therefore, are a fundamental component of a mineral systems-type targeting approach.
Three types of geophysical data were sourced and filtered for inclusion in this targeting study [34]:
- Gravity data, which respond to variations in rock density and reflect density contrasts in the subsurface. As such, gravity surveys are effectively a ‘depth penetrative’ method.
- Magnetic data, which respond to variations in rock magnetism, are mostly controlled by magnetic susceptibility. Like gravity data, magnetic data reflect subsurface contrasts.
- Radiometric data, which respond to surface variations in naturally occurring gamma radiation, mostly originating from radioactive isotopes of potassium (K), thorium (Th) and uranium (U).
In the EGST, gravity gradients show a clear association to faults that host gold deposits [35]. The extraction of gravity gradients from gridded gravity data has been carried out in various ways since the method was first published in the late 1970s [36,37]. Here we adapted the phase congruency approach of [38], using the differential upward continuation operator of [39] instead of log Gabor filters, resulting in a multi-scale feature detection filter perfectly tailored for potential field (gravity and magnetic) data. Topological features [40] extractable from gridded potential field data at multiple scales are:
- Edges (i.e., maximum gradient curves), which represent traces of physical property boundaries across gravity or magnetic data grids, arising from structural breaks such as faults or shear zones, or lithological contacts.
- Ridges (i.e., surface maximum/peak curves), which correspond to ridgeline curves across gravity and magnetic data grids. Gravity ridges, for example, reflect peak gravity responses. In granite-greenstone terrain, gravity ridges often coincide with the thickest parts of dense, mafic rock units and, thus, work well in terms of mapping structurally thickened mafic-ultramafic rocks in the central parts of inverted greenstone basins.
- Valleys (i.e., curves of surface minimum), which correspond to valley line curves across gravity or magnetic data grids. Magnetic valleys, for example, often coincide with faults or fault corridors along which primary magnetite was partly, or mostly, destroyed due to fluid-rock interaction.
Radiometric data, on the other hand, work well in terms of detecting and mapping outcropping hydrothermal alteration systems. For example, studies by de Quadros et al. [41], Herbert et al. [42] and Shebl et al. [43] served to demonstrate the merit of this technique for identifying areas of gold-related white mica (sericite) alteration, using various computations involving normalized radiometric data and their ratios.
2.4.2. Remote Sensing Data and Processing
ALOS digital elevation data [44] were downloaded in grid format (as per Table 1) and treated in a similar fashion as described for the geophysical data above. Topographic elevation data reflect the shape of the Earth’s surface across the study area, where surface highs often represent units more resistive to weathering. As such, even in ancient peneplained cratonic environments such as the Yilgarn Craton, topographic data can be useful for mapping areas of out- or subcropping bedrock, structure in exposed bedrock (and structural trends therein), or past and present mining activities. Surface topography can also reflect geological processes, which, in turn, can inform exploration targeting, especially in well-exposed neotectonic environments.
Multi-spectral Sentinel-2 data were downloaded as multiband grids (as per Table 1) and windowed to the study area. The area has several salt lakes that can generate false positive results in some of the processing. These lakes were manually traced and removed from the data prior to processing. Indexes were calculated to highlight ferric-iron-bearing phases like goethite (Band4/Band2) and clay (Band11/Band12). Additionally, the iron feature depth (IFD) was calculated to highlight possible weathering sulfides in the regolith [45]. The three indexes (goethite, clay, and IFD) were combined to create a CMY ternary image. The image was converted to CEI L*a*b* color space and the Euclidean distance to black was calculated [46]. Black areas in the CMY image are where all three indexes have high values. These are the most likely areas to have exposed clay alteration assemblages and weathering sulfides. The distance to black was converted to an inverse distance so that high values in the distance grid were areas where all three indexes have relatively high values. The inverse distance grid was thresholded and polygonised.
2.4.3. Solid Geology Interpretation
The workflow adopted in our interpretation of the geophysical data and generation of a solid geology (lithostructural) map of the study area was broadly similar to that described by [47]. Namely, (i) constructing form lines, (ii) identifying magnetic rock units, (iii) characterizing geophysical domains, (iv) integrating the geophysical interpretation with other relevant information (e.g., geological maps), (v) identifying and defining structural elements, (vi) mapping and interpretating lithology, and (vii) generating an integrated lithostructural framework.
2.5. Mineral Systems Concept
The targeting model developed in this study was generated according to the mineral systems approach [20,21,22,26,48] and in a manner described in more detail by [27,30,49,50]. In short, the mineral systems concept views mineral deposits as localized expressions of a series of geological processes operating at different scales of time and space:
- Source processes that extract the essential mineral deposit components (i.e., melts and/or fluids, metals, and ligands) from their crustal or mantle sources;
- Transport processes that drive the transfer of the essential components from source to trap regions via melts and/or fluids;
- Trap processes that focus melt and/or fluid flow into physically and/or chemically responsive, deposit-scale sites;
- Deposition processes that drive the efficient extraction of metals from melts and/or fluids passing through the traps;
- Preservation processes that act to preserve the accumulated metals through time.
Where one or more of these critical processes fail to operate, a mineral deposit cannot form or be preserved. The probabilistic philosophy at the core of the mineral systems concept lends itself well to MPM [27,49,50] given the latter runs on mathematical algorithms. Another key strength of the mineral system concept is that it provides a robust yet flexible framework for formulating a holistic, process-based targeting model and for observing, mapping, and/or querying in the available geoscience data the expressions of the critical processes of mineral deposit formation [22,51].
2.6. Fry Analysis
Fry analysis [52] presents a simple geometrical approach to visualizing patterns in spatial point data. The method works by recording the distance and bearing from each point in a given dataset to every other point, either manually or computationally. Hence, for n points in a dataset, Fry analysis generates n2 ‒ n spatial relationships. These point translations can then be visualized in autocorrelation diagrams, known as Fry plots, and rose diagrams, serving to enhance subtle trends in point patterns and reveal directions of maximum continuity of mineral deposit alignment [53,54,55].
2.7. Mineral Potential Modeling (MPM)
MPM, first introduced in the late 1980s alongside the emergence of geographic information systems (GIS) [56,57], has since matured into a robust, cost- and time-efficient tool for exploration targeting that also possesses a strong capability for big data analytics. More specifically, MPM can concurrently handle, integrate, process, and model the typically different and often very substantial geological, geophysical, geochemical, remote sensing, and drilling data developed and utilized in mineral exploration. It is also a tool that is well-adapted for effective screening and target generation within large search areas, be it a particular mineral district or belt or an entire country or continent. In general, MPM encompasses the following principal stages [21,51,58,59,60,61,62]:
- Genetic model stage: Recognition the critical geological processes responsible for the formation of the targeted deposit type to establish a conceptual deposit model.
- Targeting model stage: Translation of the genetic model into a targeting model in which the critical ore-forming processes are expressed through mappable targeting criteria (also referred to as spatial proxies, predictor maps, predictors, or targeting elements).
- Mathematical model stage: Assignment of weights to integrate the diverse predictor maps utilizing mathematical algorithms.
- Target identification and prioritized stage: Mapping and prioritization of the most prospective areas.
The mathematical modeling can be broadly subdivided into knowledge-driven, data-driven, hybrid data- and knowledge-driven, and continuous techniques that utilize logistic functions [24,58,63]. The selection of a suitable weighting approach is strongly governed by data availability, specifically the number of known mineral occurrences in support of the targeting model, commonly referred to as prospect locations. For instance, ‘brownfields’ regions are typically well explored and, thus, more data-rich, especially in the vicinity of known mineral deposits. For such regions, the weighting is commonly data-driven. Un- or underexplored ‘frontier’, ‘grassroots’, or ‘greenfields’ regions, on the other hand, are typically data poor and may contain only few, if any, mineral occurrences of the target type. In such search spaces, a knowledge-driven approach is often required, with MPM reliant on expert opinion [24,58]. In contrast, continuous weighting approaches require neither prospect locations nor expert opinion, with continuous spatial evidence offering superior predictive capability compared to discretized evidence [63].
In this study, we adopted a multi-technique approach to MPM [31] comprised of continuous (fuzzy gamma: [64]; geometric average: [65]; improved index overlay: [66]), data-driven (random forest (RF): [67]) and knowledge-driven (best worst method–sum additive weighting (BWM-SAW): [68,69,70]) modeling techniques.
3. Geology
3.1. Eastern Goldfields Superterrane (EGST), Yilgarn Craton
3.1.1. Overview
The study area is situated in the central-eastern Yilgarn Craton, a large, poorly-exposed Archean (~3730 to 2660 Ma) piece of crust comprised of extensive granite-greenstone and high-grade metamorphic gneiss terrains [71] (Figure 1). More precisely, the study area straddles the boundary between the Kalgoorlie and Kurnalpi terranes, which form part of the ~2960 to 2660 Ma EGST [7,12,72,73,74], one of the most important and best endowed Late Archean metallogenic provinces in the world [8]. Each of the terranes that make up the EGST (i.e., from west to east, the Kalgoorlie, Kurnalpi, Burtville and Yamarna terranes) is a distinct, structurally-bound entity characterized by major differences in stratigraphic ages and whole rock and isotopic geochemistry of its volcanic and intrusive rocks. [72,75]. The individual terranes can be further subdivided into lithostructural domains defined by internally consistent stratigraphy and structural history and bounded by interconnected fault systems interpreted largely from geophysical data [75].
3.1.2. Geology and Structure
The greenstone belts and major fault systems within the EGST typically strike N-S to NNW-SSE. Deep seismic reflection data portray the principal fault systems, which can be traced in gravity and magnetic data for up to 700 km along strike, as E-dipping, crustal-scale structures intersecting the Mohorovičić discontinuity. The supracrustal volcanic and sedimentary successions that define the greenstone belts are preserved in up to seven kilometer-thick synformal basins with greenstone stratigraphies generally dipping and facing away from granite domes flanking or coring the belts [7]. As summarized by [10,76], greenstone sequences across the EGST show a broadly coherent stratigraphy, typically comprising (from the bottom to the top) of:
- A basal volcanic package dominated by ~2720 to 2690 Ma komatiite and basalt;
- A sedimentary package dominated by ~2690 to 2670 Ma deep marine siliciclastic and volcaniclastic sedimentary rocks; and
Older, ∼2960 Ma to 2770 Ma greenstone successions, mainly comprised of intermediate to felsic and mafic-ultramafic volcanic rocks, have been identified in the Burtville Terrane. These rocks have lithological and temporal affinities with the Youanmi Terrane in the western Yilgarn Craton [7].
Granitoids are abundant and widespread in the EGST, and can be classified into five groups [7,8,12,33]:
- High-Ca granites: Constitute the most abundant group of granites (∼60% of all EGST granitoids) and occur both within and external to greenstone belts. They are typically granite, granodiorite or trondhjemite in composition. Emplacement ages fall into three clusters at ∼2800 Ma, 2740 to 2650 Ma and, most commonly, 2685 to 2655 Ma.
- High field strength element (HFSE)-enriched granites: Make up 5 to 10% of all Yilgarn Craton granites. They are typically granite or, to a lesser degree, granodiorite in composition and occur mostly internal or marginal to greenstone belts. Emplacement ages fall into two clusters at >2720 to 2665 Ma and, most commonly, 2700 to 2680 Ma.
- Mafic granites: Make up 5 to 10% of all Yilgarn Craton granites. They are typically granite, granodiorite, tonalite, trondhjemite or diorite in composition and occur mostly internal or marginal to greenstone belts. A common spatial association with gold mineralization has been noted. Their emplacement ages fall into a relatively narrow time bracket from >2720 to 2650 Ma, although younger examples likely exist.
- Low-Ca granites: Are the second most abundant granite group by volume (∼20%) and mostly external to greenstone belts. Compositionally, the granites of this group are typically granitic or granodioritic. Their emplacement ages fall into a relatively narrow time bracket from 2655 to 2630 Ma. Low-Ca granites are considered products of partial melting of high-Ca granite source rocks.
- Syenitic granites: Are the least abundant granite group (<5%) and typically internal or marginal to greenstone belts. Granites of this group are syenite or quartz syenite in composition. A spatial association with gold mineralization has been noted. Emplacement ages cluster at 2650 Ma and 2655 to 2645 Ma.
3.1.3. Deformation History
According to [7], a combination of poor rock exposure and strain partitioning make it difficult to correlate structural information across the EGST. As such, its structural event history remains poorly constrained and subject to ongoing debate. The structural framework study by [7] addressed these difficulties using an integrated approach that involved the collection of >10,000 new structural observations and structural, stratigraphic, magmatic, metallogenic and geophysical data correlation and integration. Based on the results of this work, the authors proposed a six-stage (D1 to D6) deformation history (Figure 2):
- D1: ENE-WSW-directed extension at ~2720 to 2670 Ma marked by rifting and greenstone deposition.
- D2: ENE-WSW-directed shortening at ~2670 to 2665 Ma marked by the termination of volcanic activity and generation of NNW-SSE-trending upright folds and N-S-to NE-SW-striking dextral strike-slip and reverse faults.
- D3: NE-SW-directed extension and extensional doming (i.e., core complex formation) at ~2665 to 2655 Ma marked by deep crustal exhumation and the formation of late basins with the late basin sequences constituting the first record of the deposition of granite detritus in the EGST.
- D4: ENE-WSW-directed shortening at ~2655 to 2650 Ma (D4a) marked by the tightening of earlier formed fold structures, WSW-directed thrusting along NNW-SSW-striking faults as well as the generation of NNW-SSE-trending upright folds and reverse faults; and WNW-ESE-directed shortening at (D4b) marked by reactivation of and sinistral transpression along earlier formed NNW-SSE-striking faults and generation of ENE-WSW-striking thrust faults, which recorded transport to the NW and SE.
- D5: NE-SW-directed shortening at ~2650 to 2635 Ma marked by dextral strike-slip movement along N-S- to NNE-SSW-striking faults and thrusting along NNW-SSE- to NW-SE-striking faults.
- D6: Low-strain vertical shortening and horizontal extension at <2630 Ma marked by the development of crenulations.
3.1.4. Metamorphic History
The EGST recorded metamorphic conditions ranging from sub-greenschist to granulite facies developed over a ~130 m.y. time period from ~2750 to 2620 Ma. A broadly conformable Neoarchean metamorphic history is indicated by regional metamorphic isograds extending across terrane and domain boundaries [11,32]. The latter identified five regional metamorphic events across the EGST, which have been temporally and spatially integrated with the above structural event framework of [7] (Figure 2).
- Ma: Early-formed, low-P/high-T upper-amphibolite to granulite facies assemblages of the Ma metamorphic event are rare. They are restricted to magmatic arc-related, ~2730 to 2810 Ma greenstone sequences of the western Burtville Terrane and HFSE granites and ~2675 to 2715 Ma greenstones of similar affinity in the Gindalbie Domain of the Kurnalpi Terrane.
- M1: This metamorphic event, which occurred at ~2750 to 2700 Ma, produced high-P/moderate-T assemblages preserved in relatively narrow, upper-amphibolite grade domains along major, crustal-scale fault zones. The structural setting, depth of burial and rapid exhumation of these rocks are consistent with partial burial of buoyant magmatic arcs, or terranes, during magmatic arc accretion events in subduction-like environments.
- M2: This ~2680 to 2670 Ma, low-P/moderate-T metamorphic event produced a contact metamorphic pattern linked to the emplacement of large volumes of high-Ca granite melt into the upper crust, which were generated by partial melting of a down-going slab subducted beneath the Kalgoorlie and Kurnalpi terranes. The M2 event coincided in time with the cessation of volcanism and D2 crustal shortening.
- M3: The M3 metamorphic event is believed to have been caused by lithospheric extension at ~2665 to 2650 Ma, linked to the cessation of subduction with sag on the previously subducted plate causing slab rollback and extension of the overriding plate. The M3 event coincided in time with the D3, that is metamorphic core complex formation.
- M4: Low-P/high-T metamorphism at ~2650 to 2610 Ma was likely triggered by delamination of the lower crust, resulting in mantle upwelling and the arrival of a thermal anomaly in the upper crust associated with widespread and voluminous low-Ca granite magmatism.
3.1.5. Geodynamic Implications
The available stratigraphic, structural, geochemical, and isotopic data support an interpretation of the Kalgoorlie, Kurnalpi and Yamarna terranes of the EGST as failed intracontinental rift basins, developed on older ‘proto-Yilgarn’ crust. The rift basins were subsequently closed, uplifted, deformed, and metamorphosed during the ~2670 to 2630 Ma Kalgoorlie Orogeny [74,80].
3.2. Kalgoorlie-Kurnalpi Rift
The ~2720 to 2600 Ma Kalgoorlie-Kurnalpi Rift (Figure 1), recognized by [12] based on stratigraphic, geochronological and isotopic data correlations across the Kalgoorlie and Kurnalpi terranes of the EGST, is believed to have formed in response to a major mantle input event that exploited weakened crust along the eastern margin of the Yilgarn proto-craton, comprised of the South-West, Narryer and Youanmi terranes. According to [12], the genesis and evolution of the intracontinental Kalgoorlie-Kurnalpi Rift is consistent with spatially and temporally overlapping plume-related magmatism in the Kalgoorlie Terrane and west-directed subduction to the east of the Burtville Terrane. This geodynamic model, however, implies that plate tectonic processes similar to modern-style plate tectonics operated as far back as the Archean eon, a contentious hypothesis that is subject to ongoing debate [81,82,83].
3.3. Kalgoorlie Terrane
The Kalgoorlie Terrane (Figure 1 and Figure 3), the westernmost lithostructural element of the EGST, is bound by the Ida-Waroonga fault system to the W and Ockerburry fault system to the E. The terrane is divided into 10 domains, five of which (i.e., Boorara, Jundee, Moilers, Ora Banda and Wiluna) occur within the study area. The terrane is mainly composed of 2710 to 2660 Ma greenstone and overlying, coarse clastic (‘late basin’) sequences dated at 2658 to 2655 Ma. Older (>2730 Ma) lithostratigraphic sequences appear to be restricted to the Norseman, Boorara, and Wiluna domains. Due to widespread cover, clearly defined lithostratigraphic sequences have only been established for the southern Kalgoorlie Terrane. Here, greenstones can be divided into the ~2710 to 2690 Ma Kambalda Sequence (tholeiitic and komatiitic mafic-ultramafic rocks) and the overlying, ~2690 to 2660 Ga Kalgoorlie Sequence (felsic volcaniclastic and epiclastic rocks with subordinate lavas). The late basin sequences are mainly composed of poorly sorted, polymict conglomerates that grade upward into sand- and siltstone. Kalgoorlie Terrane greenstones form highly deformed, curvilinear belts that are separated by variably deformed and metamorphosed granitoid rocks, intruded principally between 2760 and 2620 Ma [7,72,84,85,86].
3.4. Kurnalpi Terrane
The Kurnalpi Terrane (Figure 1 and Figure 3), which abuts the Kalgoorlie Terrane to the east, is bound by the Ockerburry fault system to the W and . The terrane is comprised of seven domains, five of which (i.e., Edjudina, Gindalbie, Laverton, Menangina and Murrin) occur within the study area. Lithostratigraphically, the Kurnalpi Terrane greenstones can be divided into four sequences: (i) The ~2800 Ma Laverton sequence (mafic-ultramafic volcanic rocks and banded iron formation with minor clastic sedimentary rocks intruded by felsic porphyries); (ii) the ~2715 to 2705 Ma Kurnalpi Sequence (mafic volcanic and intrusive, intermediate calc-alkaline igneous and feldspathic sedimentary rocks), which has no obvious stratigraphic equivalent in the Kalgoorlie Terrane; (iii) the ~2695 to 2675 Ma Minerie Sequence (mafic-ultramafic volcanic rocks), which are correlated to the Kambalda Sequence in the Kalgoorlie Terrane; and (iv) an unnamed, ~2690 to 2680 Ma sequence of bimodal rhyolite-basalt and intermediate-felsic, calc-alkaline igneous rocks that forms a linear belt along the western margin of the Gindalbie Domain. The greenstones are overlain by late basin sequences, which are dated at younger than ~2673 Ma, are mainly comprised of turbidite with subordinary carbonaceous shale, sandstone, conglomerate, chert and magnetic shale [7,72,84,85,87].
4. Gold Mineralization
4.1. Gold Endowment
In the EGST, gold was first discovered at Coolgardie in 1892 followed by Kalgoorlie in 1893. Since then, more than 20 deposits with metal contents of greater than one million ounces (Moz) of gold (Au) have been discovered in the region. Production to date exceeds 145 Moz Au with the Golden Mile at Kalgoorlie accounting for 65 Moz Au (or ~45%) of the current total [78,88]. Combining past production and unmined resources, which are estimated at greater than 125 Moz Au [1], gives a total endowment of the EGST of well over 270 Moz Au. The study area captures >40.0 Moz Au of the endowment, largely contained in 11 gold deposits and deposit clusters [1] (Figure 1 and Figure 3, Table 2).
4.2. Gold Deposit Styles
The EGST is home to a diverse range of gold deposit styles that are controlled by a variety of different structures and hosted by a variety of rock types of different metamorphic grades from sub-greenschist to amphibolite facies. Despite this diversity, their many common features strongly indicate that the gold deposits in the EGST, and broader Yilgarn Craton, form part of regionally extensive gold mineralizing systems that operated at various times during the late Archean evolution of the host craton [103,104].
According to Tripp et al. [105], gold mineralization occurs as structurally and/or lithologically controlled lodes that typically take the form of quartz ± carbonate veins, breccias and disseminations enveloped by gold-related wall rock alteration. Gold occurs in all rock types, although basalt and dolerite are the most frequent and large granitoid bodies are the least frequent hosts [16,105]. The principal control on gold mineralization was structure, across scales, having controlled both hydrothermal fluid flow as well as the architecture and location of gold deposition [105].
4.3. Gold Depositional Events
The EGST experienced multiple, protracted gold mineralization events during the late Archean, related to both extensional and compressional deformation episodes within a 60 m.y. timeframe between ~2670 and 2630 Ma [5,7,8,9,12,15,105]. Whilst gold was deposited during most EGST deformation events [7], formation of the larger deposits can be attributed to three events (Figure 2) [7,8,15]:
- D3 (~2665 to 2655 Ma): Formation of EGST crustal architecture during a period of NE-SW-directed extension and associated metamorphic core complex formation. Most of the large crustal-penetrating fault systems had already been established at this time, connecting the upper crust to a metasomatized mantle as indicated by the first arrival of mafic and syenitic granites. The mantle link would have resulted in the addition of significant heat into the base of the crust and aided in mantle-to-crust metal transfer. A prominent D3 deposit example in the study area is Gwalia (>8.2 Moz Au).
- D4 (~2655 to 2650 Ma): The extensional crustal architecture established during D3 was inverted during D4, a brittle-ductile deformation event that can be divided into an initial phase of ENE-WSW-directed shortening (D4a) followed by a switch in contraction to WNW-ESE-directed shortening (D4b). Deformation was accompanied by a switch from high- to low-Ca granite magmatism due to crustal melting. Most importantly, D4 coincided with the most significant gold mineralization event in the EGST. In particular, strike-slip deformation and reactivation of pre-existing structural heterogeneities during D4b served as a highly effective fluid focusing mechanism. The most prominent D4 deposit example is the Golden Mile (>65 Moz Au), located ~35 km S of the study area.
- D5 (~2650 to 2635 Ma): A further switch in the stress field triggered NE-SW-directed shortening associated with dextral strike-slip, thrusting and low-Ca granite melt emplacement. Gold mineralization was controlled by brittle structures. A prominent D5 deposit example is Sunrise Dam (>10.3 Moz Au), located ~20 km E of the study area.
5. Data Integration and Interpretation
5.1. Insights from the Enhancement Filtering of Geophysical and Remote Sensing Data
Enhancement filtering of gravity data delivered two critical insights regarding proximity, association and abundance relationships between gravity features and gold occurrences:
- Belt-parallel gravity ridges serve as proxies for greenstone basin centers or zones of thicker mafic-ultramafic material along greenstone keels and root zones (Figure 4). As demonstrated by a confidential gravity data enhancement filter for the entire Australian continent, a large proportion of Yilgarn gold (and nickel) deposits have proximity, association and abundance relationships with gravity ridges. A similar relationship can be observed within the study area where gold occurrences, other than those wholly contained within intrusive rocks, have proximity, association and abundance relationships with gravity ridges observable at multiple scales (Figure 5).
- Gravity edges, on the other hand, represent discontinuities such as fault or shear zones, or significant lithological boundaries. In the case of the study area, the Thunderbox, King of the Hills, Gwalia and Ulysses gold deposits all sit along the same curvilinear belt-parallel gravity edge, which can be traced along strike for >230 km and appears to continue north beyond the study area boundary. Interestingly, this gravity linear only coincides with the Perseverance-Ockerbury-McClure fault system in places whilst there is strong spatial coincidence between it and the basement granite-greenstone contact (Figure 6). Similar, semi-parallel linear features in the study area may represent attractive targets for first pass exploration.
Magnetic edges typically represent fault or shear zones or lithological boundaries. Lithostructural features within the study area that are clearly evident in magnetic edge enhancement filters data are (i) Proterozoic dolerite dykes, (ii) certain intrusive contacts, and (iii) segments of major and subsidiary shear and/or fault zones. In addition, all of the larger gold deposits are located along and coincident with magnetic edges (Figure 7).
Where outcropping at surface or exposed in open cut mines, orogenic gold systems in the study have proximity, association and abundance relationships with (i) domains of high (95th percentile) K/Th values as extracted from radiometric data, and (ii) goethite-clay-iron feature depth index (IFD) ratio anomalies as extracted from remote sensing imagery.
Overall, the application of advanced geophysical and remote sensing data modeling served to map potential ore-controlling structures and ore signatures, thereby greatly enhancing the toolbox for targeting gold in central-eastern Yilgarn Craton. The semi-automated filtering approaches applied to the geophysical and remote sensing data helped mitigate some of the bias and inconsistencies that can occur when data are exclusively interpreted by humans.
5.2. Solid Geology (Lithostructural) Interpretation
The main objective for undertaking a lithostructural interpretation was the generation of a coherent base map for MPM and target generation. Precedence was given to the development of a new structural framework that integrates the results of the geophysical enhancement filtering. Whilst our interpretation incorporated and honored aspects of previous solid geology maps produced by the Geological Survey of Western Australia, pmd*CRC and St Barbara Limited (Table 1), in particular geology, the overall structural framework was rebuilt from the ground up, informed by the new geophysical evidence.
In the study area, form lines (Figure 8a) trace stratigraphy and schistosity in greenstone, compositional layering in granitic and schistosity in gneissic units. Form line orientations are highly variable. However, NNW-SSE orientations dominate, reflecting the principal stratigraphic and tectonic grain of the greenstone sequences. Local variations are mostly due to folding at the kilometer to multi-kilometer scale.
The major, first- and second-order faults within the study area (Figure 8b-d), likely the products of D3 and subordinate to earlier-formed, N-S-striking, D1 master faults (cf. Figure 3 in [7]), include the (i) Menzies-Boorara fault system, which separates the Ora Banda and Boorara domains of the Kalgoorlie Terrane, (ii) Ockerburry-McClure-Perseverance fault system, which separates the Kalgoorlie and Kurnalpi terranes, (iii) Melita-Emu fault system, which separates the Gindalbie and Menangina domains of the Kurnalpi Terrane, (iv) Keith-Kilkenny fault system, which separates the Menangina and Murrin domains of the Kurnalpi Terrane, and (v) Celia fault system, which separates the Murrin and Edjudina/Laverton domains of the Kurnalpi Terrane.
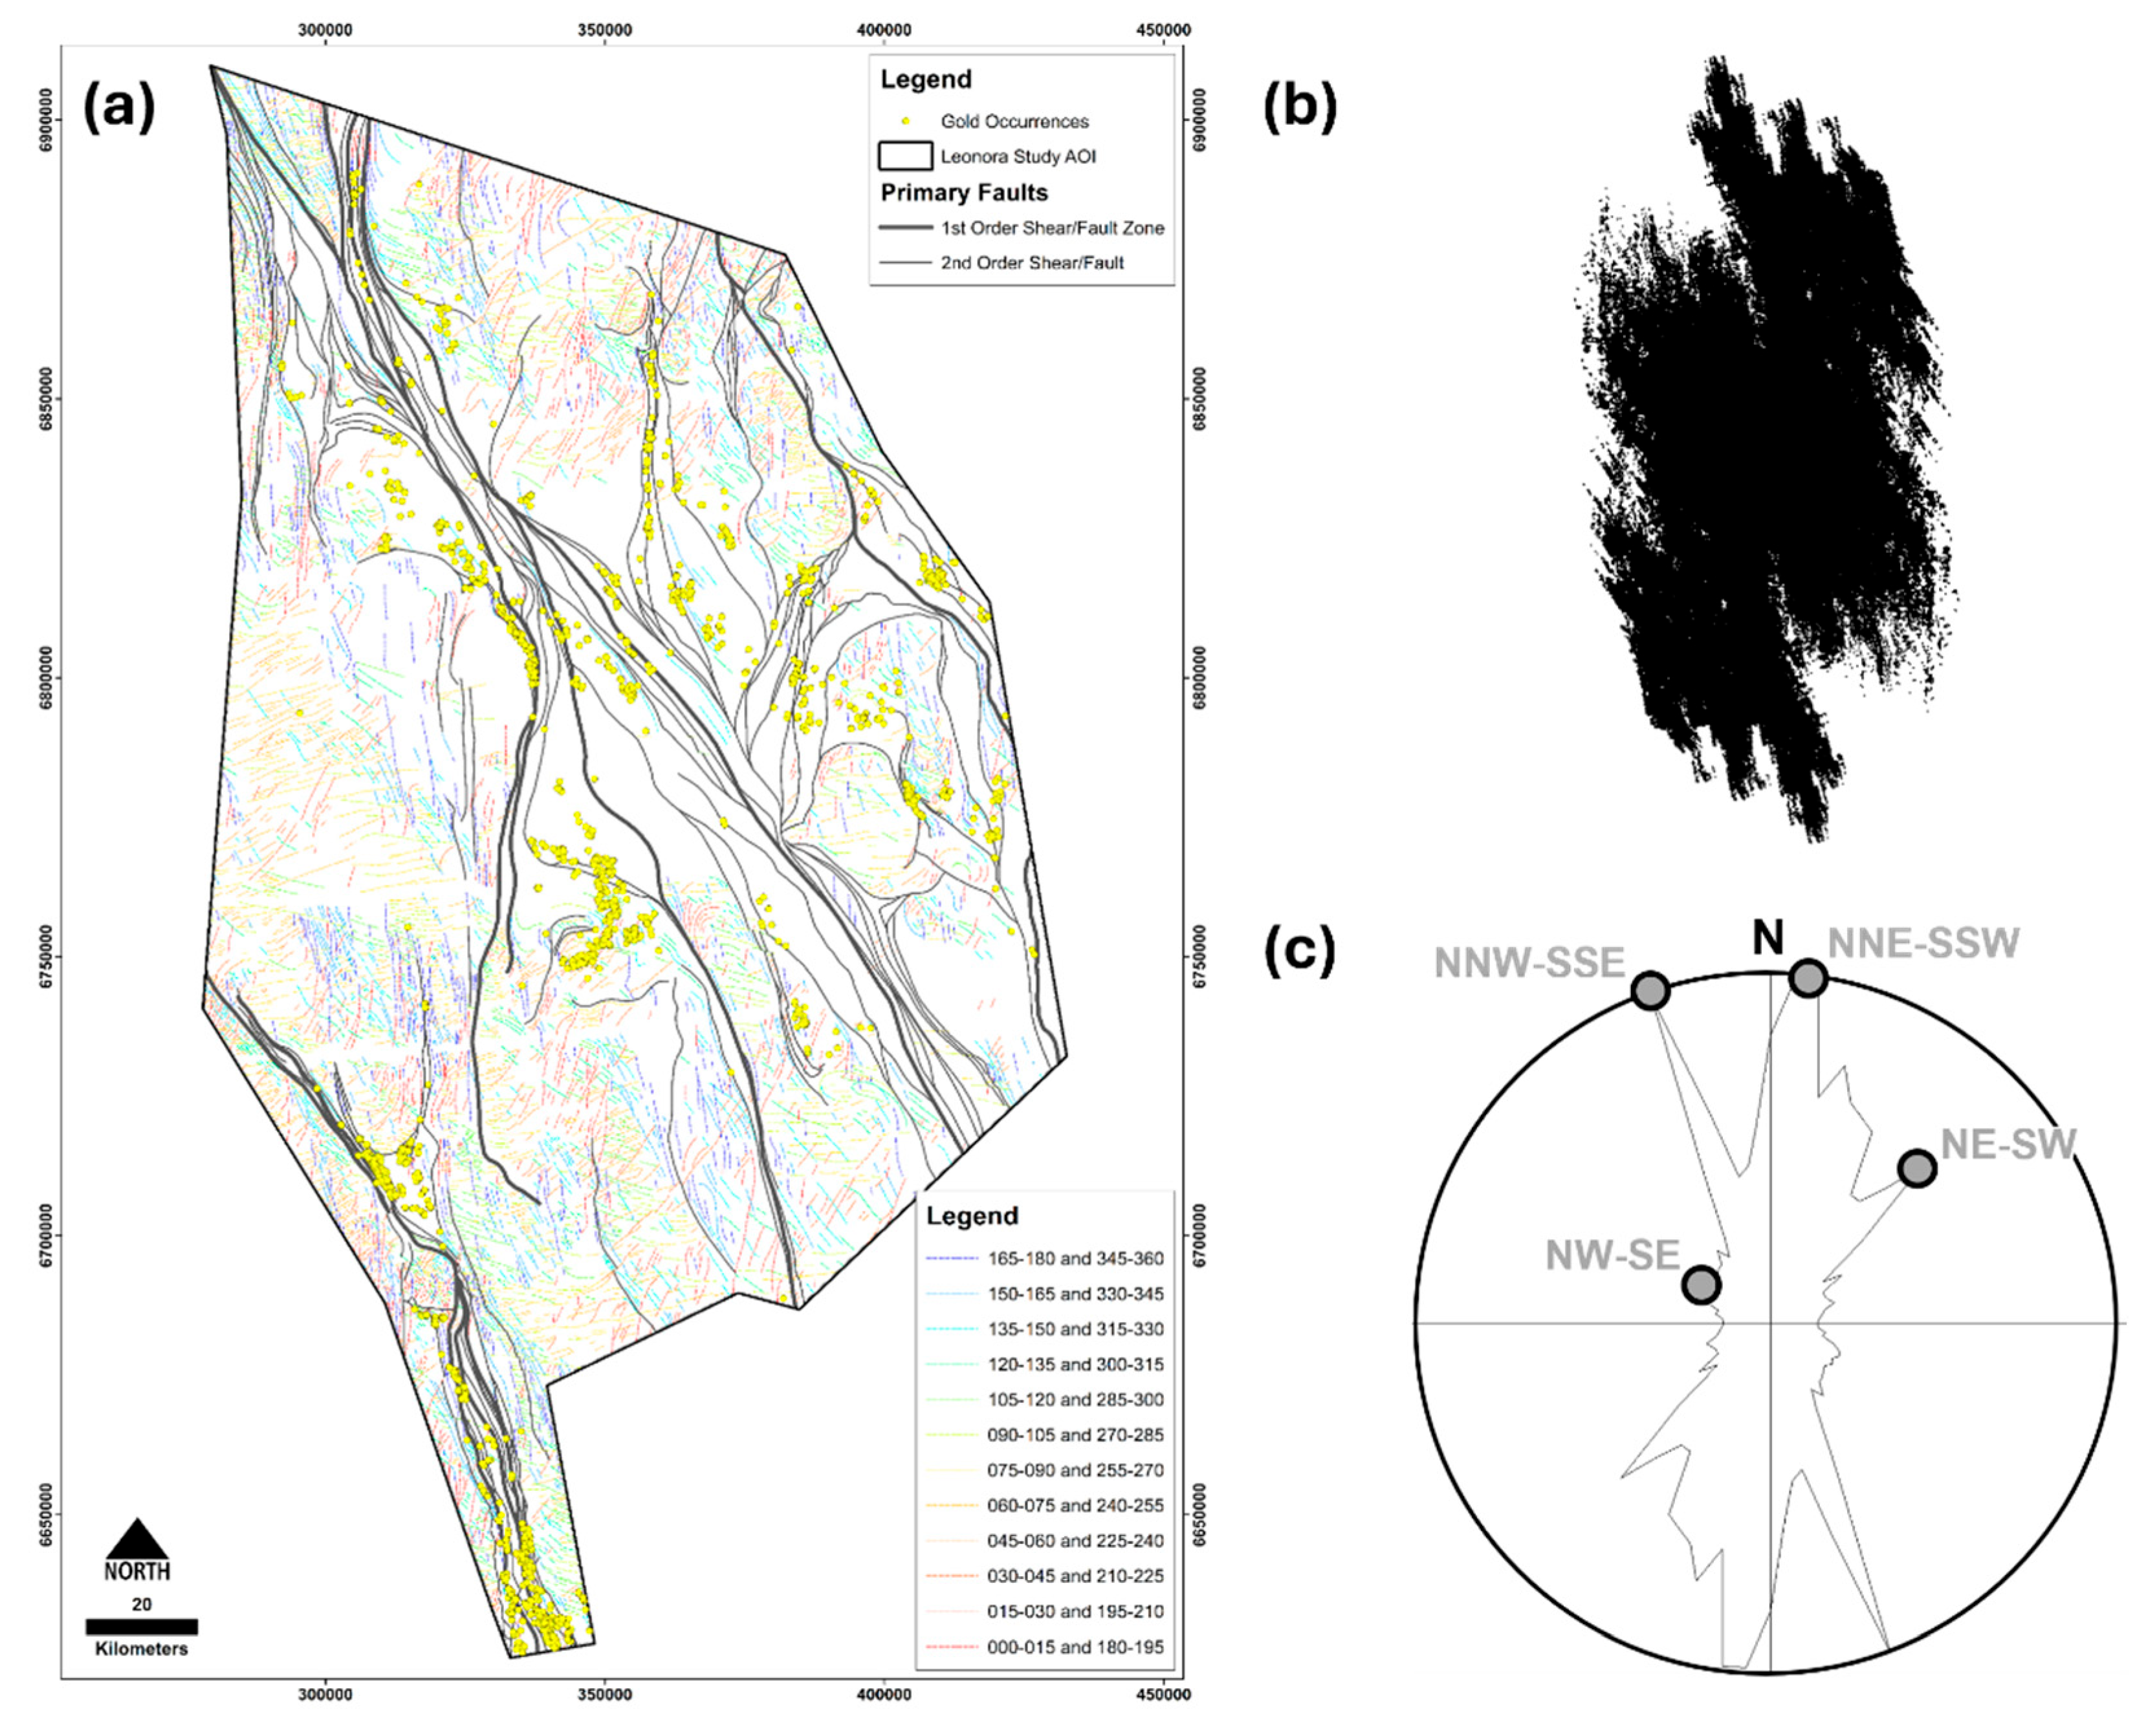
The subsidiary third- and fourth-order fault-fracture dataset shows several structural corridors with N-S, E-W, NE-SW and NW-SE orientations dominant (Figure 8e-f). These corridors are oblique, or orthogonal, to the generally NNW-SSE-trending greenstone belts, and may have played an important role in focusing fluid flow and controlling the location of gold mineralization. The latter thesis is supported by the results of a Fry analysis, which identified NNW-SSE, N-S to NNE-SSW, NE-SW and NW-SE directions of maximum gold occurrence alignment (Figure 9).
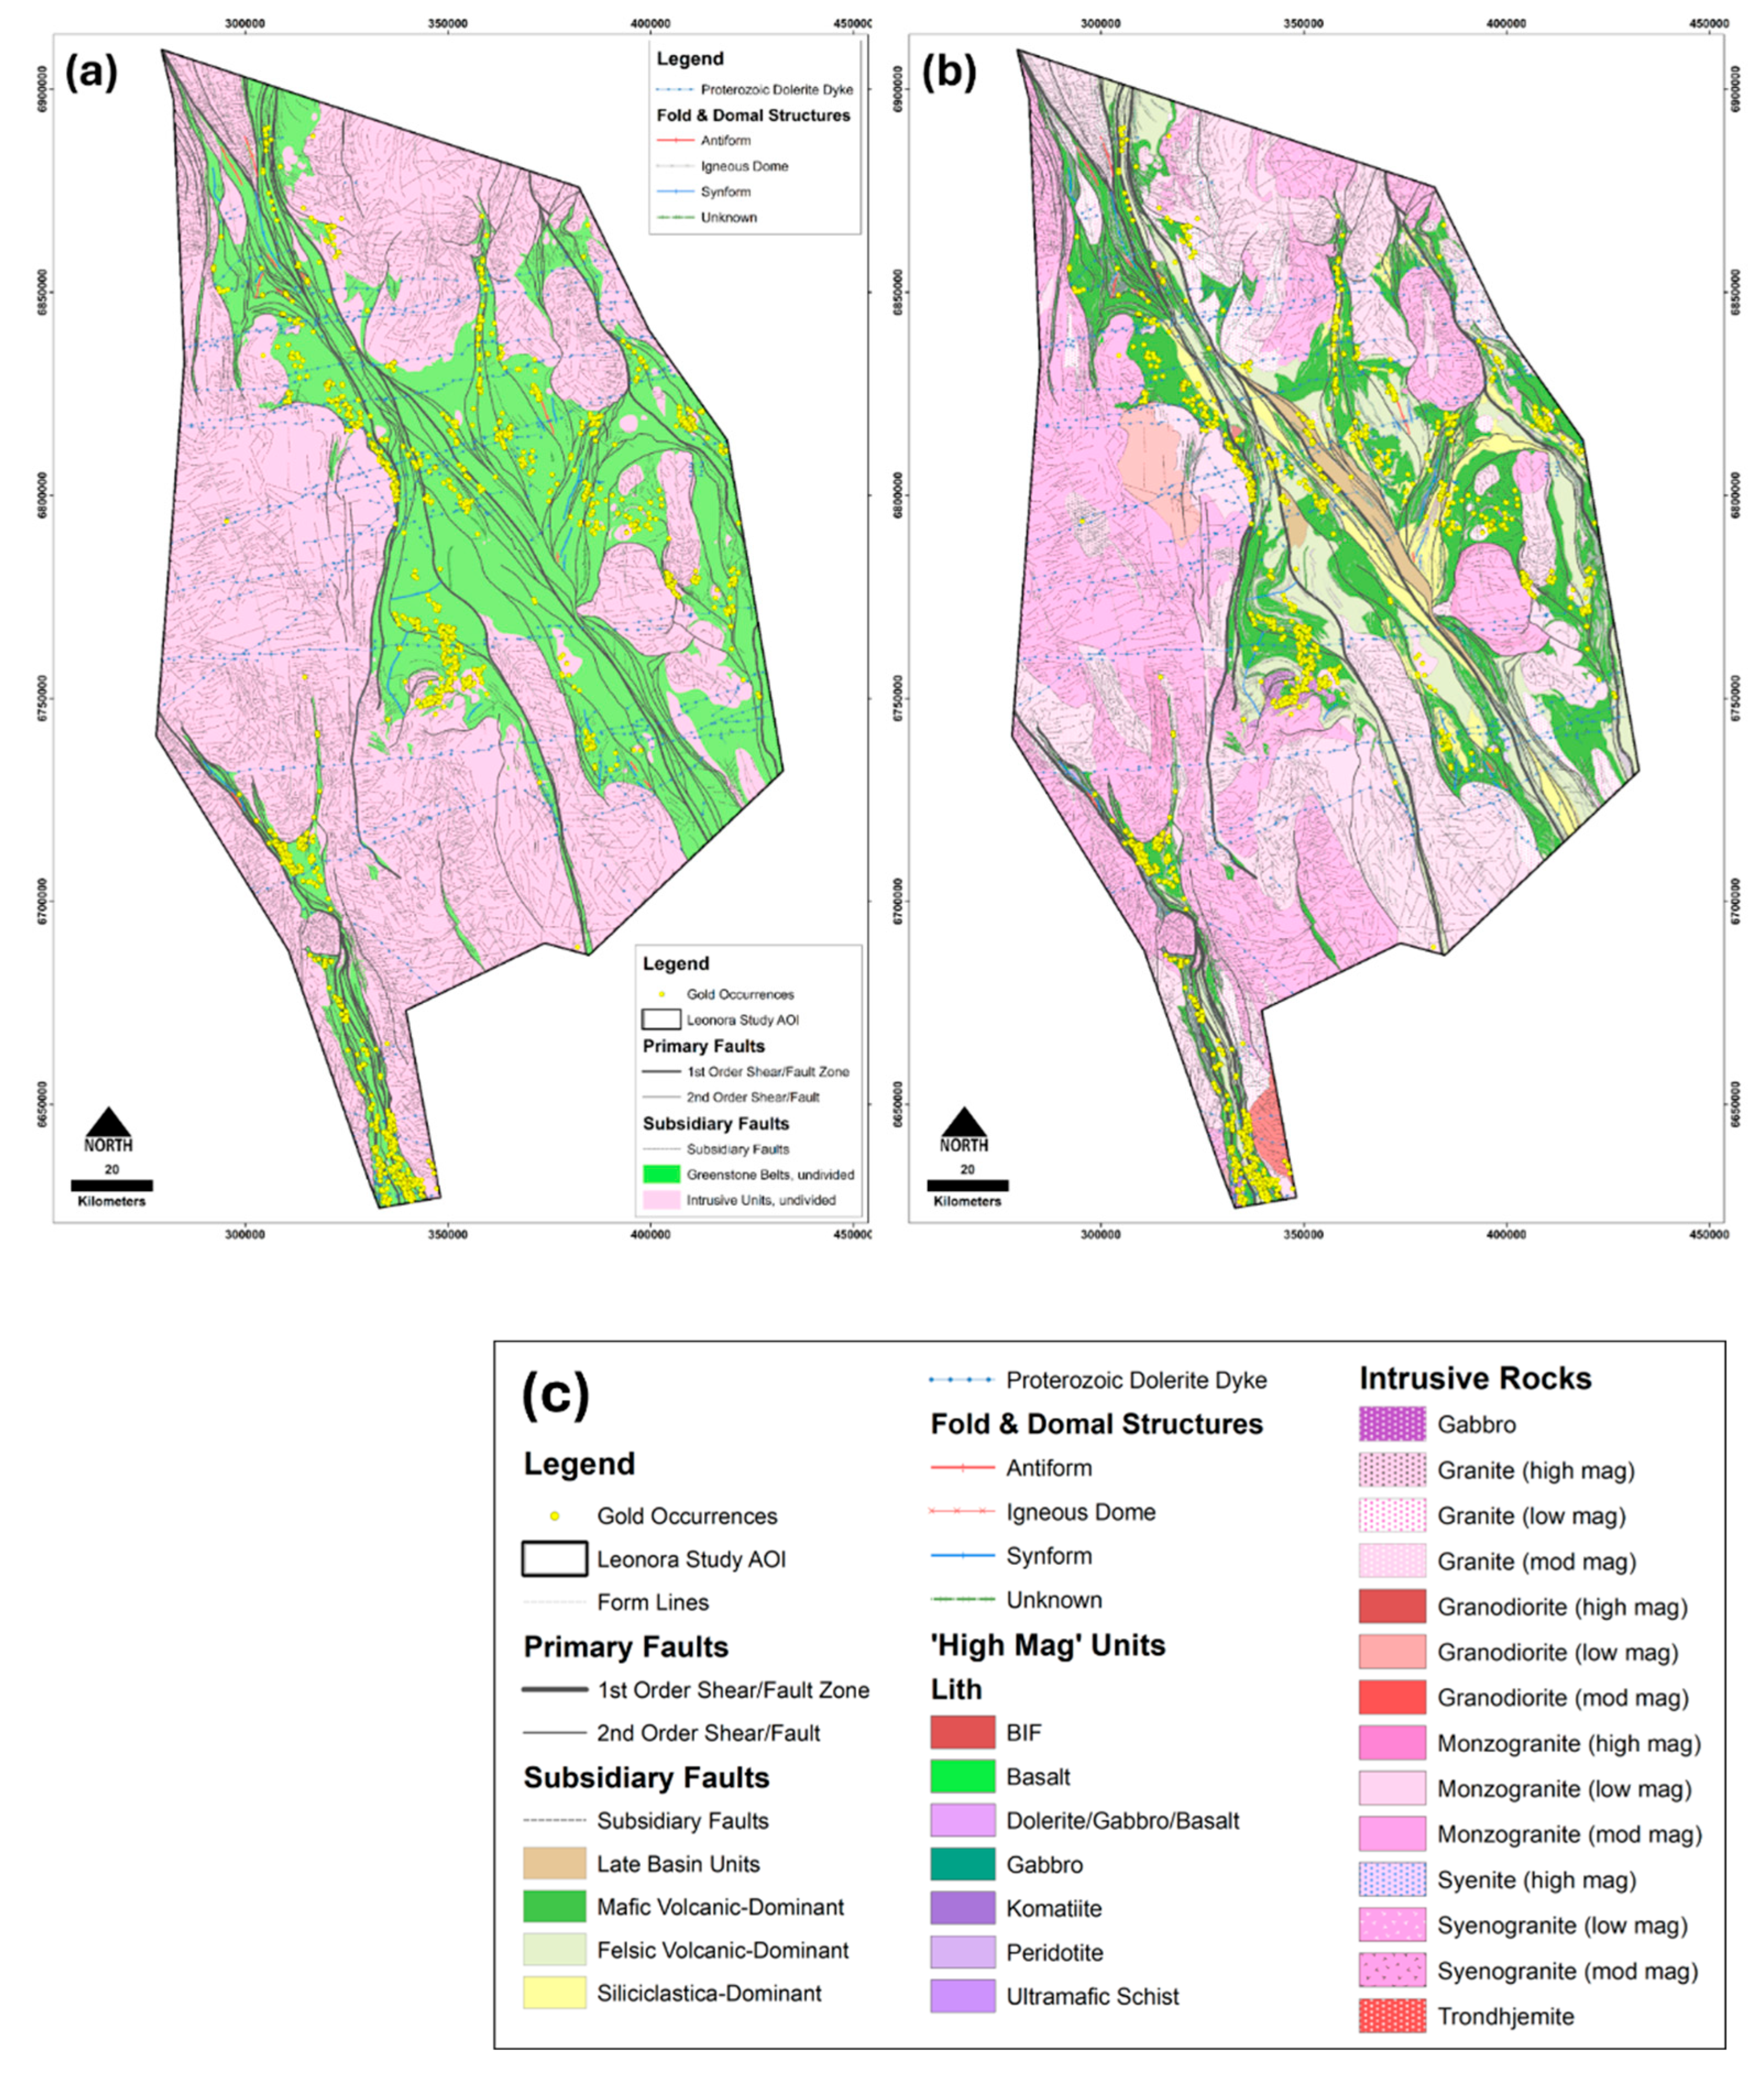
Lithologically, the study area can be divided into two broad domains, both of which are Archean in age (Figure 10): (i) Felsic to intermediate granite-gneiss, and (ii) greenstone terrain. Intrusive rocks are the most abundant rock type, covering c. 62% (in plan view) of the study area. They include large regional as well as some deformed, gneissic (‘external’ or ‘basement’) granitoid plutons, commonly of monzogranitic composition and often clearly mapped by well-defined gravity lows. Smaller ‘internal’ plutons that intruded the greenstone terrain range in composition from granitic to gabbroic. The greenstones, often spatially coincident with gravity highs, were assigned here to six broad lithological groups:
- Late basin sequences: Polymictic to oligomictic conglomerate and sandstone.
- Sedimentary siliciclastic sequences: Felsic volcaniclastic sandstone, siltstone ± conglomerate, chemical sedimentary and interleaved felsic volcanic rock.
- Felsic to intermediate volcanic sequences: Rhyolite to rhyodacite, andesite, felsic volcaniclastic and siliciclastic rock ± felsic and mafic volcanic rock, interleaved with coeval basalt and dolerite.
- Mafic to ultramafic volcanic sequences: Basalt, komatiite, peridotite, serpentinite, mafic to ultramafic schist (chlorite schist, tremolite schist, fuchsite-andalusite schist) ± coeval dolerite and gabbro.
Figure 8.
(continued). Lithostructural (solid geology) interpretation. First- and second-order fault systems draped over (c) gravity (0 to 6400 m differential upward continuation of the Bouguer anomaly grid) and (d) magnetics (1VD of the RTP).
Figure 8.
(continued). Lithostructural (solid geology) interpretation. First- and second-order fault systems draped over (c) gravity (0 to 6400 m differential upward continuation of the Bouguer anomaly grid) and (d) magnetics (1VD of the RTP).
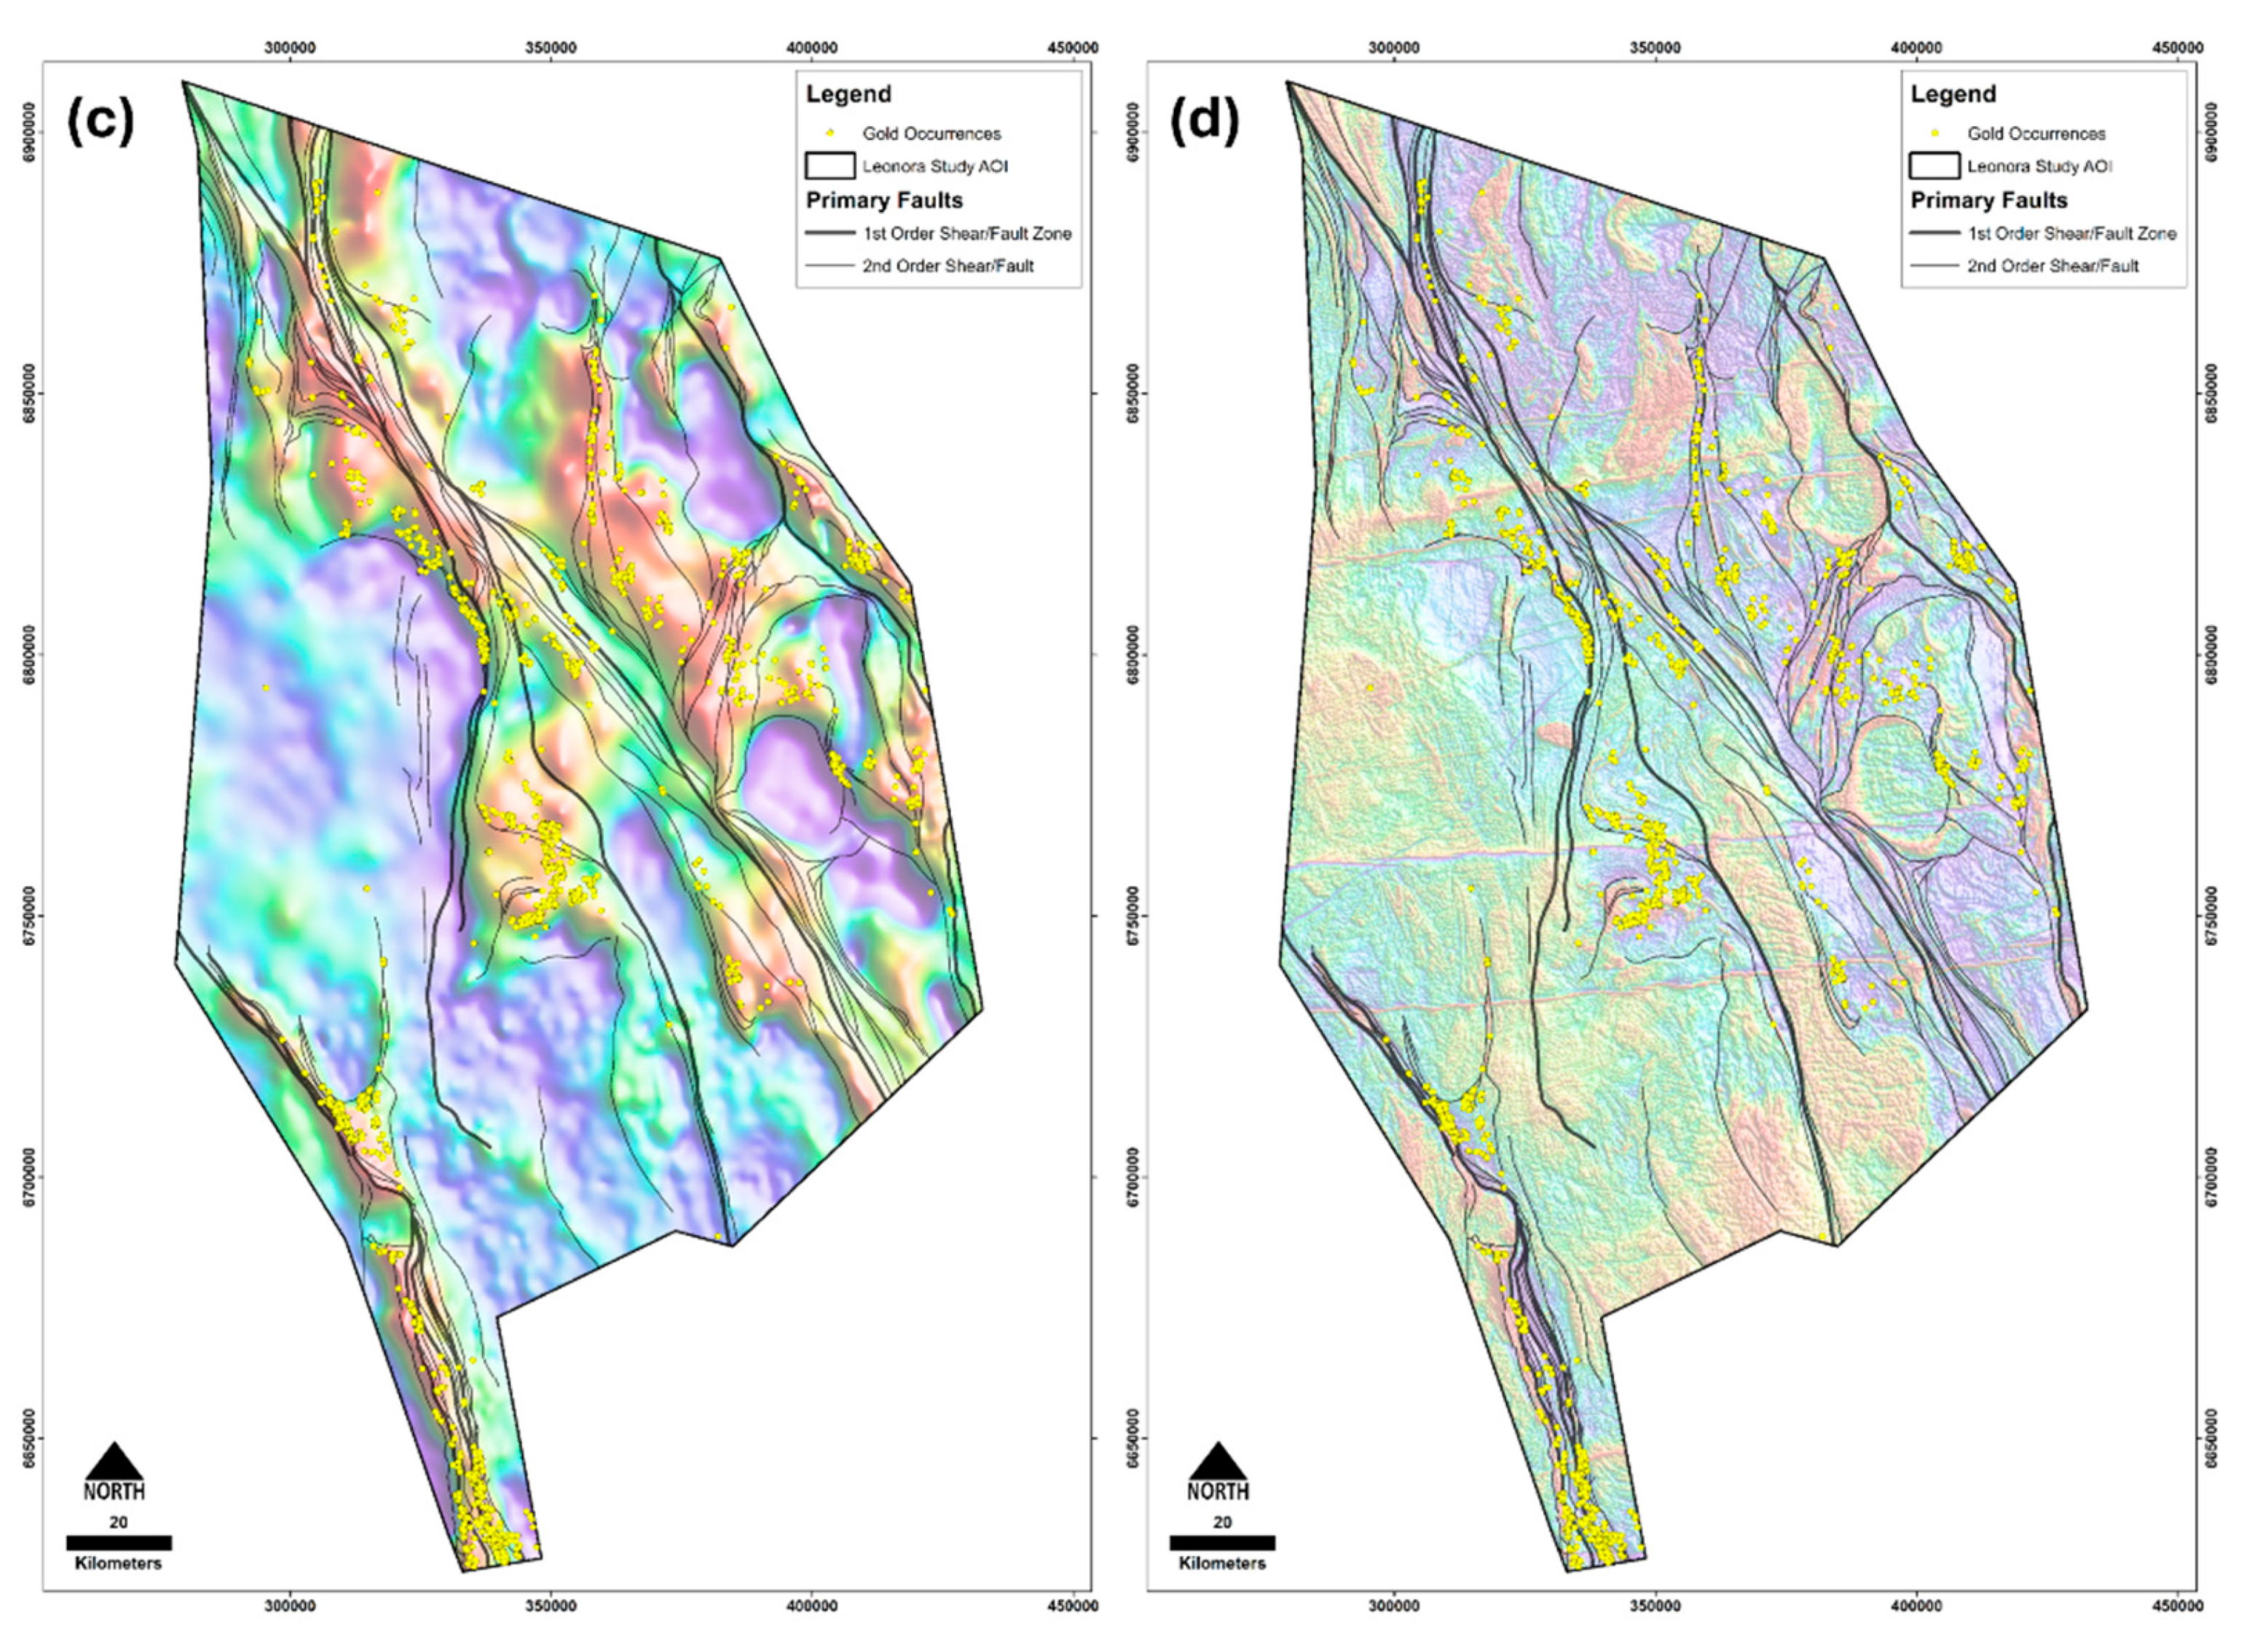
Figure 8.
(continued). Lithostructural (solid geology) interpretation. (e) Fault and fracture systems. (f) Fault and fracture systems color-coded according to dominant orientation, thereby highlighting several corridors with dominant N-S, E-W, NE-SW and NW-SE structural orientations.
Figure 8.
(continued). Lithostructural (solid geology) interpretation. (e) Fault and fracture systems. (f) Fault and fracture systems color-coded according to dominant orientation, thereby highlighting several corridors with dominant N-S, E-W, NE-SW and NW-SE structural orientations.
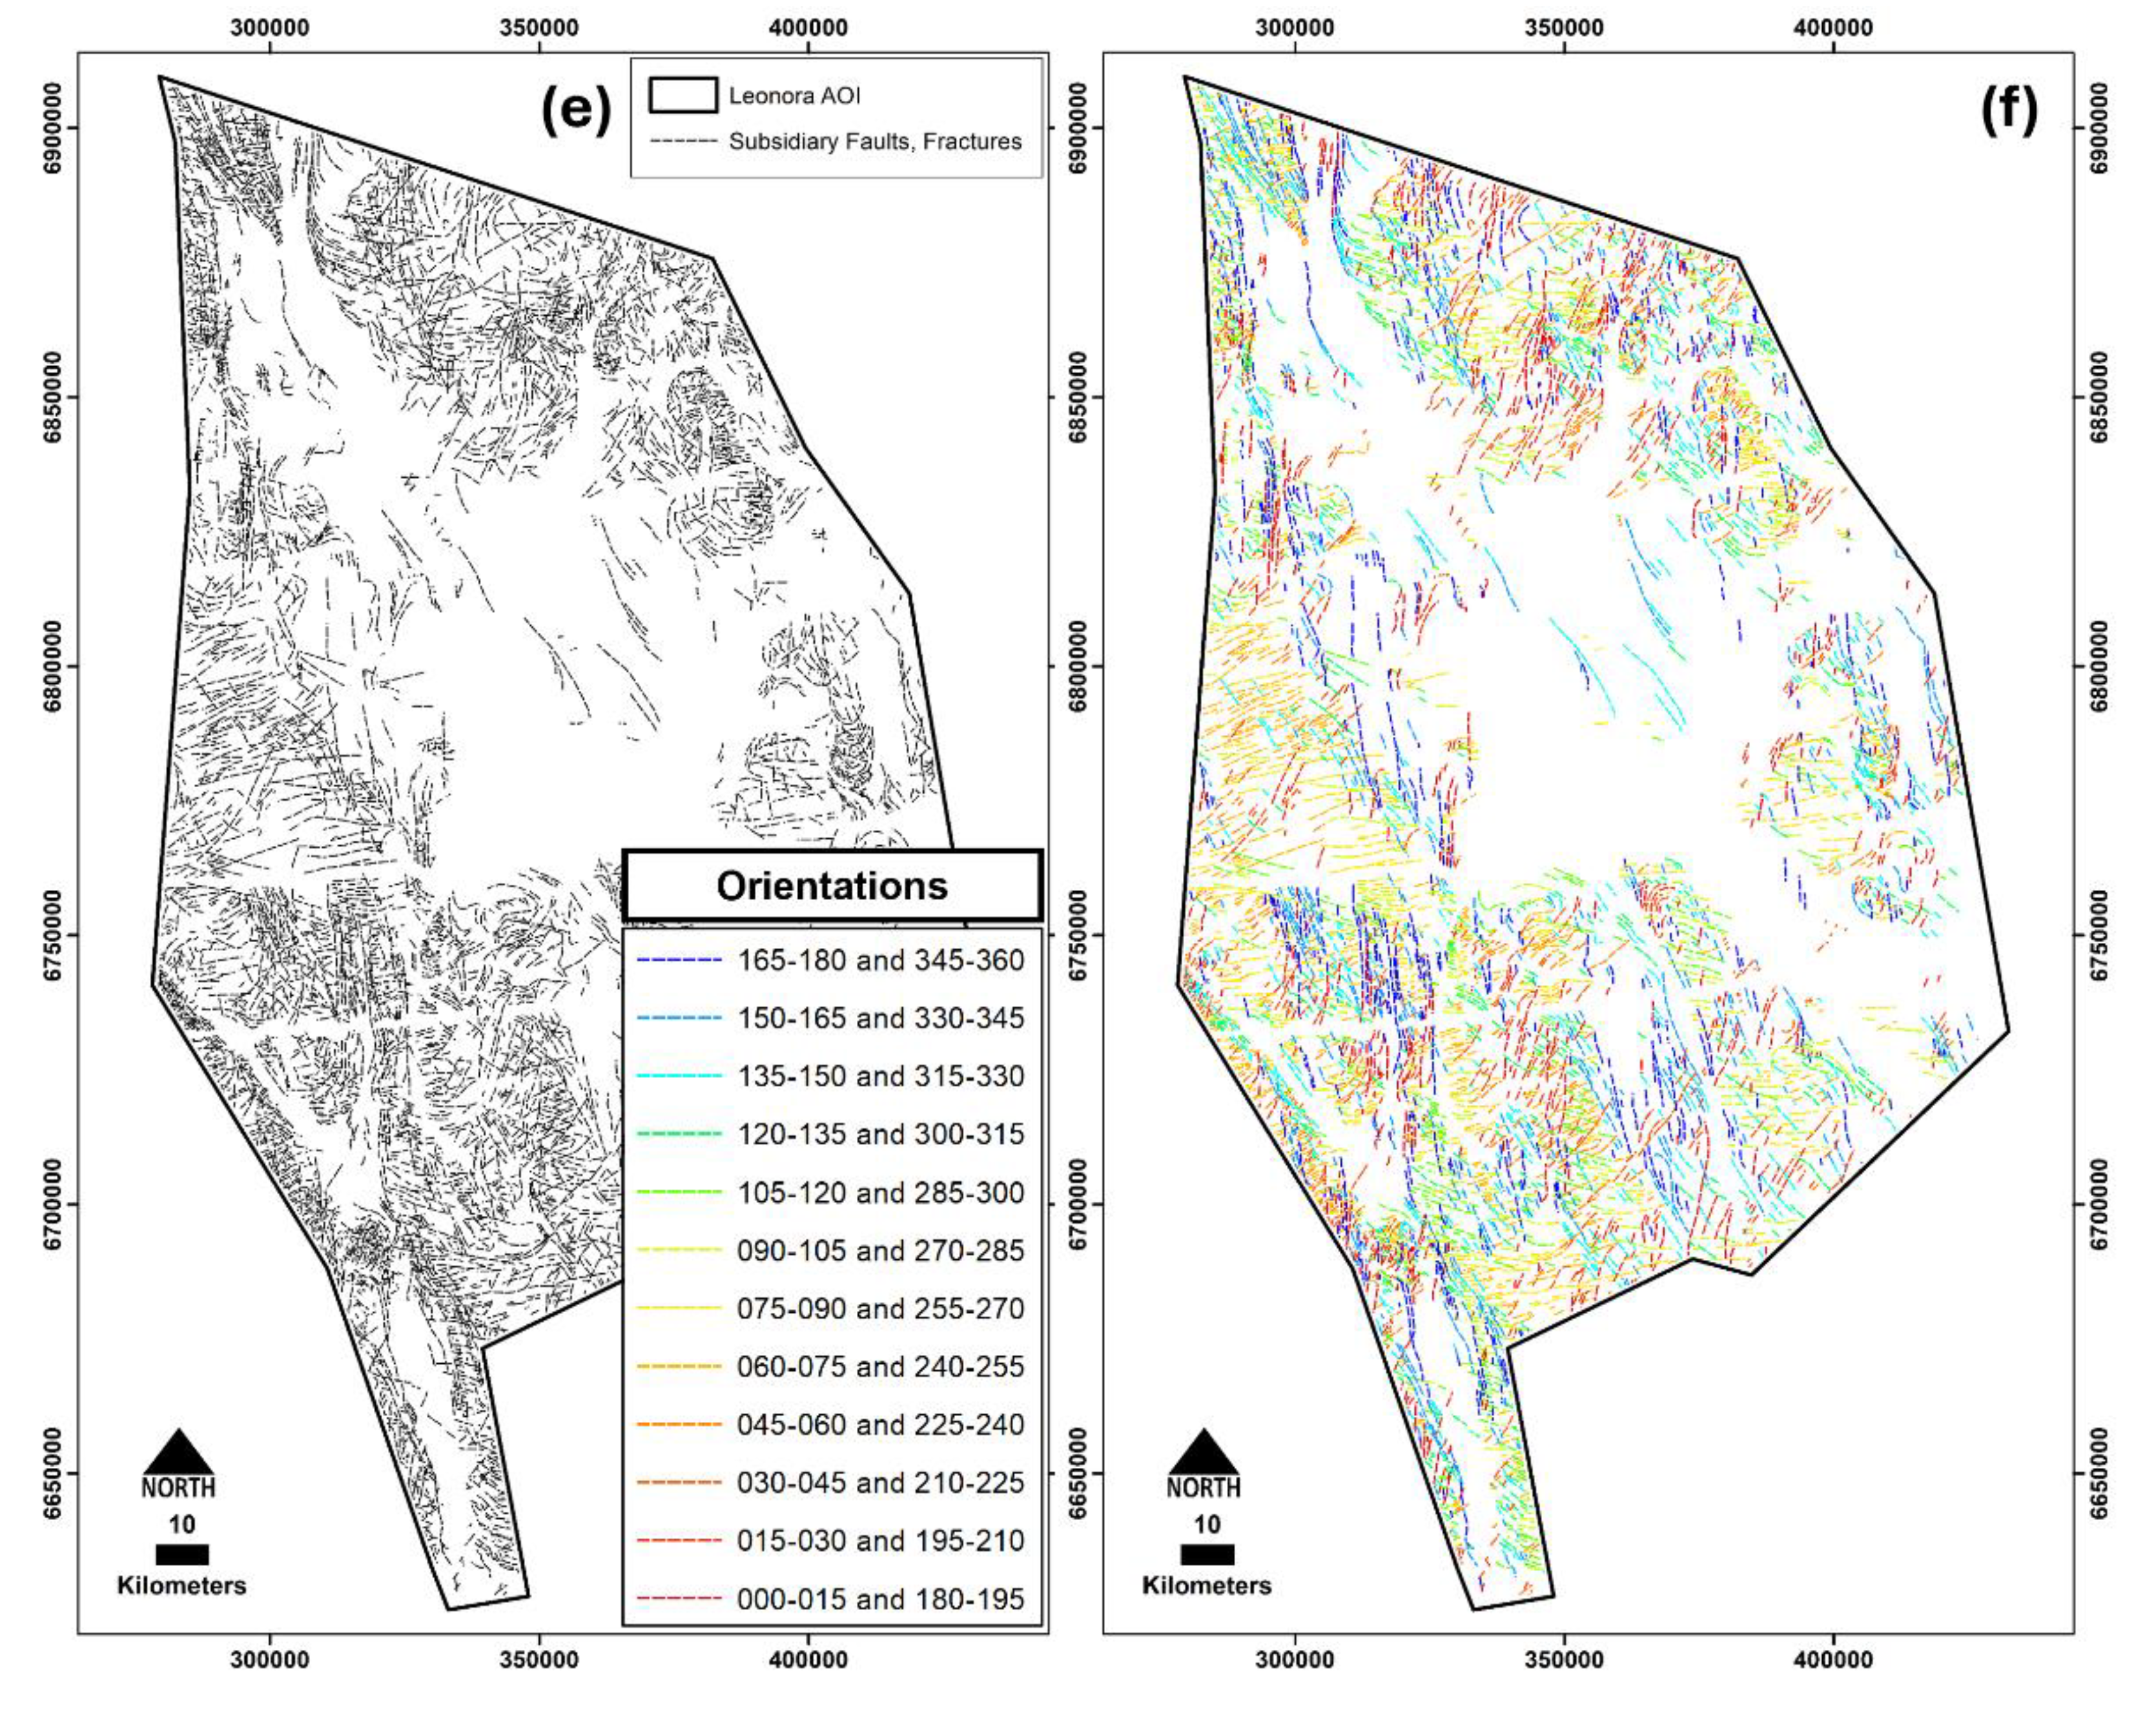
Figure 9.
Fry analysis. (a) Structural framework and gold occurrences used for Fry analysis. (b) Fry plot showing translations of all gold occurrences (i.e., relative center-to-center distances and directions). (c) Rose diagram of all translations illustrating frequency distributions and directions of maximum gold occurrence alignment: NNW-SSE, NNE-SSW, NE-SW and NW-SE.
Within all the above sequences there are narrow, curvilinear units characterized by strong positive magnetic anomalies, typically comprised of banded iron formation (BIF), basalt, dolerite, gabbro, komatiite, peridotite or ultramafic schist.
Last but not least, the study area is traversed by numerous E-W- to ENE-WSW-striking dolerite intrusions of the Paleoproterozoic (~2408 to 2401 Ma) Widgiemooltha dyke swarm [107,108] (Figure 10). The dykes are easily identifiable in magnetic datasets due to their high magnetic contrast and linear nature. Two groups of dykes are evident: (i) 2408 ± 3 Ma dykes that produce positive magnetic anomalies and typically strike c. 075°, and (ii) 2401 ± 1 Ma dykes that produce negative magnetic anomalies and typically strike c. 085°. Their contrasting magnetic polarities are linked to their emplacement during different paleomagnetic regimes. The dykes, which comprise of solidified mantle melts, are interpreted here to have exploited pre-existing crustal heterogeneities and, as such, may mark deep-seated, mantle-tapping structures of Archean age that were re-activated and re-used during Proterozoic times. Interestingly, many of the gold occurrences in the study area are located along or proximal to (i.e., within 5 km of) the dyke swarm corridors, in particular the larger gold deposits.
Figure 10.
Lithostructural (solid geology) interpretation—final map product. (a) Simplified version showing undivided granite and greenstone units. (b) Full version showing lithological subdivisions. (c) Legend to Figure 10b.
Figure 10.
Lithostructural (solid geology) interpretation—final map product. (a) Simplified version showing undivided granite and greenstone units. (b) Full version showing lithological subdivisions. (c) Legend to Figure 10b.
6. Targeting Model
Generating an efficient targeting model requires careful consideration of several interrelated factors [21,30,109,110]:
7. Mineral Potential Modeling (MPM)
7.1. Statistical Evaluation of Predictor Maps
The predictive performance of each predictor map was statistically assessed using a reference dataset consisting of 1773 gold occurrences, referred to here as mineral deposit locations (MDLs), and 1773 unmineralized sites, referred to here as non-deposit locations (NDLs). The MDLs are comprised of gold deposits, occurrences, and gold mineralized drill intercepts. The NDLs were selected based on the following criteria: They must (i) be spatially randomized; (ii) be situated at a sufficient distance from known prospect sites; and (iii) located outside of the gold permissive tract.
Two statistical approaches were utilized to evaluate the predictor maps: The (i) normalized density index (Nd) [126,127] illustrated in prediction-area plots (Figure A1) and area under the receiver operating characteristic curve (AUC) (Figure A2) [127,128]. Predictor maps that satisfied the statistical thresholds of Nd > 1.00 [124] and AUC > 0.50 [128] were deemed suitable for incorporation into MPM (Table 4).
7.2. Continuously-Weighted Mineral Potential Models
Gold prospectivity in the Leonora district was modeled using three continuous integration techniques: (i) Fuzzy gamma [64], (ii) geometric average [65] and (iii) improved index overlay [66]. Predictor maps were weighted through logistic [63] and small fuzzification functions [129,130], yielding fuzzy membership scores within the interval [0,1] for the proxy variables (Figures A5–A36).
The MPM outcomes for the Leonora district, derived from the application of these integration functions, are depicted in Figures 11a–c.
7.2.1. Continuous Fuzzy Gamma Technique
Continuously-weighted fuzzy spatial predictors can be integrated through the application of fuzzy operators [24]. In the present study, the fuzzy gamma operator that synthesizes the SUM and PRODUCT operators was utilized to achieve fine-tuned calibration of various inputs [129]:
For each cell, represents the ith input spatial predictor’s fuzzy score, while denotes the resultant potential score obtained through the combination procedure, with the parameter constrained to the interval . Here, a gamma value of 0.9 was adopted.
7.2.2. Geometric Average Technique
The geometric average constitutes an effective multi-criteria decision-making (MCDM) framework, operationalized for the coherent synthesis of continuously-weighted predictor maps in MPM. Pursuant to the mathematical formulation in Equation 2, the geometric average (GA) associated with each spatial cell is formally computed as the nth root of the overall product of the respective proxy values [65]:
For each spatial cell, n denotes the total number of predictor maps, while Fi represents the fuzzy weight corresponding to the ith predictor map. Accordingly, Equation 2 was reformulated to accommodate the specific conditions of the study area as follows:
In this formulation, denote the fuzzy scores assigned to the evidential values within their respective predictor maps. Subsequent to the computation of for each unit cell throughout the study area, the resulting values were spatially mapped to develop the geometric average gold potential model.
7.2.3. Improved Index Overlay Technique
The Improved Index Overlay represents an enhanced version of the data-driven index overlay approach applied in both brownfield and greenfield MPM [66]. In contrast to conventional and data-driven index overlay approaches, this technique assigns weights to each predictor map using a modified Shannon’s entropy algorithm. Notably, it eliminates reliance on expert opinion or pre-existing mineral occurrences. The detailed workflow of the modified Shannon’s entropy weighting procedure is outlined in [66]. Following this procedure, the weights of individual predictor maps were objectively determined (Table 5), demonstrating that the density of lithological contacts represents the most influential predictor map, whereas proximity to principal faults exhibits the lowest relative significance.
Upon deriving the weights of the predictor maps through the modified Shannon’s entropy algorithm, the maps were subsequently integrated using the Improved Index Overlay framework as follows:
where for all cells within the study area, denotes the Improved Index Overlay score, while signifies the weight of the ith predictor map, assigned utilizing the modified Shannon entropy algorithm. The variable reflects the continuously allocated cell value of the ith predictor map through a logistic or small fuzzification function. In this study, Equation 4 is formulated as follows:
Here, denote the weights of the predictor maps, determined based on the modified Shannon entropy algorithm. The parameters represent the continuously assigned weights reflecting the evidential value of each individual cell within the respective predictor maps.
7.3. Knowledge-Driven BWM-SAW Technique
Within the spectrum of knowledge-driven techniques to MPM, multi-criteria decision-making (MCDM) approaches are particularly valued for their efficiency [62,132,133,134,135]. In this context, the assignment of weights to predictor maps is generally carried out through either matrix- or comparison-oriented procedures. Among these, the simple additive weighting (SAW: [68]) and best-worst method (BWM: [70]) represent prominent examples of matrix- and comparison-oriented techniques, both of which have been successfully implemented in MPM [62,132,133,134,135].
In this study, a hybrid MCDM framework, namely BWM–SAW [134], was employed in conjunction with the overall performance (Op) index [136,137,138]. The Op index is calculated on the basis of an improved P–A plot that incorporates three fundamental criteria: (i) occupied area curve, (ii) NDL prediction rate curve and (iii) MDL prediction rate curve [136]. To achieve this, the BWM technique was implemented to objectively quantify the weights of the decision criteria encapsulated by the predictor maps (Table 4). The Op index was utilized to determine the weights of the predictor maps, as well as to identify the best and worst predictor maps (Figure A33, Table 6). Subsequently, the others-to-worst (OW) and best-to-others (BO) vectors were established (Tables A1 and A2) in accordance with the Op values reported in Table 6. Based on these parameters, problem 3 of [134] can be formulated as presented in the following Equation 6:
Next, optimal weights and were determined (Table A3) by solving Equation 6. For the obtained consistency index was 5.23 [134] whilst the consistency ratio was demonstrating appropriate consistency. After assigning weights to the predictor maps, the SAW approach was employed to rank the alternatives. To achieve this, an initial decision matrix was developed that includes 1,201,497 decision alternatives, each linked to an individual cell with a particular coordinate in the corresponding predictor maps, and 28 decision criteria. The alternatives were then ranked via the SAW step-by-step process, previously described by [134]. The BWM-SAW gold potential model for Leonora district is shown in Figure 11d.
7.4. Data-Driven Random Forest (RF) Algorithm
A growing number of recent investigations have underscored the efficacy of RF-based MPM, consistently evidencing its outperformance relative to a broad spectrum of supervised machine learning techniques previously adopted for MPM [31,50,62,139,140,141,142,143]. The superior performance of RF is largely attributable to its inherent ability to alleviate overfitting tendencies and to enhance predictive efficiency through the incorporation of the bootstrap aggregation (bagging) paradigm [67]. RF is an ensemble-oriented machine learning algorithm that capitalizes on a resampling mechanism to generate multiple random subsets of training samples, each subsequently employed in the construction of an unpruned decision tree [67]. Within this framework, a bootstrapping procedure is operationalized, wherein sub-samples with replacement are drawn from the spatial proxy values at mineral deposit and non-deposit locations, collectively designated as labeled data. Decision trees are trained on the in-bag portion of these samples, representing approximately two-thirds of the labeled dataset, while the residual fraction, referred to as out-of-bag (OOB) samples, is exploited to estimate decision tree impurity. As such, RF represents an aggregation of unpruned decision trees, each of which is developed in accordance with a distinct set of so-called existent patterns.
The implementation of RF requires the specification of two principal hyperparameters: (i) the number of decision trees (n) to be generated within the ensemble and (ii) the number of predictor variables (m) considered at each node split [67]. In this study, an n value of 1,000 and m value of 9 were considered based on the procedure outlined by [139]. The relative importance of predictor variables can be quantitatively evaluated through the mean decrease in the Gini impurity index (MG) and accuracy (Ma). The MG statistic reflects the degree to which each variable contributes to enhancing node homogeneity and, by extension, the overall discriminative power of the RF model. Conversely, Ma is derived from the computation of out-of-bag (OOB) error, thereby serving as an accuracy-based measure of predictor relevance. In line with [67], higher values of both Ma and MG indicate greater predictive importance of a given variable. Figure A34 illustrates the significance of the predictor variables in the RF modelling pursuant to MG and Ma. According to this figure, proximity to felsic to intermediate volcanic rocks is the least significant predictor map in this study while the proximity to domains of juvenile crust, based on the Ma, and the proximity to basement granitoids, based on the MG, are the most significant ones.
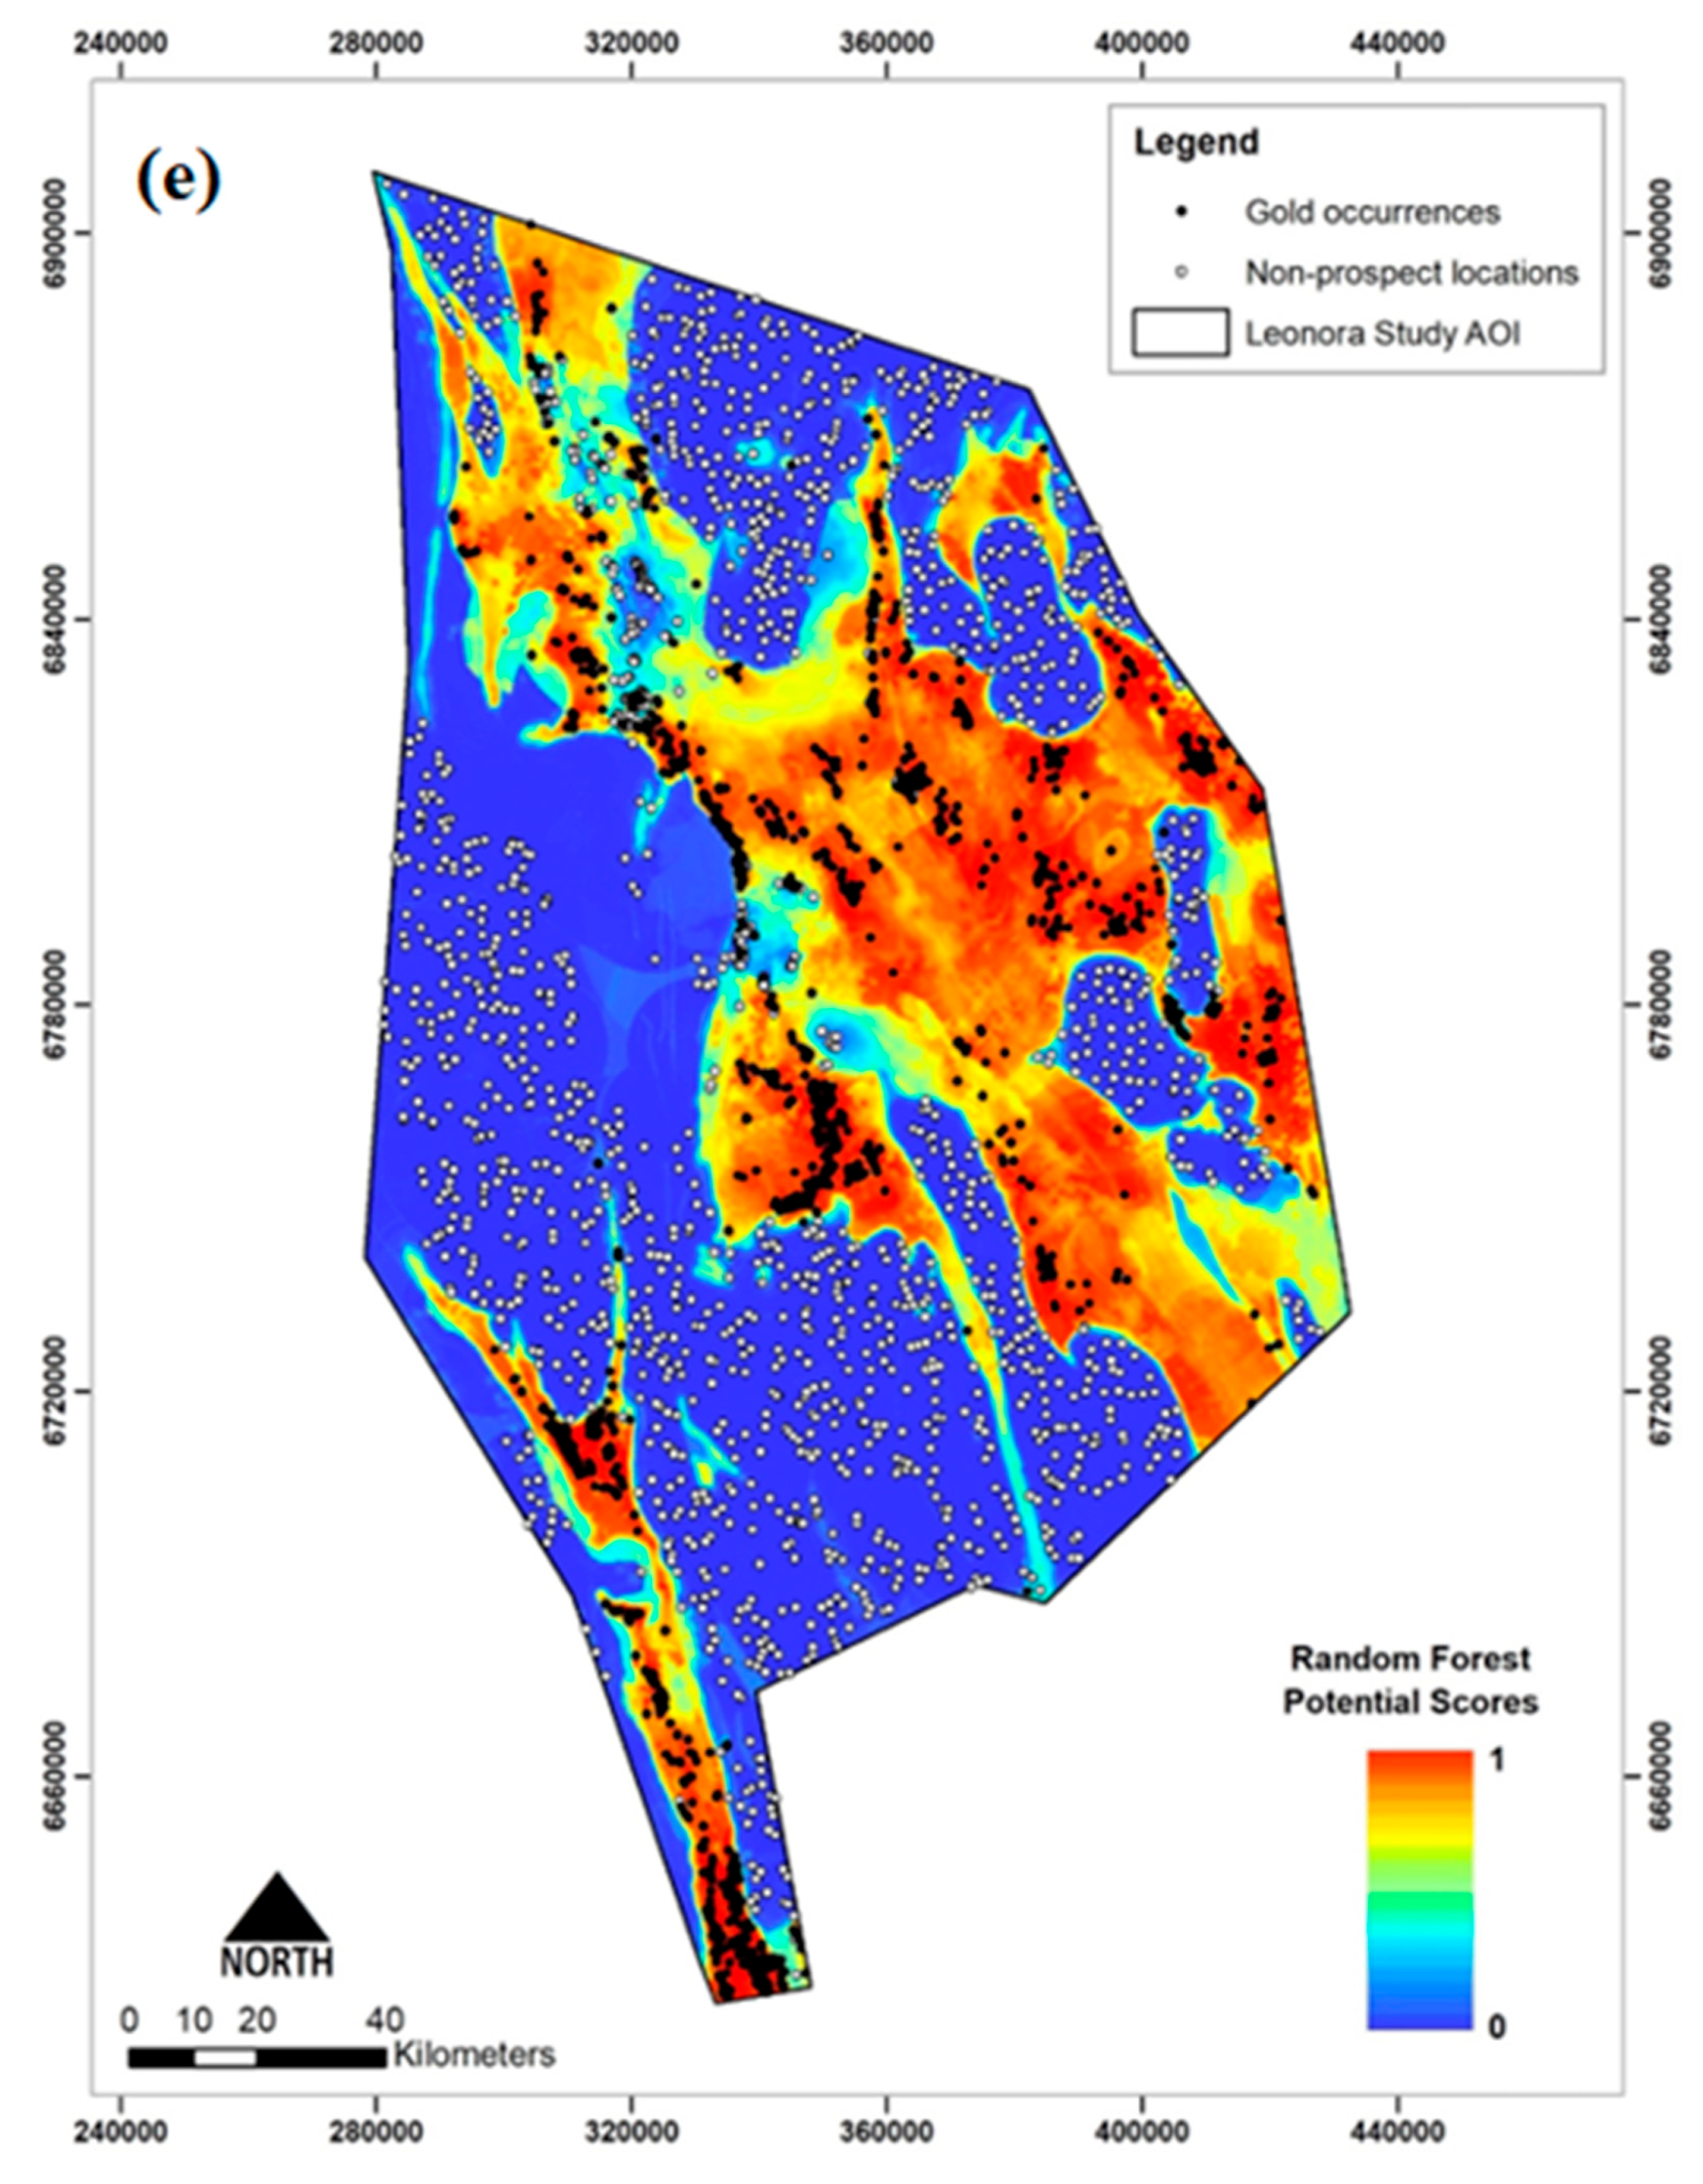
Figure 11e illustrates the RF-based gold potential model generated with the 27 competent fuzzified predictor maps (Figures A5b–A31b), deliberately excluding the predictor map of “proximity to known gold occurrences” to mitigate exploration bias, and a training error curve as depicted in Figure A35. As evidenced by the latter, the modeling error rate exhibits a progressive decline with the incremental growth of decision trees, decreasing from an initial mean squared error of ~0.065 for the first tree to about 0.028 upon the 1,000th iteration.
Figure 11.
(continued). Gold potential maps. (e) Random forest.
8. Discussion
8.1. Geology and Structure
One of the key geological observations in this study is that of gold occurrences having proximity, association and abundance relationships with structures that are orthogonal, or at high angles, to the dominant NNW-SSW grain of the terrane- and domain-bounding fault systems and regional schistosity preserved in the greenstone belts.
Firstly, we observed a spatial relationship between gold occurrences, in particular the larger ones, and E-W-striking magnetic edges, representing certain geological features with Proterozoic dolerite dyke corridors the most prominent of these (Figure 7). A similar relationship was noted by [144] for the Yilgarn Craton as a whole in which most of the major gold districts exhibit “intriguing spatial associations” with Proterozoic dykes. This association was interpreted by [144] in terms of the Proterozoic dykes occupying much older planes of weakness that formed prior to or at the time of Archean gold mineralization. We agree with this interpretation and believe that Proterozoic dyke swarms, which can be easily traced in magnetic ± gravity data, map important yet cryptic basement structures, some or segments thereof played a critical role in localizing gold mineralization. This belief was confirmed by spatial statistical analyses undertaken as part of this study, returning AUC values of 0.54 and 0.52 as well as Nd values of 1.08 and 1.04 for predictor maps representing Proterozoic dolerite dyke proximity and density, respectively. According to published constraints [126,128], any predictors with AUC > 0.50 and Nd > 1.00 are statistically sound, in this case confirming a valid spatial relationship between gold occurrences and Proterozoic dolerite dykes, or more accurately the structures that host them.
Secondly, we observed N-S, E-W, NE-SW and NW-SE structural trends, represented by subsidiary, late tectonic (likely of D4/5 timing), low-displacement faults and fractures, that are oblique, or orthogonal, to the dominant NNW-SSW grain. Fry analysis indicated similar directions of maximum gold occurrence alignment, implying that structures of this nature may have played an important control on the location of gold mineralization. Some of these structures are coincident with NE-SW- and NW-SE-striking low-displacement faults and fractures interpreted by [145], who referred to them as Perkins Discontinuities. The latter term describes planar boundaries that mark an abrupt termination of mineralization continuity, typically observed at the hand specimen to deposit scales. According to [145], the nature of the Perkins Discontinuities identified at the Aphrodite deposit and surrounding area suggests that gold mineralization occurred after the formation of these discontinuities, resulting in asymmetric gold mineralization across these low-displacement faults and fractures, which themselves are typically unmineralized. A lithostructural interpretation by [146] of the Bardoc area, done in greater detail than the solid geology interpretation completed as part of this study, showed that Aphrodite lies within a ~5 km-wide, NE-SW-striking corridor defined by a series of fractures and low-displacement (typically <100 to 300 m) faults with apparent dextral kinematics (Figure 12). These structures, as well as less common NW-SE-striking ones, cut obliquely across the dominant NNW-SSE trend of the Bardoc Tectonic Zone. Deposit-scale studies completed at Aphrodite reported cross structures of broadly similar orientation, including NE-SW-striking and steep to moderately NW-dipping faults, the NW-SE-striking and moderately NE-dipping Epsilon orebody [93] and abundant yet poorly mineralized, ENE-WSW (070°) and WNW-ESE (130°)-striking quartz-carbonate ± pyrite veins [93,147]. We believe that the intersection of the dominant NNW-SSE and subordinate NE-SW (± 22.5°) and NW-SE (± 22.5°) structural trends created a permeability network that played a major role in localizing gold mineralization, not only at Aphrodite but also in other places where similar structural interaction and complexity exist. More work would be required, and at a variety of scales and locations, to better understand how cross structures influenced gold mineralization and the geometry thereof.
8.2. Geophysics and Remote Sensing
Magnetic and gravity data are the most commonly used and available geophysical datasets for regional targeting of orogenic gold mineralization in the Yilgarn Craton. Greenstones often show significant contrast relative to the surrounding granite in both magnetic and gravity data. Detailed magnetic data typically map the fabric of greenstone belts. Fabric-parallel features apparent in magnetic data tend to be fault or shear zones or stratigraphic boundaries. By and large, ‘cross-fabric’ features are widespread with the most common ones typically representing cross-cutting fault-fracture systems and mafic dikes. Gravity data over the Yilgarn Craton are generally too coarse in resolution for mapping detailed features. However, they are useful for mapping greenstone distribution and relative thicknesses. They also serve to highlight major cross structures. The main goal of the semi-automated geophysical filtering undertaken as part of this study was to highlight geological features in a relatively unbiased and consistent way. One way this was done is by extracting features in particular orientations (Figure 5, Figure 6 and Figure 7). This can be useful because different orientations often are related to different styles or periods of deformation. The phase congruency algorithm extracts features in eight different orientations (i.e., 0°, 22.5°, 45°, 67.5°, 90°, etc.). These can then be combined to highlight structures in certain orientation ranges. For example, the fabric parallel features in Figures 5a–7a are generated by combining the 0° and 167.5° orientation so that features with a NNW-SSE to N-S trend are highlighted. In the case of the Yilgarn Craton, these features tend to be belt-parallel fault/shear zones or stratigraphic contacts. Gold mineralized structures are typically parallel to the fabric of the host greenstone belt. Cross structures often impact grade continuity and distribution. Extracting these different types of structures separately makes targeting more effective. The phase congruency method is also relatively amplitude independent, which makes it possible to highlight subtle features in the data. This is important because orogenic gold systems are not always associated with strongly magnetic bodies. Rather, the geophysical signatures of orogenic gold systems are highly variable due to a wide range of host rocks, structural settings, mineralization styles, ore minerals and alteration assemblages.
Direct detection of unweathered orogenic gold systems with Sentinel-2 data is difficult. Pyrite is one of the most common alteration phases, but it cannot typically be detected with satellite remote sensing data. However, the Sentinel-2 satellite can detect the weathering products of pyrite such as goethite and jarosite [45,148]. Weathering of pyrite generates acidic conditions that lead to enhanced generation of clays during the weathering of silicate minerals [149]. The Yilgarn Craton has experienced significant weathering and oxidation [150], so any outcropping gold mineralization should be weathered to an assemblage containing ferric-Fe-bearing phases and clays. Areas with coincident highs in goethite, clay and IFD indexes were found to correlate well with known mineralization in the Leonora area. Any single remote sensing product will have many false positive anomalies. We helped limit this issue by using a CMY ternary combination of the goethite, clay and IFD indexes. Our approach allowed us to highlight all areas with coincident highs in these indexes accurately and efficiently. Extracting the anomalies using an automated approach helps mitigate issues with interpreter bias or inconsistencies. The main limitation of this approach with the Sentinel-2 data is that it can only detect outcropping mineralization. Even very thin cover would block any signal from underlying rocks.
8.3. Mineral Potential Modeling (MPM)
8.3.1. Predictor Map Performance
The significance of predictor maps in MPM can be conceptualized from two perspectives. First, during the pre-modeling stage, attention is directed toward the identification and selection of the most competent predictor maps (Table 4), which are subsequently incorporated into the integration framework for developing the potential model. Second, in the post-modeling stage, predictor maps are systematically ranked according to the degree to which they have contributed to the prediction of potential values (Figure A34). From the pre-modeling perspective, the careful selection of well-performing predictor maps plays a critical role in minimizing systemic uncertainty and ensuring that the modeling process is grounded on robust and meaningful spatial variables. From the post-modeling perspective, predictor maps that exhibit limited or negligible predictive capacity may be excluded from further consideration, thereby enabling the modeling process to be refined and repeated with a reduced but more effective set of inputs. Such an iterative approach not only facilitates the optimization of the modeling framework but also allows for the comparative evaluation of successive mineral potential models, providing insights into the sensitivity of model performance to the choice of predictor maps.
It is strongly recommended to use a combination of statistical analysis tools to identify effective predictor maps and to quantify their contribution in predicting potential values. This approach enables the comparison of predictor maps based on different performance metrics, thereby allowing for more accurate decision-making regarding their differentiation, elimination or retention. In the former perspective, for instance, whilst both the “proximity to fold hinges” (predictor M1) and “proximity to flanks of granitoid bodies” (predictor M2) predictor maps achieved Nd scores of 1.440, their AUC scores set them apart in that predictor M1 scored an AUC value that is ~1.24 times higher than that of predictor M1. Thus, considering only the Nd index would not have allowed us to differentiate between the two predictor maps; however, incorporating the AUC index highlighted the superiority of predictor M1 over predictor M2. As another instance, as illustrated in Figure A34, the predictor map of “proximity to areas of demagnetization” is ranked 21st according to Ma, but 9th according to MG. To achieve a more precise comparison, it is advisable to incorporate additional performance metrics, such as entropy or information gain.
8.3.2. Multi-Technique Approach
The robustness of MPM is highly contingent upon the quality of the underlying genetic model and translation of the key genetic processes into mappable targeting criteria, since the conceptual model sits at the core of the MPM process and stochastic uncertainty mostly arises from inappropriate selection of predictor maps. Whilst these issues can be minimized by way of mineral systems modeling, systemic and stochastic uncertainties can be further mitigated by adopting a multi-technique approach to MPM, which (i) ensures optimal use of the available empirical and conceptual information, (ii) compares, contrasts and cross-validates MPM results and (iii) better constrains exploration targets by integrating the results from diverse numerical models [31,114]. As evidenced in [31,50,62], a multi-technique approach to MPM not only facilitates the generation of more robust exploration targets but also provides insights unattainable through any single modeling technique, while also contributing to the development and calibration of novel tools and techniques.
Beyond the aforementioned advantages, adopting a multi-technique approach coupled with the development of diverse gold potential models (Figure 11) also supports appraisal of model performance. To achieve this, we applied the improved P-A plot procedure of [136]. Pursuant to Figure A36 and the performance statistics reported in Table 7, the RF algorithm to MPM delivered the best-performing gold potential model for the study area (overall performance, Op = 0.52) (Figure 11e). It is imperative to note that the potential model developed by the RF algorithm demonstrates different patterns compared to the ones developed by the other techniques (Figure 11). This difference, improving the reliability of prediction in this study, is an intrinsic property of the RF algorithm, which constructs an ensemble of regression trees through bootstrap sampling and derives the final prediction by averaging their outputs, thereby reducing variance and enhancing robustness.
8.3.3. Predictor Map Sensitivity
Several of the predictor maps used in this study have potential to introduce bias into the MPM given they (i) present ‘self-fulfilling prophecies’ (e.g., proximity to gold occurrences) by enhancing prospectivity in areas around the known gold deposits, (ii) have possible interdependencies with other predictors (e.g., proximity to greenstone belts or proximity to the flanks of granitoids) given spatial overlap, (iii) are ineffective in areas of cover (e.g., proximity to remotely sensed alteration systems or proximity to domains of high K/Th values) because certain signals do not penetrate the regolith, and/or (iv) do not uniformly and objectively represent the study area as a whole (e.g., proximity to fold hinges) because of inconsistent mapping scales data resolutions.
Given that such biases can have serious consequences [114], we set out to investigate model sensitivity to certain predictor maps. More specifically, we employed the best-performing RF approach to generate two additional gold potential maps for the study area, altering the number and types of input predictor maps: Alternative RF model 1, which excludes predictor maps (a) proximity to gold occurrences, (b) greenstone belts, (c) flanks of granitoids, (d) fold hinges, (e) remotely sensed alteration systems and (f) domains of high K/Th values, and alternative RF model 2, which excludes predictors (a), (b) and (c). Both alternatives recorded excellent overall performance (Op) values in the range from 0.49 (alternative RF model 1) to 0.54 (alternative RF model 2), respectively. These values are close to or, in the case of alternative RF model 2, even exceed the Op value of the original RF model of 0.52. The results are not only similar statistically but also visually with little discernible difference between the original and alternative RF-generated gold prospectivity maps (Figure 13).
8.3.4. Using Fractal Thresholding for Target Generation
The concentration-area (C-A: [151]) fractal technique, a proven and widely used method for classifying continuous spatial data [28,66,127,152,153,154], was applied here to prioritize areas of gold potential derived from the superior RF model. Two thresholds (Figure A37), marking the most significant changes in slope and reflecting higher potential scores as well as data populations more strongly associated with mineralization, were determined at potential scores of 0.830 (2nd order target areas) and 0.958 (1st order target areas). These two thresholds were then used to generate a ternary-class exploration targeting map, in which the modeling results were categorized into domains of high, moderate, and low gold potential (Figure 14). The delineated target areas are spatially correlated with the known gold occurrence locations and key predictors of the underlying genetic and target models for orogenic gold mineral systems. As illustrated in Figure 14, the prioritized high potential, 1st order target area represents an order of magnitude (i.e., >13 times) reduction of the search space, the hallmark of a well-performing, practically useful targeting technique [114].
In this study, apart from identifying high-priority targets, the results obtained from MPM served three additional critical purposes: (i) providing context and constraints for area prioritization of future gold exploration activities, (ii) identifying the most prospective ground held by competitors, thereby flagging areas of interest with regard to potential corporate investment, acquisition or joint venture deals and (iii) providing context and constraints for the monitoring of mineral tenement status and acquisition of new, vacant ground.
8.4. Targeting
8.4.1. Role of MPM as a Targeting Tool
Since its inception in the late 1960s and early 1970s [113], MPM has come a long way both from a method development perspective and as an effective targeting tool. According to [49], whilst methodological and technological improvements have been addressed comprehensively and published widely, demonstrations of practical applications of MPM have been very limited in the literature apart from the showcasing of mineral potential maps. Examples of MPM case studies that have gone a step further in that the modeling results served as input for additional analysis and/or particular attention was paid to the development of comprehensive targeting models and quality targets include [28,49,59,155,156,157,158,159].
As summarized by [31], the discovery in 2020 of the Gonneville Ni-Cu-PGE deposit in Western Australia represents the first world-class discovery that can, at least partly, be attributed to MPM, validating the effectiveness of MPM as a targeting tool and presenting proof-of-concept for this technology. Gonneville was a greenfields discovery by Chalice Mining Limited [160], made on the back of a Ni-Cu-PGE prospectivity map produced by Geoscience Australia [161] that also unlocked an entire new search space for Ni-Cu-PGE deposits along the >1000 km-long, underexplored western margin of the Archean Yilgarn Craton.
Regardless of these abilities, MPM generated prospectivity maps do not guarantee discovery success and, thus, should not be treated as ‘treasure maps’. Rather, they should serve as starting points for ‘treasure hunts’. As such, MPM is best treated as just another tool in the ‘exploration toolbox’, more specifically, a decision-support tool for delineating, ranking, and prioritizing exploration targets based on the underlying modeled prospectivity. Also important to understand is that prospectivity maps present a snapshot in time, reflecting the conceptual understanding of the targeted mineral deposit type as well as the availability and quality of the supporting data at the time of modeling. New information and/or new or better-quality data will invariably change the results, typically for the better [28].
8.4.2. Assessment of MPM Target Areas
The RF model, the best-performing of the MPM approaches employed in this study, correctly identified the locations of all the large (>1 Moz) gold deposits and deposit clusters in the study area like Paddington, Gwalia, Mt Morgans, Tarmoola/King of the Hills, Thunderbox, Apollo Hill, Aphrodite, Ulysses and Menzies (Figure 13 and Figure 14). It also correctly identified most of the smaller gold occurrences, such that the ratio of deposits located within anomalies to the area covered by anomalies [50,140,162] is 83.93% to 7.69% in the high gold potential domain (red polygons in Figure 14), demonstrating the excellent performance of the RF potential model.
Given these results, the modeled areas of gold potential that have no known gold occurrences but similar mappable ingredients as areas that are gold mineralized clearly merit further investigation, particularly where underexplored. One way to assess whether a prospective area may be underexplored or adequately tested is by examining the available, previously collected exploration data. The most useful data for an initial assessment are drilling data given that drilling provides a definitive test of the subsurface. This is particularly true for reverse circulation and diamond core holes. Areas of great(er) drilling density typically denote more intensive and detailed exploration activity that would have led the previous explorers to develop a reasonable understanding of the subsurface geology of the tested area. In places where exploration was intense and drilling dense and relatively deep (>100 to 200 m, or more) it is unlikely that a gold deposit would have been missed if present.
Open-file drilling data for the study area were sourced largely from the Geological Survey of Western Australia (GSWA), augmented by additional confidential drilling data provided by St Barbara Limited (SBM) (Table 1). The GSWA database comprises of >231,000 records whilst the SBM dataset covers >77,000 records (Table 8). Some overlap exists between these two databases. In addition, the GSWA records are open-file only, which means that any as-of-yet confidential drill holes are missing. Despite these shortcomings, the GSWA and SBM drill hole databases provide a reasonably complete picture of previous drilling completed within the study area. Whilst, at first glance, the greenstone belts in the study area appear to be well tested (Figure 15b), this picture changes when drill collars other than those relating to reverse circulation and diamond core drilling are removed. When only plotting the collars of the deeper reverse circulation and diamond core drill holes it becomes evident that large tracts of greenstone are untested at depth (Figure 15c).
Our review of the previous drilling (Figure 15) identified six broad areas of high gold potential that have relatively low drill hole densities, in particular when only considering reverse circulation and diamond core drill holes with hole lengths of 100 m, or more. These areas feature many of the targeting parameters outlined in Table 4, and, therefore, present attractive targets.
A manual analysis [59,163] of these areas identified eight more discrete targets within the broader prioritized MPM target areas (Table 9, Figure 16). Apart from having received less drilling compared to neighboring areas, all but one of the manual targets are located along NNW-SSE-striking, ‘800 m-scale’ gravity ridges. This ridge filter maps the thicker portions of greenstone belt that often correlate well with significant gold deposits. As illustrated in Figure 5, many of the large gold deposits occur on or adjacent to 800 m-scale ridges, in particular those that trend NNW-SSE.
The top-two ranked manual targets are particularly exciting:
- Target #1: Covers a cluster of poorly tested intrusions of the McAuliffe Well Syenite that intruded mafic volcanic-dominant greenstone sequences, abut the first-order order Keith-Kilkenny fault system and are cut by E-W- to NW-SW-striking dolerite dykes. Shallow (maximum hole depth of 45 m) rotary air blast drilling by Saracen Gold Mines Proprietary Limited returned intercepts up to 1.00 m @ 12.28 g/t Au from 9.00 m (hole YER143), 1.00 m @ 6.94 g/t Au from 10 m (hole YER158) and 2.00 m @ 2.20 g/t Au (hole YER159), defining surficial, saprolite-hosted gold mineralization over an area of 400 by 300 m at the Dingo prospect. The adjacent Bull Terrier prospect returned up to 16.00 m # 2.59 g/t Au from 105.00 m (hole YBD-2) and 16.00 m @ 1.52 g/t Au from 60.00 m, including 1.00 m @ 211.70 g/t Au from 65.00 m (hole YRC-63) [164,165]. No deeper or broader, more systematic exploration drilling appears to have been completed across the McAuliffe Well Syenite intrusive cluster. Moreover, the cluster is held by various exploration companies. The disjointed ownership, which appears to have prevailed over decades, likely played a role in preventing a more holistic exploration approach.
- Target #2: Covers prospective mafic and felsic volcanic-dominant greenstone sequences, comprising chemically reactive banded iron formations (BIF) and syenite intrusions, along strike from the Mt Morgans gold production center. Previous drilling returned drilling intersections of up to 6.70 m @ 13.15 g/t Au from 95.00 m (hole MRC036), 5.90 m @ 7.24 g/t from 79.00 m (hole MRC003) and 2.90 m @ 5.41 m from 112 m (hole MRC028) from and defined a small (>150 koz Au @ 1.40 g/t Au) resource at the Korong-Waihi prospect. The latter remains open along strike and at depth with no prior drilling below a vertical depth of 150 m [166,167]. Similar to target #1, ownership of target #2 is disjointed, currently preventing a broader, more holistic approach to exploration.
9. Summary and Conclusions
This study of Archean orogenic gold systems in the central-eastern Yilgarn Craton illustrates that a geophysically-informed lithostructural framework, when combined with a mineral systems-based targeting model and a suite of complementary prospectivity algorithms, can provide a powerful tool for gold exploration.
Enhancement filtering of gravity, magnetic, radiometric and remote sensing data revealed cryptic structures and alteration systems that correlate with known gold deposits but extend into underexplored ground.
The solid geology map generated in this study underpinned a multi-technique mineral potential modelling (MPM) workflow comprising five complementary prospectivity techniques spanning knowledge-driven, data-driven and continuous methods. The best performing random forest (RF) correctly predicted the majority of known gold occurrences while generating a greatly reduced, prioritized search space for new gold targets.
The key strengths of our approach are its reproducibility, explicit incorporation of often cryptic deep-seated architecture and cross-structure networks, and ability to integrate and test multiple weighting schemes to minimize bias. The results confirm that integrating a detailed geophysical interpretation with mineral systems-based prospectivity modelling is an effective way to identify concealed gold corridors and reduce exploration risk. The methodology is readily transferable to other commodities and geological provinces worldwide.
Supplementary Materials
The following supporting information can be downloaded at the website of this paper posted on Preprints.org, Figures S1-S2: Prediction-area plots for the predictor maps used in this study; Figures S3-S4: Receiver operating characteristic curves for the predictor maps used in this study; Figures S5-32: Predictor maps used in this study, Figure S33: Improved prediction-area plots for the predictor maps used in this study; Figure S34: Measure of predictor variable importance derived by RF technique; Figure S35: Evolution of mean squared error curve; Figure S36: Improved prediction-area plot for the mineral potential models generated in this study; Figure S37: Concentration-area fractal plot for the superior RF mineral potential model; Table S1: Others-to-worst pairwise comparison vector based on the Op index; Table S2: Best-to-others pairwise comparison vector based on the Op index; Table S3: Optimal weights (W*) derived from the BWM approach.
Author Contributions
Conceptualization, O.P.K., D.McD., and R.M.; methodology, O.P.K., B.R., A.J.B, D.P.C., B.A.K. and D.McD.; software, B.R., A.J.B, D.P.C. and B.A.K.; validation, O.P.K., B.R., A.J.B, D.P.C. and B.A.K.; formal analysis, O.P.K., B.R., A.J.B, D.P.C. and B.A.K.; investigation, O.P.K., B.R., A.J.B, D.P.C. and B.A.K.; resources, O.P.K., B.R., A.J.B, D.P.C. and B.A.K.; data curation, O.P.K., B.R., A.J.B, D.P.C. and B.A.K. writing—original draft preparation, O.P.K., B.R., A.J.B, D.P.C. and B.A.K.; writing—review and editing, O.P.K., B.R., A.J.B, D.P.C., D.McD. and R.M.; visualization, O.P.K., B.R., A.J.B, D.P.C. and B.A.K.; project administration, O.P.K. and D.McD.; funding acquisition, O.P.K. All authors have read and agreed to the published version of the manuscript.
Funding
This research was funded by St Barbara Limited (https://stbarbara.com.au/). D.McD. and R.M. are employees of St Barbara Limited.
Data Availability Statement
The sources of the publicly available datasets analyzed in this study are specified in Table 1. Confidential company data cannot be made publicly available.
Acknowledgments
Genesis Minerals Limited (https://genesisminerals.com.au/) is thanked for permission to publish the results of this work. In particular, we would like to thank Mr Andrew Chirnside, Group Manager Geology & Exploration at Genesis Minerals Limited, for his time and assistance.
Conflicts of Interest
The authors declare no conflicts of interest. The funders had a role in the design of the study (i.e., study conceptualization and definition of the study area) but not in the collection, analyses, or interpretation of data; in the writing of the manuscript; or in the decision to publish the results.
Abbreviations
The following abbreviations are used in this manuscript:
| Au | Gold |
| DEMIRS | Department of Energy, Mines, Industry Regulation and Safety |
| EGST | Eastern Goldfields Superterrane |
| GSWA | Geological Survey of Western Australia |
| koz | Thousand ounces |
| MA | Time ago in millions of years |
| Moz | Million ounces |
| MPM | Mineral potential modeling |
| Mtpa | Millions of tonnes per annum |
| m.y. | Time span in millions of years |
| SBM | St Barbara Limited |
References
- Geological Survey of Western Australia. Gold Investment Opportunities; Government of Western Australia, Department of Energy, Mines, Industry Regulation and Safety: East Perth, Australia, 2023; 2p.
- Phillips, G.N.; Vearncombe, J.R.; Eshuys, E. Gold production and the importance of exploration success: Yilgarn Craton, Western Australia. Ore Geology Reviews 2019, 105, 137–150.
- Williams, P.R.; Nisbet, B.W.; Etheridge, M.A. Shear zones, gold mineralization and structural history in the Leonora district, Eastern Goldfields Province, Western Australia. Australian Journal of Earth Sciences 1989, 36(3), 383–403.
- Duuring, P.; Hagemann, S.G.; Cassidy, K.F.; Johnson, C.A. Hydrothermal alteration, ore fluid characteristics, and gold depositional processes along a trondhjemite-komatiite contact at Tarmoola, Western Australia. Economic Geology 2004, 99(3), 423–451.
- Morey, A.A.; Weinberg, R.F.; Bierlein, F.P. The structural controls of gold mineralisation within the Bardoc Tectonic Zone, Eastern Goldfields Province, Western Australia: Implications for gold endowment in shear systems. Mineralium Deposita 2007, 42(6), 583–600.
- Weinberg, R.F.; Van Der Borgh, P. Extension and gold mineralization in the Archean Kalgoorlie terrane, Yilgarn craton. Precambrian Research 2008, 161(1–2), 77–88.
- Blewett, R.S.; Czarnota, K.; Henson, P.A. Structural-event framework for the eastern Yilgarn Craton, Western Australia, and its implications for orogenic gold. Precambrian Research 2010, 183(2), 203–229.
- Czarnota, K.; Champion, D.C.; Goscombe, B.; Blewett, R.S.; Cassidy, K.F.; Henson, P.A.; Groenewald, P.B. Geodynamics of the eastern Yilgarn Craton. Precambrian Research 2010, 183(2), 175–202.
- Jones, S.A. Contrasting structural styles of gold deposits in the Leonora Domain: Evidence for early gold deposition, Eastern Goldfields, Western Australia. Australian Journal of Earth Sciences 2014, 61(7), 881–917.
- Jones, S.A. 2730-2670 Ma rifting triggers sagduction prior to the onset of orogenesis at ca 2650 Ma: Implications for gold mineralisation, Eastern Goldfields, Western Australia. Australian Journal of Earth Sciences 2024, 71(5), 647–672.
- Goscombe, B.; Foster, D.A.; Blewett, R.; Czarnota, K.; Wade, B.; Groenewald, B.; Gray, D. Neoarchean metamorphic evolution of the Yilgarn craton: A record of subduction, accretion, extension and lithospheric delamination. Precambrian Research 2019, 335, 105441.
- Witt, W.K.; Cassidy, K.F.; Lu, Y.J.; Hagemann, S.G. The tectonic setting and evolution of the 2.7 Ga Kalgoorlie–Kurnalpi Rift, a world-class Archean gold province. Mineralium Deposita 2020, 55(4), 601–631.
- Jones, S.A.; Cassidy, K.F.; Davis, B.K. Unravelling the D1 event: Evidence for early granite-up, greenstone-down tectonics in the Eastern Goldfields, Western Australia. Australian Journal of Earth Sciences 2021, 68(1), 1–35.
- Groves, D.I.; Goldfarb, R.J.; Knox-Robinson, C.M.; Ojala, J.; Gardoll, S.; Yun, G.Y.; Holyland, P. Late-kinematic timing of orogenic gold deposits and significance for computer-based exploration techniques with emphasis on the Yilgarn Block, Western Australia. Ore Geology Reviews 2000, 17(1–2), 1–38.
- Czarnota, K.; Blewett, R.S.; Goscombe, B. Predictive mineral discovery in the eastern Yilgarn Craton, Western Australia: an example of district scale targeting of an orogenic gold mineral system. Precambrian Research 2010, 183(2), 356–377.
- Witt, W.K.; Ford, A.; Hanrahan, B.; Mamuse, A. Regional-scale targeting for gold in the Yilgarn Craton: Part 1 of the Yilgarn gold exploration targeting atlas; Report 125. Geological Survey of Western Australia: East Perth, Australia, 2013; 130p.
- Witt, W.K.; Ford, A.; Hanrahan, B. District-scale targeting for gold in the Yilgarn Craton: Part 2 of the Yilgarn gold exploration targeting atlas; Report 132. Geological Survey of Western Australia: East Perth, Australia, 2015; 276p.
- Witt, W.K. Deposit-scale targeting for gold in the Yilgarn Craton: Part 3 of the Yilgarn gold exploration targeting atlas; Report 158. Geological Survey of Western Australia: East Perth, Australia, 2016; 182p.
- Knox-Robinson, C.M. Vectorial fuzzy logic: A novel technique for enhanced mineral prospectivity mapping, with reference to the orogenic gold mineralisation potential of the Kalgoorlie Terrane, Western Australia. Australian Journal of Earth Sciences 2000, 47(5), 929–941.
- Wyborn, L.A.I.; Heinrich, C.A.; Jaques, A.L. Australian Proterozoic mineral systems: Essential ingredients and mappable criteria. In Proceedings of the 1994 AusIMM Annual Conference: Australian Mining Looks North—The Challenges and Choices, Darwin, NT, Australia, 5–9 August 1994; pp. 109–115.
- McCuaig, T.C.; Beresford, S.; Hronsky, J. Translating the mineral systems approach into an effective exploration targeting system. Ore Geology Reviews 2010, 38, 128–138.
- McCuaig, T.C.; Hronsky, J.M.A. The mineral system concept—The key to exploration targeting. Society of Economic Geologists Special Publication 2014, 18, 153–175.
- An, P.; Moon, W.M; Rencz, A. Application of fuzzy set theory to integrated mineral exploration. Canadian Journal of Exploration Geophysics 1991, 27(1), 1–11.
- Bonham-Carter, G.F. Geographic Information Systems for Geoscientists: Modelling with GIS; Pergamon: Oxford, UK, 1994; 416p.
- St Barbara Limited. St Barbara agrees to sale of Leonora assets to Genesis Minerals for total consideration of $600 million. In Australian Securities Exchange (ASX) Announcement dated 17 April 2023; St Barbara Limited: West Perth, Australia, 2023; 5p.
- Knox-Robinson, C.M.; Wyborn, L.A.I. Towards a holistic exploration strategy: Using geographic information systems as a tool to enhance exploration. Australian Journal of Earth Sciences 1997, 44, 453–463.
- Kreuzer, O.P.; Etheridge, M.A.; Guj, P.; McMahon, M.E.; Holden, D.J. Linking mineral deposit models to quantitative risk analysis and decision-making in exploration. Economic Geology 2008, 103, 829–850.
- Kreuzer, O.P.; Roshanravan, B. Transforming LCT pegmatite targeting models into AI-powered predictive maps of lithium potential for Western Australia and Ontario: Approach, results and implications. Minerals 2025, 15(4), 397.
- Buckingham, A.J; Core, D.P.; Hart, C.J.R.; Jenkins, S. TREK project area gravity compilation, enhancement filtering and structure detection; Geoscience BC Report 2017-14; Geoscience BC, Vancouver, Canada, 2017; 34p.
- Kreuzer, O.P.; Buckingham, A.; Mortimer, J.; Walker, G.; Wilde, A.; Appiah, K. An integrated approach to the search for gold in a mature, data-rich brownfields environment: A case study from Sigma-Lamaque, Quebec. Ore Geology Reviews 2019, 111, 102977.
- Roshanravan, B.; Kreuzer, O.P.; Buckingham, A.; Keykhay-Hosseinpoor, M.; Keys, E. Mineral potential modelling of orogenic gold systems in the Granites-Tanami Orogen, Northern Territory, Australia: A multi-technique approach. Ore Geology Reviews 2023, 152, 105224.
- Goscombe, B.; Blewett, R.S.; Czarnota, K.; Groenewald, B.; Maas, R. Metamorphic evolution and integrated terrane analysis of the Eastern Yilgarn Craton: Rationale, methods, outcomes and interpretation; Record 2009(23); Geoscience Australia: Canberra, Australia, 2009, 270p.
- Mole, D.R.; Fiorentini, M.L.; Cassidy, K.F.; Kirkland, C.L.; Thébaud, N.; McCuaig, T.C.; Doublier, M.P.; Duuring, P.; Romano, S.S.; Maas, R.; Belousova, E.A.; Barnes, S.J; Miller, J. Crustal evolution, intra-cratonic architecture and the metallogeny of an Archaean craton. In Ore deposits in an evolving Earth; Jenkin, G.R.T.; Lusty, P.A.J.; McDonald, I.; Smith, M.P.; Boyce, A.J.; Wilkinson, J.J., Eds.; Special Publications, Geological Society, London, 2015; Volume 393, pp. 23–80.
- Dentith, M.; Mudge, S.T. Geophysics for the mineral Exploration geoscientist. Cambridge University Press: Cambridge, United Kingdom, 454p.
- Bierlein, F.; Murphy, F.C.; Weinberg, R.F.; Lees, T. Distribution of orogenic gold deposits in relation to fault zones and gravity gradients: Targeting tools applied to the Eastern Goldfields, Yilgarn Craton, Western Australia. Mineralium Deposita 2006, 41(2), 107–126.
- Cordell, L. Gravimetric expression of graben faulting in Santa Fe country and the Espanola Basin, New Mexico. In Guidebook to Santa Fe Country: Thirtieth Field Conference, October 4-6, 1979, Ingersoll, R.V., Ed.; New Mexico Geological Society: Socorro, United States, 1979; pp. 59–64.
- Grauch, V.J.S.; Cordell, L. Limitations of determining density or magnetic boundaries from the horizontal gradient of gravity or pseudogravity data. Geophysics 1987, 52, 118–121.
- Kovesi, P.D. Image features from phase congruency. Videre: Journal of Computer Vision Research 1999, 1(3), 1–26.
- Jacobsen, B.H. A case for upward continuation as a standard separation filter for potential-field maps. Geophysics 1987, 52(8), 1138–1148.
- Cazals F.; Pouget M. Topology driven algorithms for ridge extraction on meshes; Raport Recherche 5526. Institut National de Recherche en Sciences et Technologies du Numérique (INRIA), Sophia Antipolis, France, 2005; 29p.
- de Quadros, T.F.; Koppe, J.C.; Strieder, A.J.; Costa, J.F.C. Gamma-ray data processing and integration for lode-Au deposits exploration. Natural Resources Research 2003, 12(1), 57–65.
- Herbert, S.; Woldai, T.; Carranza, E.J.M.; van Ruitenbeek, F.J. Predictive mapping of prospectivity for orogenic gold in Uganda. Journal of African Earth Sciences 2014, 99, 666–693.
- Shebl, A.; Abdellatif; M., Badawi, M.; Dawoud, M.; Fahil, A.S.; Csámer, Á. Towards better delineation of hydrothermal alterations via multi-sensor remote sensing and airborne geophysical data. Scientific Reports 2023, 13(1), 7406.
- Japan Aerospace Exploration Agency. ALOS World 3D 30 meter DEM, version 3.2, Jan 2021. Distributed by OpenTopography. Available online: https://doi.org/10.5069/G94M92HB (accessed on 18 November 2022).
- Mielke, C.; Boesche, N.K.; Rogass, C.; Kaufmann, H.; Gauert, C.; de Wit, M. Spaceborne mine waste mineralogy monitoring in South Africa, applications for modern push-broom missions: Hyperion/OLI and EnMAP/Sentinel-2. Remote Sensing 2014, 6, 6790–6815.
- ISO/CIE. Colorimetry—Part 4: CIE 1976 L*a*b* colour space. International Standard, ISO/CIE 11664-4:2019. Available online: https://cdn.standards.iteh.ai/samples/74166/8056d4c35bb24b54a6a7761c51f2575f/ISO-CIE-11664-4-2019.pdf (accessed on 01 October 2025).
- Siddorn, J.P; Williams, P.R; Isles, D.J., Rankin, L.R. Integrated geologic-geophysical interpretation of district-scale structural frameworks: Systematic approaches for targeting mineralizing systems. In Applied structural geology of ore-forming hydrothermal systems; Reviews in Economic Geology 21; Rowland, J.V., Rhys, D.A., Eds.; Society of Economic Geologists, Littleton, United States, 2020; pp. 271–313.
- Hagemann, S.G.; Lisitsin, V.A.; Huston, D.L. Mineral system analysis: Quo vadis. Ore Geology Reviews 2016, 76, 504–522.
- Kreuzer, O.P.; Miller, A.V.; Peters, K.J.; Payne, C.; Wildman, C.; Partington, G.A.; Puccioni, E.; McMahon, M.E.; Etheridge, M.A. Comparing prospectivity modelling results and past exploration data: A case study of porphyry Cu–Au mineral systems in the Macquarie Arc, Lachlan Fold Belt, New South Wales. Ore Geology Reviews 2015, 71, 516–544.
- Roshanravan, B.; Kreuzer, O.P.; Bruce, M.; Davis, J.; Briggs, M. Modelling gold potential in the Granites-Tanami Orogen, NT, Australia: A comparative study using continuous and data-driven techniques. Ore Geology Reviews 2020, 125, 103661.
- Kreuzer, O.P.; Yousefi, M.; Nykänen, V. Introduction to the special issue on spatial modelling and analysis of ore-forming processes in mineral exploration targeting. Ore Geology Reviews 2020, 119, 103391.
- Fry, N. Random point distributions and strain measurement in rocks. Tectonophysics 1979, 60, 1–2, 89–105.
- Vearncombe, J.R.; Vearncombe, S. The spatial distribution of mineralization; applications of Fry analysis. Economic Geology 1999, 94(4), 475–486.
- Kreuzer, O.P.; Blenkinsop, T.G.; Morrison, R.J.; Peters, S.G. Ore controls in the Charters Towers goldfield, NE Australia: Constraints from geological, geophysical and numerical analyses. Ore Geology Reviews 2007, 32(1–2), 37–80.
- Carranza, E.J.M. Controls on mineral deposit occurrence inferred from analysis of their spatial pattern and spatial association with geological features. Ore Geology Reviews 2009, 35, 383–400.
- Agterberg, F.P. Computer programs for mineral exploration. Science 1989, 245, 76–81.
- Bonham-Carter, G.F.; Agterberg, F.P.; Wright, D.F. Integration of geological datasets for gold exploration in Nova Scotia. Digital Geological and Geographical Information Systems 1989, 10, 15–23.
- Carranza, E.J.M. Geochemical Anomaly and Mineral Prospectivity Mapping in GIS—Handbook of Exploration and Environmental Geochemistry 11; Elsevier: Amsterdam, The Netherlands, 2008; 351p.
- Joly, A.; Porwal, A.K.; McCuaig, T.C. Exploration targeting for orogenic gold deposits in the Granites-Tanami Orogen: Mineral system analysis, targeting model and prospectivity analysis. Ore Geology Reviews 2012, 48, 349–383.
- Porwal, A.K.; Carranza, E.J.M. Introduction to the special issue: GIS-based mineral potential modelling and geological data analyses for mineral exploration. Ore Geology Reviews 2015, 71, 477–483.
- Keykhay-Hosseinpoor, M.; Porwal, A.; Rajendran, K.; Panja, S. Mineral system modeling of Lithium-Cesium- Tantalum (LCT)-type pegmatites: Regional-scale exploration targeting and uncertainty analysis in the Sanandaj-Sirjan zone, Western Iran. Journal of Geochemical Exploration 2025, 107885.
- Roshanravan, B.; Kreuzer, O.P.; Buckingham, A. BWM-MARCOS: A new hybrid MCDM approach for mineral potential modelling. Journal of Geochemical Exploration 2025, 269, 107639.
- Yousefi, M.; Nykänen, V. Data-driven logistic-based weighting of geochemical and geological evidence layers in mineral prospectivity mapping. Journal of Geochemical Exploration 2016, 164, 94–106.
- Yousefi, M.; Carranza, E.J.M. Fuzzification of continuous-value spatial evidence for mineral prospectivity mapping. Computers & Geosciences 2015, 74, 97–109.
- Yousefi, M.; Carranza, E.J.M. Geometric average of spatial evidence data layers: a GIS-based multi-criteria decision-making approach to mineral prospectivity mapping. Computers & Geosciences 2015, 83, 72–79.
- Aryafar, A.; Roshanravan, B. Improved index overlay mineral potential modeling in brown- and greenfields exploration using geochemical, geological and remote sensing data. Earth Science Informatics 2020, 1–17.
- Breiman, L. Random forests. Machine Learning 2001, 45, 5–32.
- Hwang, C-L.; Yoon, K. Methods for multiple attribute decision making. In Multiple Attribute Decision Making; Hwang, C-L., Yoon, K., Eds.; Springer, Berlin, Heidelberg, Germany, 1981, 58–191.
- Afshari, A.; Mojahed, M.; Yusuff, R.M. Simple additive weighting approach to personnel selection problem. International Journal of Innovation, Management and Technology 2010, 1, 511.
- Rezaei, J. Best-worst multi-criteria decision-making method. Omega 2015, 53, 49–57.
- Huston, D.L.; Blewett, R.S.; Champion, D.C. Australia through time: A summary of its tectonic and metallogenic evolution. Episodes 2012, 35, 23–43.
- Cassidy, K.F.; Champion, D.C.; Krapež, B.; Barley, M.E.; Brown, S.J.A.; Blewett, R.S.; Groenewald, P.; Tyler, I.M. A revised geological framework for the Yilgarn Craton, Western Australia; Record 2006(8); Geological Survey of Western Australia: East Perth, Australia, 2006; 15p.
- Wyche, S.; Fiorentini, M.L.; Miller, J.L.; McCuaig, T.C. Geology and controls on mineralisation in the Eastern Goldfields region, Yilgarn Craton, Western Australia. Episodes Journal of International Geoscience 2012, 35(1), 273–282.
- Masurel, Q.; Thébaud, N. Deformation in the Agnew-Wiluna greenstone belt and host Kalgoorlie Terrane during the c. 2675–2630 Ma Kalgoorlie Orogeny: ∼45 Ma of horizontal shortening in a Neoarchean back-arc region. Precambrian Research 2024, 414, 107586.
- McCuaig, T.C.; Miller, J.M.; Beresford, S. Controls on giant mineral systems in the Yilgarn Craton—a field guide; Record 2010(26); Geological Survey of Western Australia: East Perth, Australia, 2010; 159p.
- Jones, S.A. 2730-2670 Ma rifting triggers sagduction prior to the onset of orogenesis at ca 2650 Ma: Implications for gold mineralisation, Eastern Goldfields, Western Australia. Australian Journal of Earth Sciences 2024, 71(5), 647–672.
- Krapež, B.; Barley, M.E.; Brown, S.J. Late Archaean synorogenic basins of the Eastern Goldfields Superterrane, Yilgarn Craton, Western Australia: Part I. Kalgoorlie and Gindalbie Terranes. Precambrian Research 2008, 161(1–2), 135–153.
- Wyche, S. Geological setting of mineral deposits in the eastern Yilgarn Craton—A field guide; Record 2014(10); Geological Survey of Western Australia: East Perth, Australia, 2014; 56p.
- Czarnota, K.; Blewett, R.S.; Goscombe, B. Structural and metamorphic controls on gold through time and space in the central Eastern Goldfields Superterrane—A field guide, Record 2008(9); Geological Survey of Western Australia: East Perth, Australia, 2008; 66p.
- Weinberg, R.F.; Moresi, L.; Van der Borgh, P. Timing of deformation in the Norseman-Wiluna belt, Yilgarn craton, Western Australia. Precambrian Research 2003, 120(3–4), 219–239.
- Brown, M.; Johnson, T.; Gardiner, N.J. Plate tectonics and the Archean Earth. Annual Review of Earth and Planetary Sciences 2020, 48(1), 291–320.
- Windley, B.F.; Kusky, T.; Polat, A. Onset of plate tectonics by the Eoarchean. Precambrian Research 2021, 352, 105980.
- Kuang, J.; Morra, G.; Yuen, D.A.; Kusky, T.; Jiang, S.; Yao, H.; Qi, S. Metamorphic constraints on Archean tectonics. Precambrian Research 2023, 397, 107–195.
- Blewett, R.S; Czarnota, K. Tectonostratigraphic architecture and uplift history of the eastern Yilgarn Craton; Record 2007(15); Geological Survey of Western Australia: East Perth, Australia, 2007; 114p.
- Krapež, B.; Barley, M.E. Late Archaean synorogenic basins of the Eastern Goldfields Superterrane, Yilgarn Craton, Western Australia: Part III. Signatures of tectonic escape in an arc-continent collision zone. Precambrian Research 2008, 161(1–2), 183–199.
- Masurel, Q.; Thébaud, N.; Saptoka, J.; De Paoli, M.C.; Drummond, M.; Smithies, R.H. Stratigraphy of the Agnew-Wiluna greenstone belt: Review, synopsis, and implications for the late Mesoarchean to Neoarchean geological evolution of the Yilgarn Craton. Australian Journal of Earth Sciences 2022, 69, 1149–1176.
- Yilgarn Craton—Geology, structure and mineralisation (PorterGeo). Available online: https://portergeo.com.au/database/mineinfo.asp?mineid=mn1626 (accessed on 12 July 2025).
- KCGM operations (Northern Star Resources Limited). Available online: https://www.nsrltd.com/our-assets/kcgm-operations/ (accessed on 28 July 2025).
- Sons of Gwalia, Gwalia, Tower Hill (PorterGeo). Available online: https://portergeo.com.au/database/mineinfo.asp?mineid=mn761 (accessed on 02 August 2025).
- Vielreicher, R.M.; Groves, D.I.; Ridley, J.R.; McNaughton, N.J. A replacement origin for the BIF-hosted gold deposit at Mt. Morgans, Yilgarn Block, WA. Ore Geology Reviews 1994, 9(4), 325–347.
- Bennett, M.A. Thunderbox gold and Waterloo nickel deposits. In Gold and nickel deposits in the Norseman-Wiluna greenstone belt, Yilgarn Craton, Western Australia—A field guide, Record 2014(16); Neumayr, P., Harris, M., Beresford, S.W., Eds.; Geological Survey of Western Australia: East Perth, Australia, 2014; 166p.
- Castle, M. Independent geologist’s report on the Apollo Hill gold project in Western Australia. In Prospectus Saturn Metals Limited ACN 619 488 498, Saturn Metals Limited: West Perth, Australia, 2018; pp. 53–132.
- Standing, J.; Outhwaite, M.; Fay, C.; Martin, D.; McCormack, B. Aphrodite geological campaign 2018. Confidential Report to Spitfire Materials Limited, Model Earth Proprietary Limited, March 2018, 59p.
- Harris, M.; Fleming, S.; Dudfield, L.; Savage, B. Melita project—Ulysses gold deposit, Western Australia. In Regolith expression of Australian ore systems—A compilation of geochemical case histories and conceptual models; Butt, C.R.M., Cornelius, M., Scott, K.M., Robertson, I.D.M., Eds.; Cooperative Research Centre for Landscape Environments and Mineral Exploration (CRC LEME), 3p. Available online: https://crcleme.org.au/RegExpOre/Ulysses.pdf (accessed on 02 August 2025).
- Genesis Minerals Limited. Ulysses mineral resource soars 137% to 760,000 ounces. In Australian Securities Exchange (ASX) Announcement dated 09 October 2018; Genesis Minerals Limited: Perth, Australia, 2018; 17p.
- Witt, W.K. Gold mineralization in the Menzies-Kambalda region, Eastern Goldfields, Western Australia; Report 39; Geological Survey of Western Australia: East Perth, Australia, 1993; 165p.
- Martinick McNulty Pty Limited. Notice of intent to mine the Wonder orebody. In Department of Energy, Mines, Industry Regulation and Safety (DEMIRS), Government of Western Australia, GeoDocs, Document MP3808, 09 October 2001; Martinick McNulty Pty Limited: West Perth, Australia; 79p. Available online: https://geodocs.dmirs.wa.gov.au/Web/documentlist/9/EARS_regi_id/17195 (accessed on 02 August 2025).
- Allchurch, J.D. Celtic Project, Annual report covering 01/04/2016 to 31/03/2017, combined reporting number C28/2012 for P37/8306, P37/8382, P37/8383, P37/8384, P37/8385, P37/8386, M37/350, M37/488, M37/513, M37/514 and M37/638. In Department of Energy, Mines, Industry Regulation and Safety (DEMIRS), Government of Western Australia, WAMEX Mineral Reporting System, Report Number A114129, 21 September 2017; S R Mining Pty Limited and Bligh Resources Limited: Fremantle, WA, Australia; 17p. Available online: https://wamex.dmp.wa.gov.au/Wamex/Search/ReportDetails?ANumber=114129 (accessed on 02 August 2025).
- Schmitt, L.A. The dolerite-hosted Zoroastrian gold deposit, Yilgarn Craton, Western Australia: Lithogeochemistry, alteration zonation patterns and source of sulfur. MSc Thesis, Oulu Mining School, University of Oulu, Oulu, Finland, 2017, 91p.
- Dunbar, P.; Fairfield, P. Independent technical assessment & valuation report, Bardoc Gold Limited Scheme Booklet. In Australian Securities Exchange (ASX) Announcement dated 23 February 2022; Bardoc Gold Limited: North Fremantle, WA, Australia, 2022; 328p.
- Kretz, R. Symbols for rock-forming minerals. American Mineralogist 1983, 68, 277–279.
- List of mineral abbreviations. Siivola, J, and Schmid, R. A systematic nomenclature for metamorphic rocks: 12. List of mineral abbreviations. Recommendations by the IUGS Subcommission on the Systematics of Metamorphic Rocks. Recommendations, web version of 01.02.2007. Available online: https://www2.bgs.ac.uk/scmr/products.html (accessed on 02 August 2025).
- Groves, D.I. The crustal continuum model for late-Archaean lode-gold deposits of the Yilgarn Block, Western Australia. Mineralium Deposita 1993, 28(6), 366–374.
- Groves, D.I.; Ridley, J.R.; Bloem, E.M.J.; Gebre-Mariam, M.; Hagemann, S.G.; Hronsky, J.M.A.; Knight, J.T.; McNaughton, N.J.; Ojala, J.; Vielreicher, R.M.; McCuaig, T.C. Lode-gold deposits of the Yilgarn block: Products of Late Archaean crustal-scale overpressured hydrothermal systems. In Early Cambrian processes, Special Publications, 95(1); Coward, M.P., Ries, A.C., Eds.; Geological Society of London: London, United Kingdom, 1995; pp. 155–172.
- Tripp, G.I.; Tosdal, R.M.; Blenkinsop, T.; Rogers, J.R.; Halley, S. Neoarchean Eastern Goldfields of Western Australia. In Geology of the World’s Major Gold Deposits and Provinces, Sillitoe, R.H., Goldfarb, R.J., Simmons, S.F., Eds.; Society of Economic Geologists: Littleton, Colorado, USA; 2020; pp. 709–734.
- Gold Road Resources Limited. Company presentation. In Australian Securities Exchange (ASX) Announcement dated 23 May 2013; Gold Road Resources Limited: West Perth, Australia, 2013; 26p.
- Pisarevsky, S.A.; De Waele, B.; Jones, S.; Söderlund, U.; Ernst, R.E. Paleomagnetism and U-Pb age of the 2.4 Ga Erayinia mafic dykes in the south-western Yilgarn, Western Australia: Paleogeographic and geodynamic implications. Precambrian Research 2015, 259, 222–231.
- Wingate, M.T.D. Mafic dyke swarms and large igneous provinces in Western Australia get a digital makeover. In GSWA 2017 extended abstracts—Promoting the prospectivity of Western Australia, Record 2017/2; Geological Survey of Western Australia: East Perth, Australia, 2017; pp. 4–8.
- McCuaig, T.C.; Kreuzer, O.P.; Brown, W.M. Fooling ourselves—Dealing with model uncertainty in a mineral systems approach to exploration. In Proceedings of the 9th biennial SGA meeting “Mineral exploration and research: Digging deeper”, Dublin, Ireland, 20–23 August 2007, pp. 1435–1438.
- Hronsky, J.M.A.; Groves, D.I. Science of targeting: Definition, strategies, targeting and performance measurement. Australian Journal of Earth Sciences 2008, 55, 3–12.
- Lord, D.; Etheridge, M.A.; Willson, M.; Hall, G.; Uttley, P.J. Measuring exploration success: An alternative to the discovery-cost-per-ounce method of quantifying exploration success. Society of Economic Geologists (SEG) Newsletter 2001, 45, 1 and 10–16.
- Penney, S.R.; Allen, R.M.; Harrisson, S.; Lees, T.C.; Murphy, F.C.; Norman, A.R.; Roberts, P.A. A global-scale exploration risk analysis technique to determine the best mineral belts for exploration. Transactions of Institute of Mining and Metallurgy 2004, 133, B183–B196.
- Porwal, A.K.; Kreuzer, O.P. Introduction to the special issue: Mineral prospectivity analysis and quantitative resource estimation. Ore Geology Reviews 2010, 38(3), 121–127.
- Hronsky, J.M., Kreuzer, O.P. Applying spatial prospectivity mapping to exploration targeting: Fundamental practical issues and suggested solutions for the future. Ore Geology Reviews 2019, 107, 647–653.
- Bárdossy, G.; Fodor, J. Traditional and new ways to handle uncertainty in geology. Natural Resources Research 2001, 10(3), 179–187.
- Hronsky, J.M.; Groves, D.I.; Loucks, R.R.; Begg, G.C. A unified model for gold mineralisation in accretionary orogens and implications for regional-scale exploration targeting methods. Mineralium Deposita 2012, 47(4), 339–358.
- Groves, D.I.; Santosh, M.; Müller, D.; Zhang, L.; Deng, J.; Yang, L.Q.; Wang, Q.F. Mineral systems: Their advantages in terms of developing holistic genetic models and for target generation in global mineral exploration. Geosystems and Geoenvironment 2022, 1(1), 100001.
- Sibson, R.H. Hinge-parallel fluid flow in fold-thrust belts: How widespread? Proceedings of the Geologists’ Association 2005, 116(3–4), 301–309.
- Cox, S.; Knackstedt, M.; Braun, J. Principles of structural control on permeability and fluid flow in hydrothermal systems. Reviews in Economic Geology 2001, 14, 1–24.
- Tripp, G.I.; Vearncombe, J.R. Fault/fracture density and mineralization: A contouring method for targeting in gold exploration. Journal of Structural Geology 2004, 26(6–7), 1087–1108.
- Groves, D.I.; Santosh, M.; Goldfarb, R.J.; Zhang, L. Structural geometry of orogenic gold deposits: Implications for exploration of world-class and giant deposits. Geoscience Frontiers 2018, 9(4), 1163–1177.
- Sibson, R.H.; Scott, J. Stress/fault controls on the containment and release of overpressured fluids: Examples from gold-quartz vein systems in Juneau, Alaska; Victoria, Australia and Otago, New Zealand. Ore Geology Reviews 1998, 13(1–5), 293–306.
- Sibson, R.H. Fault-valve behavior and the hydrostatic-lithostatic fluid pressure interface. Earth-Science Reviews 1992, 32(1–2), 141–144.
- McQueen, K.G. Ore deposit types and their primary expressions. In Regolith expression of Australian ore systems: A Compilation of exploration case histories with conceptual dispersion, process and exploration models; Butt, C.R.M., Robertson, I.D.M., Scott, K.M., Cornelius, M, Eds.; Cooperative Research Centre for Landscape Environments and Mineral Exploration (CRCLEME), Bentley, Australia, 2005; pp. 1–14.
- Phillips, G.N.; Thomson, D.F., Kuehn, C.A. Deep weathering of deposits in the Yilgarn and Carlin gold provinces. In Proceedings of the Regolith ’98 Conference: New approaches to an old continent, Kalgoorlie, Australia, 2–9 May 1998, pp. 1–22; Available online: https://crcleme.org.au/Pubs/Monographs/regolith98/1-phillips_et_al.pdf (accessed on 02 August 2025).
- Mihalasky, M.J.; Bonham-Carter, G.F. Lithodiversity and its spatial association with metallic mineral sites, Great Basin of Nevada. Natural Resources Research 2001, 10, 209–226.
- Roshanravan, B.; Agajani, H.; Yousefi, M.; Kreuzer, O.P. Generation of a geochemical model to prospect podiform chromite deposits in north of Iran. In 80th EAGE Conference and Exhibition, Copenhagen, Denmark, 11-14 June 2018.
- Nykänen, V.; Lahti, I.; Niiranen, T.; Korhonen, K. Receiver operating characteristics (ROC) as validation tool for prospectivity models—A magmatic Ni-Cu case study from the central Lapland greenstone belt, northern Finland. Ore Geology Reviews 2015, 71, 853–860.
- Tsoukalas, L.H.; Uhrig, R.E. Fuzzy and Neural Approaches in Engineering; John Wiley & Sons: New York, USA, 1997; 606p.
- Nykänen, V.; Groves, D.I.; Ojala, V.J.; Eilu, P.; Gardoll, S.J. Reconnaissance-scale conceptual fuzzy-logic prospectivity modelling for iron oxide copper-gold deposits in the northern Fennoscandian Shield, Finland. Australian Journal of Earth Sciences 2008, 55, 25–38.
- Zimmermann, H. J. Fuzzy set theory—and its applications; Kluwer Academic Publishing: Dordrecht, Netherlands, 1996; 399p.
- Karbalaei-Ramezanali, A.; Feizi, F.; Jafarirad, A.; Lotfi, M. Application of best-worst method and additive ratio assessment in mineral prospectivity mapping: A case study of vein-type copper mineralization in the Kuhsiah-e-Urmak Area, Iran. Ore Geology Reviews 2020, 117, 103268.
- Feizi, F.; Karbalaei-Ramezanali, A.A.; Farhadi, S. FUCOM-MOORA and FUCOM-MOOSRA: New MCDM-based knowledge-driven procedures for mineral potential mapping in greenfields. SN Applied Sciences 2021, 3, 358.
- Aryafar, A.; Roshanravan, B. BWM-SAW: A new hybrid MCDM technique for modeling of chromite potential in the Birjand district, east of Iran. Journal of Geochemical Exploration 2021, 231, 106876.
- Riahi, S.; Fathianpour, N.; Tabatabaei, S.H. Improving the accuracy of detecting and ranking favorable porphyry copper prospects in the east of Sarcheshmeh copper mine region using a two-step sequential Fuzzy-Fuzzy TOPSIS integration approach. Journal of Asian Earth Sciences 2023, 10, 100166.
- Roshanravan, B.; Aghajani, H.; Yousefi, M.; Kreuzer, O.P. An improved prediction-area plot for prospectivity analysis of mineral deposits. Natural Resources Research 2019, 28, 1089–1105.
- Roshanravan, B.; Kreuzer, O.P.; Buckingham, A.; Keys, E. On data quality in mineral potential modelling: A case study using Random Forest and fractal techniques. In 84th EAGE Annual Conference & Exhibition, Vienna, Austria, 5-8 June 2023.
- Roshanravan, B.; Kreuzer, O.P. An optimized XGBoost approach to prospectivity modelling of orogenic gold systems in the Granites-Tanami Orogen, Australia. In 86th EAGE Annual Conference & Exhibition, Toulouse, France, 1-5 June 2025.
- Rodriguez-Galiano, V.F.; Chica-Olmo, M.; Chica-Rivas, M.; Predictive modelling of gold potential with the integration of multisource information based on random forest: A case study on the Rodalquilar area, Southern Spain. International Journal of Geographical Information Science 2014, 28, 1336–1354.
- Carranza, E.J.M.; Laborte, A.G.; Random forest predictive modeling of mineral prospectivity with small number of prospects and data with missing values in Abra (Philippines). Computers & Geosciences 2015, 74, 60–70.
- Sun, T.; Chen, F.; Zhong, L.; Liu, W.; Wang, Y.; GIS-based mineral prospectivity mapping using machine learning methods: A case study from Tongling ore district, eastern China. Ore Geology Reviews 2019, 109, 26–49.
- Xiang, J.; Xiao, K.; Carranza, E.J.M.; Chen, J.; Li, S.; 3D mineral prospectivity mapping with random forests: A case study of Tongling, Anhui, China. Natural Resources Research 2020, 29, 395–414.
- Zhang, S.; Carranza, E.J.M.; Xiao, K.; Wei, H.; Yang, F.; Chen, Z.; Xiang, J.; Mineral prospectivity mapping based on isolation forest and random forest: Implication for the existence of spatial signature of mineralization in outliers. Natural Resources Research 2022, 31, 1981–1999.
- Isles, D.J.; Cooke, A.C. Spatial associations between post-cratonisation dykes and gold deposits in the Yilgarn Block, Western Australia. In Proceedings of the 2nd International Dyke Conference—Mafic Dykes and emplacement mechanisms; Adelaide, Australia, 12-16 September 1990; pp. 157–162.
- Cowan, E.J.; Hobbs, B.E. Perkins Discontinuities: Structurally controlled grade patterns diagnostic of epigenetic gold mineralisation at the deposit-scale. Australian Journal of Earth Sciences 2025, 1–41.
- Kreuzer, O.P. Bardoc gold study. Confidential Report to St Barbara Limited, Corporate Geoscience Group, February 2023, 85p.
- Crameri, K. Structural controls on mineralisation within the Alpha Lode at the Aphrodite deposit, Western Australia. BSc (Honours) Thesis, University of South Australia, Adelaide, Australia, 2002, 63p.
- Ge, W.; Cheng, Q.; Jing, L.; Wang, F.; Zhao, M.; Ding, H. Assessment of the capability of Sentinel-2 imagery for iron-bearing minerals mapping: A case study in the Cuprite area, Nevada. Remote Sensing 2020, 12(18), 3028.
- Kimpe, C.D.; Miles, N. Formation of swelling clay minerals by sulfide oxidation in some metamorphic rocks and related soils of Ontario, Canada. Canadian Journal of Soil Science 1992, 72(3), 263–270.
- Anand, R.R.; Butt, C.R.M. A guide for mineral exploration through the regolith in the Yilgarn Craton, Western Australia. Australian Journal of Earth Sciences 2010, 57(8), 1015–1114.
- Cheng, Q.; Agterberg, F.P.; Ballantyne, S.B. The separation of geochemical anomalies from background by fractal methods. Journal of Geochemical Exploration 1994, 51(2), 109–130.
- Afzal, P.; Yasrebi, A.B.; Saein, L.D.; Panahi, S. Prospecting of Ni mineralization based on geochemical exploration in Iran. Journal of Geochemical Exploration 2017, 181, 294–304.
- Nezhad, S.G.; Mokhtari, A.R.; Rodsari, P.R. The true sample catchment basin approach in the analysis of stream sediment geochemical data. Ore Geology Reviews 2017, 83, 127–134.
- Keykhay-Hosseinpoor, M.; Porwal, A.; Rajendran, K.; Panja, S. Mineral system modeling of lithium-cesium-tantalum (LCT)-type pegmatites: Regional-scale exploration targeting and uncertainty analysis in the Sanandaj-Sirjan zone, Western Iran. Journal of Geochemical Exploration 2025, 107885.
- Partington, G. Developing models using GIS to assess geological and economic risk: An example from VMS copper gold mineral exploration in Oman. Ore Geology Reviews 2010, 38(3), 197–207.
- Chudasama, B.; Porwal, A.; Kreuzer, O.P.; Butera, K. Geology, geodynamics and orogenic gold prospectivity modelling of the Paleoproterozoic Kumasi Basin, Ghana, West Africa. Ore Geology Reviews 2016, 78, 692–711.
- Chudasama, B.; Kreuzer, O.P.; Thakur, S.; Porwal, A.; Buckingham, A. Surficial uranium mineral systems in Western Australia: Geologically-permissive tracts and undiscovered endowment. In Quantitative and Spatial Evaluations of Undiscovered Uranium Resources, IAEA-TECDOC-1861; International Atomic Energy Agency: Vienna, Austria, 2018, pp. 446–614.
- Bruce, M.; Kreuzer, O.P.; Wilde, A.; Buckingham, A.; Butera, K.; Bierlein, F. Unconformity-type uranium systems: A comparative review and predictive modelling of critical genetic factors. Minerals 2020, 10(9), 738.
- Partington, G.A.; Peters, K.J.; Czertowicz, T.A.; Greville, P.A.; Blevin, P.L.; Bahiru, E.A. Ranking mineral exploration targets in support of commercial decision making: A key component for inclusion in an exploration information system. Applied Geochemistry 2024, 168, 106010.
- Chalice Mining Limited. Significant nickel-palladium discovery confirmed at Julimar. In Australian Securities Exchange (ASX) Announcement dated 15 April 2020; Chalice Mining Limited: West Perth, Australia, 2020; 19p. Available online: https://chalicemining.com/wp-content/uploads/2022/12/6975195.pdf (accessed on 08 September 2025).
- Dulfer, H.; Skirrow, R.G.; Champion, D.C; Highet, L.M.; Czarnota, K.; Coghlan, R.; Milligan, P.R. Potential for intrusion-hosted Ni-Cu-PGE sulfide deposits in Australia: A continental-scale analysis of mineral system prospectivity; Record 2016(01); Geoscience Australia: Canberra, Australia, 2016; 97p.
- Porwal, A.; Carranza, E.J.M.; Hale, M. Knowledge-driven and data-driven fuzzy models for predictive mineral potential mapping. Natural Resources Research 2003, 12(1), 1–25.
- Kreuzer, O.P.; Markwitz, V.; Porwal, A.K.; McCuaig, T.C. A continent-wide study of Australia’s uranium potential: Part I: GIS-assisted manual prospectivity analysis. Ore Geology Reviews 2010, 38(4), 334–366.
- Roberts, F.I.; Witt, W.K.; Westaway, J. Gold mineralization in the Edjudina-Kanowna region, Eastern Goldfields, Western Australia; Report 90; Geological Survey of Western Australia: East Perth, Australia, 2004; 277p.
- Blina Minerals NL. Acquisition of Dingo gold project. In Australian Securities Exchange (ASX) Announcement dated 05 May 2017; Blina Minerals NL: West Perth, Australia, 2017; 14p. Available online: https://announcements.asx.com.au/asxpdf/20170505/pdf/43j1p43h2x9km6.pdf (accessed on 08 September 2025).
- Verity Resources Limited. Resource upgrade drilling completed. In Australian Securities Exchange (ASX) Announcement dated 04 August 2025; Verity Resources Limited: Kew East, Australia, 2025; 7p. Available online: https://wcsecure.weblink.com.au/pdf/VRL/02974515.pdf (accessed on 08 September 2025).
- Verity Resources Limited. Historical drill validation study confirms high grade zones at Monument gold project. In Australian Securities Exchange (ASX) Announcement dated 12 September 2025; Verity Resources Limited: Kew East, Australia, 2025; 28p. Available online: https://wcsecure.weblink.com.au/pdf/VRL/02992609.pdf (accessed on 08 September 2025).
Figure 1.
Location of the study area in the central-eastern Yilgarn Craton. Domain boundaries, geology and gold occurrences are based on data sources listed in Table 1.
Figure 1.
Location of the study area in the central-eastern Yilgarn Craton. Domain boundaries, geology and gold occurrences are based on data sources listed in Table 1.
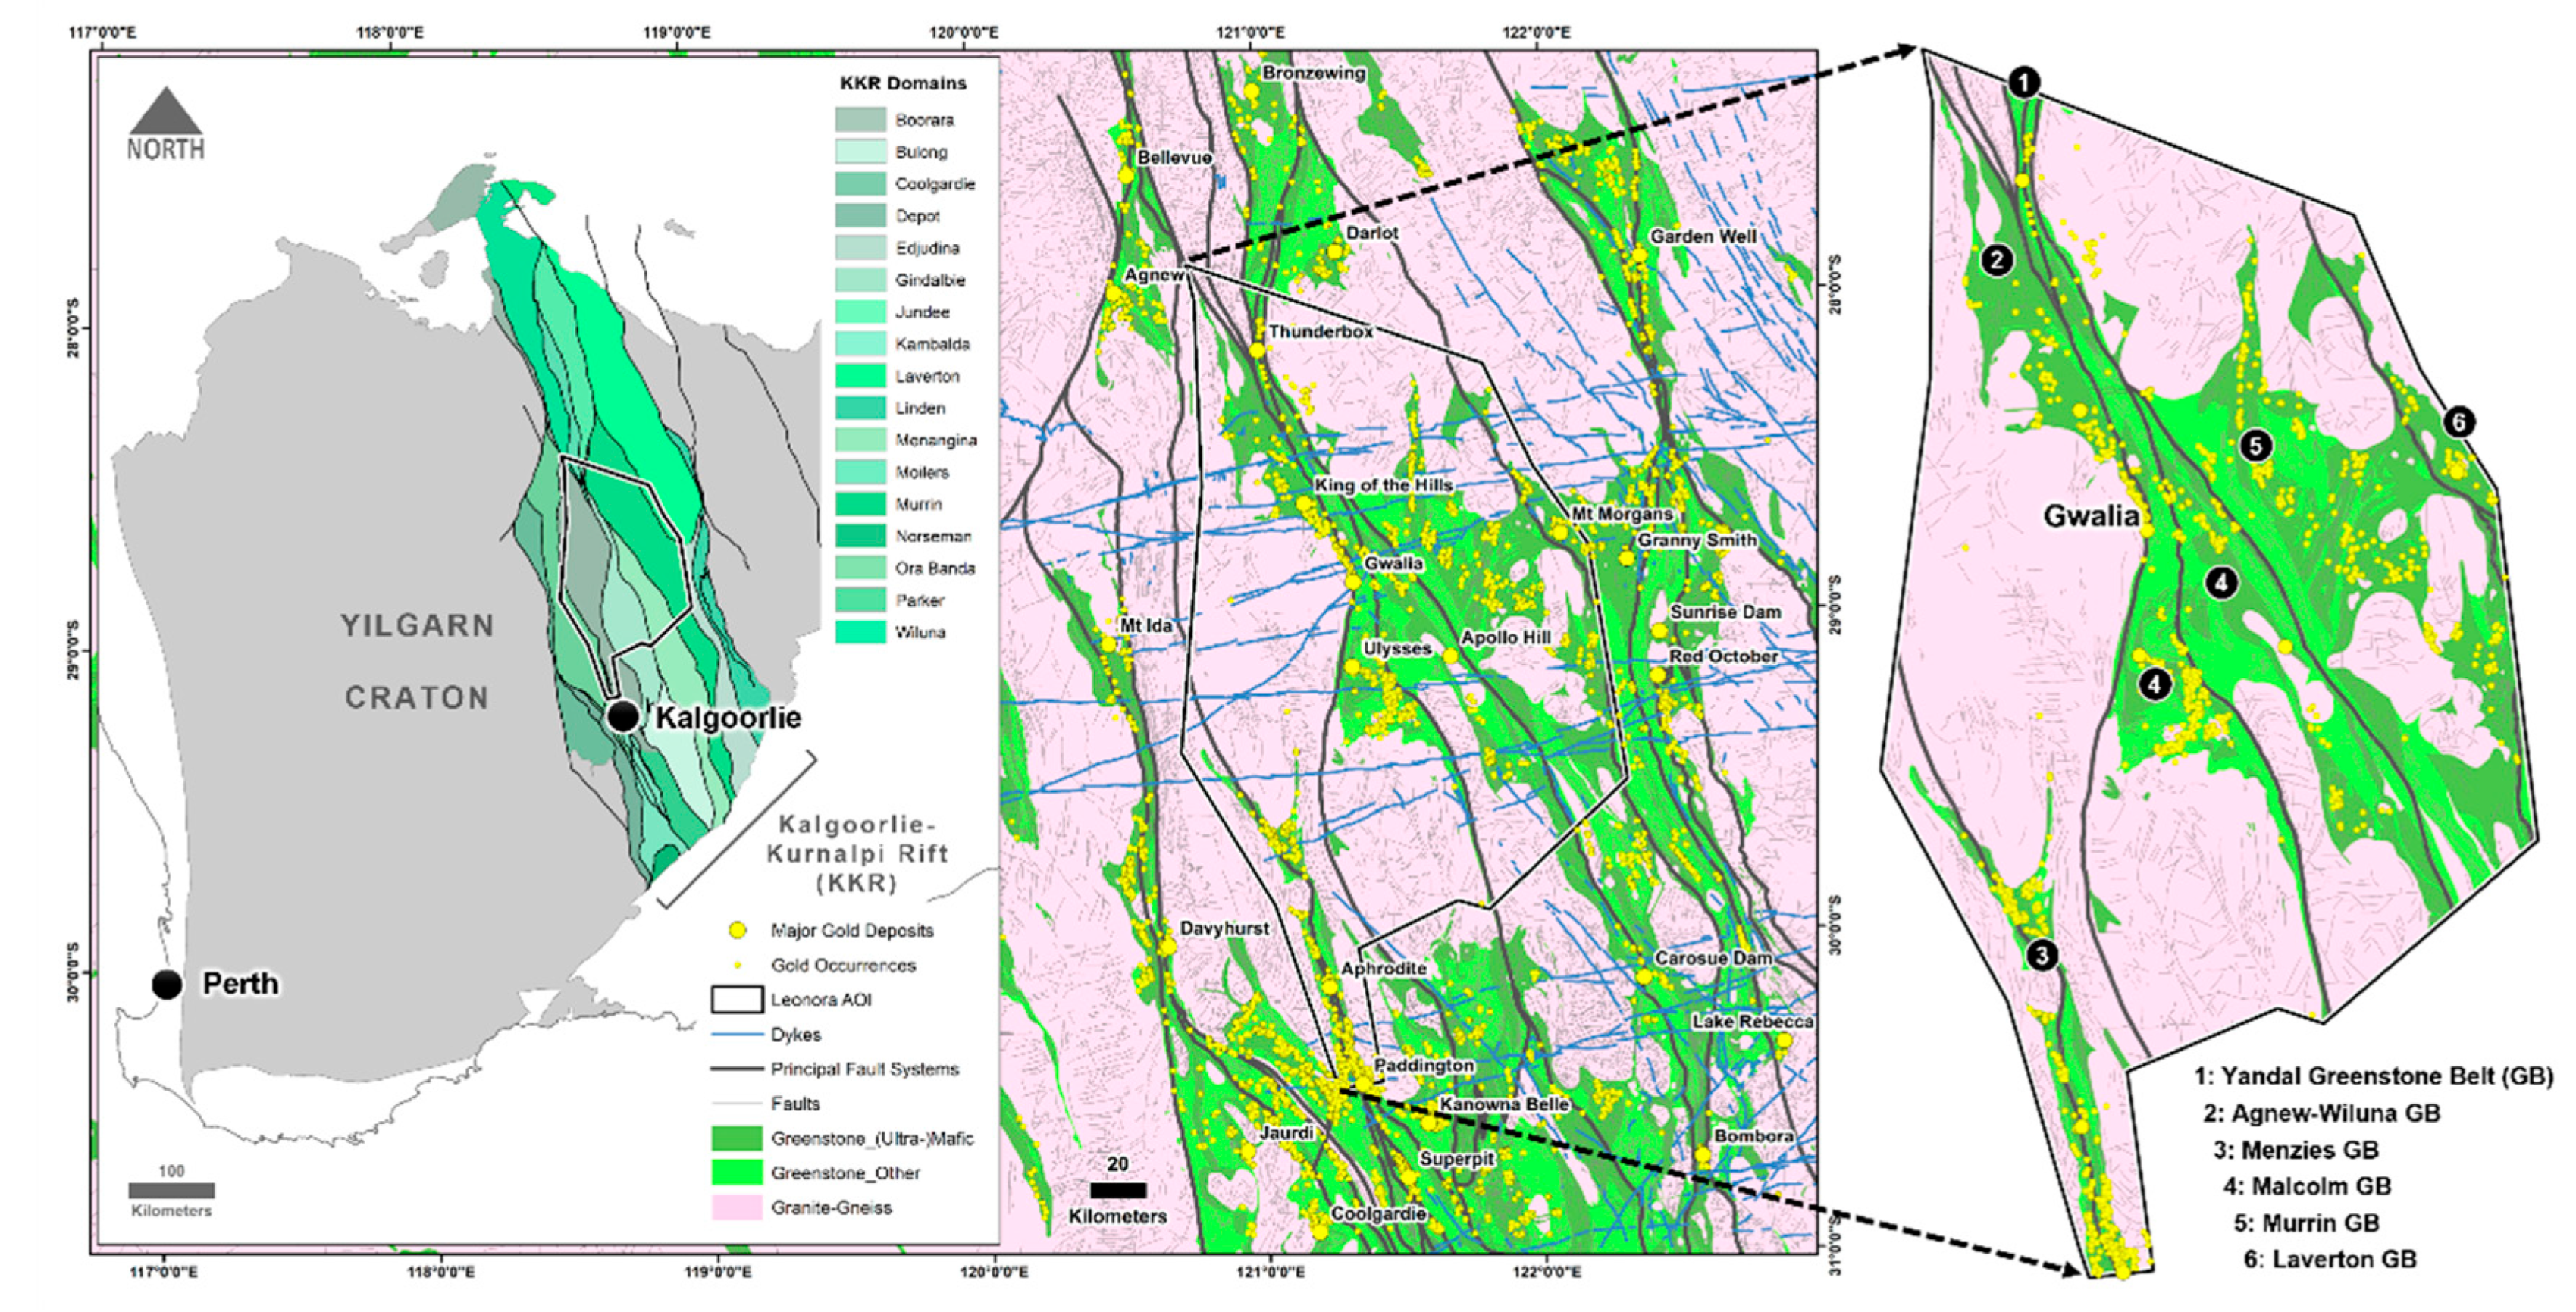
Figure 2.
Yilgarn Craton time-space-event synthesis [79_alt].
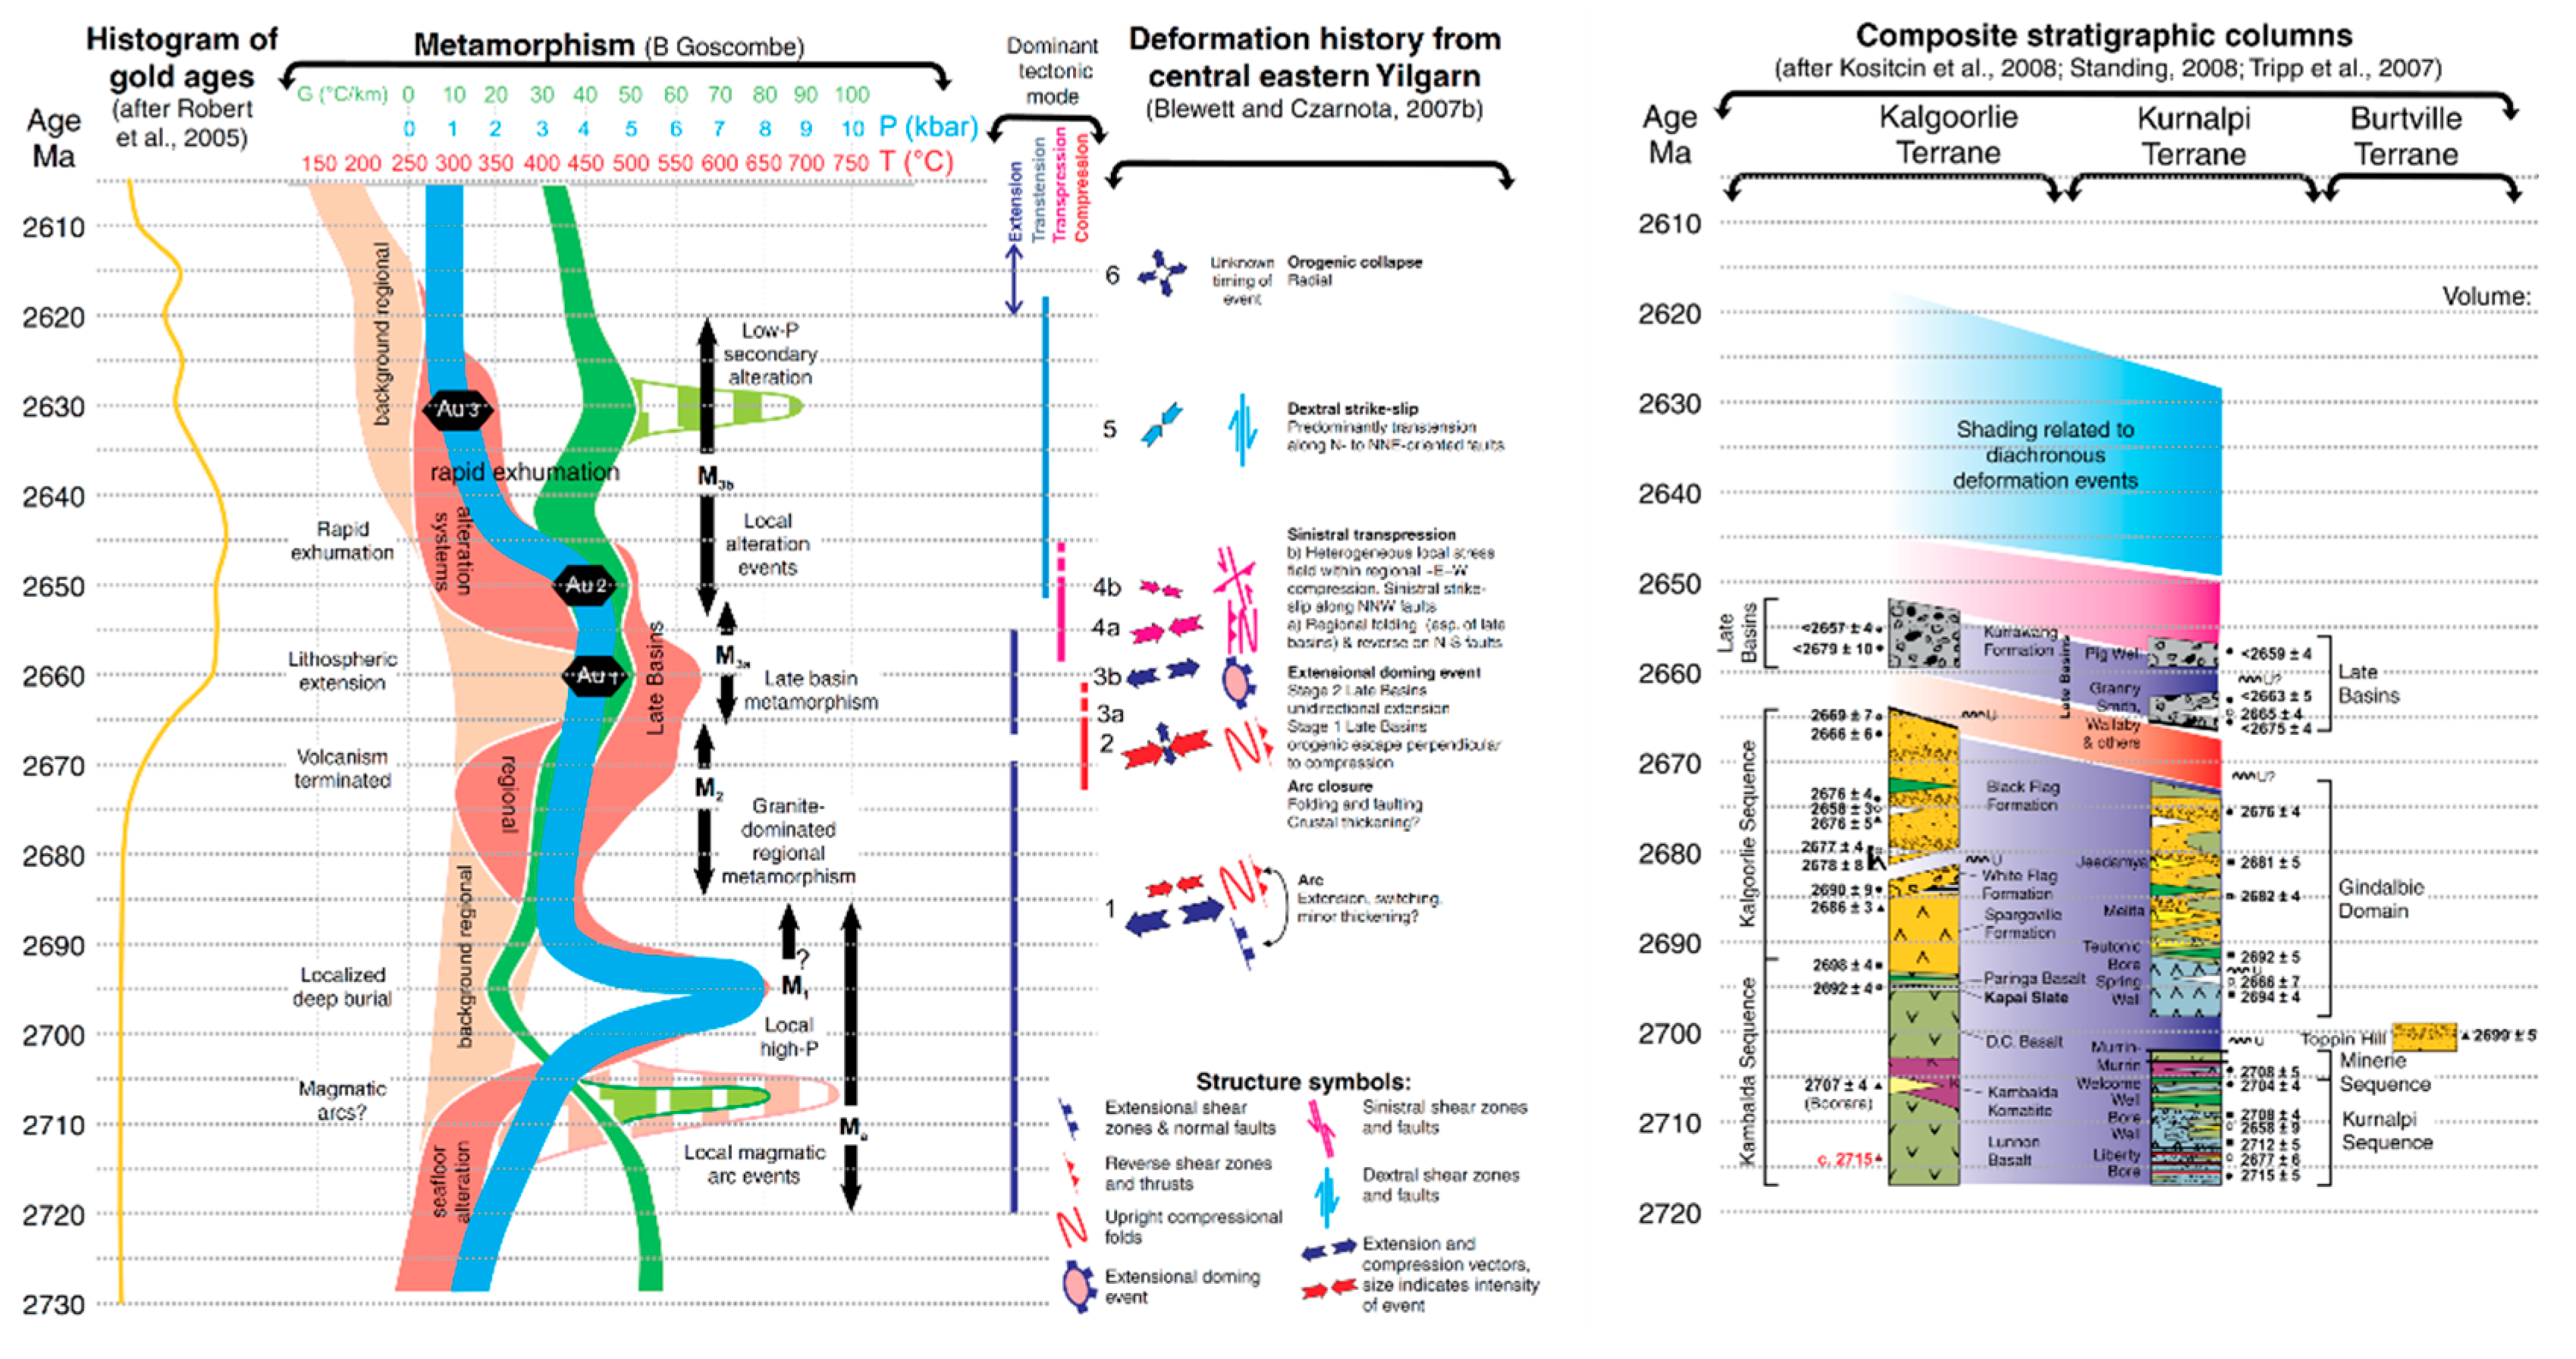
Figure 3.
Terrane boundaries and major fault systems relevant to the study area. Names of major fault systems: 1 = Waroonga; 2 = Ida; 3 = Ballard; 4 = Zuleika; 5 = Menzies; 6 = Black Flag/Boorara/Abattoir; 7 = Perseverance/Ockerbury/McClure; 8 = Melita/Emu; 9 = Keith/Kilkenny; 10 = Celia; 11 = Laverton; 12 = Hootanui; 13 = Barnicoat. Terrane boundaries, faults and gold occurrences are based on data sources listed in Table 1.
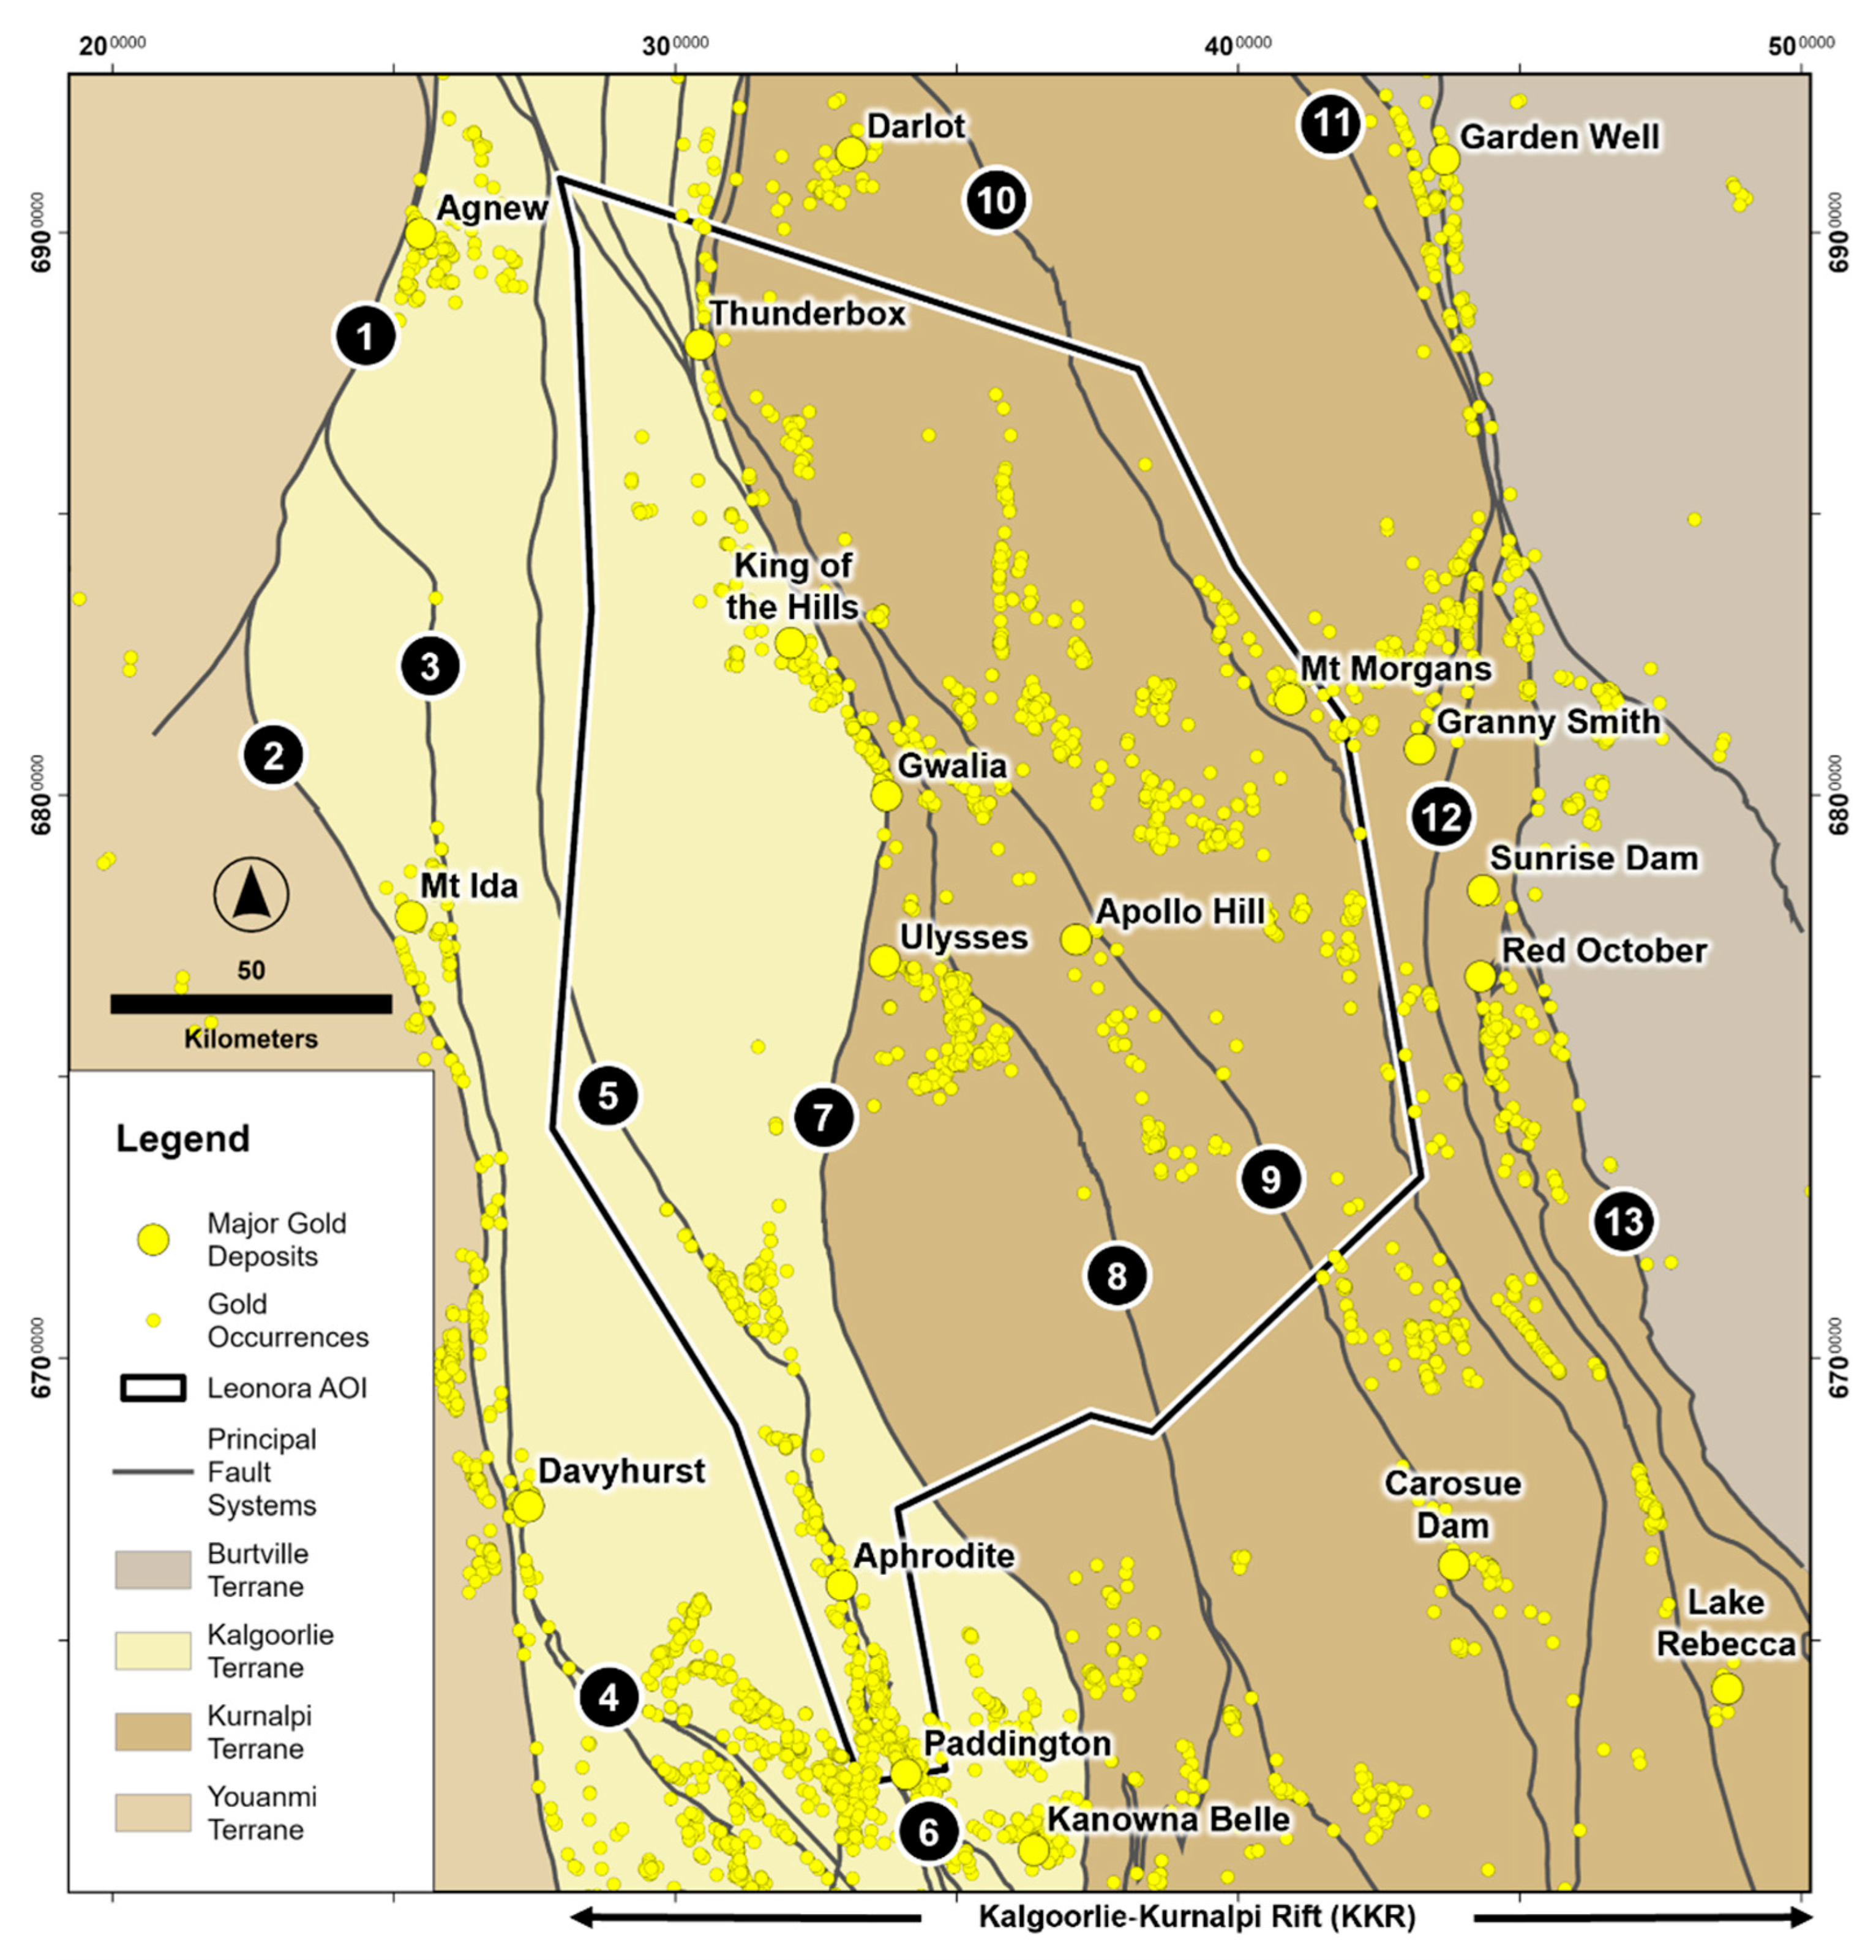
Figure 4.
Schematic greenstone belt-hosted gold targeting model (modified from [106]). In this model, large, (multi-)million ounce gold camps form in the central parts of now inverted ‘greenstone basins’, in particular where they are cut by cross structures. Structurally thickened mafic-ultramafic rock packages in the central parts of inverted greenstone basins are mappable by gravity ridges (Figure 5). Strongly deformed basin edges, which are typically associated with smaller gold deposits, are mappable by gravity edges (Figure 6).
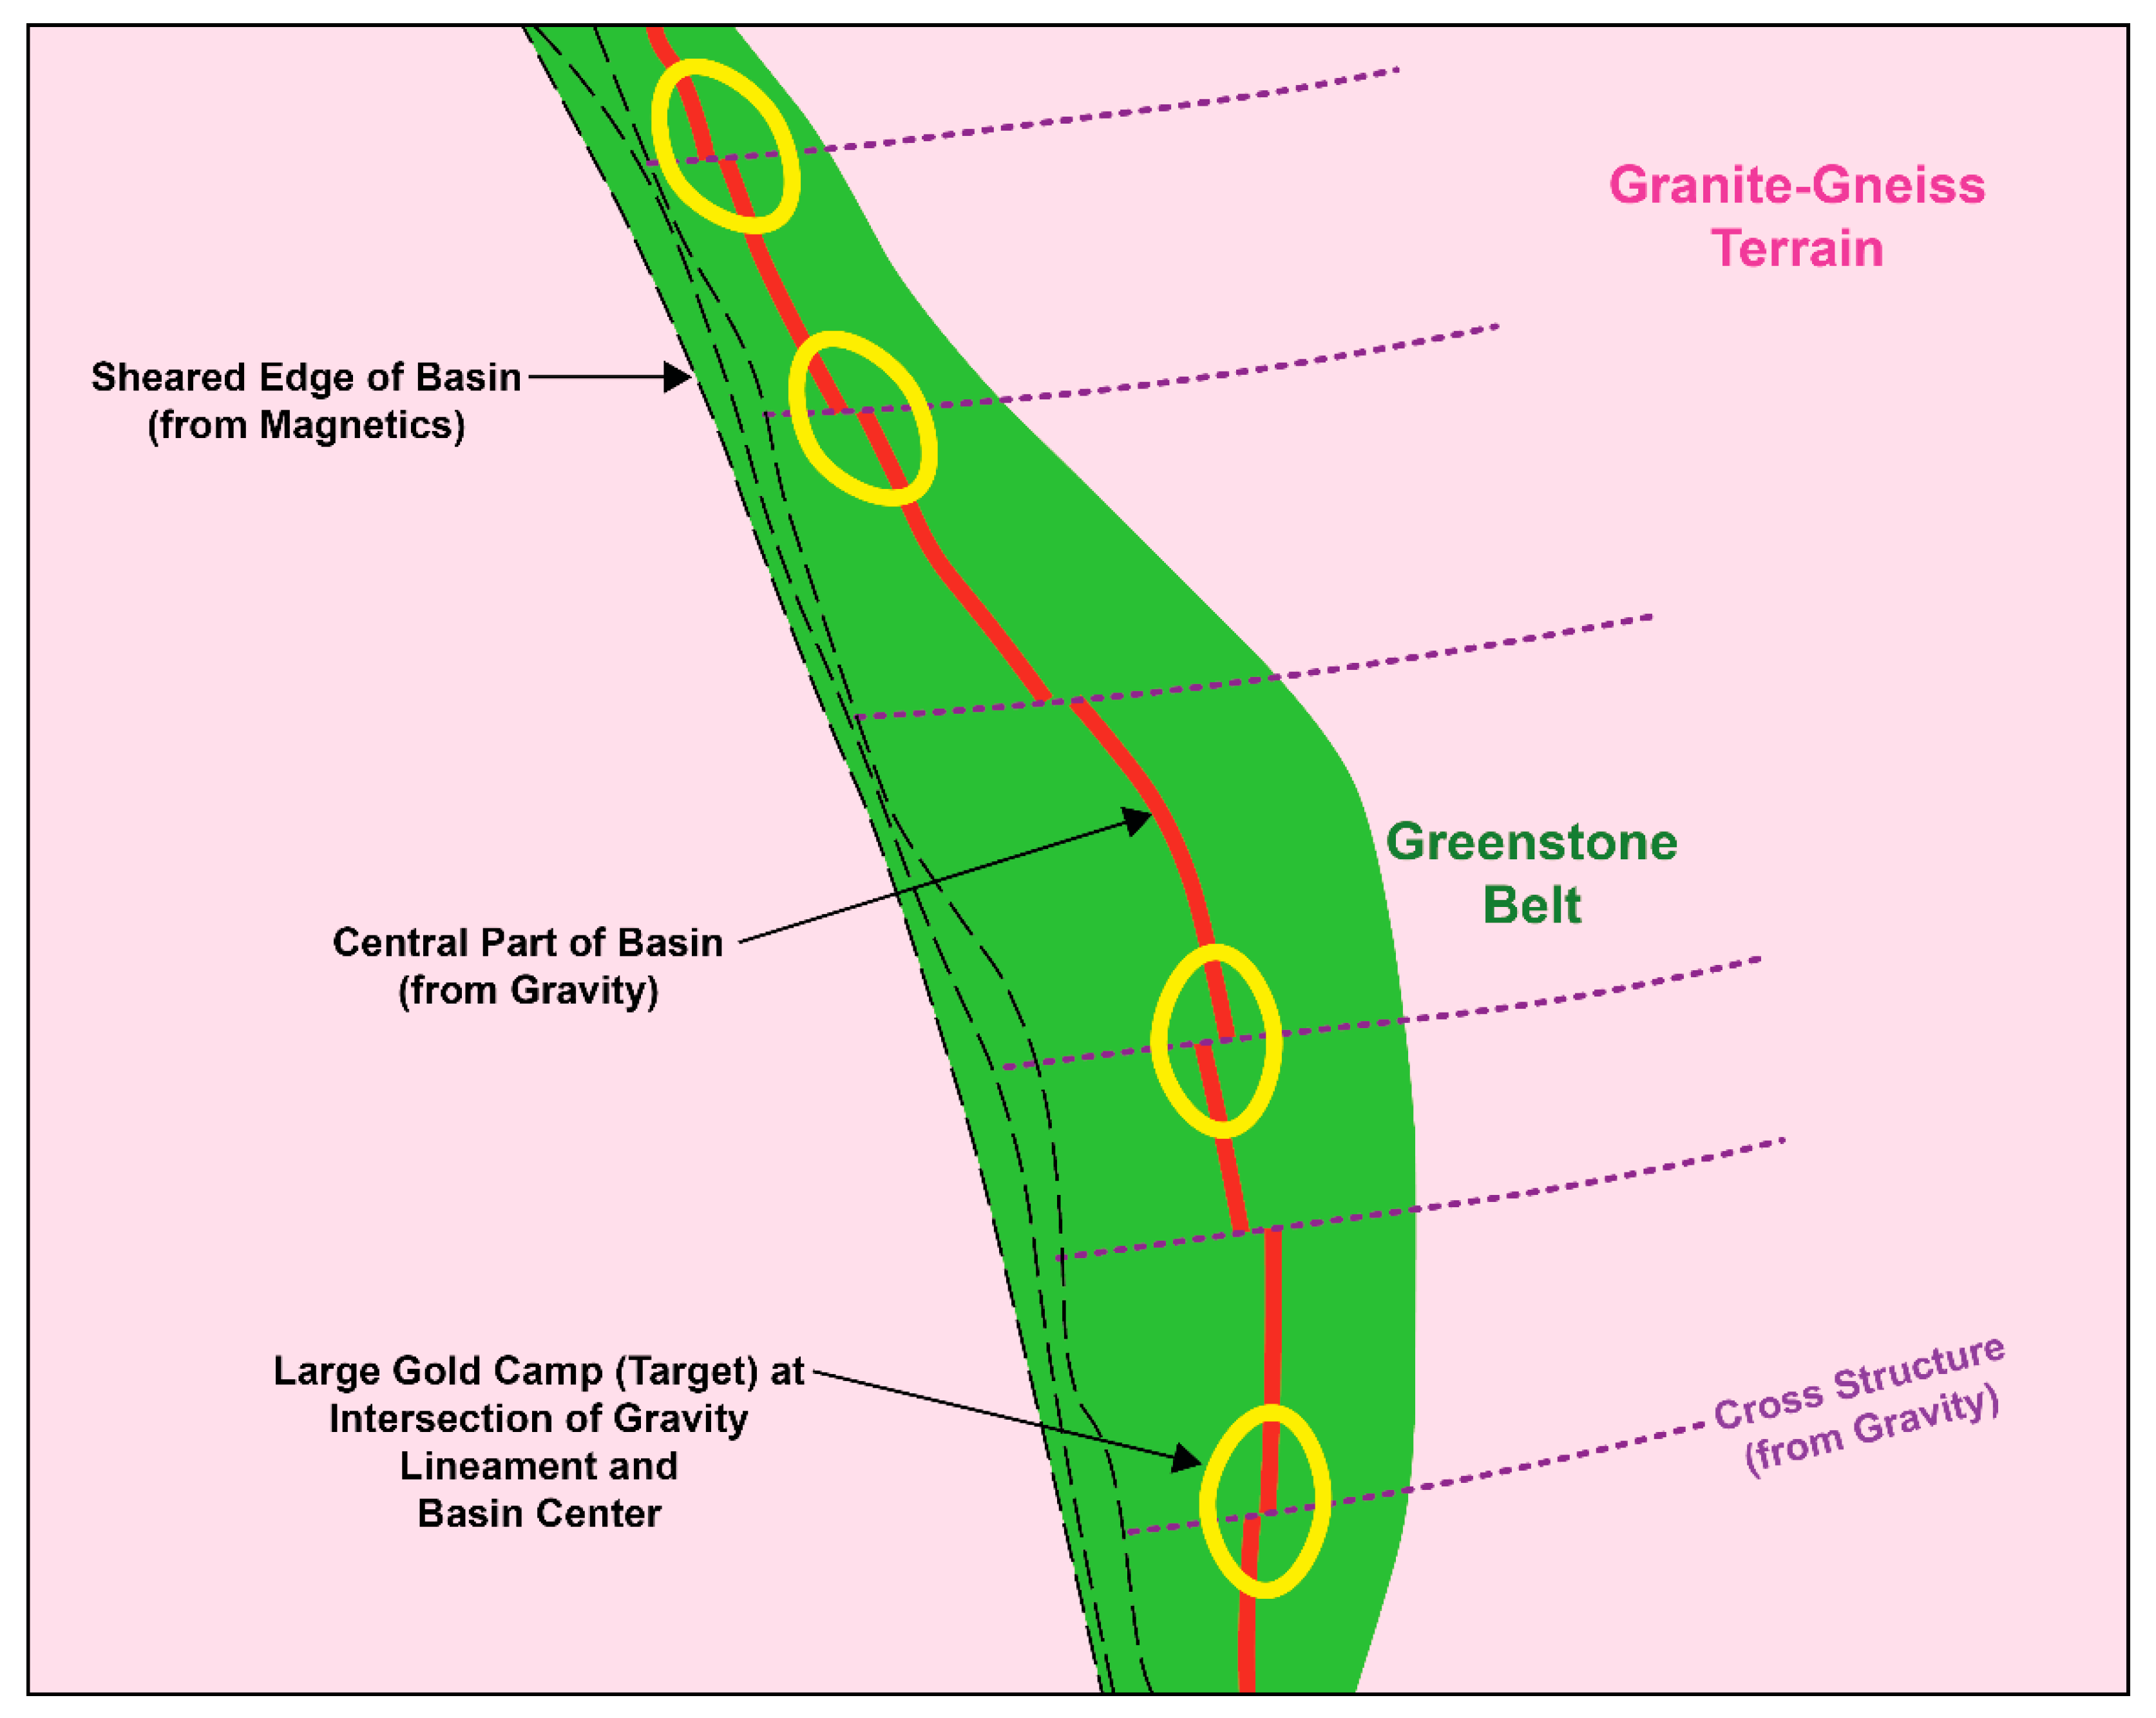
Figure 5.
Gravity ridges (800 m-scale) serve as proxies for now inverted greenstone basin centers or zones of thicker mafic material along greenstone keels and root zones. (a) Belt-parallel gravity ridges. (b) Cross-belt gravity ridges. See text for details.
Figure 5.
Gravity ridges (800 m-scale) serve as proxies for now inverted greenstone basin centers or zones of thicker mafic material along greenstone keels and root zones. (a) Belt-parallel gravity ridges. (b) Cross-belt gravity ridges. See text for details.
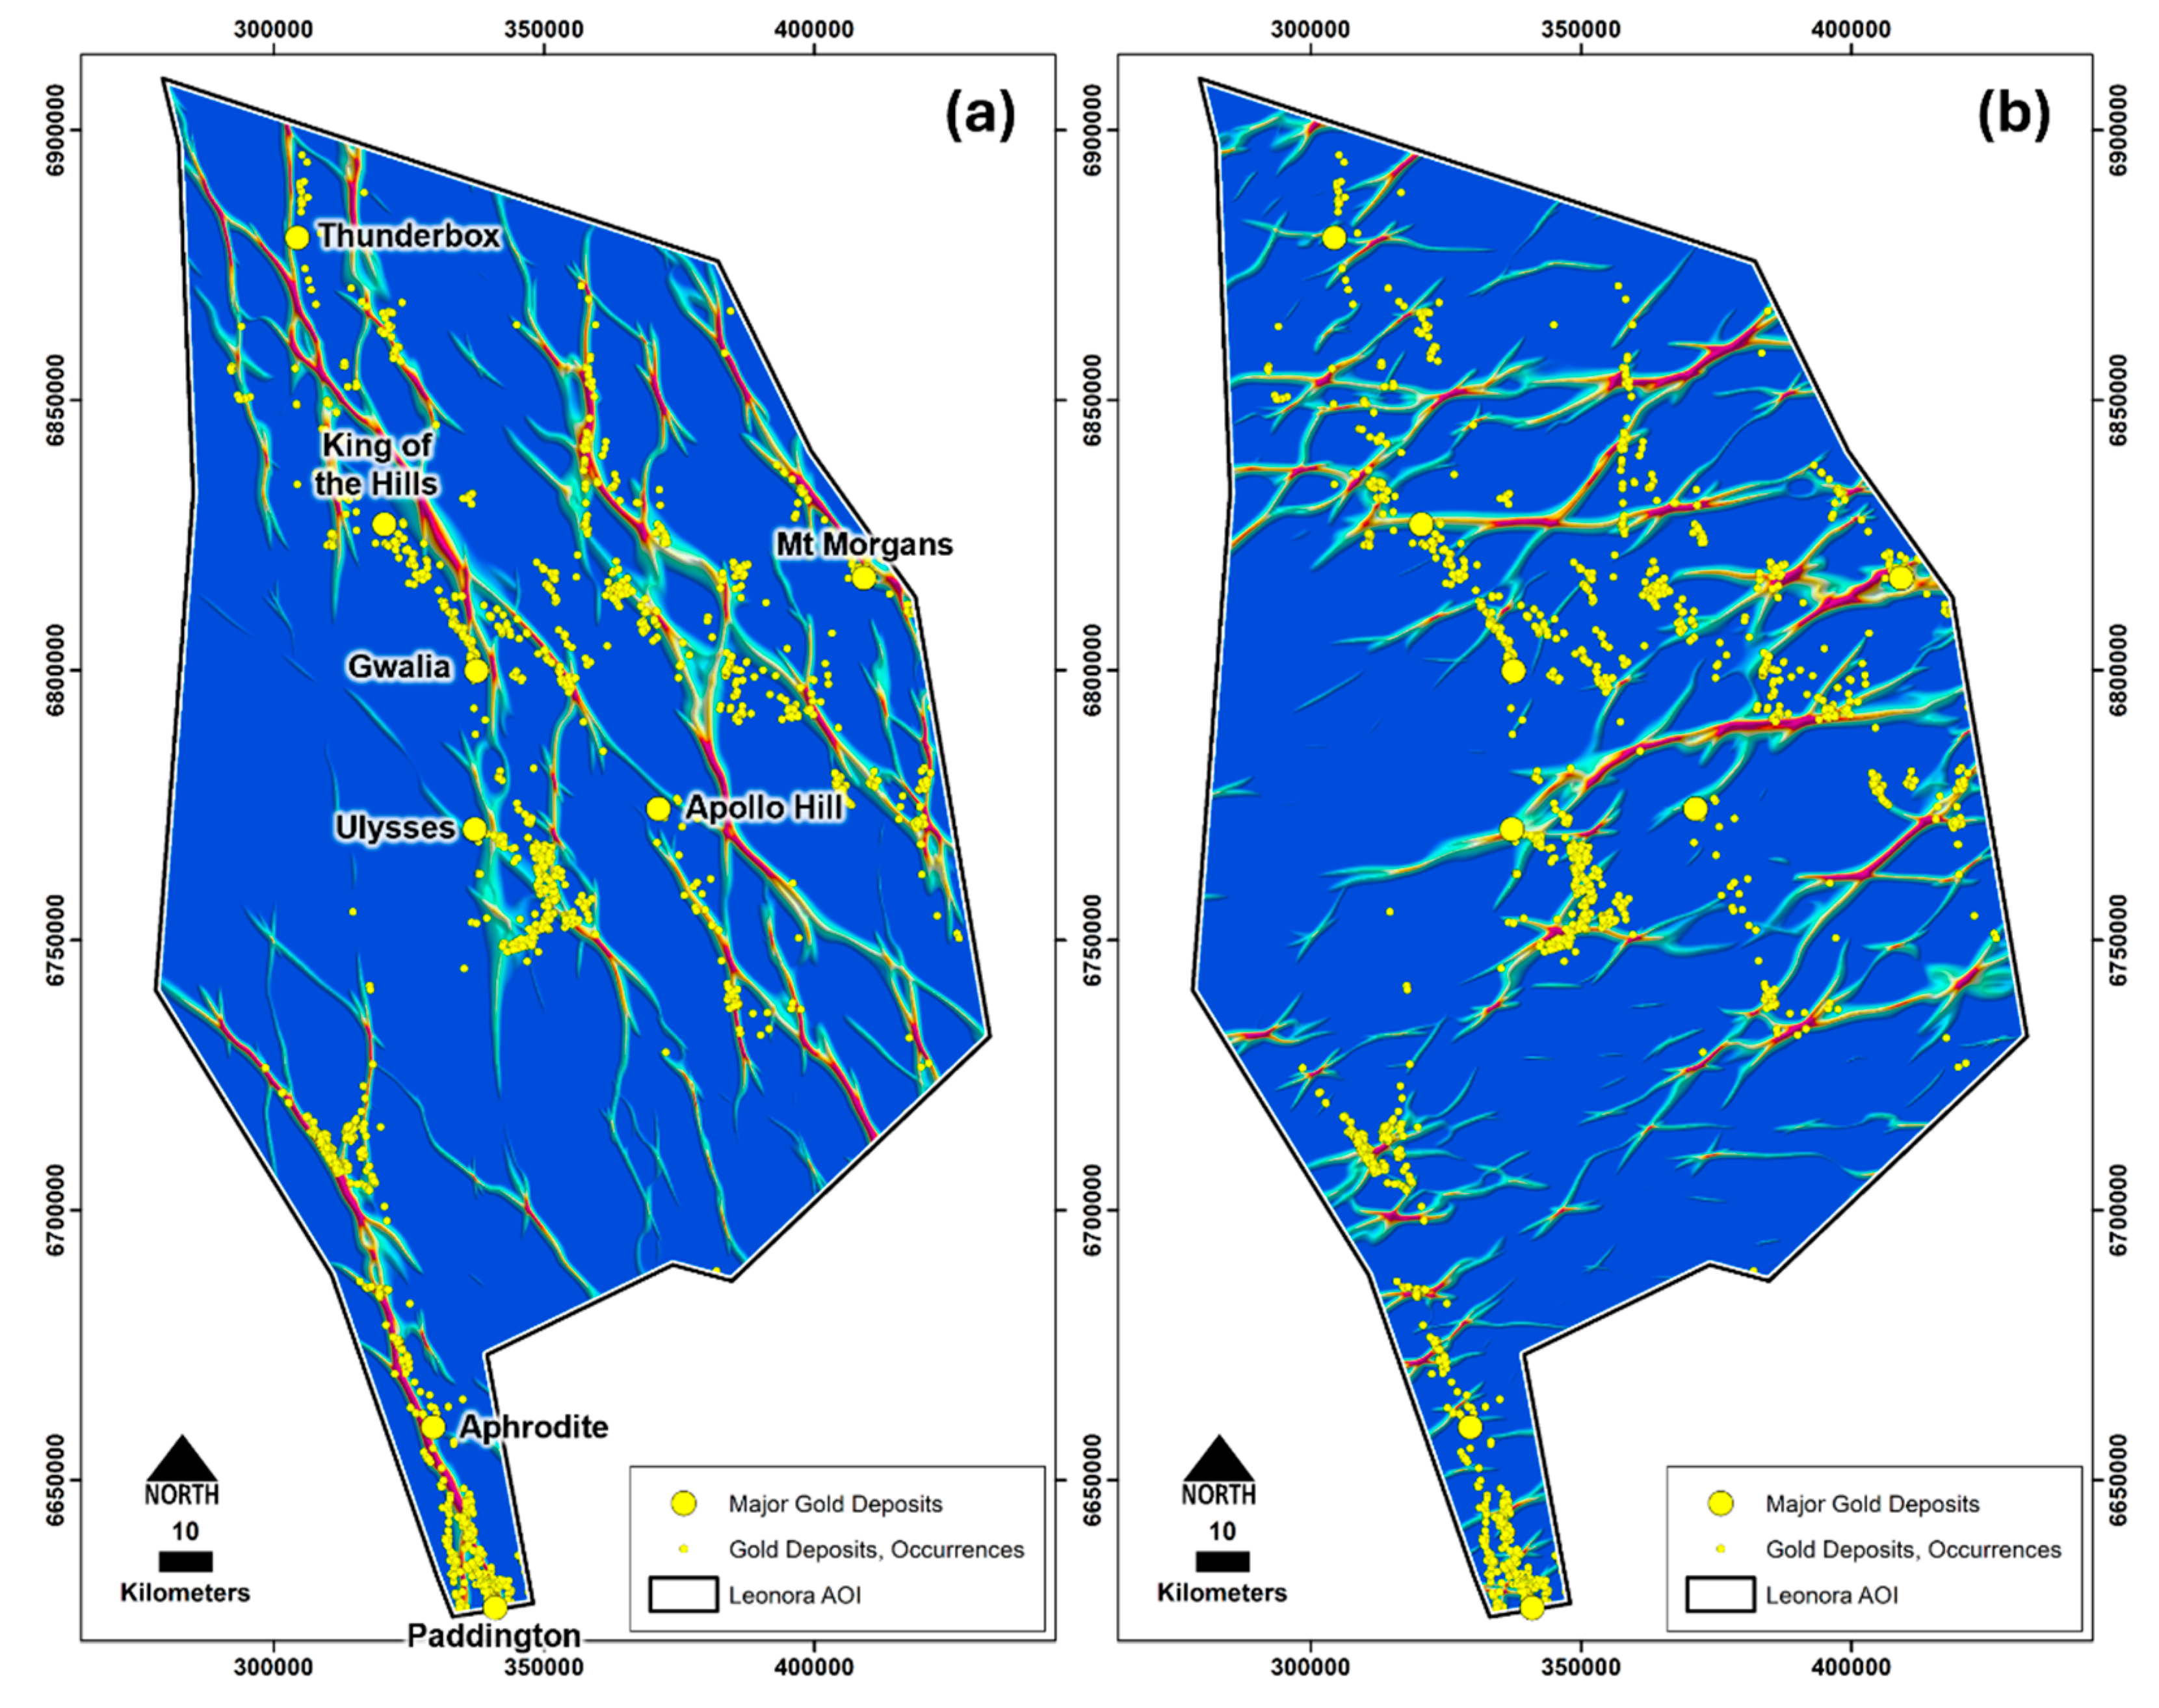
Figure 6.
Gravity edges (3200 m-scale) represent significant faults or lithological boundaries. (a) Belt-parallel gravity edges. (b) Cross-belt gravity edges. Label #1 marks a curvilinear belt-parallel gravity edge that can be traced along strike for >230 km and likely continues beyond the study area boundary. The Thunderbox, King of the Hills, Gwalia and Ulysses gold deposits all sit along this gravity edge. Interestingly, this gravity edge does not spatially coincide with the nearby Perseverance/Ockerbury/McClure fault system but a granite-greenstone contact. Semi-parallel gravity edges, in particular those labeled #2 and #3, may present attractive exploration targets. See text for details.
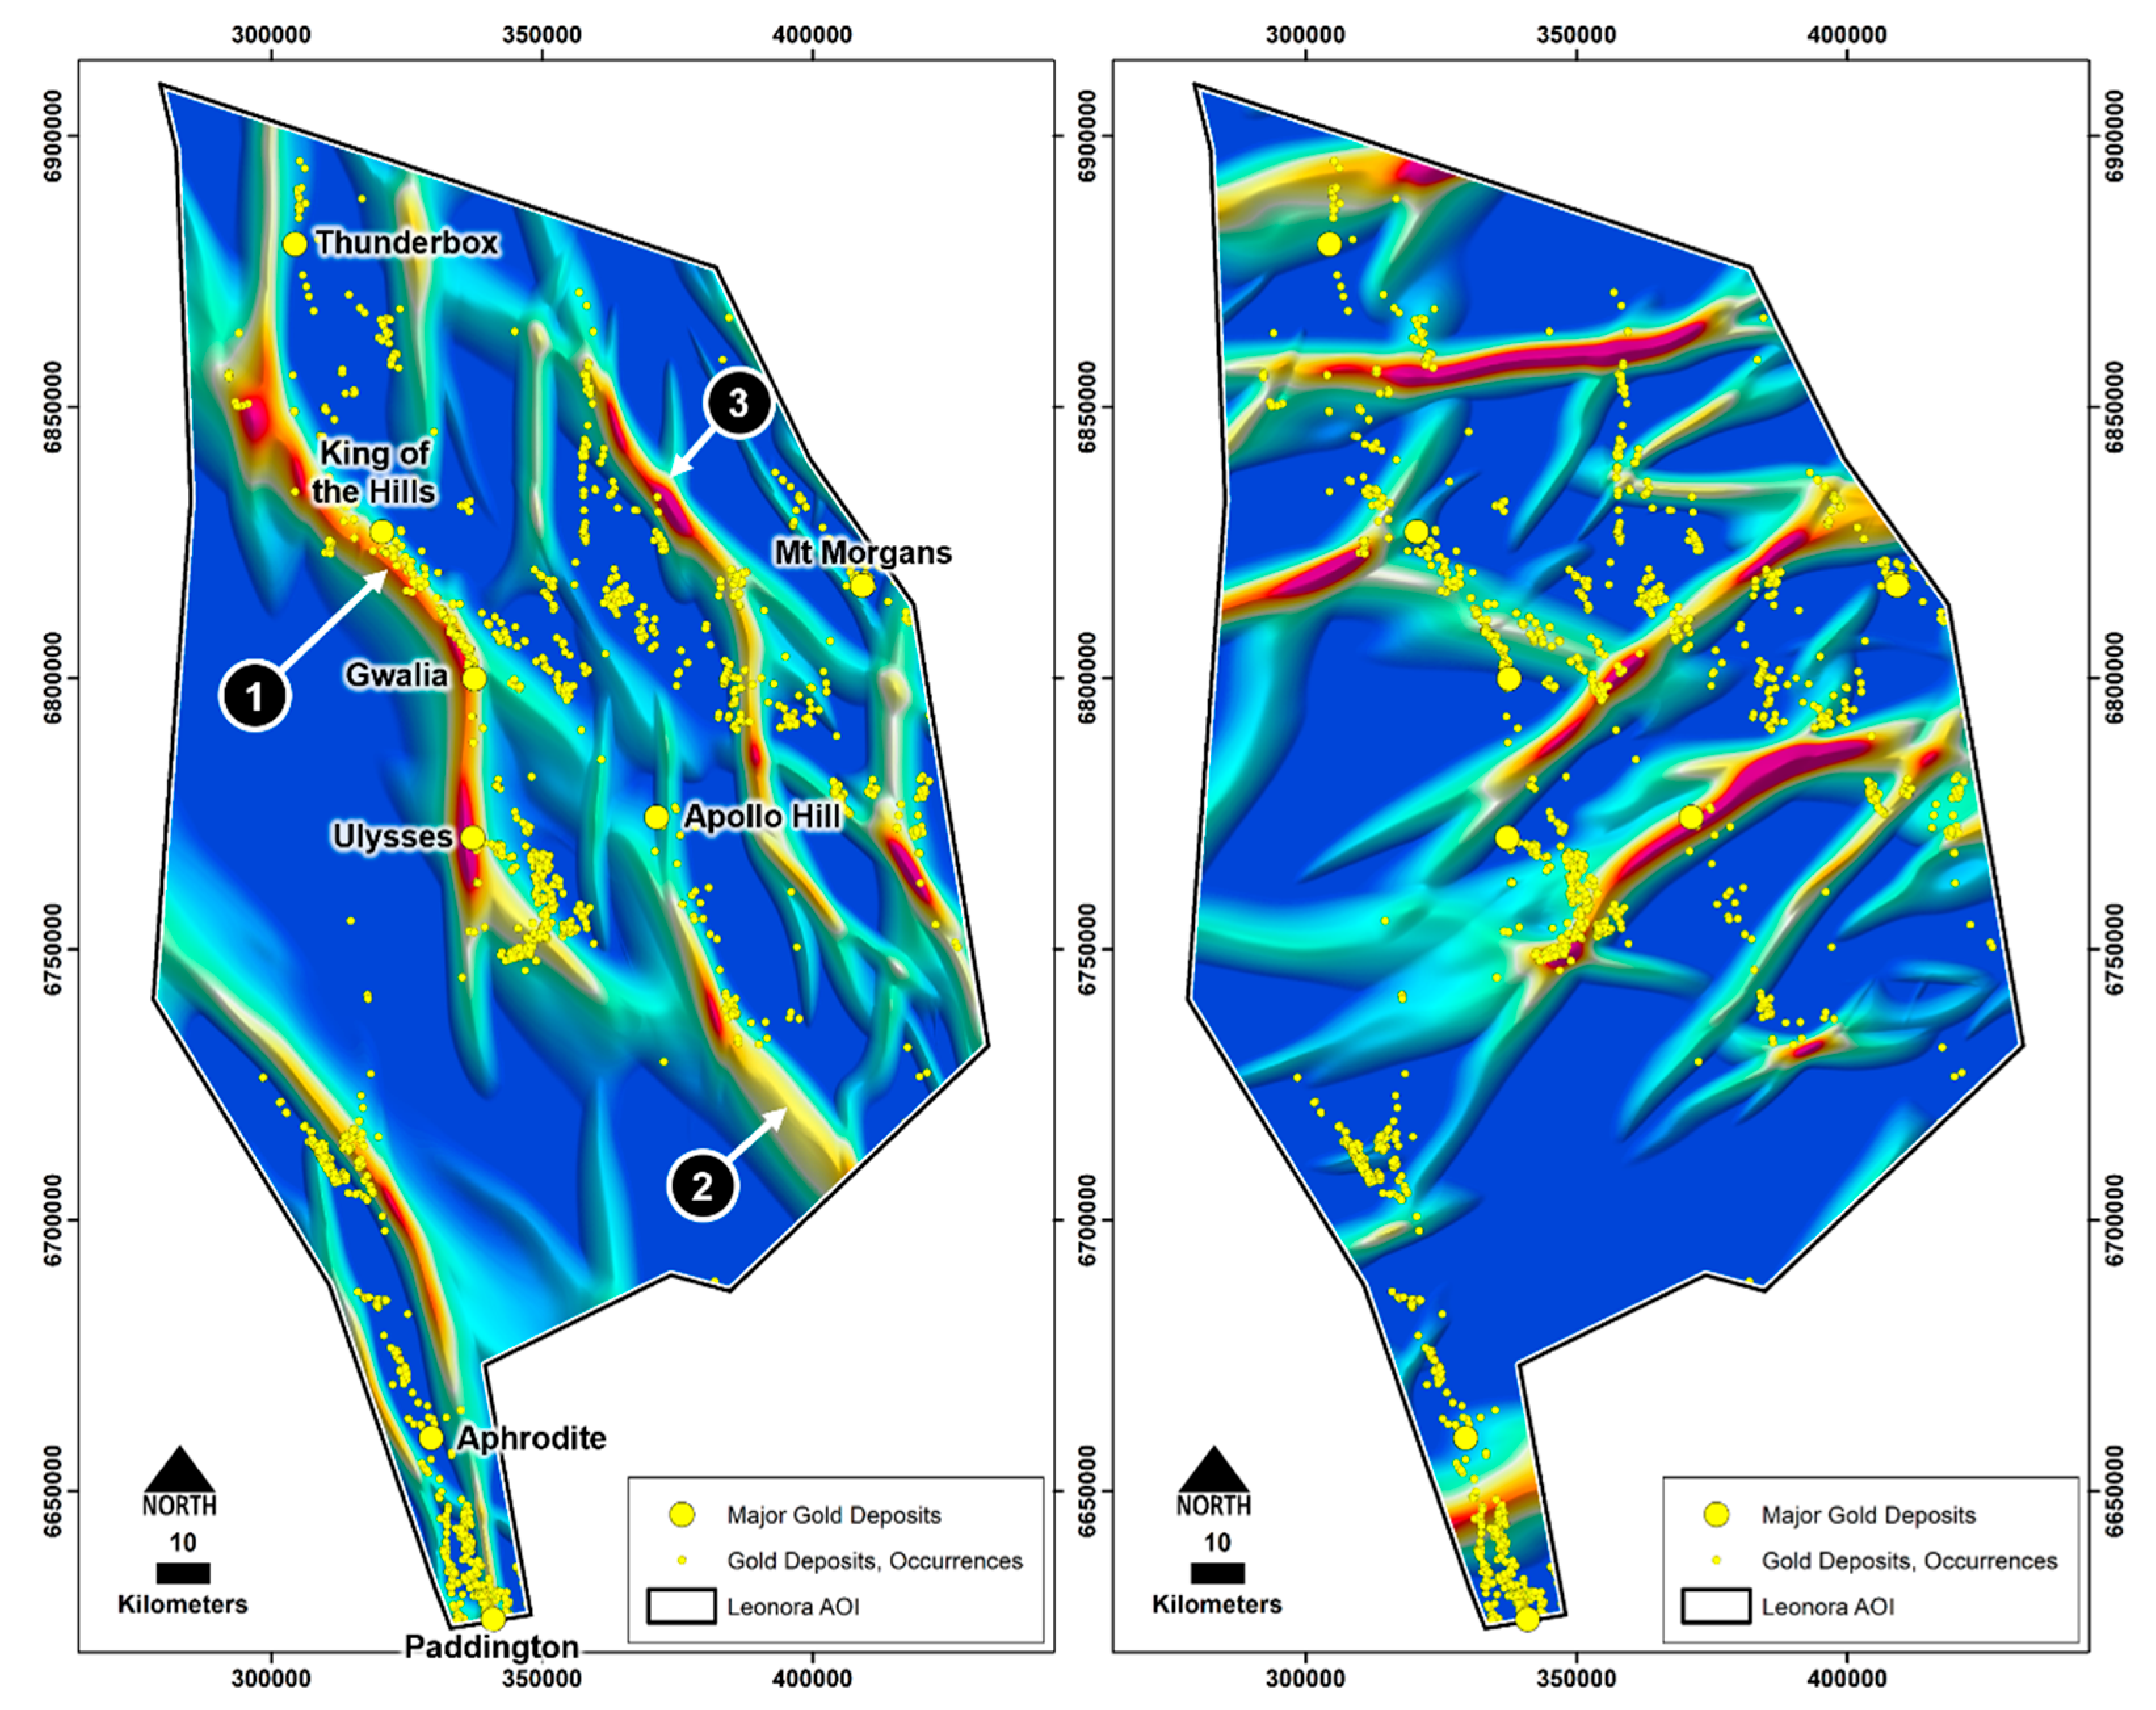
Figure 7.
Magnetic edges (800 m-scale) represent faults or lithological boundaries. (a) Belt-parallel magnetic edges. (b) Cross-belt magnetic edges. Lithostructural features evident here are Proterozoic dolerite dykes and certain intrusive contacts and faults. See text for details.
Figure 7.
Magnetic edges (800 m-scale) represent faults or lithological boundaries. (a) Belt-parallel magnetic edges. (b) Cross-belt magnetic edges. Lithostructural features evident here are Proterozoic dolerite dykes and certain intrusive contacts and faults. See text for details.
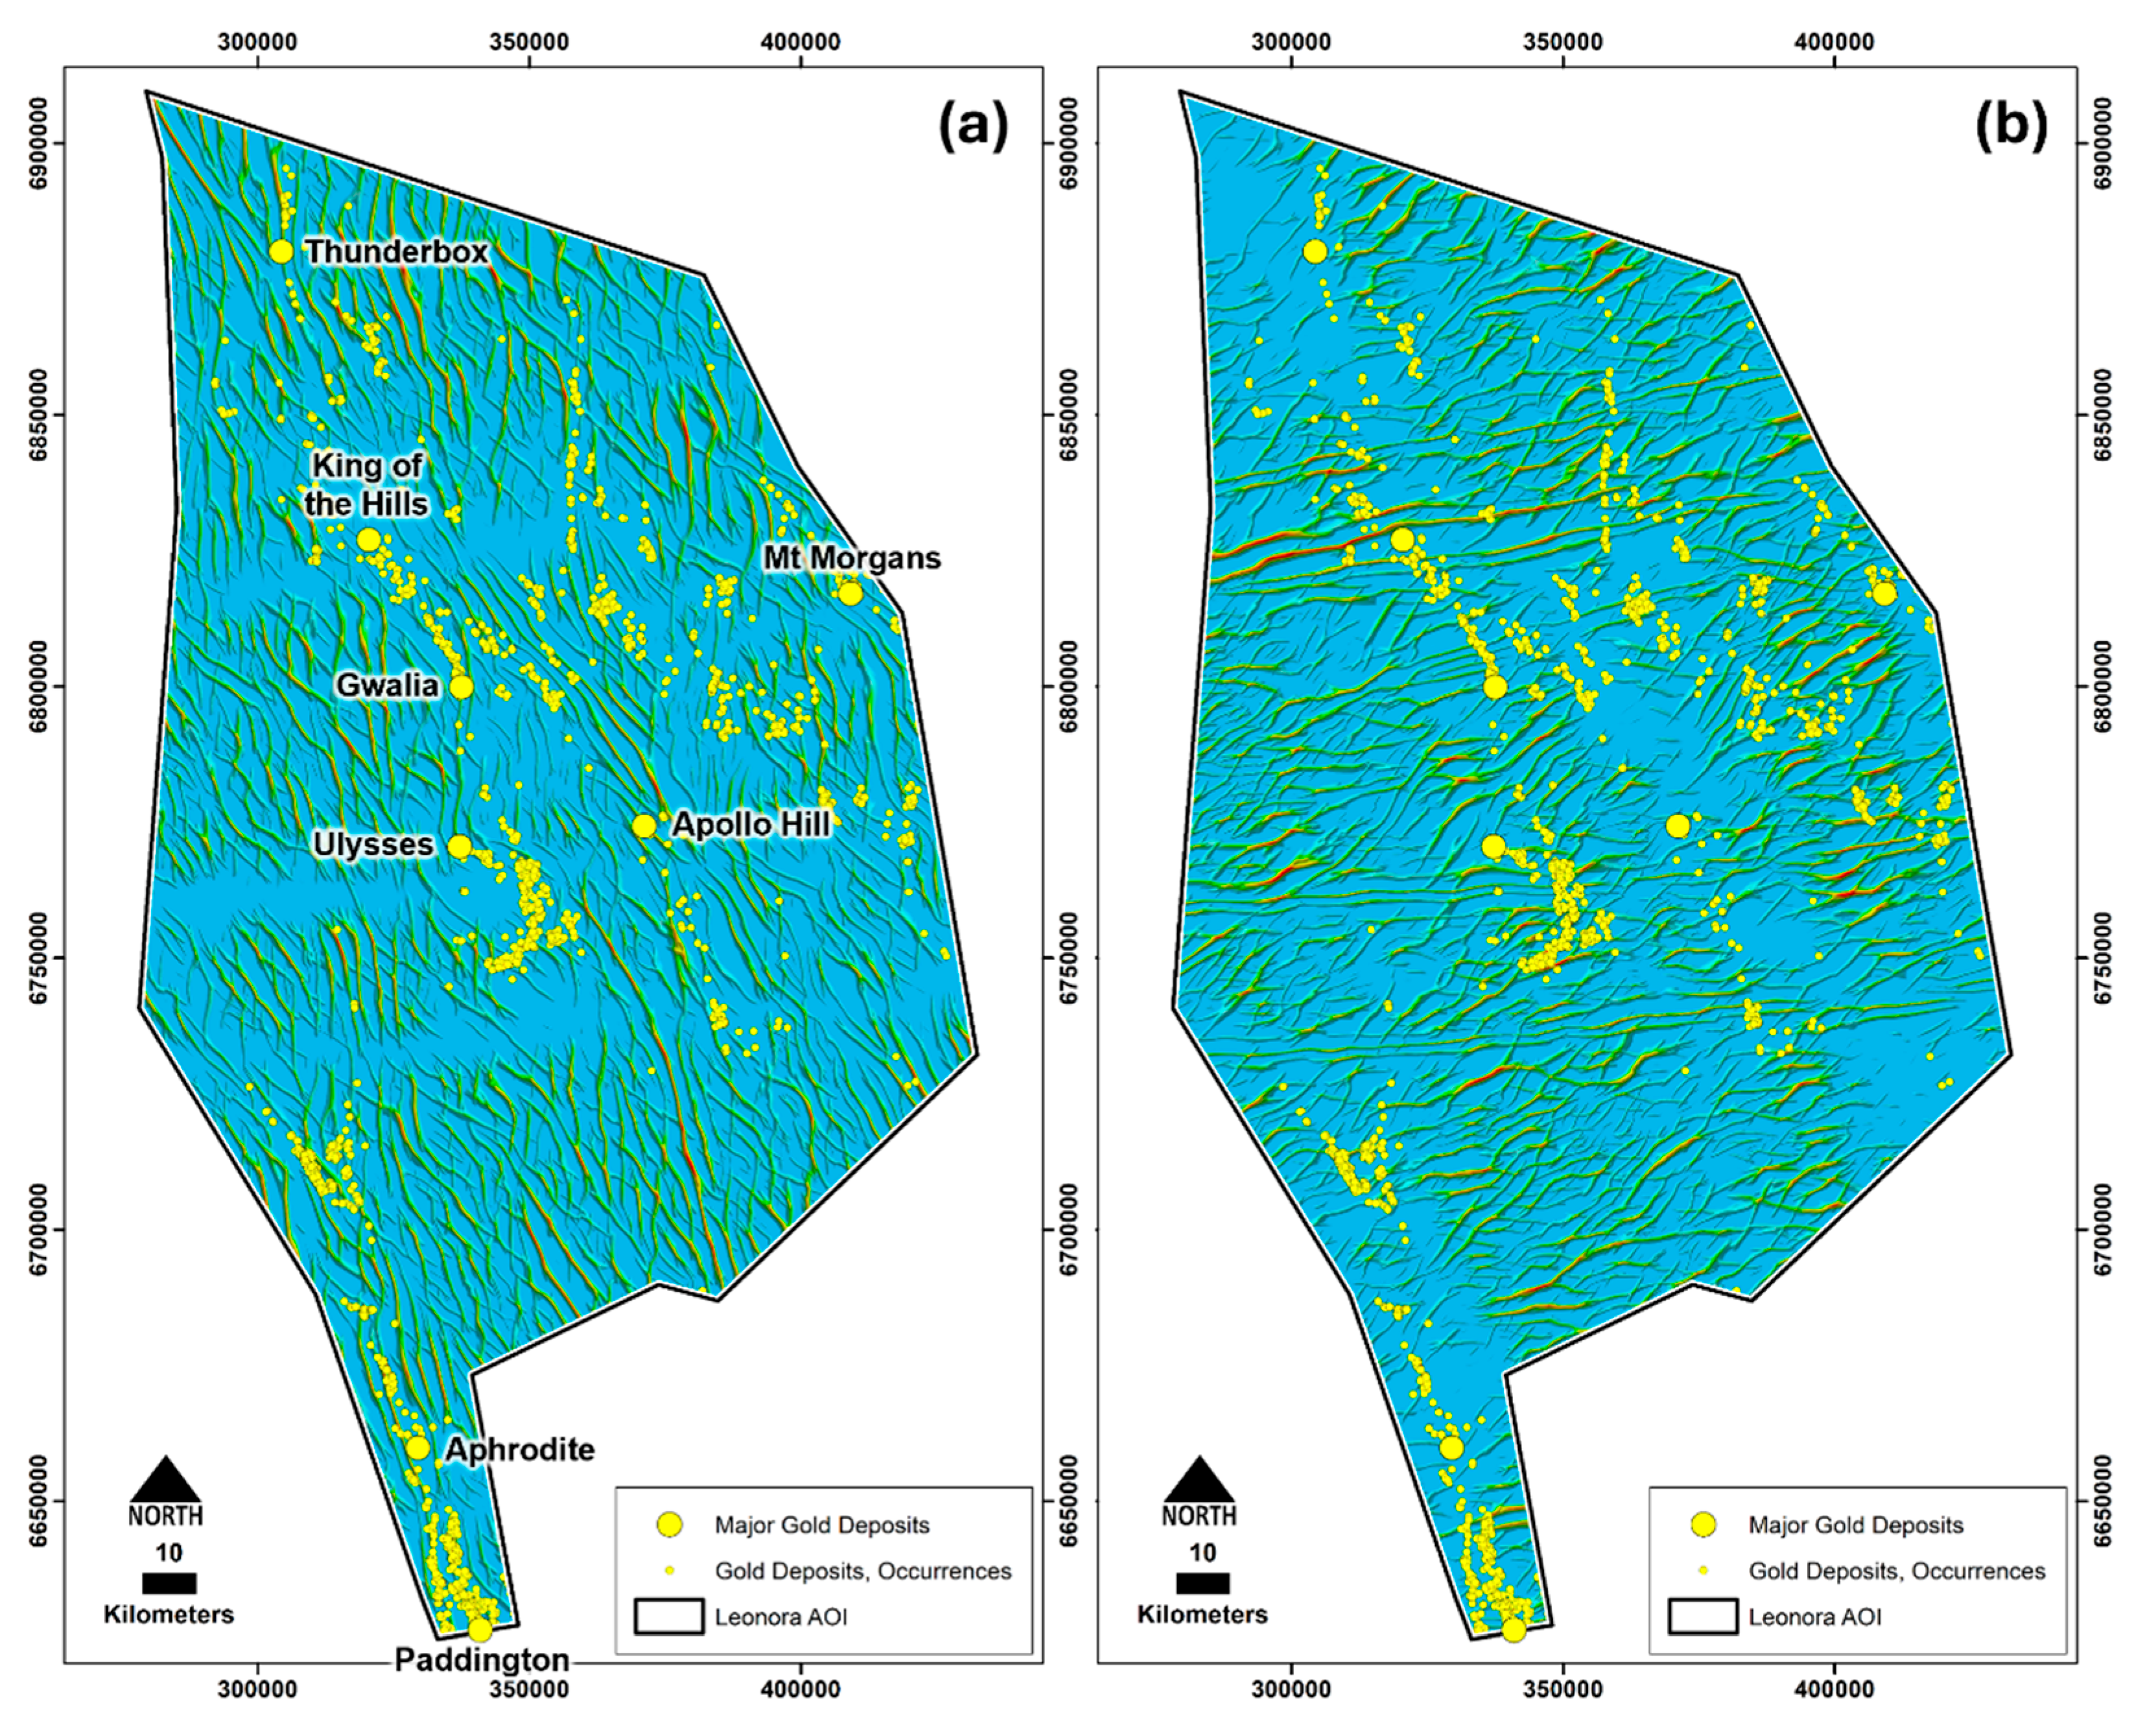
Figure 8.
Lithostructural (solid geology) interpretation. (a) Form lines. (b) First-and second-order fault systems. Names of first-order fault systems: 1 = Menzies-Boorara fault system (separates the Ora Banda and Boorara domains of the Kalgoorlie Terrane); 2 = Ockerburry-McClure-Perseverance fault system (separates the Kalgoorlie and Kurnalpi terranes); 3 = Melita-Emu fault system (separates the Gindalbie and Menangina domains of the Kurnalpi Terrane); 4 = Keith-Kilkenny fault system (separates the Menangina and Murrin domains of the Kurnalpi Terrane); 5 = Celia fault system(separates the Murrin and Edjudina/Laverton domains of the Kurnalpi Terrane).
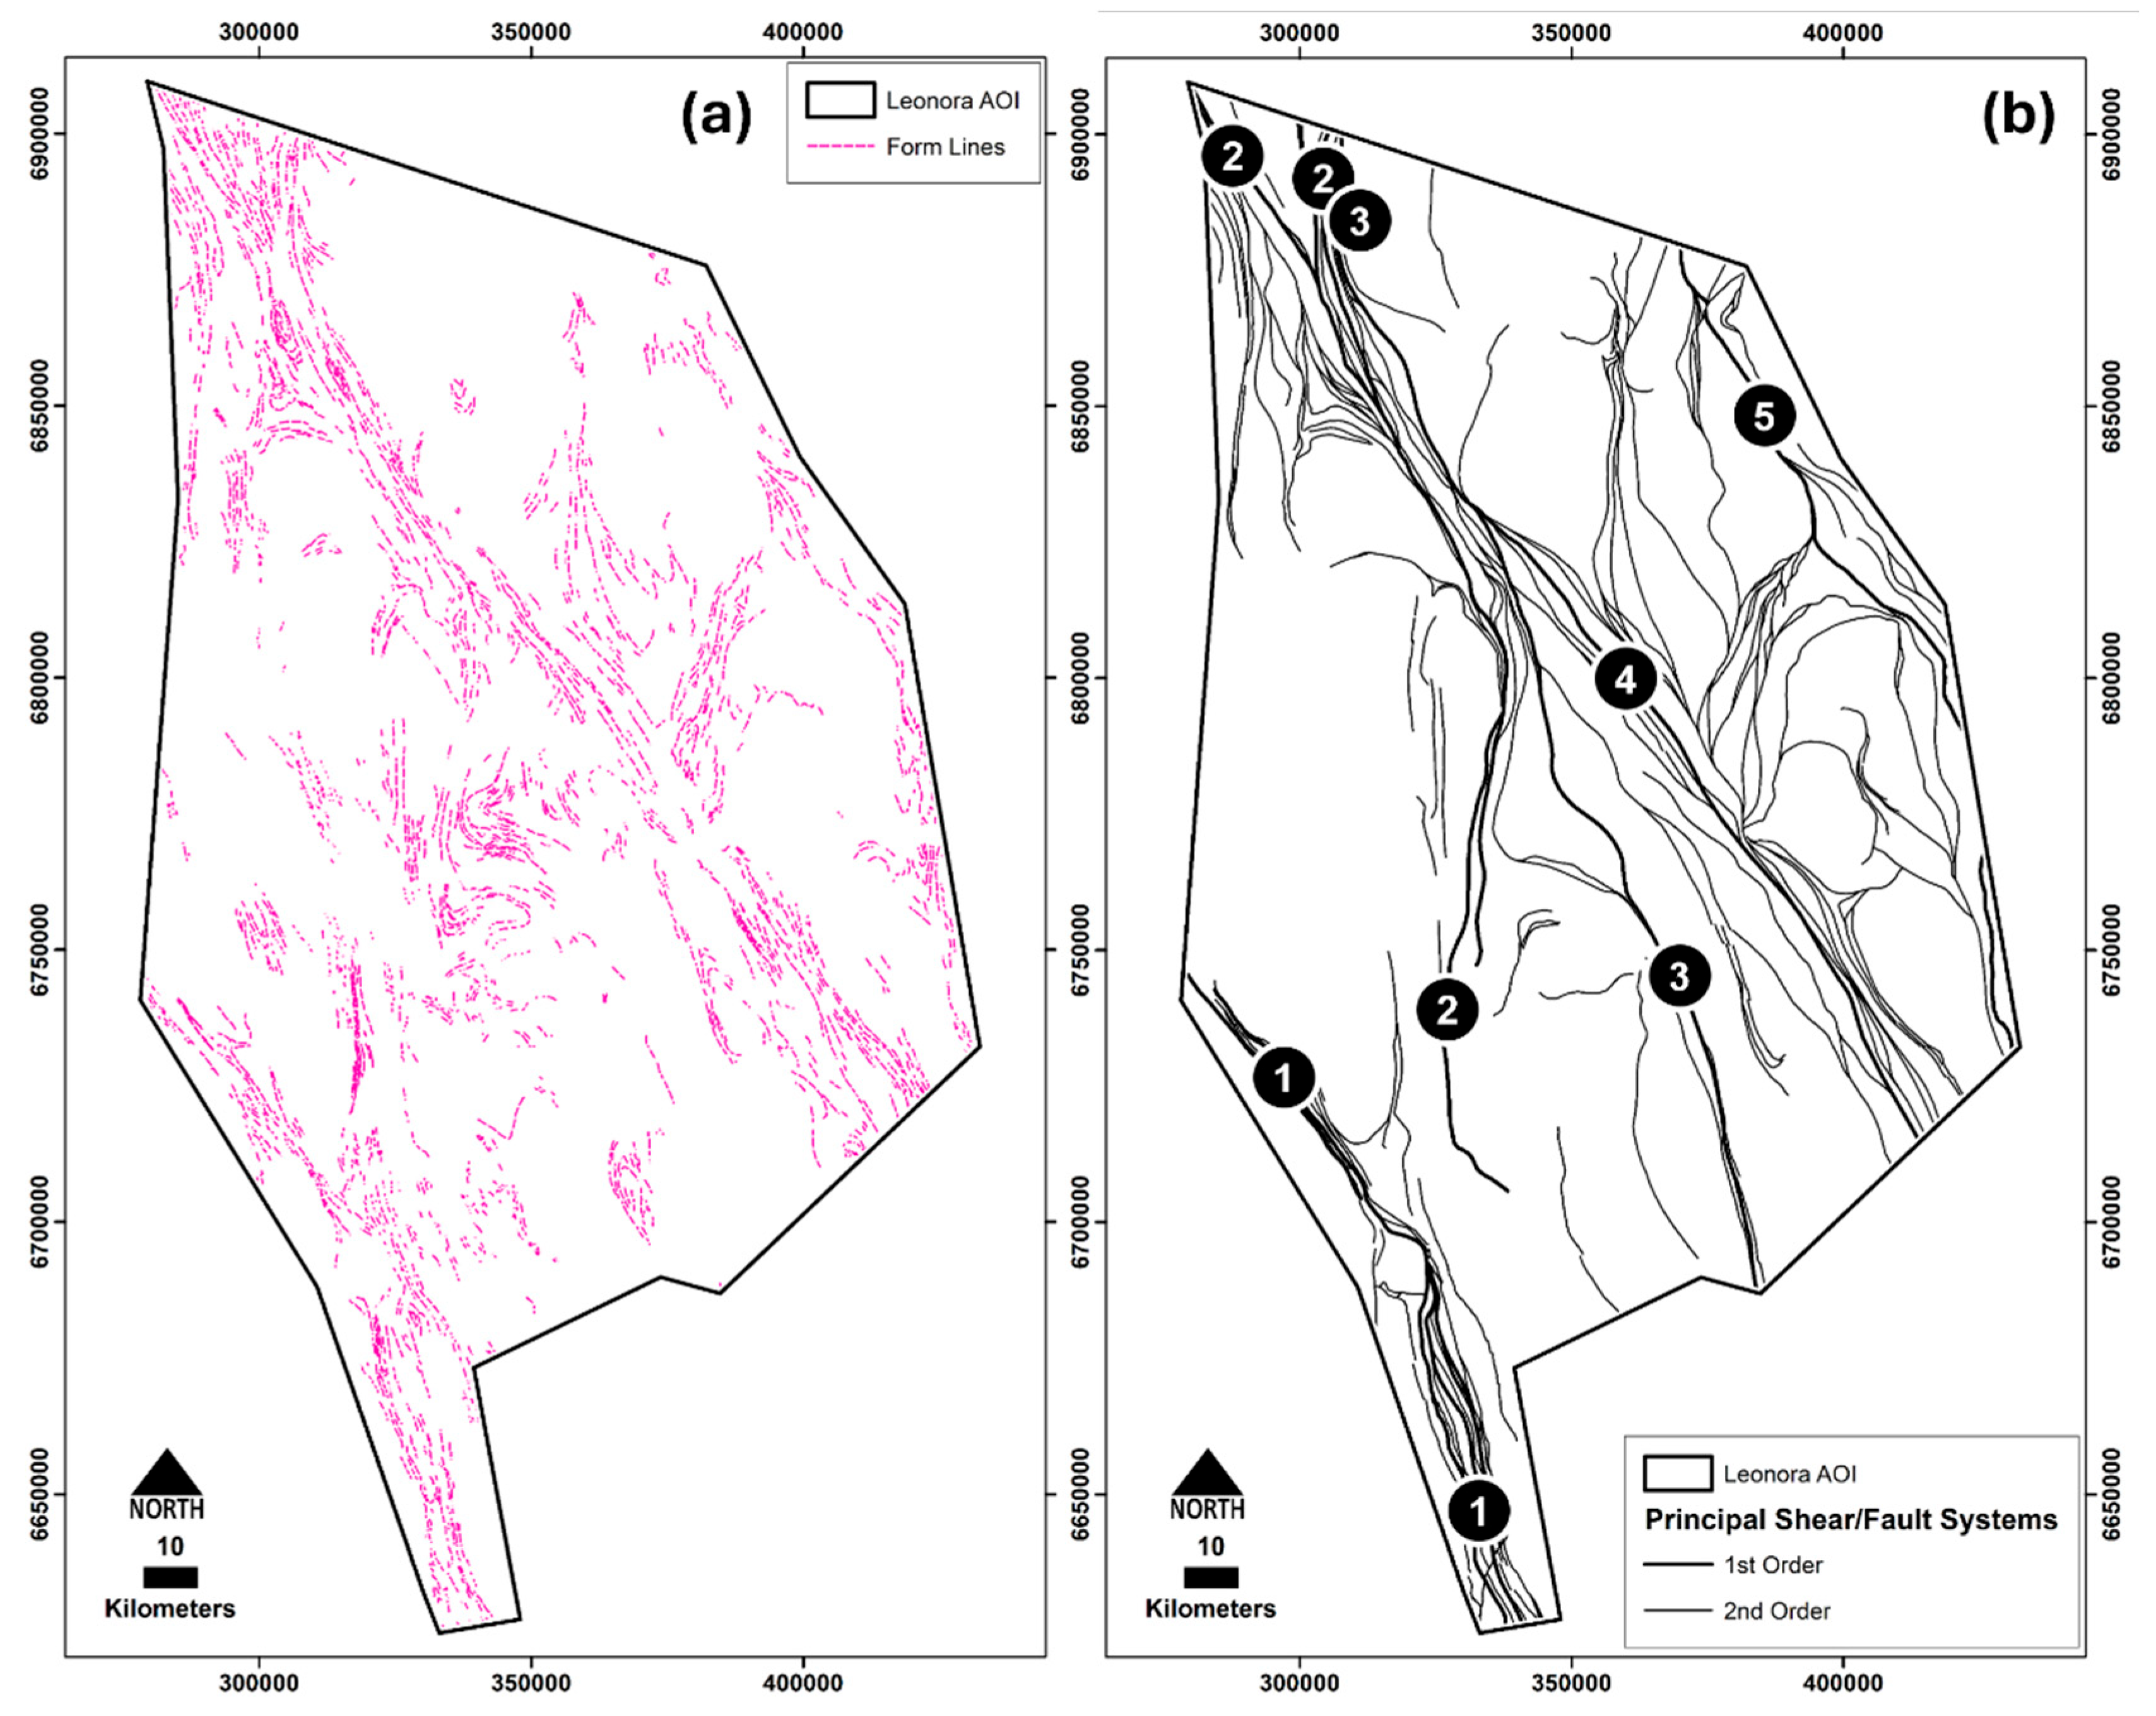
Figure 11.
Gold potential maps. (a) Fuzzy gamma. (b) Geometric average. (c) Improved index overlay. (d) BMW-SAW.
Figure 11.
Gold potential maps. (a) Fuzzy gamma. (b) Geometric average. (c) Improved index overlay. (d) BMW-SAW.
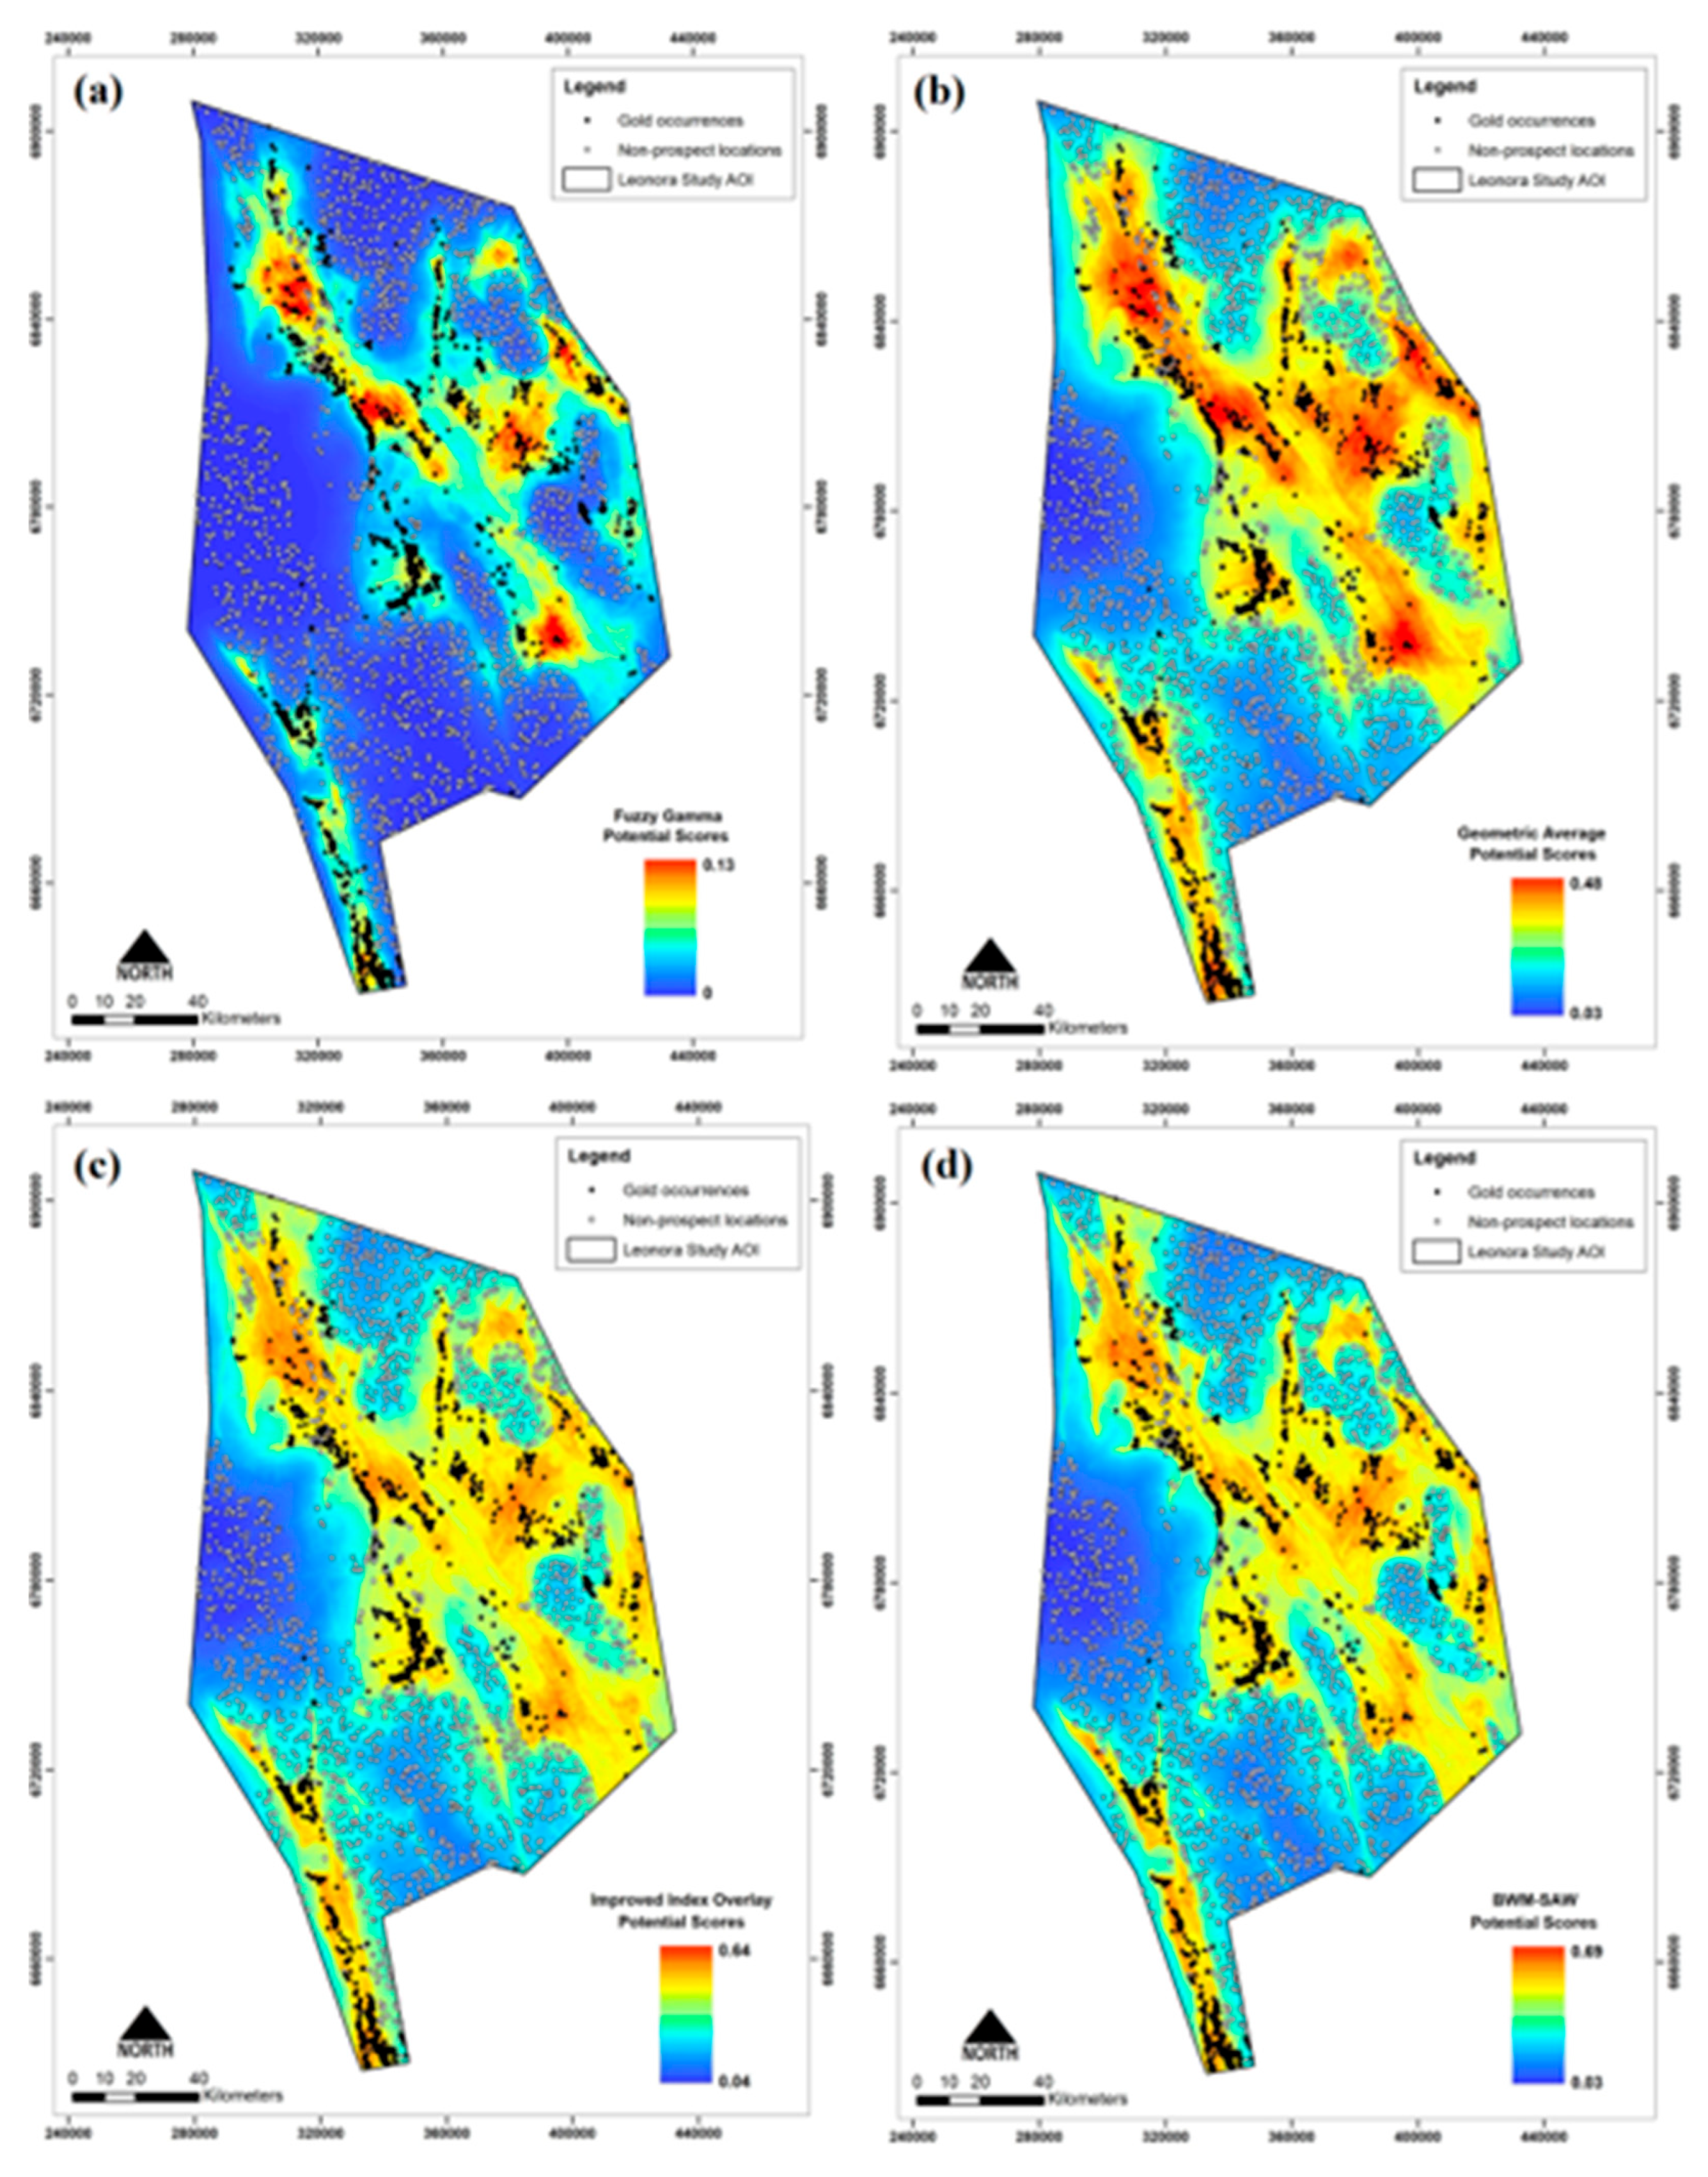
Figure 12.
Location of the Aphrodite gold deposit cluster within a ~5 km-wide, NE-SW-striking corridor defined by a series of fractures and low-displacement (typically <100 to 300 m faults with apparent dextral kinematics.
Figure 12.
Location of the Aphrodite gold deposit cluster within a ~5 km-wide, NE-SW-striking corridor defined by a series of fractures and low-displacement (typically <100 to 300 m faults with apparent dextral kinematics.
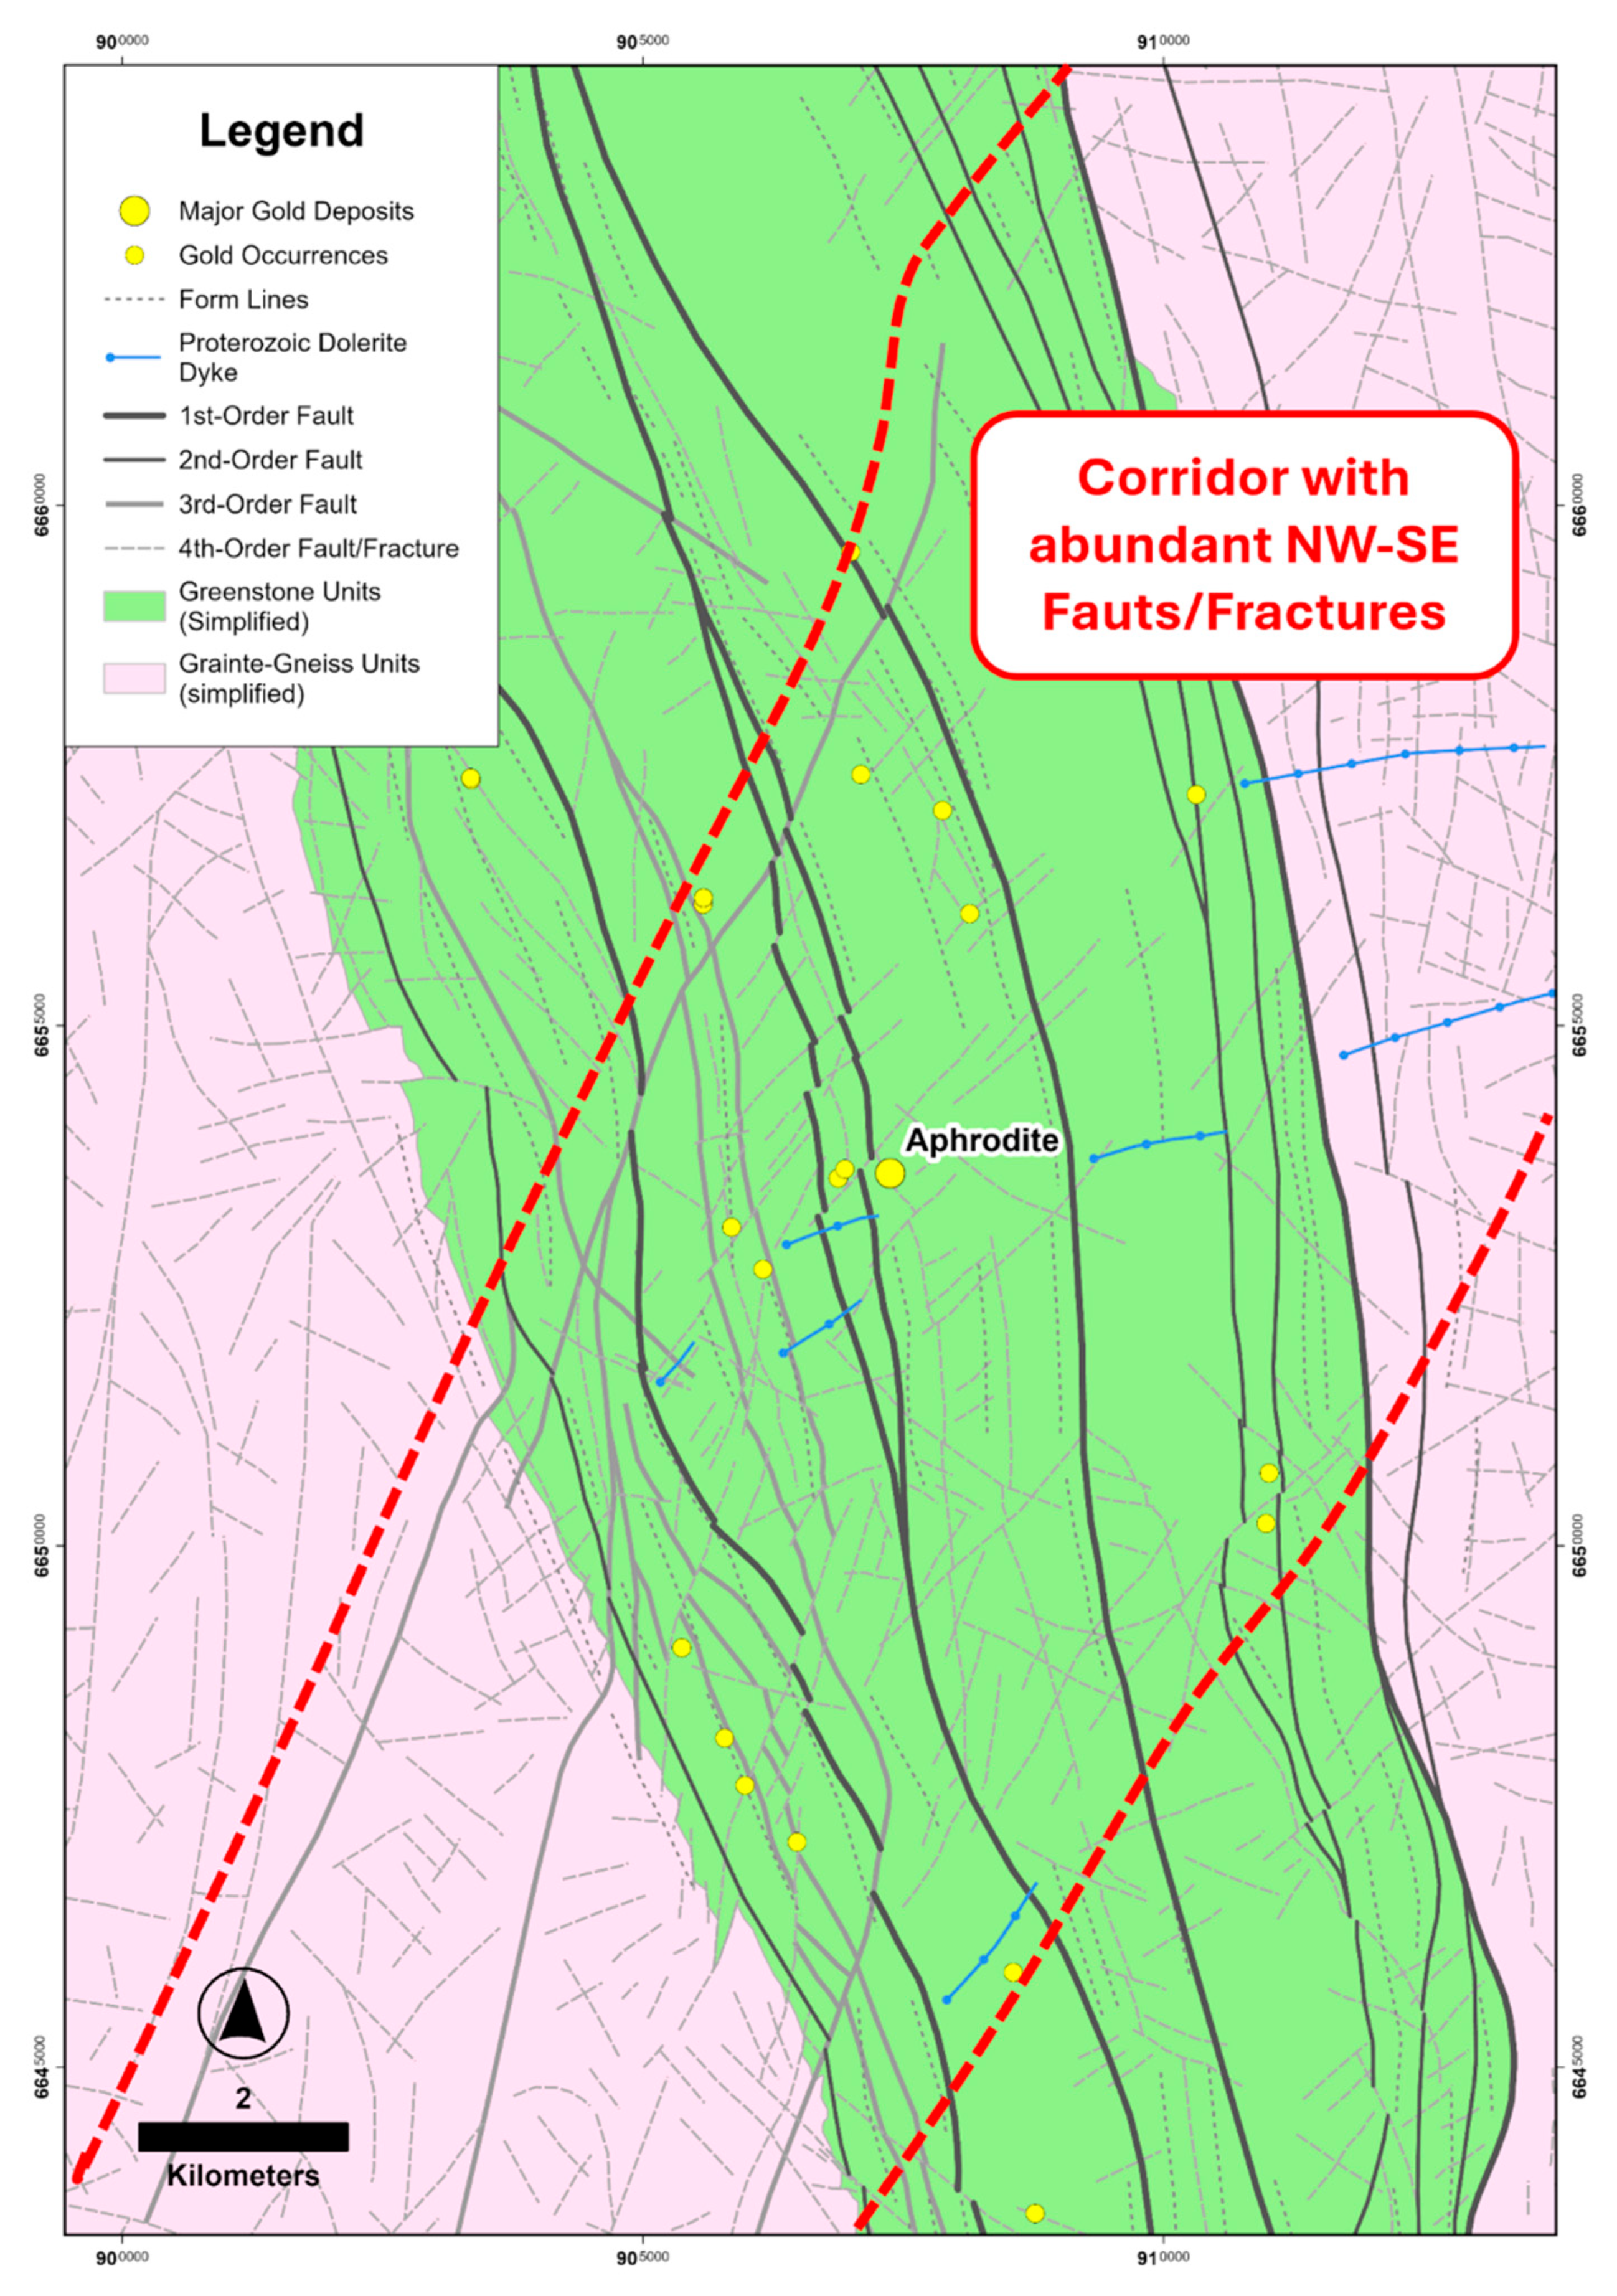
Figure 13.
Alternative random forest (RF) gold prospectivity models generated to test model sensitivity and performance with regards to certain predictor maps. (a) Alternative RF Model 1 excludes the following predictors: Proximity to known gold deposits, greenstone rocks, remotely sensed alteration systems, fold hinges, flanks of granitoids, and domains of high K/Th values. (b) Alternative RF Model 2 excludes the following predictors: Proximity to known gold deposits, greenstone rocks and flanks of granitoids. Overall performance (Op) values of these alternative RF models are similar to, and in the case of the RF 2 model better than, the Op of the original RF model. See text for details.
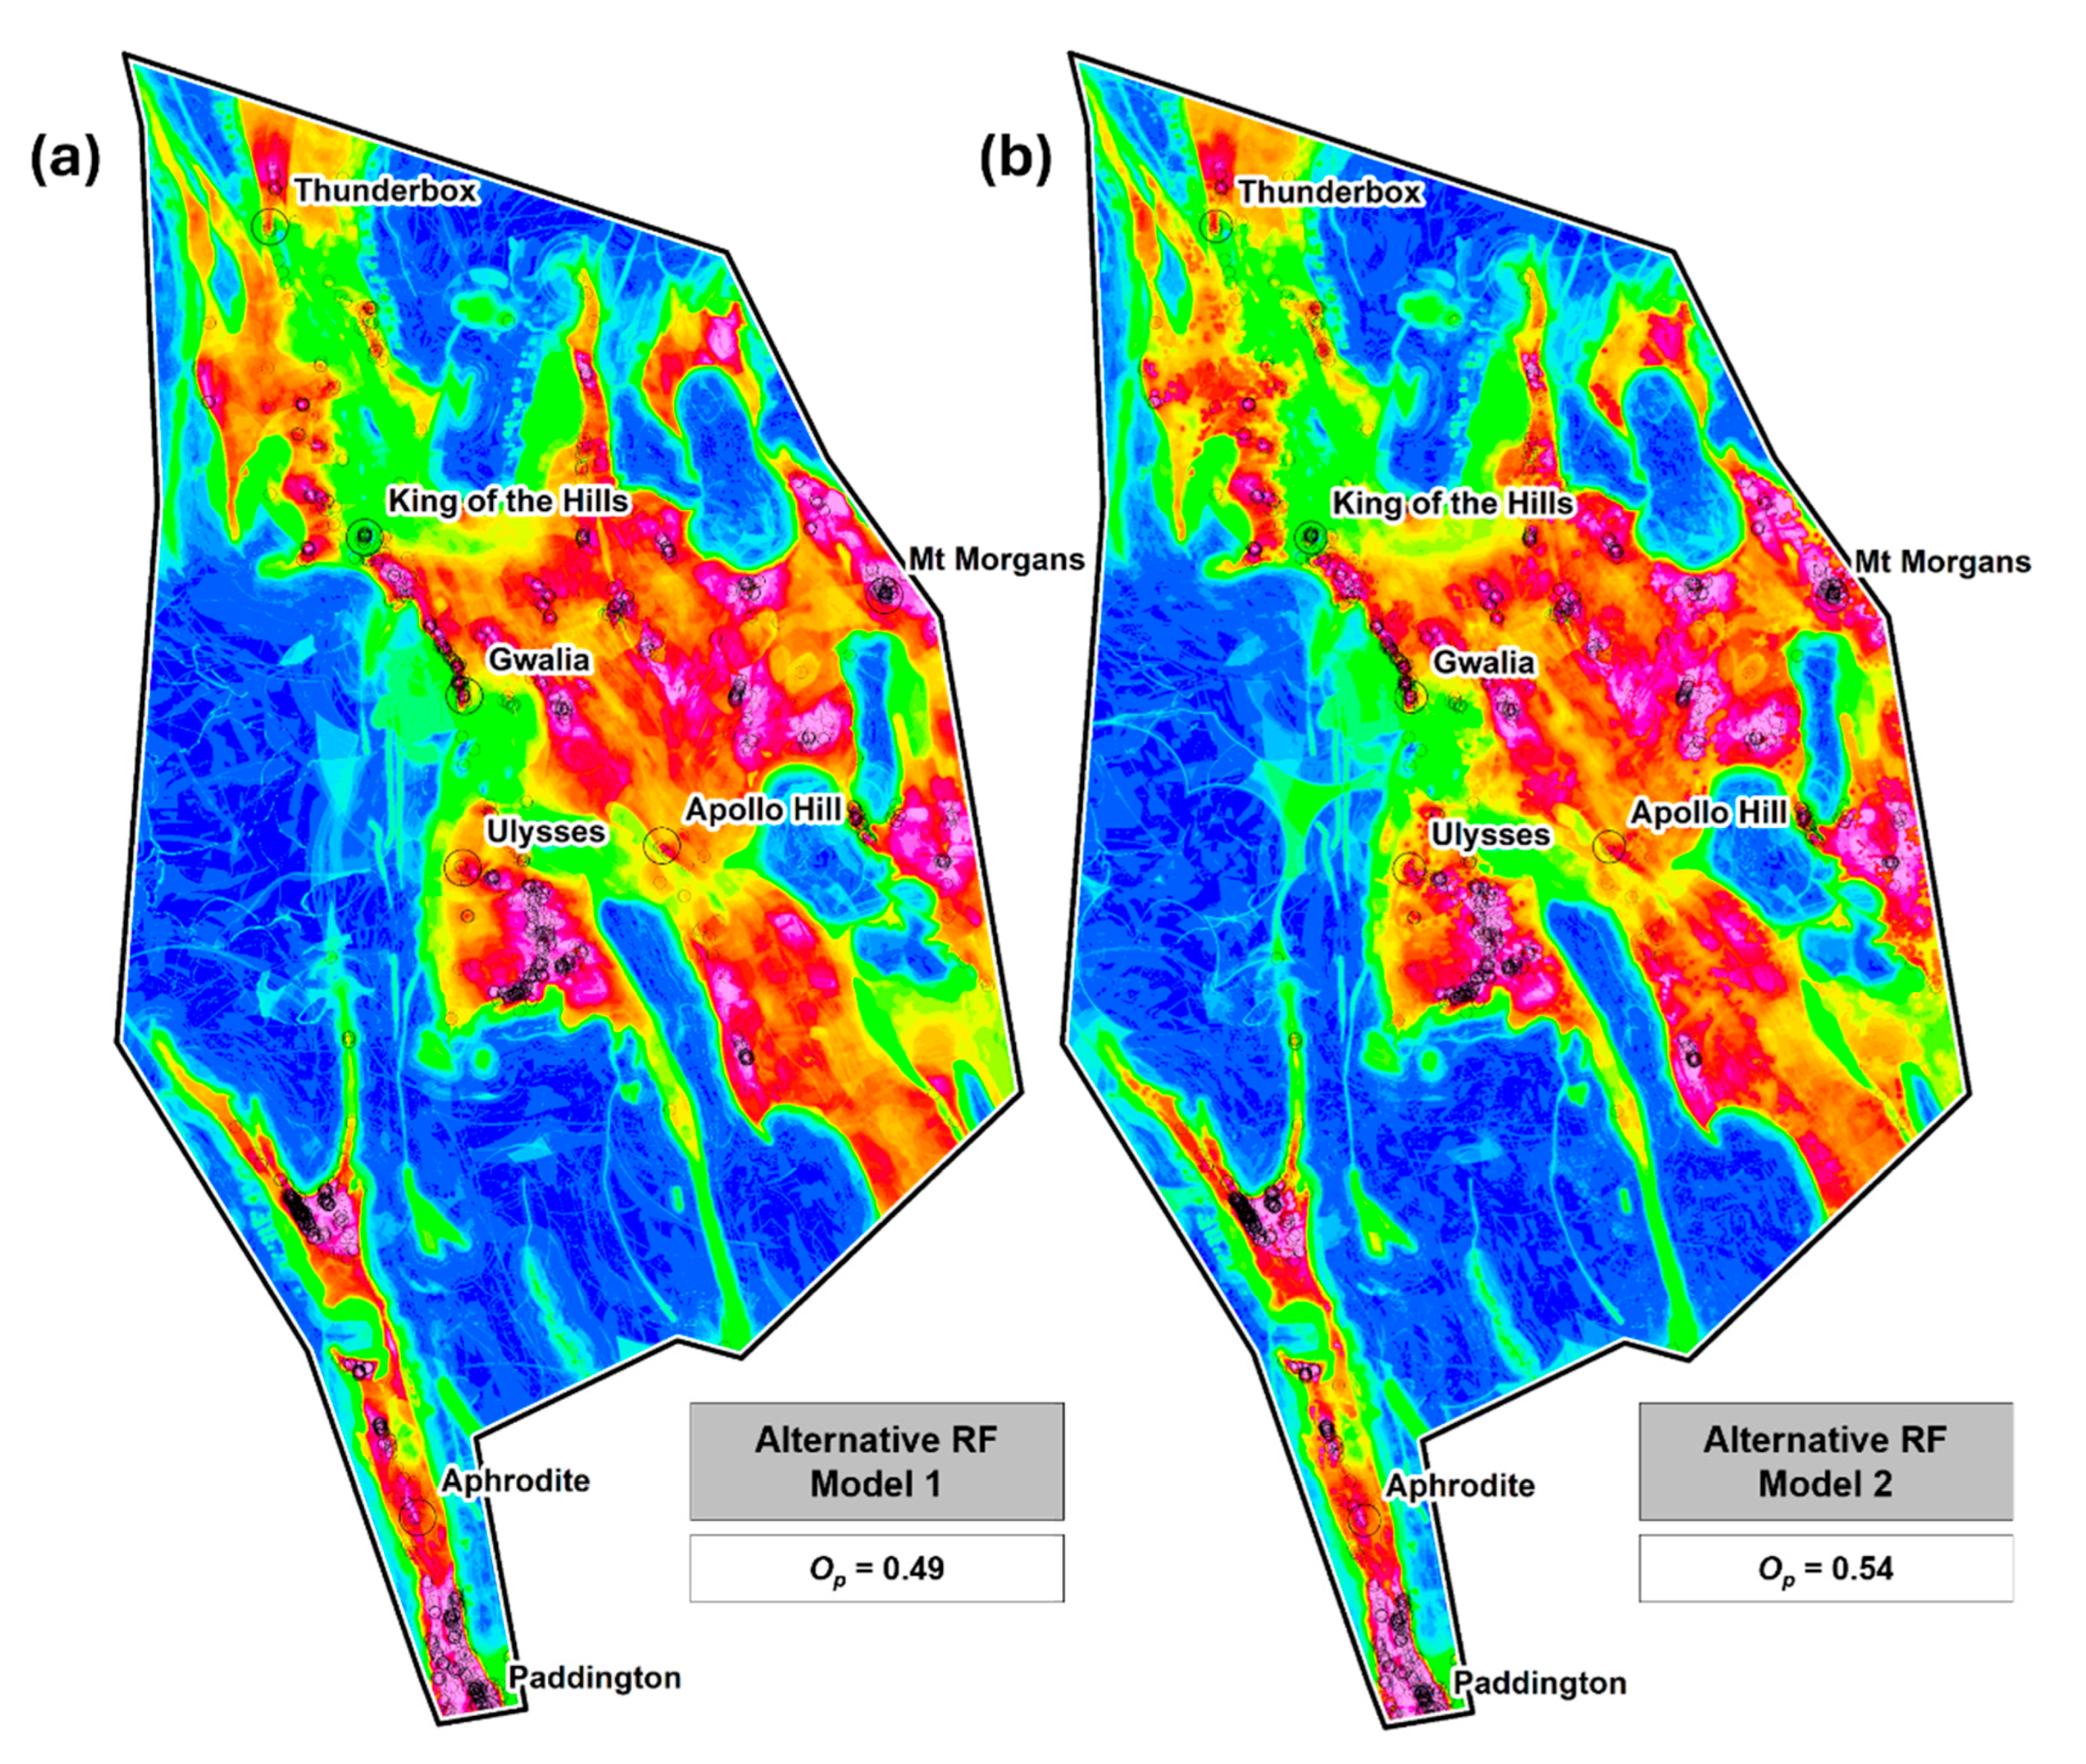
Figure 14.
Map of prioritized MPM target areas, also showing the main gold deposits within the study area. Zoomed images provide a more detailed view of selected areas.
Figure 14.
Map of prioritized MPM target areas, also showing the main gold deposits within the study area. Zoomed images provide a more detailed view of selected areas.
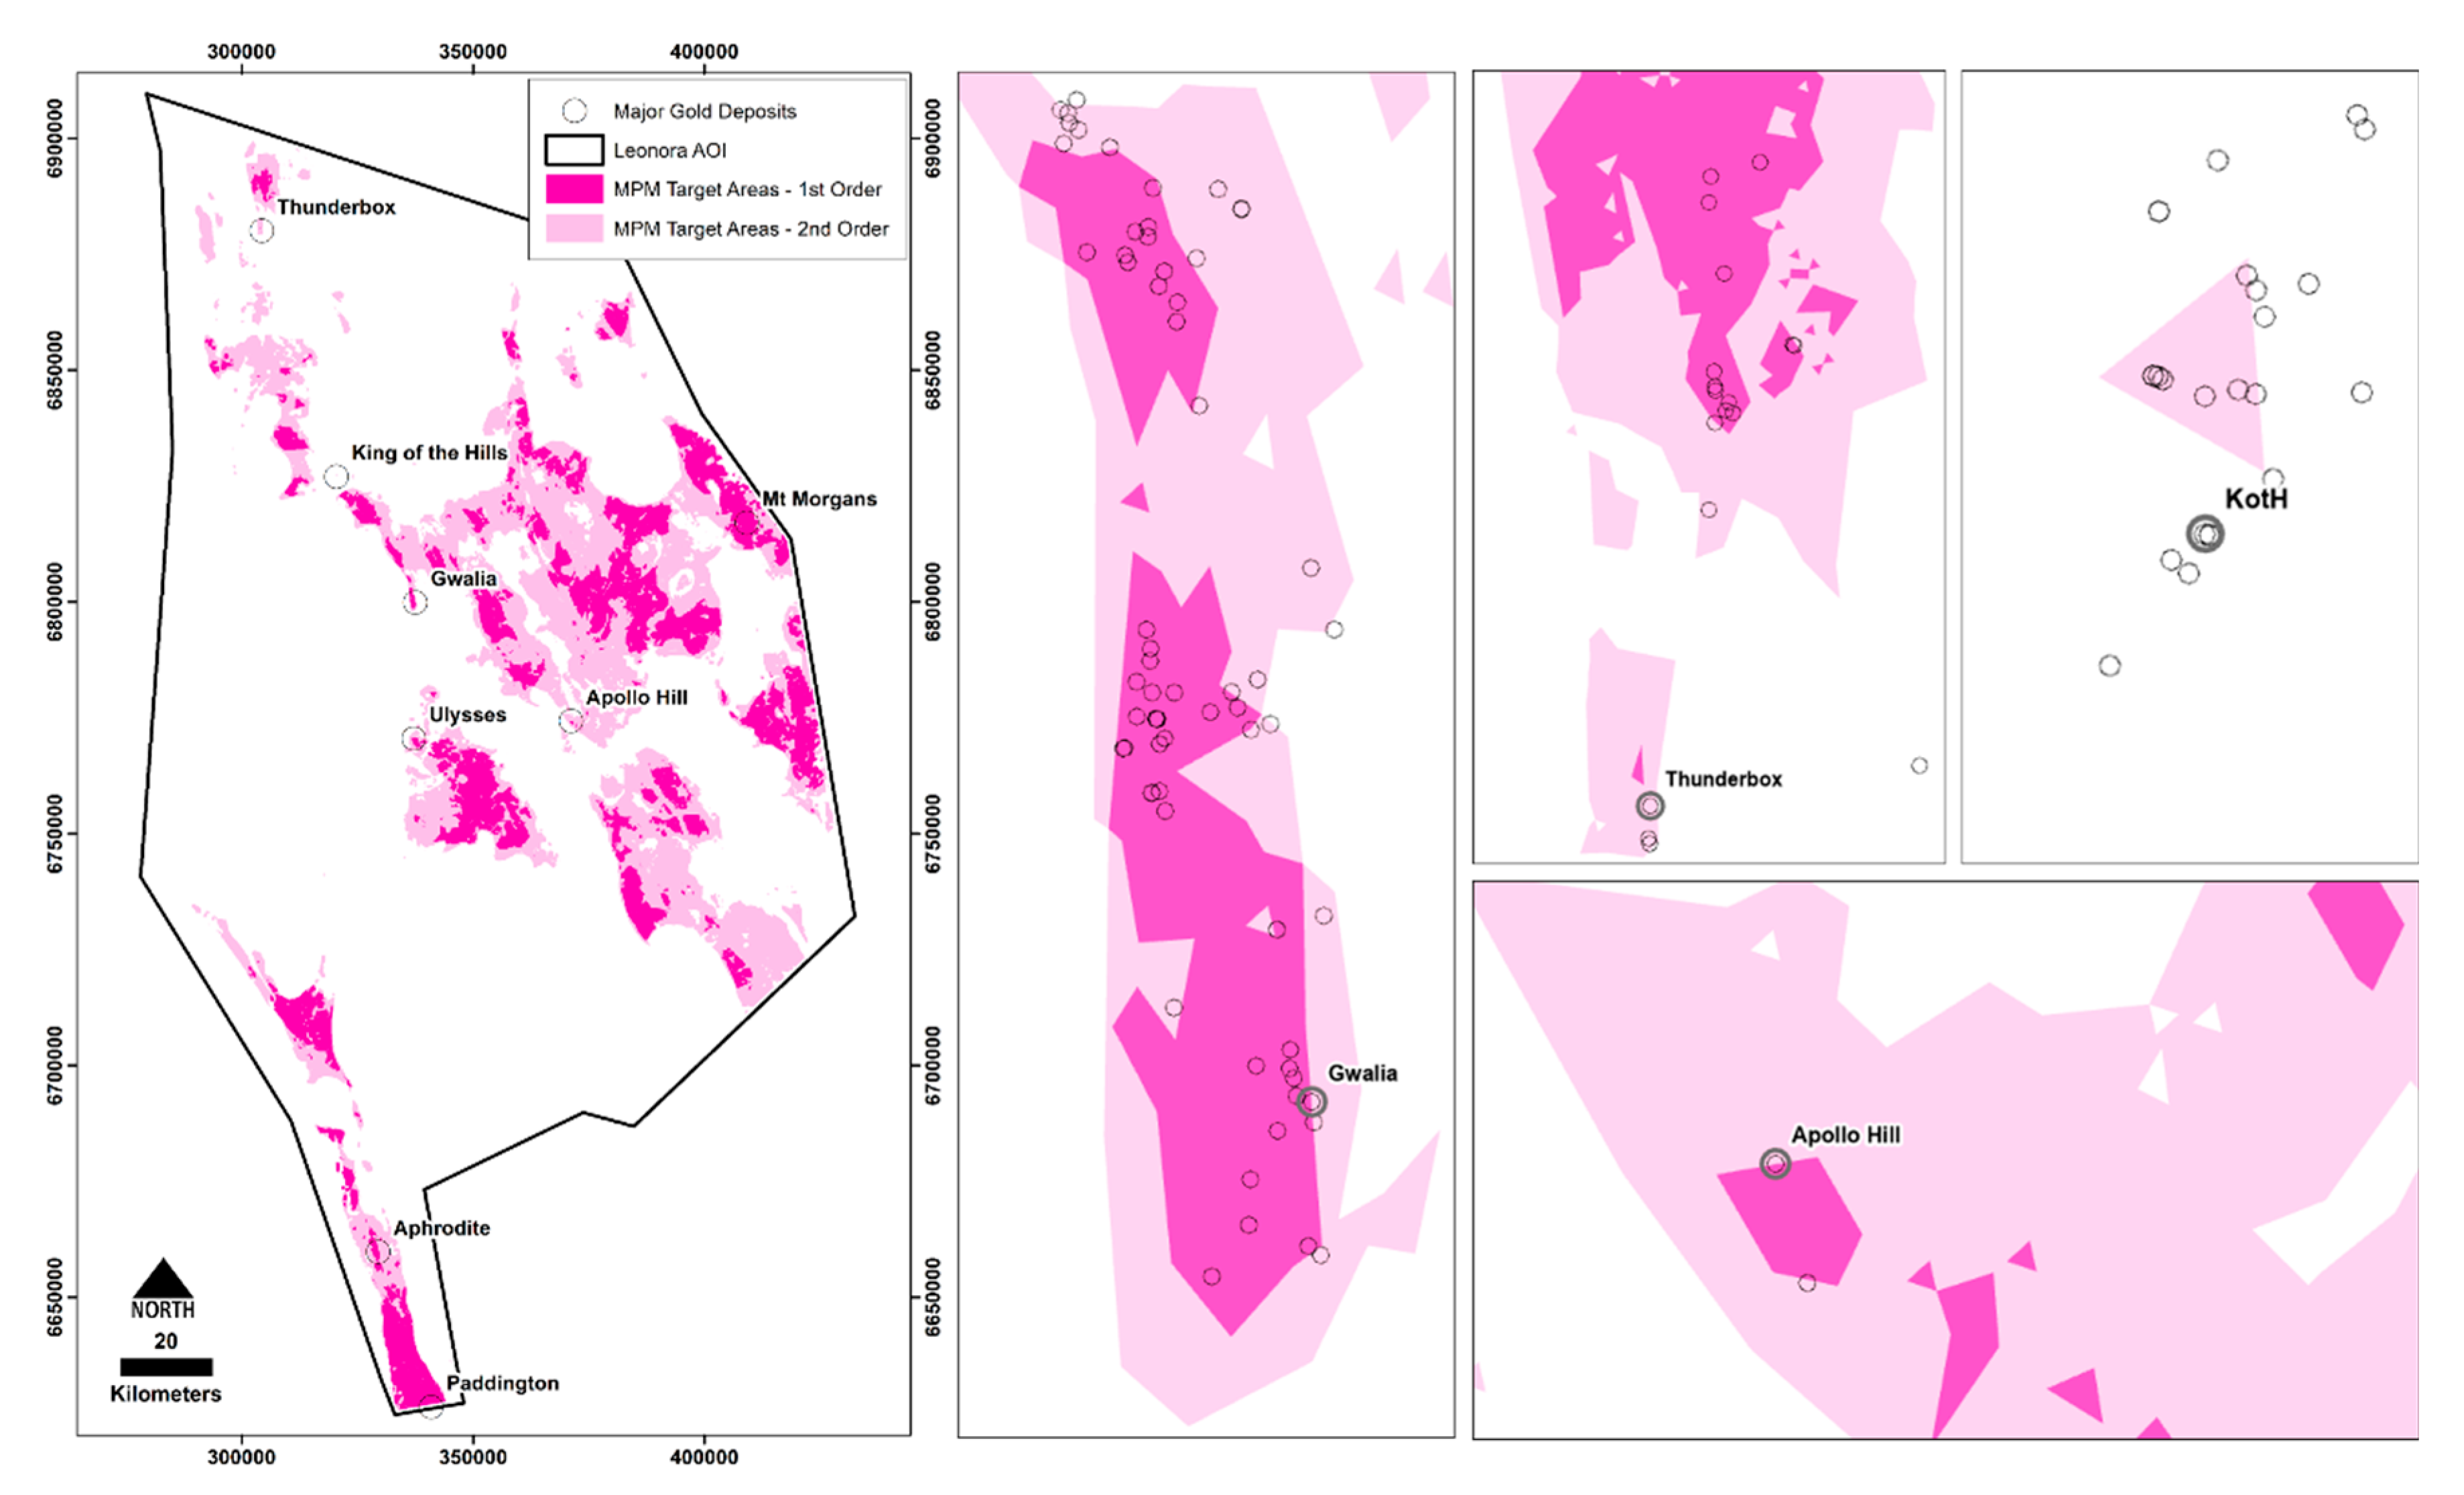
Figure 15.
Prioritized MPM target areas (a) overlain with all open-file drill holes (b) and reverse circulation (RC) and diamond core (DD) holes ≥100 m hole length. Map (c) illustrates how many of the high priority areas are poorly or untested by bedrock drilling, in particular below vertical depths of ~90 to 100 m, or more.

Figure 16.
‘Manual targets’ generated from prioritized MPM target areas. Target descriptions are given in Table 9.
Figure 16.
‘Manual targets’ generated from prioritized MPM target areas. Target descriptions are given in Table 9.
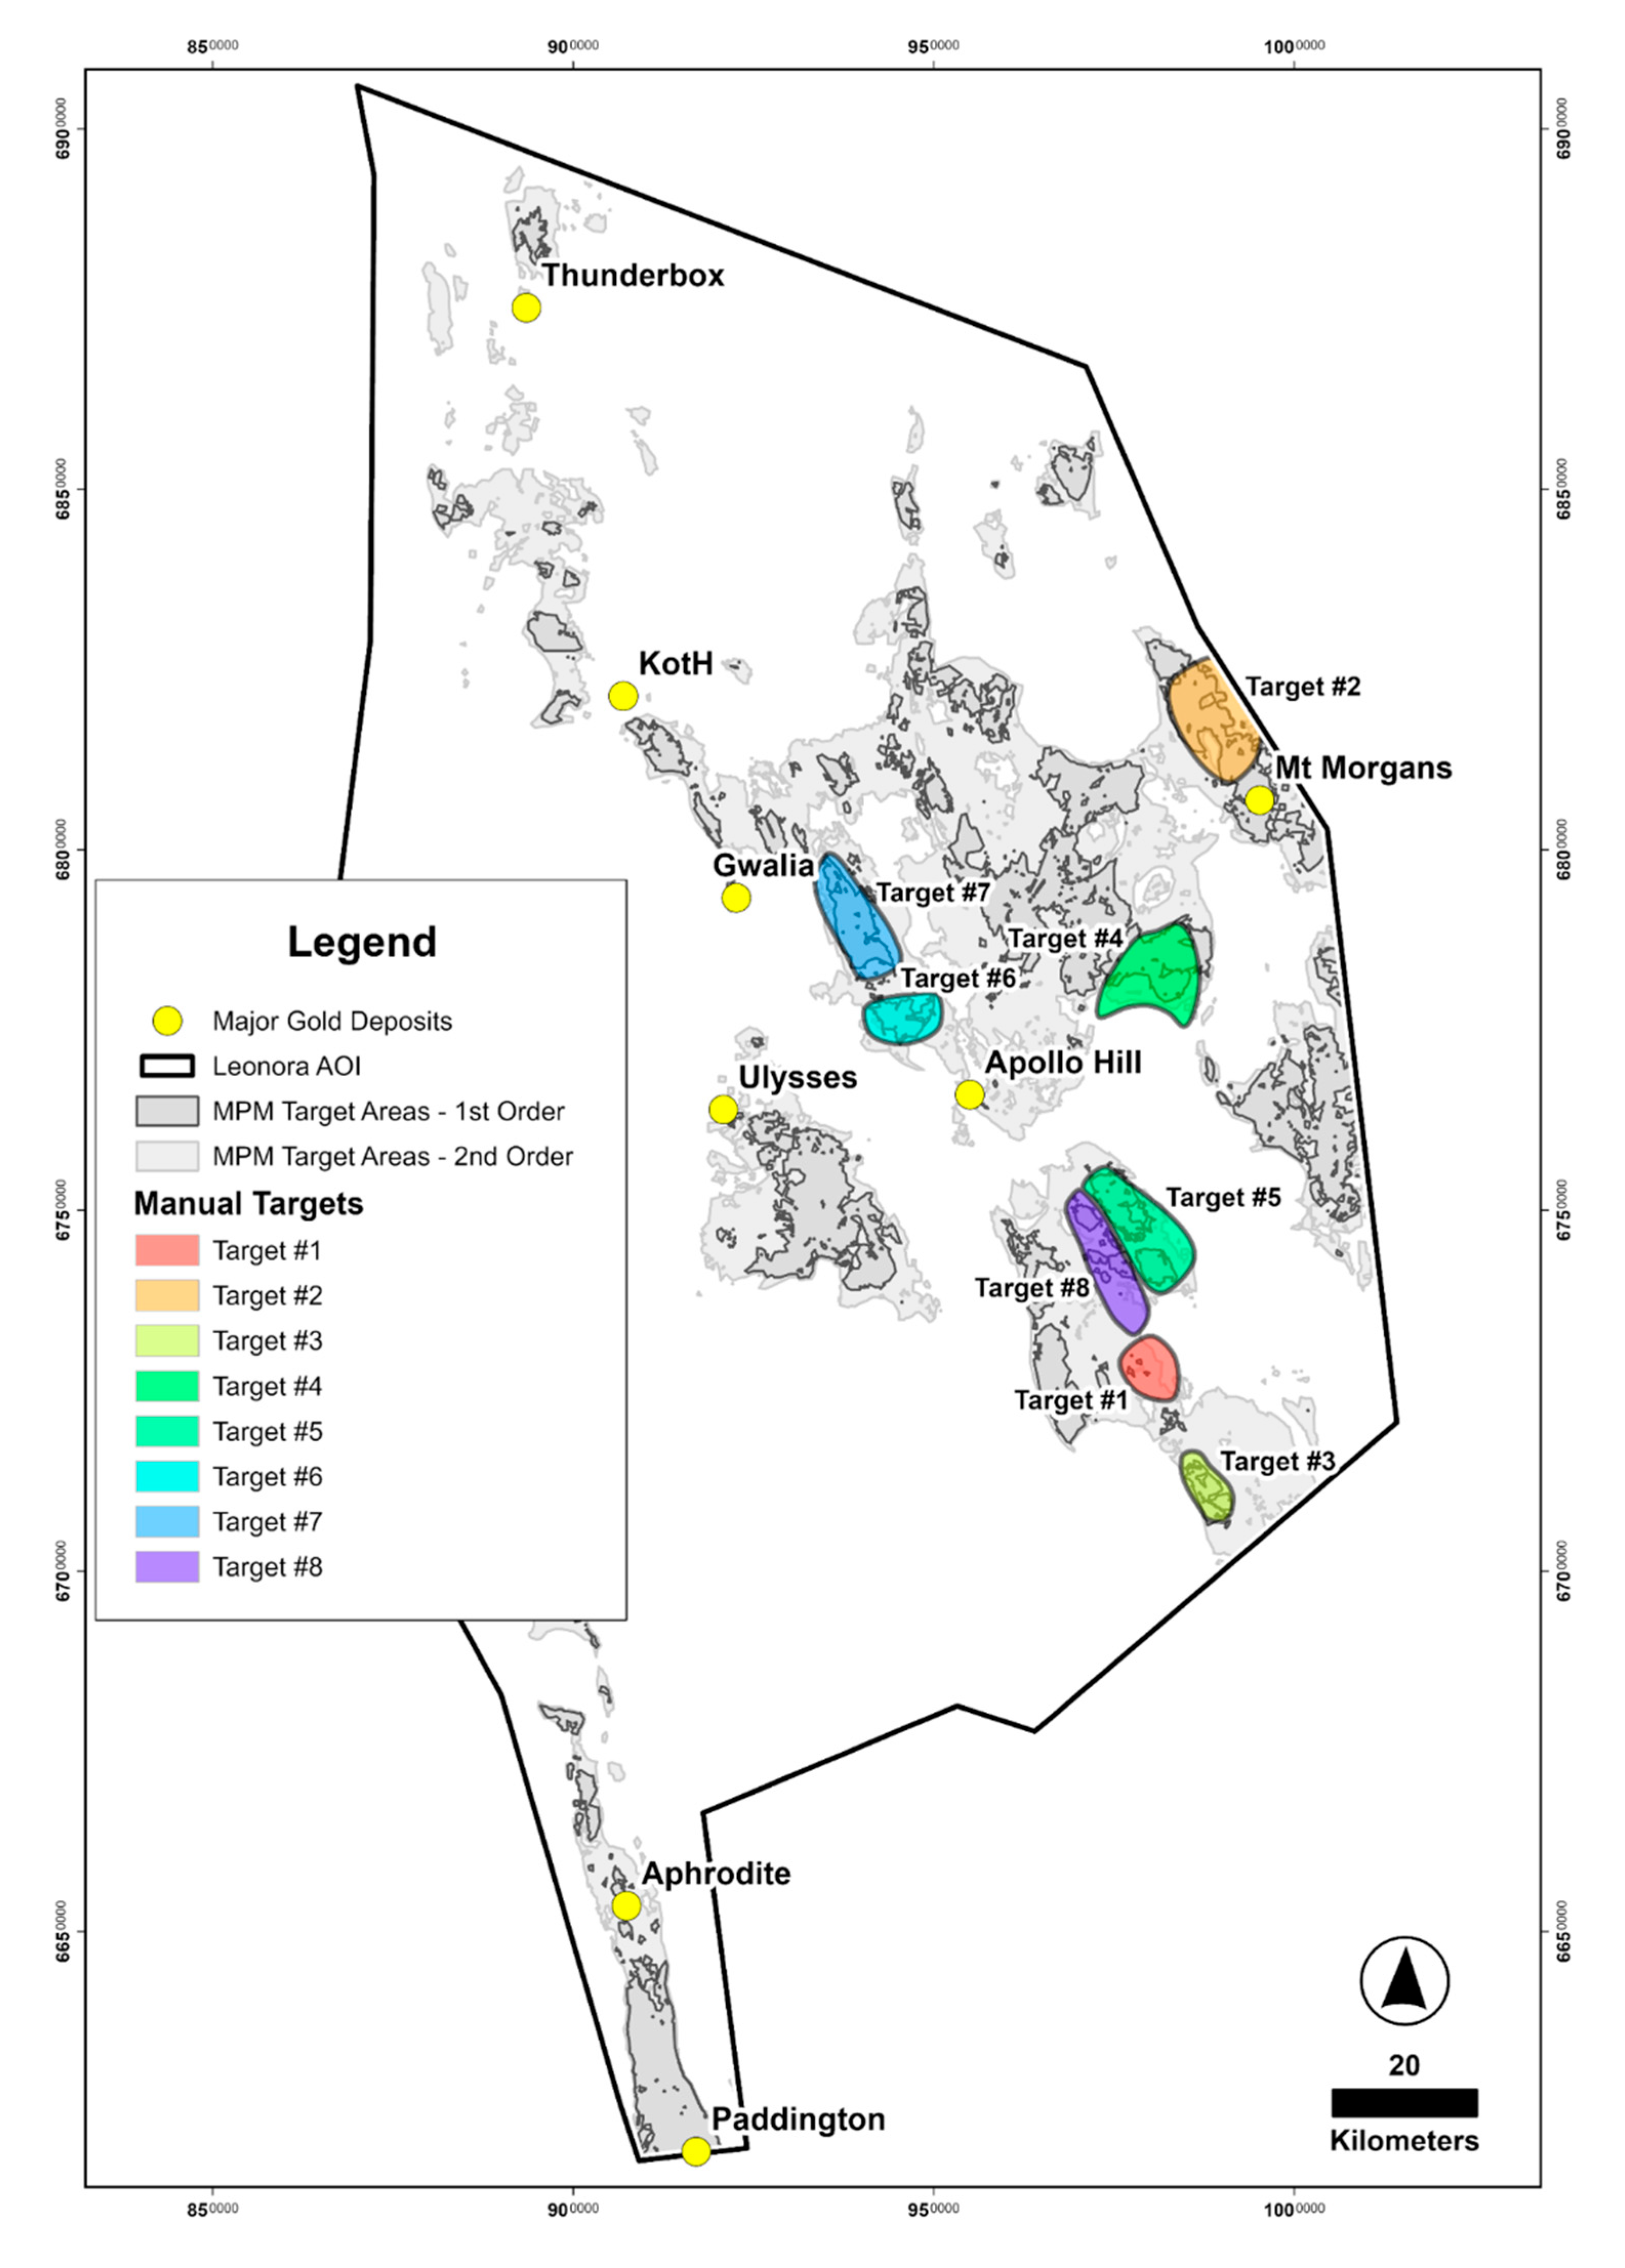

Table 1.
Data types and sources.
| Category | Data Type/Name | Source | Comments |
| Gold occurrences | Mines and mineral deposits (MINEDEX) | GSWA | Data available from DEMIRS Data and Software Centre: https://dasc.dmirs.wa.gov.au/ |
| MINEDEX operating mines map | |||
| Geology | 1:100,000 state interpreted bedrock geology of Western Australia | ||
| 1:500,000 interpreted bedrock geology of Western Australia | |||
| 1:100,000 geological series maps | |||
| 1:500,000 state regolith geology | |||
| In-house Eastern Yilgarn Craton geology map | SBM | Confidential dataset | |
| pmd*CRC 1:100,000 solid geology map, eastern Yilgarn Craton | [15] | Data or data links provided in quoted references | |
| Yilgarn Craton metamorphic facies map | [11,32] | ||
| Geochemistry | Yilgarn Craton εNd (juvenile crust) map | [33] | |
| Drilling | Mineral exploration drill holes (open file) | GSWA | Confidential dataset |
| Leonora drill hole database | SBM | https://dasc.dmirs.wa.gov.au/ | |
| Geophysics | 400 m Bouguer gravity merged grid of Western Australia 2020 version 1 | GSWA | Data available from MAGIX Online: https://geodownloads.dmp.wa.gov.au/downloads/geophysics/72203/, …/72204/ and …/72205/ |
| 40 m reduced to the pole (RTP) magnetic merged grid of Western Australia 2021 version 1 | |||
| Radiometric grids (80 m) of Western Australia | |||
| Remote Sensing | ALOS World 3D - 30 m (AW3D30) ALOS Global Digital Surface Model |
OpenTopography | Data available from https://opentopography.org/ |
| Sentinel-2 (blue, green, red and near-infrared (NIR) bands at 10 m and other bands at 20 m resolution) | European Space Agency |
Data available from https://dataspace.copernicus.eu |
Key to abbreviations: DEMIRS = Department of Energy, Mines, Industry Regulation and Safety; GSWA = Geological Survey of Western Australia; pmd*CRC = Predictive Mineral Discovery Cooperative Research Centre; SBM = St Barbara Limited.
Table 2.
Main gold deposits in the study area*.
|
Deposit Name |
Discovery (Year) |
Endowment (Moz Au) |
Absolute Age (Ma) | Geology & Mineralization |
| Paddington | 1894 | >11.7 | Unk | Principal host rock(s): granophyric qtz-dolerite (greenschist facies); Mineralization style(s): closely-spaced, 1 to 5 cm-wide, subhorizontal, sheeted gold and sulphide (apy > py, sp > gn)-bearing qtz-dol-ank-ab veins, and a 3 m-wide, steeply-dipping, laminated, gold- and sulfide (apy > py, ccp, gn > sp)-bearing qtz-cb vein; Alteration type(s): carbonatization, chloritization, sericitization, silicification, sulfidation (apy, py, po); Metal association: Note reported (Au-As?); Ore control(s): D2 kinematics and associated brittle-ductile structures; interaction of key structural elements (synclinal fold structure, location along the crustal-scale Bardoc Tectonic Zone), strong competency contrast between dolerite and surrounding ultramafic and sedimentary rocks |
| Gwalia | 1896 | >8.2 | 2755 | Principal host rock(s): mafic schist, basalt (± pillowed) (lower amphibolite facies); Mineralization style(s): variably deformed, millimeter- to meter-scale, laminated and typically tightly folded and boudinaged gold- and sulphide (py, po > ccp)-bearing qtz-cb veins; Alteration type(s): carbonatization, biotitization, sericitization, silicification, sulfidation (py); Metal association: Not reported; Ore control(s): D2 kinematics and associated ductile structures, interaction of key structural elements (mylonite zone, fold hinge of a large M-shaped fold, Poker/Gwalia Fault, bulge of the Raeside Batholith, proximity to crustal-scale Keith-Kilkenny fault system) |
| Mt Morgans | 1896 | >5.0 | 2650-2630 | Principal host rock(s): banded iron formation (BIF) (greenschist facies); Mineralization style(s): structurally controlled, disseminated gold-sulfide (py > ccp) in BIF and along the margins of qtz-cb veins; Alteration type(s): silicification, carbonatization, sulfidation (py > po, ccp, sp); Metal association: Not reported; Ore control(s): D4/5 kinematics and brittle(-ductile) structures, interaction of key structural elements (fault intersections, fold hinges developed on overturned anticlinal fold structure, dilational jog, proximity to crustal-scale Celia fault system), chemically reactive rock type (mag replacement by sulfides) |
| Tarmoola/King of the Hills | 1897 | >4.4 | 2650-2630 | Principal host rock(s): trondhjemite, komatiite (greenschist facies); Mineralization style(s): sets of conjugate, 20 cm to 2 m-wide, gold-, telluride-, sulfide (py, ccp, sp, gn)- and ± scheelite-bearing, laminated qtz-cb veins and breccias; Alteration type(s): silicification, carbonatization, sericitization, chloritization, albitization and sulfidation (py, ccp, sp, ga); Metal association: Au-Sb-Mo-W ± Bi; Ore control(s): D4/5 kinematics and associated brittle-ductile structures, interaction of key structural elements (proximity to local shear zones and crustal-scale Keith-Kilkenny fault system), strong competency contrast between trondhjemite and komatiite, fault-valve action; Note: Tarmoola/King of the Hills is the largest known granite-hosted gold deposit in the Yilgarn Craton |
| Thunderbox | 1999 | >4.4 | Unk | Principal host rock(s): porphyritic dacite (upper greenschist facies); Mineralization styles: structurally-controlled, disseminated gold-sulfide (apy, po > py, sp, gn) accumulations and mm- to cm-thick, boudinaged and folded gold- and sulfide (apy)-bearing qtz veins; Alteration styles: carbonatization, silicification, albitization and sulfidation (apy, po); Metal association: Not reported (Au-As?); Ore control(s): D4/5 kinematics and brittle-ductile structures, interaction of key structural elements (local fold axes, Thunderbox shear zone, proximity to crustal-scale Perseverance fault system), strong competency contrast between porphyritic dacite and enclosing sedimentary and mafic volcanic rocks |
| Apollo Hill | 1986 | >2.0 | Unk | Principal host rock(s): basalt (pillowed), dolerite, felsic volcaniclastic rocks; Mineralization style(s): Four sets of mm- to cm-thick, sheeted and stockwork-type, gold- and sulfide (py > ccp, sp, gn, po)-bearing qtz-cb veins; Alteration type(s): carbonatization, chloritization, sericitization, silicification, pyritization; Metal association: Not reported (Au-Ag-Cu-Pb-Zn?); Ore control(s): D4/5(?) kinematics and associated brittle-ductile structures, interaction of key structural elements (Apollo-Ra shear zone, proximity to crustal-scale Keith-Kilkenny fault system), strong competency contrast, lithological contacts |
| Aphrodite | 1996 | >1.6 | Unk | Principal host rock(s): volcaniclastic rocks, felsic to intermediate (dacitic) porphyries; Mineralization style(s): conjugate, mm- to cm-scale gold- and sulfide (py > apy)-bearing qtz veins and breccias; Alteration type(s): silicification, carbonatization, sericitization, biotitization and sulfidation (py > apy > gn, ccp, stb); Metal association: Not reported (Au-As-Sb?); Ore control(s): D2 kinematics and associated brittle-ductile structures; interaction of key structural elements (local fold axes and crenulations, location along the crustal-scale Bardoc Tectonic Zone), strong competency contrast, chemically reactive sedimentary rock |
| Ulysses | 1993 | >1.6 | Unk | Principal host rock(s): qtz-dolerite (sills), basalt; Mineralization style(s): stacked, shear zone-hosted, gold- and sulfide-bearing qtz veins; Alteration type(s): silicification, carbonatization, sericitization, albitization, sulfidation (py, po > ccp) ± biotitization, chloritization; Metal association: Not reported; Ore control(s): D4/5(?) kinematics and associated brittle-ductile structures; interaction of key structural elements (fault intersections with dolerite sills), strong competency contrast |
| Menzies | 1891 | >1.4 | Unk | Principal host rock(s): metasedimentary rock, basalt, amphibolite ± porphyritic granodiorite; Mineralization style(s): locally stacked, shear zone-hosted, gold- and sulfide (py > apy)-bearing qtz veins and zones of brecciation; Alteration type(s): biotitization, chloritization, sericitization, silicification, sulfidation (py, po) ± carbonatization; Metal association: Au-As; Ore control(s): D4/5(?) kinematics and associated brittle-ductile structures; interaction of key structural elements (shear fabric, proximity to Menzies shear zone, location along the crustal-scale Bardoc Tectonic Zone) |
| Wonder | 1890s | >0.9 | Unk | Principal host rock(s): syenogranite (Bundarra Batholith) with partially assimilated greenstone rafts (mafic roof pendants); Mineralization style(s): gold- and sulphide (py > ccp, gn)-bearing qtz veins; Alteration type(s): silicification, carbonatization, sericitization, propylitization (hem), sulphidation (py) ± chloritization; Metal association: Not reported; Ore control(s): D4/5(?) kinematics and associated brittle-ductile structures; interaction of key structural elements (local faults, granite margin, proximity to the crustal-scale Keith-Kilkenny fault system), strong competency contrast between granite and mafic greenstone rafts |
| Zoroastrian | 1894 | >0.6 | Unk | Principal host rock(s): granophyric dolerite; Mineralization style(s): steeply-dipping and flat-lying, gold- and sulphide (apy, py, po)-bearing qtz stockwork veins; Alteration type(s): silicification, carbonatization, sericitization, chloritization, sulphidation (apy, py, po); Metal association: Not reported; Ore control(s): D4/5(?) kinematics and associated brittle-ductile structures; interaction of key structural elements (narrow synclinal fold structure, constriction zone between two granite domes, location along the crustal-scale Bardoc Tectonic Zone), strong competency contrast between dolerite and surrounding sedimentary, mafic and ultramafic rocks |
*Sources: Paddington = [5], Gwalia = [9,89], Mt Morgans = [90], Tarmoola/King of the Hills [4,9], Thunderbox = [91], Apollo Hill = [92], Aphrodite = [93], Ulysses [94,95], Menzies = [96], Wonder = [97,98], Zoroastrian = [99,100]. Gold endowment data were compiled from the above sources and [1]. Mineral abbreviations [101,102]: ab = albite, ank = ankerite, apy = arsenopyrite, cb = carbonate mineral; ccp = chalcopyrite, dol = dolomite, gn = galena, hem = hematite, mag = magnetite, po = pyrrhotite, py = pyrite, qtz = quartz, sp = sphalerite. Other abbreviations: Unk = unknown.
Table 3.
Orogenic gold deposit targeting model.
|
Critical Processes |
Constituent Processes |
Targeting Criteria (Proxies) |
Rationale for Proxies |
Proxies Used for MPM |
| Source | Availability of energy to drive and sustain the mineral system | Source processes related to orogenic Au systems are cryptic in nature:
|
Broad consensus exists in terms of orogenic Au systems of the Yilgarn Craton being formed in convergent margin settings, particularly in accretionary orogens, which, if mineralised, involve the following ingredients [33,116,117]:
|
Proximity to:
|
| Availability of fertile Au source region | ||||
| Availability of melts and fluids to extract Au from source region | ||||
| Availability of ligands to enhance Au solubility | ||||
| Favorable geodynamic/tectonic (“ground-preparation”) history | ||||
| Transport | Fundamental translithospheric structures | First-order fault systems |
|
Proximity to:
|
| Crustal structures | Second-order fault systems |
|
||
| Regional folds |
|
|||
| Domes |
|
|||
| Greenstone constriction zones |
|
|||
| Late basins |
|
|||
| Proterozoic dolerite dyke swarms |
|
|||
| Trap | Transient catastrophic rock failure and concomitant structurally controlled, and highly focused fluid flow | Second- and higher-order faults |
|
|
| Fault irregularities Dilational or contractional bends/jogs Fault splays, tips and wings En-echelon fracture zones |
|
|||
| Structural intersections and intersection density |
|
|||
| Fold structures |
|
|||
| Ductile structures Boudinage Stretching lineation Deflections in schistosity |
|
|||
| Competency contrasts |
|
|||
| Lithological complexity |
|
|||
| Deposition | Physicochemical destabilization of Au-bearing fluids | Phase separation |
|
|
| Fluid-rock interaction |
|
|||
| Fluid mixing |
|
|||
| Preservation | Geodynamics | Tectonic setting, crustal depth and timing of Au deposit formation and post-Au deformation history |
|
Not used in this study:
|
| Peneplanation and climate | Peneplained, tectonically stable cratonic environments in (semi-) arid climate zones |
|
Table 4.
Statistical parameters of the predictor maps extracted from prediction-area plots and receiver operating characteristic curves.
Table 4.
Statistical parameters of the predictor maps extracted from prediction-area plots and receiver operating characteristic curves.
| Predictor Map | Pr (%) | Oa (%) | Nd | AUC |
| Proximity to known gold occurrences | 100 | 0 | Infinity | 1.000 |
| Proximity to greenstone belts | 69 | 31 | 2.230 | 0.965 |
| Proximity to domains of favorable metamorphic grade | 69 | 31 | 2.230 | 0.950 |
| Proximity to felsic to intermediate volcanic rocks | 59 | 41 | 1.440 | 0.948 |
| Proximity to regional gravity highs | 71 | 29 | 2.450 | 0.931 |
| Proximity to mafic-ultramafic volcanic rocks | 69 | 31 | 2.230 | 0.922 |
| Proximity to basement granitoids | 71 | 29 | 2.450 | 0.858 |
| Proximity to ‘high mag units’ | 66 | 34 | 1.940 | 0.852 |
| Proximity to areas of demagnetization | 62 | 38 | 1.630 | 0.851 |
| Proximity to subsidiary faults | 66 | 34 | 1.940 | 0.833 |
| Proximity to remotely sensed alteration systems | 72 | 28 | 2.570 | 0.824 |
| Proximity to lithological contacts | 68 | 32 | 2.120 | 0.800 |
| Proximity to fold hinges | 59 | 41 | 1.440 | 0.794 |
| Proximity to internal granitoids | 64 | 36 | 1.770 | 0.788 |
| Density of principal faults | 61 | 39 | 1.560 | 0.786 |
| Proximity to principal faults | 64 | 36 | 1.770 | 0.778 |
| Density of lithological contacts | 58 | 42 | 1.380 | 0.758 |
| Density of ENE-WSW-striking gravity ridges | 63 | 37 | 1.700 | 0.746 |
| Density of NNW-SSE-striking gravity ridges | 59 | 41 | 1.440 | 0.715 |
| Density of principal fault intersections | 59 | 41 | 1.440 | 0.700 |
| Proximity to siliciclastic and sedimentary rocks | 64 | 36 | 1.770 | 0.691 |
| Density of ENE-WSW-striking gravity lineaments | 59 | 41 | 1.440 | 0.669 |
| Proximity to flanks of granitoid bodies | 59 | 41 | 1.440 | 0.639 |
| Density of NNW-SSE-striking gravity lineaments | 56 | 44 | 1.270 | 0.611 |
| Proximity to domains of juvenile crust (εNd-values of -0.2 to 2.4) | 52 | 48 | 1.080 | 0.611 |
| Proximity to domains of high K/Th values (≥95th percentile) | 55 | 45 | 1.220 | 0.560 |
| Proximity to Proterozoic dolerite dykes | 52 | 48 | 1.080 | 0.537 |
| Density of Proterozoic dolerite dykes | 51 | 49 | 1.040 | 0.515 |
Key to abbreviations: Pr = prediction rate, Oa = prediction area, Nd = Pr/Oa, AUC = area under the receiver operating characteristic curve.
Table 5.
Statistical parameters of the predictor maps extracted from prediction-area plots and receiver operating characteristic curves.
Table 5.
Statistical parameters of the predictor maps extracted from prediction-area plots and receiver operating characteristic curves.
| Predictor Map | Entropy (e) | Normalized entropy value (h) | Weight (W) |
| Density of lithological contacts | 6095.6771 | 0.0106 | 0.9894 |
| Proximity to basement granitoids | 7645.2808 | 0.0133 | 0.9867 |
| Proximity to felsic to intermediate volcanic rocks | 8618.7458 | 0.0150 | 0.9850 |
| Density of principal fault intersections | 14307.6455 | 0.0249 | 0.9750 |
| Density of Proterozoic dolerite dykes | 15560.7472 | 0.0271 | 0.9729 |
| Density of principal faults | 15964.4654 | 0.0278 | 0.9722 |
| Proximity to greenstone belts | 16756.0867 | 0.0292 | 0.9708 |
| Proximity to domains of favorable metamorphic grade | 17192.3563 | 0.0300 | 0.9700 |
| Proximity to regional gravity highs | 17325.3546 | 0.0302 | 0.9698 |
| Density of NNW-SSE-striking gravity lineaments | 18651.1160 | 0.0325 | 0.9675 |
| Density of ENE-WSW-striking gravity ridges | 20723.5017 | 0.0361 | 0.9639 |
| Density of ENE-WSW-striking gravity lineaments | 20805.6584 | 0.0363 | 0.9637 |
| Density of NNW-SSE-striking gravity ridges | 21253.2799 | 0.0371 | 0.9629 |
| Proximity to mafic-ultramafic volcanic rocks | 21418.1640 | 0.0373 | 0.9627 |
| Proximity to fold hinges | 23135.5471 | 0.0403 | 0.9597 |
| Proximity to siliciclastic and sedimentary rocks | 23344.8807 | 0.0407 | 0.9593 |
| Proximity to domains of high K/Th values (≥95th percentile) | 23608.4979 | 0.0412 | 0.9588 |
| Proximity to domains of juvenile crust (εNd-values of -0.2 to 2.4) | 23831.9069 | 0.0415 | 0.9585 |
| Proximity to internal granitoids | 24255.2574 | 0.0423 | 0.9577 |
| Proximity to lithological contacts | 24480.4544 | 0.0427 | 0.9573 |
| Proximity to remotely sensed alteration systems | 25084.6743 | 0.0437 | 0.9563 |
| Proximity to ‘high mag units’ | 25400.9016 | 0.0443 | 0.9557 |
| Proximity to known gold occurrences | 25649.8157 | 0.0447 | 0.9553 |
| Proximity to flanks of granitoid bodies | 25836.8422 | 0.0450 | 0.9550 |
| Proximity to areas of demagnetization | 25900.6011 | 0.0452 | 0.9548 |
| Proximity to Proterozoic dolerite dykes | 26630.7561 | 0.0464 | 0.9536 |
| Proximity to subsidiary faults | 26876.2032 | 0.0469 | 0.9531 |
| Proximity to principal faults | 27249.1575 | 0.0475 | 0.9525 |
Table 6.
Extracted parameters from improved prediction-area plots for the competent predictor maps.
| Competent Predictor Maps | Parameters | ||||||
| Pm | Pn | 100-Pm | 100-Pn | TPr | FPr | Op | |
| Proximity to known gold occurrences (DC1) | 100 | 46 | 0 | 54 | 1 | 0.46 | 0.54 |
| Proximity to regional gravity highs (DC2) | 71 | 43 | 29 | 57 | 0.71 | 0.43 | 0.28 |
| Proximity to basement granitoids (DC3) | 71 | 43 | 29 | 57 | 0.71 | 0.43 | 0.28 |
| Proximity to greenstone belts (DC4) | 69 | 42 | 31 | 58 | 0.69 | 0.42 | 0.27 |
| Proximity to domains of favorable metamorphic grade (DC5) | 69 | 43 | 31 | 57 | 0.69 | 0.43 | 0.26 |
| Proximity to mafic-ultramafic volcanic rocks (DC6) | 69 | 44 | 31 | 56 | 0.69 | 0.44 | 0.25 |
| Proximity to subsidiary faults (DC7) | 66 | 42 | 34 | 58 | 0.66 | 0.42 | 0.24 |
| Proximity to remotely sensed alteration systems (DC8) | 72 | 48 | 28 | 52 | 0.72 | 0.48 | 0.24 |
| Proximity to ‘high mag units’ (DC9) | 66 | 43 | 34 | 57 | 0.66 | 0.43 | 0.23 |
| Proximity to principal faults (DC10) | 64 | 43 | 36 | 57 | 0.64 | 0.43 | 0.21 |
| Proximity to lithological contacts (DC11) | 68 | 47 | 32 | 53 | 0.68 | 0.47 | 0.21 |
| Density of ENE-WSW-striking gravity ridges (DC12) | 63 | 45 | 37 | 55 | 0.63 | 0.45 | 0.18 |
| Proximity to internal granitoids (DC13) | 64 | 47 | 36 | 53 | 0.64 | 0.47 | 0.17 |
| Density of principal faults (DC14) | 61 | 45 | 39 | 55 | 0.61 | 0.45 | 0.16 |
| Proximity to siliciclastic and sedimentary rocks (DC15) | 64 | 48 | 36 | 52 | 0.64 | 0.48 | 0.16 |
| Proximity to areas of demagnetization (DC16) | 62 | 46 | 38 | 54 | 0.62 | 0.46 | 0.16 |
| Proximity to fold hinges (DC17) | 59 | 47 | 41 | 53 | 0.59 | 0.47 | 0.12 |
| Proximity to felsic to intermediate volcanic rocks (DC18) | 59 | 48 | 41 | 52 | 0.59 | 0.48 | 0.11 |
| Density of NNW-SSE-striking gravity ridges (DC19) | 59 | 48 | 41 | 52 | 0.59 | 0.48 | 0.11 |
| Density of ENE-WSW-striking gravity lineaments (DC20) | 59 | 48 | 41 | 52 | 0.59 | 0.48 | 0.11 |
| Density of principal fault intersections (DC21) | 59 | 48 | 41 | 52 | 0.59 | 0.48 | 0.11 |
| Proximity to flanks of granitoid bodies (DC22) | 59 | 48 | 41 | 52 | 0.59 | 0.48 | 0.11 |
| Density of lithological contacts (DC23) | 58 | 49 | 42 | 51 | 0.58 | 0.49 | 0.09 |
| Density of NNW-SSE-striking gravity lineaments (DC24) | 56 | 49 | 44 | 51 | 0.56 | 0.49 | 0.07 |
| Proximity to domains of juvenile crust (DC25) | 52 | 47 | 48 | 53 | 0.52 | 0.47 | 0.05 |
| Proximity to domains of high K/Th values (DC26) | 55 | 50 | 45 | 50 | 0.55 | 0.5 | 0.05 |
| Proximity to Proterozoic dolerite dykes (DC27) | 52 | 50 | 48 | 50 | 0.52 | 0.5 | 0.02 |
| Density of Proterozoic dolerite dykes (DC28) | 51 | 51 | 49 | 49 | 0.51 | 0.51 | 0 |
Key to abbreviations: Pm = hits, Pn = false alarms, 100- Pm = misses, 100- Pn = correct rejections, TPr = true positive rate, FPr = false positive rate, Op = overall performance, DC = decision criterion.
Table 7.
Improved prediction-area (P-A) plot parameters for the different gold potential models.
| Fuzzy Gamma | Geometric Average | Improved Index Overlay | BWM-SAW | RF | |
| Pm (Hits) | 77 | 78 | 79 | 88 | 88 |
| Pn (False Alarms) | 42 | 43 | 42 | 41 | 36 |
| 100-Pm (Misses) | 23 | 22 | 21 | 12 | 12 |
| 100-Pn (Correct Rejection) | 58 | 57 | 58 | 59 | 64 |
| True Positive Rate (TPr) | 0.77 | 0.78 | 0.79 | 0.88 | 0.88 |
| False Positive Rate (FPr) | 0.42 | 0.43 | 0.42 | 0.41 | 0.36 |
| Overall Performance (Op) | 0.35 | 0.35 | 0.37 | 0.47 | 0.52 |
Table 8.
Summary statistics for the open-file Geological Survey of Western Australia (GSWA) and confidential St Barbara Limited (SBM) drill hole databases.
Table 8.
Summary statistics for the open-file Geological Survey of Western Australia (GSWA) and confidential St Barbara Limited (SBM) drill hole databases.
| Parameters | GSWA Database | SBM Database | Comments |
| Number of drill holes | 231,760 | 77,675 | |
| Main hole type | |||
| RC | 84,078 (36%) | 19,874 (26%) | Only 39% of all drill holes completed in the study area are RC or DD holes whereas 56% represent geochemical drill holes comprised of RAB, AC and AUG holes. |
| RAB | 62,377 (27%) | 43,180 (56%) | |
| AC | 52,905 (23%) | 8875 (11%) | |
| AUG | 14,276 (6%) | 889 (1%) | |
| DD | 7043 (3%) | 1827 (2%) | |
| Other | 11,081 (5%) | 3030 (4%) | |
| Hole depth—all drill holes | |||
| Min | 0.0 m | 0.0 m | The median value demonstrates that 50% of all drill holes completed in the study area have hole lengths of only 39 m or less. |
| Max | 2895.6 m | 2895.6 m | |
| Median | 39.0 m | 36.0 m | |
| Mean | 50.5 m | 53.9 m | |
| Hole depth—RC holes | |||
| Min | 0.0 m | 0.0 m | Of the 80,078 RC holes in the GSWA database, 31,713 (~40%) targeted Au whilst 32,666 (~41%) targeted Ni ± Co; the remaining holes targeted mostly base metals ± Au |
| Max | 1043.1 m | 624.6 m | |
| Median | 41.0 m | 69.0 m | |
| Mean | 53.1 m | 81.3 m | |
| Hole depth—DD holes | |||
| Min | 0.0 m | 6.0 m | Of the 7043 DD holes in the GSWA database, 3511 (~50%) targeted Au ± Ag, Ni; the remaining holes targeted mostly base metals ± Au |
| Max | 2895.6 m | 2895.6 m | |
| Median | 211.9 m | 220.0 m | |
| Mean | 292.8 m | 403.0 m |
Key to abbreviations: AC = aircore; AUG = auger; DD = diamond core; RAB = rotary air blast; RC = reverse circulation.
Table 9.
‘Manual targets’ generated from RF-derived MPM targets.
| Target ID & Ranking | Name | Rationale | Exploration & Ownership |
| #1 | Dingo | Lithostructural target comprising a cluster of poorly tested intrusions of the McAuliffe Well Syenite; partially covered by Lake Raeside; hosts Dingo and Bull Terrier Au occurrences; proximal to 1st order Keith-Kilkenny fault system; located along a NNW-SSE-trending gravity ridge | Shallow saprolite drilling only although open-file drill hole data appear to be incomplete; best historic drill intercept: 1.00 m @ 12.28 g/t Au; disjointed ownership |
| #2 | Westralia North | Lithostructural target comprising BIF units and syenite intrusions; Korong and Akicia Au occurrences; proximal to 1st order Celia fault system; located along a NNW-SSE gravity ridge; along strike from the Mt Morgans Au deposit | No deep drilling >150 m vertical; best historic drill intercept: 6.70 m @ 13.15 g/t Au; disjointed ownership |
| #3 | Mt Boyce | Lithostructural target; largely soil covered; no reported Au occurrences in 2021; proximal to 1st order Keith-Kilkenny fault system; located along a NNW-SSE-trending gravity ridge | No deep drilling >100 m vertical; best historic drill intercept: 2.00 m @ 34.50 g/t Au |
| #4 | Mt Redcastle | Lithostructural target in ‘nose region’ of a large granite dome and comprising internal granitoids; hosts several known Au occurrences; proximal to unnamed 2nd order fault system; located along NW-SE-trending gravity ridge | No deep drilling >100 m; disjointed ownership |
| #5 | Mt Remarkable | Lithostructural target covering part of the Pig Well Basin; no reported Au occurrences in 2021; proximal to 1st order Keith-Kilkenny fault system; located along a NNW-SSE-trending gravity ridge | Drilling is mostly associated with the Marvellous Au occurrence; best historic drill intercept: 82.00 m @ 0.83 g/t Au; disjointed ownership; partly located within an extensive registered site of Aboriginal cultural heritage |
| #6 | Twenty Six Well | Lithostructural target; largely soil covered; no reported Au occurrences in 2021; proximal to 1st order Keith-Kilkenny fault system; located along a NNW-SSE-trending gravity ridge | Minimal drilling; disjointed ownership |
| #7 | Malcolm | Lithostructural target comprising BIF units; hosts numerous Au occurrences over a strike length of 10 km; located in between the 1st order Keith-Kilkenny and Melita-Emu fault systems; located along a NNW-SSE-trending gravity ridge | Limited drilling; best historic drill intercept: 11.00 m @ 1.75 g/t Au + 10.00 m @ 1.26 g/t Au; disjointed ownership |
| #8 | Lake Raeside | Lithostructural target covering part of the Pig Well Basin; largely covered by lake Raeside; proximal to 1st order Keith-Kilkenny fault system; located along a NNW-SSE-trending gravity ridge | Minimal drilling; disjointed ownership; partly located within an extensive registered site of Aboriginal cultural heritage |
Key to abbreviations: BIF = banded iron formation.
Disclaimer/Publisher’s Note: The statements, opinions and data contained in all publications are solely those of the individual author(s) and contributor(s) and not of MDPI and/or the editor(s). MDPI and/or the editor(s) disclaim responsibility for any injury to people or property resulting from any ideas, methods, instructions or products referred to in the content. |
© 2025 by the authors. Licensee MDPI, Basel, Switzerland. This article is an open access article distributed under the terms and conditions of the Creative Commons Attribution (CC BY) license (http://creativecommons.org/licenses/by/4.0/).
Copyright: This open access article is published under a Creative Commons CC BY 4.0 license, which permit the free download, distribution, and reuse, provided that the author and preprint are cited in any reuse.


