
Submitted:
17 October 2025
Posted:
17 October 2025
You are already at the latest version
Abstract
Currently, renewable energy projects are growing, and one of the critical unforeseen consequences that has emerged is curtailment. This study focuses on characterizing a full dataset of real operational curtailed electricity from wind energy projects in one-hour time steps, obtained through Supervisory Control and Data Acquisition over the years 2022 and 2025 of operation. The case study is based on the national electrical system of Chile and the analysis incorporates curtailment patterns and more significant features, which can ultimately be used as an input source for annexed projects, such as energy storage systems or green hydrogen production. The total installed capacity increased from 3.0 GW to 5.0 GW during this period, representing a 66\% expansion, while energy generation increased by only 22\%. Curtailed energy increased from 9\% to 13\% of total potential output, equivalent to approximately 3.4 TWh of unused clean energy. Location analysis reveals that around 60\% of generation and curtailment occur in northern Chile, where grid congestion is most pronounced. Monthly trends show a pattern that combines a linear upward increase associated with growth in installed capacity and a cyclical seasonal component driven by resource variability. These findings highlight that curtailment has become a structural limitation for renewable integration, primarily due to insufficient transmission expansion and system flexibility.
Keywords:
curtailment
; renewable energy
; variable renewable energy
1. Introduction
The worldwide expansion of variable renewable energies (VRE), particularly wind and solar sources, has been accompanied by an increase in the magnitude and frequency of curtailed energy [1]. Curtailment refers to the reduction of energy output when generation exceeds demand or grid capacity constraints. As such, a portion of the energy is not utilized, even when it is available. From an economic perspective, excessive curtailment reduces the revenue potential of renewable projects, which can discourage further investment in renewable technologies. Environmentally, it leads to a loss of clean energy that could otherwise displace fossil fuel generation, thus increasing carbon emissions. For grid operators, managing curtailment adds complexity to grid operations and requires advanced forecasting and real-time balancing capabilities [2].
The curtailment of renewable energy has been widely studied in the literature. Bird et al. [3] provided an early review of experiences in different countries, showing that, in some cases, generation curtailments exceeded 10%, mainly due to transmission constraints and institutional factors. Similar conclusions are provided by O’Shaughnessy et al. [4], in their study of global curtailment trends in key markets (Chile, China, Germany, and the United States), highlighting that transmission constraints and temporary mismatches between supply and demand are determining factors. Yasuda et al. [5,6] developed a global comparative tool that allows relating renewable penetration levels with generation reduction rates known as the C-E map, facilitating historical analysis and comparisons between different countries. These studies have shown that curtailment is a characteristic of electrical systems with high renewable penetration, primarily influenced by transmission capacity and system flexibility. López et al. [7] analyzed the dynamics of curtailment in California, detailed in 1-hour time steps, showing how the simultaneous penetration of variable and conventional generation increases the reduction rates, although with a moderate impact on the levelized costs of electricity, which reinforces the need to evaluate both its causes and its economic effects.
Chile represents a particularly relevant case in this context. Over the past decade, the country has experienced an accelerated increase in the penetration of variable renewable energy. In 2013, the energy generated by solar or wind sources accounted for less than 1% of the total generation [8], whereas by 2024, their participation had grown to 41% [9]. Additionally, VRE projects under construction represent an additional 2500MW of capacity, with 178 further projects in evaluation by the Environmental Assessment Service [10]. Nowadays, Chile is one of the markets with the competitive cost of electricity and projected as an important producer of green hydrogen production [11,12,13,14,15,16,17]. This evolution highlights the expansion of VRE in Chile, consolidating its role as a central component of the energy transition of the country.
In parallel with the VRE expansion, curtailment has become one of the main challenges for renewable integration in Chile. The country presents a marked geographical imbalance between the location of renewable resources and electricity demand. Most wind and solar potential is concentrated in the northern regions, while demand is primarily located in the central zone. To mitigate this mismatch, the north and central power systems were interconnected in 2017, producing a significant and immediate reduction in curtailment, from around 14% that year to approximately 2% a few years later [18,19] . However, this improvement proved temporary since curtailment has experienced a consistent and explosive increase in recent years. While in 2021, curtailed energy reached 453 GWh, in 2024, curtailment from VRE reached 5900 GWh [18]. This increment exposed a structural problem in the integration of more renewable energy, highlighting the need for enhanced grid management strategies to accommodate the VRE supply. In terms of curtailment, the relevance of wind projects is not completely understood, as it is either studied by coupling it with solar projects or analyzed in cumulative time frames; namely, monthly or yearly trends [2,18,20,21,22]. There is no general rule on which VRE (wind or solar) has a larger contribution to total curtailment [3,5,7]. Nevertheless, the recent steep increase in technology maturity in storage [23,24] or coupled projects that take advantage of such resources [25,26] make it attractive to unveil the full potential of this type of VRE.
This paper contributes by providing a comprehensive study of an extensive timeline dataset of real generation and curtailment, only including wind parks from the national electric system (SEN) of Chile. The analysis incorporates normalized magnitudes, temporal curtailment patterns and seasonal trends. The latter is shown over a local and international framework, contributing to a valuable data-driven deliverable that contextualizes the wind energy for further energy applications.
The rest of the article is organized as follows. Section 2 provides details of the dataset and gives an overview of the case study while describing the methodology applied in the analysis. The results and more relevant patterns are discussed in Section 3 to finalize with the key remarks concluded by this work in Section 4.
2. Data and Methods
2.1. Generation and Curtailment
This research uses data from Chilean wind energy parks; both the generated [27] and curtailed [28] electricity are fed by the operational documentation of the National Electrical Coordinator (CEN). In this way, a database timeline of wind energy generation and curtailment in 1-hour time steps is created. Raw data is obtained through the Supervisory Control and Data Acquisition (SCADA) of the CEN main controller. Figure 1a) shows the energy generation of the wind park Tchamma over the full timeline, while Figure 1b) depicts the curtailed electricity under the same period.
Additional information is collected through technical [29] and environmental [30] resources. Raw data can be directly downloaded through each wind energy park name; nevertheless, the reader can access the code-format database used in this investigation through its public repository. Table 1 shows an example of data in addition to curtailment.
A total of 51 wind parks are evaluated, whereas a 42-month timeline is from January 2022 to June 2025. The total installed power corresponds approximately to 5054 MW.
2.2. Methodology
The methods used to analyze the data are presented. First, the data is clustered to perform different analyses by means of hours, days, months or the full cumulated energy through the timeline and in three groups, namely potential energy (E), generation (G) and curtailed (C) electricity accordingly to Equations (1)–(3), respectively.
where i is the corresponding wind park, and T is the cumulated time, which can be by 1-day, 1-month or the complete 42-month dataset. Additionally, global trends are analyzed by means of the average of each concept as shown in Equation 4.
where, can be E, G or C and is the number of analyzed periods, i.e., by months or by days . It is important to mention that at the begging of the study, january 2022, there are 34 projects (∼ 3048 MW) in operation while by the end of it, june 2025, the 17 resting (∼ 2006 MW) were gradually incorporated in the generation and curtailment data accordingly the operation date (see Table 1). Therefore, only considers when each wind park is actively in operation. Finally, the ratio r of curtailed energy over generated energy is calculated according to Equation (5):
3. Results and Discussion
Results are presented, starting from a cumulated study of the quantities, either potential, generation or curtailment energy. Subsequently, data is clustered in months and days to gain a qualitative description of the behavior, adding the stats that provide quantification to the analyzed case study. For the sake of conciseness, only the most significant findings are presented and each topic is discussed in turn. However, to ensure completeness, the entire data collection is available for further analysis.
During the 42 months of the study, a maximum available energy of approximately 128.7 TWh is estimated following Equation 1, using NEP and the contribution period of operation of each wind park. Analogously, a total energy of 34TWh and 3.4TWh represents generation and curtailment, respectively (Equation (4). Figure 2 shows the distribution of such energy magnitude over the different regions in the study case. The areas with the highest penetration of wind energy are also those with the highest levels of curtailment. As shown in Figure 2(a), from the 51 wind parks analyzed, the largest contribution is located in northern Chile (∼60%), while the remaining significant rest (∼36%) leaps to the south region, mostly skipping the central part of the country. In this distribution, the relative share of nominal installed capacity in a region is proportionally reflected in the generated and curtailed energy in the same area (Figure 2b,c). This trend aligns with findings in other worldwide electrical distributions, where regions with high VRE penetration exhibit high curtailment levels [1,3,7,31,32]. It is remarkable that the low performance between the potential energy and real generation magnitudes (0.26), is within the range of low-performing wind energy capacity factor [33,34,35,36].
Thus, there is a similar share in either nominal power, generation or curtailment across the regions in Chile. The details along the studied timeframe are now explored; for instance, Figure 3 shows trends over three years from different world sections, exhibiting heterogeneity regarding curtailment. Wind curtailment in Chile has shown sustained growth over the past three years. In this way, between 2022 and 2024, the percentage of wind curtailment in Chile increased from 9% to 13%, reciprocally, but in less magnitude than the recent expansion of installed wind capacity (66%). Conversely, in China during the 2017–2019 period, exhibit a curtailment decreased from 13% to 5% due to improvements in system flexibility through cogeneration units and new regulations that granted priority access to renewable sources [6,37,38,39]. An intermediate case is shown in Europe, between years 2018 and 2020, the curtailment remained stable at around 4–5%, which is attributed to the existence of a robust transmission grid, high interconnection between countries, and the flexibility provided by other energy sources [6,40,41]. International comparisons reveal that the regulatory environment, transmission infrastructure, and operational flexibility of each electricity system heavily influence the evolution of curtailment [6]. While China and Europe have managed to reduce or contain the phenomenon through structural and regulatory measures during those periods, in Chile, the upward trend confirms the need to adopt policies and technologies that increase system flexibility and strengthen the transmission grid [42].
Global results can veil some of the trends in the timeline of the case study. Consequently, the clustering of the energy accumulation for each of the 42 months is presented in Figure 4. Although the installed power increased by 66%, there is an unmarked increment in generation; in fact, the generation over January 2022 is roughly 800GWh, while by the same month three years later, goes up to 975GWh, only a 22% increase. In contrast, curtailment shows a qualitative progressive increment; indeed, it exhibits a 176% increment in the same time threshold as generation. These results are complemented by recent technical studies that have monitored the curtailment from VRE in Chile, coupling solar and wind [20].
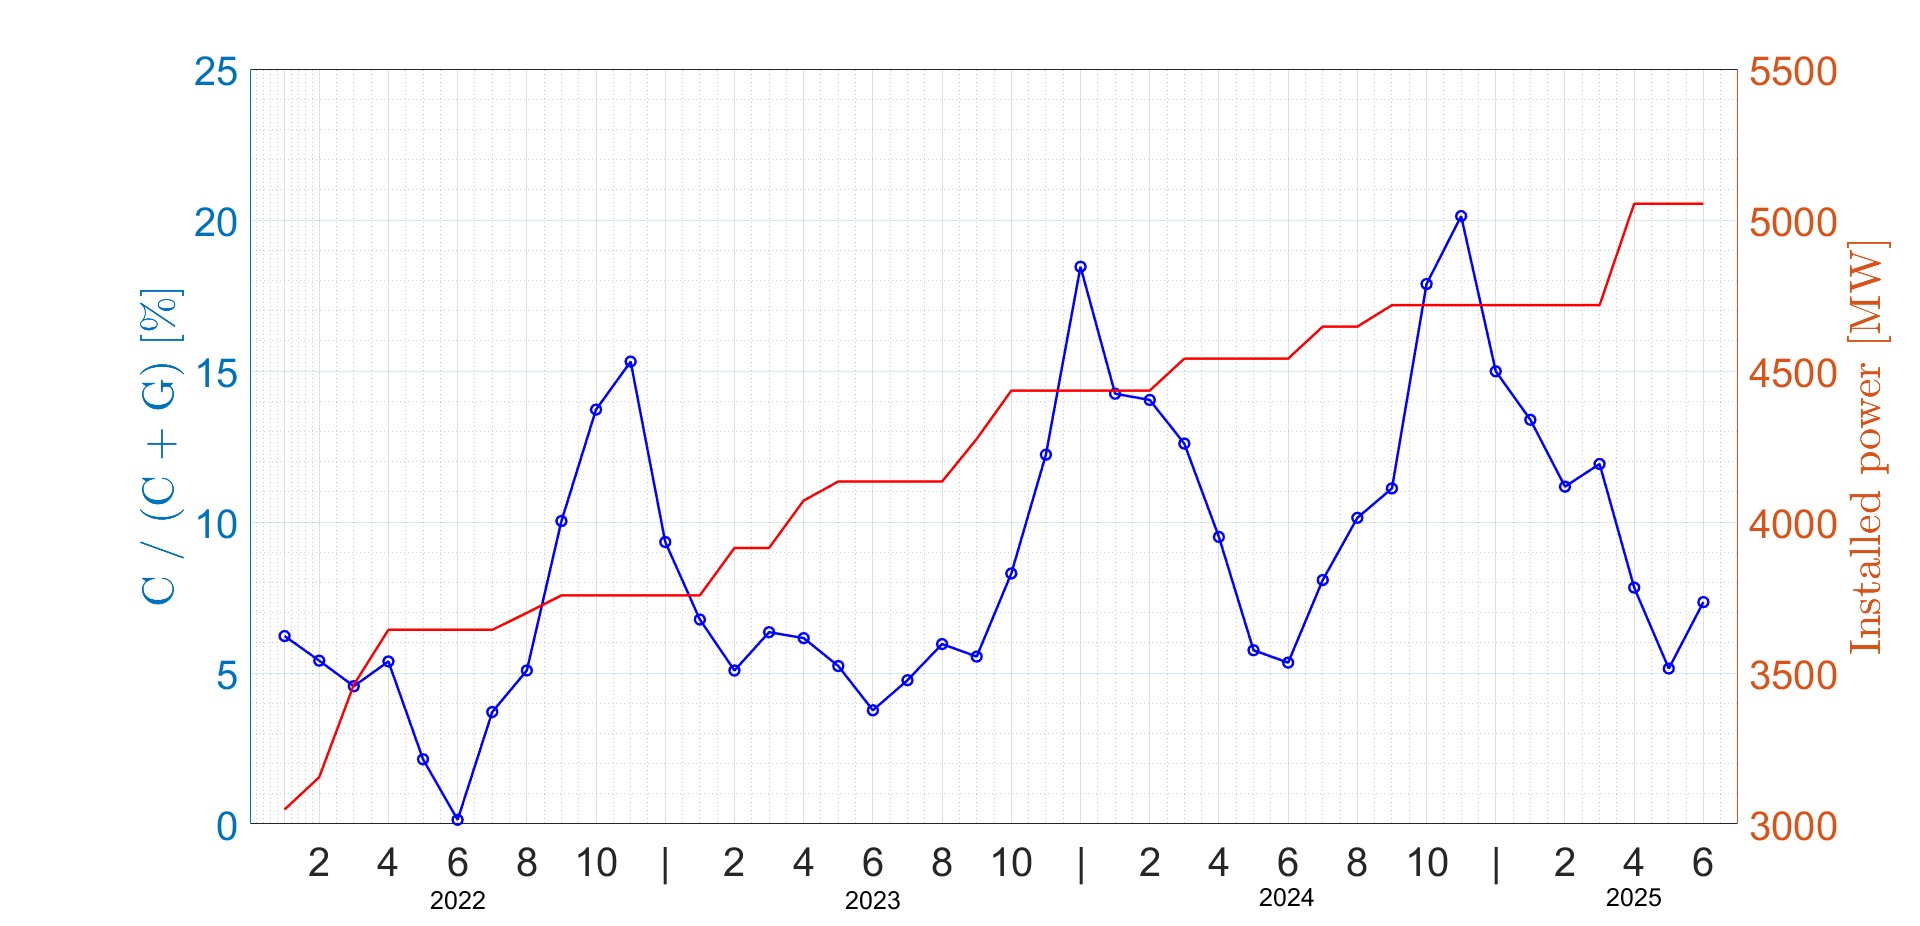
Thus, a detailed view is presented in Figure 5, where the monthly evolution of the curtailed energy ratio, Equation (5); and in addition, the progression of nominal wind power. A coupled behavior is observed, characterized by two distinct but interconnected phenomena. On the one hand, a linear offset manifests as a steady, proportional increase aligned with the growth of NEP. The latter indicates a systematic link; therefore, a possible parameterization or prediction. On the other hand, coupled with this linear trend is a cyclic behavior, where seasonal periodic fluctuations become the principal driving force. This cyclic pattern introduces oscillations that repeat regularly, with peaks in warm seasons and troughs in the cold ones. Together, linear progression and seasonal variation evidence a complex interplay. For comparison purposes, it is useful to contrast these results with other international experiences, such as the case of California. During the 2015–2021 period, wind curtailment in California remained below 5%, following a downward trend with peaks concentrated in the warm seasons, especially in the early years of the period [7]. During the same period, installed wind capacity fluctuated moderately, decreasing from 6,108 MW to 5,609 MW between 2015 and 2017, before increasing to 6,142 MW in 2021 [43]. In contrast, wind curtailment in Chile has increased steadily, rising from 9% to 13% over the last three years (2022-2025), while installed capacity has grown significantly. Despite the different trends observed in both regions, data reveal a consistent coupling between installed capacity and curtailment, confirming that curtailment growth tends to follow capacity expansion when grid adaptation is limited.
The aforementioned relationship provides a basis for interpreting the observed behavior through Equation (5). According to this expression, an increment in nominal power (assuming a constant capacity factor) should not affect the curtailed energy ratio (r). Therefore, the increase in r observed in Chile can be understood as an effective reduction in the capacity factor of the system. The combination of increased curtailment with the expansion of installed capacity indicates that the transmission infrastructure and operational flexibility of the Chilean electricity system have not kept pace with the growth of renewable energy sources. In fact, Chile has suffered from blackouts due to infrastructure incidents [44,45] and recently, presented a public international tender for renovation on the transmission system [46].
Literature shows a qualitative consensus on how to represent the trends of curtailment (C), which is, accordingly to the generation (G). Nevertheless, there are two common metrics used to quantify the curtailment rate. Thus, it can be by considering the whole energy as a normalization, as in this study (Equation (1)) [6,7]; or, on the contrary, by normalizing only by the real generation [1,3,4] as shown in Equation (6).
Figure 6 shows both ratios to evaluate the sensitivity of the results to the definition used, while exhibiting a daily average ratio from the 51 wind parks. It depicts a similar temporal trend, confirming that the overall evolution of curtailment is independent of the selected metrics. However, tends to yield systematically higher values than r, particularly, under high curtailment conditions. This difference is explained by the fact that normalizes the reduced energy only with respect to the energy actually generated, which decreases during periods of grid congestion, thereby amplifying the apparent magnitude of the phenomenon. In contrast, as r expresses the reduced energy as a fraction of the total available potential (C+G), it offers a measure bounded between 0 and 1; thus, it is physically more stable. For low values of curtailment, both metrics converge because . This ambiguity can lead to misleading interpretations and under- or overestimations of phenomena. Therefore, the specification of the curtailment rate calculation is essential for making comparisons across different sources or electricity systems, thereby ensuring a consistent interpretation of the curtailment percentages presented in this study.
Overall, in the case study, nominal power, generation, and curtailment are distributed in comparable proportions across Chilean regions. Nevertheless, total curtailment has won share over the past three years (2022-2024) in contrast to the behavior of other parts of the world. The dramatic increase in installed power explains the latter without leveraging it in actual generation.
4. Conclusions
This study focuses on real generation and curtailment data from 51 wind parks in Chile. First, a characterization of the total energy and nominal effective power is done considering the whole accumulation between January 2022 and June 2025. Subsequently, a particular focus is carried out on the timeline of events between capacity increase and performance metrics of generation or curtailment.
In terms of the relationship between installed, generated and curtailed energy, results show a strong geolocation correspondence between wind penetration and levels of curtailment percentages, reflecting a resource distribution that exceeds the effective utilization capacity of the electrical system. In fact, curtailed energy increased from 9% to 13%, while installed capacity grew by 66%, indicating that transmission and operational constraints are the main limitations to renewable integration. The sustained growth in curtailment represents an effective reduction in the wind capacity factor, mainly caused by grid congestion in northern regions and insufficient flexibility in the national electric system.
There is evidence of a sustained upward trend in wind curtailment in Chile, associated with the rapid growth of installed capacity and the limited capacity of the electrical system to absorb such expansion. Furthermore, the monthly analysis reveals a coupled pattern mixed up with the upward trend, namely a cyclic seasonal behavior. This combination demonstrates that, although operating conditions can fluctuate throughout the year, the sustained increase in wind capacity remains the main factor driving the rise in curtailment when grid adaptation is limited. From a system-planning perspective, the consistent increase in curtailed electricity () underscores the need to strengthen transmission infrastructure and implement flexibility-enhancing measures, such as storage, demand management, and wind-to-hydrogen integration. Without these actions, a significant fraction of clean generation potential will continue to be lost.
On the wind capacity factor, the increase in curtailment in Chile implies an effective reduction in the capacity factor of wind sources due to a mismatch between renewable expansion and grid capacity. Once more confirming that limitations in transmission and operational flexibility are critical factors restricting the efficient integration of wind energy.
Finally, the open-source dataset generated in this work provides a reproducible foundation for future techno-economic analyses of curtailment mitigation and for quantifying the marginal cost of grid adaptation in Chile and similar high-penetration renewable systems.
Author Contributions
Conceptualization, R.S-V. and J.U.; methodology, R.S-V.; formal analysis, R.S-V. and J.U.; investigation, R.S-V. and J.U.; data curation, R.S-V.; writing—original draft preparation, review and editing, R.S-V. and J.U.; visualization, R.S-V.; All authors have read and agreed to the published version of the manuscript.
Funding
This research received no external funding.
Data Availability Statement
Database used in this investigation can be accessed through R.S-V. repository.
Conflicts of Interest
The authors declare no conflicts of interest.
References
- Frew, B.; Sergi, B.; Denholm, P.; Cole, W.; Gates, N.; Levie, D.; Margolis, R. The curtailment paradox in the transition to high solar power systems. Joule 2021, 5, 1143–1167. [CrossRef]
- Laimon, M. Renewable energy curtailment: A problem or an opportunity? Results in Engineering 2025, p. 104925. [CrossRef]
- Bird, L.; Lew, D.; Milligan, M.; Carlini, E.M.; Estanqueiro, A.; Flynn, D.; Gomez-Lazaro, E.; Holttinen, H.; Menemenlis, N.; Orths, A.; et al. Wind and solar energy curtailment: A review of international experience. Renewable and Sustainable Energy Reviews 2016, 65, 577–586. [CrossRef]
- O’Shaughnessy, E.; Cruce, J.R.; Xu, K. Too much of a good thing? Global trends in the curtailment of solar PV. Solar Energy 2020, 208, 1068–1077. [CrossRef]
- Yasuda, Y.; Bird, L.; Carlini, E.M.; Estanqueiro, A.; Flynn, D.; Forcione, A.; Lázaro, E.G.; Higgins, P.; Holttinen, H.; Lew, D.; et al. International comparison of wind and solar curtailment ratio. In Proceedings of the In 14th International Workshop on Large-Scale Integration of Wind Power into Power Systems as well as on Transmission Networks for Offshore Wind Farms. Brussels, Belgium, 2015.
- Yasuda, Y.; Bird, L.; Carlini, E.M.; Eriksen, P.B.; Estanqueiro, A.; Flynn, D.; Fraile, D.; Lázaro, E.G.; Martín-Martínez, S.; Hayashi, D.; et al. CE (curtailment–Energy share) map: An objective and quantitative measure to evaluate wind and solar curtailment. Renewable and Sustainable Energy Reviews 2022, 160, 112212. [CrossRef]
- Prol, J.L.; Zilberman, D. No alarms and no surprises: Dynamics of renewable energy curtailment in California. Energy Economics 2023, 126, 106974. [CrossRef]
- Odeh, R.P.; Watts, D. Impacts of wind and solar spatial diversification on its market value: A case study of the Chilean electricity market. Renewable and Sustainable Energy Reviews 2019, 111, 442–461. [CrossRef]
- Coordinador Eléctrico Nacional (CEN), Gobierno de Chile. Reporte energético marzo, 2024. Last accessed 20.12.24 Access here.
- Ministerio de Energía, Chile. Reporte de proyectos en Construcción e Inversión en el Sector Energía mes de julio, 2024. División de Desarrollo de Proyectos Unidad de Acompañamiento de Proyectos. Last accessed 14.10.25 Access here.
- Serra, P. Chile’s electricity markets: Four decades on from their original design. Energy Strategy Reviews 2022, 39, 100798. [CrossRef]
- Acosta, K.; Salazar, I.; Saldaña, M.; Ramos, J.; Navarra, A.; Toro, N. Chile and its potential role among the most affordable green hydrogen producers in the world. Frontiers in Environmental Science 2022, 10, 890104. [CrossRef]
- Gonzales, L.E.; Ito, K.; Reguant, M. The investment effects of market integration: Evidence from renewable energy expansion in Chile. Econometrica 2023, 91, 1659–1693. [CrossRef]
- Sánchez-Squella, A.; Muñoz, M.; Toledo, M.; Yanine, F. Techno-economic assessment of a green hydrogen production plant for a mining operation in Chile. International Journal of Hydrogen Energy 2025, 112, 531–543. [CrossRef]
- Losada, A.M.I. Green hydrogen: Chances and barriers for the Energiewende in Chile. Science Talks 2022, 4, 100088. [CrossRef]
- Chavez-Angel, E.; Castro-Alvarez, A.; Sapunar, N.; Henríquez, F.; Saavedra, J.; Rodríguez, S.; Cornejo, I.; Maxwell, L. Exploring the potential of green hydrogen production and application in the antofagasta region of Chile. Energies 2023, 16, 4509. [CrossRef]
- Osorio-Aravena, J.C.; Aghahosseini, A.; Bogdanov, D.; Caldera, U.; Ghorbani, N.; Mensah, T.N.O.; Khalili, S.; Muñoz-Cerón, E.; Breyer, C. The impact of renewable energy and sector coupling on the pathway towards a sustainable energy system in Chile. Renewable and Sustainable Energy Reviews 2021, 151, 111557. [CrossRef]
- Parrado, C.; Fontalvo, A.; Ordóñez, J.; Girard, A. Optimizing dispatch strategies for CSP plants: A Monte Carlo simulation approach to maximize annual revenue in Chile’s renewable energy sector. Energy 2025, 317, 134551. [CrossRef]
- International Energy Agency (IEA). Renewable Energy Market Update: Outlook for 2023 and 2024, 2023. Last accessed 08.10.2025.
- Ember. Reducing Curtailment in Chile: Key to Unlocking the Full Potential of Renewable Energy, 2025. Last accessed 07.10.2025.
- Zhao, H.; Cui, C.; Zhang, Z. Assessing the dynamics of power curtailment in China: Market insights from wind, solar, and nuclear energy integration. International Journal of Hydrogen Energy 2025, 118, 209–216. [CrossRef]
- Phivos, T.; Rogiros, T.; Petros, A.; Charalambides, A. RES curtailments in Cyprus: A review of technical constraints and solutions. Solar Energy Advances 2025, p. 100097. [CrossRef]
- Qin, Z.; Ma, J.; Zhu, M.; Khan, T. Advancements in energy storage technologies: Implications for sustainable energy strategy and electricity supply towards sustainable development goals. Energy Strategy Reviews 2025, 59, 101710. [CrossRef]
- Enasel, E.; Dumitrascu, G. Storage solutions for renewable energy: A review. Energy Nexus 2025, p. 100391. [CrossRef]
- Le Coq, C.; Bennato, A.R.; Duma, D.; Lazarczyk, E. Flexibility in the Energy Sector. Technical report, Centre on Regulation in Europe (CERRE), 2025. Last accessed 14.10.25 Access here.
- Travaglini, R.; Superchi, F.; Bianchini, A. Mitigating curtailments in offshore wind energy: A comparative analysis of new and second-life battery storage solutions. Journal of Cleaner Production 2025, 519, 146055. [CrossRef]
- Coordinador Eléctrico Nacional (CEN), Gobierno de Chile. Operación: Generación Real, 2022-2025. Last accessed 12.09.25 Access here.
- Coordinador Eléctrico Nacional (CEN), Gobierno de Chile. Operación: Reducciones de Generación Renovable, 2022-2025. Last accessed 12.09.25 Access here.
- Coordinador Eléctrico Nacional (CEN), Gobierno de Chile. Infotécnica, 2024. Last accessed 28.12.24 Access here.
- Superintendencia del Medio Ambiente, Gobierno de Chile. Sistema Nacional de INformación de Fiscalización Ambiental (SNIFA), 2024. Last accessed 28.12.24 Access here.
- Micheli, L.; Soria-Moya, A.; Talavera, D.L.; Abbasi, B.; Fernández, E.F. Energy and economic implications of photovoltaic curtailment: Current status and future scenarios. Sustainable Energy Technologies and Assessments 2025, 81, 104414. [CrossRef]
- Fotis, G.; Maris, T.I.; Mladenov, V. Risks, Obstacles and Challenges of the Electrical Energy Transition in Europe: Greece as a Case Study. Sustainability 2025, 17, 5325. [CrossRef]
- Spiru, P.; Simona, P.L. Wind energy resource assessment and wind turbine selection analysis for sustainable energy production. Scientific Reports 2024, 14, 10708. [CrossRef]
- Albatayneh, A.; AbuAlRous, R.; Kay, M.; Abdallah, R.; Juaidi, A.; García-Cruz, A.; Manzano-Agugliaro, F. Wind farm capacity factor forecasting: An Australian case study. Energy Nexus 2025, p. 100422. [CrossRef]
- Abed, K.; El-Mallah, A. Capacity factor of wind turbines. Energy 1997, 22, 487–491. [CrossRef]
- Benalcazar, P.; Komorowska, A. Techno-economic analysis and uncertainty assessment of green hydrogen production in future exporting countries. Renewable and Sustainable Energy Reviews 2024, 199, 114512. [CrossRef]
- Qiao, Q.; Zeng, X.; Lin, B. Mitigating wind curtailment risk in China: The impact of subsidy reduction policy. Applied energy 2024, 368, 123493. [CrossRef]
- International Energy Agency (IEA). Renewables 2017: Analysis and Forecast to 2022. Technical report, International Energy Agency (IEA), 2017. Last accessed 14.10.2025 Access here.
- Lewis, J.I. Wind energy in China: Getting more from wind farms. Nature Energy 2016, 1, 1–2. [CrossRef]
- Eriksen, P.B. The transition of the Danish power system from a fossil fueled system to presently having 40% wind penetration. In Proceedings of the In Grand Renewable Energy Conference, Yokohama, Japan, June 2018.
- Martín-Martínez, S.; Lorenzo-Bonache, A.; Honrubia-Escribano, A.; Cañas-Carretón, M.; Gómez-Lázaro, E. Contribution of wind energy to balancing markets: The case of Spain. Wiley Interdisciplinary Reviews: Energy and Environment 2018, 7, e300. [CrossRef]
- Coordinador Eléctrico Nacional (CEN), Gobierno de Chile. Propuesta final de expansión de la transmisión: Proceso de planificación de la transmisión, 2025. Gerencia planificación y desarrollo de la red. Last accessed 05.10.2025 Access here.
- American Clean Power Association. Clean Power Annual Market Report 2021, 2022. Last accessed 08.10.2025 Access here.
- Garcia-Sanz, M.; Marden, M.; Cvetkovic, I.; Oh, H.; LoCicero, E.; Khalid, S. Grid Fragility, Blackouts, and Control Co-Design Solutions. Advanced Control for Applications: Engineering and Industrial Systems 2025, 7, e70022. [CrossRef]
- Flores, E.A.; Curi, V.T.; Mattos, S.M.T.; Cayllahua, E.C.; Quezada, P.R.Q. Distributed Generation as a Complement to the Reliability of Electricity Supply: For Peruvian Social Economic Development. Centro Sur 2025, 9, 15–26. [CrossRef]
- Ministerio de Energía, Chile. Decreto 13 Exento, Energía, 2025. Last accessed 08.10.2025 Access here.
Figure 1.
Sample of the wind energy dataset from Tchamma wind park between January 2022-June 2025 in time steps. a) Real generation. b) Curtailed electricity.
Figure 1.
Sample of the wind energy dataset from Tchamma wind park between January 2022-June 2025 in time steps. a) Real generation. b) Curtailed electricity.
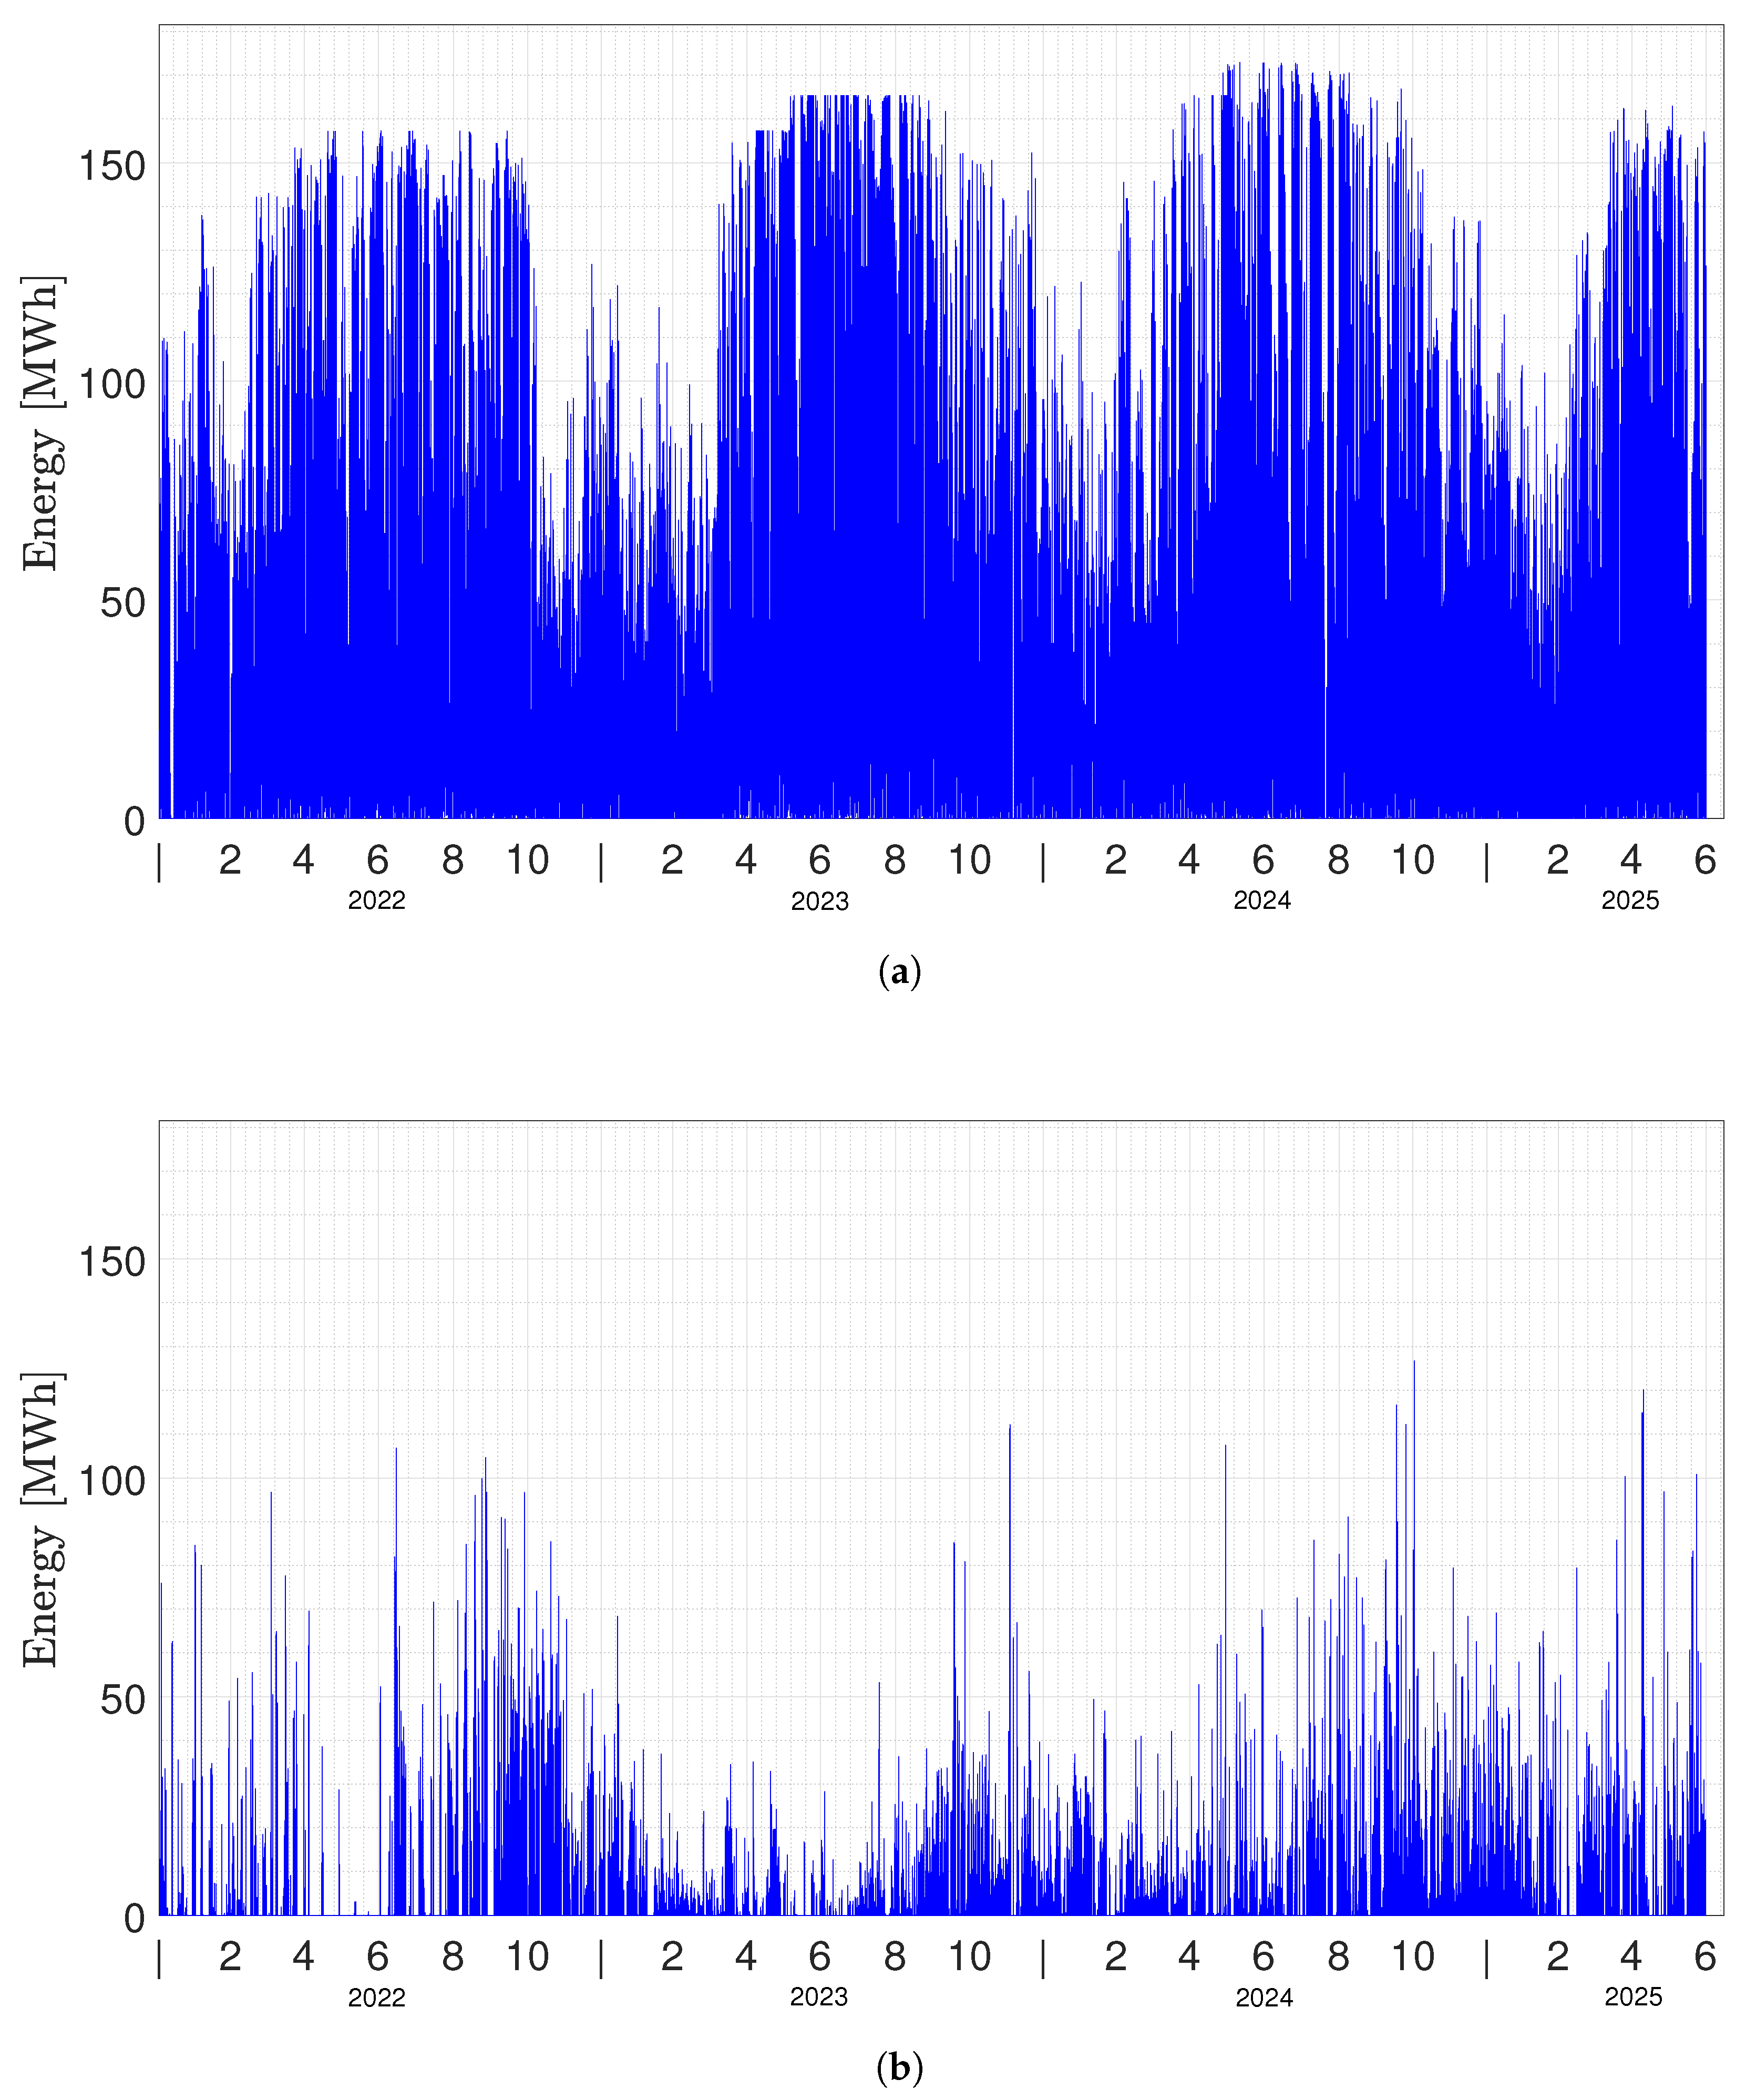
Figure 2.
Percentage of energy distribution over case of study distributed by regions. a) Energy based on nominal power (128.7 TWh). b) Real generation (34TWh). c) Curtailed energy (3.4TWh).
Figure 2.
Percentage of energy distribution over case of study distributed by regions. a) Energy based on nominal power (128.7 TWh). b) Real generation (34TWh). c) Curtailed energy (3.4TWh).
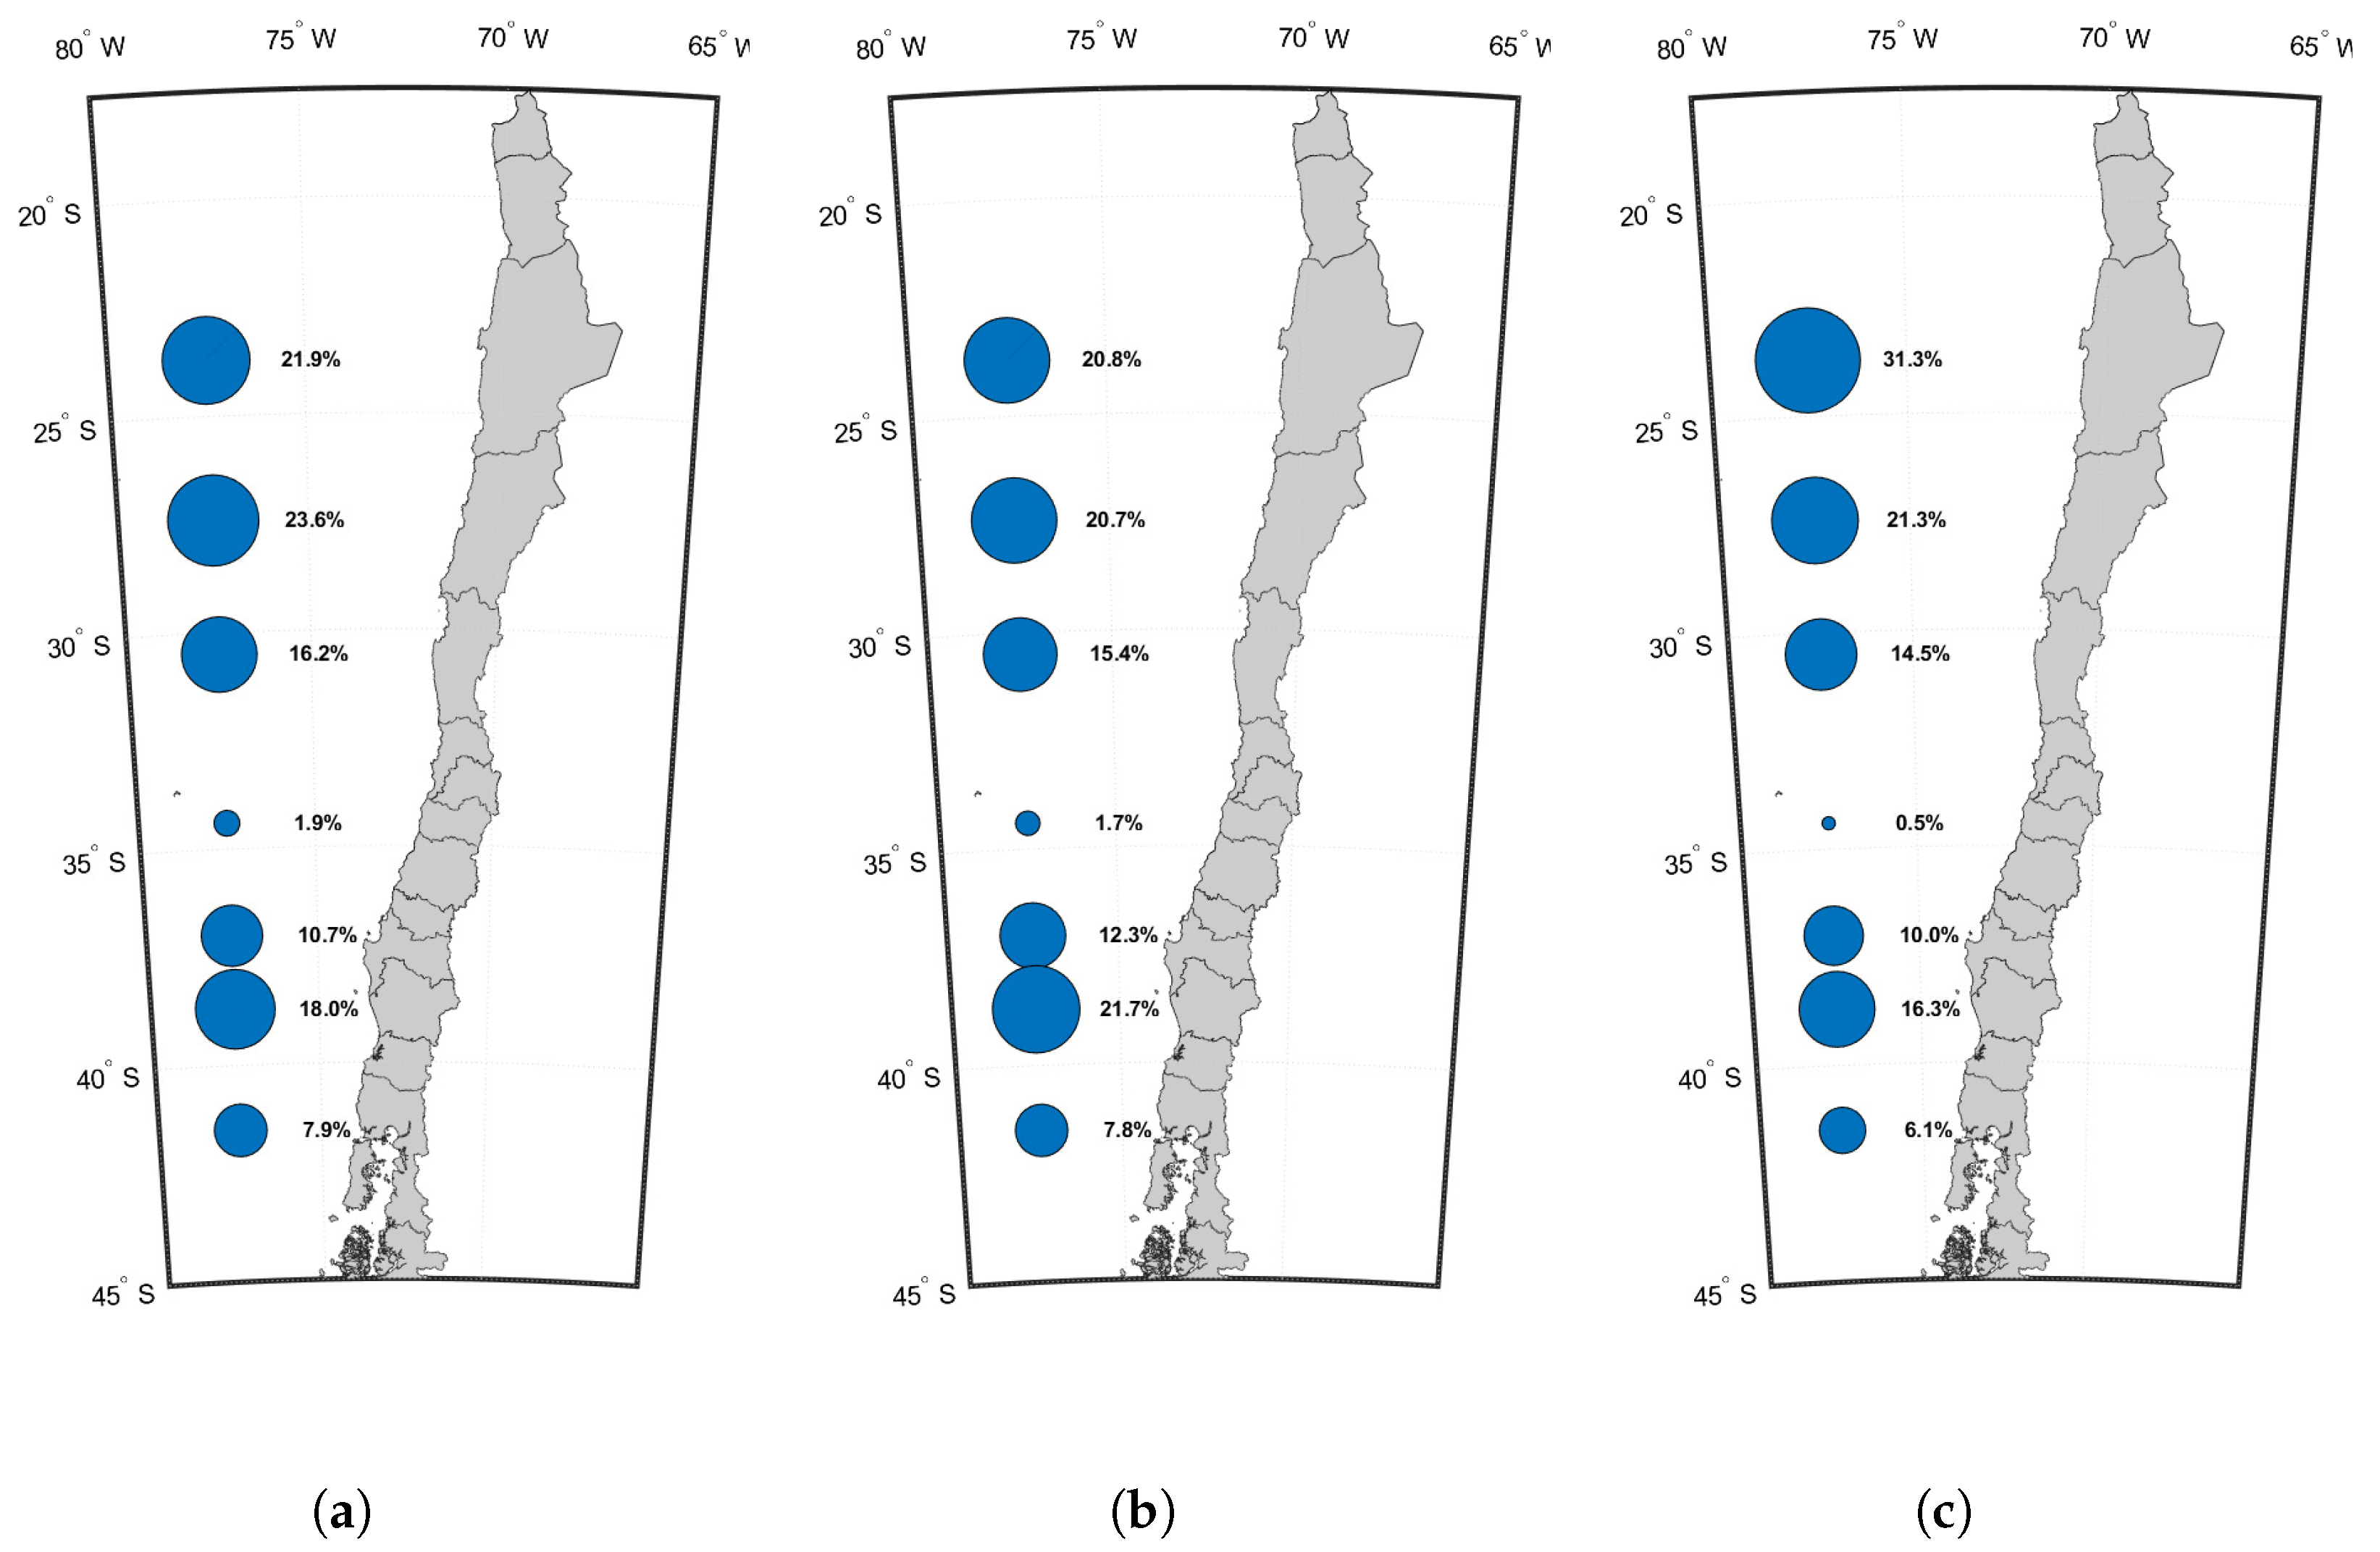
Figure 3.
Percentage of energy contribution comparison between generation and curtailment over three years at different locations.
Figure 3.
Percentage of energy contribution comparison between generation and curtailment over three years at different locations.
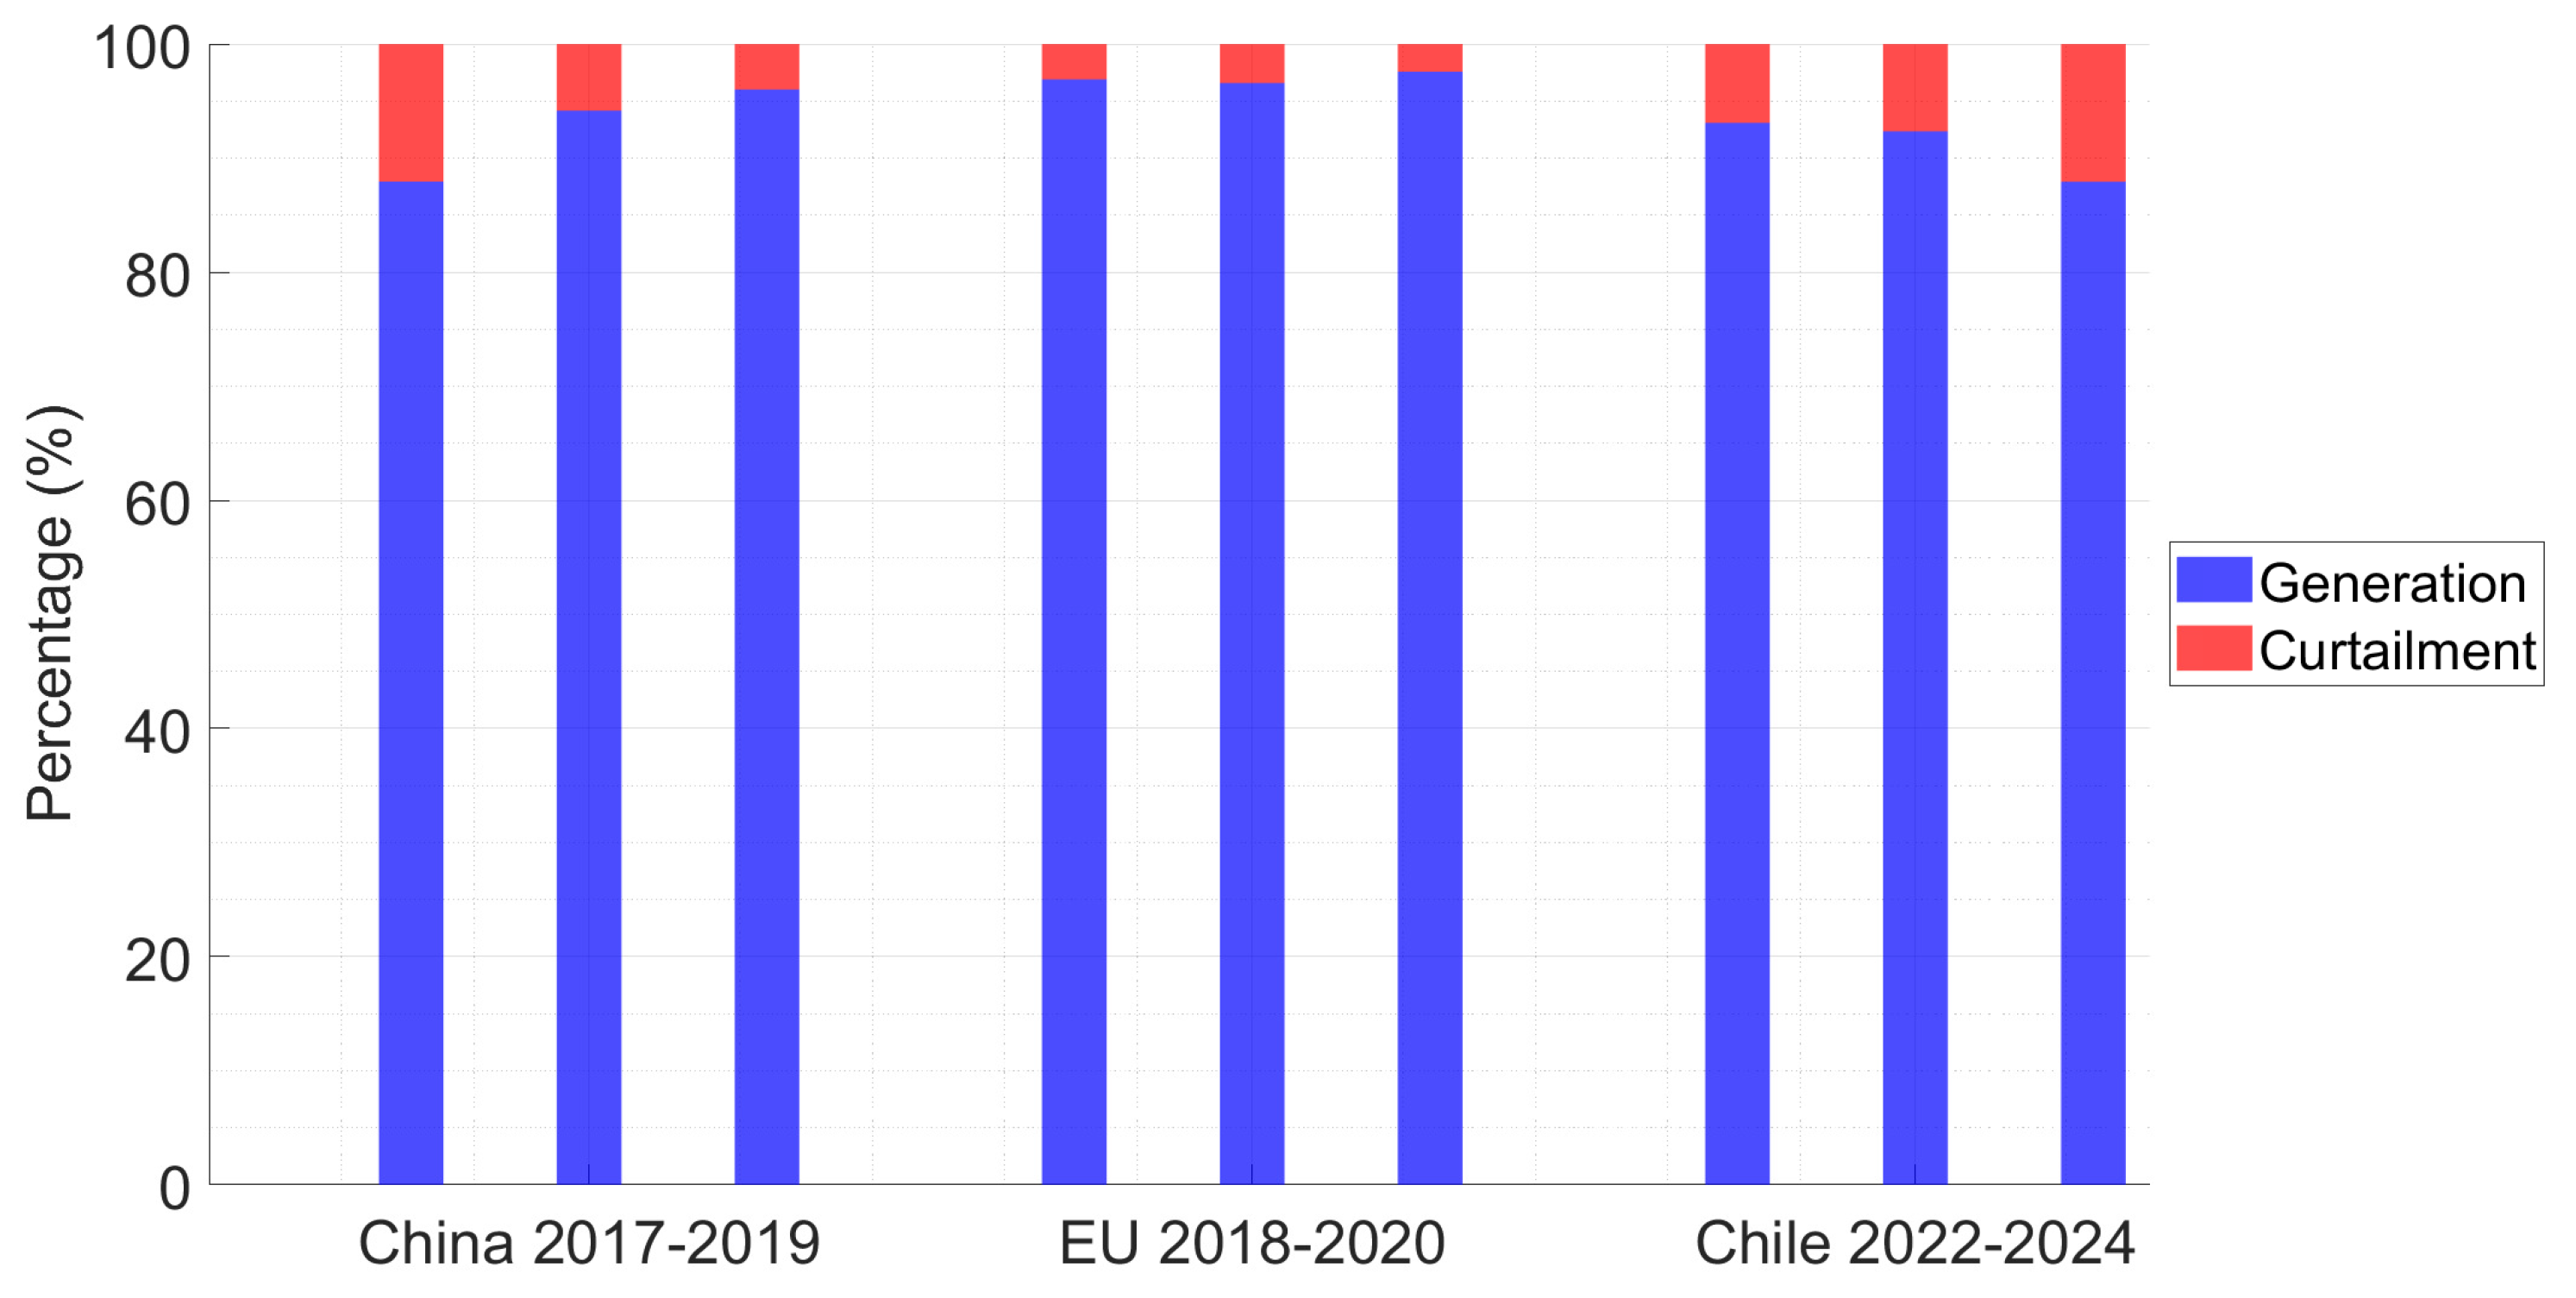
Figure 4.
Stacked energy cumulation over months. In blue, real generation; in red, curtailed electricity.
Figure 4.
Stacked energy cumulation over months. In blue, real generation; in red, curtailed electricity.
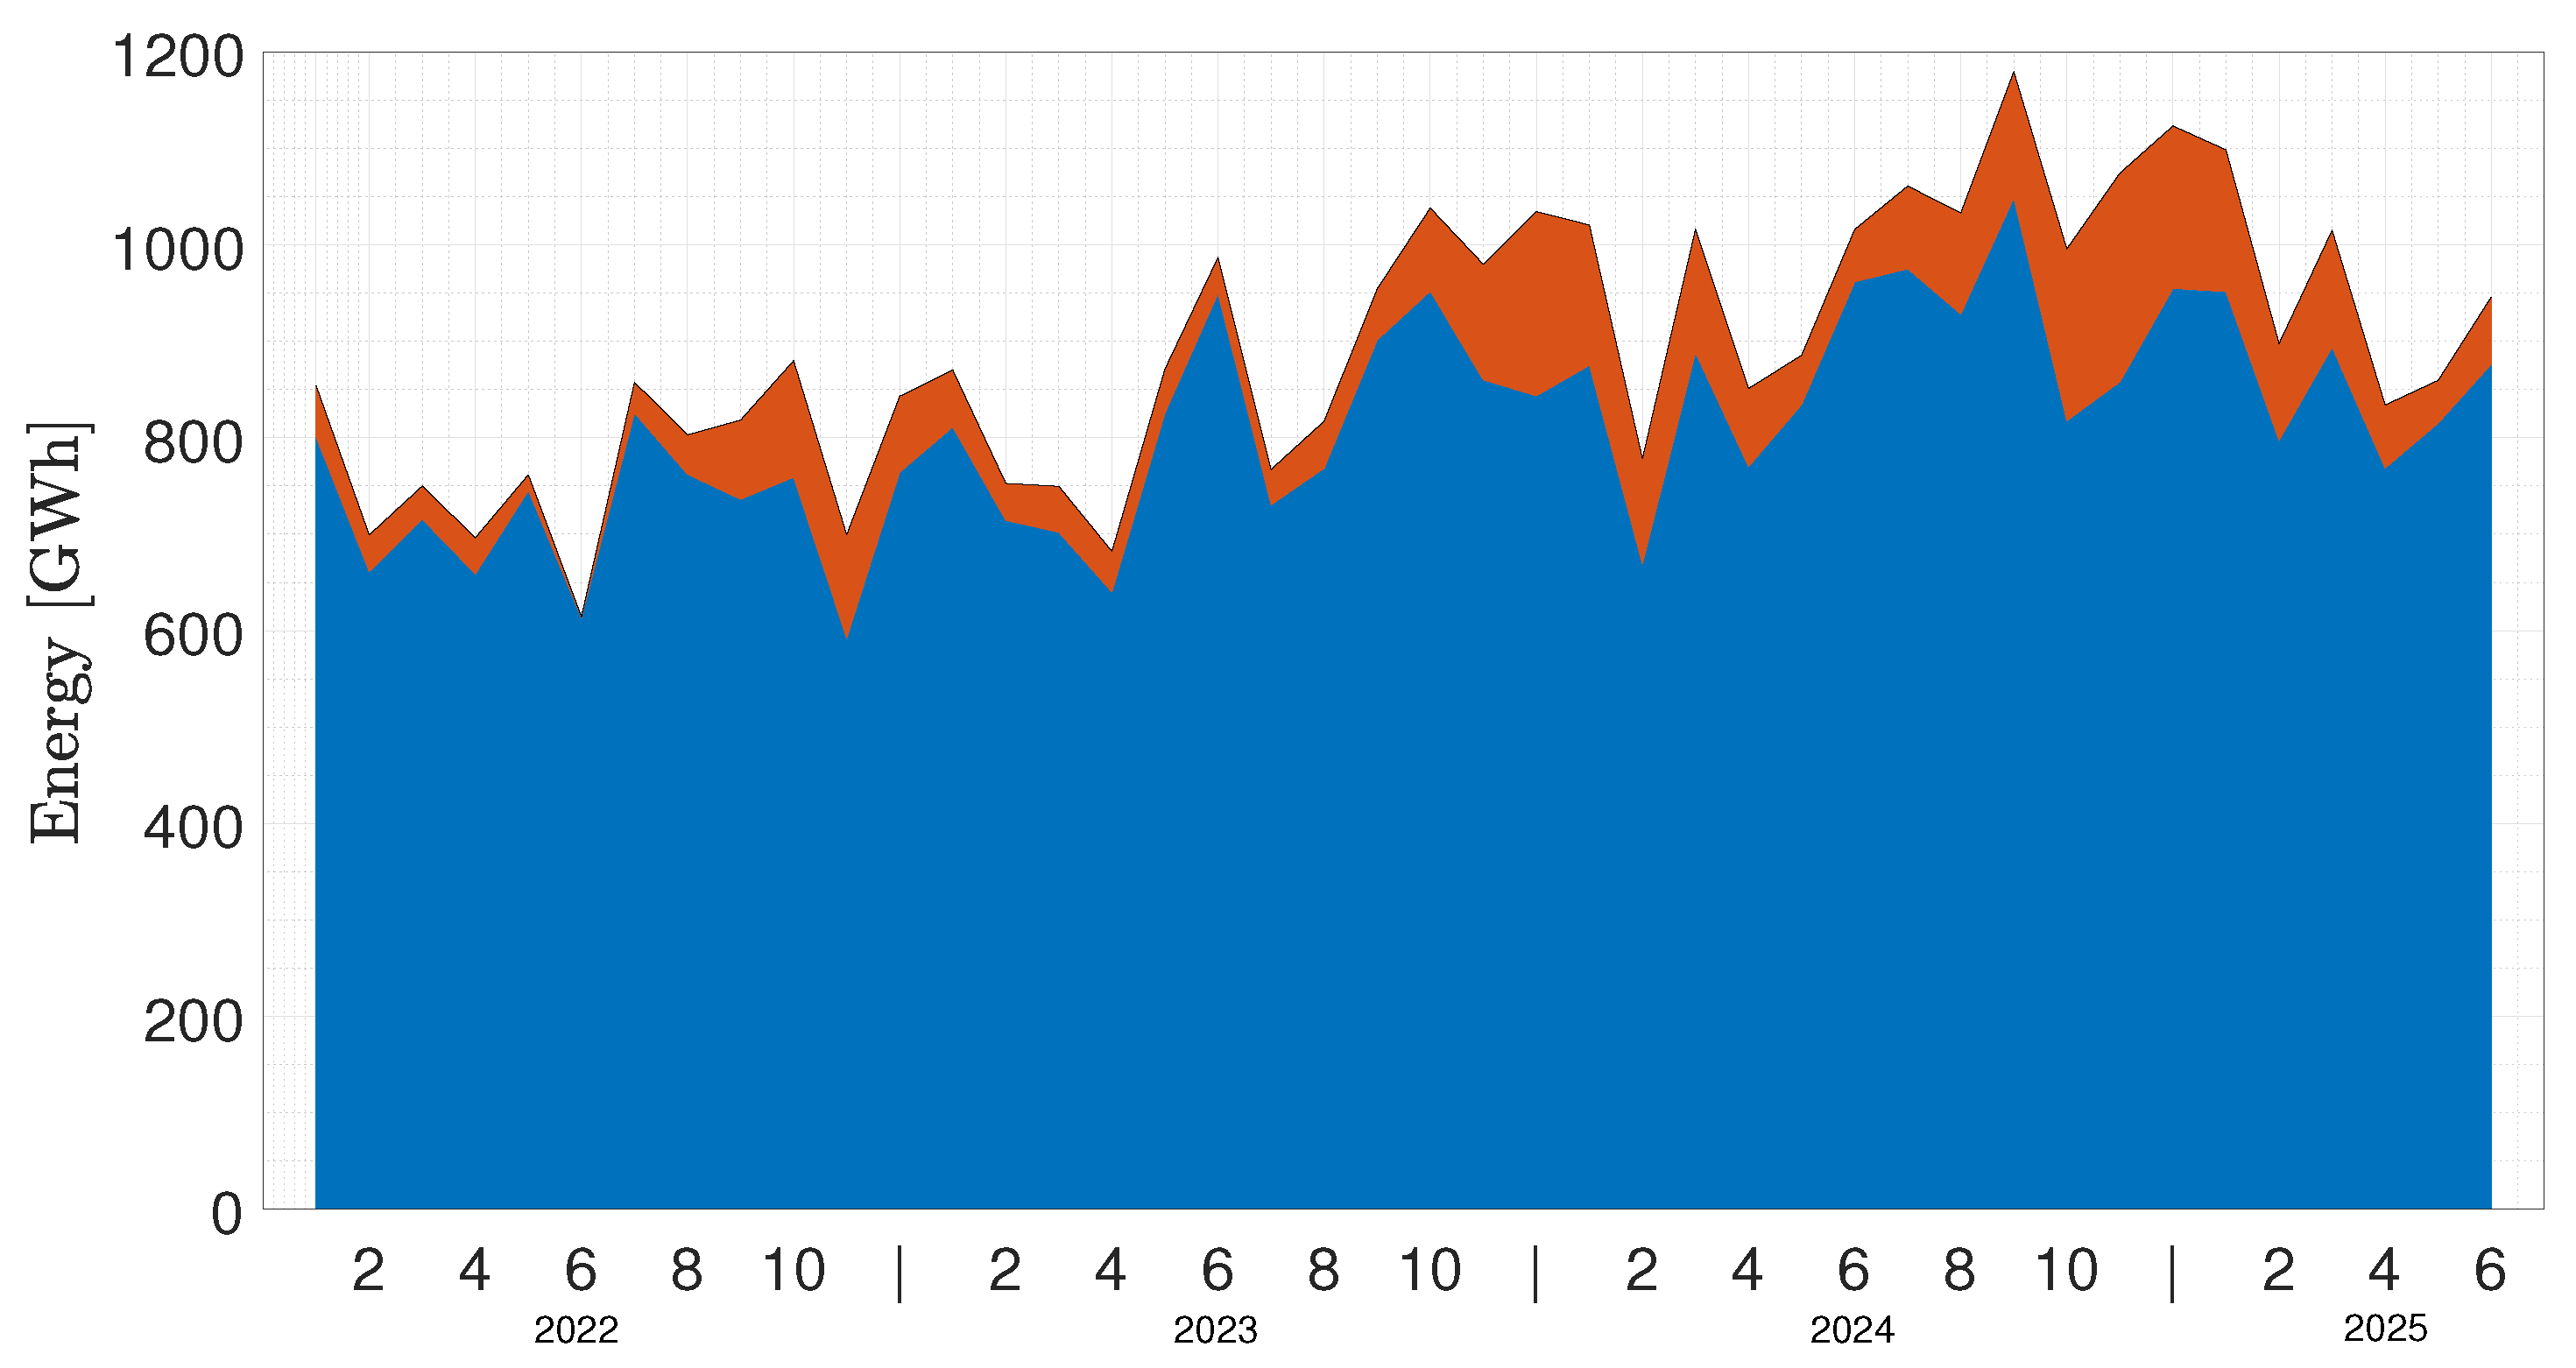
Figure 5.
Monthly evolution of the ratio of curtailed energy (r) and cumulative nominal power.
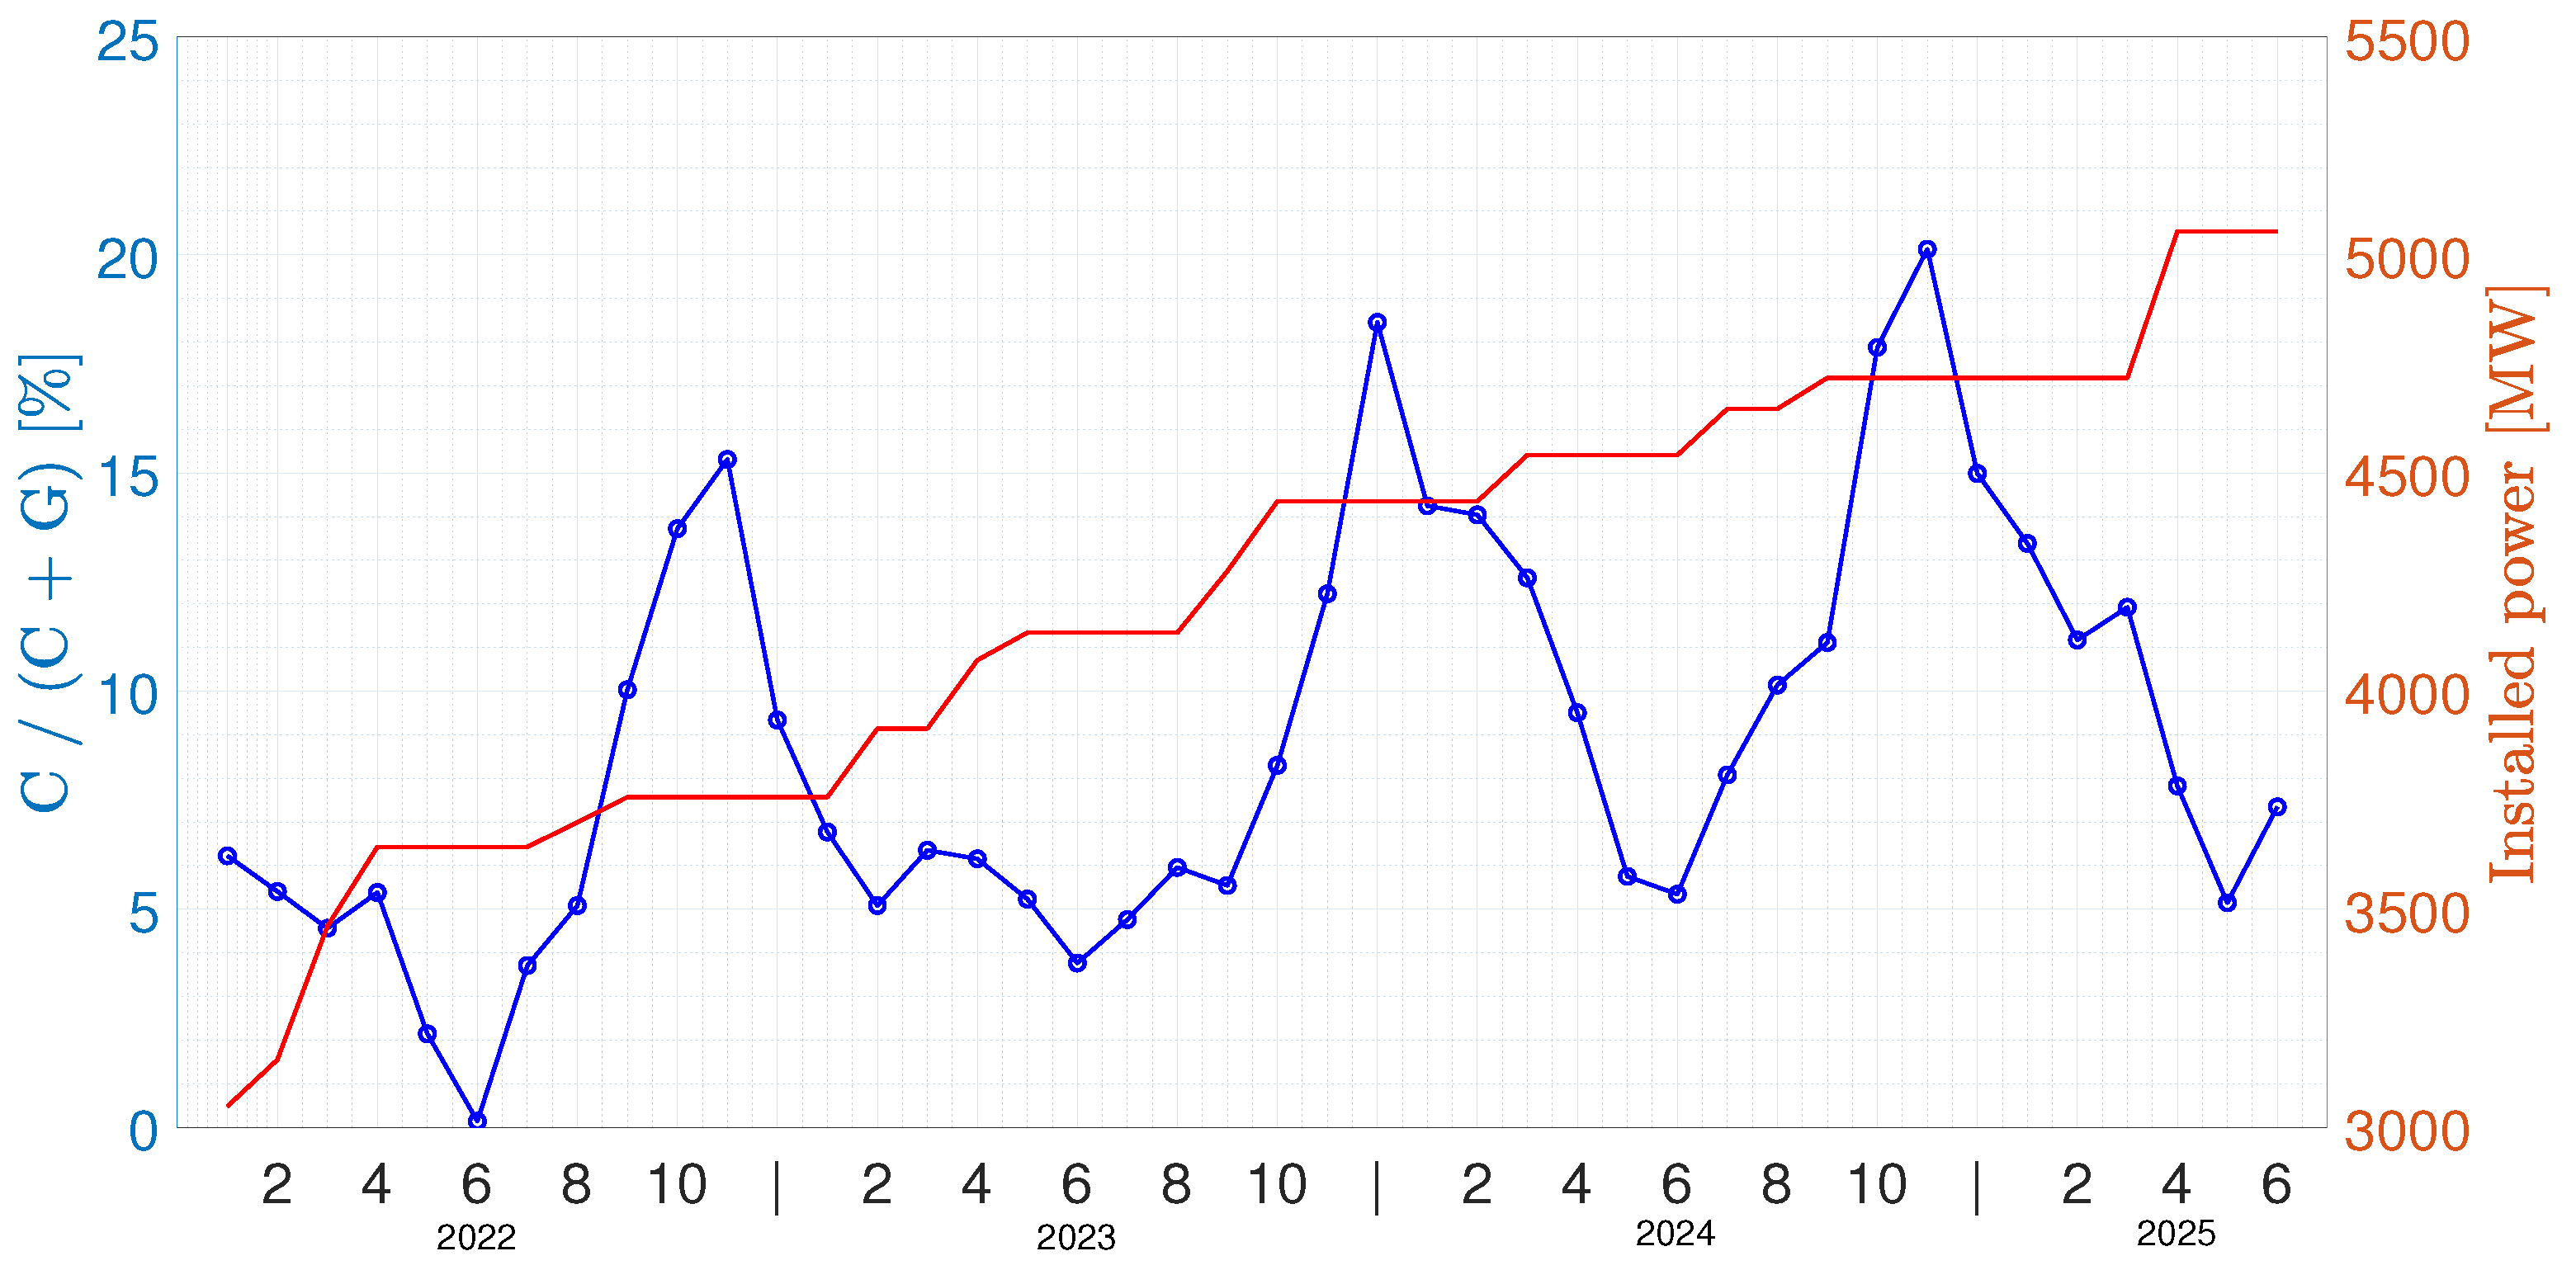
Figure 6.
Curtailed electricity ratios over a day. Curtailment Average it from all projects during operations.
Figure 6.
Curtailed electricity ratios over a day. Curtailment Average it from all projects during operations.
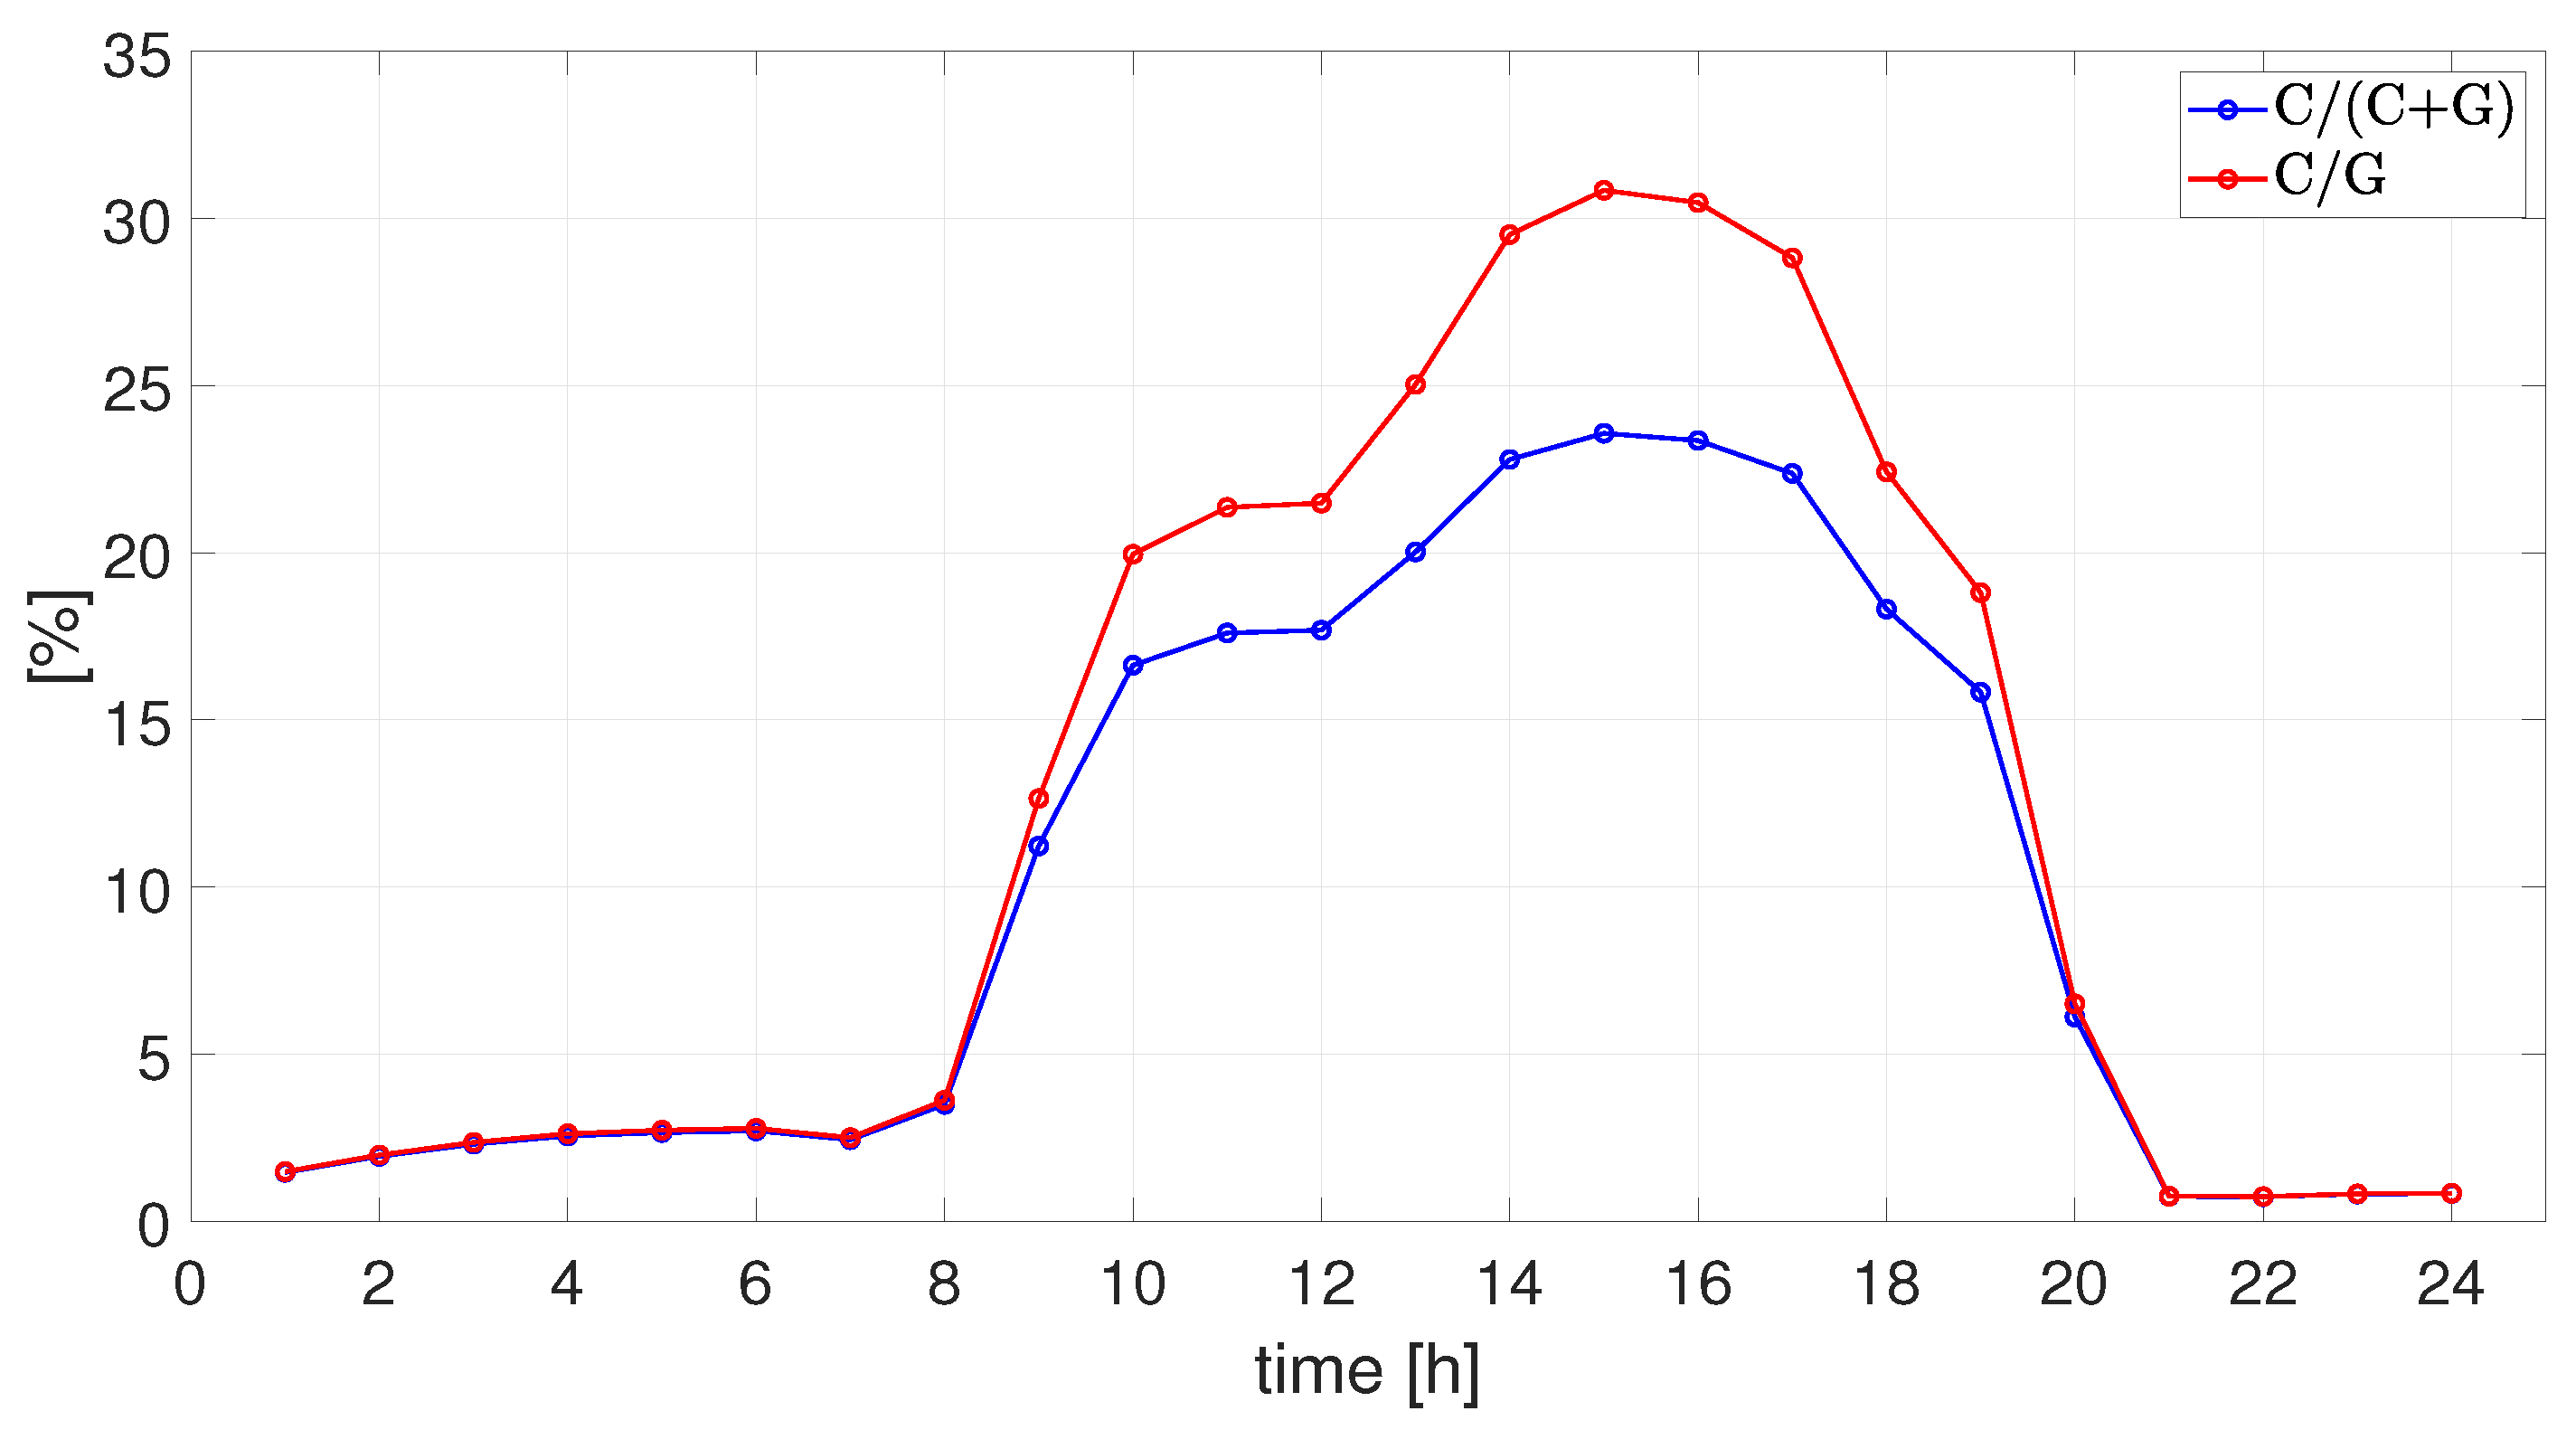

Table 1.
Sample of information from each wind energy park.
| Item | information |
|---|---|
| ID | 1 |
| wind park name | Tchamma |
| Region, code | Antofagasta, AN |
| City | Calama |
| Net effective power, NEP | 171.78 MW |
| east coordinate, UTMWGS84 | 492341 |
| north coordinate, UTMWGS84 | 7511625 |
| Officially operative since | 21.02.2022 |
Disclaimer/Publisher’s Note: The statements, opinions and data contained in all publications are solely those of the individual author(s) and contributor(s) and not of MDPI and/or the editor(s). MDPI and/or the editor(s) disclaim responsibility for any injury to people or property resulting from any ideas, methods, instructions or products referred to in the content. |
© 2025 by the authors. Licensee MDPI, Basel, Switzerland. This article is an open access article distributed under the terms and conditions of the Creative Commons Attribution (CC BY) license ( http://creativecommons.org/licenses/by/4.0/).
Copyright: This open access article is published under a Creative Commons CC BY 4.0 license, which permit the free download, distribution, and reuse, provided that the author and preprint are cited in any reuse.


