Submitted:
16 October 2025
Posted:
17 October 2025
You are already at the latest version
Preprints on COVID-19 and SARS-CoV-2
Abstract
The COVID-19 pandemic caused people worldwide to have continuous mental distress over the years due to ongoing uncertainty, economic instability, and changes in the living environment. However, the perceived stress of individuals is not uniform due to many factors such as their biological differences, gendered social roles, living conditions, and experiences. This study investigates the gendered impact of marital status on mental health, specifically, feelings of nervousness or stress, one year after the COVID-19 pandemic, while controlling sociodemographic variables: age, education, employment, family size, and national-level happiness scores using responses from over 24 countries from COVIDiSTRESS Global Survey II data and explainable machine learning models. Our results revealed that age, gender, and national happiness were the strongest predictors of stress, with relationship status also playing a moderate but meaningful role. Notably, women in dating or cohabitating relationships indicated significantly higher model-inferred stress levels, while marriage appeared more protective, especially for women. These findings highlight the complex interplay between relational, personal, and national factors in shaping mental health outcomes and call for gender-sensitive mental health policies in the post-pandemic period or public health crisis.
Keywords:
perceived stress
; marital status
; gender differences
; machine learning
; SHAP
; mental health
; COVID-19
; Random Forest
; ANOVA
Introduction
The COVID-19 pandemic brought about sudden disruptions to everyday life, social connections, and mental health worldwide (Xiong et al., 2020; Eales et al., 2021; Eugene et al., 2025; Etheridge & Spantig, 2022). As the COVID-19 pandemic unfolded over multiple years, its deep and long-term effects on psychological well-being, which were fueled by ongoing uncertainty, economic volatility, and shifts in family and social dynamics, have gained significant attention from researchers and public health authorities worldwide (Eugene et al., 2025; Etheridge & Spantig, 2022; World Health Organization, 2022).
A person's mental health can be affected by several factors, and marital status is one of these factors. There have been studies that explore the influence of marital status on mental health during the pandemic. Marital status represents many kinds of relationships, such as single, married, separated/divorced, and widowed, etc., and there is evidence showing that married individuals experience less psychological distress compared to unmarried individuals during the COVID-19 pandemic. However, it has been proven that the influence of marital status on mental health is not uniform and varies across genders. For example, it has been shown that married women experience poorer mental health than married men during the pandemic (Thomeer, 2022, and Peng et al.,2022), possibly due to men and women experiencing and coping with psychological distress differently due to their societal roles and expectations. Further, studies showed that the decreasing mental health advantage of being married over being previously married was more noticeable among women (Thomeer, 2022; Bray & Gunnell, 2006). However, no study covers all possible main groups in marital status at once to have a comprehensive understanding and comparison of mental health between each group.
In addition to marital status and gender, a person's mental health is connected to and affected by many sociodemographic factors such as age, educational attainment, economic status, and family composition (McGinty et al., 2020; Patel et al., 2022; Jace & Makridis, 2021; Green et al., 2023). Furthermore, beyond individual experience, the national context, specifically, how happy or satisfied people are with their overall lives, which indicates social support and community well-being can exert a considerable influence on mental health (Uddin et al.,2025; Bray & Gunnell, 2006). Therefore, it is important to consider these confounding factors as much as possible and remove their influence to have a clear understanding of how marital status influences mental health by gender.
Therefore, this study investigates the influence of marital status on mental health, specifically feelings of nervousness and stress, by gender while controlling for age, family size, employment status, and education, and incorporating national happiness to address the identified literature gap. The study includes the main relationship status: single, dating, cohabitating, married, separated/divorced, widowed, and others/would not say. Utilizing data collected approximately one year after the COVID-19 pandemic for 24 countries with more than 200 participants in the COVIDiSTRESS Global Survey II (Blackburn et al., 2022) and two machine learning classifiers with SHapley Additive exPlanations (SHAP), the study aims to do a cross-country analysis to understand how personal and national-level factors interact to shape mental health outcomes, particularly during the long-term recovery period following the COVID-19 pandemic. Results showed that the age, gender, and happiness score following relationship status contributed mostly to predicting stress. Further, dating and cohabitating woman experience high stress compared to male and married and widowed women experience less stress in average compared to women in other relationships.
Hence, the results of this study will enhance the literature by doing a cross-country study about mental health during health crises as well as performing an improved version of previous studies on a gendered analysis of the impact of marital status on mental health by considering many relationship statuses and controlling more confounding factors such as age, education level, employment status, family composition, and people’s satisfaction of their life in general (country’s happiness score). In addition, the findings of this study will help target mental health interventions and public policy efforts to support vulnerable subgroups during the post-crisis recovery period.
Literature Review
The COVID-19 pandemic has exerted profound psychological effects across diverse populations globally, prompting extensive scholarly inquiry into the interplay between sociodemographic factors and mental health outcomes. Among these factors, marital status emerges as a pivotal determinant, differentially impacting mental health in females compared to males. This review synthesizes existing literature addressing how marital status influences mental health disparities by gender during the pandemic, with particular attention to the moderating roles of country context, family composition, education, occupation, and age on mental health.
Many studies have been done to show the disparity in mental health between gender groups. McLean et al. (2011) showed that women diagnosed with each anxiety disorder, except for social anxiety, in their lifetime more than men. Similar results were shown in the studies of Riecher-Rössler (2010) and McLean et al. (2011). A study done by Etheridge & Spantig (2022) showed that women experienced a decrease in mental health that was over two times greater than the decrease experienced by men in the UK during the pandemic. Kang et al. (2023) showed that in Korea, women experienced more psychological distress during and post-vaccine periods than men.
When considering the relationship status, a study done by Thomeer (2023) highlighted the amplified mental health disparity based on the relationship status by gender during the COVID-19 pandemic. The data were collected using a nationally representative US survey conducted between May and December 2020, and the results showed that as the pandemic progressed, never-married individuals experienced the steepest health decline over time, even after accounting for pandemic-related stressors, such as food insecurity. In contrast, divorced/separated and widowed individuals' mental health disadvantages shrank relative to married people over the same period. Further, the results show that when it came to mental health, the increasing benefits of being married compared to never being married were more evident among men. In contrast, the decreasing mental health advantage of being married over being previously married was more noticeable among women. Also, Peng et al. (2022) performed a study on healthcare workers and related academic staff in the UK and showed that married women reported mental health is significantly lower than married men. In contrast, single women reported significantly lower mental health compared to both married women and men during COVID-19.
Moreover, a study by Jace and Makridis (2021) showed that married individuals are less likely to experience negative mental health outcomes by one to two percent compared to unmarried individuals due to a decline in work-related income, indicating the economic and psychological benefits brought by marriage. The experimental data were collected through a Household Pulse Survey (the Pulse), an online survey designed by the US Census Bureau, from April 23 to May 20, 2020. Also, Eugene et al. (2025) showed that the women who faced a decrease in income due to the pandemic had higher depression. In contrast, the study done by Sieverding et al. (2023) to explore the effect of COVID-19 on the mental health of Middle Eastern and North African countries, which are known to have low to middle-income countries, showed that mental health is negatively associated with employment and income loss, without having a gender differential result. McGinty et al. (2020) showed that individuals who earned less than $35000 in the USA were more likely to have mental distress during the COVID-19 pandemic.
Further, family composition is another factor that influences mental health. Yerkes et al. (2020) demonstrated that mothers in the Netherlands continued to shoulder more childcare and household responsibilities and had less time than fathers during the lockdown period. The burden that comes from this inequality can vary depending on the family composition, resulting in mental health problems. Green et al. (2023) found that couples with children experienced a higher level of perceived stress compared to couples without children in the UK. Additionally, single individuals with no children showed more distress than couples with no children, while single parents showed the highest distress.
In addition, age and education are other factors that influence mental health. A study conducted in the US in July 2020 found that adults aged 18 to 29 years are more likely to experience distress (McGinty et al., 2020). A study done in the UK showed that adults between 25 and 44 years have an increase in psychological distress compared to other age groups due to the effects of the COVID-19 pandemic (Patel et al., 2022). Besides, the results of this study showed that individuals with a degree experience lower psychological distress than individuals who have a lower level of education than a degree.
Furthermore, the mental health outcome can differ based on an individual's economy, social support, or a country's happiness score, among other factors. Uddin et al. (2025) demonstrated an association between social support and mental health in Bangladesh. Likewise, Bray and Gunnell (2006) studied the relationship between life satisfaction, happiness, and suicide rates in 34 countries in Europe. The results showed that there is a negative correlation between suicide rates and both life satisfaction and happiness. However, when analyzed by the subgroup, the life satisfaction and suicide rate had a negative association in Eastern European countries but had a positive association in Western European countries.
Despite substantial advancement, significant gaps remain. One major gap is that no study has comprehensively examined all possible relationship statuses to compare mental health across each group. In addition, past research shows that marriage can help protect mental health. However, this effect is complex, especially when combined with factors such as education, employment status, family composition, age, and the community's economic status. Therefore, to have a clear understanding of how marital status impacts mental health by gender, it requires approaches acknowledging these layered interdependencies. Hence, it helps to identify the vulnerable groups that need mental health support in the face of public health crises or the post-recovery period.
Data and Methodology
Data and Data Preparation
This study focuses on exploring how marital status affects mental health, specifically feelings of nervousness and stress, by gender while controlling for age, family size, employment status, education, and national happiness. Data is drawn from two datasets. The primary data source is the COVIDiSTRESS Global Survey – Round II (Blackburn et al., 2022), conducted from May to August 2021 across 137 countries (Table 1). It was conducted as part of the COVIDiSTRESS Consortium project (Yamada et al., 2021) to collect data and evaluate the impact of COVID-19 approximately one year after the pandemic. The survey collected data in 48 languages and dialects through Qualtrics, with support from over 150 researchers worldwide, enabling cross-cultural studies. The resulting final cleaned dataset “Final_COVIDiSTRESS_Vol2_cleaned.csv”, which is available at the Open Science Framework: OSF | COVIDiSTRESS Global Survey - Round II, under Final Data set [cleaned] COVIDiSTRESS II (Parry et al., 2022; Blackburn et al., 2022), included responses from 15,740 participants aged 18 or older and is used for this study.
For analysis, countries with more than 200 respondents were selected, resulting in an initial sample of 12,831 participants from 24 countries. Demographic variables extracted include residing country, age, gender (male, female, other/would not say), highest level of education (ranging from less than 6 years of schooling to doctorate level), occupation (student, self-employed, full-time employed, part-time employed, unemployed, or retired), relationship status, and living arrangements related to household adults and children (living alone, number of cohabitating people: adults(18+), children: (0-4, 5-11,12-17)) to form independent variables. The survey measured Mental health status using the Perceived Stress Scale (PSS-10; Cohen et al., 1983). The third item, which assessed the frequency of feeling "nervous and stressed" over the past month, was rated on a 0–4 scale (never to very often) and selected to serve as the dependent variable, perceived stress.
Data preprocessing involved several steps to ensure quality and relevance. Responses missing critical demographic (age, gender, residing country, education, occupation, relationship status, live alone ) or perceived stress data (192 cases) were removed. When participants indicated they live alone, missing values in cohabitation variables were imputed as zero. The number of cohabiting children was calculated by summing up the cohabiting children in different age groups. To remove outliers and ensure typical household representation, thresholds capturing 99% of data were applied: adults living together capped at 5, and children capped at 4. This outlier removal led to the elimination of 199 participants. Due to the very small proportion (0.83%) identifying as "other/would not say" gender (female: 67.28%, male: 31.89%), the dataset was restricted to male and female participants after removing 103 such cases.
Education level with less than 1% representation (university degree:46.33%, some university/equivalent (not graduated/still ongoing):26.81%, 12 years of schooling: 16.47%, PhD/Doctorate:5.45%, 9 years of schooling: 2.46%, 6 years of scholling:0.48%) was combined with the upper education level to create a “less than 12 years schooling” category. Employment status was derived from the occupation variable, which can have more than one choice in the following order: respondents selecting self-employed, full-time, or part-time employed were classified as employed; those selecting unemployed were categorized as unemployed; others, including students and retirees, were grouped as “others,” resulting 68.53% employed, 22.69% other, 8.77% unemployed sample population. Relationship status retained all categories, as each represented over 1% of responses: married (33.70%), single (30.96%), cohabiting (15.02%), separated/divorced (5.03%), other or would not say (1.8%), and widowed (1.05%). After these modifications, the final cleaned dataset contained 12,337 participants from 24 countries.
To incorporate contextual national factors, the country-level happiness scores from the 2021 World Happiness Report (Helliwell et al., 2021) were matched to respondents by their country of residence. The World Happiness Report stands as the leading global publication on well-being and strategies for its enhancement. The University of Oxford's Well-being Research Centre releases the annual report. This report utilizes the Gallup World Poll's Cantril Ladder scale, which asks respondents to rate their current life on a scale from 0 (worst possible) to 10 (best possible). The analysis used a three-year rolling life evaluation score average to enhance stability.
Figure 1 illustrates the countries included in the final dataset and the number of respondents from each. In the final dataset, the distribution of perceived stress scale responses was 36.22% for scale 2 ("sometimes"), 26.16% for scale 3 ("fairly often"), 16.97% for scale 1 ("almost never"), 15.78% for scale 4 ("very often"), and 4.87% for scale 0 ("never"). Since less than 5% of the sample fell into scale 0, this group was merged with scale 1 to form a consolidated "low" stress category, ensuring sufficient representation and analytical validity. The recategorized stress levels were thus defined on a 0-3 scale as follows: low (combined scales 0 and 1), moderate (scale 2), high (scale 3), and very high (scale 4).
Methodology
To assess the perceived stress level, both eXtreme Gradient Boosting (XGBoost) and Random Forest classifiers were employed (Breiman, 2001; Chen & Guestrin, 2016), with hyperparameter tuning conducted using the Optuna optimization framework (Akiba et al., 2019), employing the Tree-structured Parzen Estimator (TPE) for Bayesian optimization. The macro-averaged F1 score served as the objective for model selection. The dataset was preprocessed by encoding categorical variables using LabelEncoder, and stratified train-test-validation (60:20:20) splits were created using five distinct random seeds to ensure robust performance estimation. Model evaluation metrics included F1-scores and macro-averaged F1-scores calculated on the validation sets. The standard deviation of macro-averaged F1-scores across different seeds for both models was used to determine the most stable model.
Following the best model selection, SHAP values were computed for each trained model using the TreeExplainer (Lundberg & Lee, 2017) to interpret model predictions. SHAP values provide feature-level contribution estimates to the predicted stress levels. After computing SHAP values for all test samples, summary plots were generated to rank feature importance by average impact and to visualize individual feature effects.
SHAP value distributions were visualized using gender-stratified box plots and interaction (estimated marginal means) plots to examine how marital status contributes differently to stress prediction across genders. To investigate the statistical significance of the interaction effect of marital status and gender on stress prediction, a statistical analysis was conducted on the SHAP values corresponding to the relationship status feature. A two-way analysis of variance (ANOVA) was performed with gender and marital status as categorical independent variables and the SHAP values as the dependent variable. This analysis assessed both main and interaction effects. Post hoc pairwise comparisons for marital status were conducted using Tukey’s HSD test.
This comprehensive methodology enabled robust predictive modeling and transparent interpretation of results, facilitating insights into the factors most associated with perceived stress.
Results
Exploratory Data Analysis
In this section, the results of exploratory data analysis were presented. The results showed that males experience less stress or nervousness than their female counterparts across all marital statuses (Figure 2). Married, separated/divorced, or widowed women experience less stress than single, dating, or cohabitating women, with dating women reporting the highest stress levels. These observations confirm that the effect of marital status on mental health differs by gender, supporting the examination of an interaction term.
The correlations among numerical features reveal expected patterns, such as a negative correlation between age and perceived stress, and positive correlations between family size measures and stress levels (Figure 3). However, the correlation coefficients are not strong. Figure 4 and Figure 5 show the perceived stress distribution trends in education and employment status. People with only a school education and those with college or higher education do not show a clear pattern of perceived stress. However, perceived stress decreases within these categories as education level increases (Figure 4). Based on Figure 5, students and retirees experience more stress than employed and unemployed individuals, with employed people experiencing less stress than unemployed people. These results show perceived stress varies across demographic groups, supporting their role as control variables.
Happier countries (e.g., Finland, Switzerland, Norway) tend to have fewer respondents in the highest stress level and more respondents in the low or moderate range, indicating lower perceived stress. In contrast, less happy countries (e.g., Malaysia and Ukraine) show higher percentages of people with high stress, indicating that national well-being might buffer stress levels (Figure 6). However, there are exceptions, such as Japan and Ireland. Japan shows a relatively high percentage in the low stress category (29.9%) despite not ranking at the top for happiness. In comparison, Ireland has a large share of respondents selecting very high stress (35.4%), despite a high happiness ranking. Nevertheless, the graph shows clear differences in stress profiles by country, justifying its role as a control variable in predicting perceived stress.
Inferential Statistics
The initial results of both the Random Forest model and the XGBoost model showed that the models struggled to identify the stress levels correctly, as the F1-scores are lower than 0.5 for many groups in perceived stress (low, moderate, high, very high). Hence, further feature engineering was done to improve the model performance, resulting in low and high stress levels. Low and moderate groups in the initial dataset were combined to create the low stress level group, and high and very high groups were combined to create the high stress level group.
Following further feature engineering on the dataset, both XGBoost and Random Forest models performed comparably in terms of overall classification performance. However, as shown in Table 3, the Random Forest model demonstrated slightly higher F1-scores for both low and high stress level classes, 0.7258 and 0.5429, respectively, along with a much lower standard deviation of macro average F1-score, = 0.002, = 0.006, across five random seeds compared to the XGBoost model. These results suggested that Random Forest was slightly more accurate, stable, and reliable for predicting perceived stress levels than XGBoost. Hence, the Random Forest model was selected as the best model and used for further analysis.
Figure 7 visualizes the mean absolute SHAP values of the Random Forest model. Results showed that age, gender, and happiness score were the top three contributors to predicting stress level, while relationship status ranked fourth, showing a moderate influence. Further, gender, being a highly influential factor, also supported testing for interaction with marital status.
Figure 8 showed that younger ages (blue) pull predictions toward higher stress, while older ages (red) push toward lower stress. Also, females had higher SHAP values while males had lower SHAP values, indicating that females tend to have higher stress levels than males. Countries with the highest happiness score tend to pull the prediction towards negative or lower SHAP values, indicating lower stress, and countries with moderate happiness scores tend to have the prediction towards high SHAP values compared to countries with high and low happiness scores, indicating high stress prediction. Even though it was challenging to identify which relationship status has a high stress level just looking at Figure 8, the apparent clustering in relationship status shows that its effect on prediction differs by relationship status.
Visualization of the SHAP value distribution (Figure 9) and interaction effect (Figure 10) illustrated that females in cohabitating or dating relationships had substantially higher SHAP values than males, indicating that these marital statuses were more influential in predicting stress for women. In contrast, married and widowed females showed more negative SHAP values than their male counterparts, suggesting reduced model-inferred stress contributions in those categories. Moreover, dating relationships have the highest median and mean SHAP values for both genders compared to the other groups. Married groups (both genders) tend to have the lowest SHAP values compared to other groups, but with less spread for males. These results indicate that Females and males have very different SHAP patterns across relationship statuses.
The results of the two-way ANOVA which was conducted to examine the interaction between marital status and gender on the SHAP values derived from the Random Forest model's prediction of perceived stress levels indicated significant main effects for marital status, F(6, 12326) = 12,646.03, p < .001, and gender, F(1, 12326) = 9.11, p = .003. Moreover, there was a significant interaction effect between marital status and gender, F(6, 12326) = 438.57, p < .001, suggesting that the impact of marital status on stress prediction differs by gender.
Post hoc comparisons using Tukey’s HSD revealed significant pairwise differences among most marital status categories (all p < .05), with cohabitating and dating individuals generally showing higher SHAP contributions (indicative of stronger model impact) compared to other groups.
Discussion
This study investigated the influence of marital status on perceived stress levels across genders, accounting for sociodemographic variables (age, education, employment, family size) and national context (happiness score). Using data from the COVIDiSTRESS Global Survey II (Blackburn et al., 2022) across 24 countries, and interpretable machine learning techniques, we addressed a critical gap in the literature: the gendered impact of diverse relationship statuses on mental health in the post-pandemic period while controlling the sociodemographic factors and national context.
Stress levels were binarized into "low" and "high" to improve model performance based on initial poor F1-scores from four-category classification. Between XGBoost and Random Forest, the latter outperformed in both predictive accuracy and consistency across seeds, justifying its selection for interpretability analysis via SHAP.
Results revealed that age, gender, and national happiness were the most influential predictors of stress levels. Relationship status, though not top-ranked, emerged as a moderately strong contributor. SHAP dependence plots indicated that younger individuals and females were more likely to be classified as having high stress, while older age and higher national happiness were associated with lower stress consistent with prior research (Thomeer, 2022; Peng et al., 2022; Uddin et al., 2025).
Additionally, interaction plots between gender and relationship status revealed significant gender differences. Women in cohabitating or dating relationships had substantially higher SHAP values indicating higher predicted stress compared to men. Conversely, married and widowed women had lower SHAP values than men in the same categories, suggesting these statuses buffered stress more for women. These patterns align with findings that the protective mental health effects of marriage are not uniformly distributed and may diminish or reverse for women under certain conditions (Bray & Gunnell, 2006; Thomeer, 2022).
To statistically validate the SHAP-derived patterns, a two-way ANOVA was conducted on SHAP values for relationship_status, including gender as an interaction term. Significant main effects for both marital status and gender were observed, along with a robust interaction effect. Post hoc Tukey tests confirmed that most marital status groups differed significantly, with dating and cohabitating groups showing the highest stress contributions and married groups the lowest.
By leveraging machine learning interpretability tools, this study offers a detailed view of how complex social factors interact to shape mental health in a post-pandemic world. For an example, our results shows that married women tend to feel less nervous and stress compared to married men during post-pandemic. In contrast, Etheridge & Spantig (2022) showed that women experienced decrease in mental health than men in UK during the pandemic. These results showed that the perceived stress experience by individuals cannot be generalized but indeed affected by many factors such as time, living environment, etc. indicating the importance of implementing targeted mental health intervention policies.
Conclusions
This study provides an extensive understanding of how different marital status plays a significant, gender-specific role in shaping mental health outcomes in the post COVID-19 period by extending the existing literature. We found that relationship status, particularly dating and cohabitating, contributed meaningfully to stress predictions, with marked differences by gender using expainable machine learning models trained on a large, multinational dataset. Women in dating or cohabitating relationships were at heightened risk for stress, while marriage appeared more protective, especially for women. These findings confirm and expand upon prior research that has highlighted gender asymmetries in the mental health impact of relational status. As this study showed evidence of importance of time when assessing the mental health of individuals, this study can extend to examine how the observed results change over time.
Data Availability Stetement
The data that support the findings of this study are publicly available in the COVIDiSTRESS Global Survey – Round II dataset at https://osf.io/36tsd/overview (Blackburn et al., 2022) and the 2021 World Happiness Report at https://www.worldhappiness.report/data-sharing/ (Helliwell et al.,2021). The data generated and analyzed during this study are openly available in the GitHub repository, https://github.com/Csenevirathna/covid19-mental-health-shap.
Acknowledgments
I would like to thank Dr. Ziyuan Huang and Dr. Maria Vaida for their advice and supervision.
Conflicts of Interest
The author declares no conflict of interest.
References
- Akiba, T.; Sano, S.; Yanase, T.; Ohta, T.; Koyama, M. Optuna: A next-generation hyperparameter optimization framework. In Proceedings of the 25th ACM SIGKDD International Conference on Knowledge Discovery & Data Mining; Association for Computing Machinery, 2019; pp. 2623–2631. [Google Scholar] [CrossRef]
- Bauer, D. J.; Sterba, S. K. Fitting multilevel models with ordinal outcomes: Performance of alternative specifications and methods of estimation. Psychological Methods 2011, 16(4), 373–390. [Google Scholar] [CrossRef] [PubMed]
- Blackburn, A.M.; Vestergren, S. & the COVIDiSTRESS II Consortium COVIDiSTRESS diverse dataset on psychological and behavioural outcomes one year into the COVID-19 pandemic. Scientific Data 2022, 9, 331. [Google Scholar] [CrossRef] [PubMed]
- Bray, I.; Gunnell, D. Suicide rates, life satisfaction and happiness as markers for population mental health. Social Psychiatry and Psychiatric Epidemiology 2006, 41(5), 333–337. [Google Scholar] [CrossRef] [PubMed]
- Breiman, L. Random forests. Machine Learning 2001, 45(1), 5–32. [Google Scholar] [CrossRef]
- Chen, T.; Guestrin, C. XGBoost: A scalable tree boosting system. In Proceedings of the 22nd ACM SIGKDD International Conference on Knowledge Discovery and Data Mining; Association for Computing Machinery, 2016; pp. 785–794. [Google Scholar] [CrossRef]
- Cohen, S.; Kamarck, T.; Mermelstein, R. A Global Measure of Perceived Stress. Journal of Health and Social Behavior 1983, 24(4), 385–396. [Google Scholar] [CrossRef]
- Eales, L.; Ferguson, G. M.; Gillespie, S.; Smoyer, S.; Carlson, S. M. Family resilience and psychological distress in the COVID-19 pandemic: A mixed methods study. Developmental Psychology 2021, 57(10), 1563–1581. [Google Scholar] [CrossRef]
- Etheridge, B.; Spantig, L. The gender gap in mental well-being at the onset of the Covid 19 pandemic: Evidence from the UK. European Economic Review 2022, 145, 104114. [Google Scholar] [CrossRef]
- Eugene, D.; Nöthling, J.; Tarsitani, L.; et al. Mental health during the Covid-19 pandemic: An international comparison of gender-related home and work-related responsibilities, and social support. Archives of Women's Mental Health 2025, 28, 359–374. [Google Scholar] [CrossRef]
- Green, M.J.; Craig, P.; Demou, E.; et al. Understanding inequalities in mental health by family structure during COVID-19 lockdowns: Evidence from the UK Household Longitudinal Study. Annals of General Psychiatry 2023, 22, 24. [Google Scholar] [CrossRef]
- Hedeker, D. Methods for multilevel ordinal data in prevention research. Prevention Science 2015, 16(7), 997–1006. [Google Scholar] [CrossRef]
- Helliwell, J. F.; Layard, R.; Sachs, J.; De Neve, J.-E. (Eds.) World Happiness Report 2021. In Sustainable Development Solutions Network; New York, 2021; Available online: https://worldhappiness.report/data-sharing/.
- Jace, C. E.; Makridis, C. A. Does marriage protect mental health? Evidence from the COVID-19 pandemic. Social Science Quarterly. Advance online publication, 2021. [Google Scholar] [CrossRef]
- Kang, M.; Yu, S.; Choe, S. A.; Moon, D.; Ki, M.; Chun, B. C. Gender inequalities in mental health during the COVID-19 pandemic: A population-based study in Korea. Journal of Preventive Medicine and Public Health 2023, 56(5), 413–421. [Google Scholar] [CrossRef]
- Lundberg, S. M.; Lee, S.-I. A unified approach to interpreting model predictions. Advances in Neural Information Processing Systems 2017, 30. Available online: https://proceedings.neurips.cc/paper_files/paper/2017/hash/8a20a8621978632d76c43dfd28b67767-Abstract.html.
- McGinty, E. E.; Presskreischer, R.; Anderson, K. E.; Han, H.; Barry, C. L. Psychological distress and COVID-19–related stressors reported in a longitudinal cohort of US adults in April and July 2020. JAMA 2020, 324(24), 2555–2557. [Google Scholar] [CrossRef] [PubMed]
- McLean, C. P.; Asnaani, A.; Litz, B. T.; Hofmann, S. G. Gender differences in anxiety disorders: Prevalence, course of illness, comorbidity and burden of illness. Journal of Psychiatric Research 2011, 45(8), 1027–1035. [Google Scholar] [CrossRef] [PubMed]
- Parry, D. A.; Blackburn, A. M.; Griffin, S. M., I; zer, G.; Stoeckli, S.; Vestergren, S.; Tran, T. P. Weekly data uploads. 14 April 2022. Available online: https://osf.io/xf4e8/files/osfstorage.
- Patel, K.; Robertson, E.; Kwong, A. S. F.; et al. Psychological distress before and during the COVID-19 pandemic among adults in the United Kingdom based on coordinated analyses of 11 longitudinal studies. JAMA Network Open 2022, 5(4), Article e227629. [Google Scholar] [CrossRef]
- Peng, J.; Wu, W. H.; Doolan, G.; et al. Marital status and gender differences as key determinants of COVID-19 impact on wellbeing, job satisfaction and resilience in health care workers and staff working in academia in the UK during the first wave of the pandemic. Frontiers in Public Health 2022, 10, 928107. [Google Scholar] [CrossRef]
- Riecher-Rössler, A. Prospects for the classification of mental disorders in women. European Psychiatry 2009, 25(4), 189–196. [Google Scholar] [CrossRef]
- Sieverding, M.; Krafft, C.; Selwaness, I.; Nassif, A. A. Impacts of the COVID-19 pandemic on subjective wellbeing in the Middle East and North Africa: A gender analysis. PLoS ONE 2023, 18(5), e0286405. [Google Scholar] [CrossRef]
- Thomeer, M. B. Relationship status-based health disparities during the COVID-19 pandemic. Social Currents 2023, 10(1), 17–40. [Google Scholar] [CrossRef]
- Uddin, M. K.; Islam, M. N.; Ahmed, O. COVID-19 concern and stress in Bangladesh: Perceived social support as a predictor or protector. Trends in Psychology 33 2025, 1–17. [Google Scholar] [CrossRef]
- World Health Organization. COVID-19 pandemic triggers 25% increase in prevalence of anxiety and depression worldwide [News release]. 2 March 2022. Available online: https://www.who.int/news/item/02-03-2022-covid-19-pandemic-triggers-25-increase-in-prevalence-of-anxiety-and-depression-worldwide.
- Xiong, J.; Lipsitz, O.; Nasri, F.; et al. Impact of COVID-19 pandemic on mental health in the general population: A systematic review. Journal of Affective Disorders 2020, 277, 55–64. [Google Scholar] [CrossRef]
- Yamada, Y.; Ćepulić, D. B.; Coll-Martín, T.; et al. COVIDiSTRESS Global Survey dataset on psychological and behavioural consequences of the COVID-19 outbreak. Scientific Data 2021, 8, 3. [Google Scholar] [CrossRef]
- Yerkes, M. A.; André, S. C. H.; Besamusca, J. W.; et al. ‘Intelligent’ lockdown, intelligent effects? Results from a survey on gender (in)equality in paid work, the division of childcare and household work, and quality of life among parents in the Netherlands during the Covid-19 lockdown. PLoS ONE 2020, 15(11), e0242249. [Google Scholar] [CrossRef]
Figure 1.
The countries with more than 200 responders. Note: This shows the distribution of perceived stress scales by country, sorted by their happiness score, with Finland at the top with the highest happiness score.
Figure 1.
The countries with more than 200 responders. Note: This shows the distribution of perceived stress scales by country, sorted by their happiness score, with Finland at the top with the highest happiness score.
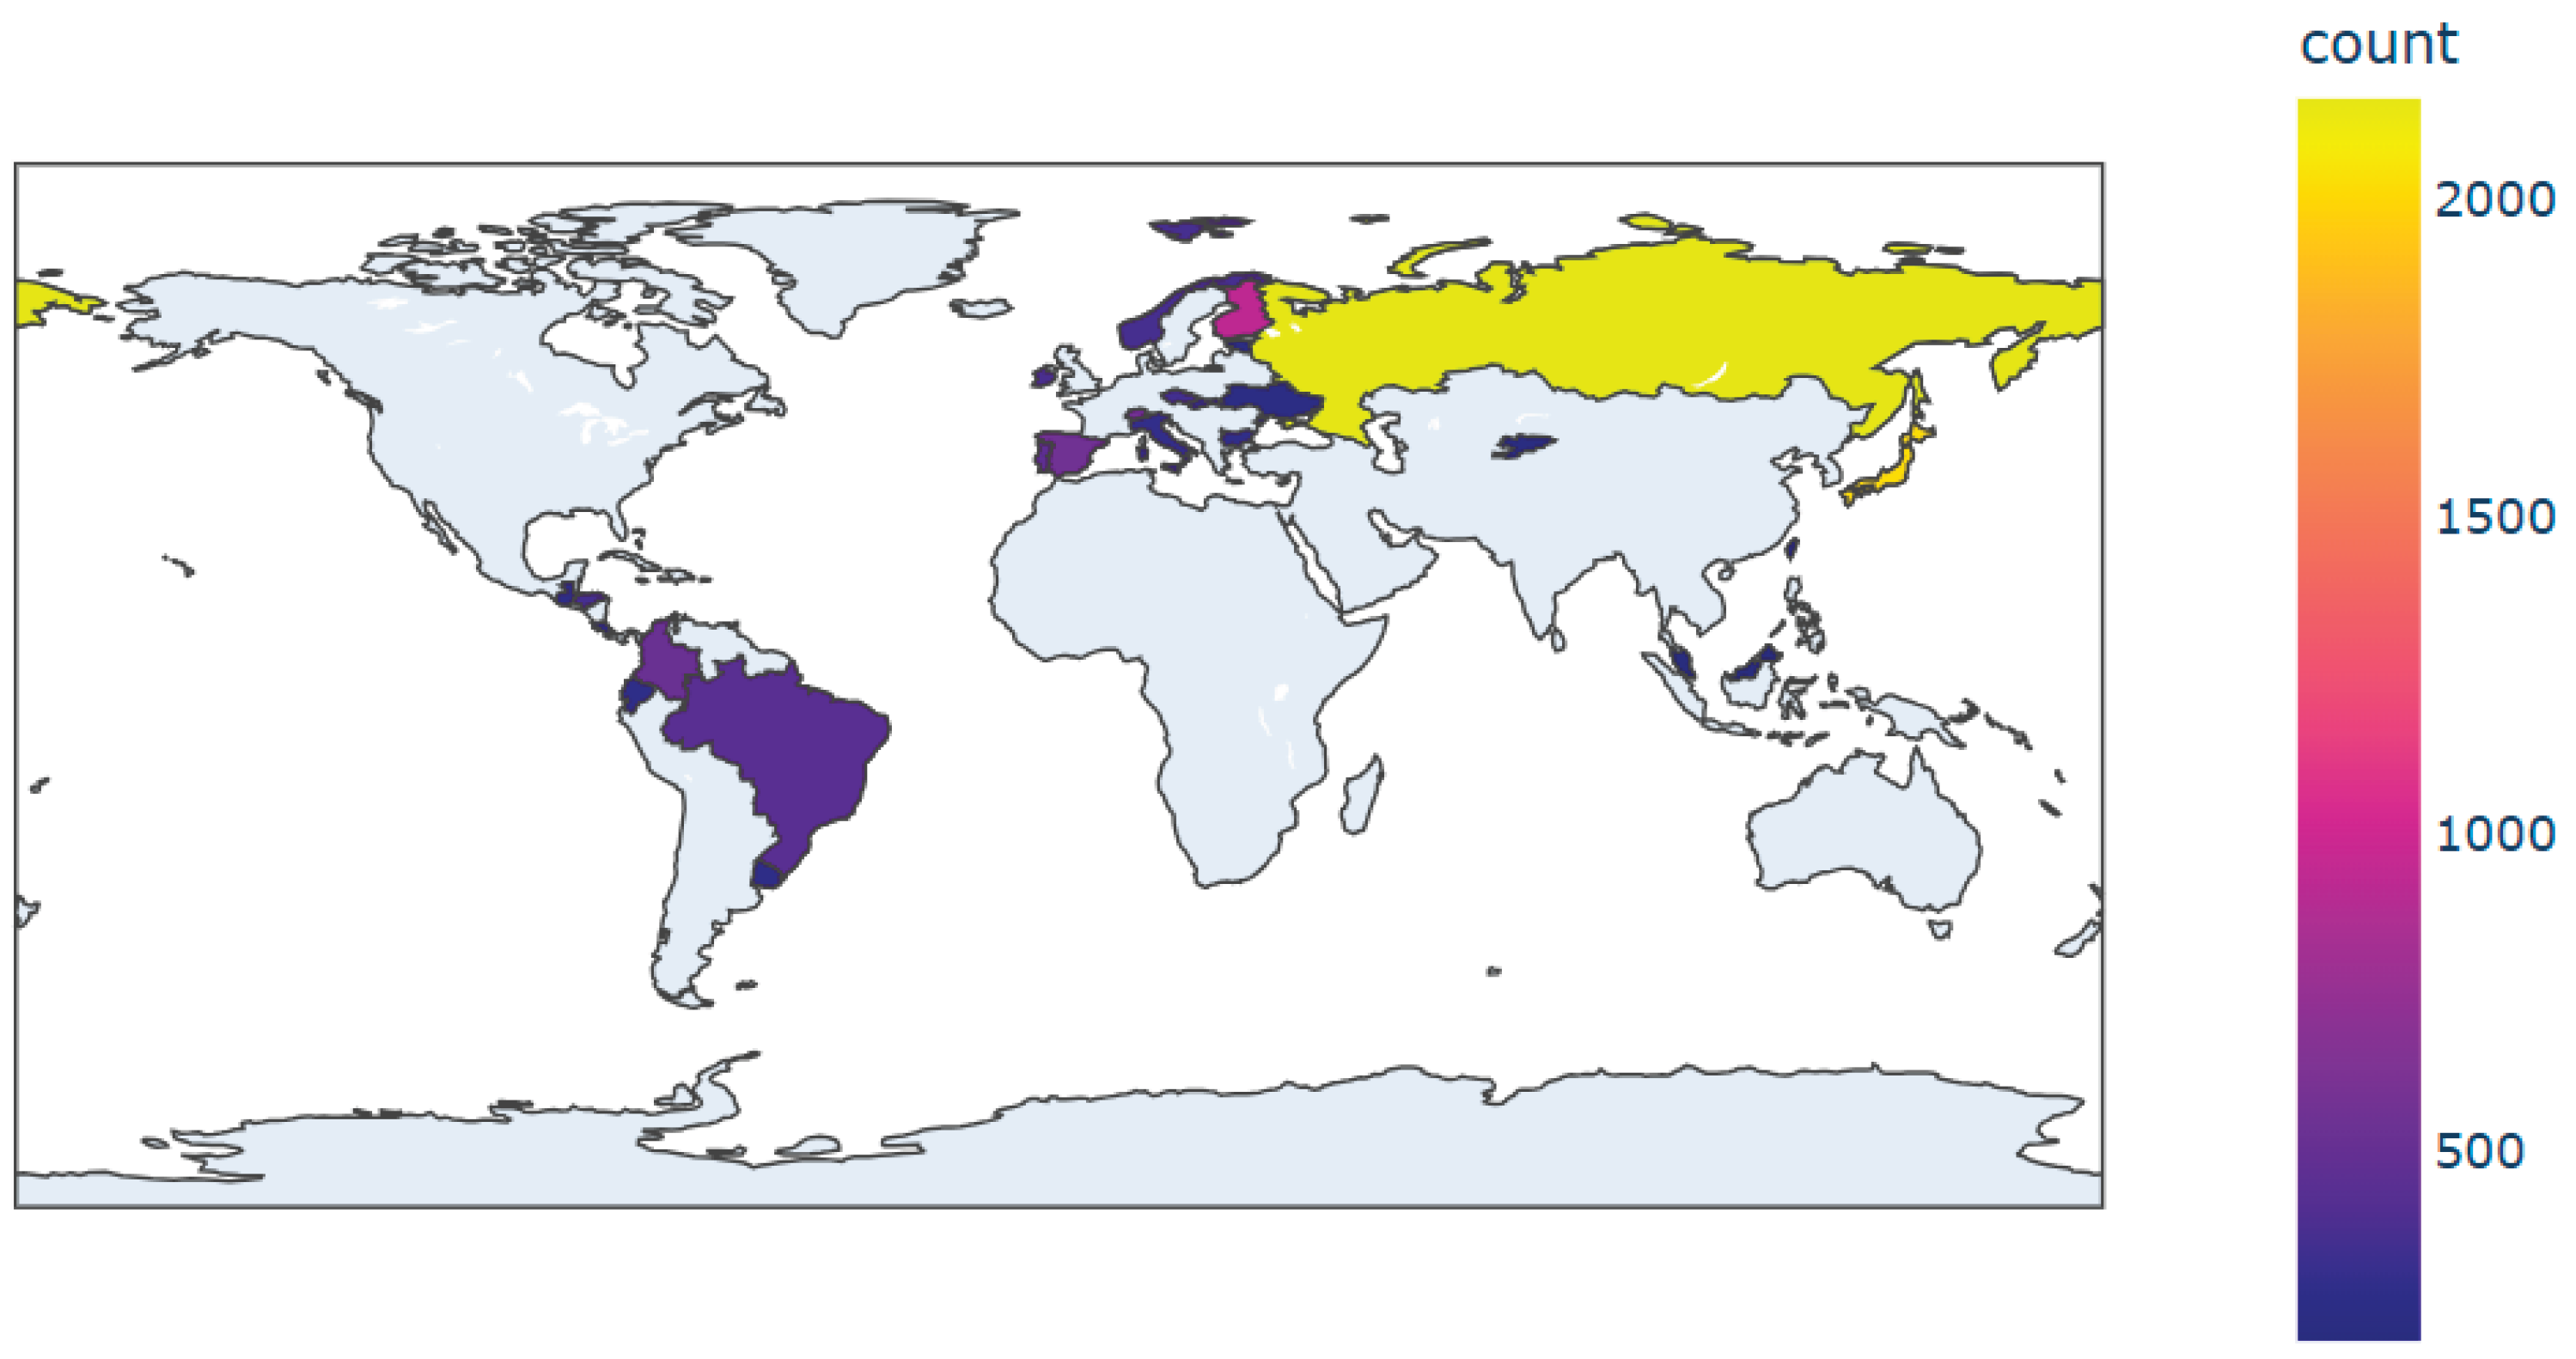
Figure 2.
The proportion of perceived stress level by marital status and gender.
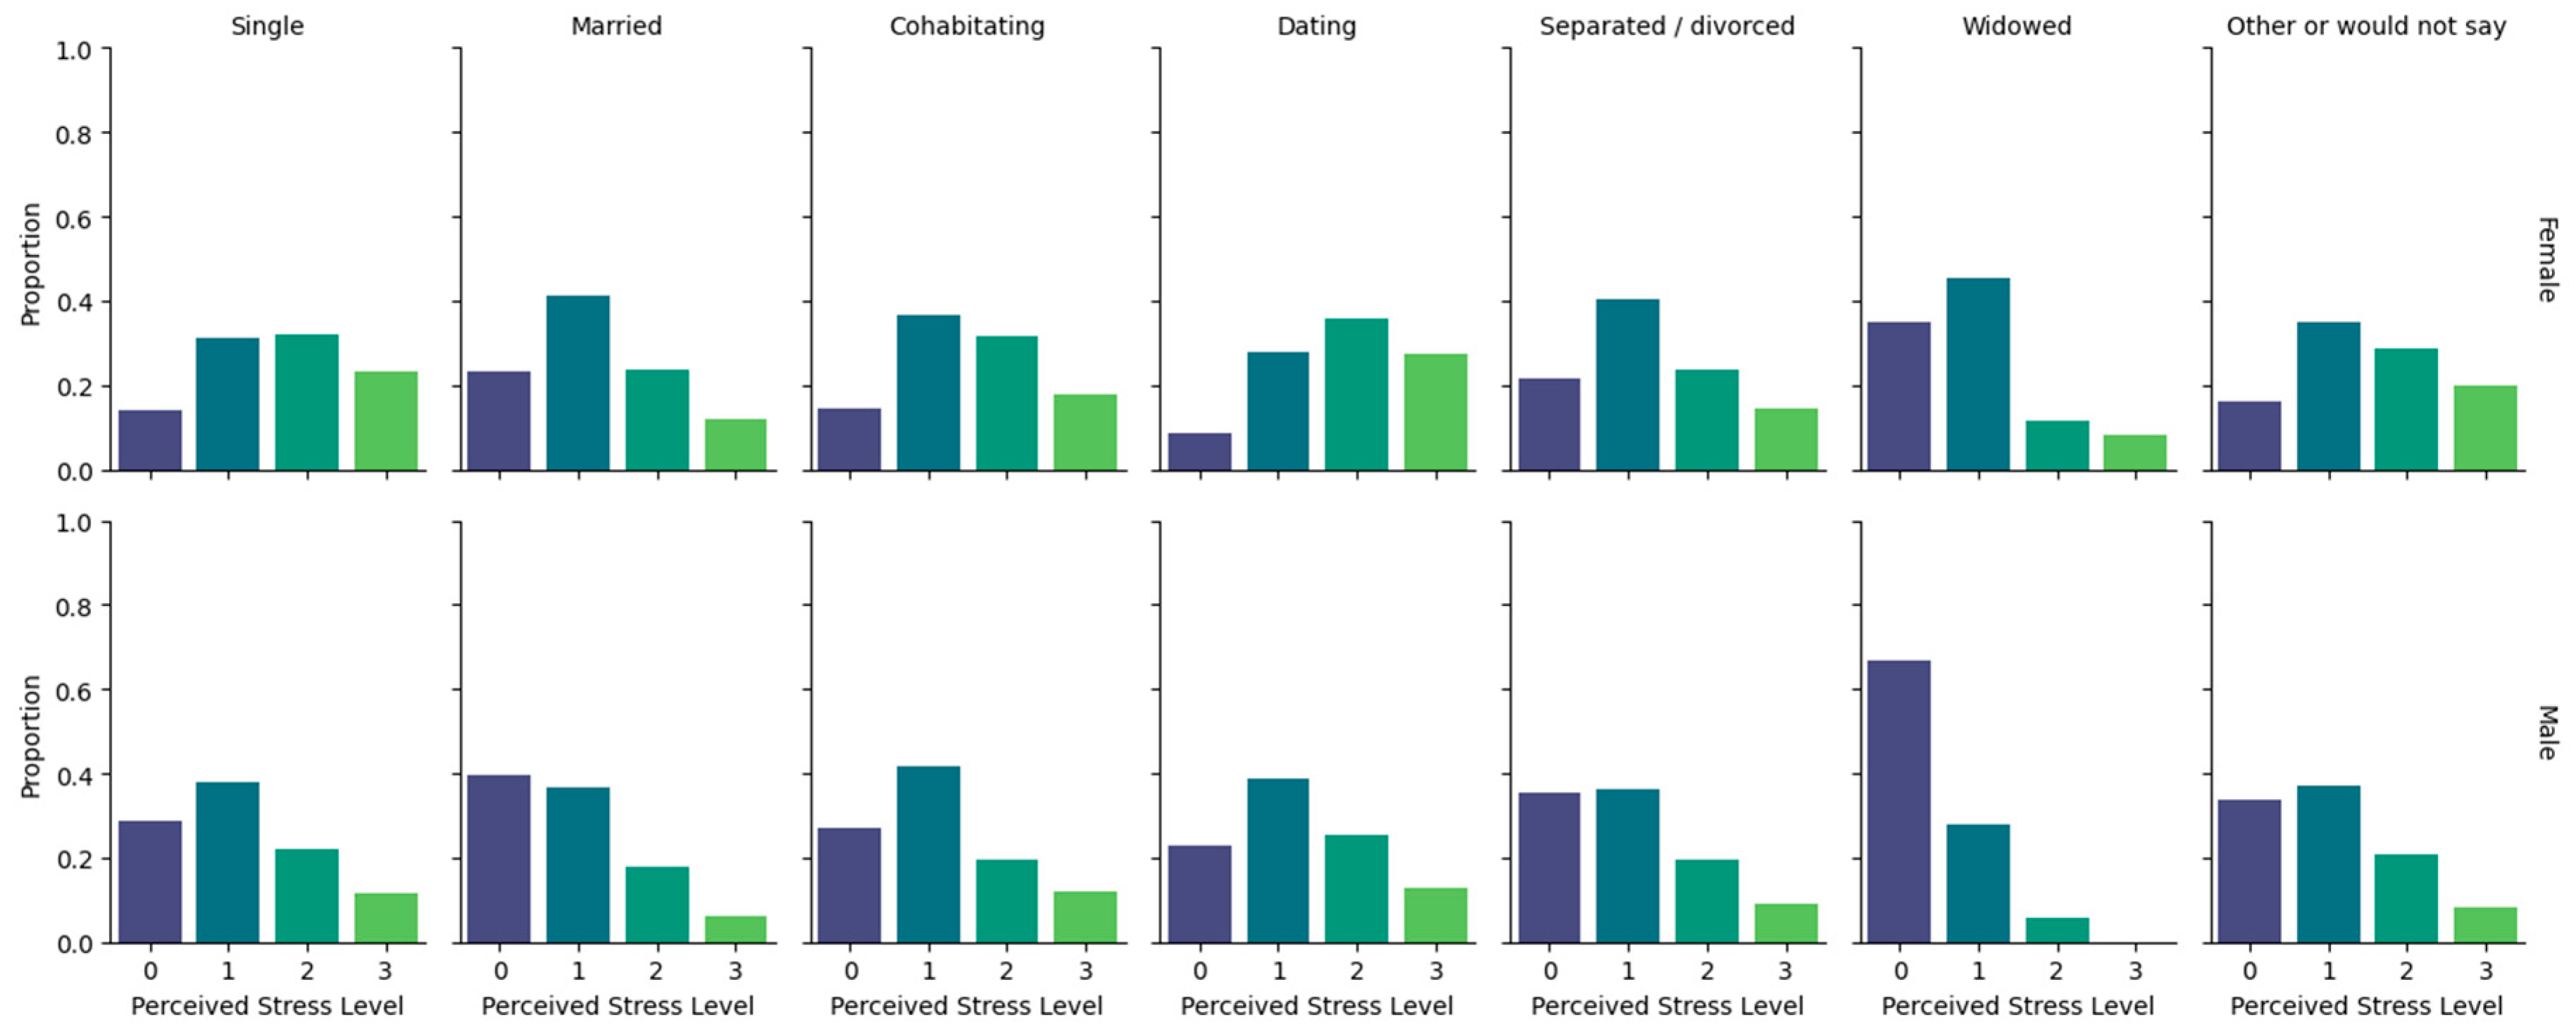
Figure 3.
Correlation matrix of numerical variables. Note: This plot shows the correlation matrix of the numerical variables obtained by Spearman’s rank correlation test.
Figure 3.
Correlation matrix of numerical variables. Note: This plot shows the correlation matrix of the numerical variables obtained by Spearman’s rank correlation test.
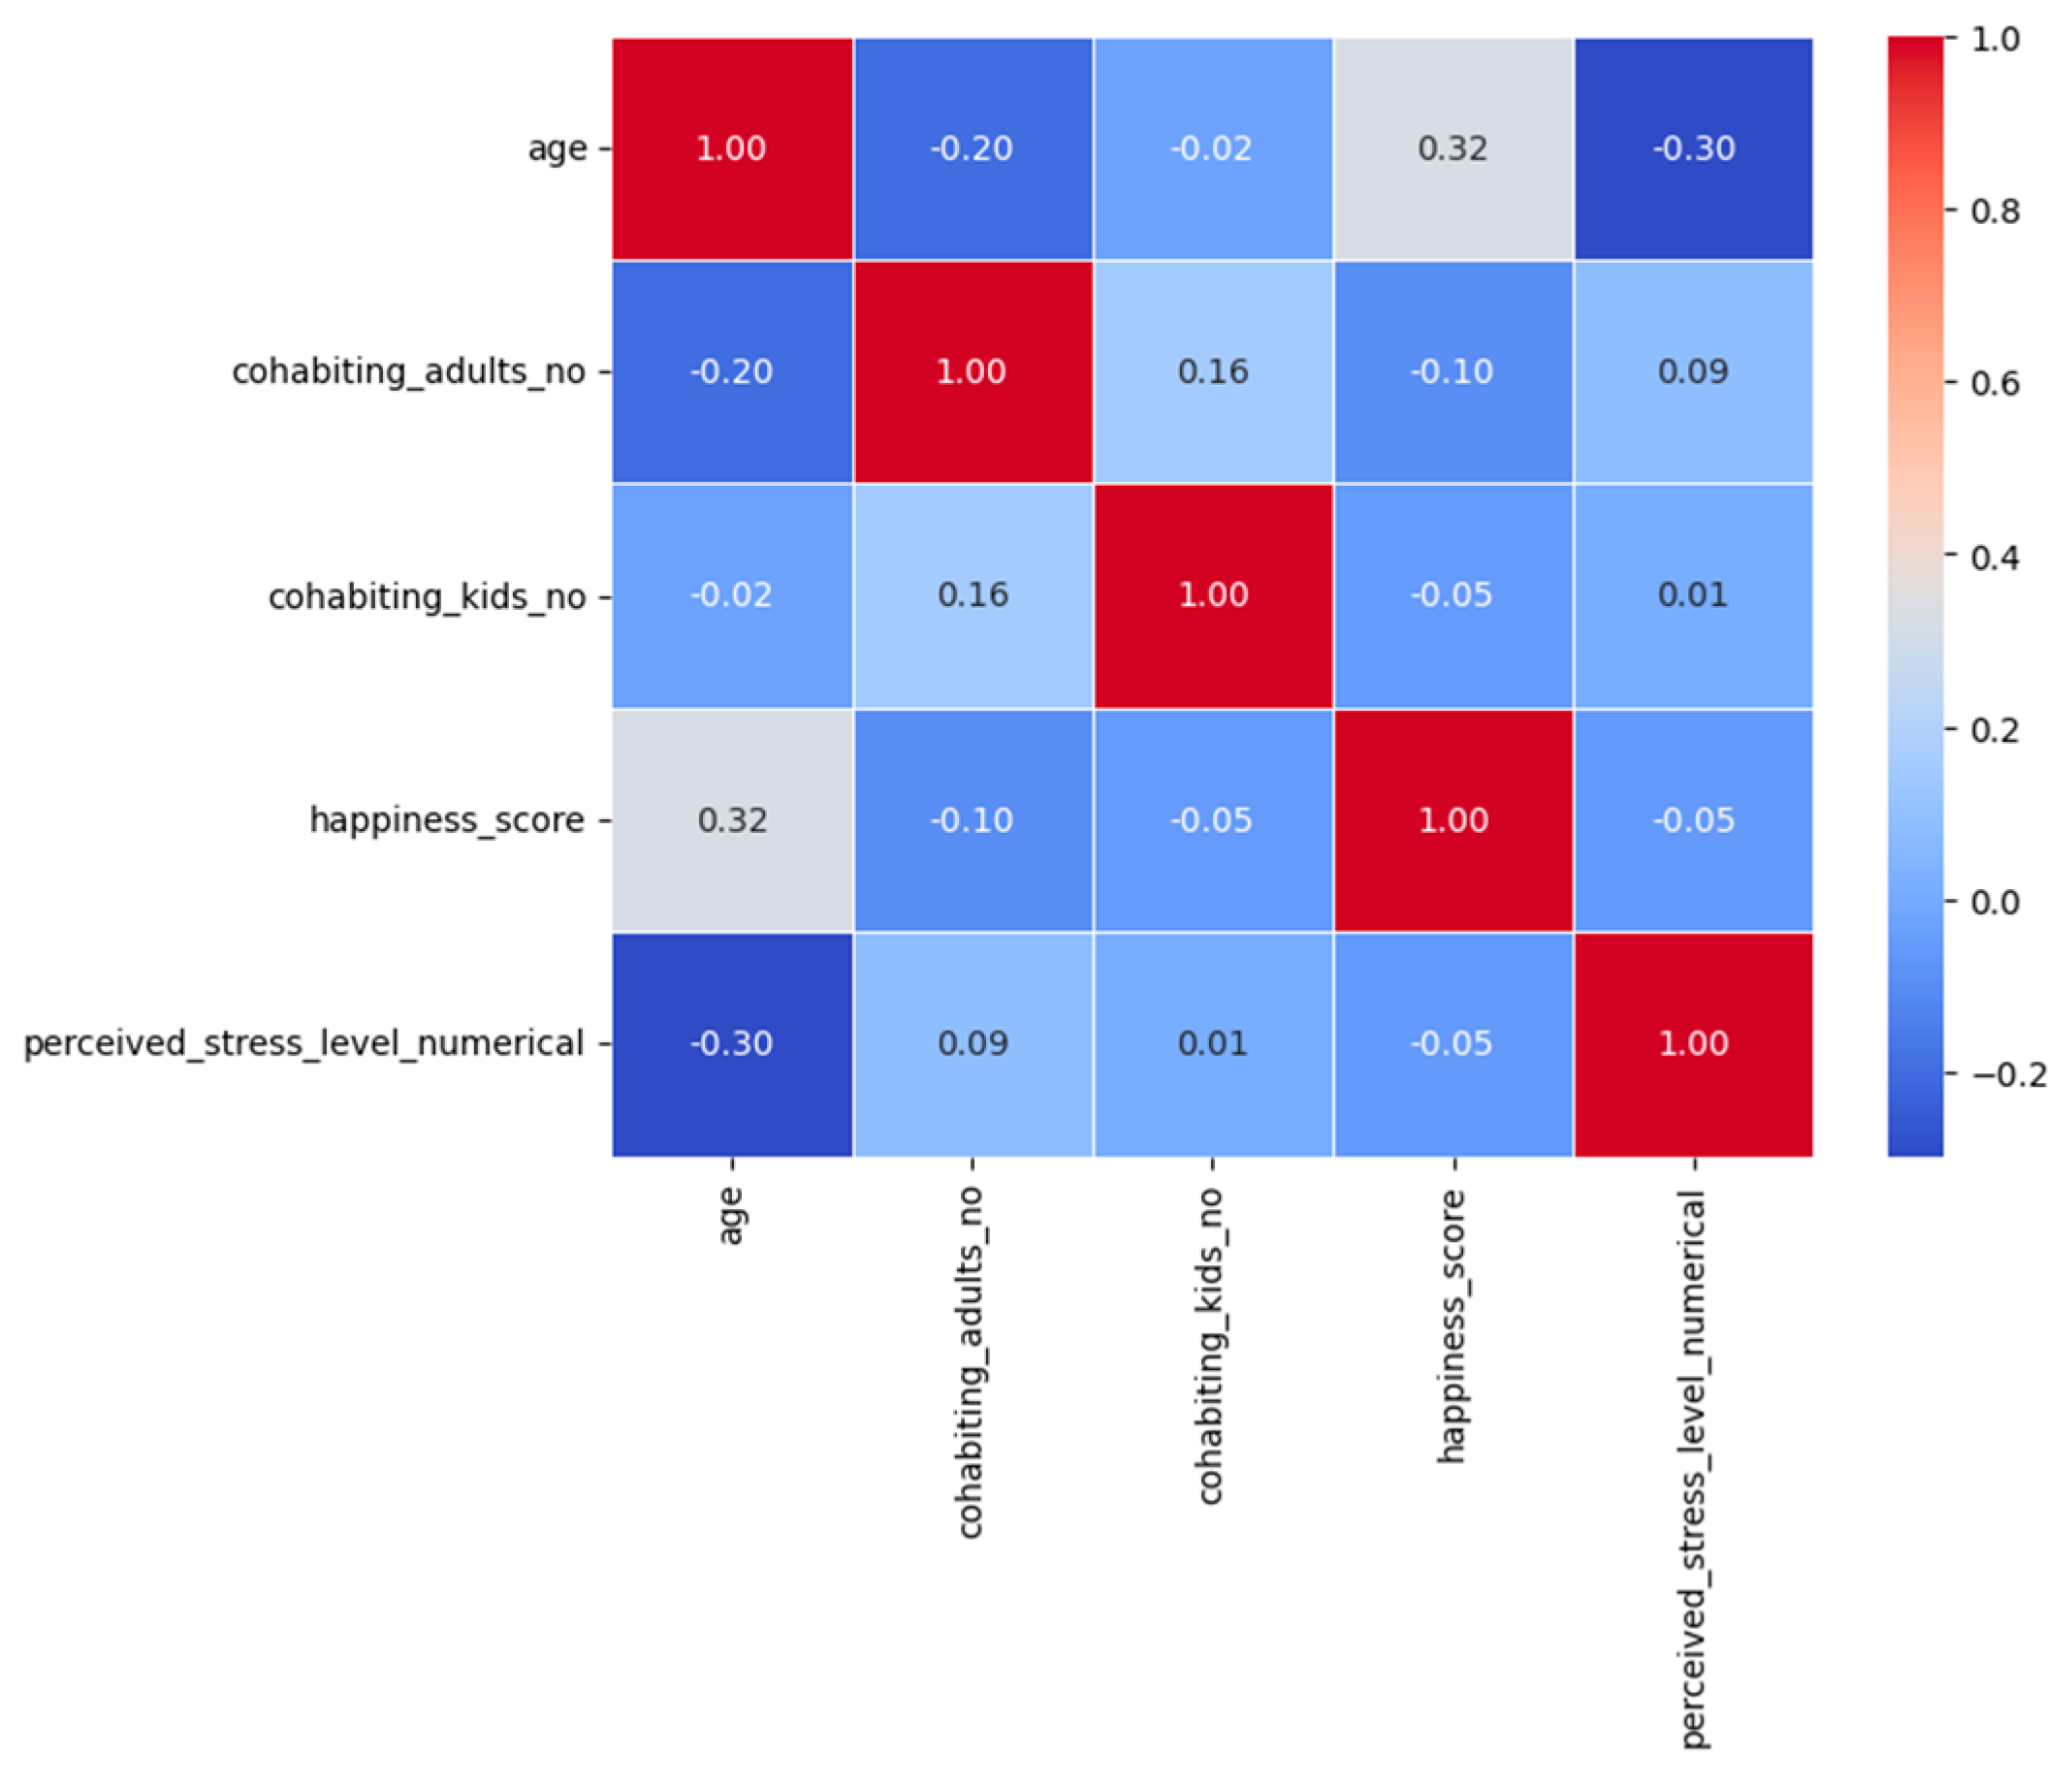
Figure 4.
The proportion of perceived stress levels within each education level.
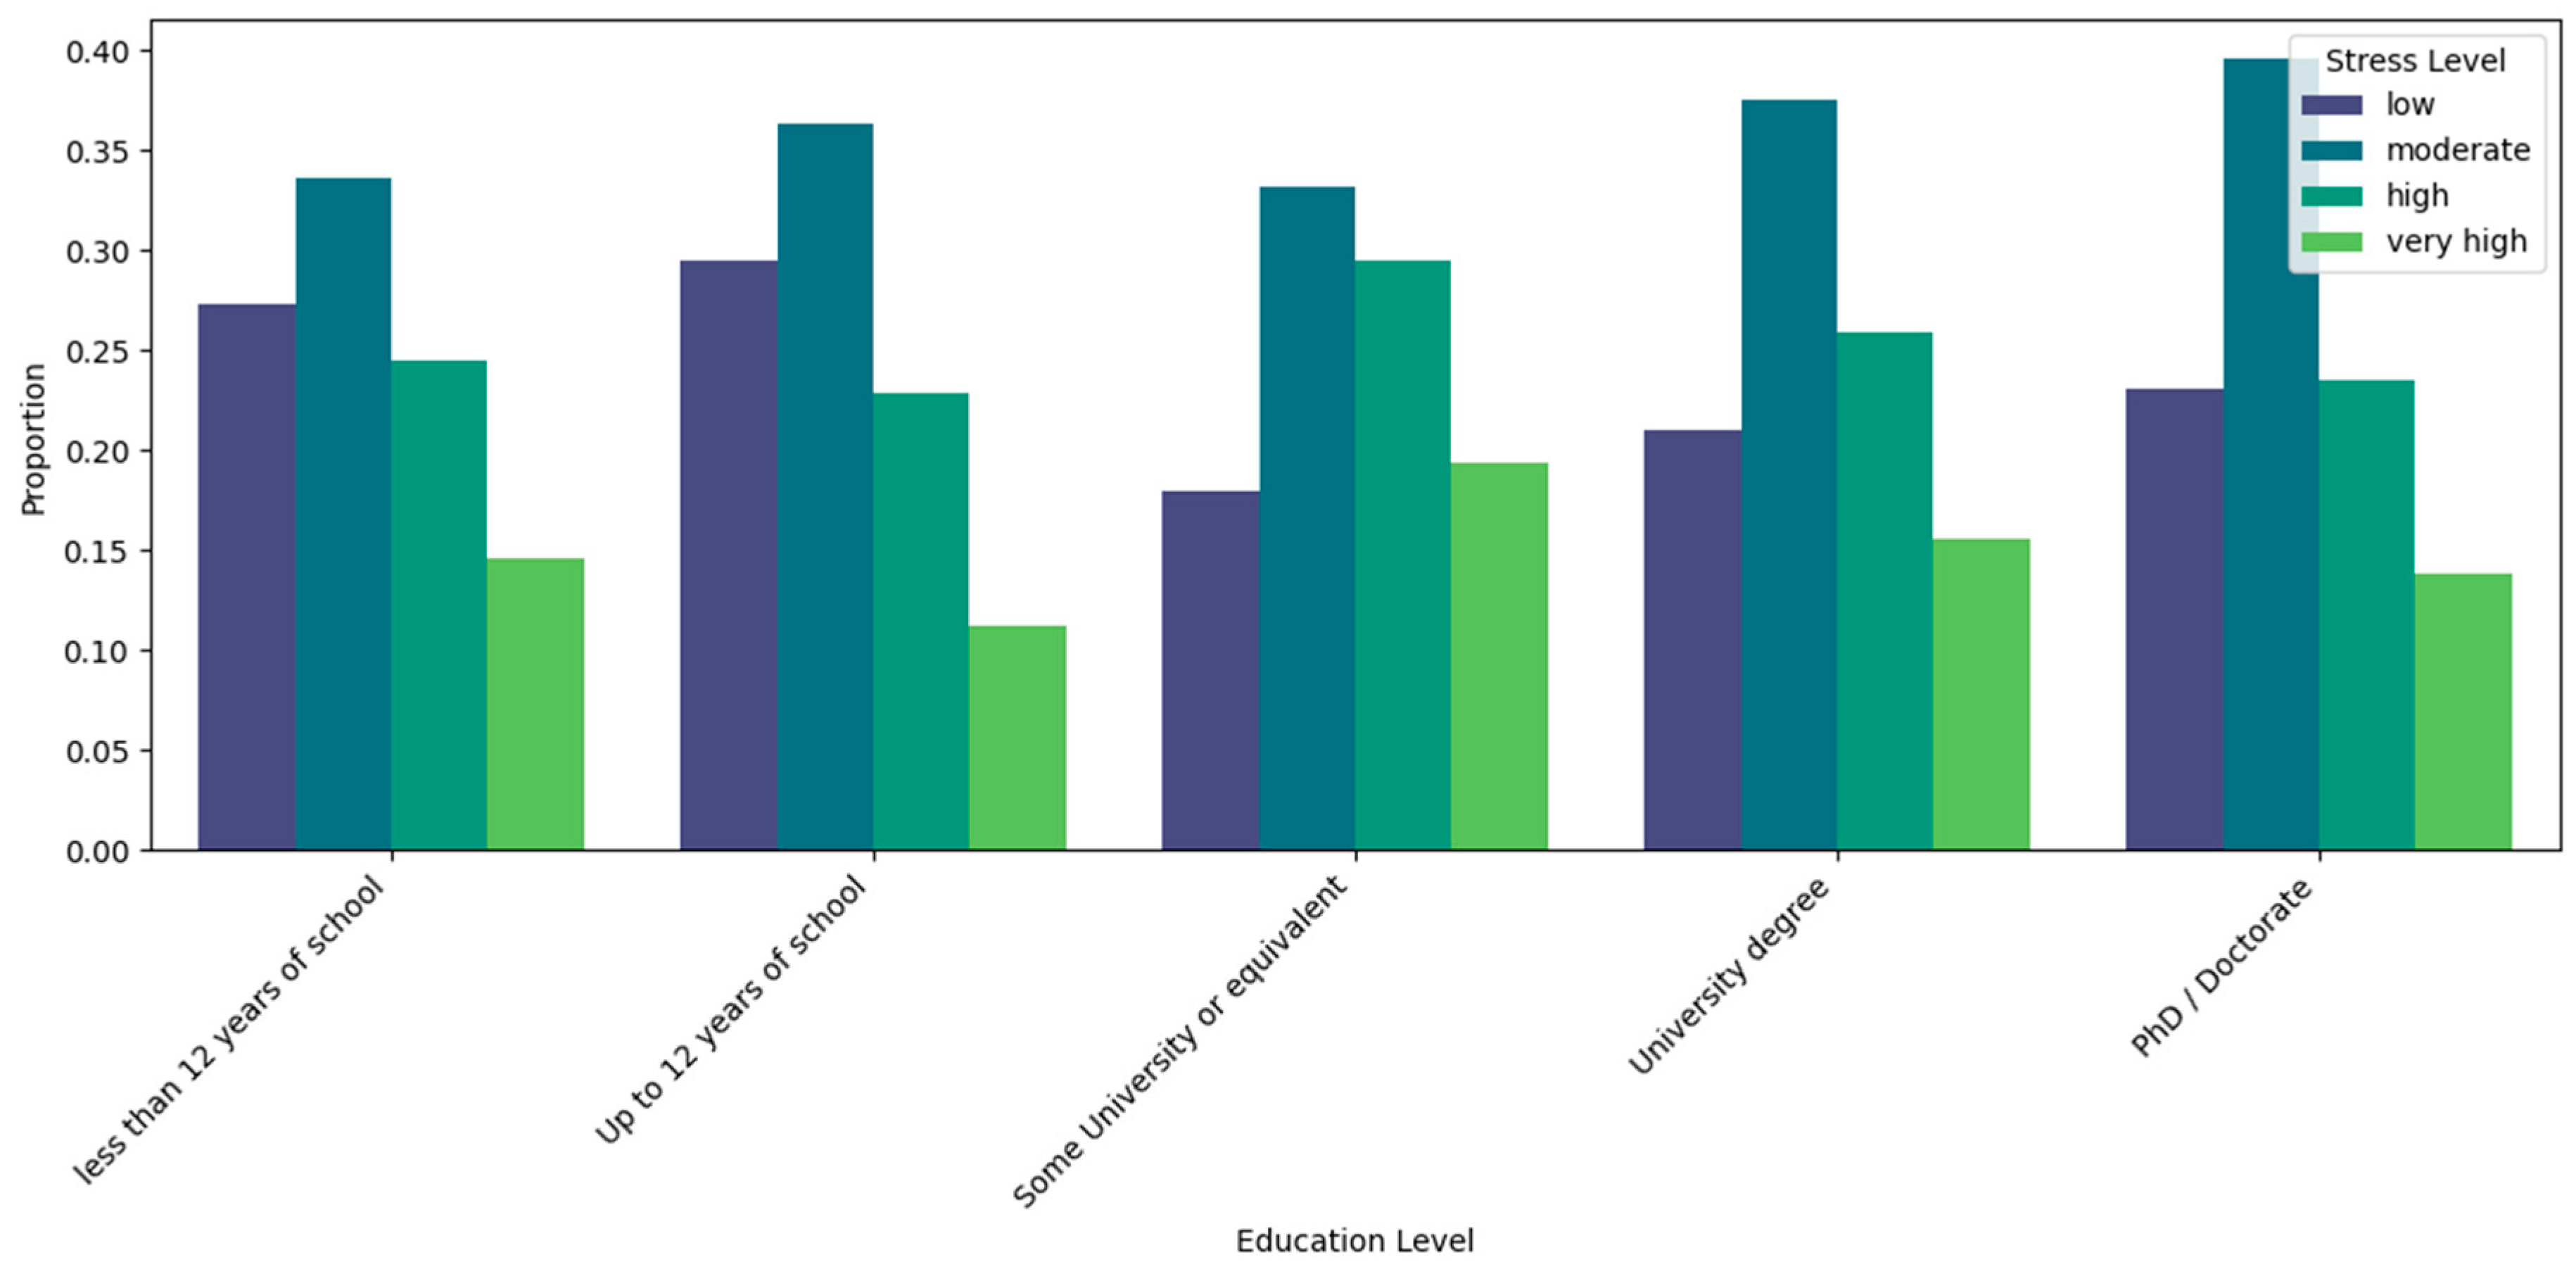
Figure 5.
The proportion of perceived stress levels within each employment status.
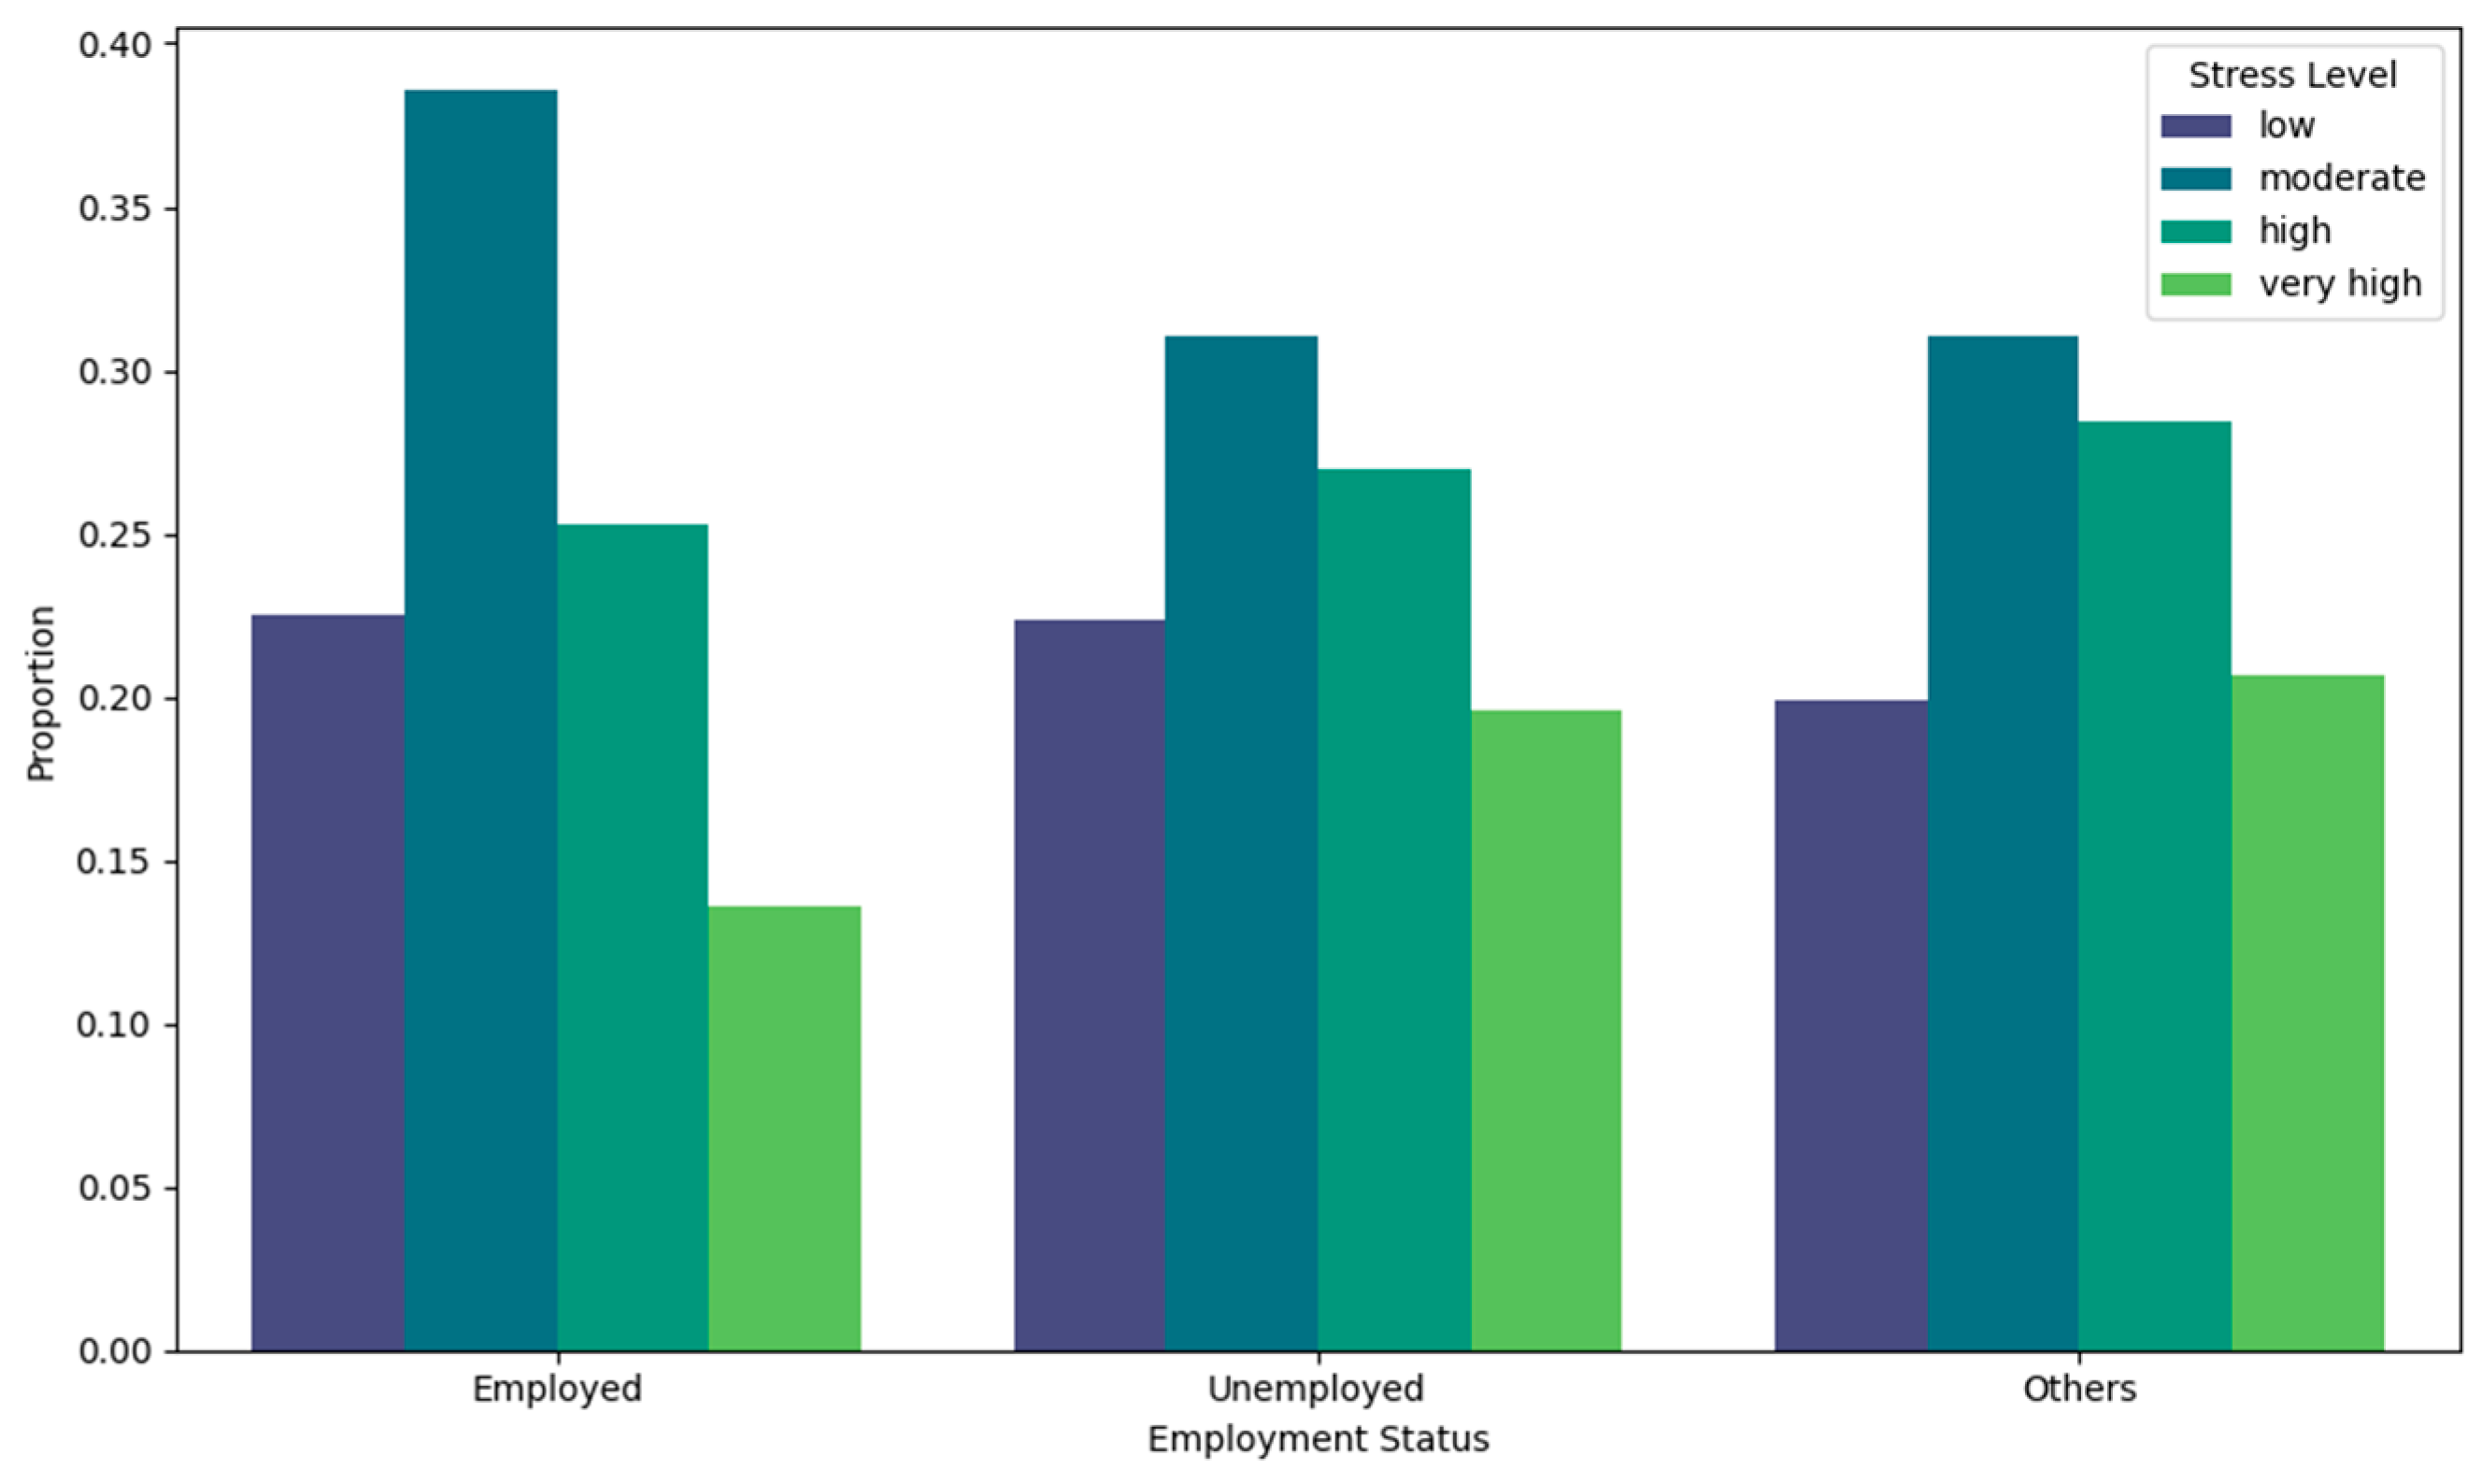
Figure 6.
The distribution of the percentage of the perceived stress scale by country. Note: The heat map shows the distribution of perceived stress levels in percentages for the total sample (top row) and by country. The countries are sorted by happiness score, from highest to lowest (second from the top to bottom).
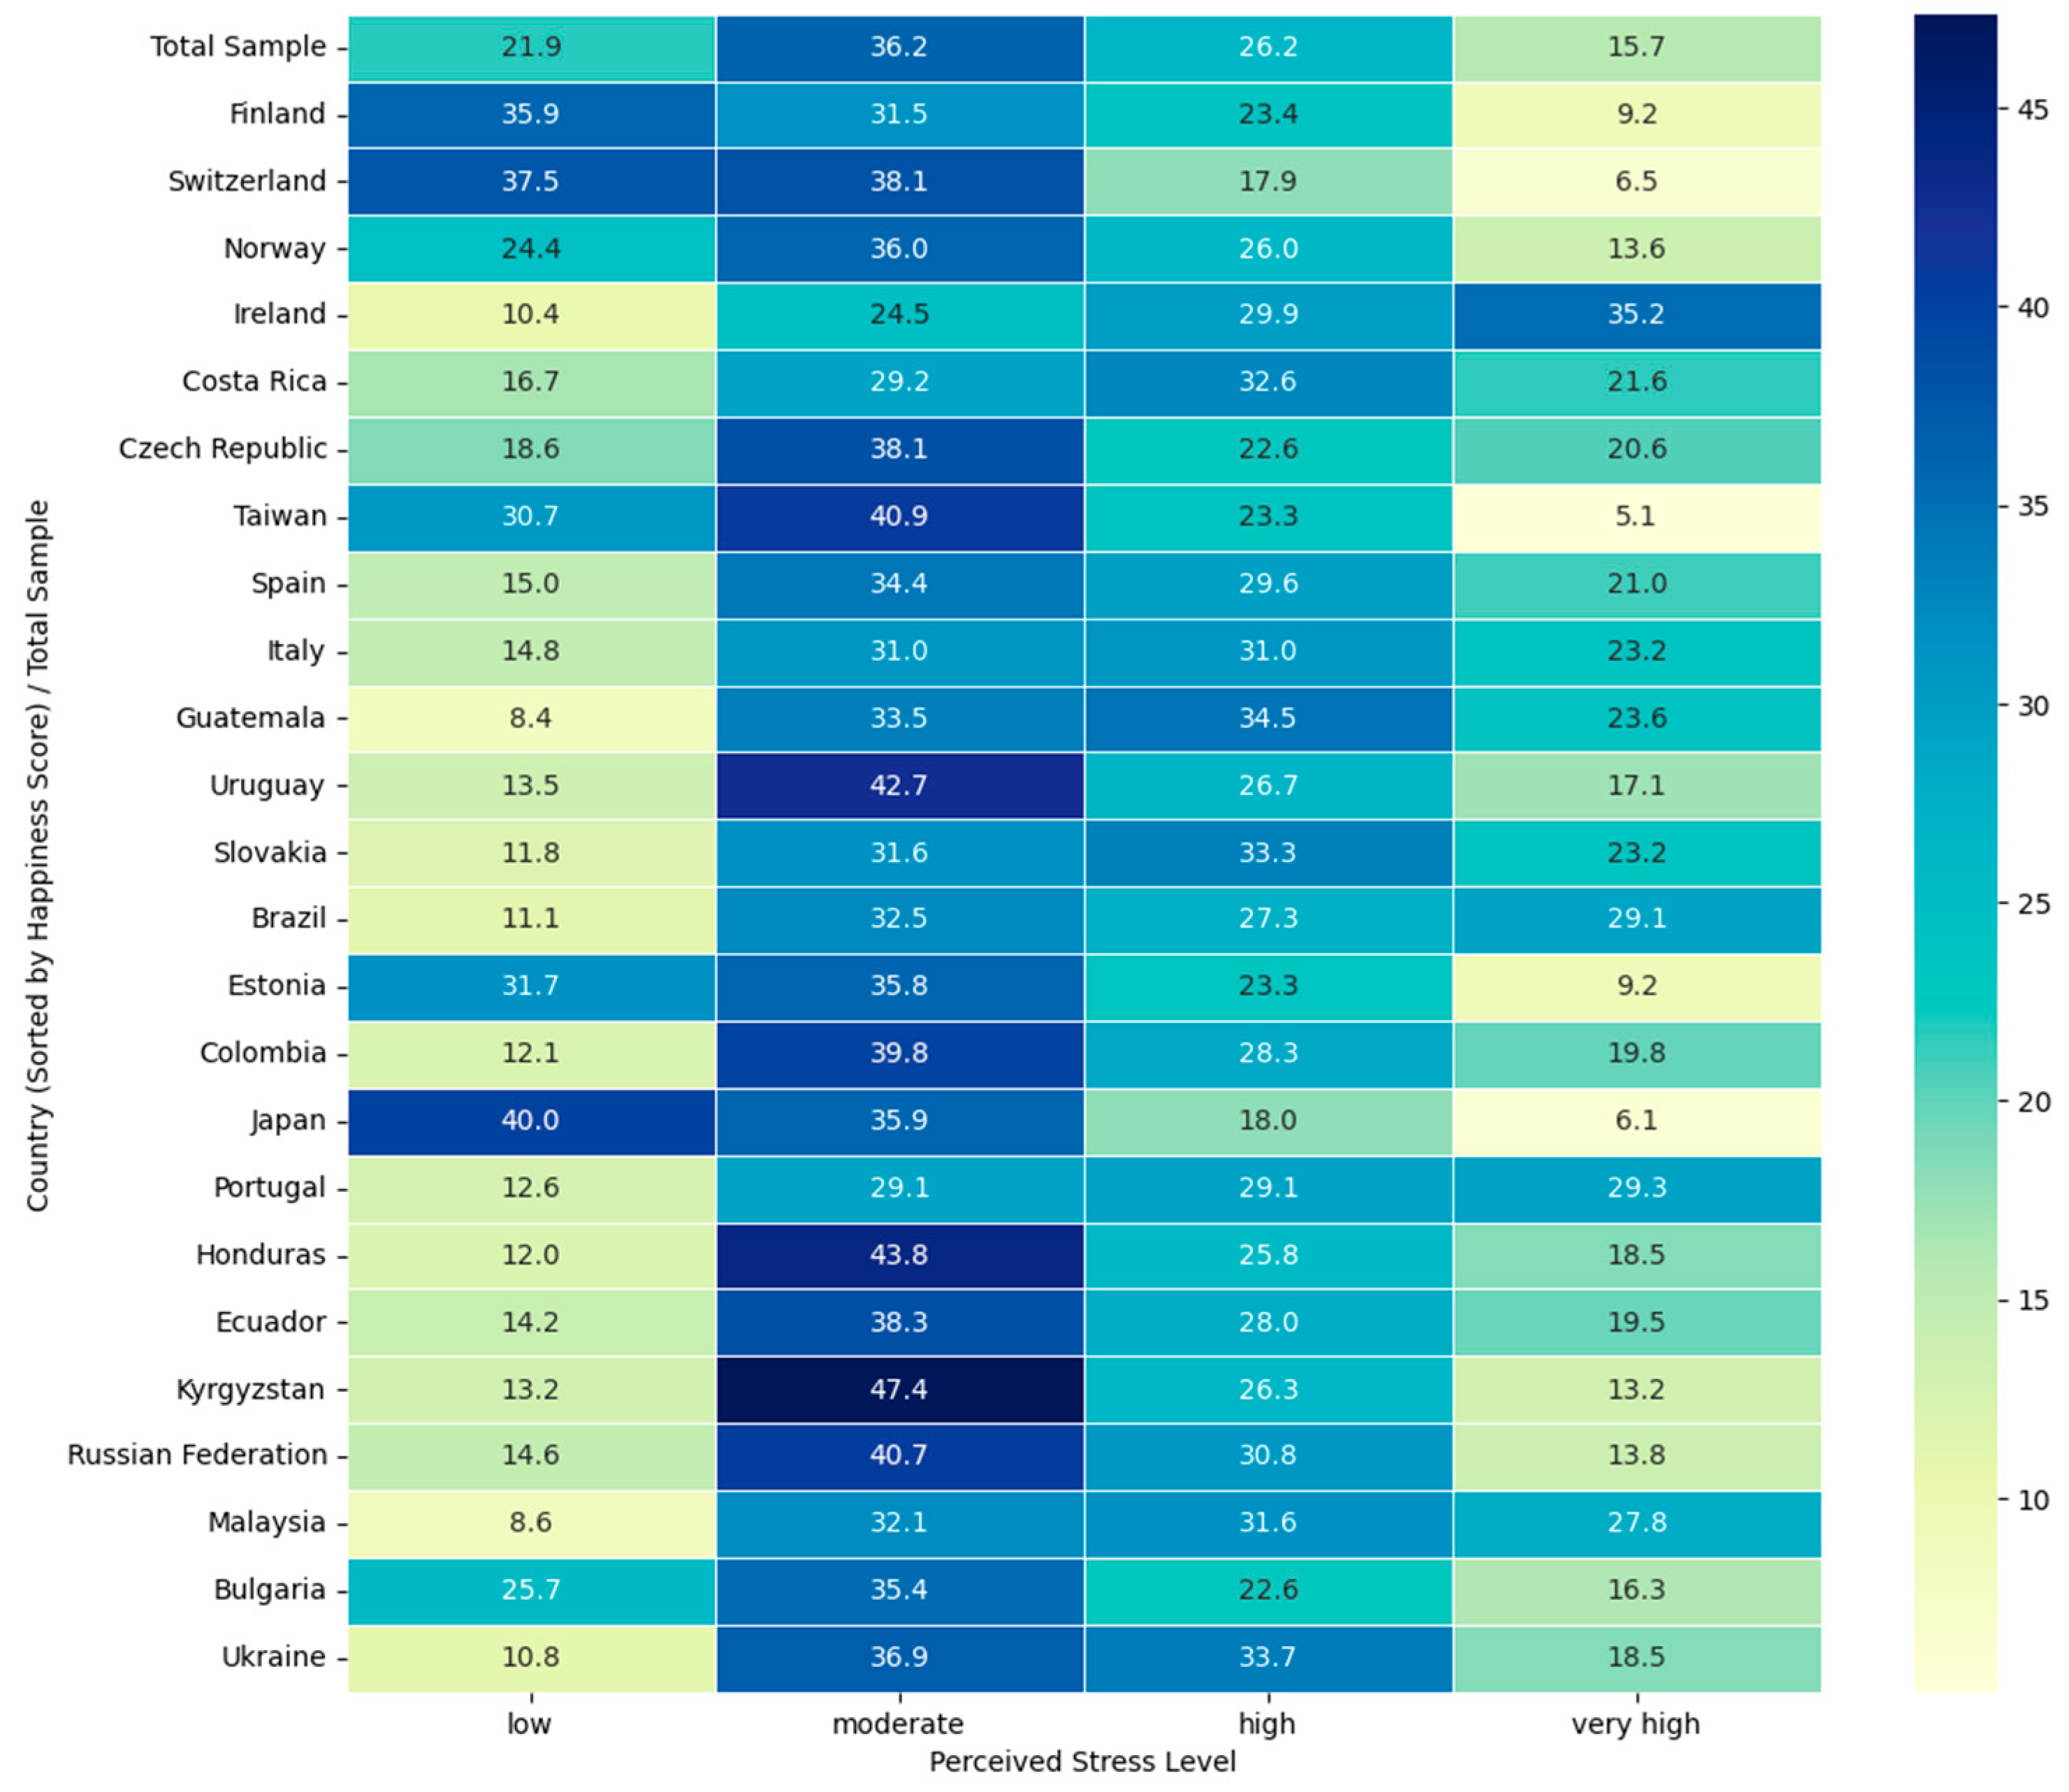
Figure 7.
Average Importance of Features on Perceived Stress Prediction.
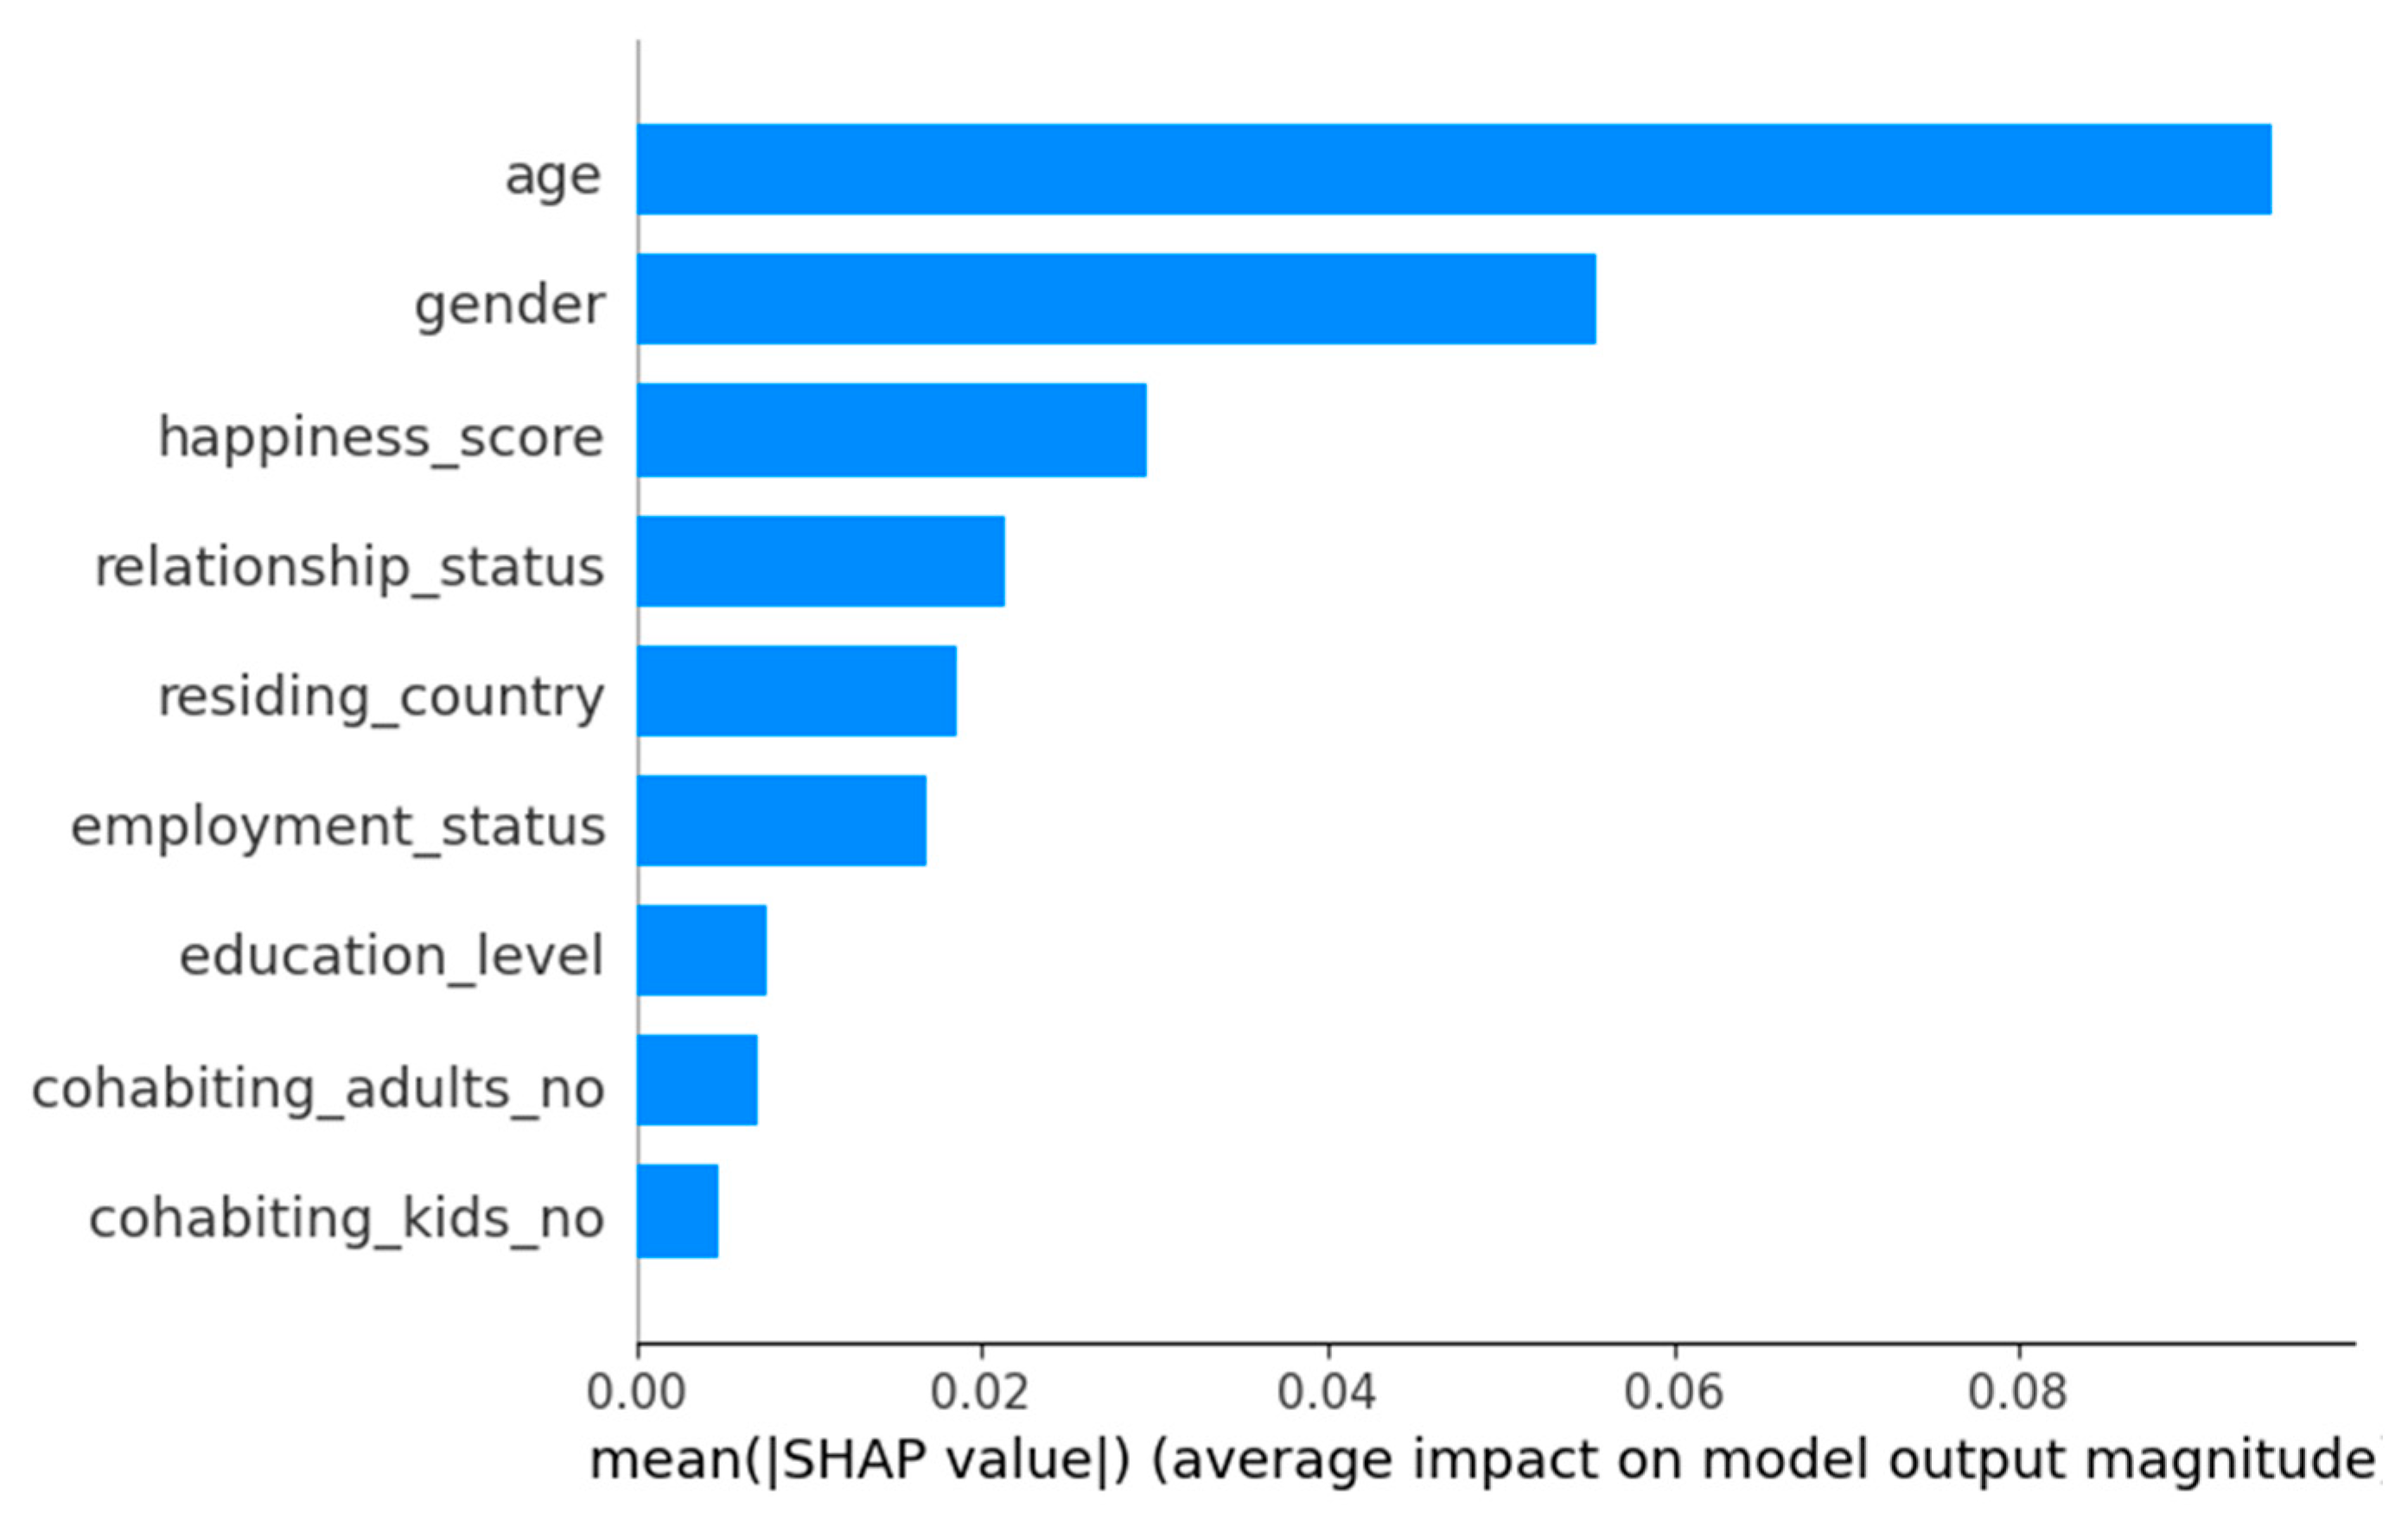
Figure 8.
Individual Feature Effect on Perceived Stress Prediction. Note: The beeswarm plot shows the impact of individual features on model output. In gender, female participants are represented in blue and male participants in red.
Figure 8.
Individual Feature Effect on Perceived Stress Prediction. Note: The beeswarm plot shows the impact of individual features on model output. In gender, female participants are represented in blue and male participants in red.
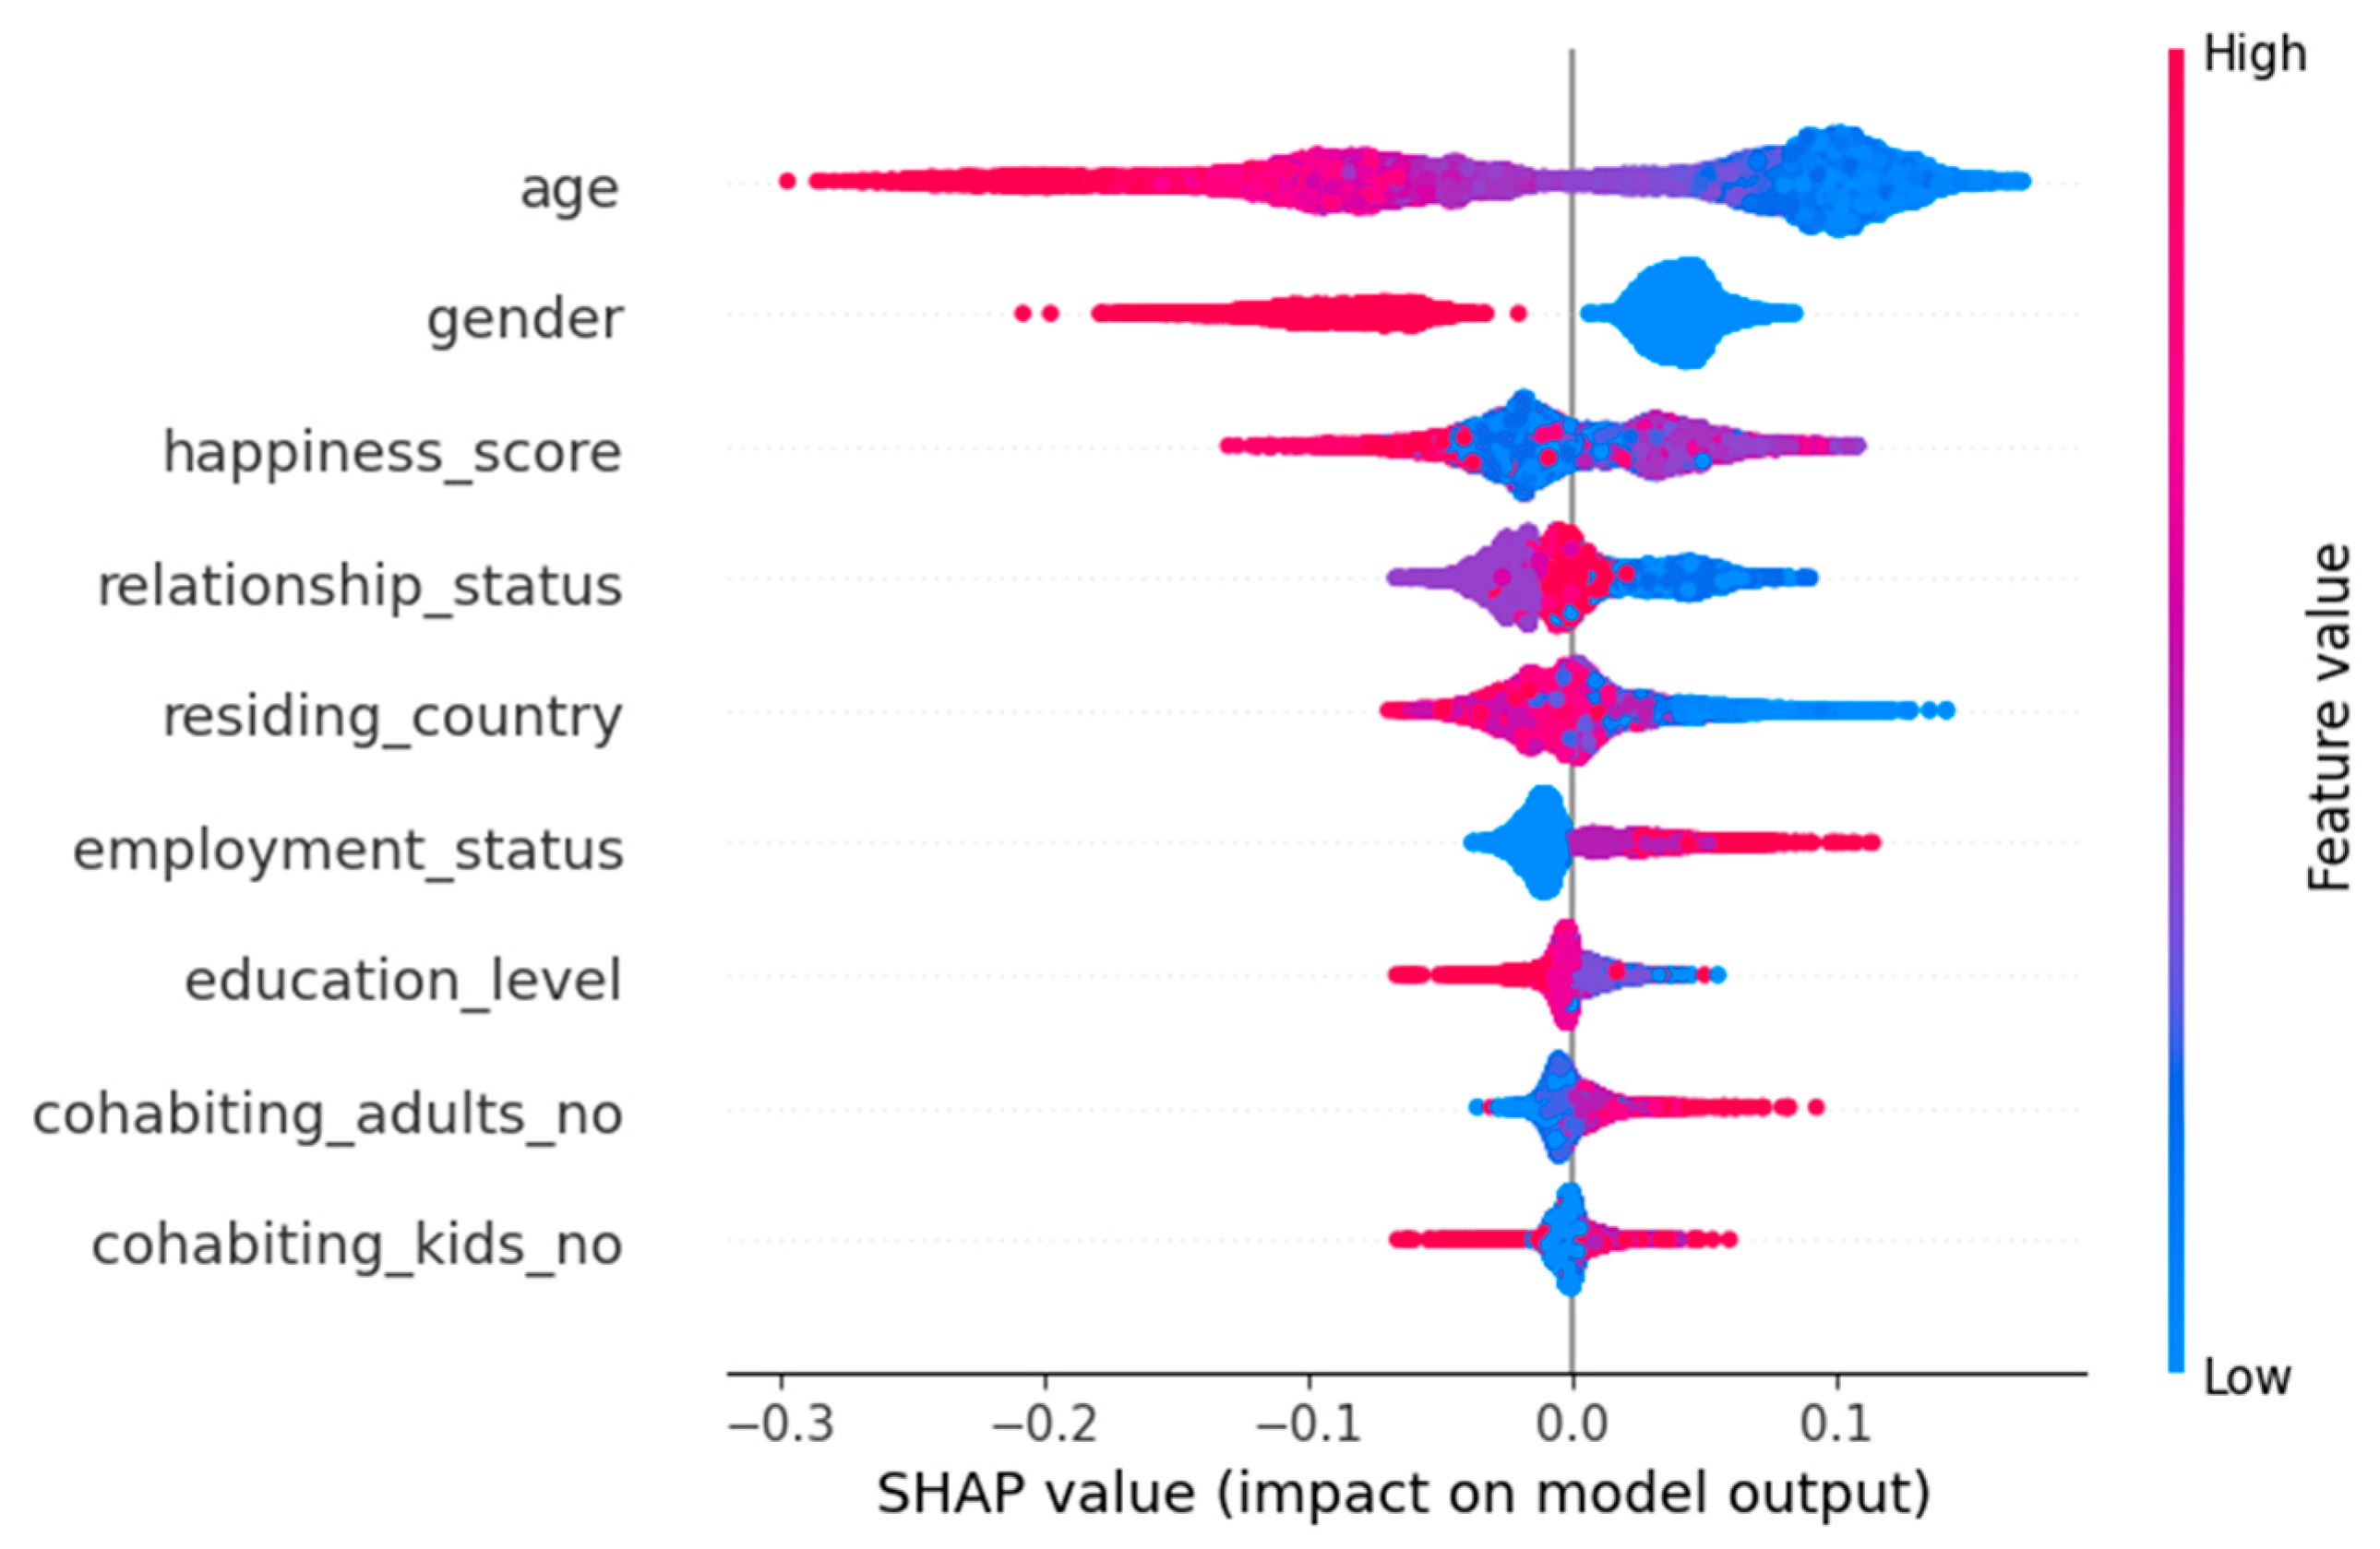
Figure 9.
SHAP Value Distributions for Marital Status by Gender. Note: Box plot showing the distribution of SHAP values attributed to marital status, stratified by gender. Female participants are represented in blue and male participants in red. Each box displays the interquartile range (IQR), median, and outliers, highlighting gender differences in how marital status contributes to the predicted perceived stress level.
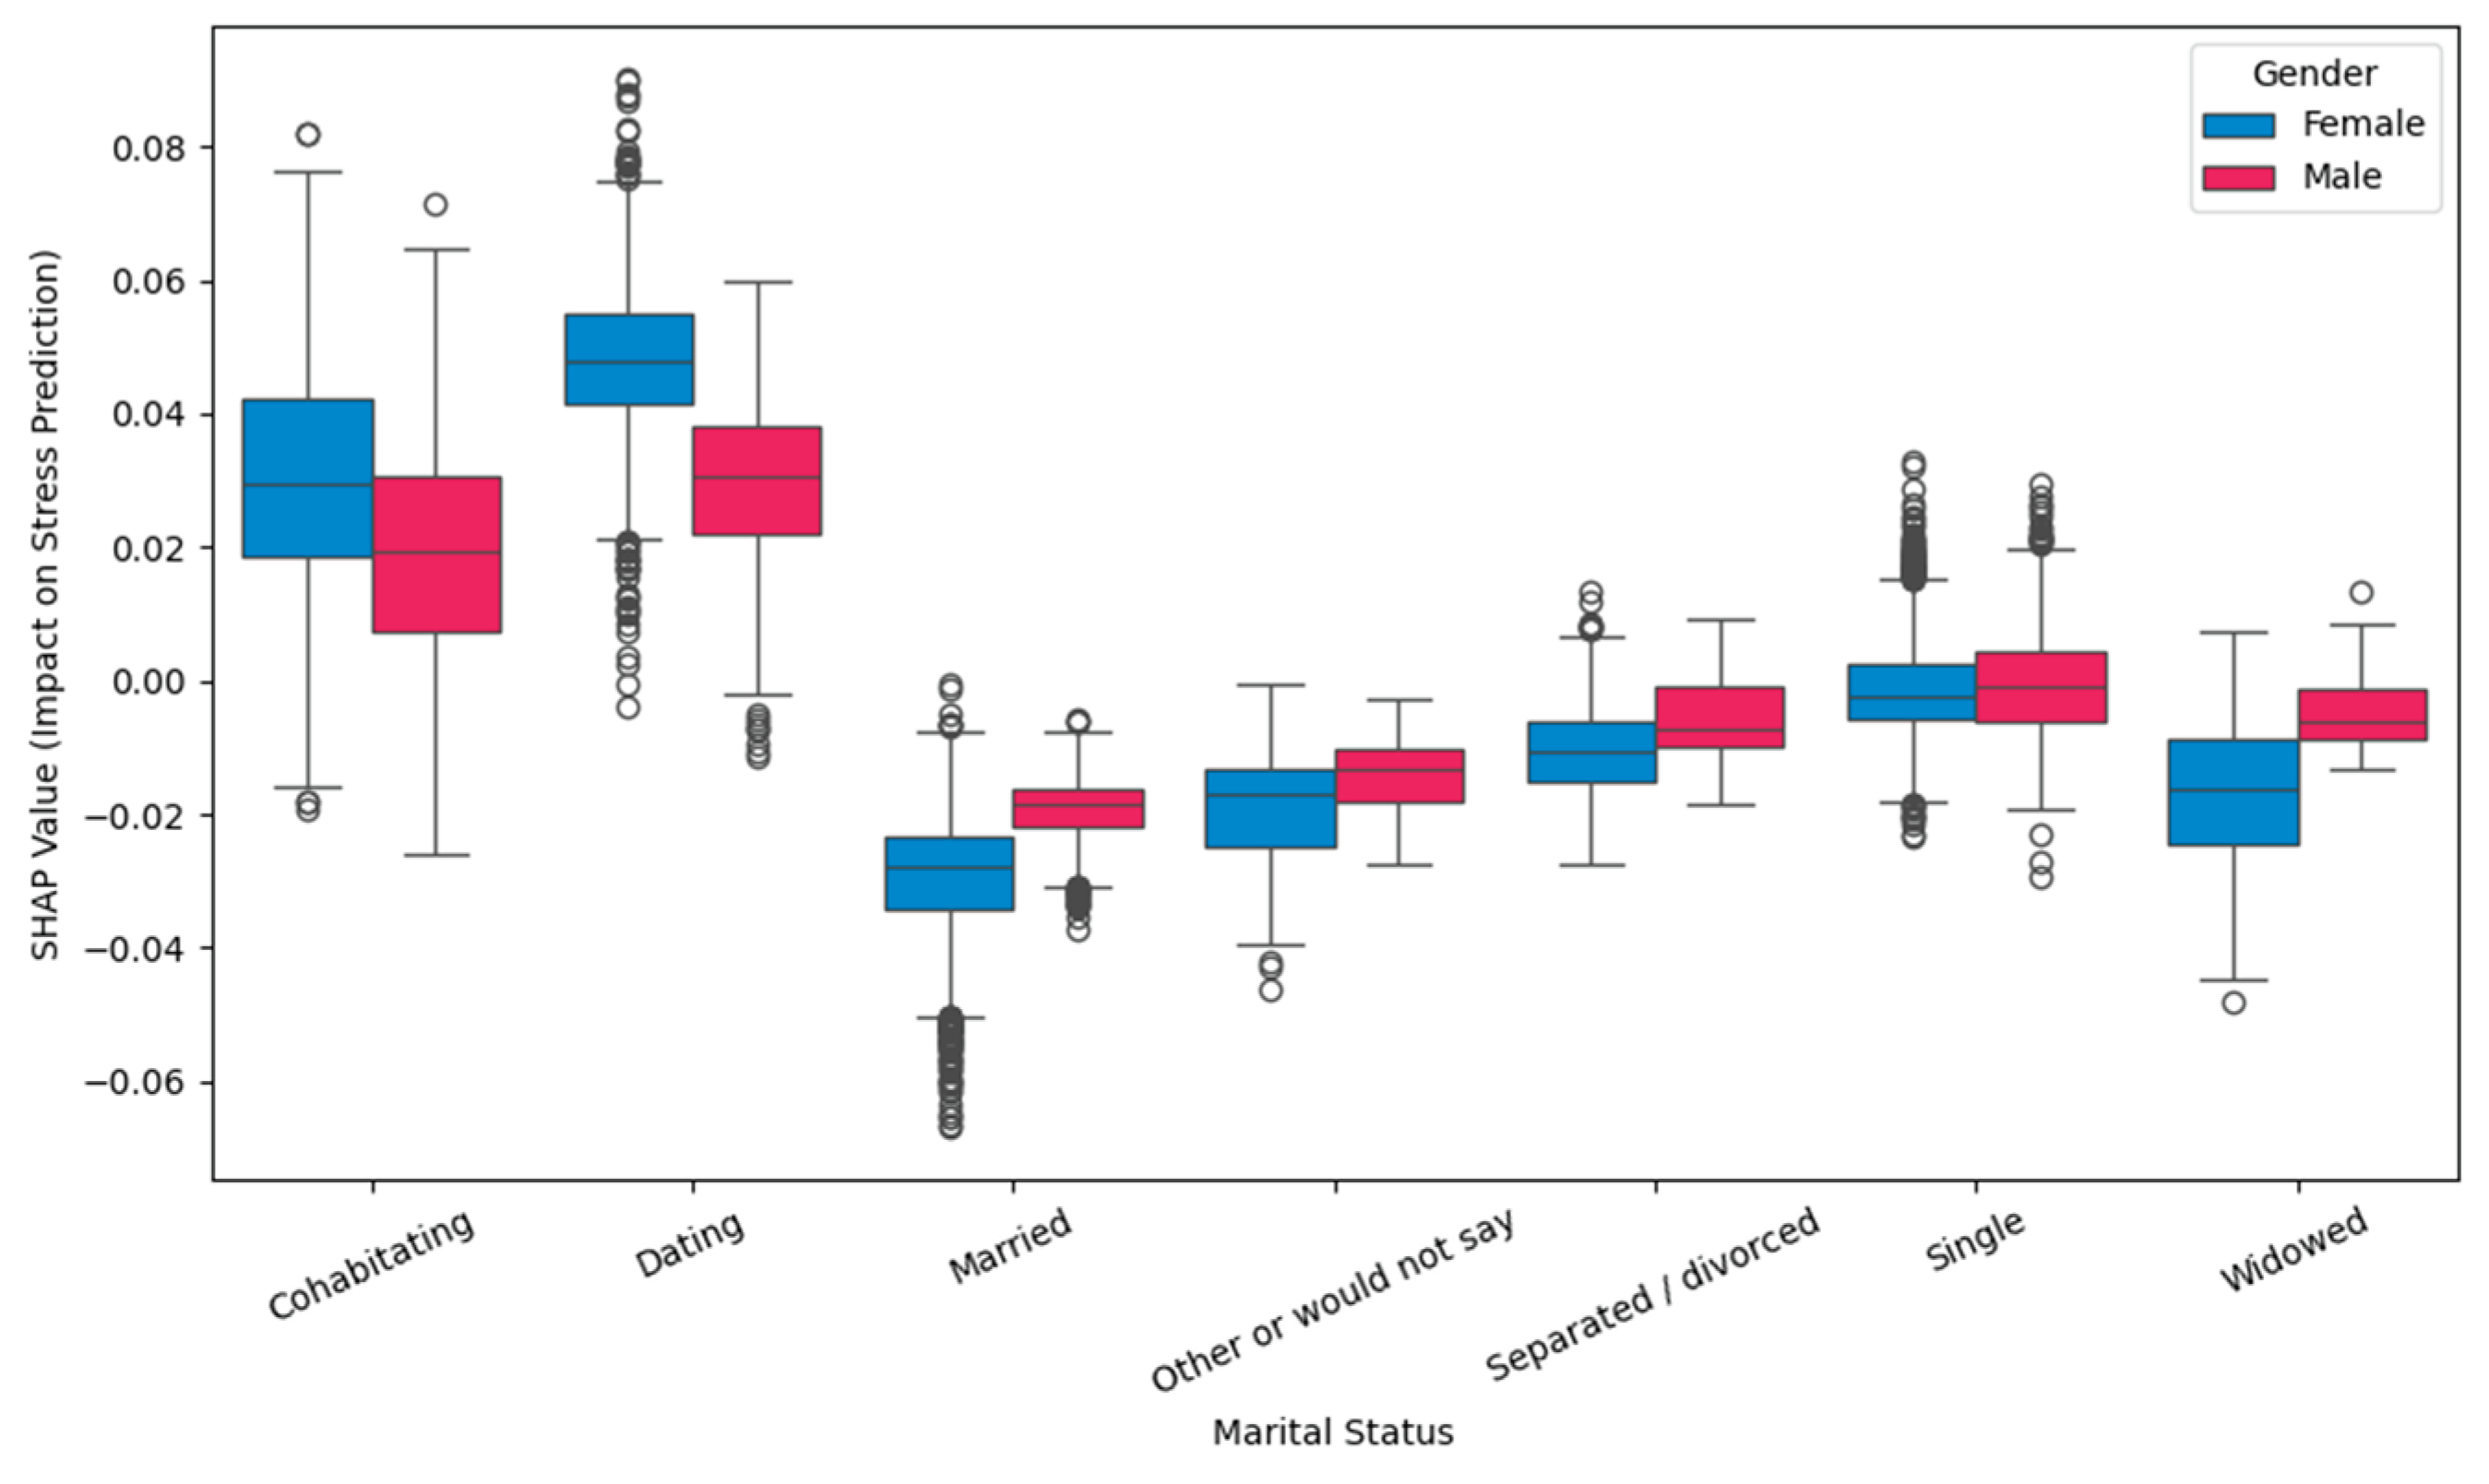
Figure 10.
Interaction Effects of Marital Status and Gender on SHAP Values. Note: The estimated marginal means plot shows the interaction between marital status and gender on SHAP values. Error bars represent ±95% confidence intervals. The plot reveals divergent patterns of stress prediction influence across marital statuses between females (blue) and males (red).
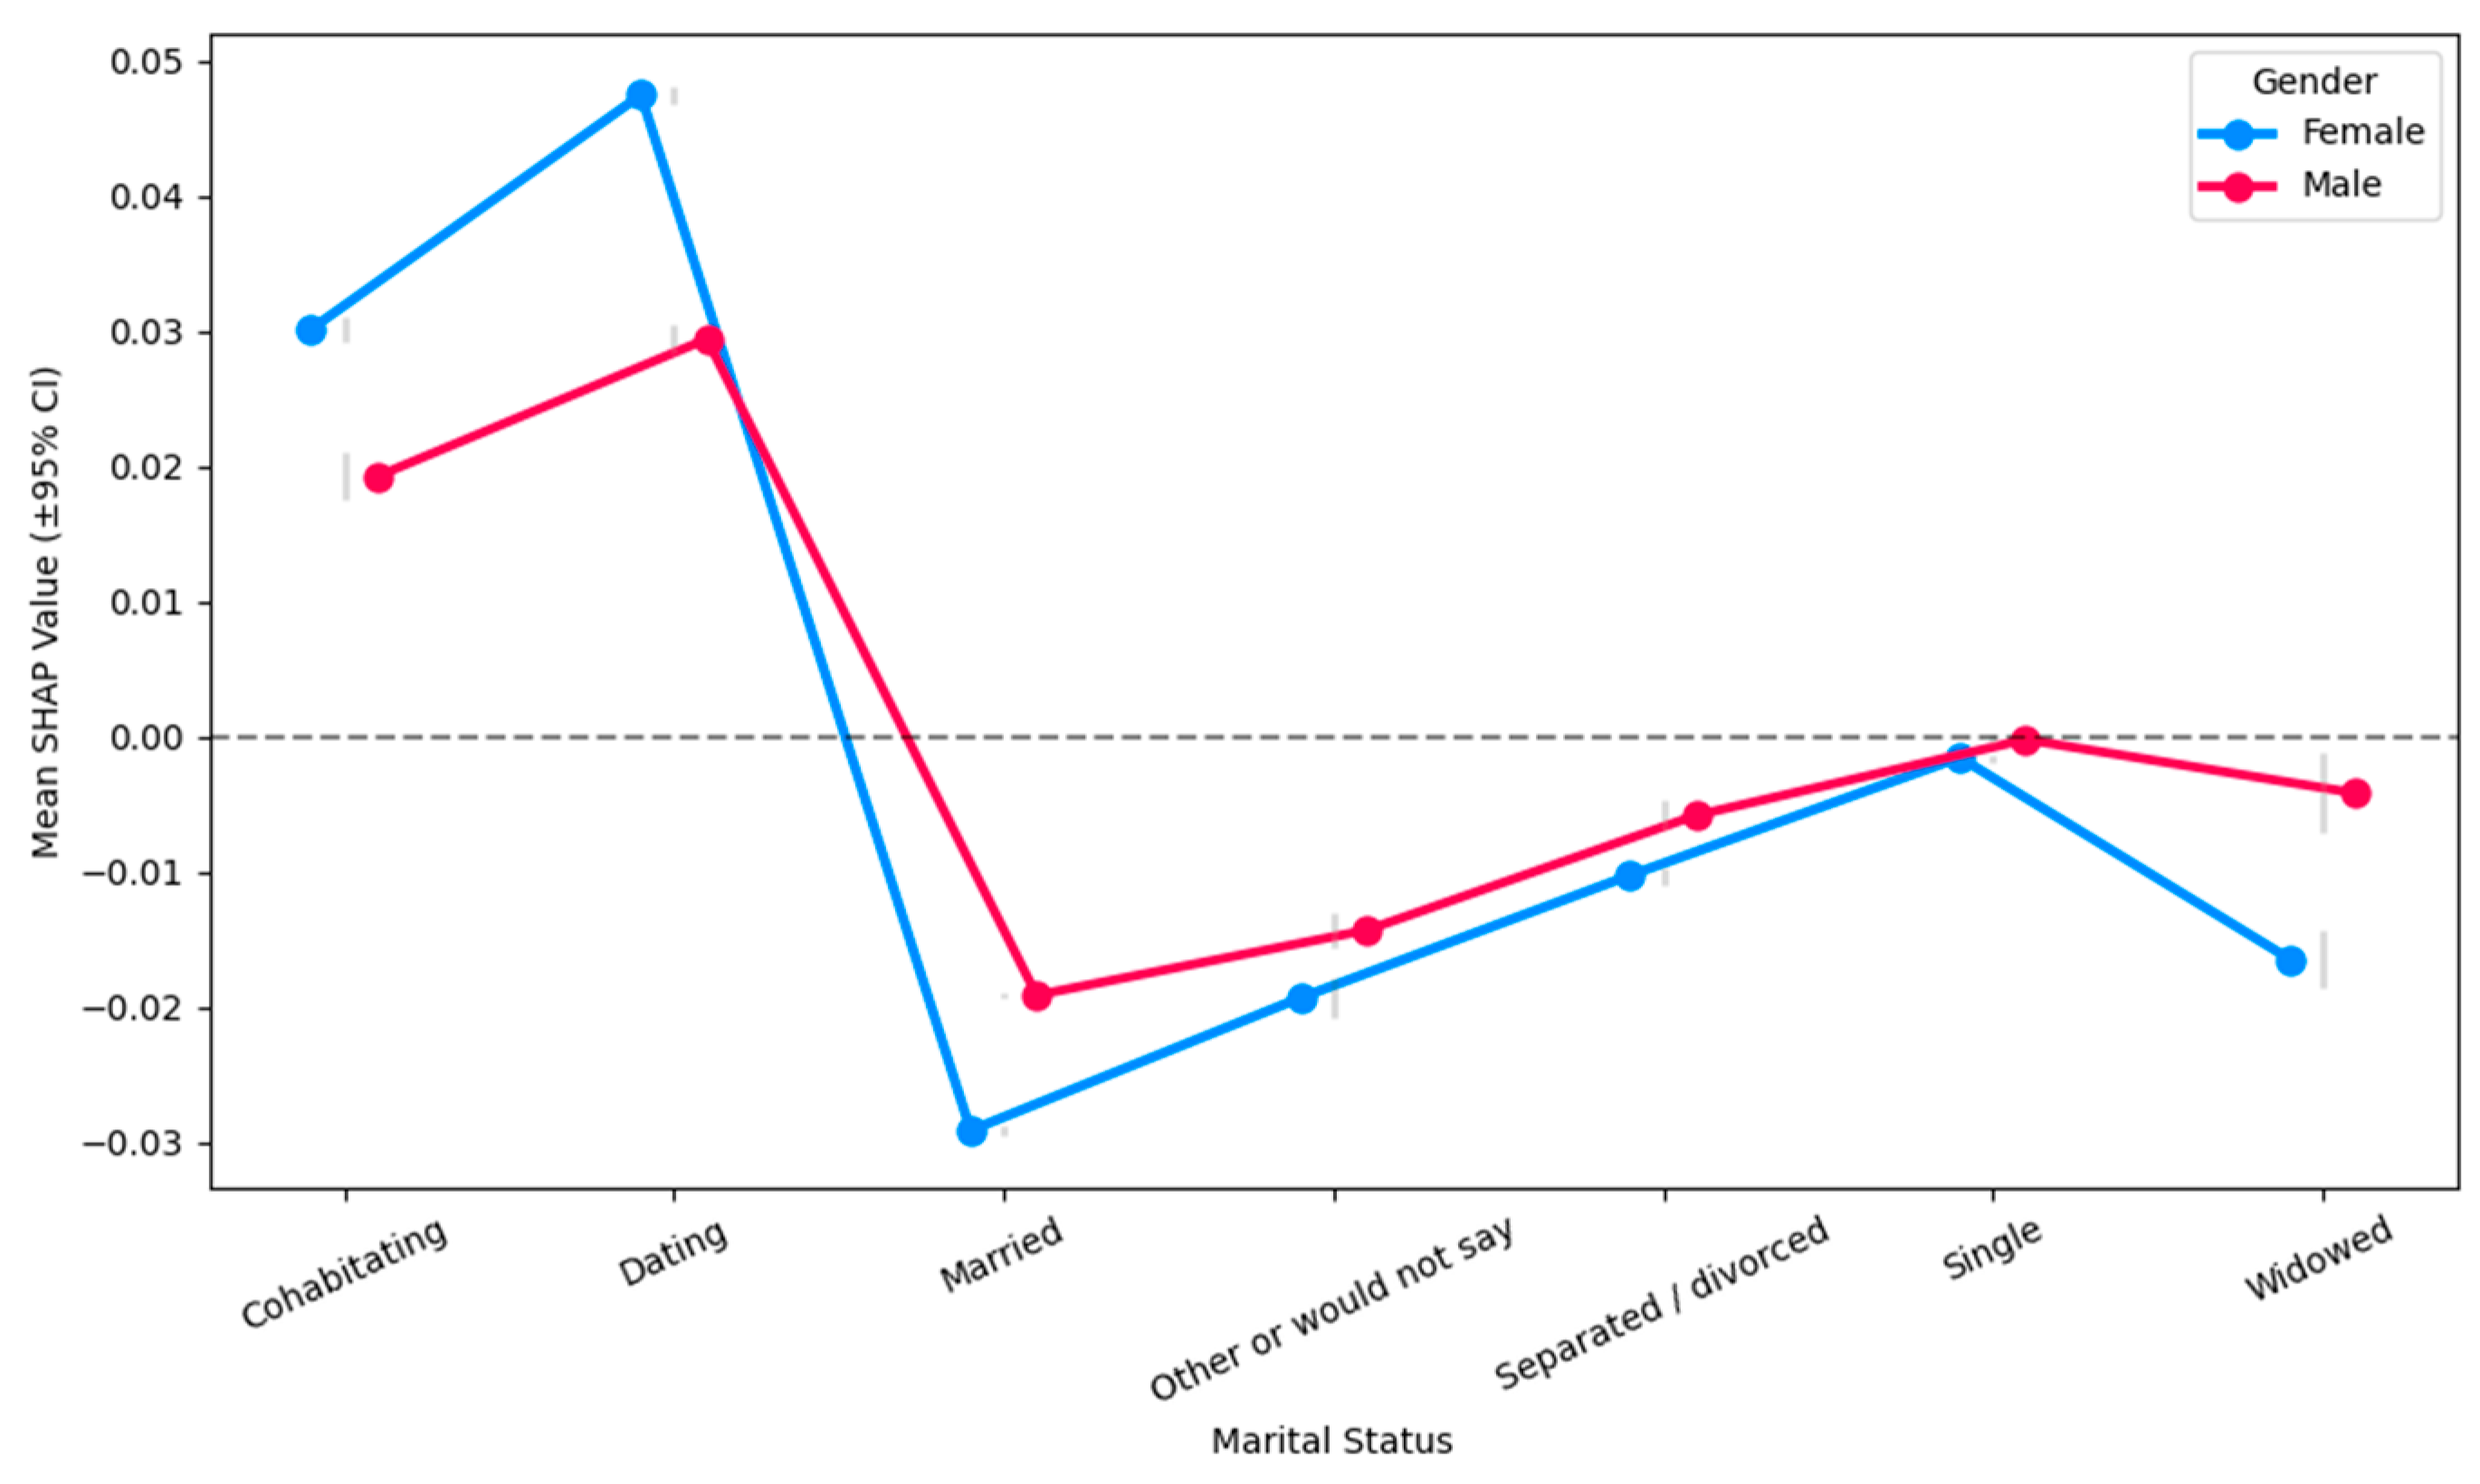

Table 1.
The dates of data collection.
| Country | Data Collection Period | Reason |
| All 137 countries (main dataset) | 06/10/2021 - 08/22/2021 | N/A |
| Russia (active data collection) | 05/28/2021 – 05/31/2021 | Political restrictions and/or local teams’ availability |
| Uganda (active data collection) | 05/29/2021 – 06/30/2021 | |
| Columbia and Sweden | Through 08/29/2021 |
Table 2.
The summary statistics for numerical variables.
| Variable | Mean | Std | Min | 25% | 50% | 75% | Max |
| age | 37.04893 | 14.616995 | 18.0 | 24.0 | 35.0 | 47.0 | 88.0 |
| cohabiting_adults_no | 1.363503 | 1.136124 | 0.0 | 1.0 | 1.0 | 2.0 | 5.0 |
| cohabiting_kids_no | 0.478804 | 0.825025 | 0.0 | 0.0 | 0.0 | 1.0 | 4.0 |
| happiness_score | 6.260288 | 0.765813 | 4.8748 | 5.7436 | 5.9405 | 6.5844 | 7.8421 |
Note: This table shows the summary statistics for the numerical variables, and the total participant count is 12377.
Table 3.
The summary statistics of the categorical variables.
| Variable | Unique | Top | Freq |
| gender | 2 | Female | 8306 |
| relationship_status | 7 | Married | 4094 |
| education_level | 5 | University degree (e.g., MA, MSc, BA, BSc) | 5920 |
| employment_status | 3 | Employed | 8385 |
| perceived_stress_level | 4 | Moderate | 4466 |
Note: This table shows the summary statistics for the categorical variables. The total number of participants is 12377.
Table 3.
General Performance Overview of Random Forest and XGBoost models.
| Metric | Random Forest | XGBoost | ||||
| Low Class | High Class | Macro Average | Low Class | High Class | Macro Average | |
| Precision | 0.6777 | 0.6164 | 0.6471 | 0.6735 | 0.6103 | 0.6419 |
| Recall | 0.7814 | 0.4854 | 0.6334 | 0.7802 | 0.4763 | 0.6283 |
| F1-Score | 0.7258 | 0.5429 | 0.6343 | 0.7229 | 0.5350 | 0.6290 |
| Support | 1433.0000 | 0.1035.0000 | 2468.0000 | 1433.0000 | 1035.0000 | 2468.0000 |
Disclaimer/Publisher’s Note: The statements, opinions and data contained in all publications are solely those of the individual author(s) and contributor(s) and not of MDPI and/or the editor(s). MDPI and/or the editor(s) disclaim responsibility for any injury to people or property resulting from any ideas, methods, instructions or products referred to in the content. |
© 2025 by the authors. Licensee MDPI, Basel, Switzerland. This article is an open access article distributed under the terms and conditions of the Creative Commons Attribution (CC BY) license (http://creativecommons.org/licenses/by/4.0/).
Copyright: This open access article is published under a Creative Commons CC BY 4.0 license, which permit the free download, distribution, and reuse, provided that the author and preprint are cited in any reuse.


