
Submitted:
17 October 2025
Posted:
17 October 2025
You are already at the latest version
Abstract
The whale shark aggregation area in La Paz has given rise to a vital wildlife tourism activity since the mid-1990s, which has been consolidated during the first decade of the 21st century. La Paz Bay is one of the three sites in Mexico where whale shark wildlife tourism is practiced. Biological and ecological research of whale sharks in the La Paz Bay is extensive. However, there is a considerable lack of knowledge about the socioeconomic implications of this activity. Understanding the recreational values of users of the whale shark area is fundamental to formulating an effective management policy. Using the individual travel cost method, we estimate the recreational value of whale shark marine wildlife in La Paz Bay—the estimated individual´s willingness to pay ranges from 8 to 27 US$ per trip. The recreational value of whale shark wildlife tourism ranges from 304,600 to 1,028,025 US$/season. The recreational value per whale shark ranges from 2,361 to 14,083 US$. These results serve as a baseline for implementing economic and environmental policies and/or instruments to collect financial resources, aiming to strengthen actions oriented towards site and species conservation. Community-based management options, limitations, and opportunities are also discussed.
Keywords:
marine endangered species
; non-market valuation
; gulf of california
; marine and coastal tourism
; willingness-to-pay
1. Introduction
1.1. Wildlife Tourism
Wildlife tourism is defined as tourism based on encounters with non-domesticated animals (Higginbottom, 2004). These encounters can occur in either the animals’ natural environment or in captivity, also known as ‘non-consumptive’ activities, such as viewing/watching, photography, and feeding, as well as hunting and recreational fishing. Wildlife tourism is typically practiced in protected areas (terrestrial or marine), with the main problems in emerging economies being sustainable finance and a lack of funding for these areas (Rodger et al., 2010).
Globally, many marine wildlife-watching sites and species opportunities have evolved into a significant and growing industry in some developed and emerging economies. Valentine & Curnock (2001) identified 70 target species for practicing wildlife tourism, including the whale shark. Higginbottom (2004) categorizes marine wildlife watching into three distinct elements: shore-based observations, boat-based observations, and in-water activities, all of which are widely available. The latter includes swimming and diving focused on marine wildlife, including some specialized opportunities (i.e., swimming with sharks, whale sharks, dolphins, and whales).
Whale shark marine tourism is a growing industry and activity in both developed and emerging countries. Since 1986, there has been a considerable increase in recreational diving and boating activity worldwide, with WS aggregations in various places (Stevens, 2007). Often, predictable aggregations foster diving and boating activities with WS, which are associated with singular productivity events. Locations, where aggregations occur, include Belize (Heyman et al., 2001; Graham & Roberts, 2007), Ningaloo Reef (Taylor, 2007; Norman & Stevens, 2007; Taylor, 1996), the Sea of Cortez (Eckert & Stewart, 2001; Nelson, 2004), the Seychelles (Rowat & Gore, 2007), KwaZulu-Natal (Beckley et al., 1997), Veraval in India (Vivekanandan & Zala, 1994) and Mexico (Whitehead et al., 2020; Ziegler et al., 2015). Stevens (2007) notes that increased demand and higher prices for WS products have led to increased interest in conservation and marine wildlife tourism.
Wildlife tourism has economic benefits, including the monetary value of the expenditures wildlife tourists make for travel, accommodation, food, souvenirs, and other related expenses during their visit. Economists have used total economic value (TEV) as a broader concept than these expenses. There are two widely accepted definitions of TEV. Turner et al. (1993) define TEV as a multi-attribute environmental asset that provides both use and non-use values to individuals. Pearce & Turner (1994) define TEV as the sum of the actual use, option, and existence values. Direct use by tourists is only one of the economic values that flow from nature tourism destinations (Higginbottom, 2004; Wells, 1997).
These positive impacts are only a partial reflection of the total economic value of wildlife tourism, as significant non-use values, such as existence, intrinsic, heritage, and option values (Tisdell, 2002; Emerton, 2001), also need to be considered. Even though the difference between the amount individuals would be willing to pay and the amount they actually pay constitutes foregone income to the destination (consumer surplus), decision-makers are less interested in these non-use values because of the difficulty of capturing or utilizing them in practice (Wells, 1997). Pendleton & Rooke (2007) highlight that, in the case of wildlife tourism, it is more accurate to use direct use values to measure consumer surplus because they can be measured using revealed-preference methods. For recreational activities, environmental economists frequently use the travel cost method. At the beginning of the century, and more recently, some research has shown that wildlife tourism valuation has been taken into account for marine and coastal tourism management (Appendix A). However, to date, no study has examined the recreational value of wildlife tourism with WS or the value of individual whale sharks in La Paz Bay, Mexico.
The Economics of Ecosystems and Biodiversity (TEEB, 2012) argues that a better understanding of marine and coastal ecosystems, biodiversity, and their contributions to societal well-being is required. Demonstrating the economic value of ocean and coastal biomes could reveal new economic opportunities. It could also play a role in policy and management schemes that enhance sustainable development for marine resources and ecosystems. Marine environments provide nearly two-thirds of global ecosystem services (ES), yet humans know relatively little about them. Marine ecosystems suffer due to a lack of knowledge and governance deficits. Conserving ocean and coastal ecosystems requires managing human activities within them. To address the most critical challenges affecting ocean and coastal environments, the blue economy approach must be integrated into decision-making to enhance ecosystem services and resources and promote sustainable use.
1.2. Community-Based-Management
Community-based management (CBM) emphasizes local participation, empowerment, and decision-making in resource management. It is widely used in natural resource management and development initiatives (Cox et al., 2010). This approach promotes the long-term conservation of natural resources and is expected to benefit local communities (Brooks et al., 2013). Ermitage (2005) defines CMB as a mechanism to meet environmental and socio-economic goals while balancing the use and protection of important ecosystem components. A more recent definition of CBM refers to the governance and stewardship of natural resources or biodiversity by, for, and with local communities. It emphasizes the coexistence of people and nature, in contrast to protectionist approaches that segregate them. This approach integrates conservation and development objectives to protect biodiversity while supporting local livelihoods (Berkes, 2007). However, resource management requires different strategies depending on whether the resources are terrestrial or marine. Managing marine resources is more difficult than managing terrestrial resources, as some of these resources are migratory and move above and below the water column, making their position unpredictable.
Therefore, CBM in marine conservation refers to the involvement of local communities in the governance, planning, and management of marine resources and protected areas. CBM emphasizes recognizing local rights, knowledge systems, cultural and ancient practices, and identifying leadership in conservation efforts. It seeks to ensure that conservation initiatives align with the area’s socio-cultural context and provide tangible benefits to local populations (Bennet et al., 2021). Ziegler & Dearden (2021) define marine CBM as a part of incentive-based conservation (IBC) strategies, which emphasize local community involvement in the stewardship planning, development, and conservation management for sustainable use of marine resources -looking and promoting conservation while ensuring local stakeholders’ economic benefits and social welfare from the managed resources. It is a participatory approach that recognizes local knowledge and social cohesion through shared responsibility in achieving effective conservation outcomes (Sustainable Travel Tech, 2024).
Berkes (2007) argues that CBM is not a “silver bullet” or “one-size-fits-all” solution, but rather a strategy that requires adaptation to the context, adaptive governance, and recognition of the challenges to nature conservation. CBM emphasizes community involvement to ensure marine and coastal conservation, economic benefits, and social consent for the success of sustainable management efforts (Bennet, 2021). These elements empower communities to protect marine resources while improving their livelihoods (Ziegler, 2020). However, there has been a broad debate about the key principles of CBM (Child, 1996; Ermitage, 2005; Cox et al., 2010; Dressler et al., 2010; Brooks et al., 2013).
Grubber (2010) makes an essential summary of the 12 principles of CBM. These principles are i) public participation and mobilization, referring to engaging diverse stakeholders in decision-making and implementation, ii) social capital and collaborative partnerships, this is building trust, networks, and partnerships to leverage resources and foster innovation, iii) resources and equity, meaning ensuring fair distribution of benefits and addressing local economic and social needs, iv) communication and information dissemination, related to transparent and accessible communication to foster trust and knowledge sharing., v) research and information development, by using integrated scientific, social, and local knowledge for informed decision-making, vi) devolution and empowerment, which is transferring authority to local communities for better decision-making and commitment, vii) public trust and legitimacy, by building trust through transparency and participatory approaches, viii) monitoring, feedback, and accountability, systems for evaluation, learning, and accountability, must be established, ix) adaptive leadership and co-management, this is promoting resilience and collaboration through dynamic leadership and management, x) participatory decision making, by facilitating inclusive problem-solving and decision-making processes, xi) optimal environment, preconditions or early conditions should be assessed to ensuring favorable social and resource conditions for success and, xii) conflict resolution and cooperation, by addressing inherent conflicts and fostering cooperation among stakeholders. These elements collectively aim to empower communities to protect marine resources sustainably while improving their livelihoods.
1.3. Whale Shark Wildlife Tourism in La Paz Bay, Mexico
The GOC is where many WS sightings occur (Wolfson, 1987), especially off the southern Baja peninsula, from Cabo San Lucas to La Paz Bay. Peak WS sightings occur from May to June and from September to November, due to the high abundance of feeding species (Ketchum, 2003).
La Paz Bay is located in Baja California Sur, Mexico and, is the biggest coastal water cove in the Gulf of California (GOC), with a 2600 Km2 area, 450 m deep in its deepest zone and is the most important bay in the state, due to its dynamic biological and fishery activity, which is important to both net primary and secondary production (Reyes-Salinas et al., 2003) and, for a growing wildlife tourism activity; supports an array of filter feeding marine fauna such as: sardines, manta rays and WS (De Silva-Dávila & Palomares-García, 1998; Ketchum et al., 2013).
La Paz Bay is bounded to the North by Isla San José, to the South by Ensenada de La Paz, and to the East by the Espiritu Santo and La Partida Islands, making the bay a critical refuge area for many marine species, including whale sharks (SEMARNAT, 2018). The southern part of the bay features a protruding sandbar, attached at one end to the mainland and extending approximately 12 km parallel to the bay’s mouth, known as El Mogote. This area is the leading seasonally aggregating site for WS due to its highly productive coastal zone.
Diver encounters with WS in La Paz Bay were relatively rare in the 80s (Clark & Nelson, 1997), but there was a remarkable growth of specialized ecotourism operators in the 90s (Johnson et al., 2019; Hacohen-Domené et al., 2006). Since then, WS wildlife tourism has become an important economic activity in the GOC region and represents an important form of natural capital with high potential to produce economic values for La Paz Bay and Bahía de Los Angeles (Cárdenas-Torres et al., 2005; Rodríguez-Dowdell, 2007), where swimming and observation with WS are conducted, primarily due to regular and predictable aggregations on a seven-month basis annually (Petatán-Rámirez et al., 2020).
Whale sharks aggregations frequently occur in Bahía de Los Ángeles, Baja California, La Paz Bay, and Banco Gordo, Baja California Sur (Ramírez-Macias, 2005). These aggregations have become an essential seasonal component that supports an important tourist industry. According to Ramírez-Macias & Saad (2016) in La Paz City chartered dive boats conducting WS wildlife tourism has shown a rapid growth since late 90s, passing from 26 authorized boats in 2006 to 109 in 2013, these tour operators draw upon an average aggregation of 56 WS per season, 20 minimum and 71 as maximum, arguing that the increase in permits and lack of enforcement will aggravate adverse effects on WS. Whitehead et al. (2020) assessed WS abundance at La Paz Bay from October 2015 to March 2018, finding 1,662 WS sightings, ranging from 73 to 129 animals monthly.
Nature-based tourism direct expenditure in La Paz was estimated to range from 8 to 18 million USD (Cisneros-Montemayor, 2020), while shark diving direct expenditure was estimated at 12.4 million USD (Cisneros-Montemayor et al., 2019; Cisneros-Montemayor et al., 2013). Nevertheless, there are no valuation studies on wildlife tourism activity for WS alone; this research seeks to fill this gap.
Marine wildlife tourism with WS in La Paz Bay has rapidly increased, raising concerns about its effects on this endangered species and capacity-building (Whitehead et al., 2019; Ramírez-Macías & Saad, 2016). One of the recurring problems in the WS area has been injuries caused by boats, primarily affecting the dorsal, caudal, and back fins. Ramírez & Saad (2016) reported that 54% of WS had fresh injuries; 60% had abrasions, 30% had both abrasions and lacerations, and 9% had only lacerations. Womersley et al. (2022) indicate that La Paz Bay is considered a high-collision risk site for WS. These issues are primarily driven by high marine traffic areas and the lack of maritime signaling and surveillance, making them a significant challenge to address, in addition to those arising from growing tourist demand. However, there is no baseline to establish economic forfeits for natural resource damage or penalties and fines for those who cause WS injuries.
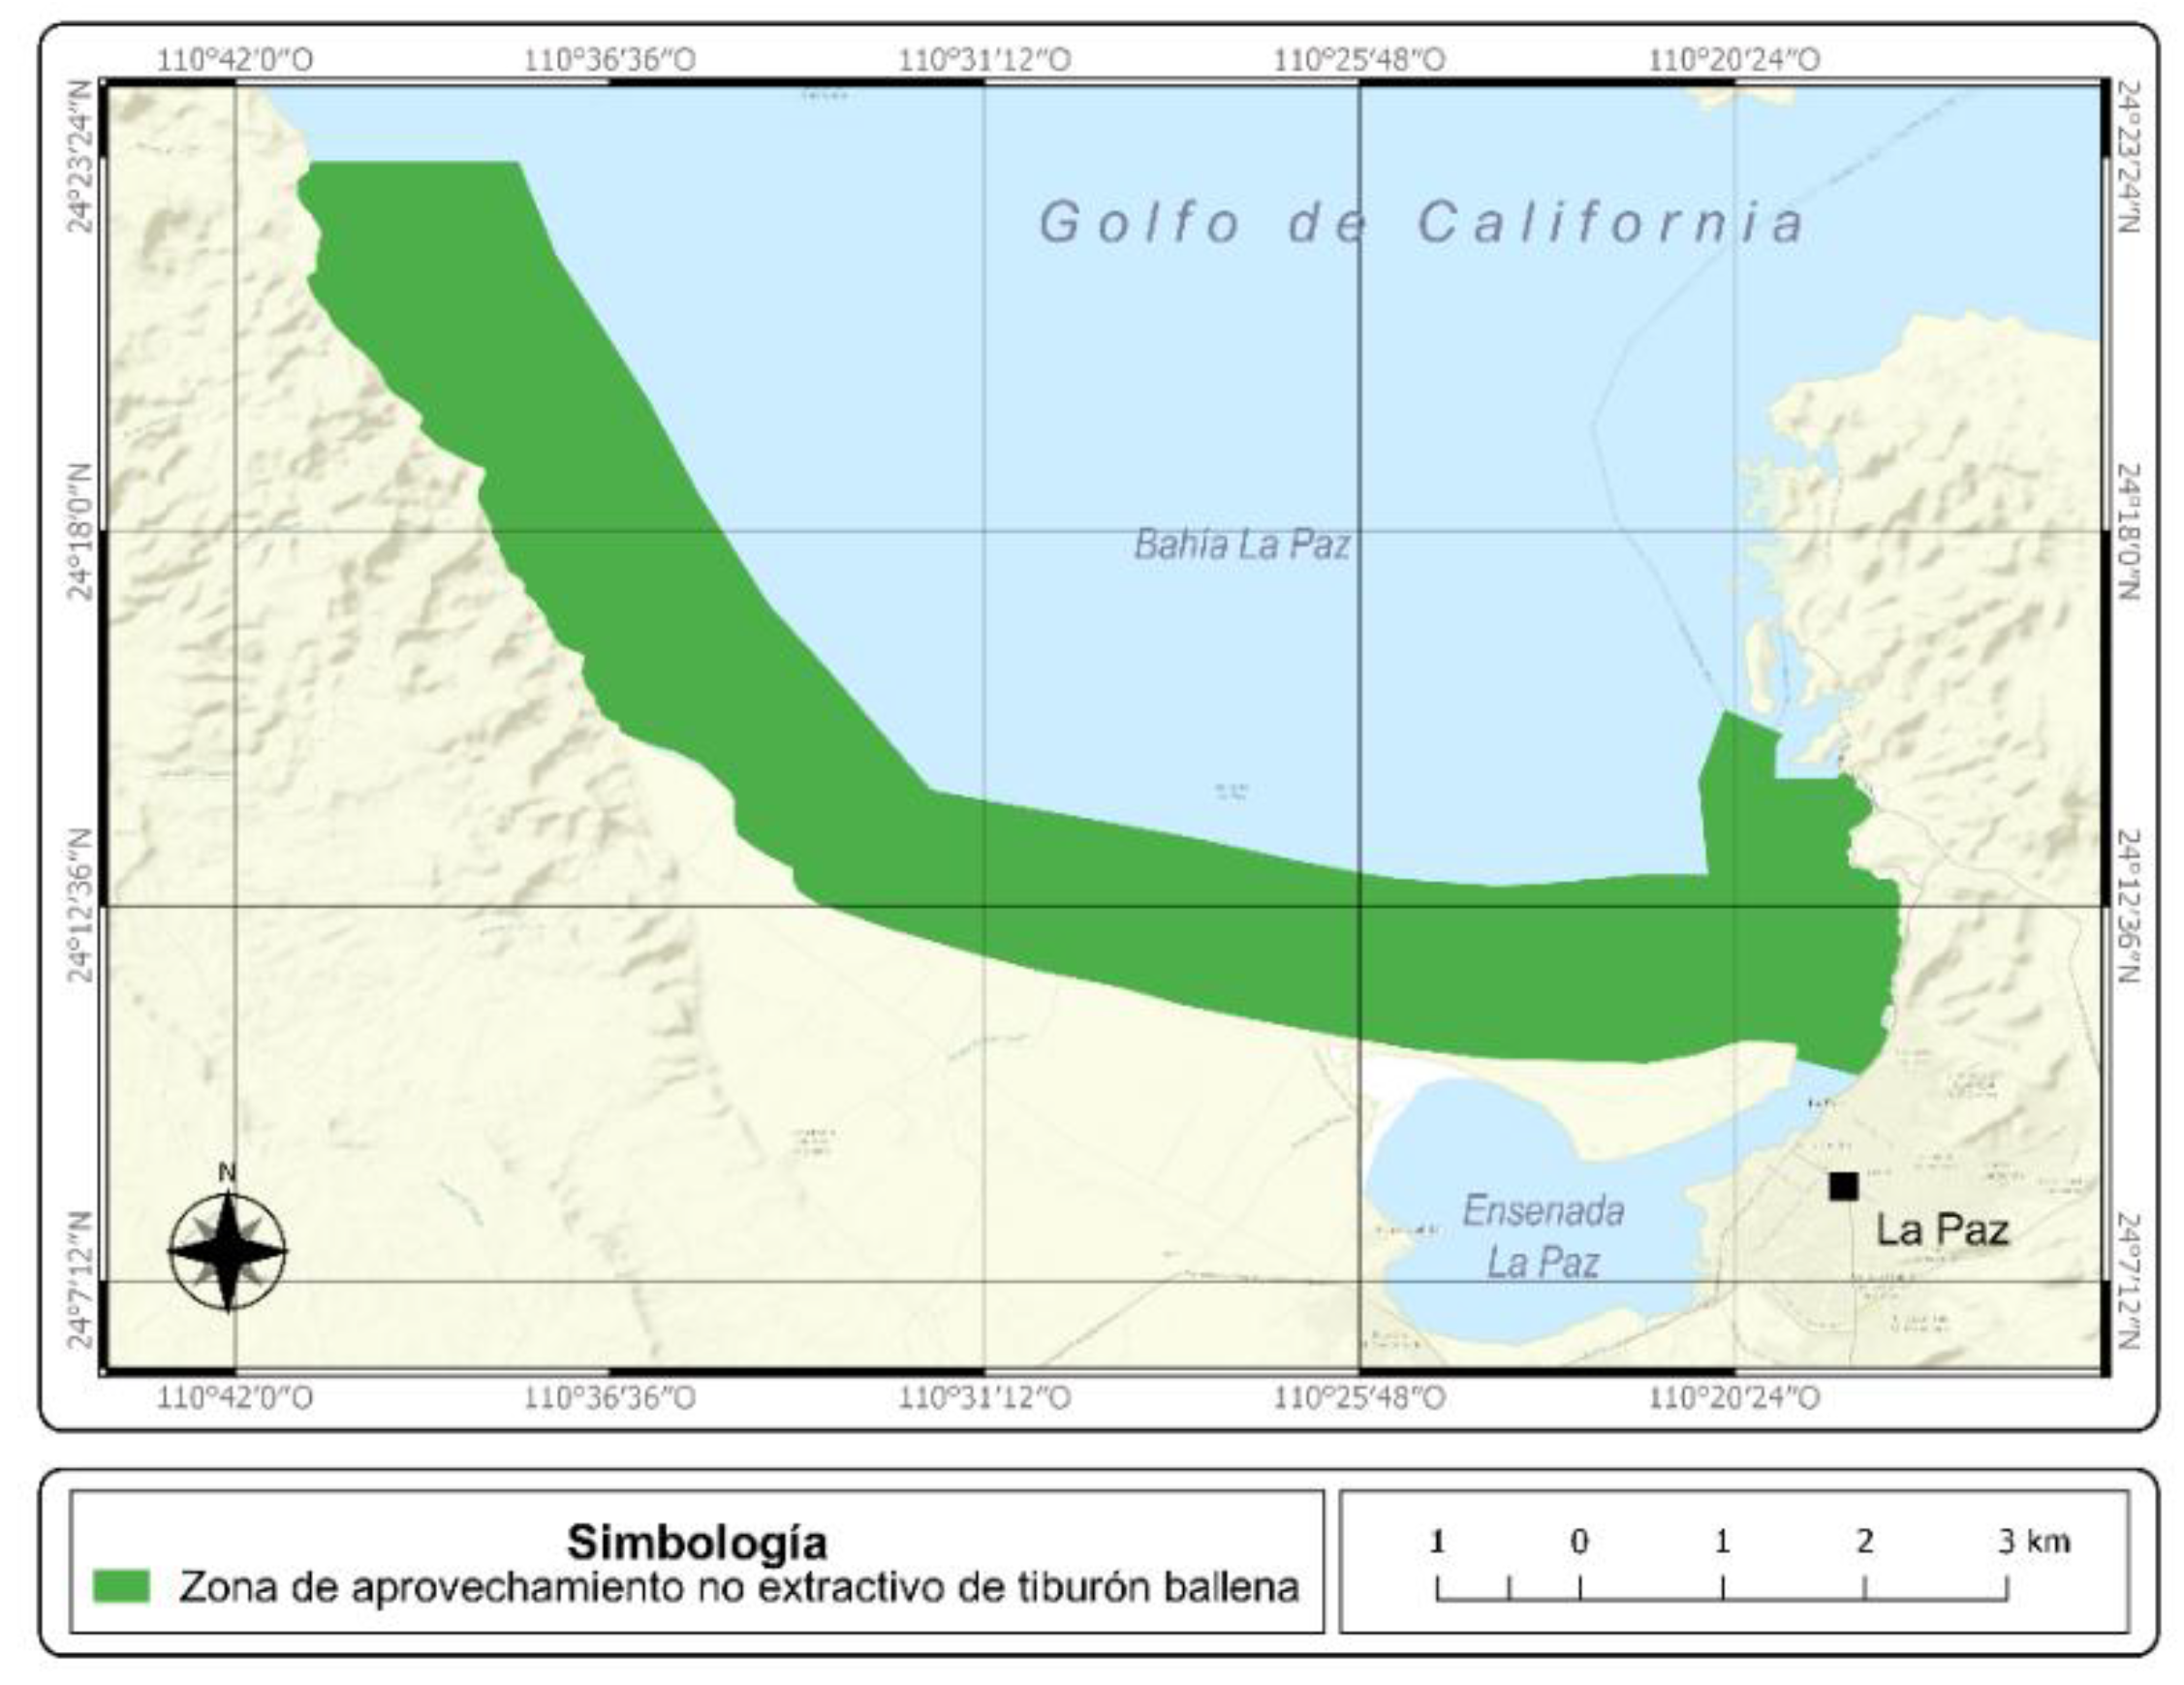
Pressures from uncontrolled tourism development, growth, and performance have prompted authorities to establish a protected area and zoning for WS wildlife tourism (Figure 1). Some site-specific regulations were also established to regulate the over-growing industry, such as i) conditions for obtaining permits, ii) indications for conducting the activity, iii) prohibitions inside the area, iv) emergency and contingency measures, v) boarding and disembarking sites, vi) number of authorized boats, vii) Boat operation maneuvers during the activity, and viii) priority criteria. Lastly, authorities define the whale shark wildlife tourism season as running from September to April annually (SEMARNAT, 2018). However, the season could vary due to different factors.
Nevertheless, to ensure that recreational ecosystem services provided by this species endure, an effective management policy is necessary to prevent damage to WS and its habitat. This policy should inform policy decision-makers on how to increase monetary collection and reinforce financial resources allocation for conserving and protecting whale sharks and their habitat, as an economic baseline for potential damages. This policy should be strengthened by understanding the area, the species, user characteristics, and their recreational values.
2. Materials and Methods
2.1. Sampling
Applying unrestricted random sampling without repetition for a known population:
n=(Npq) / pq+((N-1)i2))
Where N: population, p: success probability (0.5), q: 1-p, and i: estimation error (5.2%). We obtained a representative sample of 352 surveys (n) with 95% confidence to be administered to visitors who practice wildlife tourism with whale sharks. Information about visitors who engaged in whale shark wildlife tourism on the site during the studied period of 2023-2024 was provided by the Natural Resources Administration Agency (SEMARNAT, for its Spanish acronym). The agency registered 38,075 visitors that season. The survey response rate was 94.8%.
2.2. Travel Cost Method
The travel cost method (TC) was proposed by Hotelling (1947) to the National Park Service to establish access fees to protected areas. TC estimates demand for an environmental good or service as the number of visits when travel costs vary. The first TC studies were conducted in the early ‘70s (Haab & McConnell, 2002).
TC is based upon seven assumptions (Haab & McConnell, 2002); 1) the number of trips/travels and environmental site quality are complementary into utility function, 2) every individual perceived and respond to travel cost variations in the same way that reacts to changes on-site access fees, 3) only one site is visited, 4) staying time is fix and exogenous, 5) there are no site substitutes, 6) wage rate represent time opportunity cost, and 7) the individual does not perceive utility or disutility during travel time or working time.
From an economic perspective, aquatic ecosystems (lakes, rivers, estuaries, bays, and seas) and the recreational services they provide are considered public goods. As a result, some of their important environmental attributes and characteristics have no market value. These latter are essential for determining the economic value of natural resources that offer recreational alternatives not assigned through a market system (TEEB, 2012).
As Vásquez-Lavin et al. (2007) note, TC assumes that each individual visiting a recreational site is associated with an implicit transaction linking travel cost to the value (or price) that visitors should pay to access the site. TC has been modeled from two perspectives. One is that a demand function is estimated by associating trips and travel costs, which diverge with different traveled distances. The site’s economic value is represented by the area under the compensated demand curve and is calculated for all individuals who have visited the site. In the second approach, individuals decide whether they want to visit a site for recreational purposes. If affirmative, models that use this decision scheme are linked to a discrete choice or random utility model (RUM). These models emphasized the choice problem of selecting a site for a predetermined trip; that is, after choosing a number of trips to carry out the recreational activity, the site selection must be modeled.
The same authors indicated that the individual’s utility-maximization model could be divided into two stages. First, the site to visit is selected each time. Therefore, there is an interest in how trips are distributed among different sites. In this case, welfare estimates are calculated by using the parameters of an indirect utility function.
The general TC model formalizes individual or group behavior regarding the number of trips to a specific site. These behavioral models are based on a common hypothesis of utility maximization, restricted to the budget constraint (Hueth & Strong, 1984). Assuming that there is a single site available and that all visits are equally distributed, it is feasible to adapt the problem as follows:
Max U(x,z), s.a. m = d+wtw = z+(c1+c2)
T = tw+(t1+t2)x
Where x is the number of trips/travels; z is expenditure on a good which does not involve the time constraint (or Hicksian good) m is individual total income, d is the available income not related to labor journey, w is the wage rate, tw is the work time, c1 is travel cost, c2 are the expenditures on the site (discretional cost), T is total available time, t1 is travel time and t2 is site staying time.
Assuming individuals could choose discretionally working time (in hours), and assuming that the opportunity cost of travel time is related to w, it is possible to isolate tw as:
tw = T – (t1 + t2)x
Replacing (3) in the budget constraint m:
m = d + w[T – (t1 + t2)x] = z + (c1 + c2)x
d + wT = w(t1 + t2)x + z + (c1 + c2)x
d + wT = z + x[(c1 + wt1) + (c2 + wt2)]
From equation (4), it follows that wT is the income if the individual allocates all time to work, c1+wt1 is equivalent to the travel cost, and c2+wt2 represents the staying cost. Then equation (4) could be rewritten as:
m* = z + pxx
Where, m* = d + wT and px = (c1 + wt1)+(c2 + wt2). Then, the utility maximization problem transforms into:
Max U(x,z), s.a. m* = z + pxx
The idea is to estimate x = (px,m*) and z = z(pz,m*), where px is the price of a trip/travel and pz is the price of good z; both equations are the demand functions obtained by solving the primal problem. Highlighting the linearity of the budget constraint. Once the primal problem of TC is solved and its assumptions are considered, recreational demand estimation is possible.
2.3. Recreational Demand Estimation
At the beginning of the 80s, two demand estimation approaches for TC were identified: demand by origin zones and individual demand estimation. Hellerstein (1995) and Clawson and Knetsch (1996) indicate that, due to aggregation bias and the lack of microdata, the demand zone method was abandoned by economists. Therefore, the individual approach has been frequently applied by environmental economists, providing better parameter estimates for the regressors and more efficient outcomes for the estimated demand function for recreational services. The general form of individual TC is:
Xij = f(Cij, Zij, eij)
Where Xij is the number of visits to site i by individual j in one year, Cij is the individual’s travel cost to the site, Zij is a vector of socioeconomics and other environmental variables associated with the site, and eij is the stochastic term.
Discrete distributions are used to estimate most TC models, where the dependent variable is the number of trips or travels. These variables are discrete and non-negative, as people generally make only a few trips to the recreational site, typically one or two (Haab & McConnell, 2002). Because of this approach, TC studies commonly use discrete density functions, such as the Poisson distribution, defined by the parameter λ, which represents both the mean (expected number of trips) and the variance. If λi>0, the expected number of trips (xi) is positive. However, TC has some issues that must be taken into account, like, investment in durable equipment, multi-site/purpose recreational trips, substitutes sites, opportunity cost, lodging, subsistence expenditures and other costs involved, site classification, distance, quality of recreational area and congestion, and travel duration (Czajkowski, 2019; Leh et al., 2018; Clawson & Knetsch, 1996; Randall, 1994; Turner et al., 1993; Smith & Karou, 1990).
A Poisson regression model is appropriate because of the count data characteristics of WS wildlife tourism visits. The probability of a count is determined by a Poisson distribution (Cameron & Trivedi, 2007). Count models based on the Poisson distribution have the advantage of avoiding regression bias when the dependent variable can only take non-negative values (Shaw, 1998). One of the main assumptions of the Poisson distribution is that there may be zeros in the observations. However, Haab and McConnell (2002) mention that the estimator in the Poisson model can be biased and inconsistent in the presence of over-dispersion (α), which is considered a type of heteroscedasticity and is defined as the excess conditional variance over the corresponding conditional mean of the dependent variable (when the variance-mean ratio is greater than 1). Under conditions of this nature, it is advisable to use a negative binomial distribution, considered an extension of a Poisson distribution (Hilbe, 2007; Cameron & Trivedi, 2007).
The net benefits for recreational site visitors can be measured as the consumer surplus (CS). It is the most widely used measure for estimating visitor net benefits (Zhang et al., 2015). Once variable parameters are estimated using count models, Haab and McConnell (2002) suggest that calculating the CS or willingness-to-pay (WTP) is the next step.
3. Results
3.1. Data
On-site questionnaire surveys were conducted at La Paz City by the research team (lead researcher, supervisor researcher, and two trained interviewers) from December 8th to January 27th. Three hundred and thirty-four surveys were administered to visitors who participated in WS wildlife tourism activities. Surveys were conducted at the local harbor applied to boat passengers. One person was chosen randomly from each boat group. Interviewers answered every interviewee’s questions regarding the questionnaire when the survey was applied.
The average age is 34 years old, 7.5 hours to arrive at the La Paz destination, six people on board the boat on which the wildlife tourism activity with WS was performed, four WS were spotted before jumping into the water, visitors declared having done the activity twice in the last five years, and six days staying. The average values (in USD) for monetary variables are as follows: annual income, $40,080; excursion with WS, $74; airfare expenses, $360; meals, $225; fuel, $134; car rent, $115; lodging, $351; total travel cost, $540; it must be highlighted that not all visitors incur in the exact costs when they visit La Paz. For instance, the annual income of domestic visitors is $10,480, and that of foreign visitors is $108,748; thus, travel expenses would not be similar for both types of visitors.
The sample consists of 49% females, with a majority of males. Visitors are categorized by origin as follows: 74% are domestic, 14% are from Europe, 9% are from North America (including the United States and Canada), and 3% are from other countries. Almost 74% of the sample reported visiting the WS area for the first time. Visitors’ opinions about the main reason for conserving the WS area are disaggregated as follows: 87% state that the main reason for site conservation is marine biodiversity, 11% think the area should be conserved for recreational activities, and 2% consider its conservation important for economic reasons. Regarding site conservation status, 54% of the sample considers that site conservation is deficient, 32% grade it as poor, and only 16% consider that the WS area has a regular conservation status. The guide’s performance during the WS activity was graded by visitors as follows: 71% ranked it very good, and 29% ranked it good. A high percentage, 99%, of visitors were informed about the regulations for performing wildlife tourism activities. A high proportion of interviewees (92%) considered that people must be informed that the WS area is a natural sanctuary for WS conservation. Last, 88% consider that a conservation fee must be implemented.
3.2. Econometrics
Following Randall’s (1994) recommendation, we use travel price (tp), which each individual paid for the WS wildlife tourism excursion, instead of travel cost. The analysis excludes equipment investment, because appropriate equipment is provided for tour operators. Recreational areas differ due to their cultural, environmental, and historical characteristics. Because of this, we decided not to include substitute sites; besides, there are no other sites nearby to watch WS in Baja California Sur; La Paz Bay is the only aggregation area for WS in southern Baja. Opportunity and travel duration were included in this research through travel-time costs and other costs, such as on-site meal expenditures. Maximum likelihood estimation was used to estimate the coefficients in the Poisson models. This research included variables such as travel price, socioeconomic characteristics of WS wildlife tourism visitors, and site environmental conditions in estimations (Table 2). An example of this is variable dom, which serves as a proxy for distance, and variable consd represents site quality.
Four separate regressions were estimated (Table 4), each with a different type of travel price as the independent variable. First, travel price (TP) is the price paid for the WS excursion. The second regression is referred to as TPOME, as the travel cost analysis literature lacks consensus on which additional costs, such as accommodation or food, should be included (Rolfe & Prayaga, 2007). Beal (1995) mentions that most travel cost survey respondents considered fuel, food, and accommodation costs relevant in their recreational trips. Based on this, we decided to include on-site meals expenditures (OME) in our analysis, so TPOME is defined as
TPOME = tp + OME; where OME: On-site meal expenditures
Third, following arguments on travel cost method issues, we decide to include opportunity cost, which is defined as
TPTTC = tp + TTC; where TTC: Travel-time cost
Travel-time cost (TTC) was estimated using the following expression proposed by Hernandez-Trejo et al. (2009); this approach allows for consideration of opportunity cost in welfare estimation.
TTCi = tpi + (OPCi · TTi)
Where tpi, is the travel price of the excursion for WS wildlife tourism paid by the individual, OPCi, is the individual’s opportunity cost, and TTi is the effective travel time the individual spends from origin to La Paz. OPC was estimated by
OPCi = (ηYi) / TWTi
Where Yi is individual annual income, TWTi is the total worked time a year, and η is a coefficient to convert working time into leisure time. In our analysis, travel time cost was previously defined. However, there is still debate about how to estimate the time cost. One method commonly used is to use a fixed percentage of the respondent’s income (Hellerstein et al., 2004). Some researchers have suggested using a percentage between 25% and 100% (Hanley et al., 2001); in our analysis, the value used is 33%. An average of 50 weeks and 40 working hours a week was assumed to calculate TWT.
Fourth, a model that includes travel price, travel-time cost, plus on-site meals (TPTTCOME) is defined by
TPTTCOME = TPTTC + OME

Table 1.
Variables included in models.
| Variable | Description |
| V | Dependent, number of trips in the last 5 years, (V≥0) |
| dom | 1: If the visitor is domestic or local, 0: Other |
| alone | 1: If the visitor travels alone, 0: Other |
| lgroup | Natural logarithm for the number of tourists on board the boat, including the interviewee |
| sanct | 1: If the visitor agrees to inform citizens and visitors that the WS area is a natural sanctuary; 0: Other |
| gguide | 1: If the visitor considers that the guide had a good performance during the tour, 0: Other |
| rules | 1: If the visitor was informed about the rules to carry out the WS wildlife tourism activity; 0: Other |
| first | 1: If the visitor is visiting the WS area for the first time |
| consd | 1: If the visitor considers that the conservation status of the WS area is deficient, 0: Other |
| couple | 1: If the visitor visits the WS area with his couple/wife, 0: Other |
Estimation outcomes (Table 2) indicate that the associated coefficients for travel price (tp) in demand functions present the expected sign (negative) and are statistically significant at the 1% level. Furthermore, the coefficients of the remaining regressors are statistically significant at conventional levels, and their signs are consistent across all models.
Cameron and Trivedi (2007) and Wooldridge (2002) note that values for the McFadden R² to consider consistent estimations in cross-sectional data should range between 0.20 and 0.40; higher values indicate a better model fit. All McFadden R2 values on estimated models exceed 0.20 (Table 2). So, models present consistent estimations. According to Cameron and Windmeijer (1996, 1997), a more suitable statistical test for measuring model adjustment in count models, which are similar, is the R-squared based on the deviance residual and the Pearson R-squared. In this research, the Pearson R-squared is used to assess the goodness of fit of the models. Considering this argument, the best model is the TP model, which has the highest Chi2 value and the closest value to zero for the pseudo-log-likelihood in absolute terms. Over-dispersion tests were also conducted for each model; the output indicates rejection of the null hypothesis of the presence of over-dispersion.
If tp increases by 10%, then visitation will decrease by a percentage related to the variable coefficient times 10. Suppose the visitor is local or domestic (dom). In that case, visits will likely increase by almost one-third, since these types of visitors can afford to repeat the experience. If a visitor travels alone, the number of visits will decrease by a factor associated with the variable’s coefficient, while holding the other variables in the model constant. Supposing the number of persons on board the boat (lgroup) increases by one, the visitations will decrease by between 73% and 85% (depending on the model). Suppose that citizens and visitors are informed that the WS area was declared a wildlife sanctuary (sanct). Unlike what was expected, in that case, the visits will drop approximately by a factor of 0.48 to 0.60, depending on the estimated model, which could be because a wildlife sanctuary does not allow any activity that unnecessarily stresses the species it protects. If visitors consider the guide’s performance during the WS trip to be good (gguide), then visits will most likely increase by almost two. Visitors regularly expect good treatment and service from tour operators; if one of the main aspects of the WS wildlife activity is perceived as poor, there is a high likelihood that visitors will not return. When the rules for swimming with WS are explained to the visitor, the odds of revisiting the site increase by a factor of 0.14-0.17. If the visitor is practicing the WS wildlife activity for the first time, they are likely not to return. Opposite to what could be expected, when the visitor’s appreciation of the site’s quality is deficient (consd) for performing wildlife tourism activities, the visit will increase by almost one-third. The price-quality theory suggests that lower prices are often accompanied by lower quality, and vice versa (Gupta et al., 2025; Carrillat et al., 2024). Finally, if the visitor is visiting the site with their partner or spouse (couple), the visitation rate will decrease by approximately 0.60.
Table 2.
Estimated models for WS wildlife tourism activity.
| Dependent: V | Poisson Model | |||
| TP | TPOME | TPTTC | TPTTCOME | |
| n=334 | n=334 | n=334 | n=334 | |
| ltp | -0.7198 | |||
| [0.1229]** | ||||
| ltpome | -0.2087 | |||
| [0.0391]** | ||||
| ltpttc | -0.6449 | |||
| [0.1230]** | ||||
| ltpttcome | -0.5804 | |||
| [0.1063]** | ||||
| dom | 0.3809 | 0.2588 | 0.3384 | 0.2296 |
| [0.0819]** | [0.0822]** | [0.0791]** | [0.0739]** | |
| alone | -0.7283 | -0.5016 | -0.7323 | -0.5566 |
| [0.1970]** | [0.1435]** | [0.1945]** | [0.1500]** | |
| group | -0.8575 | -0.7316 | -0.8428 | -0.7865 |
| [0.3175]** | [0.3165]* | [0.3201]** | [0.3163]* | |
| sanct | -0.6054 | -0.4869 | -0.5753 | -0.5268 |
| [0.0894]** | [0.0858]** | [0.0890]** | [0.0860]** | |
| gguide | 2.0483 | 2.3514 | 2.1046 | 2.2958 |
| [0.2075]** | [0.2002]** | [0.2041]** | [0.1929]** | |
| rules | 0.1672 | 0.1492 | 0.1632 | 0.1547 |
| [0.0524]** | [0.0696]* | [0.0570]** | [0.0624]* | |
| first | -1.0402 | -1.0732 | -1.0251 | -1.046 |
| [0.0631]** | [0.0637]** | [0.0640]** | [0.0637]** | |
| consd | 0.3212 | 0.3394 | 0.3243 | 0.3299 |
| [0.0841]** | [0.0849]** | [0.0848]** | [0.0842]** | |
| couple | -0.6101 | -0.5983 | -0.6131 | -0.6057 |
| [0.0903]** | [0.0824]** | [0.0867]** | [0.0842]** | |
| _cons | 3.0114 | 2.5788 | 3.0912 | 3.0205 |
| [0.4343]** | [0.3751]** | [0.4792]** | [0.4467]** | |
| Chi2 Wald (10) | 716.47 | 712.41 | 712.64 | 715.54 |
| Pr>Chi2 Wald (10) | 0.0000 | 0.0000 | 0.0000 | 0.0000 |
| Pearson R2 | 0.8422 | 0.8329 | 0.8390 | 0.8374 |
| Pseudo LL | -535.09301 | -543.5885 | -537.0061 | -542.02082 |
* p<0.05; ** p<0.01; *** p<0.10. Standard errors within brackets. Source: Author’s elaboration.
3.3. Willingness to Pay
Using a semi-log function on estimated models precludes the standard method for calculating WTP. Because of this situation, Christiersson (2003) recommends two steps for WTP estimation. First, the calculation of elasticity for a semi-log model must be calculated by , where βtp is travel cost coefficient and is average visits. Secondly, estimate WTP by . Then WTP must be multiplied by the total of visitors registered for the studied season to obtain the WS wildlife tourism recreational value (WS-REV) for each model. The estimated elasticities are all inelastic across the four models. Table 3 shows the estimated WTP and WS-REV in the four models. The research adds the economic value per whale shark, estimated by dividing the WS-REV by the high and low monthly WS sightings reported by Whitehead et al. (2020), and the average economic value per WS was also estimated.
Table 4.
WTP, WS-REV, and economic value per WS. La Paz Bay (US$).
| Concept | Poisson Model | Average | |||
| TP | TPOME | TPTTC | TPTTCOME | ||
| WTP | 8.00 | 27.00 | 9.00 | 10.00 | 13.50 |
| WS-REV | 304,600 | 1,028,025 | 342,675 | 380,750 | 514,013 |
| Upper value per WS | 4,173 | 14,083 | 4,694 | 5,216 | 7,041 |
| Average value per WS | 3,016 | 10,178 | 3,393 | 3,770 | 5,089 |
| Lower value per WS | 2,361 | 7,969 | 2,656 | 2,952 | 3,985 |
| Source: Author’s elaboration | |||||
4. Discussion
4.1. Environmental Valuation
Economic valuation aims to transform WTP into environmental policy instruments. Among these are levies, charges, and access fees. The purpose of these instruments is to become in-demand control instruments for national parks and protected areas, positively or negatively affecting tourism affluence to these sites, reducing anthropic pressure, alleviating operational costs, and strengthening conservation programs and enforcing surveillance (Greiber, 2009). Marine Protected Areas in Mexico and in almost all emerging economies suffer from a lack of federal economic resources to support basic operations.
Conservation efforts and actions demand economic resources. Fortunately, stakeholders are already organized and generating cooperation. Protected Area Managers are considering implementing a Visitors Management Program (VMP) that includes a voluntary fee for area conservation. This research can serve as a baseline for establishing an initial fee. However, Milder et al. (2010) argue that these strategies tend to fail, mainly due to three factors. First, rural communities must have access to scenic and recreational resources, and negotiations must be made with tour companies and other users to purchase access rights. Two, park entrance fees collected by governments of emerging economies are usually not used to support sustainable management in local areas. Third, rural or small communities will require technical support, advice, and capacity-building to manage tourism and recreation demand and capture an equitable share of the revenue generated by these activities. The most notable limitations of a VMP are the high investment required to implement it and its long-term sustainability (Grima et al., 2016).
Based on estimated WTP, it is possible to propose a voluntary conservation fee (VCF) for WS wildlife tourism in La Paz to strengthen and fund VMP. These kinds of schemes could be applied in a general way. It is essential to note that implementing the VCF scheme can reduce demand for wild shark tourism if the threshold is set too high. Remember that this kind of scheme is a voluntary transaction between operators and visitors, oriented to secure WS habitat and, consequently, the flow of its recreational services -i.e., marine biodiversity (Forest Trends & The Katoomba Group, 2010; Wunder, 2005). Nevertheless, a critical factor, in addition to financial flow, is maintaining the long-term flow of ecosystem services. It is worth noting that the VCF could yield economic benefits for the site and facilitate management, as well as periodic and autonomous actions that need to be performed on the site (such as verification and surveillance), and assess their impact on ecosystem services. Actions that might be difficult to manage without this scheme (Chen, 2020; Koch & Verholt, 2020). Some authors are convinced that VCF can strengthen the socioeconomic benefits derived from wildlife tourism and protect and promote sustainable uses, while also involving local communities (Zeigler & Dearden, 2021). On the other hand, the economic value per WS could serve as a baseline to establish fines for boats and ships that cause injuries to whale sharks, or for illegal operators within the WS area.
Lastly, when OPC and TTC were included in the estimated models, the goodness-of-fit for the TPOME, TPTTC, and TPTTCOME models decreased. This could be interpreted as evidence that additional costs, such as accommodation, fuel, or food, which are relevant to the visitor, are not relevant for estimating the recreational economic value of biodiversity related to recreational activities. Therefore, these costs should not be included in economic valuation, as they do not contribute to improving models.
4.2. Community-Based-Management
Community-based management is not the optimal solution for conserving marine and coastal ecosystems (Berkers, 2007). Esmail (et al. 2023), Cárdenas-Torres (2007), and Rowat and Engelhardt (2007) identify five key limitations of CBM which are: i) lack of comprehensive policies and legal frameworks for the conservation of marine and coastal ecosystems in emerging economies, making it troublesome to recognize community rights, ii) lack of surveillance and remote monitoring limiting the quick response to externalities, iii) unsustainable use of marine resources by illegal operators that damage and deplete marine biodiversity, iv) access disputes for accessing the resource, communities do not have ways to achieve agreements without local authorities help, and v) emerging economies lack legal instruments to include traditions and traditional community knowledge in conservation policies.
Nevertheless, there are specific opportunities for implementing CBM, according to Esmail (2023), they can be listed as: i) recognizes the rights and traditions of communities and promotes their integration into resource management, ii) promotes the use of renewable energy in communities through projects and technologies, iii) is committed to global initiatives by strengthening local conservation capacities linked to national and international goals, iv) promotes capacity building to increase community resilience and conservation actions, v) promotes economic instruments for conservation (such as payments for ecosystem services, offsets, among others) o diversify sources of income.
5. Conclusions
The research found that the presence of WS is essential in wildlife tourism activities in La Paz. Perhaps, without WS, the local economy could shrink because visitors might not come or stay as long. Therefore, WS conservation and protection projects are crucial for tourists to continue visiting the WS area, thereby increasing local tour operators’ income and generating direct and indirect economic benefits. The estimated WTP for WS wildlife tourism activity ranges from 2.68 to 5.42 US$, and the recreational value for this activity oscillates between 110.5 and 223.8 thousand US$. Recreational values can be interpreted as the economic value of a potential loss or damage to the whale shark recreational activity. The z values for variable coefficients in the four models, along with the Chi-squared and pseudo log-likelihood values, provided statistical validation for our analysis. The travel price variable was statistically significant in the models; therefore, the estimated WTP per trip per person is reliable.
Practicing wildlife tourism with WS in La Paz Bay has some competitive advantages over other sites where WS wildlife tourism is practiced (such as Holbox in Quintana Roo or Bahía de Los Ángeles in Baja California). These advantages are: i) WS price per trip is lower than the other sites, ii) tour operators’ variable costs are lower than in Quintana Roo, and iii) connectivity is much better than in Bahía de Los Ángeles. Tour operators are not fully seizing these advantages. In addition, those tour operators in La Paz who dare to improve and invest in capital, quality service, and human capital can expect increasing economic returns, according to the service-price-quality paradigm.
Our recommendation would be to use these estimated values for WTP as a baseline to negotiate with stakeholders and together choose the most adequate scheme, as well as to define priority conservation strategies to implement in the WS area, and fund them with the collected amount, which could be taken as the WS area recreational value. Stakeholders involved in WS wildlife tourism should consider implementing a general fee to support conservation, regulatory enforcement, surveillance, management of nature-based destinations, maritime signaling, an online reservation system, WS monitoring, and data generation. Nevertheless, we must emphasize that a nature-based destination management scheme is a great way to support and strengthen other economic instruments aimed at conserving WS and its habitat in La Paz Bay. The research provides an economic baseline that stakeholders can consider when funding conservation and protection projects in the study area, should an economic instrument be implemented.
Emerging economies have numerous opportunities to leverage global partnerships, innovative technologies, financial tools, and rights-based approaches to enhance CBM attached to financial instruments, like VCF. This will help promote sustainable development and protect biodiversity. On the other hand, limitations show that marine CBM in developing countries has its own set of structural, technological, and socio-political problems. To address these issues, it is crucial to strengthen laws, make it easier for people to use marine technology, regulate fishing by outsiders, and incorporate local knowledge into policy-making.
The presented research is static and limited by the temporal, political, and environmental framework in which it was conducted. The applied methodology cannot incorporate other types of values, such as legacy values or indirect and direct use values. If these values were considered the TEV of WS, it could be even greater. Finally, conservation and protection projects with a lower cost than the recreational value for WS wildlife tourism activity are economically feasible to fund by a VCF.
At the time this research was carried out, official regulations were barely established by local, state, or federal authorities, but some local tour operators had private agreements regarding prices, how to conduct the tour on the site, including the number of boats surrounding a WS, routes of entry and exit to the WS area, and staying time in the area. In the 2018-2019 season, some agreements were incorporated into the management plan and regulations, while others were adapted through consensus. More recently, managers have adopted a capacity-building strategy to help tour operators perform the WS wildlife tourism activity more efficiently. These are joint efforts by three agencies focused on tour guide training. First, Natural Protected Area Managers focuses on training about WS area rules and zoning, second, the State Tourism Office tour-guides training focuses on the NOM-009-TUR, which specifies the information procedures and requirements in order to protect and conserve environmental, natural and cultural assets needed to perform the WS activity by visitors, and, finally the Harbor Master train tour-guides on sailing and navigation rules and laws and sea trade. Besides these efforts, the Citizen Committee for Whale Sharks voluntarily monitors the WS area to minimize injuries, elaborates its own statistics about the number of visitors by season, and reports illegal boats or activities in the area to the environmental authority.
Author Contributions
VHT: Conceptualization, Formal analysis, Funding acquisition, Project administration, Methodology, Writing-review & editing, Writing final draft. MMG: Writing - original draft, Data curation, Investigation. GAP: Software, Validation. MAORP: Resources, Writing - review & editing. UJK: Software, Visualization. EAMM: Supervision. LCAH: Software.
Funding
The local Non-Governmental Organization Sociedad de Historia Natural NIPARAJÁ funded this research with an internal grant number associated with the Research Project INV-EX/335.
Institutional Review Board Statement
Ethical review and approval were waived for this study due to the national regulation (https://www.dof.gob.mx/nota_detalle.php?codigo=5404568&fecha=20/08/2015#gsc.tab=0) and the university regulation (https://www.uabcs.mx/documentos/normatividad/reglamentos/16.pdf).
Informed Consent Statement
Informed consent was obtained from all subjects involved in the study.
Data Availability Statement
Restrictions apply to datasets. The data presented in this article are unavailable due to privacy and ownership by the funder.
Acknowledgments
To the Laboratory in Environmental and Resource Economics team at UABCS, composed of professors, researchers, social service, undergrads, postgrads, and grads students. To Dulce Robles, for her unconditional administrative support; she makes things possible when we need them. We are grateful to Felipe Vázquez-Lavin for his valuable comments on the manuscript’s first draft and for his recommendations and observations, which were instrumental in improving the paper.
Conflicts of Interest
The authors declare that they have no known competing financial interests or personal relationships that could have appeared to influence the work reported in this paper. The authors also declare that they have no conflict of interest. Finally, the authors declared that the funders had no role in the study’s design, data collection, analysis, interpretation, manuscript writing, or decision to publish the results.
Appendix A
Appendix A.1. World Economic Valuation Studies for Wildlife Tourism.
| Author(s)/ Year | Area/Site | Specie | US$* |
| Wilson & Tisdell, 2002 | South-Eastern Queensland, Australia | W ST |
17 189 043 509 666 |
| Enríquez et al., 2003 | Phuket Islands, Thailand | WS | 3 554 722 |
| Topelko & Dearden, 2005 | Belize | WS | 4 204 918 |
| Rowat & Engelhardt, 2007 | Seychelles | WS | 7 687 869 |
| Catlin et al., 2010 | Ningaloo, Australia | WS | 5 409 485 |
| Vianna et al., 2011 | Viti Levu, Fiji Islands | S | 4 626 350 |
| Du Preez et al., 2012 | Aliwal Shoal Marine Protected Area, South Africa |
S | 473 501 |
| Vianna et al., 2012 | Palau, Island | S | 25 672 131 |
| Cisneros-Montemayor et al., 2013 | Belize Mexico |
S S |
469 054 16 127 156 |
| Cagua et al., 2014 | South Ari, Maldive Islands | WS | 5 855 738 |
| Ruiz-Sakamoto, 2015 | Revillagigedo National Park, Mexico |
S | 8 377 049 |
| Schwoerer et al., 2016 | Eastern Pacific Coast Baja California Sur, Mexico | W | 281 185 |
| Huveneers et al., 2017 | Australia | S | 43 237 704 |
| Cisneros-Montemayor et al., 2019 | Mexico | S | 12 400 000 |
| Cisneros-Montemayor et al., 2020 | Baja California Sur, Mexico | SS | 47 000 000 |
| Oropeza-Cortés et al., 2023 | Laguna San Ignacio, Mexico | GW | 908 502 |
|
Source: Author’s elaboration Note: GW: grey whale, S: sharks, SS: several species, ST: sea turtles, W: whales, WS: whale shark *Direct expenditure in 2020 updated US$ | |||
References
- Armitage, D. 2005. Adaptive capacity and community-based natural resource management. Environmental Management 35:703–715, DOI: 10.1007/s00267-004-0076-z.
- Beal, D.J. 1995. Sources of variation in estimates of cost reported by respondents in travel cost surveys. Aust. J. Leis. Recreat., 5(1), pp. 3–8.
- Beckley, L.E., G. Cliff, M.J. Smale. & L.J.V. Compagno. 1997. Recent strandings and sightings of whale sharks in South Africa, Environmental Biology of Fishes 50 pp. 343–348.
- Bennett, NJ, Katz L, Yadao-Evans W, Ahmadia GN, Atkinson S, Ban NC, Dawson NM, de Vos A, Fitzpatrick J, Gill D, Imirizaldu M, Lewis N, Mangubhai S, Meth L, Muhl E-K, Obura D, Spalding AK, Villagomez A, Wagner D, White A and Wilhelm A. 2021. Advancing Social Equity in and Through Marine Conservation. Front. Mar. Sci. 8:711538. doi: 10.3389/fmars.2021.711538.
- Berkes, F. 2007. Community-based conservation in a globalized world. Proceedings of the National Academy of Sciences, 104(39), 15188-15193. [CrossRef]
- Brooks, J., Waylen, K.A. & Mulder, M.B. 2013. Assessing community-based conservation projects: A systematic review and multilevel analysis of attitudinal, behavioral, ecological, and economic outcomes. Environ Evid 2, 2. [CrossRef]
- Cagua, E.F., N. Collins, J. Hancock & R. Rees. 2014. Whale shark economics: a valuation of wildlife tourism in South Ari Atoll, Maldives. PeerJ, 2:e515, DOI 10.7717/peerj.515.
- Cameron C.A. & F.A. Windmeijer. 1997. An R-squared measure of goodness of fit for some common nonlinear regression models. Journal of Econometrics, 77(2), 329-342. [CrossRef]
- Cameron, AC & PK. Trivedi. 2007. Regression analysis of count data. 6th Ed., Econometric Society Monographs, Num. 30, Cambridge University Press, USA., p. 411.
- Cameron, C.A. & F.A. Windmeijer. 1996. R-Squared Measures for Count Data Regression Models with Applications to Health-Care Utilization. Journal of Business & Economic Statistics , Apr., 1996, Vol. 14, No. 2 (Apr., 1996), pp. 209-220. https://www.jstor.org/stable/1392433.
- Cárdenas-Torres, N., Enríquez-Andrade, R., & Rodríguez-Dowdell, N. 2007. Community-based management through ecotourism in Bahia de los Angeles, Mexico. Fisheries Research, 84(1), 114-118. [CrossRef]
- Cárdenas-Torres, N., R. Enríquez-Andrade & N. Rodríguez-Dowdell. 2005. Community-based management through ecotourism in Bahia de los Angeles, Mexico. The First International Whale Shark Conference: Promoting International Collaboration in Whale Shark Conservation, Science and Management, 9-12 May, Perth, Western Australia, p. 67.
- Carrillat, F. A., M. Mazodier & C. Eckert. 2024. Why advertisers should embrace event typicality and maximize leveraging of major events. Journal of the Academy of Marketing Science, 52:1585–1607, . [CrossRef]
- Catlin J., R. Jones, T. Jones, B. Norman & D. Wood. 2010. Discovering wildlife tourism: a whale shark tourism case study, Current Issues in Tourism, 13:4, 351-361, DOI: 10.1080/13683500903019418.
- Chen, H.L., R.L. Lewinson, L. An, Y.H. Tsai, D. Stow, L. Shi & S. Yang. 2020. Assessing the effects of payments for ecosystem services programs on forest structure and species biodiversity. Biodiversity and Conservation, (29), pp. 2123–2140, DOI: . [CrossRef]
- Child, B. 1996. The practice and principles of community-based wildlife management in Zimbabwe: the CAMPFIRE programme. Biodivers Conserv 5, 369–398. [CrossRef]
- Christiersson, A. 2003. An Economic Valuation of the Coral Reefs at Phi Phi Island. A Travel Cost Approach. Tesis de maestría en Economía, Lulea University of Technology, p.55.
- Cisneros-Montemayor, A.M.A. Townsel, C.M. Gonzales, A.R. Haas, E.E. Navarro-Holm, T. Salorio-Zuñiga & A.F. Johnson. 2020. Nature-based marine tourism in the Gulf of California and Baja California Peninsula: Economic benefits and key species. Nat Resour Forum. 44:111–128.
- Cisneros-Montemayor, A.M., E.E. Becerril-García, O. Berdeja-Zavala & A. Ayala-Bocos. 2019. Shark ecotourism in Mexico: Scientific research, conservation, and contribution to a Blue Economy. Advances in Marine Biology, 85:1, pp. 71-92. [CrossRef]
- Cisneros-Montemayor, A.M., M. Barnes-Mauthe, D. Al-Abdulrazzak, E. Navarro-Holm & R. Sumaila. 2013. Global economic value of shark ecotourism: implications for conservation. Fauna & Flora International, Oryx, 47(3), pp. 381–388 doi:10.1017/S0030605312001718.
- Clark E. & D.R. Nelson. 1997. Young whale sharks, Rhincodon typus, feeding on a copepod bloom near La Paz, Mexico. Environmental Biology of Fishes 50: 63–73.
- Clawson, M. & L. Knetsch. 1996. Economics of Outdoor Recreation. Resource for the Future [RFF], (Ed.), 328 p.
- Cox, M., G. Arnold & S. Villamayor-Tomás. 2010. A review of design principles for community-based natural resource management. Ecology and Society 15(4): 38. [online] URL: http://www.ecologyandsociety.org/vol15/iss4/art38/.
- Czajkowski, M., M. Giergiczny, J. Kronenberg & J. Englin. 2019. The Individual Travel Cost Method with Consumer-Specific Values of Travel Time Savings. Environmental and Resource Economics (2019) 74:961–984.
- De Silva-Dávila, R., & J.R. Palomares-García. 1998. Unusual larval growth production of Nyctiphanes simplex in Bahía de la Paz, Baja California Sur, Mexico, Journal of Crustacean Biology, 18, 490–498. [CrossRef]
- Dressler, W., Büscher, B., Schoon, M., Brockington, D., Hayes, T., Kull, C.A., J. McCarthy & Shrestha, K. 2010. From hope to crisis and back again? A critical history of the global CBNRM narrative. Environmental Conservation, 37(1), 5–15. doi:10.1017/S0376892910000044.
- Du Preez, M., M. Dicken & S.G. Hosking. 2012. The value of tiger shark diving within the Aliwal Shoal marine protected area: A travel cost analysis. South African Journal of Economics Vol. 80:3 September, pp. 387-399.
- Eckert, S.A. & B.S. Stewart. 2001. Telemetry and satellite tracking of whale sharks, Rhincodon typus, in the Sea of Cortez, Mexico, and the North Pacific Ocean. Environ. Biol. Fish. 60, pp. 299–308.
- Emerton, L. 2001. The nature of benefits and the benefits of nature: why wildlife conservation has not economically benefited communities in Africa. In African wildlife and livelihood: the promise and performance of community conservation. D. Hulme and M. Murphee (eds). London: James Curry, pp. 208-226.
- Esmail, N., McPherson, J. M., Abulu, L., Amend, T., Amit, R., Bhatia, S., Bikaba, D., Brichieri-Colombi, T. A., Brown, J., Buschman, V., Fabinyi, M., Farhadinia, M., Ghayoumi, R., Hay-Edie, T., Horigue, V., Jungblut, V., Jupiter, S., Keane, A., Macdonald, D.W., . . . Wintle, B. 2023. What’s on the horizon for community-based conservation? Emerging threats and opportunities. Trends in Ecology & Evolution, 38(7), 666-680. [CrossRef]
- Forest Trends & The Katoomba Group. 2010. Payments for Ecosystem Services: Getting Started in Marine and Coastal Ecosystems: A Primer. Forest Trends, The Katoomba Group and UNEP (Eds.), p. 80.
- Graham, R.T. & Roberts, C.M. 2007. Assessing the size, growth rate, and structure of a seasonal population of whale sharks (Rhincodon typus Smith 1828) using conventional tagging and photo identification, Fisheries Research 84 pp.71–80.
- Greiber, T. 2009. Payment for Ecosystem Services. Legal and Institutional Framworks. IUCN, Gland, Switzerland, xvi+296 p.
- Grima, N., S.J. Singh, B. Smetschka & L. Ringhofer. 2016. Payment for Ecosystem Services (PES) in Latin America: Analysing the performance of 40 case studies. Ecosystem Services, 17, pp. 24-32. [CrossRef]
- Gruber, J.S. 2010. Key Principles of Community-Based Natural Resource Management: A Synthesis and Interpretation of Identified Effective Approaches for Managing the Commons. Environmental Management 45, 52–66. [CrossRef]
- Gupta, T., Chen, S. & Mohanty, S. 2025. More the merrier: Effects of plural brand names on perceived entitativity and brand attitude. Journal of Consumer Psychology, 35(1), 150-157. [CrossRef]
- Haab, T. & K. McConnell. 2002. Valuing Environmental and Natural Resources: The Econometrics of Non-Market Valuation. Edward Elgar Publishing (Ed.), p. 326.
- Hacohen-Domené A., F. Galván-Magaña & J. Ketchum-Mejia. 2006. Abundance of whale shark (Rhincodon typus) preferred prey species in the southern Gulf of California, Mexico. Cybium 2006, 30(4) suppl.: 99-102.
- Hanley, N., Shogren, J.F. & White, B., 2001. Introduction to Environmental Economics. Oxford University Press, New York, p. 368.
- Hellerstein, D. 1995. Welfare estimation using aggregate and individual observation models: a comparison using Monte Carlo techniques. American Journal of Agricultural Economics, 77(3), pp. 620-630.
- Hernández-Trejo, V., J. Urciaga-García, M.A. Hernández-Vicent & L.O. Palos-Arocha. 2009. Valoración económica del Parque Nacional Bahía de Loreto a través de los servicios de recreación de pesca deportiva. Región y Sociedad, Vol. XXI, Núm. 44, enero-abril, pp. 195-223. http://redalyc.uaemex.mx/src/inicio/ArtPdfRed.jsp?iCve=10204408.
- Heyman, W.D., Graham, R.T., Kjerfve, B. & Johannes, R.E. 2001. Whale sharks, Rhincodon typus, aggregate to feed on fish spawn in Belize. Marine Ecology Progress Series 215 pp. 275–282.
- Higginbottom, K. 2004. Wildlife Tourism: Impacts, Management and Planning. Cooperative Research Centre for Sustainable Tourism Pty Ltd., Australia, p. 302.
- Hilbe, J.M. 2011. The Negative Binomial Regression. Cambridge University Press, London, UK, p. 553.
- Hueth, D. & E. Strong. 1984. A critical review of the travel cost, hedonic travel cost and household production models for measurement of quality changes in recreational experiences, Journal of Agricultural and Resource Economics, 13(2), pp. 89-107.
- Huveneers, C., M.G. Meekan, K. Apps, L.C. Ferreira, D. Pannell & G.M.S. Vianna. 2017. The economic value of shark-diving tourism in Australia. Rev Fish Biol Fisheries 27, 665–680 (2017). [CrossRef]
- Johnson, A.F., C. Gonzales, A. Townsel & A.M. Cisneros-Montemayor. 2019. Marine ecotourism in the Gulf of California and the Baja California Peninsula: Research trends and information gaps. Scientia Marina 83(2), June, pp. 177-185, Barcelona (Spain), . [CrossRef]
- Ketchum J.T. 2003. Distribución espacio-temporal y ecología alimentaria del tiburón ballena (Rhincodon typus) en la Bahía de La Paz y zonas adyacentes en el suroeste del Golfo de California. Master Thesis, p. 91, CICIMAR-IPN, La Paz.
- Ketchum, J.T., F. Galván-Magaña, & P. Klimley. 2013. Segregation and foraging ecology of whale sharks, Rhincodon typus, in the southwestern Gulf of California, Environmental Fish Biology, 96, pp. 779–755. [CrossRef]
- Koch, D-J. & M. Verholt. 2020. Limits to learning: the struggle to adapt to unintended effects of international payment for environmental services programmes. Int Environ Agreements, (20), pp. 507-539, DOI: . [CrossRef]
- Leh, F.C., Mokhtar, F.Z., Rameli, N., & Ismail, K. (2018). Measuring Recreational Value Using Travel Cost Method (TCM): A Number of Issues and Limitations. International Journal of Academic Research in Business and Social Sciences, 8(10), pp. 1381–1396.
- Milder, J.C., S.J. Scherr & C. Bracer. 2010. Trends and Future Potential of Payment for Milder, J. C., S. J. Scherr, and C. Bracer. 2010. Trends and future potential of payment for ecosystem services to alleviate rural poverty in developing countries. Ecology and Society 15(2): 4. [online] URL: http://www.ecologyandsociety.org/vol15/iss2/art4/.
- Nelson, J.D., 2004. Distribution and foraging ecology by whale sharks (Rhincodon typus) within Bahia de Los Angeles, Baja California Norte, Mexico. MSc Thesis, University of San Diego, p. 118.
- Norman, B.M. & Stevens, J.D. 2007. Size and maturity status of the whale shark (Rhincodon typus) at Ningaloo Reef in Western Australia, Fisheries Research 84 pp. 81–86.
- Oropeza-Cortés, M.G., V. Hernández-Trejo & E. Romero-Vadillo. 2023. Economic valuation of recreational gray whale watching at San Ignacio Lagoon, Mexico. El Periplo Sustentable, 45, Jul-Dec, pp. 183-200. DOI . [CrossRef]
- Pearce, D.W. & R.K. Turner. 1990. Economics of natural resources and the environment. JHU Press.
- Pendleton, L.H. & J. Rooke. 2007. Using the Literature to Value Coastal Uses – Recreational Saltwater Angling in California. COVC (Coastal Ocean Values Center) Working Paper, pp. 1-36.
- Petatán-Ramírez, D., D.A. Whitehead, T. Guerrero-Izquierdo, M.A. Ojeda-Ruiz & E.E. Becerril-García. 2020. Habitat suitability of Rhincodon typus in three localities of the Gulf of California: Environmental drivers of seasonal aggregations. Journal of Fish Biology, 97(4), pp. 1177-1186.
- Ramírez-Macías, D. & G. Saad. 2016. Key elements for managing whale shark tourism in the Gulf of California. The 4th International Whale Shark Conference, 16-18 May, Doha, Qatar., p. 2.
- Ramírez-Macias, D. 2005. Characterization of Molecular Markers for populational studies of the whale shark (Rhincodon typus, Smith 1828) of the Gulf of California. The First International Whale Shark Conference: Promoting International Collaboration in Whale Shark Conservation, Science and Management, 9-12 May, Pert Western Australia, pp. 86.
- Randall, A. 1994. A diffilculty with the travel cost method. Land Economics 70(1), pp. 88-96.
- Reyes-Salinas, A., R. Cervantes-Durante, A. Morales-Pérez & J.E. Valdez-Holguín. 2003. Seasonal variability of primary productivity and its relation to the vertical stratification in La Paz bay, B.C.S. Hidrobiológica, 13, pp. 103–110.
- Rodger K., A. Smith, C. Davis, D. Newsome & P. Patterson. 2010. A framework to guide the sustainability of wildlife tourism operations: examples of marine wildlife tourism in Western Australia, Sustainable Tourism Pty Ltd (Ed.), p. 69.
- Rodríguez-Dowdell, N., R. Enríquez-Andrade & N. Cárdenas-Torres. 2007. Property rights-based management: Whale shark ecotourism in Bahia de los Angeles, Mexico. Fish. Res. 84, pp. 119-127.
- Rolfe, J. & P. Prayaga. 2007. Estimating values for recreational fishing at freshwater dams in Queensland. Aust. J. Agric. Resour. Econ. 51(2), pp. 157-174. http://dx.doi.org/10.1011/j.1467-8489.2007.00369.x.
- Rowat, D. & Gore, M. 2007. Regional-scale horizontal and local-scale vertical movements of whale sharks in the Indian Ocean off Seychelles, Fisheries Research 84, pp. 32–40.
- Rowat, D., & Engelhardt, U. 2007. Seychelles: A case study of community involvement in the development of whale shark ecotourism and its socio-economic impact. Fisheries Research, 84(1), 109-113. [CrossRef]
- Ruiz-Sakamoto, A.T. 2015. Estimación del valor económico total y catálogo de foto identificación de la manta gigante (Manta birostris Walbaum, 1792) en el Archipiélago de Revillagigedo. Tesis de Licenciatura. UABCS., p. 46.
- Schwoerer, T., D. Knowler & S. Garcia-Martinez. 2016. The value of whale watching to local communities in Baja, Mexico: A case study using applied economic rent theory. Ecol Econ, 127, pp. 90-101.
- Secretaria de Medio Ambiente y Recursos Naturales, SEMARNAT. 2018. Plan de Manejo de Rhincodon typus (tiburón ballena) para realizar la actividad de aprovechamiento no extractivo a través de la observación y nado en la Bahía de La Paz, B.C.S. Temporada 2018. México, p. 41.
- Shaw, D. 1998. On-site samples: Regression problems of non-negative integers, truncation and endogenous stratification. Journal of Econometrics, 37(2), 211-223 pp.
- Smith, K. & Y. Kaoru. 1990. Signals or Noise? Explaining the Variation in Recreation Benefit Estimates. American Journal of Agricultural Economics. 72(2), 419-433 pp.
- Stevens, J.D. 2007. Whale shark (Rhincodon typus) biology and ecology: A review of the primary literature. Fis. Res. 84, pp. 4-9.
- Sustainable Travel Tech: Innovations in Eco-Friendly Tourism. 2024. https://visitworld.live/sustainable-travel-tech-innovations-in-eco-friendly-tourism/. Accessed 11-Nov.
- Taylor, J.G. 2007. Ram filter-feeding and nocturnal feeding of whale sharks (Rhincodon typus) at Ningaloo Reef, Western Australia, Fisheries Research 84 pp. 65–70.
- Taylor, J.G., 1996. Seasonal occurrence, distribution and movements of the whale shark, Rhincodon typus, at Ningaloo Reef, Western Australia. Mar. Freshw. Res. 47, pp. 637–642.
- The Economics of Ecosystem Services and Biodiversity. TEEB. 2012. Why Value the Oceans? A Discussion Paper. The Economics of Ecosystems & Biodiversity.
- Tisdell, C.A. 2002. The Economics of Conserving Wildlife and Natural Areas, Edward Elgar, Cheltenham, UK.
- Topelko, K.N. & P. Dearden. 2005. The Shark Watching Industry and its Potential Contribution to Shark Conservation, Journal of Ecotourism, 4:2, 108-128, DOI: 10.1080/14724040409480343.
- Turner, R.K., D.W. Pearce & I. Bateman. 1993. Environmental Economics. An Elementary Introduction. JHU Press (Ed.), p. 328.
- Valentine, A.V.P. & Curnock, M. 2001. Wildlife Tourism Research Report No. 11, Status Assessment of Wildlife Tourism in Australia Series, Tourism Based on Free-Ranging Marine Wildlife: opportunities and responsibilities. CRC for Sustainable Tourism, Gold Coast, Queensland.
- Vásquez-Lavín, F., A. Cerda-Urrutia & S. Orrego-Suaza. 2007. Valoración Económica del Ambiente. Thomson Learning (Ed.), p. 368.
- Vianna, G.M.S., J.J. Meeuwig, D. Pannell, H. Sykes & M.G. Meekan. 2011. The socio-economic value of the shark-diving industry in Fiji. Australian Institute of Marine Science. University of Western Australia. Perth, p. 26.
- Vianna, G.M.S., M.G. Meekan, D.J. Pannell, S.P. Marsh & J.J. Meeuwig. 2012. Socio-economic value and community benefits from shark-diving tourism in Palau: A sustainable use of reef shark populations. Biological Conservation, 145, pp. 267-277.
- Vivekanandan E. & M.S. Zala. 1994. Whale shark fishery off Veraval. Indian Journal of Fisheries. 41, pp. 37-40.
- Wells, M.P. 1998. Socio-economic and political aspects of biodiversity conservation in Nepal. International Journal of Social Economics, 25(2/3/4): 226-243.
- Whitehead D.A., U. Jakes-Cota, F. Pancaldi, F. Galván-Magaña & R. González-Armas. 2020. The influence of zooplankton communities on the feeding behavior of whale sharks, Gulf of California. Revista Mexicana de Biodiversidad 91: e913054, . [CrossRef]
- Whitehead, D.A., D. Petatán-Ramírez, D. Olivier, R. González-Armas, F. Pancaldi & F. Galvan-Magaña. 2019. Seasonal trends in whale shark Rhincodon typus sightings in an established tourism site in the Gulf of California, Mexico. J. Fish Biol., 95:982–984, DOI: 10.1111/jfb.14106.
- Wilson, C. & C. Tisdell. 2002. Conservation and Economic Benefits of Wildlife-based Marine Tourism: Sea Turtles and Whales as Case Studies. Working Paper #64, Working Papers on Economics, Ecology and The Environment, School of Economics, The University of Queensland, pp. 19.
- Wolfson F.H. 1987. The whale shark Rhincodon typus, Smith 1828, off Baja California, México (Chondrichthyes: Rhincodontidae). Mem. Vth Symp. Biol. Mar., UABCS, 5: pp. 103-108.
- Womersley, F. C., Humphries, N. E., Queiroz, N., Vedor, M., da Costa, I., Furtado, M., Tyminski, J. P., Abrantes, K., Araujo, G., Bach, S. S., Barnett, A., Berumen, M. L., Lion, S. B., Braun, C. D., Clingham, E., Cochran, J. E. M., de la Parra, R., Diamant, S., Dove, A. D. M., ... Sims, D. W. 2022. Global collision-risk hotspots of marine traffic and the world’s largest fish, the whale shark. Proceedings of the National Academy of Sciences of the United States of America, 119(20), Article e2117440119. [CrossRef]
- Wooldrige, J.M. 2002. Econometric Analysis Cross Section and Panel Data. Massachusetts Institute of Technology. MIT Press. 777 p.
- Wunder, S. 2005. Payment for environmental services: Some nuts and volts. CIFOR Ocassional Paper No 42. Center for International Forestry Research, Jakarta, Indonesia.
- Zhang, F., Wang, X., Nunes, P.A.L.D. & Ma, C. 2015. The recreational value of gold coast beaches, Australia: An application of the travel cost method. Ecosystem Services, 11, pp. 106-114. [CrossRef]
- Ziegler, A., P. Dearden & R. Collins. 2015. Participant crowding and physical contact rates of whale shark tours on Isla Holbox, Mexico, Journal of Sustainable Tourism, DOI: 10.1080/09669582.2015.1071379.
- Ziegler, J. & P. Dearden. 2021. Whale Shark Tourism as an Incentive-based Conservation Approach. Whale Sharks: Biology, Ecology, & Conservation. Edited by Alistair D. M. Dove and Simon J. Pierce, 2nd Ed. Taylor & Francis. Chapter 10, (Azikiwe & Bello, 2020b) Azikiwe, H., & Bello, A. (2020b). Book title. Publisher Name. [CrossRef]
Figure 1.
Figure 1. Non-consumptive whale shark area. La Paz Bay, Mexico. Source: Adapted from SEMARNAT (2018).
Figure 1.
Figure 1. Non-consumptive whale shark area. La Paz Bay, Mexico. Source: Adapted from SEMARNAT (2018).
Disclaimer/Publisher’s Note: The statements, opinions and data contained in all publications are solely those of the individual author(s) and contributor(s) and not of MDPI and/or the editor(s). MDPI and/or the editor(s) disclaim responsibility for any injury to people or property resulting from any ideas, methods, instructions or products referred to in the content. |
© 2025 by the authors. Licensee MDPI, Basel, Switzerland. This article is an open access article distributed under the terms and conditions of the Creative Commons Attribution (CC BY) license (http://creativecommons.org/licenses/by/4.0/).
Copyright: This open access article is published under a Creative Commons CC BY 4.0 license, which permit the free download, distribution, and reuse, provided that the author and preprint are cited in any reuse.


