Submitted:
16 October 2025
Posted:
17 October 2025
You are already at the latest version
Abstract
Using 28 multinational staffing projects from 2018–2022, we constructed project communication networks and employed network statistics (density, betweenness centrality, modularity) alongside ERGM/QAP regression to analyze the relationship between structural characteristics and compliance risks. We conducted IV-2SLS causal identification using destination policy windows and visa quota fluctuations as instrumental variables, and modeled the mediating effect of "collaboration → process adherence → risk reduction" via PLS-SEM. Results: After introducing structured risk workshops and visual dashboards, HR compliance incidents decreased by 41%. Each +0.1 increase in network density corresponded to a 6.2% reduction in violation rates. Collaboration's total effect on risk included a 38% mediation proportion via process adherence.
Keywords:
cross-departmental collaboration
; ERGM
; QAP regression
; IV-2SLS
; PLS-SEM
1. Introduction
Cross-border projects operate within multilayered governance environments characterized by heterogeneous institutional, regulatory, and cultural contexts. The fragmented nature of international legal frameworks leads to inconsistencies in reporting standards, approval procedures, and data protection rules, which collectively amplify compliance risks and administrative burdens. Under such complexity, single-department oversight mechanisms are often inadequate to identify and mitigate emergent risks in real time. Cross-departmental collaboration thus becomes a structural necessity, enabling dynamic coordination through the integration of policy interpretation, operational control, and information exchange mechanisms. By establishing interdepartmental communication channels and shared digital governance platforms, organizations can reduce redundancy in compliance verification, enhance transparency in decision chains, and accelerate corrective responses to regulatory deviations.
Recent empirical research reinforces the strategic significance of collaboration in compliance governance. Peng et al. (2025) demonstrate that interdepartmental cooperation strengthens procedural accountability and clarifies supervisory responsibilities, thereby reducing regulatory ambiguity [1]. Du (2025) emphasizes that effective collaboration requires not only technical interoperability but also institutional trust and shared governance values [2]. Chen (2024) further evidences that digital transformation promotes information symmetry and lowers systemic risk by embedding compliance logic into automated workflows [4]. Hu (2025) confirms that data-driven intelligence optimizes compliance monitoring and increases process accuracy [3]. These findings collectively suggest that the fusion of collaboration and technology forms the backbone of modern compliance governance.
Theoretical discourse extends this view through ethical and causal frameworks. Hasan and Abdullah (2022) warn that ethical inconsistency and policy misalignment can compromise data authenticity and distort decision outcomes [5]. Ogburn et al. (2024) verify that network interconnectivity influences the reliability of compliance information flows and risk propagation patterns [6]. Similarly, Zheleva and Arbour (2021) and Yao et al. (2021) propose causal mediation models that quantify indirect effects within governance systems [7,8]. Leung (2022) and Orlova (2023) both emphasize that strict procedural adherence not only stabilizes organizational operations but also reinforces productivity and resilience against regulatory uncertainty [9,10]. Building on these insights, this study employs causal inference and PLS-SEM to empirically evaluate the mediating effect of process adherence between cross-departmental collaboration and compliance risk, aiming to uncover the internal mechanisms driving collaborative compliance governance in cross-border contextst.
2. Research Design
2.1. Research Framework and Methodological Selection
Compliance risks in cross-border projects stem from departmental information asymmetry and policy uncertainty. To address this, network analysis identifies collaboration structures, integrated with causal inference for robust estimation. A collaboration network is built with departments as nodes and communication strength as weighted edges. Core metrics include density, betweenness centrality, and modularity. ERGM and QAP regression test correlations between network features and compliance incidents [1]. For causal inference, an instrumental variable approach uses fluctuations in visa quotas and policy windows as exogenous shocks to isolate the net effect of collaboration on compliance risk.
The first-stage regression model is:
where ` ` denotes the collaboration structure index for project ` ` in period ` `; ` ` represents the exogenous policy variable; ` ` is the instrumental variable coefficient estimate; and ` ` is the random disturbance term.
The second-stage regression model is:
where denotes the compliance risk indicator for project during period ; represents control variables; is the causal effect coefficient of collaborative structure on risk; and is the error term.
Finally, partial least squares structural equation modeling was employed to validate the chained mediating path "collaboration → process adherence → risk reduction" and assess the proportion of mediating effects [2].
2.2. Data Sources and Variable Measurement
The dataset comprises 28 multinational assignment projects conducted between 2018 and 2022, covering communication records among departments such as human resources, legal affairs, finance, and external immigration consultants. Data sources include project management platform logs, compliance incident databases, and publicly available visa quota and policy adjustment records from destination countries. All textual data were standardized to ensure consistency, forming a “project × time” panel structure [3]. The collaboration network was modeled with departments as nodes and communication frequency as weighted edges, allowing the calculation of density, betweenness centrality, and modularity. The formula for network density is:
where denotes network density; represents the number of edges; and indicates the number of nodes. Betweenness centrality is defined as:
where denotes the shortest path between nodes and; represents the number of paths passing through node . Modularity is used to identify community structures, calculated as:
where represents the adjacency matrix element for node , denotes the node degree, is the total number of edges in the network, and is 1 if the node belongs to the same community, otherwise 0.
2.3. Model Construction
Model construction relies on the overall framework of network causal inference, integrating ERGM/QAP, IV-2SLS, and PLS-SEM to achieve a complete chain from structural effect identification to causal effect estimation and mediation path verification (see Figure 1).First, the Exponential Random Graph Model characterizes the formation mechanism of cross-departmental collaboration networks, with its probability distribution expressed as:
where ` ` denotes the random network adjacency matrix; ` ` represents the network statistics vector (including triangular closure, department homophily, etc.); ` ` is the parameter vector; and ` ` is the normalization constant. This specification enables testing the potential explanatory power of collaboration patterns on non-compliance risk while controlling for local dependency structures [4].
Second, the Quadratic Assignment Program Regression (QAP) establishes the exchangeable distribution of the collaborative network statistic and risk matrix through row-column synchronous exchange. Its estimation formula is:
where denotes the th permutation; represents the explanatory variable matrix; and denotes the risk vector. This method ensures that significance tests remain unaffected by autocorrelation.
Furthermore, to identify the net effect of collaboration on compliance risk, instrumental variables two-stage least squares (IV-2SLS) are employed. The first stage uses visa quota fluctuations and policy windows as exogenous shocks to explain the collaboration index . The second stage substitutes the predicted value for the original indicator in the compliance risk equation, thereby eliminating endogeneity bias [5].
Finally, the mediating effect is tested using partial least squares structural equation modeling (PLS-SEM), with the structural path defined as:
where represents the process adherence latent variable. The proportion of indirect effects is calculated via , reflecting both the direct impact of collaboration on risk and the indirect mechanism mediated through process standardization.
3. Empirical Analysis
3.1. Descriptive Statistics and Network Measurement
As shown in Table 1, the descriptive statistics reveal distinct structural and risk characteristics within cross-border project collaboration networks. The overall mean network density of 0.42 indicates a relatively strong degree of interdepartmental interaction, suggesting that information sharing and procedural coordination are generally effective across most projects. However, the relatively large standard deviation (0.15) implies heterogeneity in collaboration intensity, reflecting that some project teams maintain limited connectivity and depend heavily on unilateral departmental operations. The intermediate centrality value (0.13 ± 0.09) shows that influence within the network is unevenly distributed; specifically, the legal and human resources departments occupy core positions with higher connectivity to multiple nodes, reinforcing their functional dominance in compliance communication and personnel governance.
The modularity coefficient of 0.36 suggests a moderate level of structural clustering, indicating partial interdepartmental integration but the persistence of semi-isolated subgroups. This segmentation can restrict the efficiency of cross-functional governance, particularly when policy interpretation or data exchange requires real-time cooperation. The observed compliance risk rate (5.8% ± 2.7%) demonstrates that while most projects operate within a controllable risk range, spikes occur during periods of regulatory adjustment—such as fluctuations in visa quotas or transnational policy transitions—when fragmented collaboration delays corrective responses.
These metrics collectively portray a network system where collaboration exists but is unevenly distributed across departments. Such variability in density, centrality, and modularity forms a quantitative foundation for subsequent Exponential Random Graph Model (ERGM), Quadratic Assignment Procedure (QAP), and Instrumental-Variable Two-Stage Least Squares (IV-2SLS) analyses, which aim to identify causal relationships between network topology, coordination efficiency, and compliance risk evolution.
3.2. Analysis of Network Structure and Risk Relationship
The relationship between network structure and compliance risk demonstrates how organizational connectivity patterns shape risk transmission and control efficiency. As illustrated in Figure 2, the ERGM estimation reveals a statistically significant negative association between network density and compliance risk (p < 0.01), implying that higher interdepartmental connectivity facilitates rapid information circulation, shared accountability, and collective response to compliance challenges. When departments interact frequently through both formal reporting and informal communication, discrepancies in interpretation of policies are minimized, thereby reducing procedural deviations and regulatory breaches [7].
Betweenness centrality exerts a dual and context-dependent influence. Departments with high centrality—particularly legal, audit, and HR—function as essential hubs for compliance coordination, integrating diverse regulatory inputs and harmonizing documentation. Nevertheless, excessive concentration of control within these nodes can create informational bottlenecks, limiting responsiveness and increasing systemic vulnerability if these units experience overload or communication breakdowns. Therefore, optimal network balance requires decentralized yet coherent connectivity, where authority and information flow remain symmetrically distributed.
The modularity index further elucidates the fragmentation effect: higher modularity values correspond to compartmentalized collaboration clusters that inhibit policy synchronization and prolong corrective cycles, thereby heightening compliance incident probabilities. The QAP regression analysis substantiates these relationships, with all coefficients significant at the 5% level or lower [8]. Overall, the integration of ERGM and QAP findings confirms that dense, well-connected networks reduce compliance risk, while excessive modular segmentation elevates it, emphasizing the necessity of maintaining both structural cohesion and adaptive communication pathways in cross-departmental governance systems.
3.3. Causal Identification
This section employs instrumental variables two-stage least squares (IV-2SLS) to achieve causal identification of collaboration on compliance risk, forming a methodological closed loop with the preceding ERGM/QAP results. The first stage uses fluctuations in destination visa quotas and policy windows as exogenous instruments to predict the collaboration structure index during the project period [9]. The second stage incorporates the predicted collaboration into the risk equation, uniformly including project and time fixed effects while controlling for observable covariates to avoid common shocks and omission bias.
Where denotes the collaboration structure index, represents the instrumental variable vector (visa quotas and policy windows), signifies control variables, denote project and time effects respectively, is the first-stage predicted value, and is the causal effect coefficient.
To validate identification, we examine instrument strength (first-stage F and Kleibergen–Paap rk F), test exclusivity via the Hansen J statistic, and assess endogeneity using the Durbin–Wu–Hausman test. We further evaluate the separability of institutional shocks and demand-side disturbances through event-study analysis of policy windows [10]. To ensure valid LATE interpretation, instrument monotonicity and exogeneity are verified, with dynamic bias controlled by lagged instruments and partial linear trends. Cross-project heterogeneity is analyzed through group comparisons and interaction terms to capture variations in marginal effects.
3.4. Testing for Mediating Effects
Regarding the measurement model, the process adherence dimension is characterized by reflective indicators such as timely closure of process nodes, first-pass material yield rate, and timeliness of anomaly feedback. These indicators collectively reflect the extent to which procedural discipline and inter-departmental accountability are achieved in project execution. Higher scores indicate more standardized operations and stronger procedural compliance. For the structural model, an advancement path from "collaboration → process adherence" and a suppression path from "process adherence → risk" are established, while retaining the direct channel from "collaboration → risk" to identify whether intermediation is complete or partial (see Figure 3). This model structure allows for simultaneous testing of both the direct contribution of cross-departmental collaboration to compliance risk reduction and the indirect effect transmitted through process adherence. To quantify the mediation proportion, the decomposition relationship of standardized path coefficients—(collaboration → process adherence),(process adherence → risk, expected to be negative),and (collaboration → risk, direct effect)—is employed. The mediation proportion is calculated as , where represent the standardized coefficients for the three paths, respectively.
Estimation results, as illustrated in Figure 4, provide quantitative evidence that enhanced cross-departmental collaboration plays a decisive role in mitigating compliance risk through both direct and indirect mechanisms. The standardized path coefficient from collaboration to process adherence (0.356, p < 0.01) indicates a strong positive linkage, reflecting that higher levels of interdepartmental cooperation foster clearer communication, mutual supervision, and shared accountability in procedural execution. The negative coefficient from process adherence to compliance risk (−0.287, p < 0.05) further demonstrates that consistent adherence to procedural norms significantly suppresses the occurrence of regulatory violations. The mediating proportion of 38% confirms that process discipline is not a passive consequence but an active conduit through which collaborative structures translate into tangible compliance gains.
Empirical observation reinforces this analytical finding. When organizations introduced structured workshops, cross-departmental standard operation procedures (SOPs), and visual kanban systems, the frequency of compliance incidents declined by 41%, while process stability improved by 17%. This improvement arises from enhanced procedural visibility and early error detection mechanisms that prevent deviation propagation. Furthermore, the marginal effect analysis reveals that every 0.1 increment in network density corresponds to a 6.2% reduction in violation rates, underscoring the compounding effect of communication intensity on risk prevention. Denser networks enable rapid feedback cycles and collective decision-making, thereby minimizing the latency between anomaly identification and corrective action. Overall, these results confirm that collaborative governance, reinforced by strong procedural adherence, substantially elevates compliance resilience and operational reliability in cross-border project environments.
4. Discussion
In cross-border staffing projects, cross-departmental collaboration reduces compliance violations both directly and indirectly through process adherence. Empirical results show that process adherence mediates 38% of collaboration’s total impact on compliance risk, confirming that procedural discipline is a core element of governance. Information accessibility, clear accountability, and knowledge integration strengthen process standardization, transforming informal coordination into formalized workflows that lower hidden violation risks. The interaction of network density, modularity, and external factors such as policy shifts and visa quota changes defines the overall risk control mechanism. Higher network density strengthens interdepartmental ties and communication redundancy, reducing compliance gaps caused by weak information flow. Lower modularity indicates fewer structural barriers and stronger closed-loop execution. Each 0.1 increase in density lowers violation rates by 6.2%, supporting the mediating role of process adherence. Collaboration intensity accelerates anomaly reporting and approvals while reinforcing accountability. Yet, overreliance on central nodes may cause bottlenecks and slow responsiveness, underscoring the need for balanced bridging structures to avoid centralization risks. At the institutional level, policy shifts and visa fluctuations reshape compliance burdens. When organizations respond with standardized measures—such as compliance checklists, risk workshops, or visual dashboards—process adherence acts as a stabilizer. Following these interventions, HR-related compliance incidents declined by 41%, consistent with the model’s mediation results. This shows that effective collaboration relies more on institutionalized procedures ensuring timely feedback and accountability than on communication frequency. Methodological triangulation supports these findings: ERGM and QAP reveal strong correlations between network structure and compliance outcomes, IV-2SLS confirms causal relationships, and PLS-SEM verifies partial mediation through process adherence. The consistency across methods rules out endogeneity bias, confirming a genuine behavioral mechanism. Overall, the results extend risk governance theory by demonstrating that network structures enhance procedural reliability rather than simply facilitating communication. Practically, the value of cross-departmental collaboration lies in transforming structural links into procedural capabilities. This enables organizations to internalize collaboration outcomes into standardized, replicable compliance templates, maintaining resilience under policy volatility and institutional uncertainty.
5. Conclusion
Cross-departmental collaboration is crucial for managing compliance risks in cross-border projects. Results show that network structures directly shape risk exposure, with process adherence mediating 38% of the total effect. ERGM and QAP confirm correlations, IV-2SLS identifies causal effects, and PLS-SEM validates mediating pathways, forming a complete analytical loop. Higher density and lower modularity reduce non-compliance, while structured workshops and visual dashboards cut HR compliance incidents by 41%, underscoring the joint role of collaboration and process standardization. Future research could link dynamic network evolution with policy shocks to examine adaptive mechanisms across regulatory contexts and build scalable compliance risk governance systems.
References
- Peng, M.; Yan, H.; Wang, L. , et al. Factors influencing cross-departmental collaborative performance: evidence from 452 water governance cases in Guangzhou, China. Journal of Chinese Governance 2025, 10, 128–163. [Google Scholar] [CrossRef]
- Du, J. Innovation of cross border e-commerce supply chain management mechanism under digital background. International Journal of Networking and Virtual Organisations 2025, 32, 291–312. [Google Scholar] [CrossRef]
- Hu, L. Hybrid Edge-AI Framework for Intelligent Mobile Applications: Leveraging Large Language Models for On-device Contextual Assistance and Code-Aware Automation. Journal of Industrial Engineering and Applied Science 2025, 3, 10–22. [Google Scholar] [CrossRef]
- Chen, L. The impact of digital transformation on systemic risk in the banking industry. In Proceedings of the SHS Web of Conferences. EDP Sciences 2024, 208, 01024. [Google Scholar]
- Hasan, R.; Abdullah, M.S. Advancing ai in marketing through cross border integration ethical considerations and policy implications. American Journal of Scholarly Research and Innovation 2022, 1, 351–379. [Google Scholar] [CrossRef]
- Ogburn, E.L.; Sofrygin, O.; Diaz, I.; et al. Causal inference for social network data. Journal of the American Statistical Association 2024, 119, 597–611. [Google Scholar] [CrossRef] [PubMed]
- Zheleva, E.; Arbour, D. Causal inference from network data. In Proceedings of the 27th ACM SIGKDD Conference on Knowledge Discovery & Data Mining; 2021; pp. 4096–4097. [Google Scholar]
- Yao, L.; Chu, Z.; Li, S. , et al. A survey on causal inference. ACM Transactions on Knowledge Discovery from Data (TKDD) 2021, 15, 1–46. [Google Scholar] [CrossRef]
- Leung, M.P. Causal inference under approximate neighborhood interference. Econometrica 2022, 90, 267–293. [Google Scholar] [CrossRef]
- Orlova, E.V. Inference of factors for labor productivity growth used randomized experiment and statistical causality. Mathematics 2023, 11, 863. [Google Scholar] [CrossRef]
Figure 1.
Integrated Model Architecture.
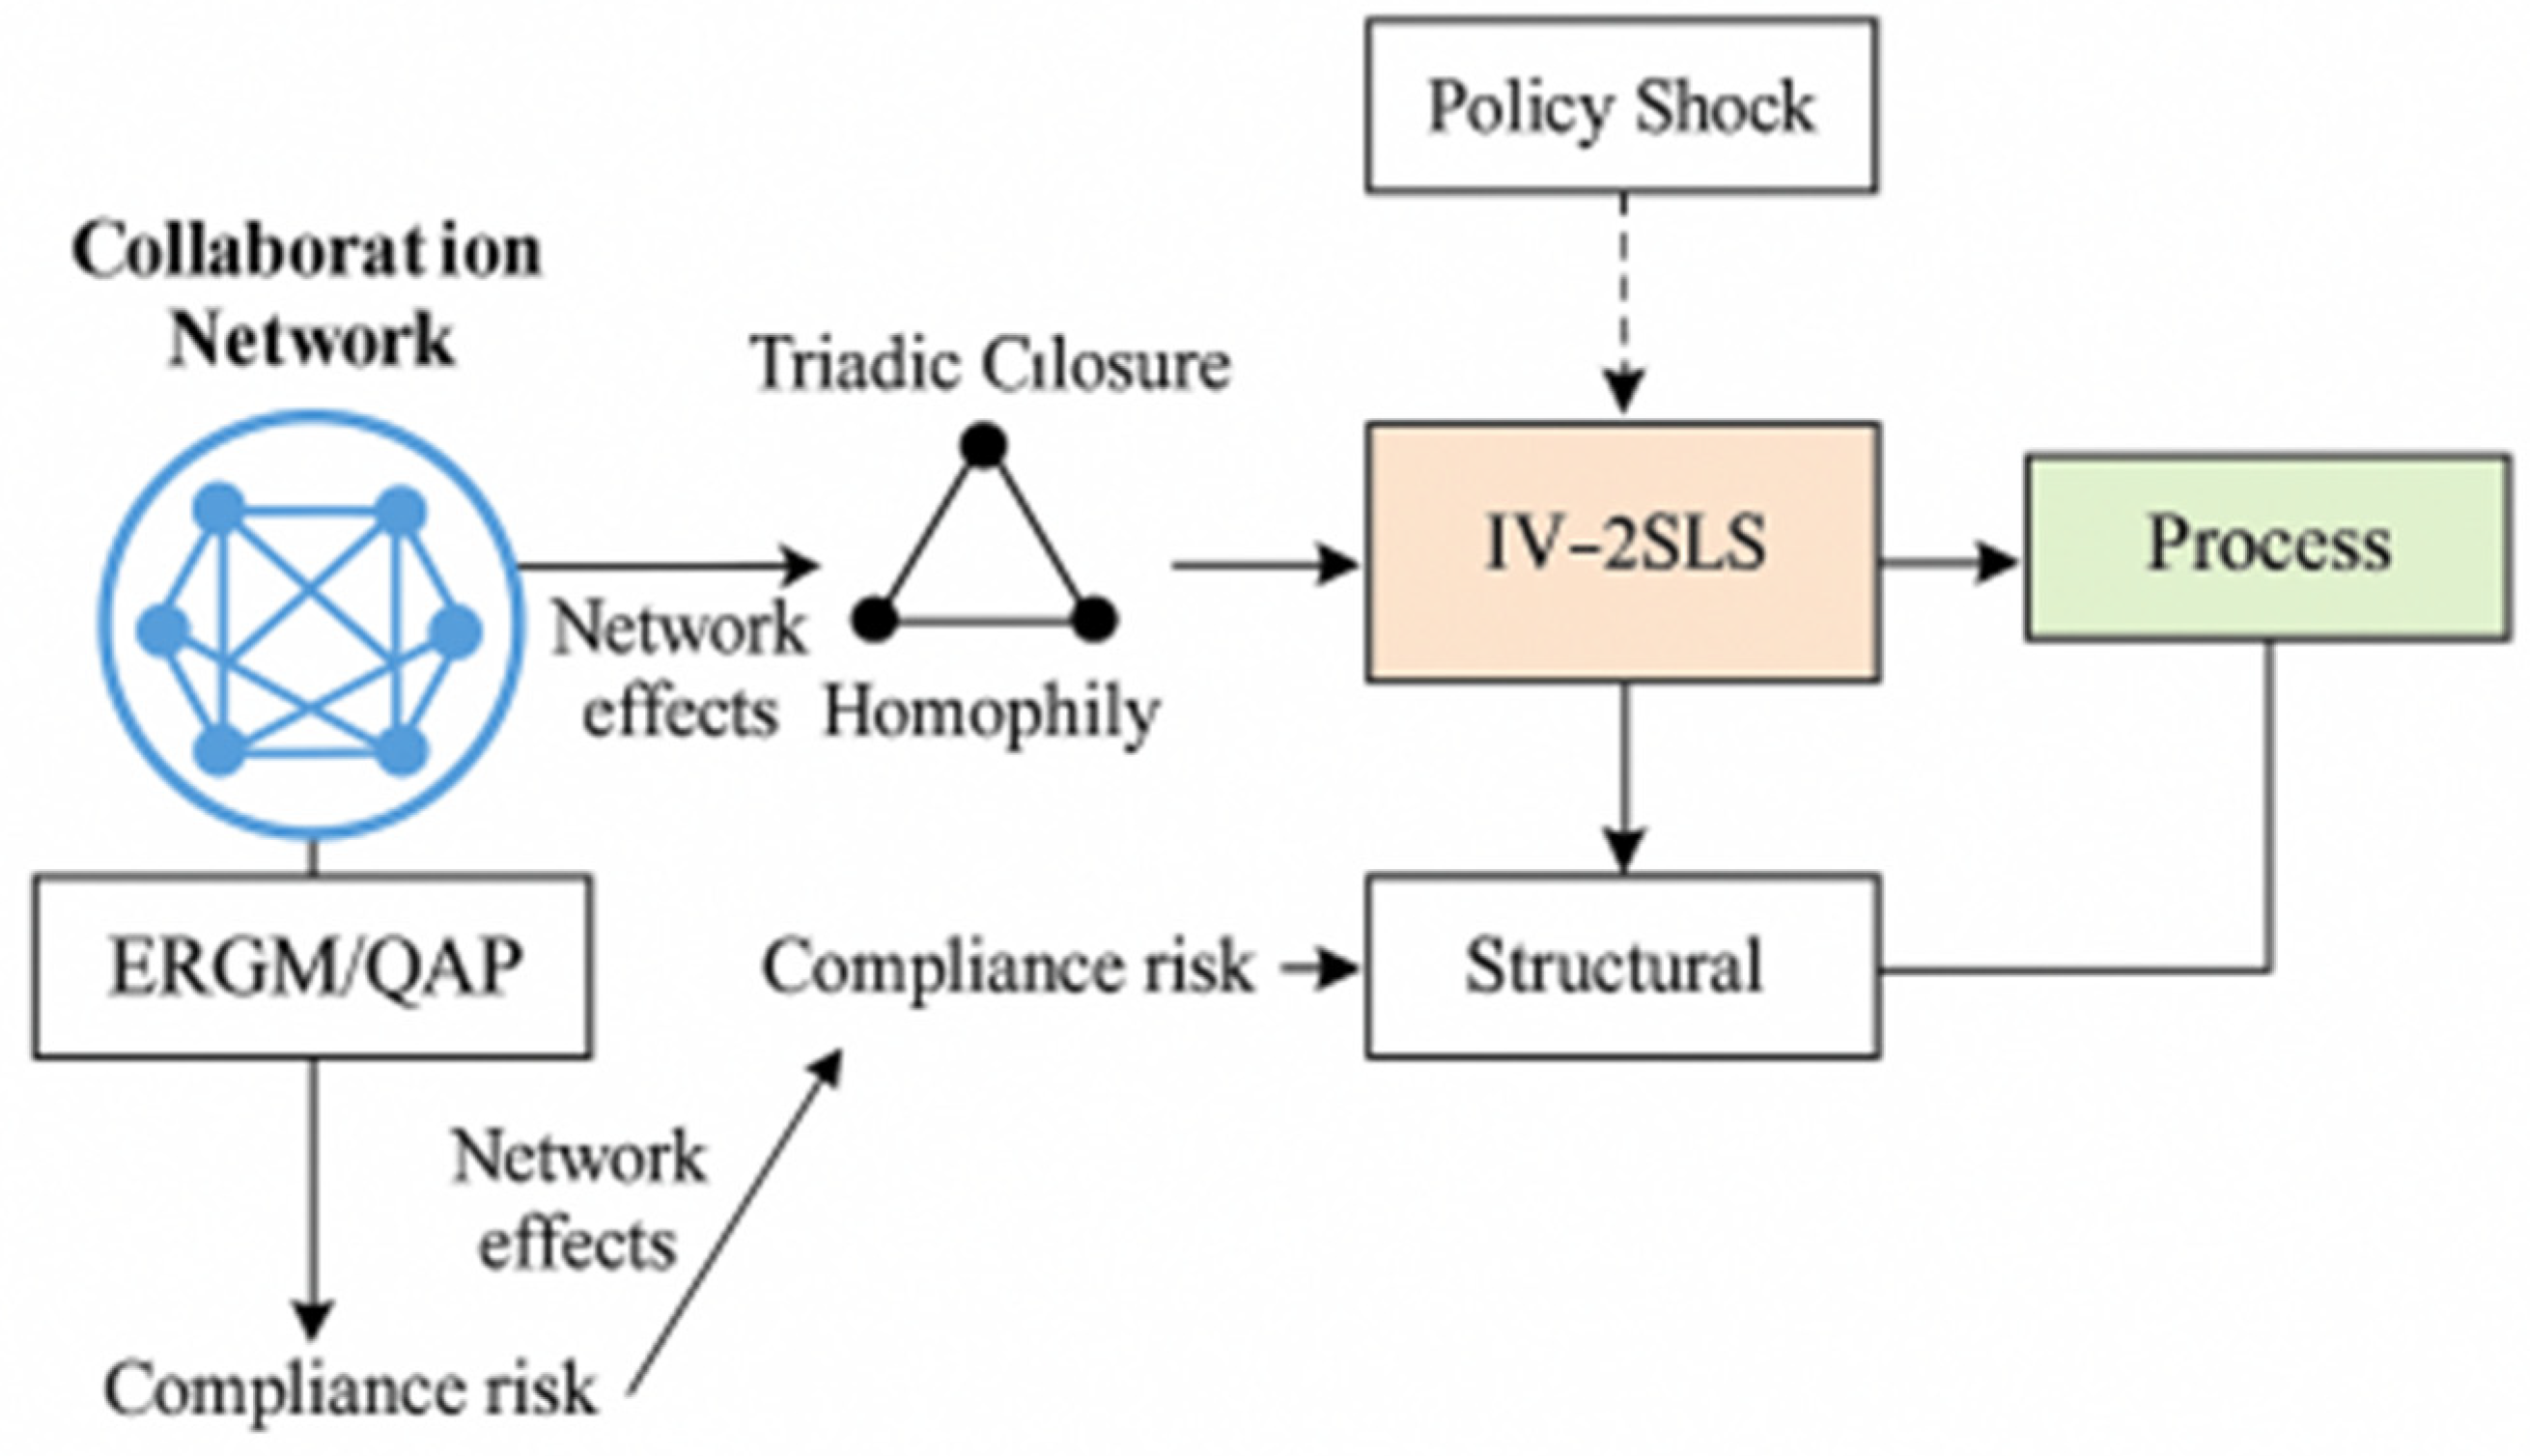
Figure 2.
Network Effects on Compliance Risk (Expert Panel and QAP Results).
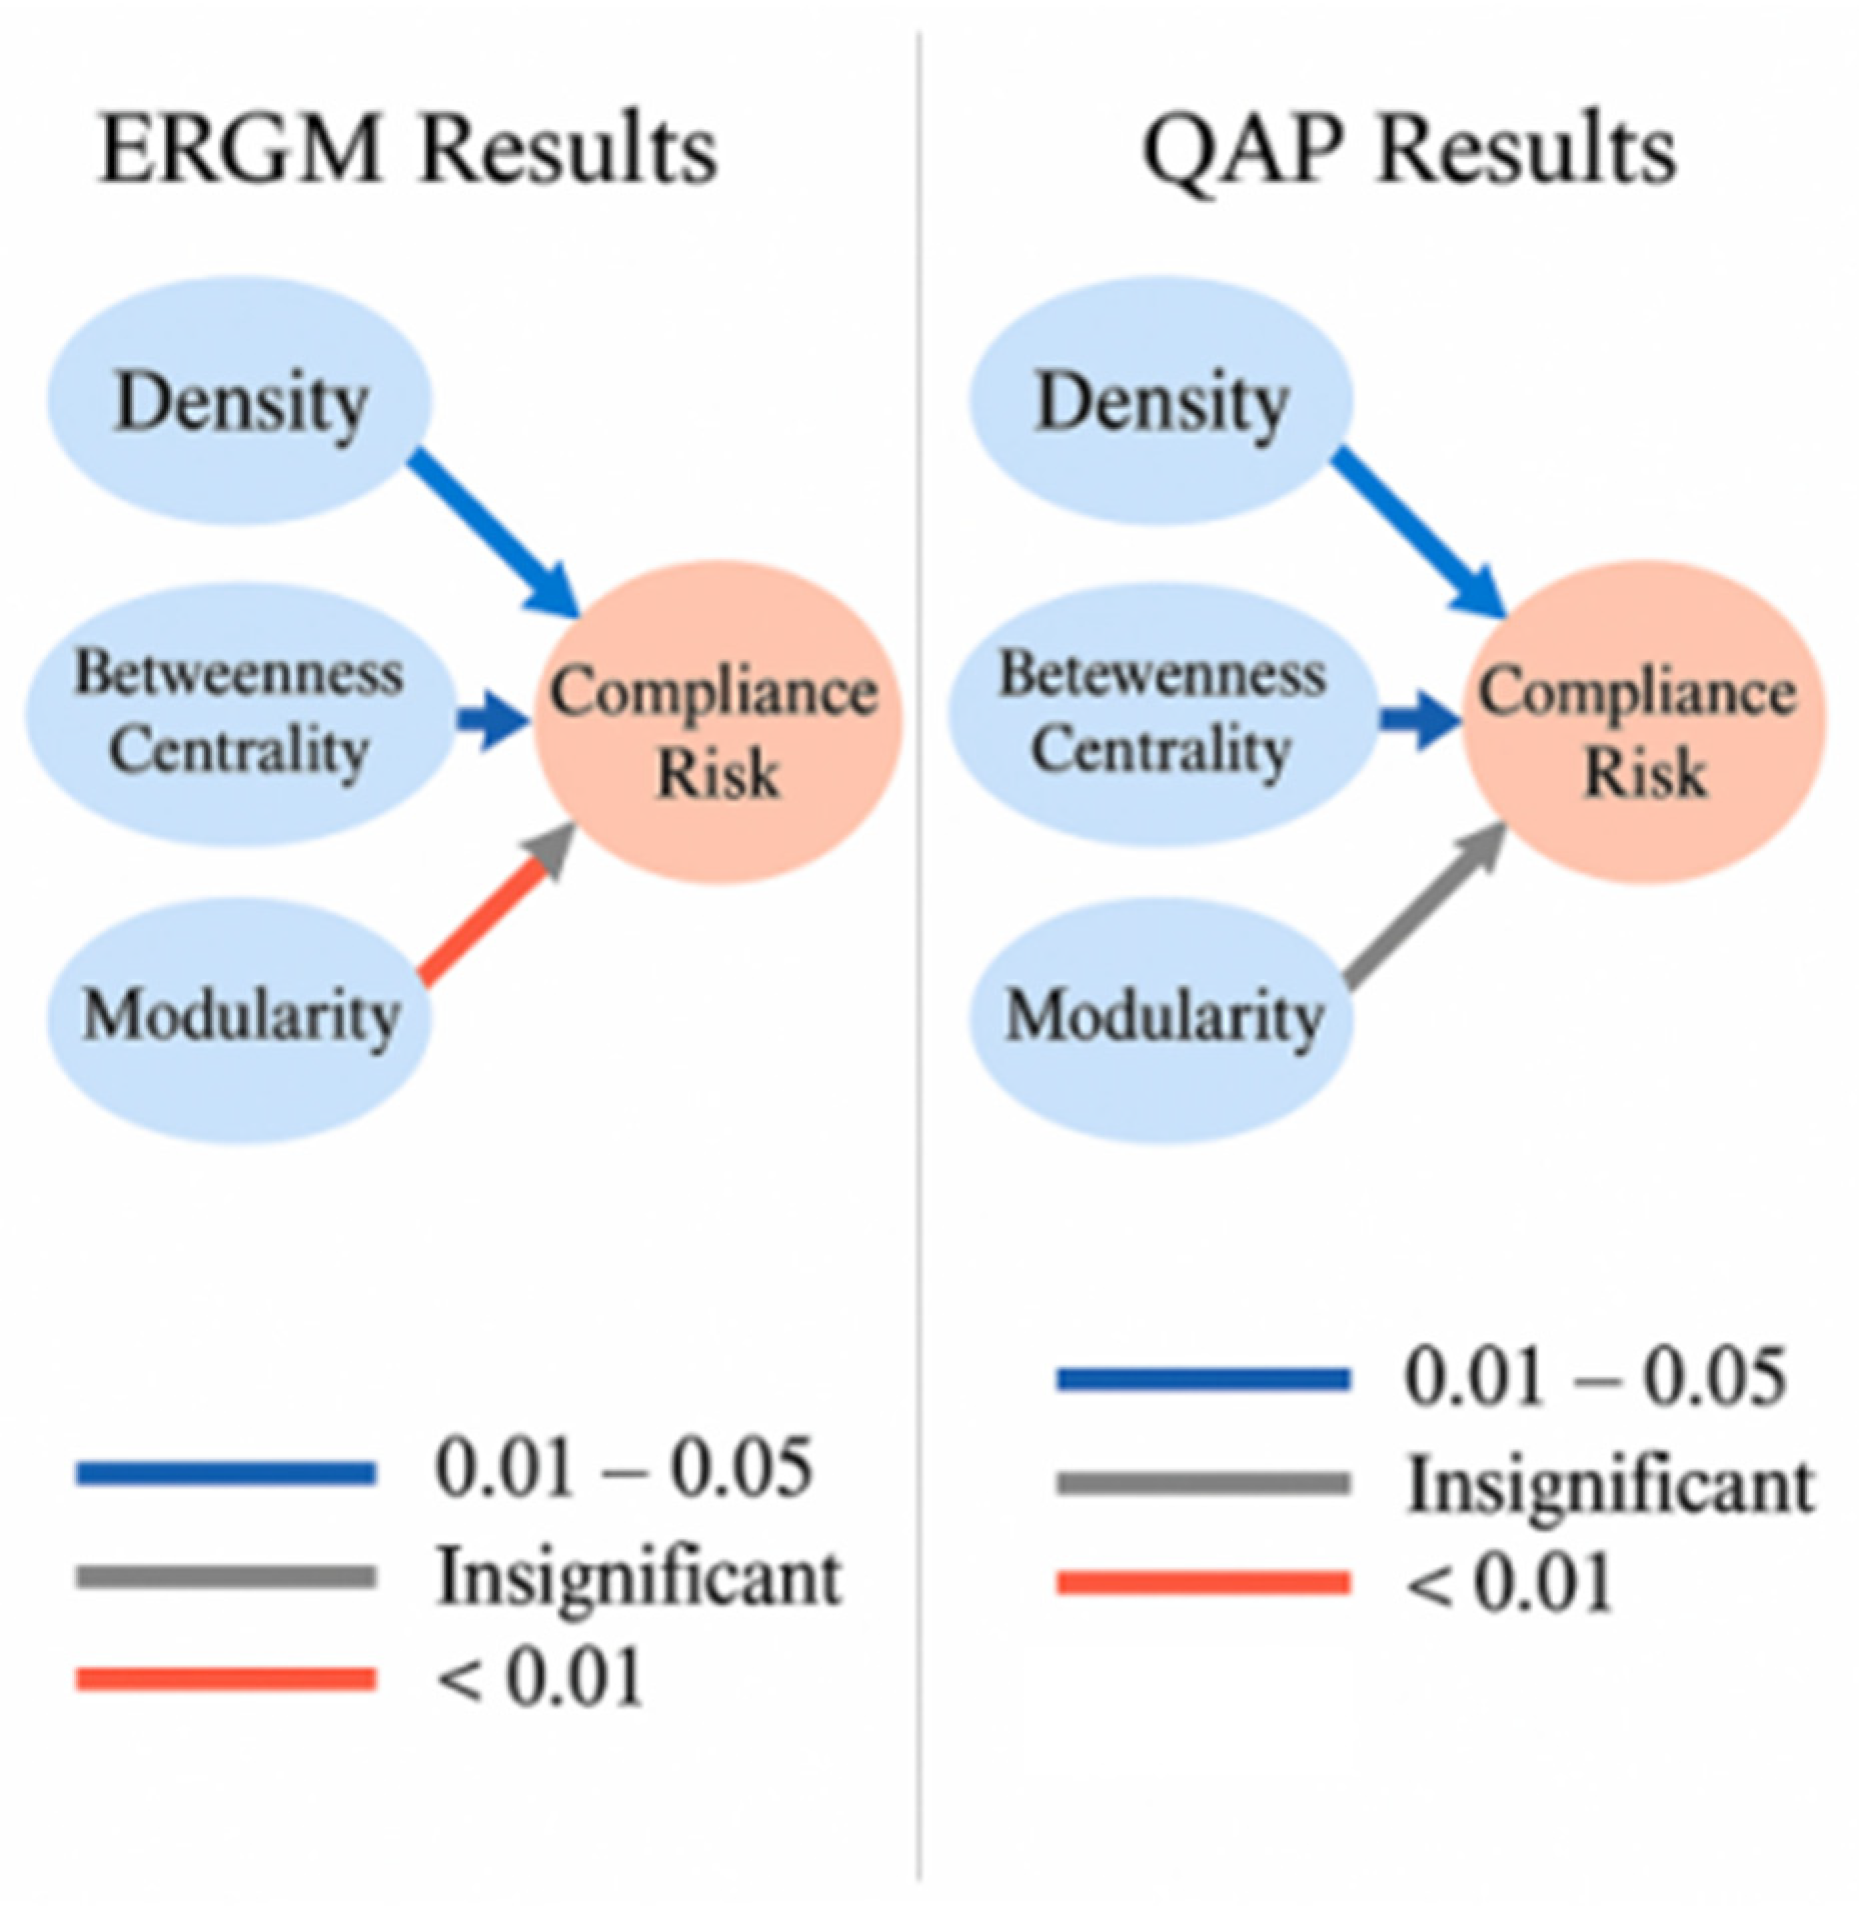
Figure 3.
PLS-SEM Mediation Model.
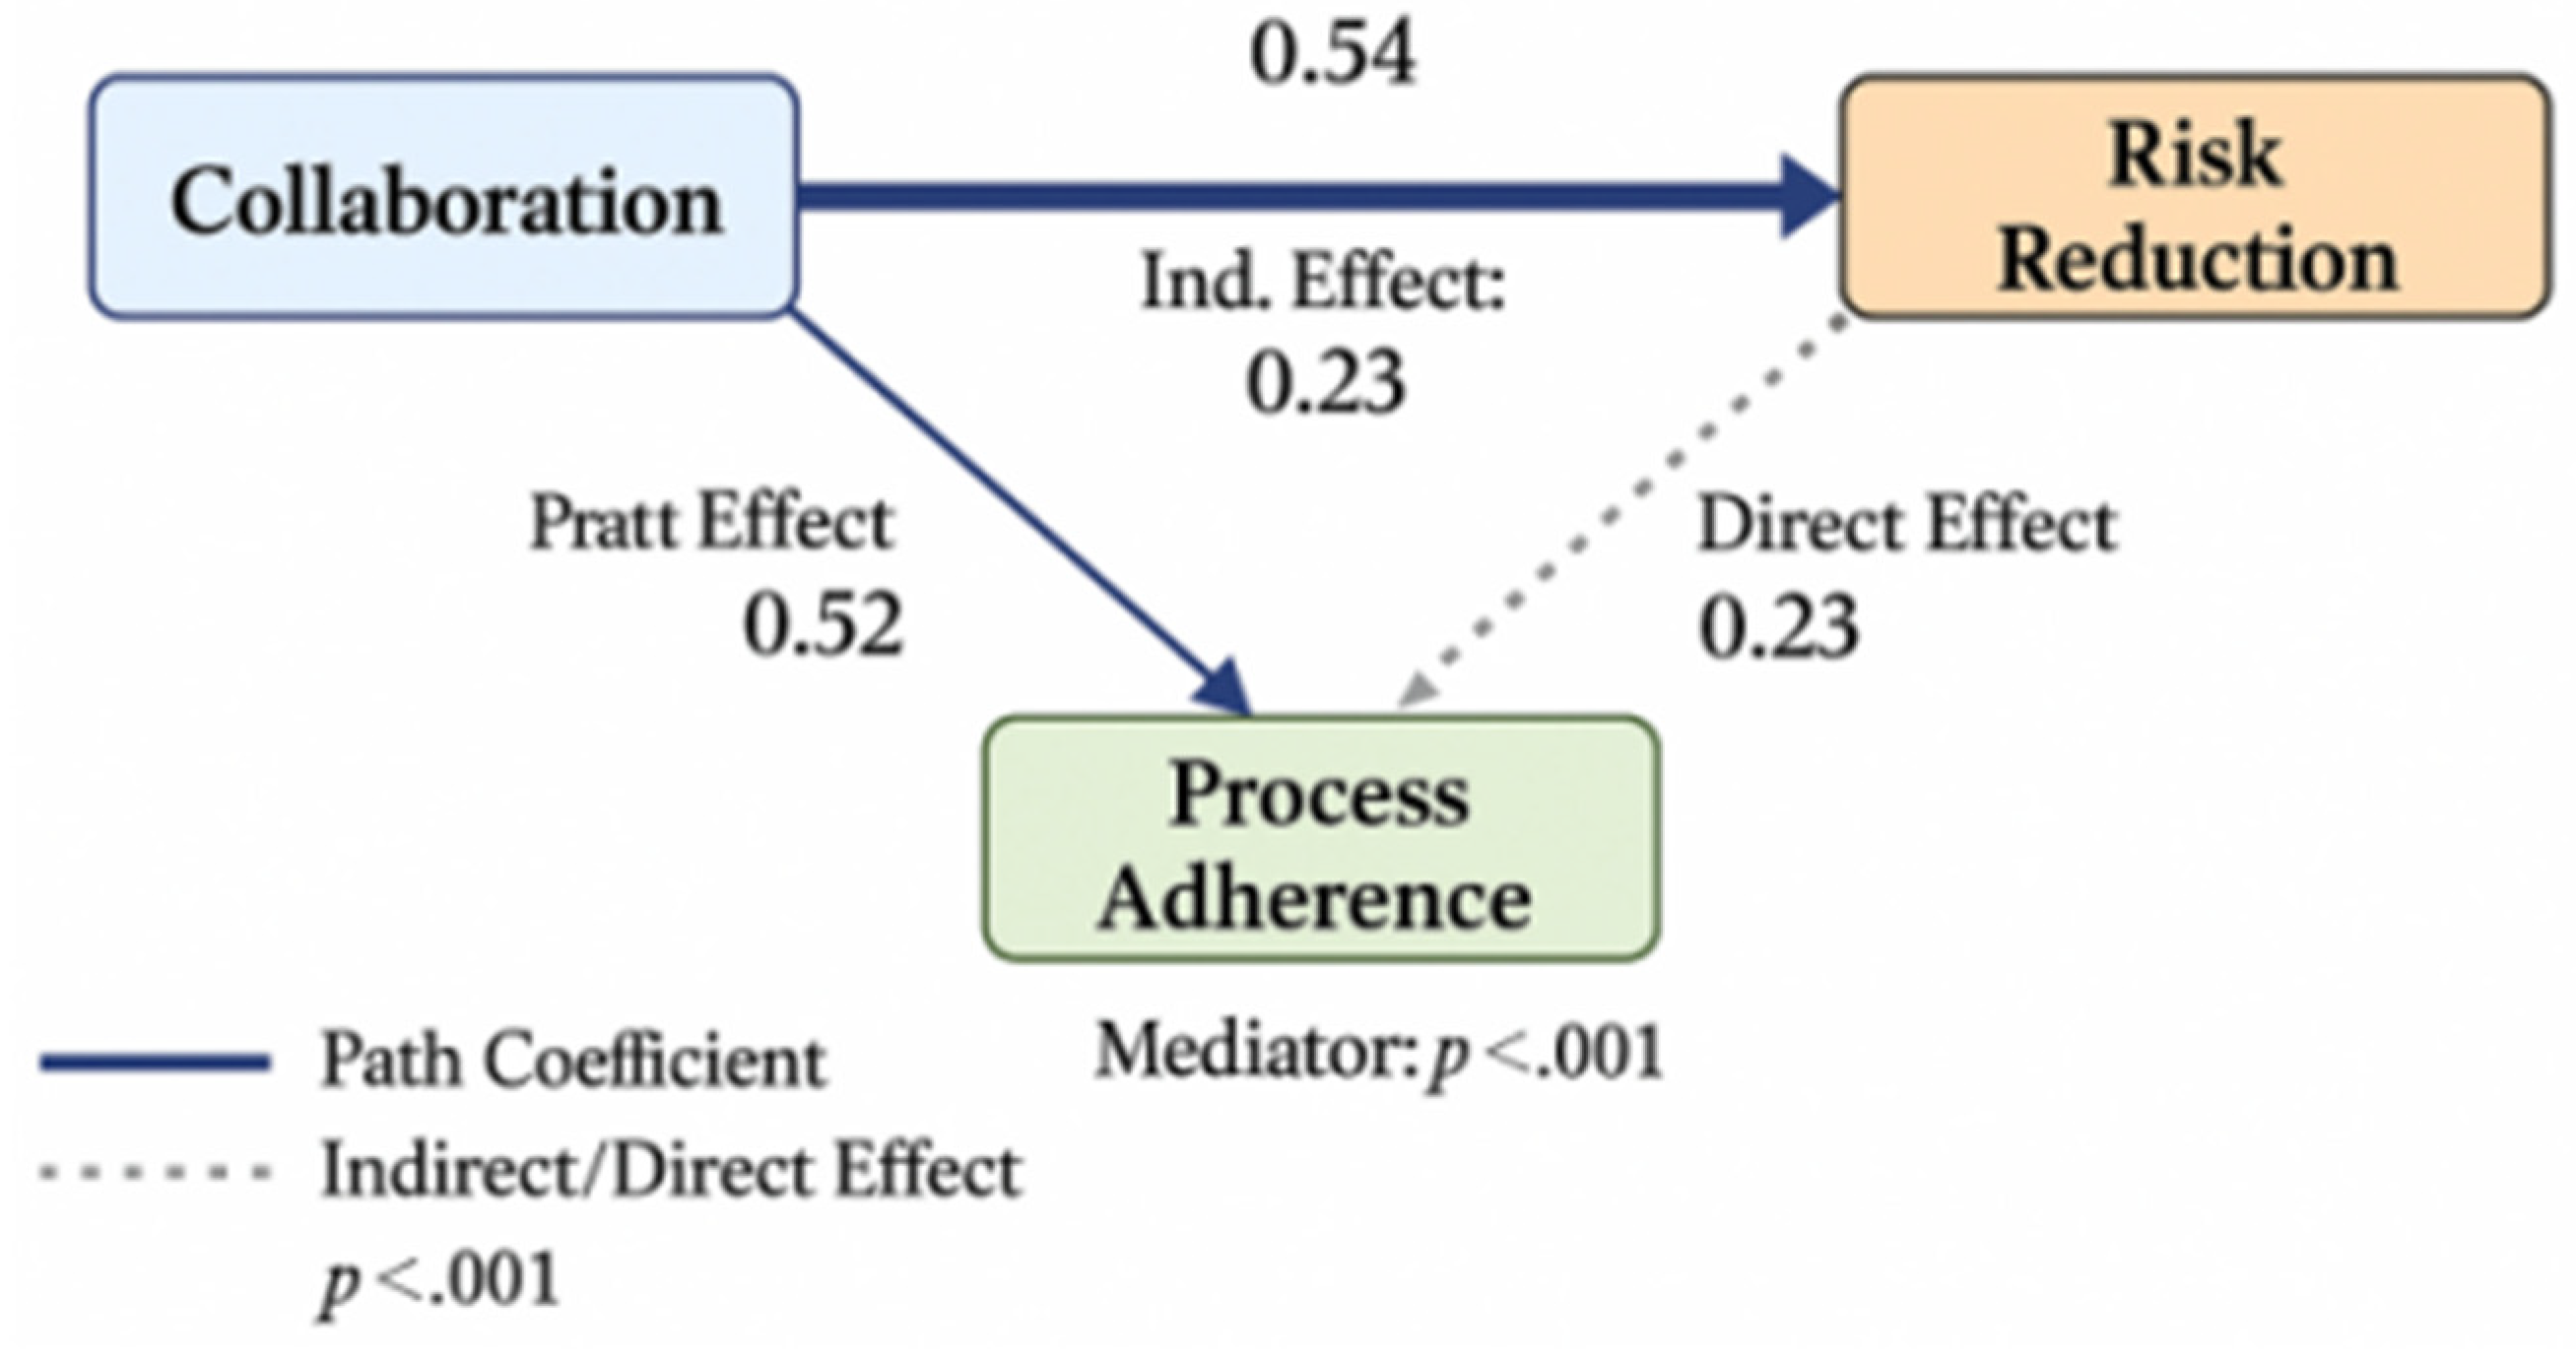
Figure 4.
Decomposition of Collaboration's Impact on Compliance Risk and Key Metrics.
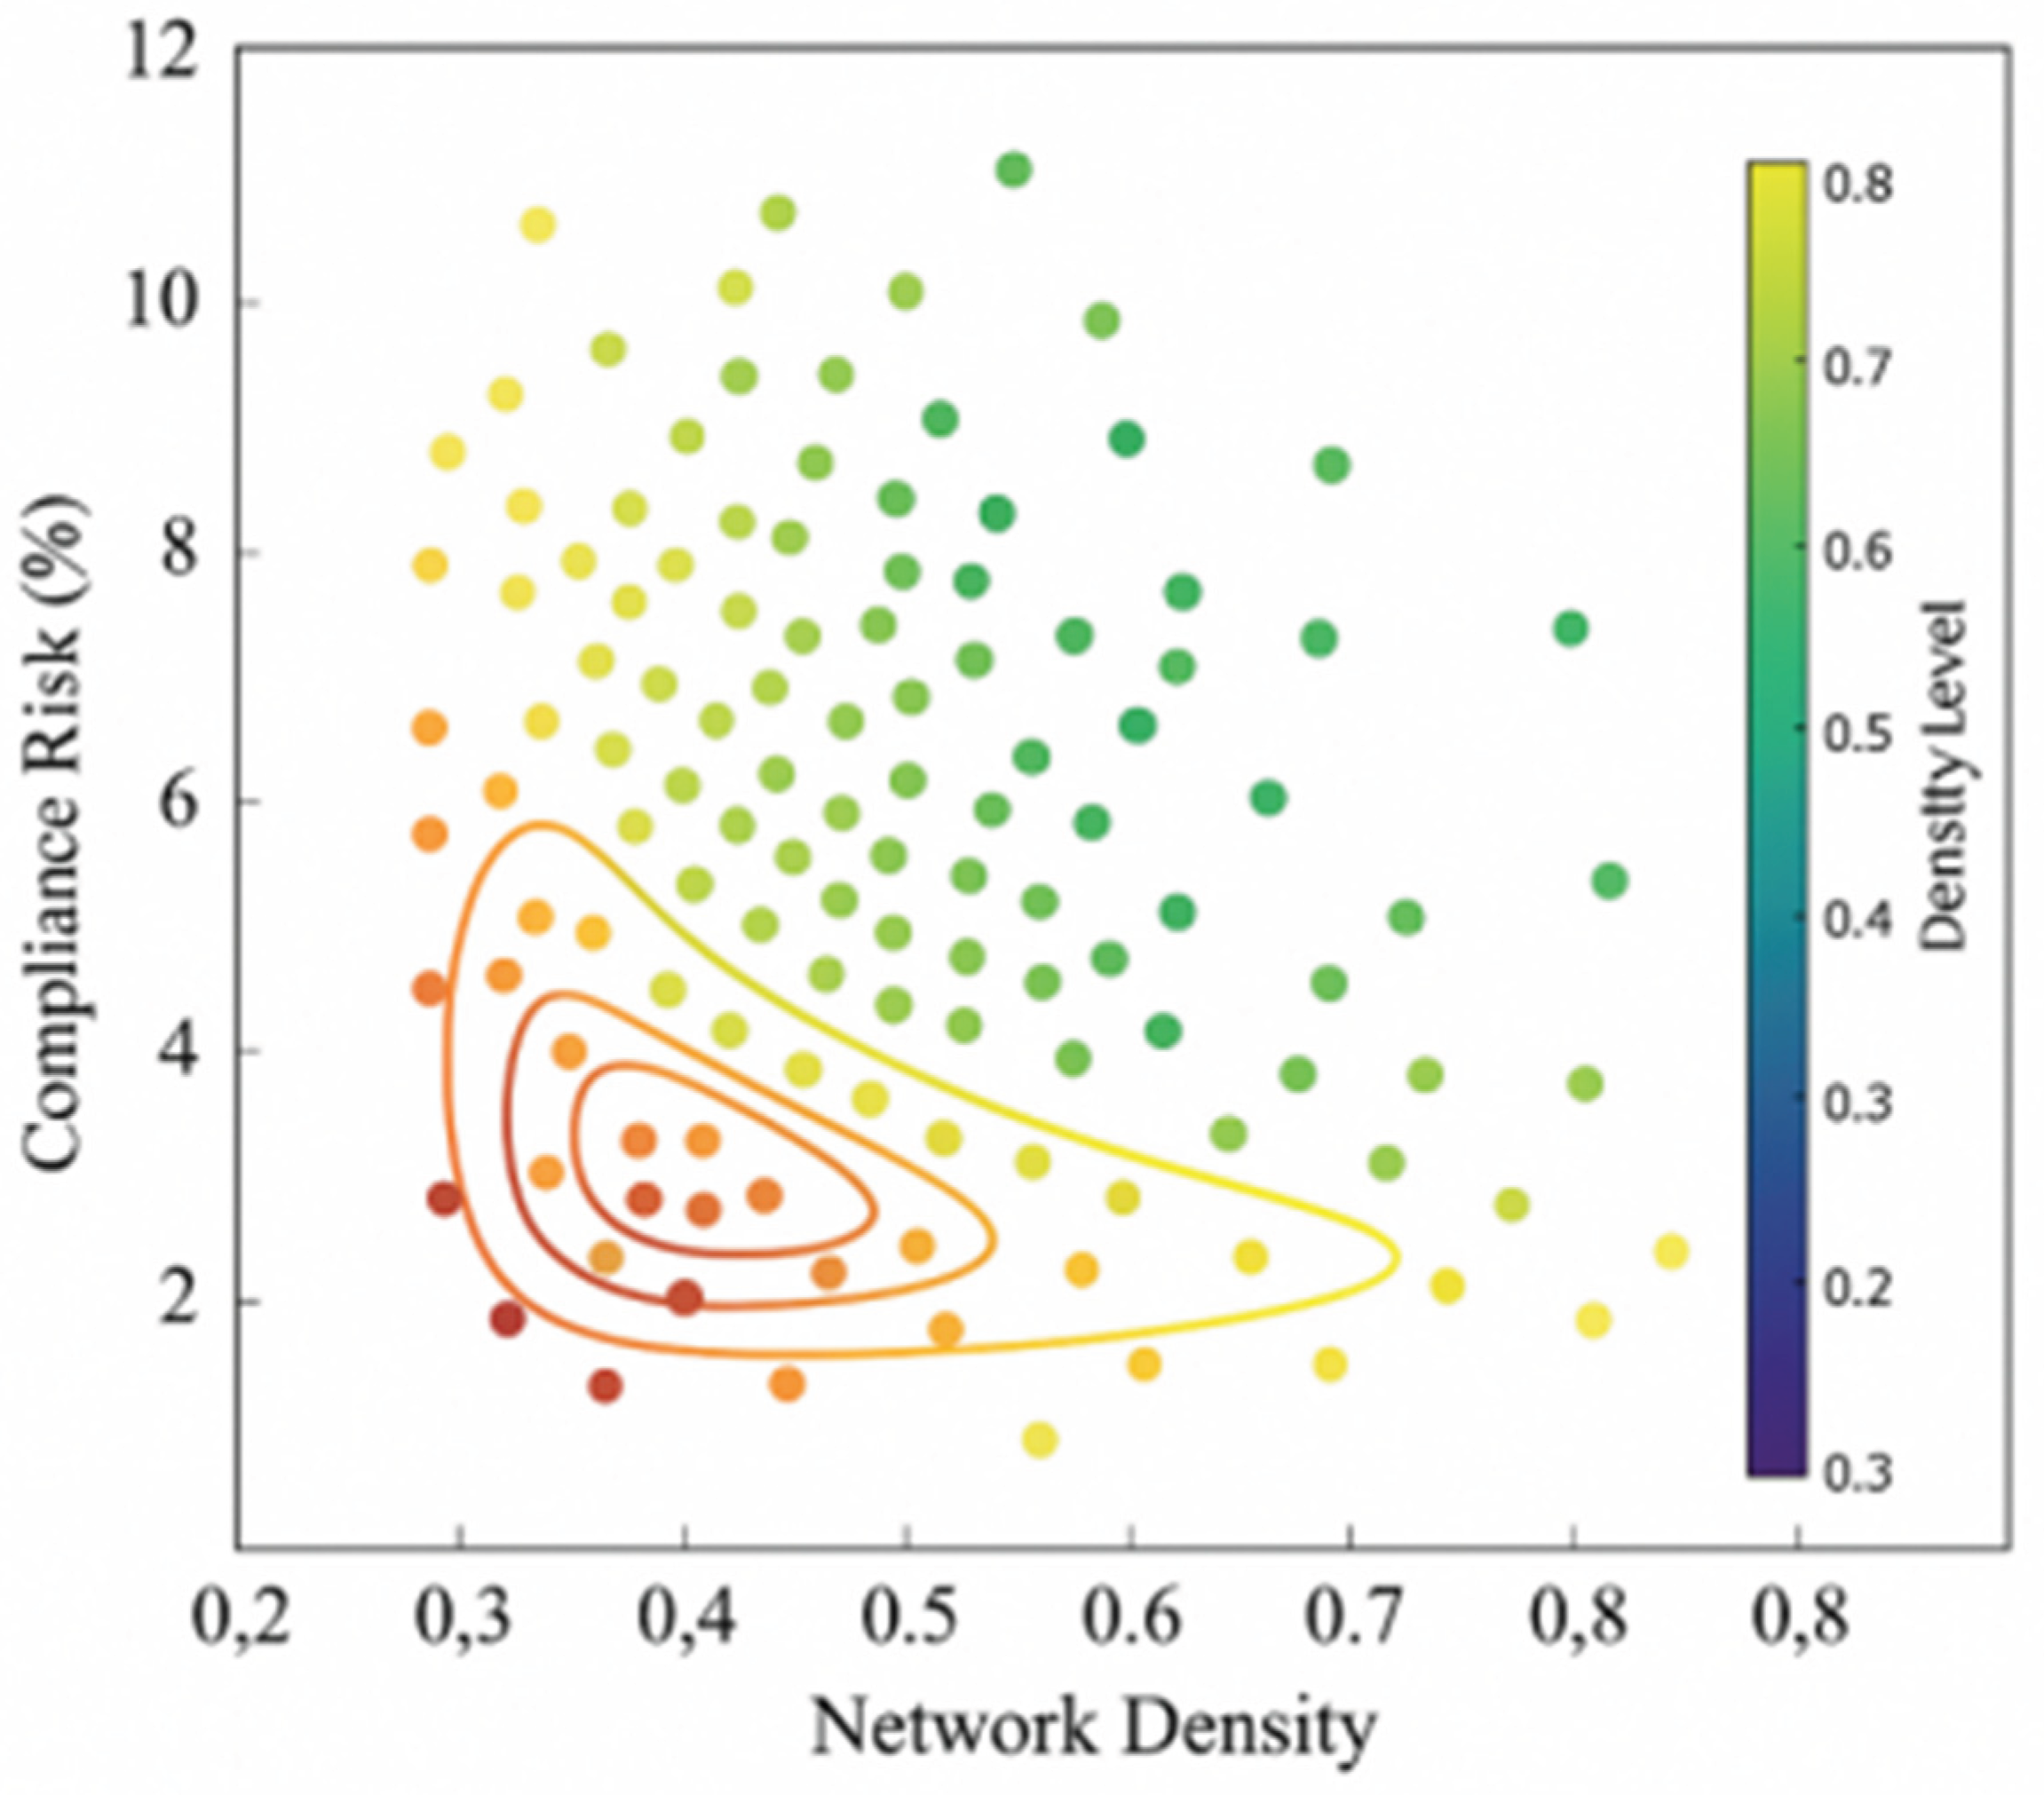

Table 1.
Descriptive Statistics of Project Collaboration Networks and Compliance Risks.
| Indicator | Mean | Standard Deviation | Minimum | Maximum |
| Network Density | 0.42 | 0.15 | 0.21 | 0.68 |
| Intermediate Centrality | 0.13 | 0.09 | 0.02 | 0.41 |
| Modularity | 0.36 | 0.12 | 0.18 | 0.52 |
| Compliance Risk Rate (%) | 5.8 | 2.7 | 2.1 | 12.3 |
Disclaimer/Publisher’s Note: The statements, opinions and data contained in all publications are solely those of the individual author(s) and contributor(s) and not of MDPI and/or the editor(s). MDPI and/or the editor(s) disclaim responsibility for any injury to people or property resulting from any ideas, methods, instructions or products referred to in the content. |
© 2025 by the authors. Licensee MDPI, Basel, Switzerland. This article is an open access article distributed under the terms and conditions of the Creative Commons Attribution (CC BY) license (http://creativecommons.org/licenses/by/4.0/).
Copyright: This open access article is published under a Creative Commons CC BY 4.0 license, which permit the free download, distribution, and reuse, provided that the author and preprint are cited in any reuse.


