1. Introduction
At least eight possible mechanisms underlying treatment resistance in hematopoietic malignancies such as acute lymphoblastic leukemia (ALL) have been reported. 1) enhanced activities of drug efflux mechanisms: extracellular release of many anticancer drugs reduces the intracellular drug concentrations, leading to treatment resistance; 2) suppressed activities of drug influx mechanisms; 3) enhanced activities of drug detoxification pathways; 4) influence of the tumor microenvironment; 5) presence of cancer stem cells; 6) changes in signaling pathways within the tumor cells: e.g., mutations of specific proteins to which molecular-targeted drugs bind; 7) genetic characteristics of the tumor prior to treatment (initial resistance) and genetic mutations acquired after the start of treatment (acquired resistance); and 8) epigenetic changes. Items 5) to 8) have been extensively studied in the medical field. However, items 1) to 4) (references 1-3) have been primarily studied only in the pharmaceutical field, and there have been very few clinical studies linking these factors to clinical treatment resistance. Furthermore, no comprehensive evaluation of these topics has been published in the literature. We previously conducted a comprehensive evaluation of the patient survival time after treatment as an indicator of treatment resistance; our results are summarized in references 2-4.
The efficacy of cancer chemotherapy is determined by the tumor expression profiles of cancer-related genes and functional proteins that play important roles in resistance to anticancer drugs. Factors inducing resistance to anticancer therapy could exist even before the start of treatment (endogenous drug resistance) or emerge after the start of treatment (acquired drug resistance). Drug resistance is the main cause of treatment resistance and disease recurrence in most malignancies. Herein, we provide a guideline for developing more effective cancer treatments in an attempt to obtain better treatment outcomes based on a better understanding of the mechanisms of drug resistance [
1].
We have previously proposed prognostic classifications - the Urayasu Prognostic Classification for large B-cell lymphoma (LBCL) [
2], aggressive T-cell lymphoma (TCL) [
3], and acute myeloid leukemia (AML) [
4] - based on the expression patterns of multiple treatment resistance factors present in the tumor cells even prior to the start of treatment (endogenous drug resistance). In patients with newly diagnosed ALL, presence of the Philadelphia chromosome (Ph) indicates a poor prognosis. In patients who test negative for Ph, the prognosis is related to age over 35 years, an elevated white blood cell count (over 30,000/μL for B-ALL and over 100,000/μL for T-ALL), and complete remission within 4 weeks [
5]. Herein, we propose the Urayasu classification for ALL based on the expression patterns of multiple resistance (endogenous) factors prior to the start of treatment. For reference, we have briefly outlined the proposed mechanisms of drug resistance in ALL [
5].
Regarding ALL, we have proposed a new Urayasu classification based on the combination of multiple (endogenous) protein factors that appear before treatment. We provide a brief explanation of the mechanisms of drug resistance with reference to a review (1). Through an extensive review of the literature, we identified the following four mechanisms as being the most significant in relation to drug resistance in hematopoietic malignancies, namely, 1) enhanced activities of drug efflux mechanisms; extracellular release of the drug results in reduced intracellular concentrations of the anticancer drugs, leading to drug resistance; 2) suppressed activities of drug influx mechanisms; 3) enhanced activities of drug detoxification pathways; and 4) influence of the tumor microenvironment.
1-1. Angiogenesis and vascular hyperplasia due to extracellular release of microenvironmental factors and escape from the immunosurveillance mechanism
1-1-1. Non-immune microenvironmental factors: Factors that facilitate overcoming stress conditions such as hypoxia and hypoglycemia in the tumor microenvironment.
1-1-1-1. Glucose-regulated protein 94 (GRP94) [
6,
7]
GRP94 exists mainly in the endoplasmic reticulum and/or mitochondria. It is secreted outside the cell and regulates apoptosis, inflammation, and angiogenesis [
6]. Upregulation of GRP94 has been observed in various cancers, including multiple myeloma, suggesting the clinical significance of developing treatment agents that can selectively target GRP94 [
7].
1-1-1-2. Glucose-regulated protein 78 (GRP78) [
8,
9,
10]
GRP78 is mainly expressed in the endoplasmic reticulum. The expression of GRP78 is known to be associated with cancer and is a potential therapeutic target as well [
8]. Expression of this protein has been identified in pediatric patients with high-risk B-cell acute lymphoblastic leukemia (B-ALL) [
9]. It has been reported that combined GRP78, CAR-T cell + dasatinib therapy can substantially enhance its effector function [
10].
1-1-1-3. Transforming growth factor β1 (TGFβ1) [
11,
12]
TGFβ1 is involved in cell growth and differentiation, apoptosis, angiogenesis, and cellular immunity. In the early stages of cancer development, it inhibits cell transformation and prevents progression of cancer, whereas in the later stages, it promotes tumor progression through inducing mesenchymal transition, triggering angiogenesis, and inducing immunosuppression [
11]. Failure of regulation of the TGFβ1 pathway has been reported in many hematological malignancies, including ALL and malignant lymphoma [
12].
1-1-1-4. Tumor necrosis factor α1 (TNFα1) [
13]
TNFα is involved in the progression and relapse of AML and is associated with decreased patient survival [
13]. We have previously reported that fibrosis caused by TGF-β1 and TNFα1 produced by hematologic malignancies is associated with a poor prognosis [
14]. Soluble TNF initiates TNFR1 signaling, but not TNFR2 signaling, despite receptor binding, except as the second messenger [
15]. TNFR1 is expressed in AML and promotes proliferation of the tumor cells [
16]. TNFR1 and caspase10 expressed in ALL induce cell death [
17].
1-1-2. Immune microenvironmental factors (3 types)
1-1-2-1 Programmed cell death-1 (PD-1) (CD279) [
18]
1-1-2-2 Programmed cell death–ligand 1(PD-L1, CD274) [
19]
In ALL, PD-L1 expression is known to be associated with a poor prognosis.
1-1-2-3 Programmed cell death–ligand 2 (PD-L2, CD273) [
20]
In AML, tumor cell surface expression of PD-1/PD-L1,2 is clinically significant, and these patients benefit from immune checkpoint inhibitor therapy.
1-2. Decreased drug uptake activity
Equilibrative nucleoside transporter 1 (ENT1) increases drug uptake [
21].
In patients with T-ALL, a decrease in tumor ENT1 expression could decrease cytarabine influx, resulting in treatment resistance.
1-3. Enhanced drug elimination activity
1-3-1. Multidrug resistance 1 (MDR1) [
22]: MDR1 is considered as a useful molecular marker of the prognosis in ALL patients.
1-3-2. Multidrug resistance-associated protein 1 (MRP1) [
23]: Tumor MRP1 expression has been reported as having a significant effect on the survival in patients with ALL.
1-3-3. Multidrug resistance-associated protein 4 (MRP4) [
24]: In patients with ALL, MRP4 could become established as a promising novel therapeutic target to develop agents that can inhibit tumor growth and induce apoptosis.
1-4. Changes in drug metabolic activity
1-4-1. Cytochrome P450 3A4 (CYP3A4) [
25]:
CYP3A4 has an important role in the metabolisms of many drugs used in ALL therapy.
1-4-2. CYP2B6 [
26]: CYP2B6 variants are significantly associated with the risk level in acute leukemia patients.
1-4-3. Aldo-keto reductase family 1 member C3 (AKR1C3) [
27]: In AML and T-cell acute lymphoblastic leukemia (T-ALL), AKR1C3 expression in the tumor cell cytoplasm degrades doxorubicin hydrochloride, resulting in treatment resistance.
1-4-4. AKR1B1 [
28]: AKR1B1 induces tumor cell proliferation in the later stages of AML. AKR1B1 is very similar in structure to AR1B10, and the two may competitively inhibit each other’s actions.
1-4-5. AKR1B10 [
29]: Intracellular concentrations of daunomycin are decreased mainly by the presence of AKR1B1 and AKR1C3 in the tumor cells; these two proteins also decrease the intracellular concentrations of idarubicin, but only by about one-fifth. AKR1B10 decreases the intracellular concentration of not only daunomycin, but also of idarubicin. It catalyzes reduction in the carbonyl groups of daunomycin and idarubicin in the cytoplasm, converting the drugs into water-soluble inactive alcohols. Like AKR1C3, it is also involved in resistance to cisplatin and is considered as playing a central role in resistance to cyclophosphamide. On the other hand, AKR1C3 is known to be associated with resistance to methotrexate and vincristine. AKR1B10 expression is regulated by genes expressed on chromosome 7q33. Failure of AKR1B10 regulation in the event of missing chromosome 7 results in enhanced function of this protein.
Dasatinib, a Bcr-Abl tyrosine kinase inhibitor, has a moderating effect on AKR1B10 and is expected to be applicable to the treatment of AML because it inhibits the metabolism of daunomycin and idarubicin [
30]. Ibrutinib, a tyrosine kinase inhibitor, has a moderating effect on AKR1C3 and is expected to be applicable to the treatment of AML because it inhibits the metabolism of doxorubicin.
1-5. Other functional proteins
1-5-1. Thymidine phosphorylase (TP) [
31]: Expression of TP, which is involved in tumor cell resistance to malnutrition and to the tumor cell ability for angiogenesis, infiltration, and metastasis in lymphomas, is associated with a poor patient prognosis due to its anti-apoptotic and angiogenic effects.
1-5-2. P53 [
32]: A more rigorous characterization of the resistance profiles and responses to therapy of TP53-mutated ALL is required before its clinical relevance can be established.
1-5-3. MYC [
33]: An essential ERG- and c-MYC-dependent transcriptional network involved in the regulation of metabolic and ribosome biogenesis pathways in BCR::ABL1 B-ALL, from which previously unidentified vulnerabilities and therapeutic targets may emerge.
1-5-4. Glutathione sulfate transferase (GST) [
34]: GST1 genotyping may be useful for selecting the appropriate chemotherapy regimen for AML [
35].
2. Materials and Methods
2.1. Patients and Sample Collection
For this study, we enrolled 19 patients with ALL who had received standard combined Hyper CVAD/MA treatment as the initial remission induction therapy at our hospital between 2015 and 2020. The distribution of the disease types in the patients is shown in
Table 1. We performed immunohistochemical (IHC) staining of formalin-fixed paraffin-embedded biopsy specimens obtained from the patients to determine the expressions of 23 proteins that have previously been reported as being treatment-resistance factors; positive and negative staining results were determined by observation under an optical microscope. Biopsies were taken from all patients prior to the start of the induction chemotherapy. In this study, the analysis was limited to investigations performed prior to the start of induction chemotherapy. We then compiled and performed a retrospective analysis of the data. We used variables such as anticancer drug metabolic factors in the analysis model and compared the overall survival periods (OS) of the patients after the initial remission induction therapy by the log-rank test. The MRC UKALL XII/ECOG classification [
5] was used as the control. The approval code for this study is U17-0016, and approval for the study by our institution’s Ethics Committee was granted on December 9, 2022.
2.2. Immunohistochemistry
Tissue biopsy specimens obtained from the patients were fixed in formalin and embedded in paraffin to prepare tissue blocks, sectioned, and subjected to IHC staining. The primary antibodies directed against the following major proteins involved in anticancer drug metabolism were as follows: (1) GRP94: Proteintech (Rosemont, IL, USA), clone 1H10B7(monoclonal antibody generated against the N-terminal region of full-length HSP90b1); (2) CYP3A4: Sigma-Aldrich (St. Louis, MO, USA); SAB1400064 (polyclonal antibody generated against CYP3A4); (3) AKR1C3: Proteintech 11194-1-AP (polyclonal antibody generated against AKRC3); (4) MDR1 (P-glycoprotein): Proteintech, 22336-1-AP (polyclonal antibody generated against MDR1); (5) MRP1 (CD9): Proteintech, 60232-1-IG (monoclonal antibody generated against the N-terminal region of full-length MRP1); (6) TGF-beta1: Proteintech, 21898-1-AP (polyclonal antibody generated against TGF-beta); (7) GRP78: Proteintech, 66574-1-IG (monoclonal antibody generated against the N-terminal region of full-length GRP78); (8) glutathione S-transferase-kappa1 (GST): Proteintech, 14535-1-AP (polyclonal antibody generated against GST1); (9) thymidine phosphorylase: Abcam (Cambridge, UK), ab226917 (polyclonal antibody generated against thymidine phosphorylase); (10) MRP4(ABCC4): SANTA CRUZ BIOTECHNOLOGY (Dallas, TX, USA), SC-376262 (monoclonal antibody generated against the N-terminal region of full-length MRP4 [amino acid 1–280]); (11) CYP2B6: LifeSpan BioSciences, Inc. (Seattle, WA, USA), LS-C352084 (polyclonal antibody generated against CYP2B6); (12) TNF1-alpha: Sigma-Aldrich, SAB4502982 (polyclonal antibody generated against TNF1-alpha); (13) PD-1; (14) PD-L1: Proteintech, 66248-1-IG, mouse IgG1 monoclonal antibody. Clone 2B11D11; (15) PD-L2 Proteintech,18251-1-AP16, rabbit IgG polyclonal antibody; (16) P53: Cell Signaling Technology, Inc. (3 Trask Lane Danvers, MA, USA), DO-7 mouse monoclonal antibody #48818; (17) c-MYC: Abcam (Kendall Sq Cambridge, MA, USA), Y69 clone ab32072; (18) ENT-1 (equilibrative nucleoside transporter 1): Proteintech, 1337-1-AP rabbit IgG polyclonal antibody; (19) AKR1B1: Sigma-Aldrich (3050 Spruce Street Saint Louis, MO, USA), rabbit polyclonal antibody HPA052751; and (20) AKR1B10: Sigma-Aldrich (3050 Spruce Street Saint Louis, MO, USA), rabbit monoclonal antibody HPA020280. After the immunostaining, two pathologists definitively determined the results of the IHC staining. The IHC staining was judged as positive when more than 50% of the tumor cells showed positive staining (weakly positive staining was also considered). The concordance rate between the two pathologists for the staining results was about 83%. In case of disagreement between the two pathologists, the final diagnosis was arrived at by consensus.
2.3. Statistical Analysis
To confirm the association between the OS and poor prognostic factors/factors involved in anticancer drug metabolism after the initial Hyper CVAD/MA therapy, survival curves were plotted by the Kaplan–Meier method, and factors significantly associated with the OS were evaluated by the log-rank test. The significance level in the statistical tests was set at 0.05 (two-tailed), and p < 0.05 was considered as being indicative of a statistically significant difference. Statistical analyses were performed using EZR version 2.7-1 software (Saitama Medical Center, Jichi Medical University, Saitama, Japan) [
36].
Multiple comparisons were not considered because of the exploratory nature of this study.
2.4 A comprehensive literature review of 33 anti-hematologic malignancy drugs related to five factors of treatment resistance and three factors of treatment enhancement.
2-4-1 The 33 representative anti-hematologic malignancy drugs
2-4-1-1 CHOP: Cyclophosphamide, Doxorubicin, Vincristine, Prednisolone, or Dexamethasone (steroid)
2-4-1-2 Tyrosine kinase inhibitors (TKIs): Dasatinib, Asciminib, Ponatinib
2-4-1-3 IMiDs: Lenalidomide, Pomalidomide
2-4-1-4 Protease inhibitors: Bortezomib, Carfilzomib
2-4-1-5 Bruton's Tyrosine Kinase Inhibitors (BTKIs): Ibrutinib
2-4-1-6 Others: Cisplatin, Methotrexate, Gemcitabine, Cytarabine (Ara-C), Romidepsin, Venetoclax, Monomethyl auristatin E (MMAE) Gilteritinib, Quizartinib, Chridamid, Etoposide Bendamustine, Carfilzomib, Melphalan, Darinaparsin, Pralatrexate, Etoposide, Bendamustine, Azacitidine (AZA), All trans retinoic acid (ATRA), Forodesine, Radiation
2-4-2 Five typical treatment resistance factors expressed in hematologic malignancies: The drug-metabolic enzymes AKR1 (AKR1B10, AKR1C3) and CYP3A4, the efflux pump MRP1, and MDR1
2-4-3 Three representative factors enhancing the treatment efficacy:
Influx pump ENT-1, CYP2B6, and AKR1B1
3. Results
3.1. Kaplan–Meier Survival Curves and Comparisons of Survival Outcomes Among Various Groups by the Log-Rank Test
3.1.1. Overall Survival of ALL Patients with and Without Various Prognostic Factors
As shown in
Figure 1, the median OS duration in the 19 patients was 57 months after the initial remission induction therapy, and the 5-year OS rate was 44%. A log-rank test was performed to compare the OS rates in relation to positive/negative tumor cell expressions of various factors involved in anticancer drug metabolism. There were no significant differences in the OS rates among the three patient groups classified according to the ALL MRC UKALL classification or between the groups that did and did not undergo allogeneic stem cell transplantation. However, a significant difference in the relapse rate within one year was seen between these latter two groups of patients.
3.1.2. Overall Survival of ALL Patients with and Without Expression of a Prognostic Factor by the Histological Immunostaining
As shown in
Figure 2, a log-rank test was performed to compare the OS rates in the ALL patients classified in accordance with the expression patterns of proteins involved in anticancer drug metabolism. The patients in this group showed significant differences in the patterns of expressions of AKR1B10 and AKR1C3. However, there were no significant differences in the OS rates among the patients with AKR1B1, MRP1, PD-L2 and CYP2B6.
3.1.3. Overall Survival of ALL Patients with and Without Expression of the Two Prognostic Factors by the Histological Immunostaining
As shown in
Figure 3, the results of univariate analyses showed that the decrease in OS rates differed significantly among patients showing different patterns of expression of AKR1C3, AKR1B10, AKR1B1 (a competitive inhibitor of AKR1B10), and MRP1, and the Philadelphia chromosome.
The OS rates differed significantly among patients showing different combinations of AKR1C3 and AKR1B10 expressions, AKR1B1 and AKR1B10 expressions, AKR1B10 and CYP2B6 expressions, MRP1 and AKR1C3 expressions, Philadelphia chromosome status and AKR1C3 expression.
3.2. Urayasu Classification for ALL
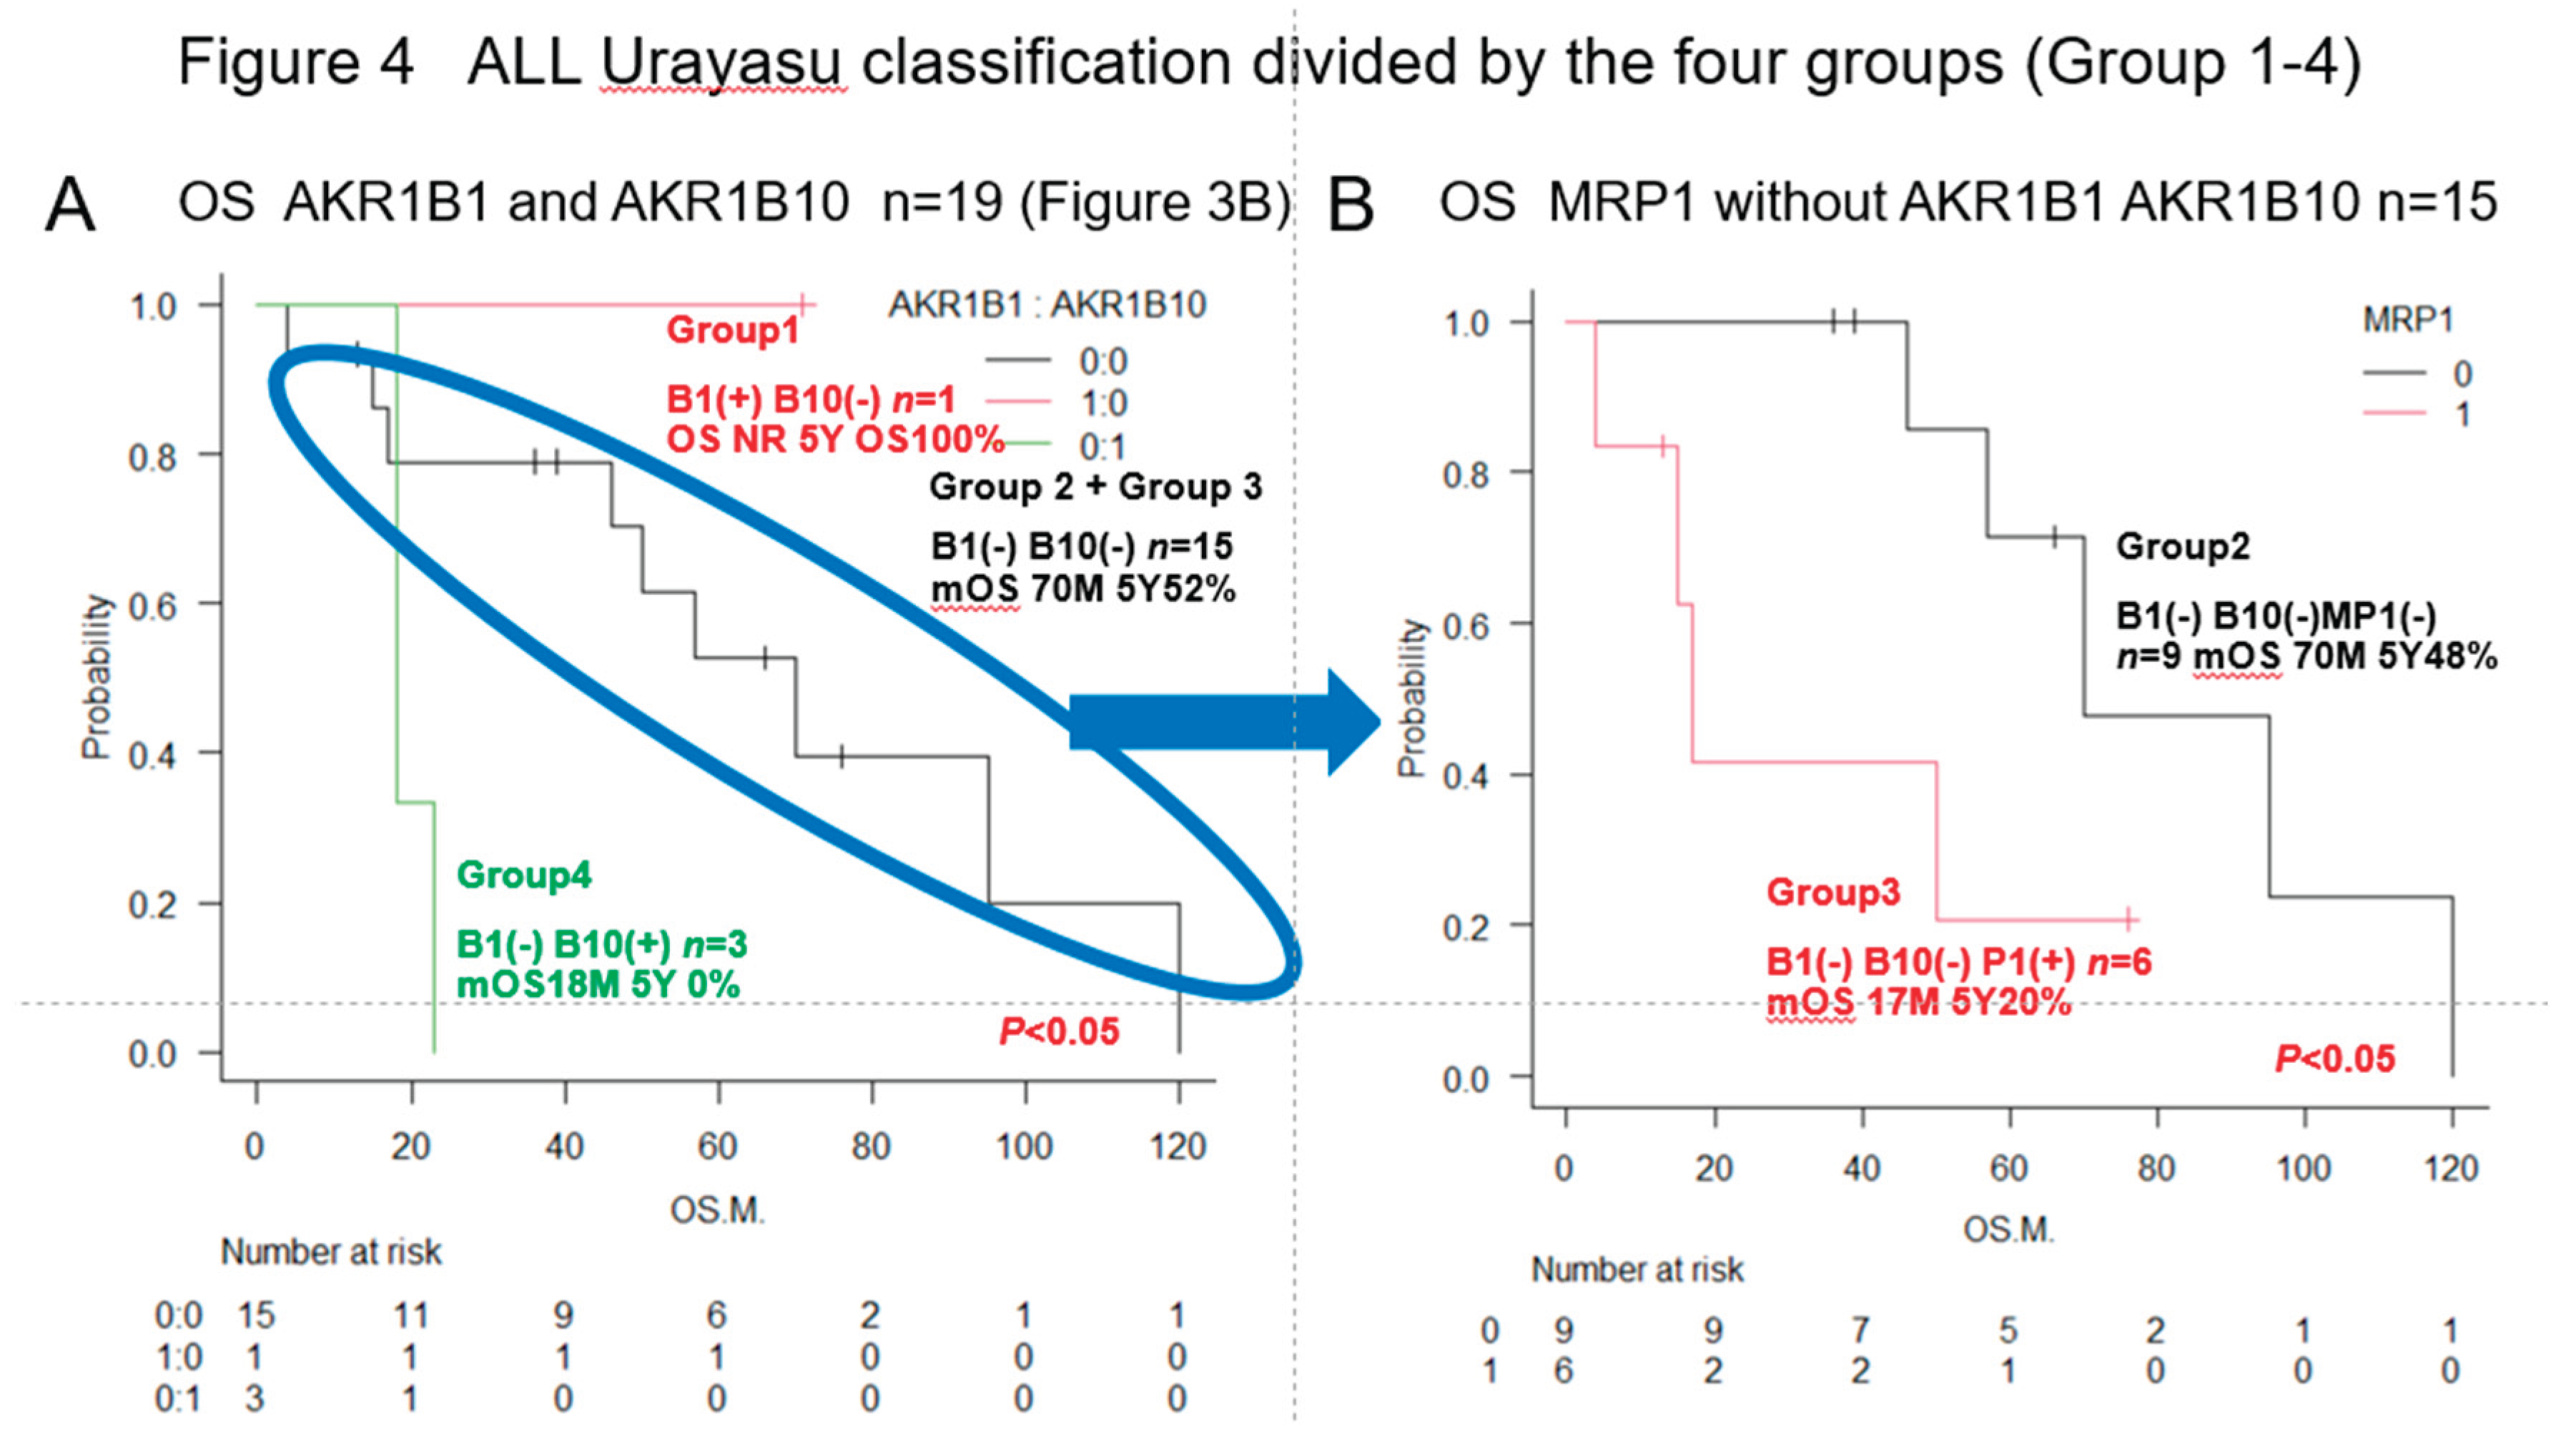
As shown in
Figure 4, we have proposed the Urayasu classification for ALL based on the expression patterns of the important treatment resistance factors (AKR1B1 and AKR1B10), in addition to the status of expression of MRP1. The classification is as follows:
. Group 1 (good prognosis group): AKR1B1(+) AKR1B10 (-), n =1
. Group 2: AKR1B1(-) AKR1B10(-) MRP(-), n=9
. Group 3: AKR1B1(-) AKR1B10(-) MRP(+), n=6
(Group 2 and Group 3 showed a more favorable prognosis than Group 4)
. Group 4 (poor prognosis group): AKR1B1(-) AKR1B10(+), n=3. Significant differences in the OS rates were observed among the four groups. These results are also shown in
Table 2.
Table 2 shows the results of immunohistochemical analysis for 23 treatment resistance factors. The median cumulative survival rate and 95% CI of the 19 cases of ALL1 calculated by the Kaplan-Meier method, as well as the results of intergroup comparison (p-value: log rank test) are shown. Poor prognostic factors were evaluated based on differences in the survival time of the patients. Significant (p<0.05) poor prognostic factors are marked with a (#). The outcomes were compared with those in the three groups of patients classified according to the MRC classification, which is the conventional prognostic classification.
All figures and tables should be cited in the main text as
Figure 1,
Table 1, etc.
3.4. Abstract Schema in this Study
Abstract schema of this study is shown in
Figure 6.
3-6
Summarization of the review of the literature (references 1-3) plus findings of this study (Figure 7)
This is a summary of the Urayasu classification based on treatment resistance
factors for four aggressive hematopoietic tumors.
Figure 7.
The r
eview of the literature (references 1-3) plus findings of this study. Regarding the relationship between treatment resistance factors in the Urayasu classification and this study's LBCL [
1], TCL [
2], AML [
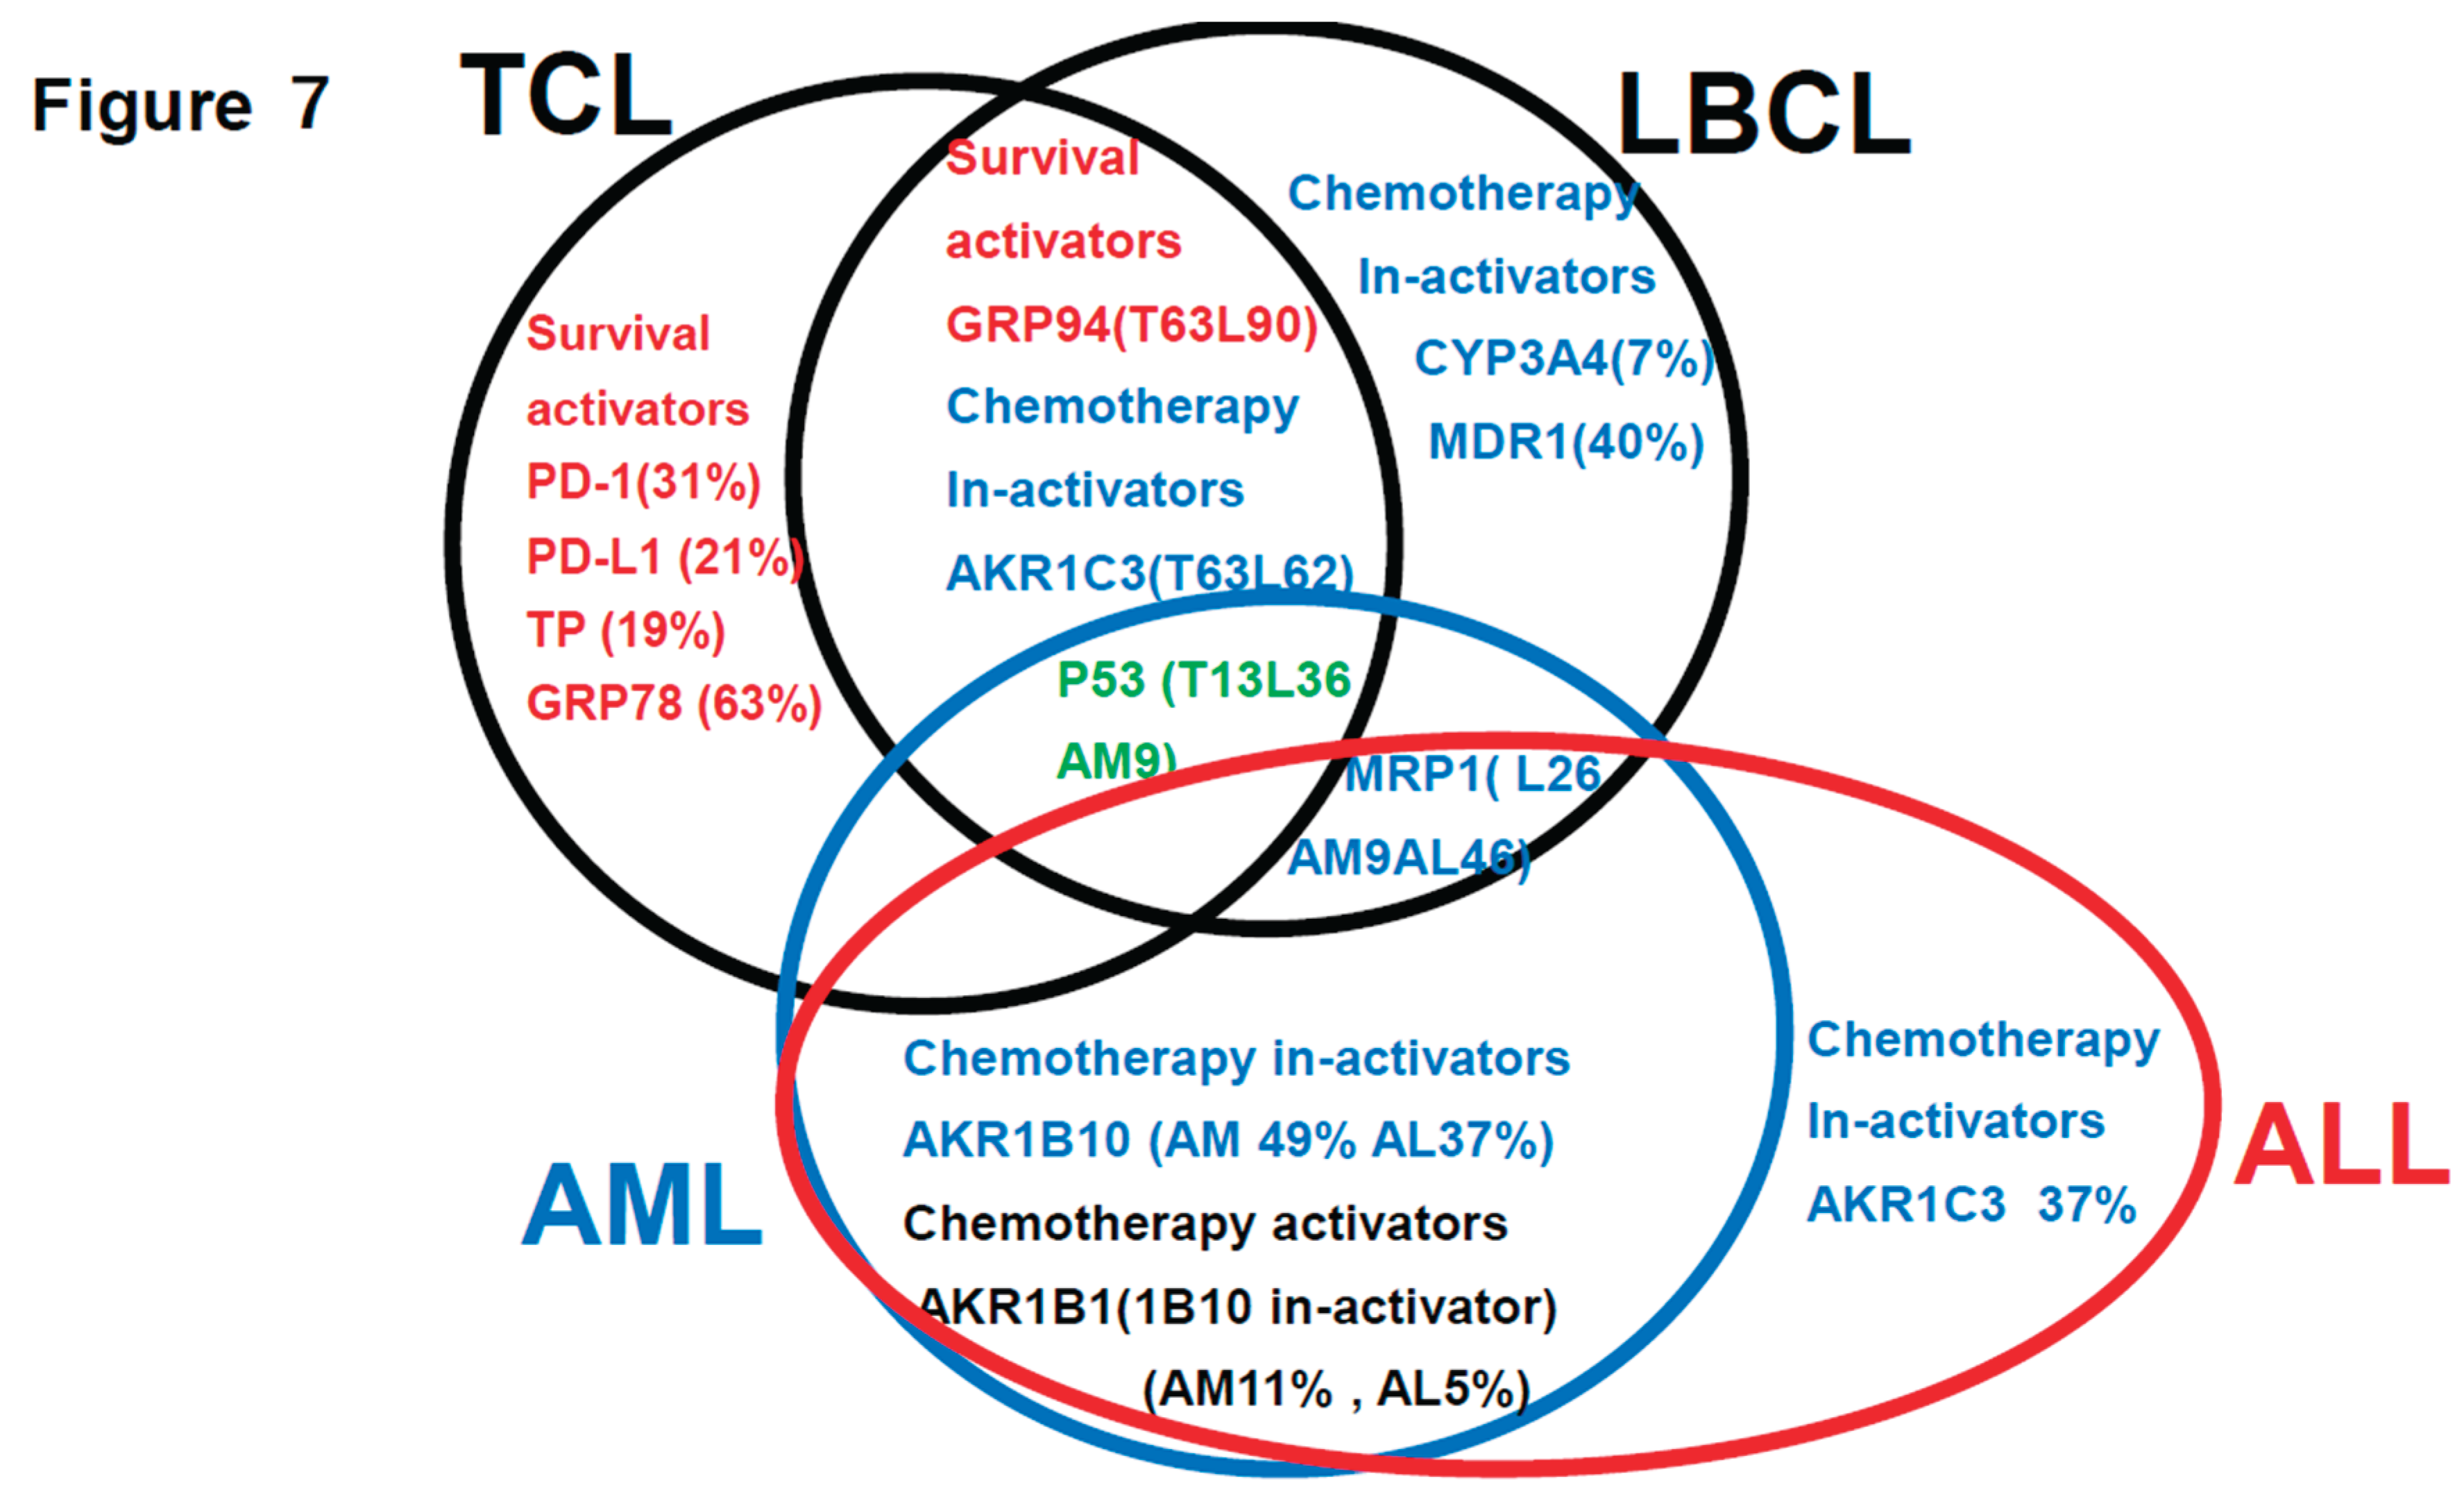
3], and ALL [this study] This is a summary of the Urayasu classification based on treatment resistance factors for four aggressive hematopoietic tumors. The prognostic significances of the treatment resistance factors in the Urayasu classification for LBCL (2), UC for TCL (3), UC for AML (4), and UC for ALL (current study) are summarized in a Venn diagram for each disease. There were no factors that were common to all four diseases. Common factors in the first three diseases were the growth factor P53 (LBCL 36%, TCL 13%, AML 9%), which was more prevalent in LBCL, the efflux pump MRP1 (LBCL 25%, AML 9%, ALL 46%), and AKR1C3, the enzyme that metabolizes doxorubicin, methotrexate, vincristine, and dasatinib (LBCL, TCL, ALL). Common to LBCL, TCL were the microenvironmental adaptation factor, ER stress protein GRP94, and common to AML and ALL was AKR1B10, which metabolizes idarubicin, daunorubicin, cyclophosphamide, and cisplatin. Dasatinib inhibits AKR1B10. The tyrosine kinase inhibitor ibrutinib inhibits AKR1C3, thereby inhibiting doxorubicin metabolism and showing promise for potential therapeutic application. Five survival activators (PD-1, PD-L1, TP, GRP78, and GRP94), which are microenvironmental factors, are also important in TCL. CYP3A4, which detoxifies doxorubicin, and the doxorubicin efflux pump MDR1 are important in LBCL. The HO efflux pump MRP1 is more frequently expressed in ALL, AML, and LBCL than in TCL, which is dependent on microenvironmental adaptation factors. P53 is involved in many diseases other than ALL. However, the poor prognosis of TCL is largely due to p53 expression. p53 is an important tumor suppressor, and loss of p53 function due to mutations or other factors leads to cancer development. p53 mutations occur in more than 50% of human cancers. However, currently, no drugs have been approved for the clinical treatment of cancers expressing mutant p53. LBCL, AML, and TCL are most frequently positive for AKR1C3, an enzyme that inactivates doxorubicin, cyclophosphamide, and vincristine (AML 17/35: 46%, TCL 6/16: 38%, LBCL 26/42: 62%). Based on these findings, while R-CHOP and Pola-RCHP regimens are standard therapies, many LBCL tumors express AKR1C3, which may contribute to treatment resistance. AML patients with P53 (3/35 9%) or MRP1 (1/35 3%) mutations show a poor prognosis. Although the incidence rate is low (12%), even with combined treatment, MRP1 inhibitors have been developed. In addition to significant microenvironmental factors in TCL, AML cells can express AKR1B10, a drug that metabolizes the anthracycline anticancer drug idarubicin, which can result in treatment resistance. AKR1B1 shares 70.6% amino acid sequence identity with AKR1B10 and shares highly similar structure and substrate specificity. Many compounds that inhibit AKR1B10 also competitively inhibit AKR1B1 to a similar degree, reducing AKR1B10 activity and reversing treatment resistance. The Abl tyrosine kinase inhibitor dasatinib inhibits AKR1B10, inhibiting daunomycin and idarubicin metabolism, offering promise for potential therapeutic application. AKR1B10 is believed to be the primary pathway underlying cisplatin and cyclophosphamide resistance.29 In fact, caution is required in the case of AKR1B10-positive ALL, in which high-dose cyclophosphamide therapy used as a conditioning regimen for allogeneic hematopoietic stem cell transplantation may show reduced efficacy. Furthermore, AKR1B10 is regulated by a gene on chromosome 7q33. Loss of chromosome 7 may result in the activation of AKR1B10. Meanwhile, TCL has a superior ability to adapt to the microenvironment, and LBCL is also thought to have a superior ability to detoxify anticancer drugs.
Figure 7.
The r
eview of the literature (references 1-3) plus findings of this study. Regarding the relationship between treatment resistance factors in the Urayasu classification and this study's LBCL [
1], TCL [
2], AML [
3], and ALL [this study] This is a summary of the Urayasu classification based on treatment resistance factors for four aggressive hematopoietic tumors. The prognostic significances of the treatment resistance factors in the Urayasu classification for LBCL (2), UC for TCL (3), UC for AML (4), and UC for ALL (current study) are summarized in a Venn diagram for each disease. There were no factors that were common to all four diseases. Common factors in the first three diseases were the growth factor P53 (LBCL 36%, TCL 13%, AML 9%), which was more prevalent in LBCL, the efflux pump MRP1 (LBCL 25%, AML 9%, ALL 46%), and AKR1C3, the enzyme that metabolizes doxorubicin, methotrexate, vincristine, and dasatinib (LBCL, TCL, ALL). Common to LBCL, TCL were the microenvironmental adaptation factor, ER stress protein GRP94, and common to AML and ALL was AKR1B10, which metabolizes idarubicin, daunorubicin, cyclophosphamide, and cisplatin. Dasatinib inhibits AKR1B10. The tyrosine kinase inhibitor ibrutinib inhibits AKR1C3, thereby inhibiting doxorubicin metabolism and showing promise for potential therapeutic application. Five survival activators (PD-1, PD-L1, TP, GRP78, and GRP94), which are microenvironmental factors, are also important in TCL. CYP3A4, which detoxifies doxorubicin, and the doxorubicin efflux pump MDR1 are important in LBCL. The HO efflux pump MRP1 is more frequently expressed in ALL, AML, and LBCL than in TCL, which is dependent on microenvironmental adaptation factors. P53 is involved in many diseases other than ALL. However, the poor prognosis of TCL is largely due to p53 expression. p53 is an important tumor suppressor, and loss of p53 function due to mutations or other factors leads to cancer development. p53 mutations occur in more than 50% of human cancers. However, currently, no drugs have been approved for the clinical treatment of cancers expressing mutant p53. LBCL, AML, and TCL are most frequently positive for AKR1C3, an enzyme that inactivates doxorubicin, cyclophosphamide, and vincristine (AML 17/35: 46%, TCL 6/16: 38%, LBCL 26/42: 62%). Based on these findings, while R-CHOP and Pola-RCHP regimens are standard therapies, many LBCL tumors express AKR1C3, which may contribute to treatment resistance. AML patients with P53 (3/35 9%) or MRP1 (1/35 3%) mutations show a poor prognosis. Although the incidence rate is low (12%), even with combined treatment, MRP1 inhibitors have been developed. In addition to significant microenvironmental factors in TCL, AML cells can express AKR1B10, a drug that metabolizes the anthracycline anticancer drug idarubicin, which can result in treatment resistance. AKR1B1 shares 70.6% amino acid sequence identity with AKR1B10 and shares highly similar structure and substrate specificity. Many compounds that inhibit AKR1B10 also competitively inhibit AKR1B1 to a similar degree, reducing AKR1B10 activity and reversing treatment resistance. The Abl tyrosine kinase inhibitor dasatinib inhibits AKR1B10, inhibiting daunomycin and idarubicin metabolism, offering promise for potential therapeutic application. AKR1B10 is believed to be the primary pathway underlying cisplatin and cyclophosphamide resistance.29 In fact, caution is required in the case of AKR1B10-positive ALL, in which high-dose cyclophosphamide therapy used as a conditioning regimen for allogeneic hematopoietic stem cell transplantation may show reduced efficacy. Furthermore, AKR1B10 is regulated by a gene on chromosome 7q33. Loss of chromosome 7 may result in the activation of AKR1B10. Meanwhile, TCL has a superior ability to adapt to the microenvironment, and LBCL is also thought to have a superior ability to detoxify anticancer drugs.
3.7. Review of the Literature on the Drug-Resistance Mechanisms in Hematopoietic Malignancies
Table 3 shows the results of
the literature on the drug-resistance mechanisms in hematopoietic malignancies. We conducted a literature search to examine the relationship between each functional protein (row) that affects the concentration of each anti-hematologic malignancy agent (column) in the tumor cells.
As shown in
Figure 8, a summary of the prognostic factors associated with treatment resistance in LBCL [
1], TCL [
2], AML [
3], and ALL (current study) in an easy-to-understand Venn diagram with four circles in the literature.
4. Discussion
Among the mechanisms of resistance to anticancer drugs in hematopoietic malignancies, those involving a decrease in intracellular anticancer drug concentrations appear to be especially important, although there have been no comprehensive investigations of their association with clinical treatment resistance. In this study, we focused on the following mechanisms that can reduce the intracellular drug concentrations of anticancer drugs: 1) enhanced activities of anticancer drug efflux mechanisms; 2) suppressed activities of drug influx mechanisms; 3) enhanced activities of drug detoxification pathways; and 4) influence of the tumor microenvironment. In the following sections 4-1 to 4-3, we describe our study conducted in 19 cases of ALL (42 cases of LBCL in Reference 2, 16 cases of TCL in Reference 3, and 35 cases of AML in Reference 4) that underwent initial induction therapy at our hospital; we performed immunohistochemical analysis for 23 resistance-associated proteins in tumor specimens obtained from these patients. We retrospectively analyzed the correlations between the OS duration/rate of the patients and results of the immunohistochemical analyses by the Kaplan-Meier method. In section 4-4, we summarize the results of a literature search conducted by us to review the proposed drug resistance mechanisms in hematopoietic malignancies. Based on the clinical study and review of the literature, we have comprehensively demonstrated associations between the mechanisms of treatment resistance involving a decrease in intracellular anticancer drug concentrations and clinical treatment resistance.
In general, immunohistochemistry is considered as being an extremely useful tool, as it allows for determinations of positive/negative results based on the observation of tumor cells under an optical microscope. Positivity is defined as positive staining, including weakly positive staining, in ≥50% of tumor cells. In this study of ALL patients, we performed immunohistochemical analyses in tumor specimens obtained from 19 cases of ALL for 23 treatment resistance factors (6-34) determined as being clinically important based on a review of the literature (
Table 1). In this cohort of ALL patients, there were no significant differences in the OS among patient groups classified according to the MRC UK ALLXIIECOG E2993 classification (
Figure 1B–D). However, as shown in
Figure 4A,B, the Urayasu classification for ALL allowed reliable prognostic stratification of the patients, with significant differences in the OS observed among the patients classified into the four groups according to this classification. Therefore, chemotherapy resistance factors are more specific for prognostic classification of ALL. We propose the Urayasu classification (UC) for ALL as a useful classification for predicting the outcomes after Hyper CVAD/MA therapy in newly diagnosed ALL patients (
Figure 4A,B). The UC for ALL (groups 1 to 4) is shown below. In this study, the overall 5-year OS rate of the patients (n=19) was approximately 43%. The 5-year OS rate of patients (n=1521) classified by the MRC UKALLXIIECOG E2993 classification was approximately 38.5% (5). The 5-year OS rate was 100% in UC Group 1 (favorable prognosis group; AKR1B10(-) AKR1B1(+); n=1) versus 57% in the MRC UKALLXIIECOG E2993- Ph-negative Standard group. The 5- year OS was 48% in UC Group 2 (intermediate-1 prognosis group; AKR1B10(-) AKR1B1(-) MRP1(-); n=9) versus 35% in the MRC UKALLXIIECOG E2993-Ph-negative High group (n=594). The 5-year OS was 20% in UC Group 3 (intermediate-2; AKR1B10(-) AKR1B1(-) MRP1(+); n=6). The 5-year OS rate was 0% in Group 4 (poor prognosis group; AKR1B10(+) AKR1B1(-); n=3). As seen from the above, although the number of cases was small, the UC for ALL allows more reliable prognostic classification of patients into good- and poor-prognosis groups as compared with the UKALLXIIECOG E2993 classification (
Figure 1B,C). We believe that this classification could contribute to stratification of treatment and promote development of treatment methods based on the mechanisms of treatment resistance.
4-2. Discussion based on the study of ALL cases (Figure 5)
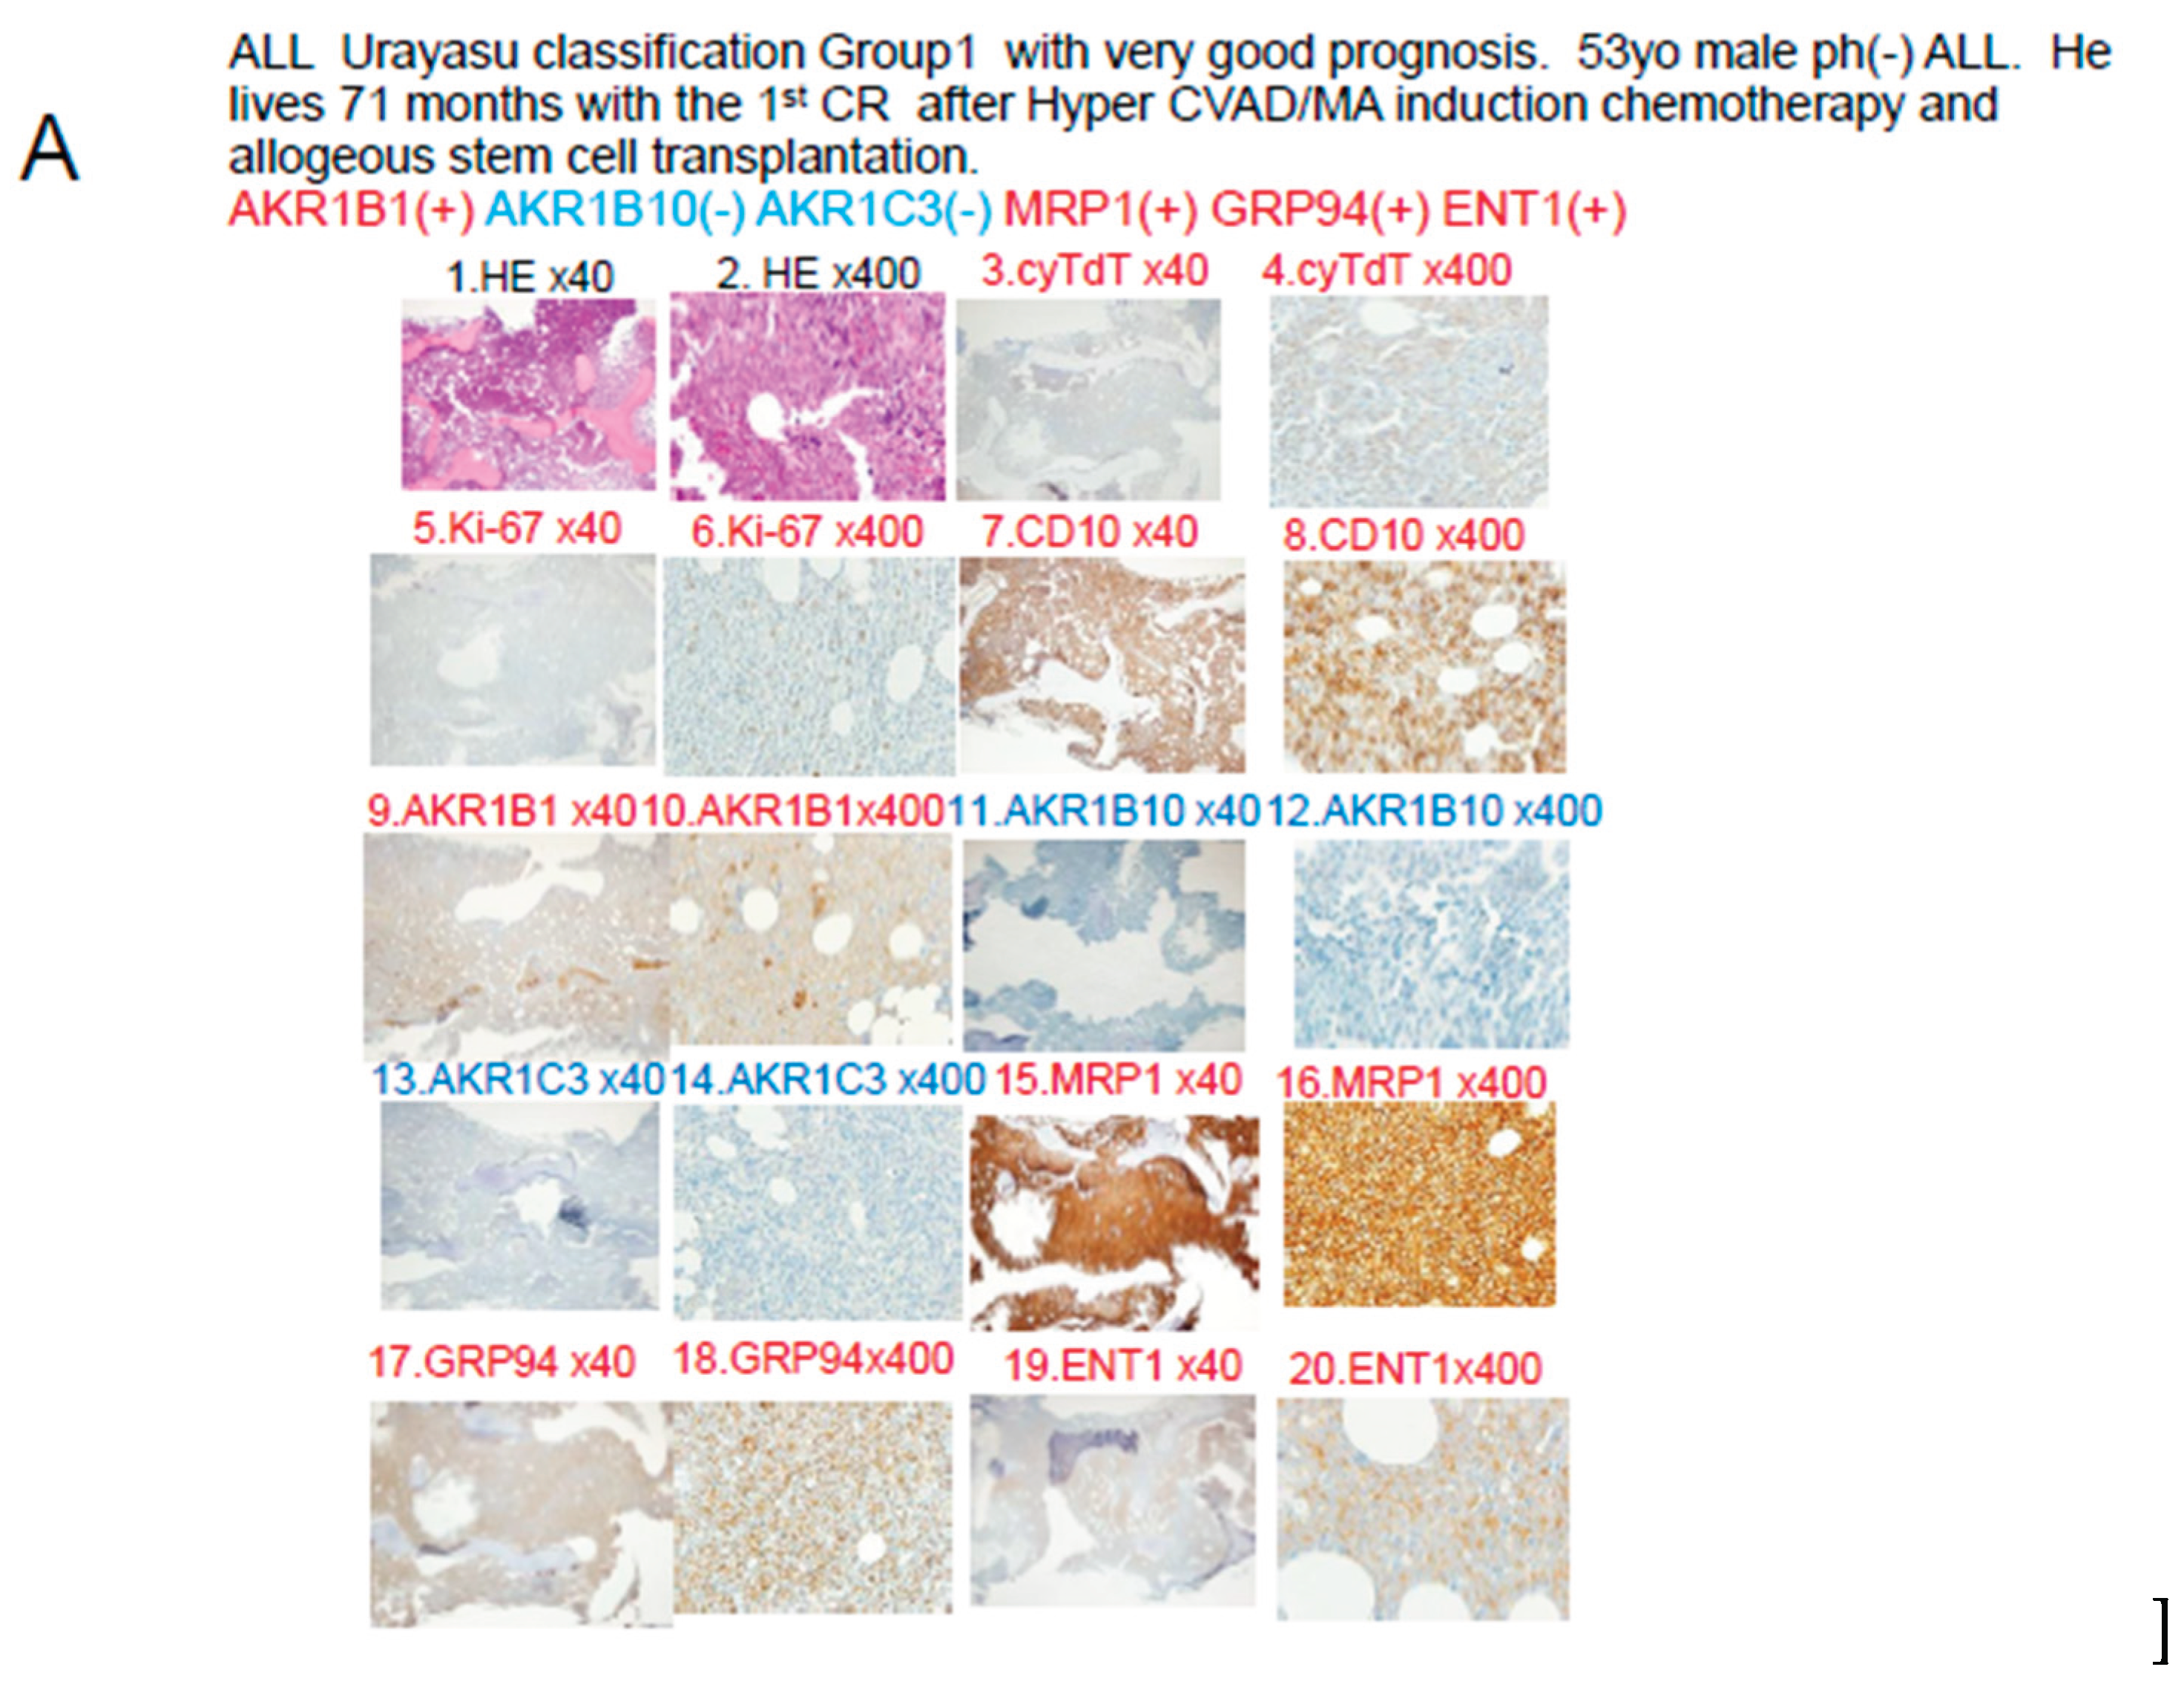
In Case 1 (
Figure 5A), the blast cells at the time of diagnosis showed positive IHC staining for the factors known to enhance the therapeutic efficacy AKR1B1 and ENT1. The therapeutic inhibitors were negative for AKR1B10, AKR1C3, and CYP3A4, but positive staining for MRP1. The tumor was negative for AKR1B10 and AKR1C3, and the staining result was negative for enzyme AKR1. The patient was classified into Group 1 of the UC for ALL. See
Table 3,
Figure 6 and
Figure 8. The tumor was positive for the metabolic enzyme AKR1B1, suppressed for AKR1B10, and negative for AKR1B10 and AKR1C3. Thus, dasatinib, cyclophosphamide, doxorubicin, vincristine, and methotrexate were expected to be effective, and proved to be effective even in the presence of expression of the efflux pump MRP1. Cytarabine and methotrexate may have been highly effective as the positive tumor cell expression of the influx pump ENT1 would have allowed large amounts of these drugs to be taken up by the tumor cells. It is believed that complete remission was achieved quickly after Hyper CVAD/MA therapy and maintained for a long period of time based on the above pattern of expression of the prognostic factors.
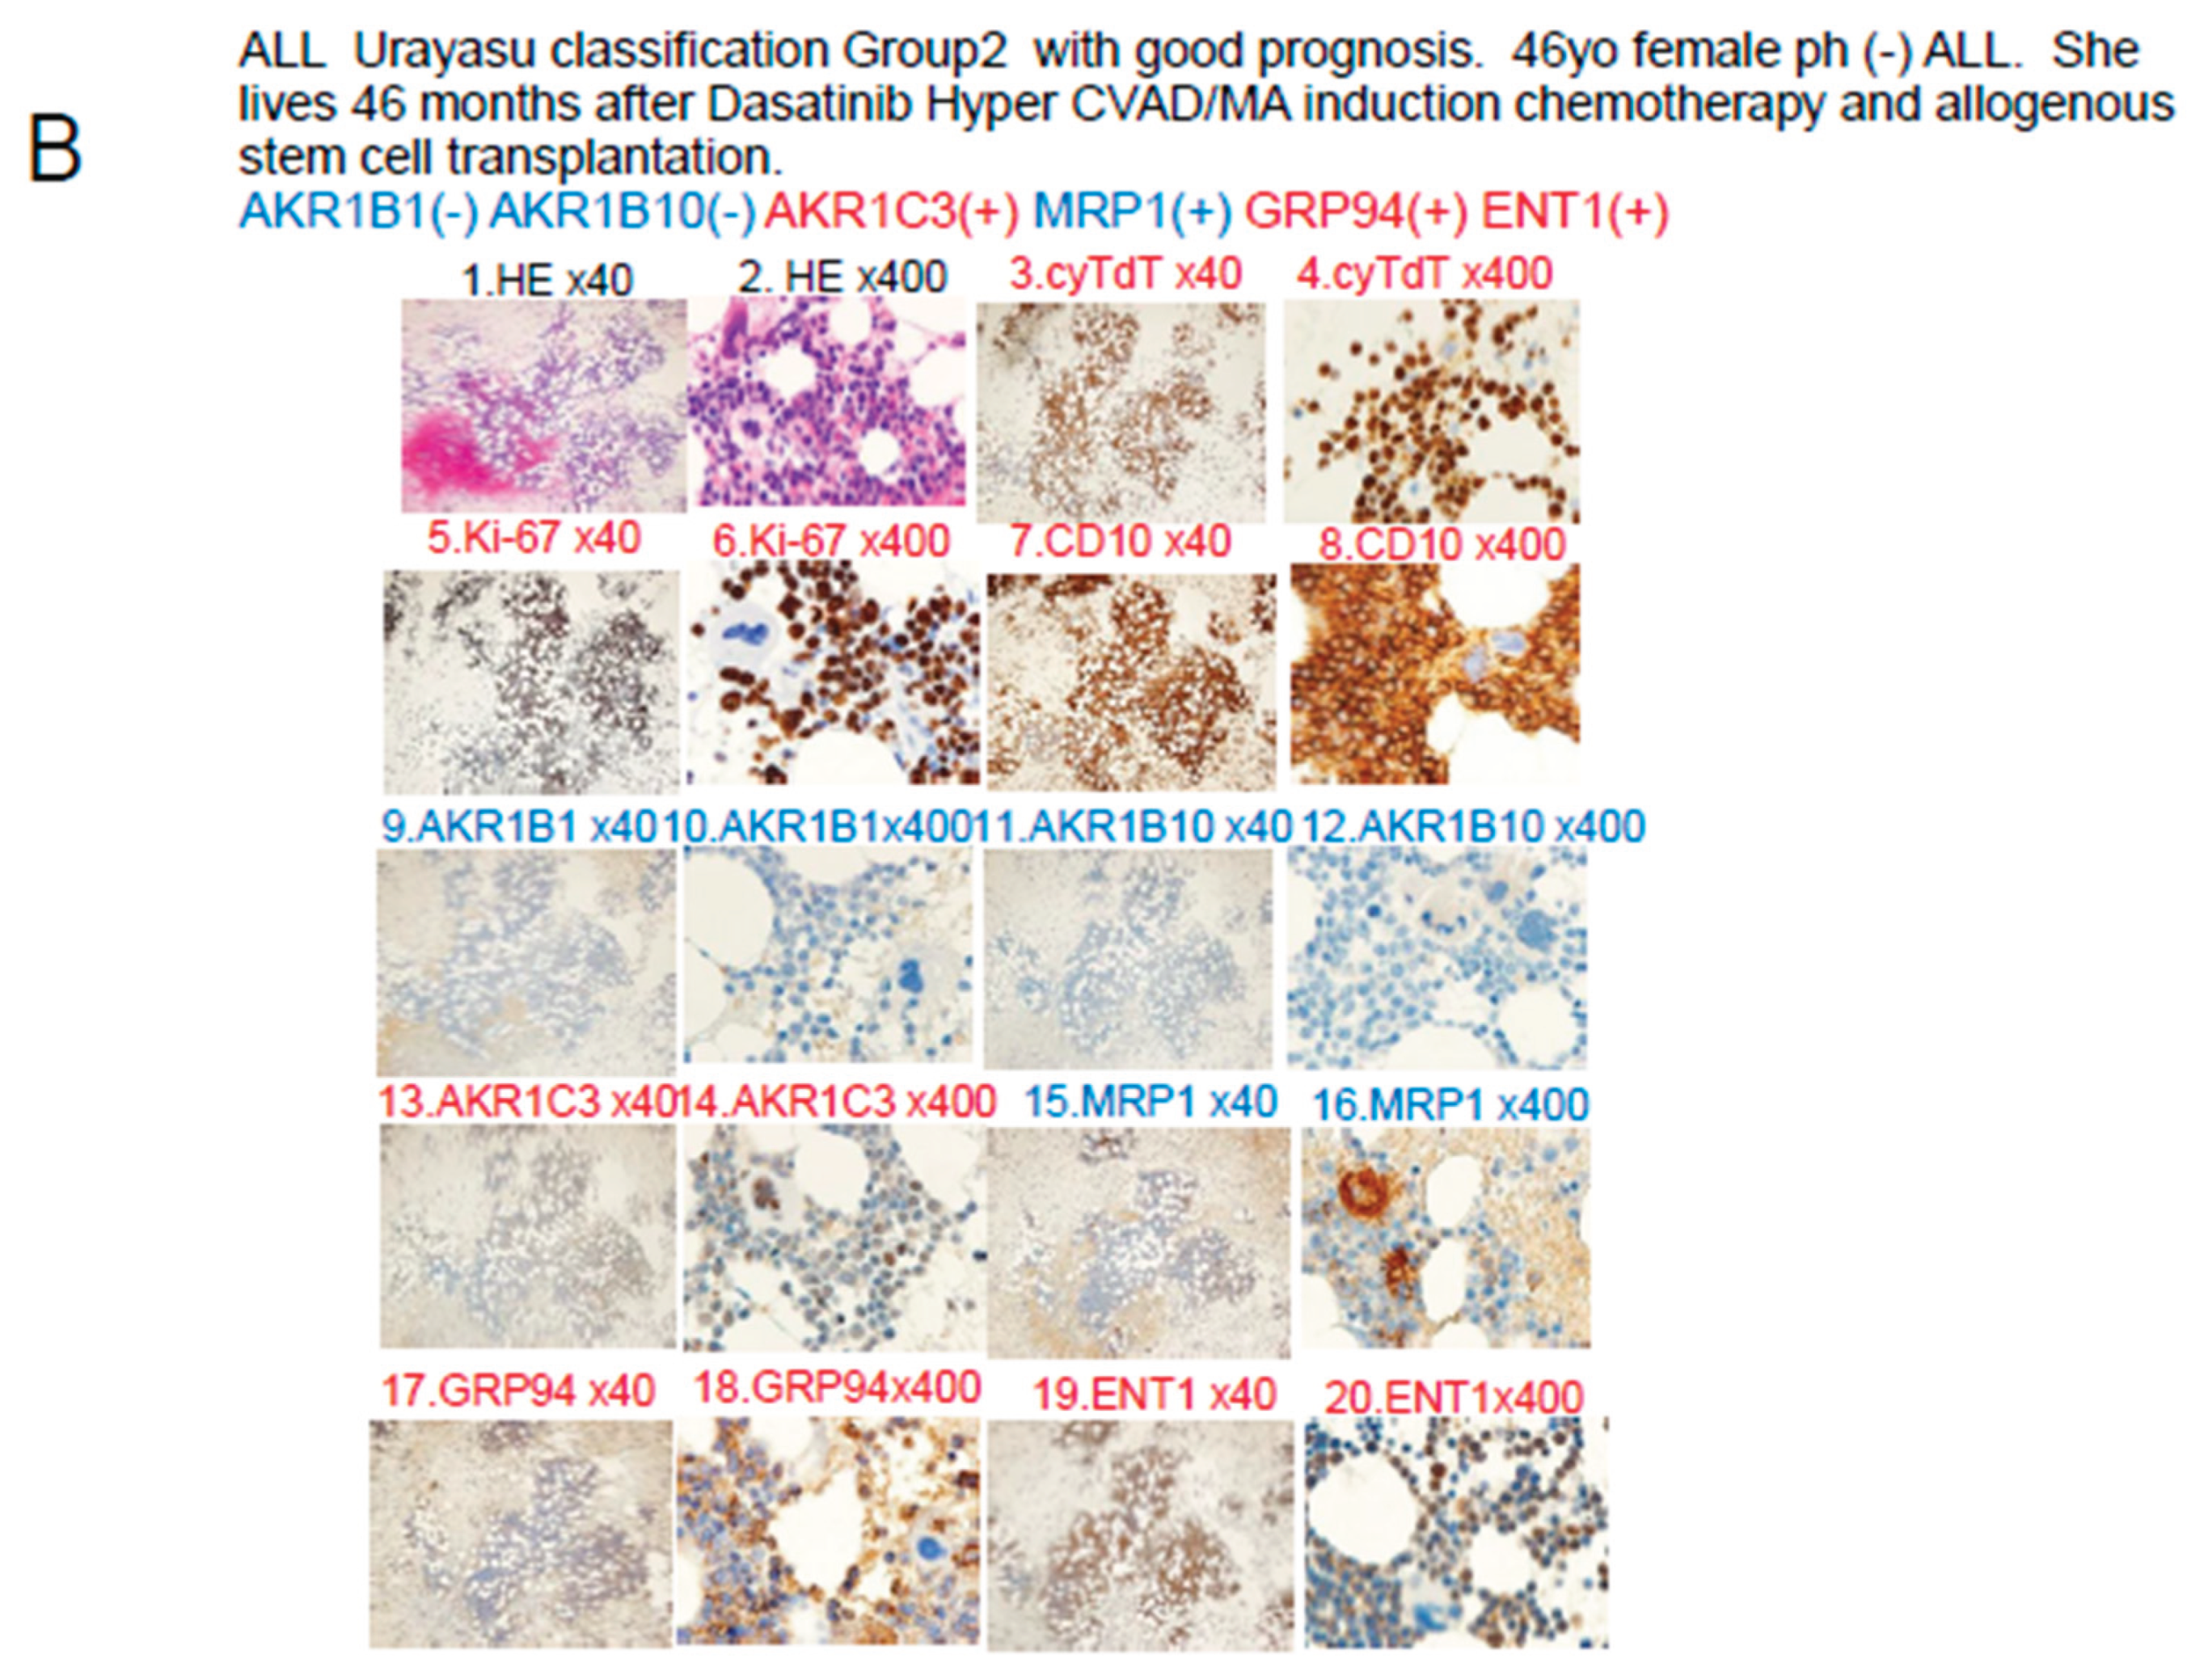
In Case 2 shown in
Figure 5B, the blast cells at diagnosis were AKR1B1(-), AKR1B10(-), and MRP1(-), so that the patient was classified into Group 2 of the UC for ALL. Please refer to
Table 3,
Figure 6 and
Figure 8. In regard to the expressions of drug-metabolic enzymes, the tumor was AKR1B10(-), but showed weakly positive staining for AKR1C3. The weak AKR1C3 positivity resulted in some degree of metabolism of dasatinib, doxorubicin, vincristine, and methotrexate. However, cyclophosphamide was highly effective because of the AKR1B10(-). Furthermore, cytarabine and methotrexate may have been highly effective as the positive tumor ENT1 expression would have allowed large amounts of these drugs to be taken up by the tumor cells. It is believed that the patient achieved complete remission after Hyper CVAD/MA therapy based on the above pattern of expression of the prognostic factors. However, because of the weak tumor cell positivity for AKR1C3, there was residual disease and early recurrence occurred approximately 6 months later. Radiation and cyclophosphamide, which are conditioning treatments for allogeneic hematopoietic stem cell transplantation after relapse, were effective because the tumor cells were negative for AKR1B10, which is a major radiation therapy resistance factor and the main cyclophosphamide-metabolizing enzyme. This is thought to be why the patient achieved long-term complete remission after allogeneic hematopoietic stem cell transplantation.
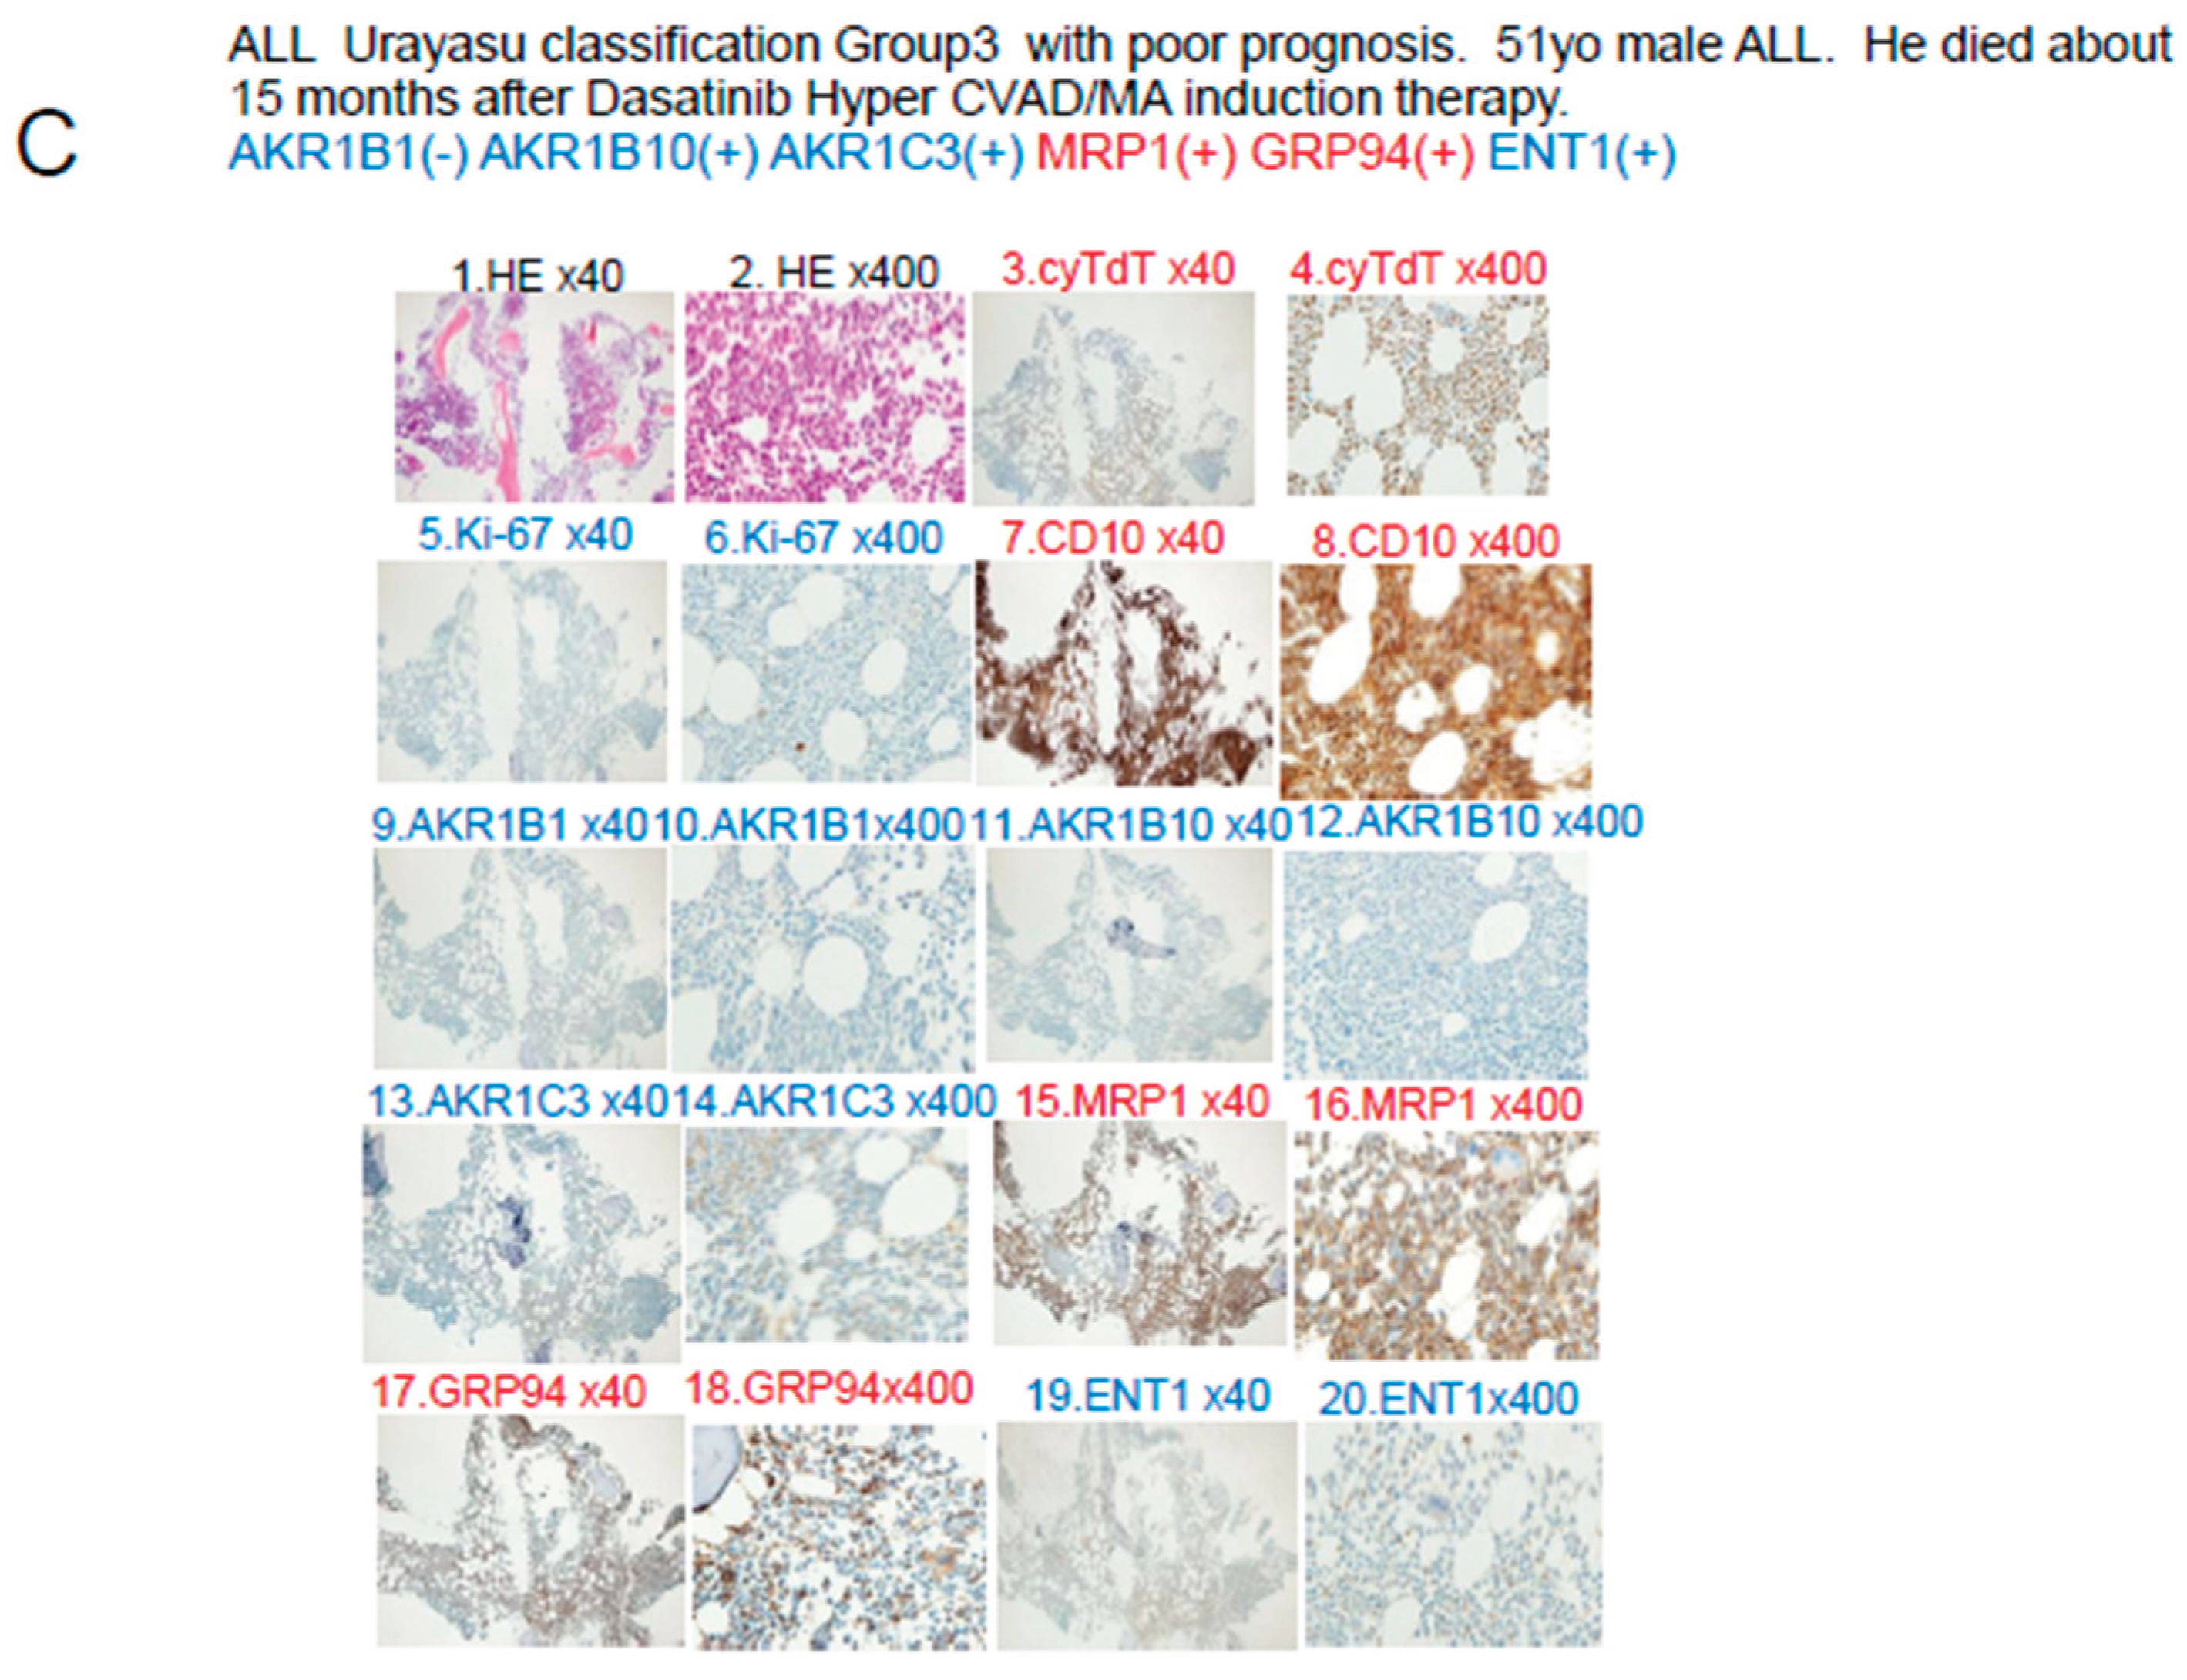
The blast cells at diagnosis in Case 3 shown in
Figure 5C were AKR1B1(-), AKR1B10(-), and MRP1(+), so that the patient was classified into Group 3 of the UC for ALL. See
Table 3. In regard to the expressions of drug-metabolic enzymes, the tumor cells were AKR1B10(-) and AKR1C3(-), so that the treatment was effective. However, due to the MRP1 positivity, dasatinib, doxorubicin, vincristine, and methotrexate were excreted from the tumor cells, which may have resulted in unsustained complete remission. The patient eventually developed disease relapse and received ponatinib plus VP therapy, which was not very effective. It was presumed that none of the drugs other than prednisolone was effective, because they were excreted from the tumor cells by the MRP1 pump, which led to disease progression and eventual death of the patient.
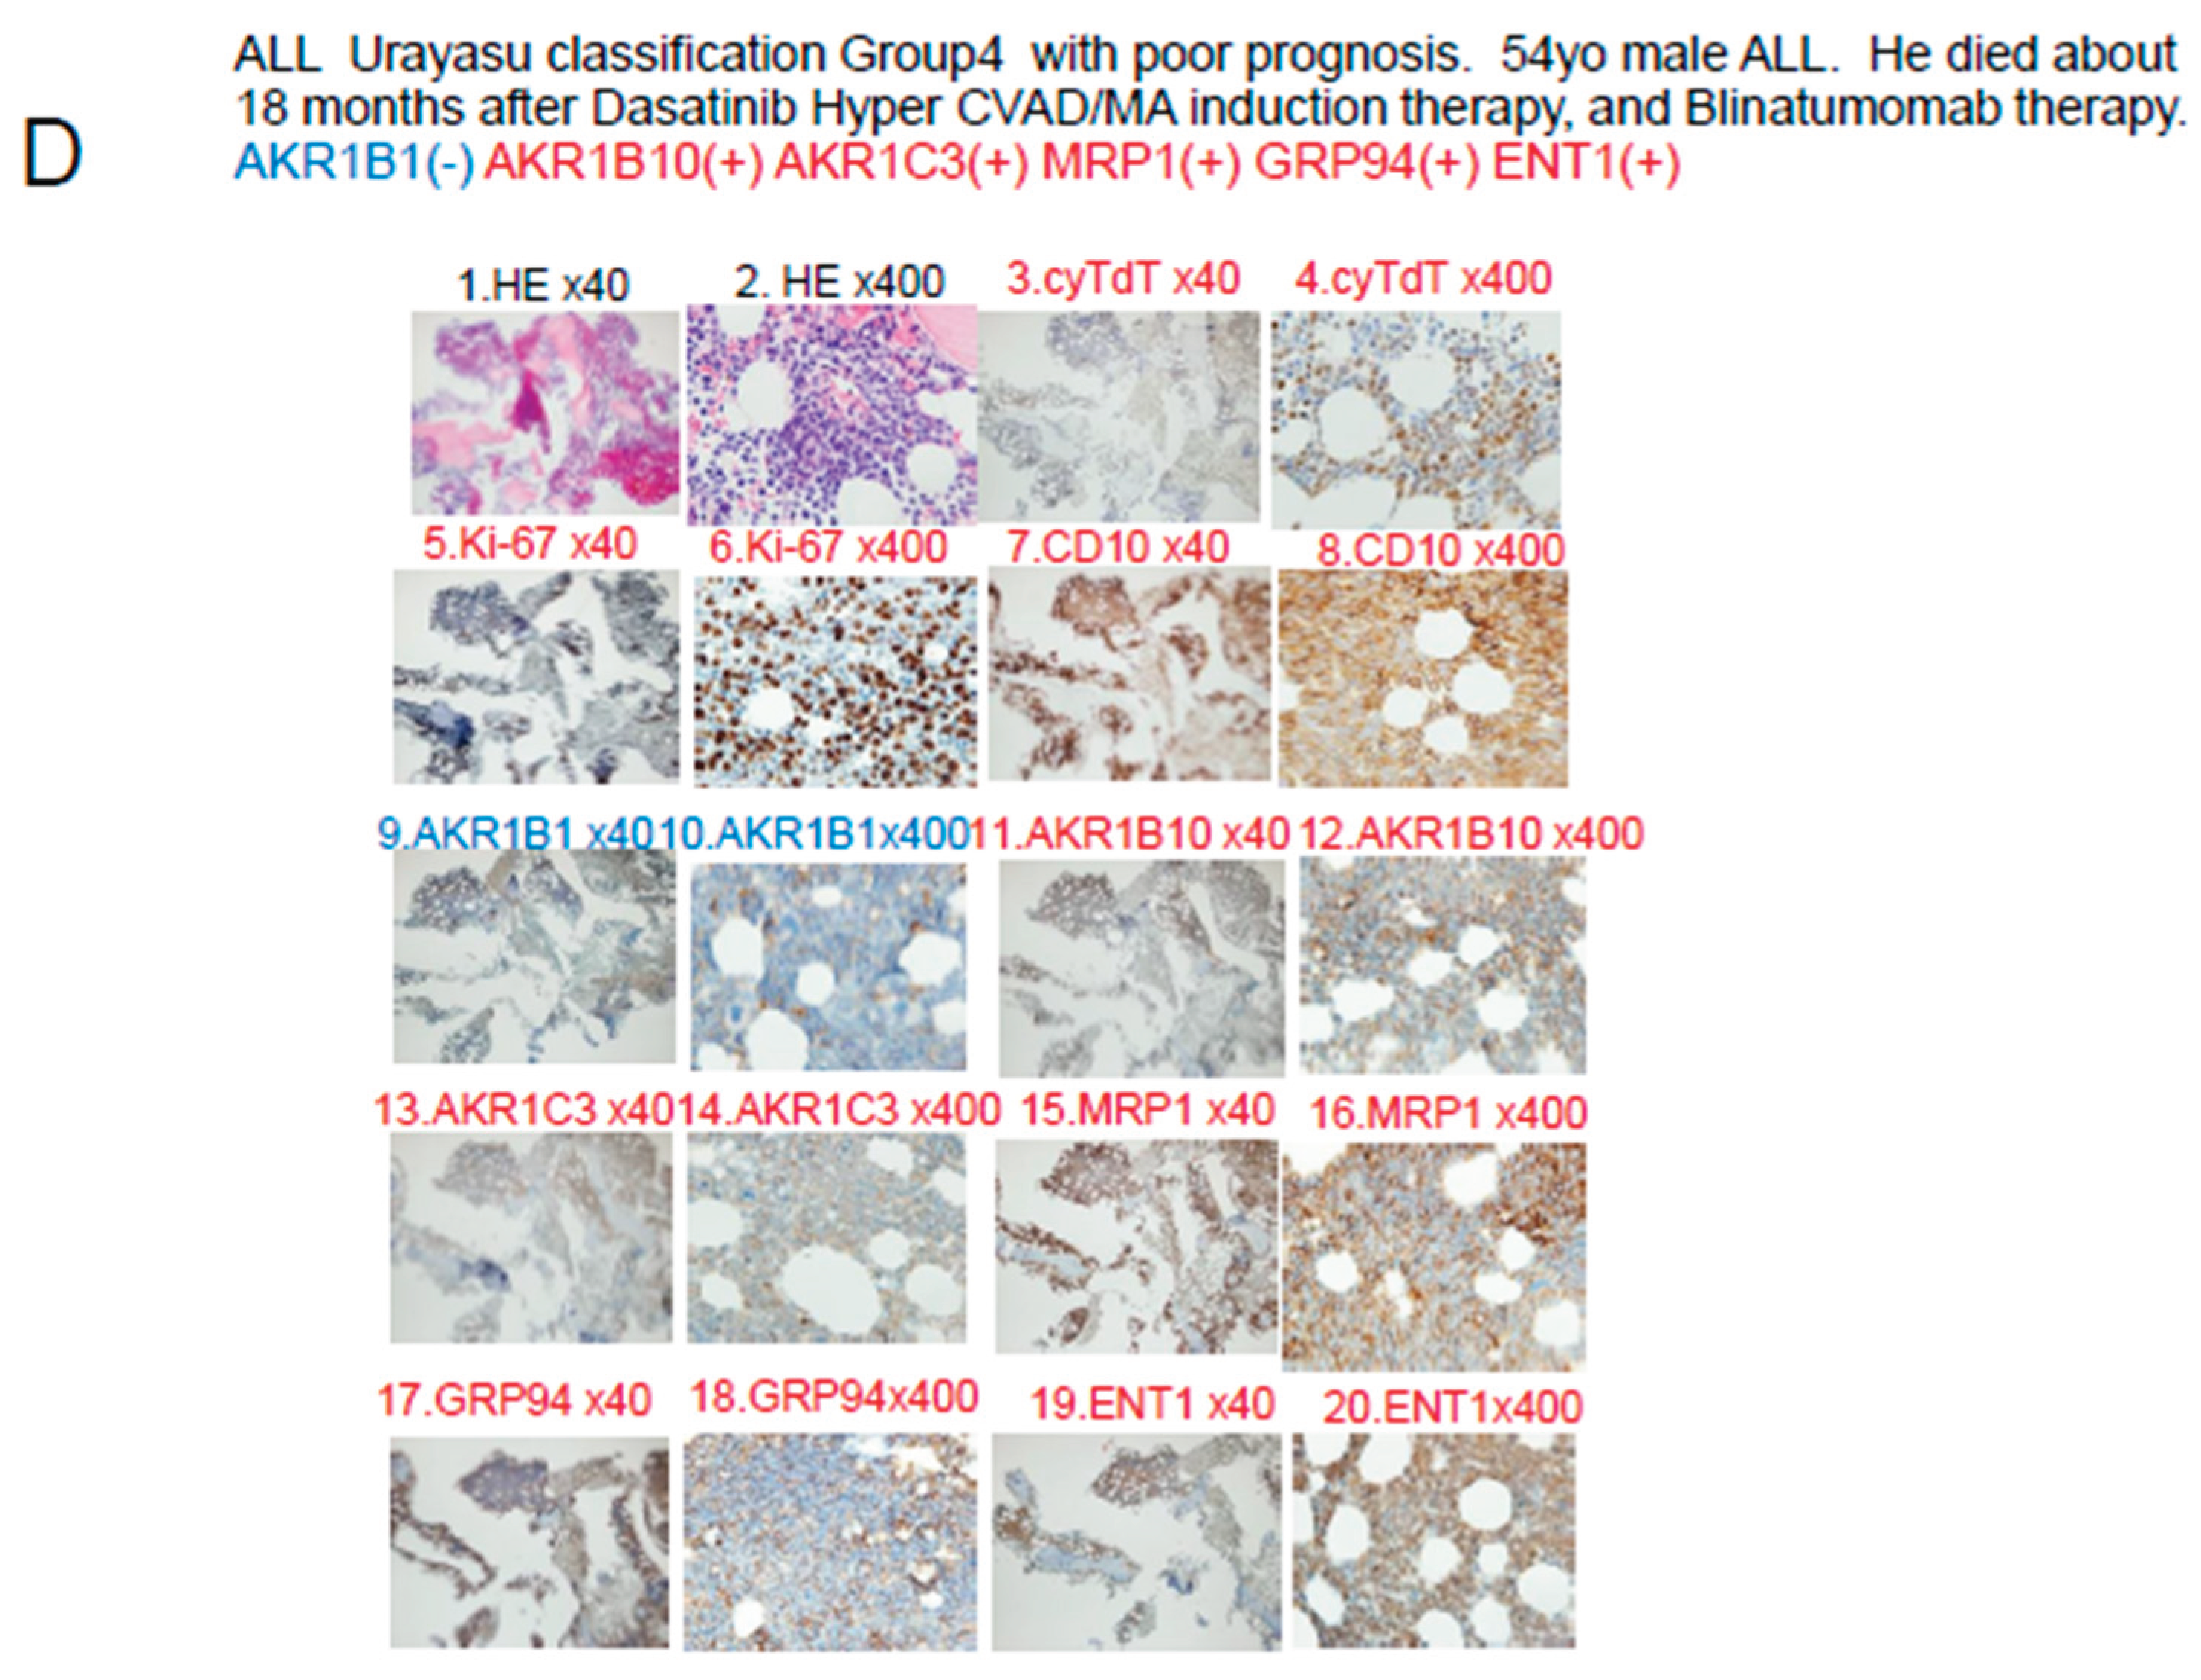
In Case 4 shown in
Figure 5D, the blast cells at diagnosis were AKR1B1(-) and AKR1B10(+), so that the patient was classified into Group 4 of the UC for ALL. Please refer to
Table 3. In regard to the expressions of drug-metabolic enzymes, the tumor cells were AKR1B10(+) and AKR1C3(+), and were therefore resistant to treatment. Metabolism of dasatinib, cyclophosphamide, doxorubicin, vincristine, and methotrexate was accelerated, and since the cells were also MRP1(+), these anticancer drugs were also excreted from the tumor cells, resulting in resistance to treatment. However, cytarabine was effective as the positivity of the tumor cells for ENT1(+) would have allowed large amounts of the drug to be taken up by the cells, and unsustained complete remission was achieved at one point. However, thereafter, the patient showed early disease relapse and the tumor burden was large, so that complete remission was not achieved even with ponatinib + Hyper CVAD/MA therapy, and the disease progressed, resulting in the death of the patient.
4-3. Discussion based on the study of ALL cases (Figure 6)
Figure 6 discusses the effects of the expression patterns of the enzymes in Groups 1-4 of the UC for ALL described in
Figure 4. For LBCL, TCL, and ALL, for which CHOP-like regimens are often selected as the initial regimens, the expression statuses of the HO (hydroxyl doxorubicin, oncovin)-metabolizing enzymes AKR1C3 and AKR1B10 are important. These enzymes are also involved in methotrexate metabolism. AKR1B10 plays a central role in cyclophosphamide metabolism. Furthermore, it is reasonable to assume that dasatinib has an AKR1B10-inhibitory effect in Ph-positive ALL cases. All drugs but cyclophosphamide are excreted by the MRP1 pump. Cytarabine enters the cells via the ENT-1 pump.
4-4 Discussion based on the findings of both our previous studies [
1,
2,
3]
and this study (Figure 7)
Figure 7 summarizes the prognostic factors for aggressive hematopoietic tumors determined from previous studies (references 1-3) and this present study of ALL. Treatment resistance factors include microenvironmental factors and factors reducing the tumor cell concentrations of anticancer drugs. (1) LBCL: According to reference 1, the median survival time (OS) was 64 months, and microenvironmental factors included a high expression rate of GRP94 (90%) of factors reducing the intracellular concentrations of anticancer drugs (CYP3A4 7%, AKR1C3 62%, AKR1B10 62%, MDR1 40%, MRP1 26%), and of P53 (36%), all of which are treatment resistance factors. (2) TCL: According to reference 2, the OS was 34 months, representing a poor prognosis. Treatment resistance factors were mainly factors related to the tumor microenvironment (GRP94 63%, GRP78 63%, PD-1 31%, PD-L1 24%, TP 19%). Therefore, even if complete remission is achieved with standard chemotherapy alone, recurrence is likely to develop even if there is minimal residual disease containing cells expressing GRP94. In cases where complete remission was not achieved, AKR1C3 (63%) and P53 (13%) could have been involved. (3) AML: According to reference 3, the 5-year OS was 73%. Treatment resistance factors included factors reducing the tumor cell concentrations of anticancer drugs such as P53 (9%), MRP1 (9%), and AKR1B10 (49%). The microenvironment factor GRP94 was expressed at a high frequency of 94%, but it did not have any significant influence on the treatment efficacy. (4) ALL: According to the results of this study, the OS duration was 57 months, indicative of a poor prognosis. Because Hyper CVAD treatment is powerful, many patients achieved temporary complete remission, but many were also at a high risk of relapse. The main treatment resistance factors were factors that reduced the tumor cell concentrations of anticancer drugs, including AKR1B10 %, MRP1 46%, and AKR1C3 37%, which increased the risk of relapse. AKR1B1 is a factor that antagonizes AKR1B10 that enhances the efficacy of chemotherapy and is important in ALL (5%). (5) Common treatment resistance factors: There are no common treatment resistance factors across the four diseases. However, the two common treatment resistance factors across the first three diseases are P53 (LBCL 36%, TCL 19%, AML 9%) and MRP1 (ALL 46%, LBCL 26%, AML 9%).
To gain a deeper understanding of resistance to chemotherapy, molecular-targeted drugs and other therapeutic agents shown in
Figure 7, we conducted a comprehensive literature review and the findings are summarized in
Table 3.
Table 3 also summarizes the relationship between 34 therapeutic agents, primarily used to treat hematological malignancies, and eight functional proteins that metabolize each therapeutic agent (chemotherapy inactivators shown in
Figure 7). For those reported in the literature, "Decrease," in
Table 3 indicating intracellular detoxification of the therapeutic agent, is listed with the supporting reference number in parentheses. Blank spaces indicate no literature reports. Based on these results, in
Figure 8, the 34 therapeutic agents are aggregated into 24 categories, and the eight functional proteins are aggregated into four types. The frequency of each of these four types in the tumor cells is listed. From this, we were able to classify the tumors into nine categories, as shown in
Figure 8. The four major metabolic pathways shown in
Figure 8 are pathways (1) to (4) described below. (1) AKR1 enzymes (represented by AKR1B10 and AKR1C3): generally expressed in hematologic tumors, particularly in LBCL and TCL, where they metabolize CHO (cyclophosphamide, doxorubicin or daunomycin or idarubicin, vincristine), methotrexate, gemcitabine, etc. AKR1C3 is important in LBCL (reference 2) and TCL (reference 3). (2) CYP3A4 enzymes: their expression rate is low at around 10%, and they are not expressed in TCL or ALL, in particular. They metabolize CHOP, venetoclax, MMAE, cytarabine, etc. (3) Efflux pumps (MRP1, MDR1): highly expressed in ALL and LBCL. Involved in the efficacy of most drugs (21 types), they expel etoposide, bendamustine, etc., from the tumor cells. This reduces their concentrations within the tumor cells, weakening their efficacy and causing tumor persistence. On the other hand, the (4) influx pump (ENT1) promotes uptake of methotrexate, gemcitabine, cytarabine, etoposide, bendamustine, etc., by the tumor cells. This influx increases the concentrations of the drugs within the tumor cells, enhancing their efficacy. The patterns of expression of the four pathways can be classified into nine categories as shown in
Figure 8. These categories are important and will provide extremely valuable information for future treatment selection.
Based on the results of the IHC analysis of tumor specimens for at least three treatment resistance proteins (AKR1B10, AKR1B1 and MRP1), patients with ALL can be classified into four prognostic groups, the so-called UC for ALL. The classification may be a simple, useful, and innovative classification that also explains the mechanisms of resistance to treatment in each group. If validated in a larger number of patients, the UC for ALL will enable targeted treatment using selected inhibitors directed against the offending protein in each patient. We propose to conduct further validation by analyzing a larger number of cases in the future.
4-5.Discussion based on the Review of the literature on the drug-resistance mechanisms in hematopoietic malignancies
Table 3 and
Figure 8 shows the results of the literature on the drug-resistance mechanisms in hematopoietic malignancies
The therapeutic agents for hematological malignancies (AML, ALL, TCL, LB, etc.) have been converted from
Table 3 to a Venn diagram in
Figure 8, summarizing the mechanisms of therapeutic resistance. The therapeutic resistance mechanisms involve at least three enzymes (AKR1B10, AKR1C3, and CYP3A4), one inflow pump that enhances the therapeutic efficacy (ENT1), and two efflux pumps. LB stands for large B-cell lymphoma. Furthermore, the incidence of each tumor is shown as a percentage based on references 1-3 as well as this study. Stars (★) indicate tumors with significant differences in the tumor survival time for each factor. Many anticancer drugs and molecular- targeted drugs are taken up into tumor cells via concentration gradient inflow pumps. 1 However, MTX, gemcitabine, cytarabine (Ara-C), romidepsin, etoposide, bendamustine, azacitidine (AZA), and forodesine are transported via the inflow pump ENT1. In cells that do not express ENT1, the efficacy of these agents is diminished. However, ENT1 is expressed in 100% of TCLs. 2) Many anticancer drugs and molecular- targeted drugs are metabolized by three enzymes (AKR1B10, AKR1C3, and CYP3A4) and two efflux pumps in tumor cells, reducing their effectiveness. 3) The CYP3A4 expression rate is 0% in TCLs and ALLs. CYP3A4 expression is also rare overall. 4) Furthermore, efflux pump expression is rare in TCL, so that AKR1B10 and AKR1C3 are the major factors involved in treatment resistance in TCL. In addition to AKR1, the microenvironmental factors shown in
Figure 7 are also important. 5) In LBCL (LB), ALL, and AML, the AKR1 enzymes and efflux pumps are often involved in treatment resistance.
5. Conclusions
In summary, based on the results of IHC analysis of tumor specimens for at least three treatment resistance proteins (AKR1B10, AKR1B1 and MRP1), patients with ALL can be classified into four prognostic groups, the so-called UC for ALL, as follows: Group 1 (favorable prognosis group); Group 2 (intermediate-1 prognosis group); Group 3 (intermediate-2 prognosis group) and Group 4 (poor prognosis group). In the future, we propose to use AKR1B10 and MRP1 inhibitors as a stratified treatment approach for ALL based on the UC to obtain improved treatment outcomes in patients with new-onset ALL. Furthermore, we also propose to conduct similar analyses in a larger number of cases, as well as in patients with other hematological malignancies and summarize the results. IHC staining for treatment resistance proteins provides quick results and is simple and inexpensive. Furthermore, it is noteworthy that our UC for ALL classified more than twice as many patients into the poor prognosis group as the MRC UKALLXIIECOG E2993 classification. We would like to conduct further validation of this classification system by analyzing a larger number of cases in the future.
Furthermore, based on the additional literature review, we concluded that the four major drug metabolic pathways in the tumor cells are: 1) AKR1 enzymes (represented by AKR1B10 and AKR1C3): expressed at a particularly high frequency in LBCL and TCL, they metabolize CHO drugs, methotrexate, gemcitabine, etc.; 2) CYP3A4 enzymes: not expressed in TCL or ALL. They metabolize the CHOP drugs, venetoclax, MMAE, cytarabine, etc.; 3) efflux pumps (MRP1, MDR1): highly expressed in ALL and LBCL. They expel anticancer drugs from tumor cells and may promote tumor persistence; 4) influx pump (ENT1): this allows anticancer drugs to enter the tumor cells and may improve the treatment efficacy. Based on the combined effects of these four pathways on the drugs, 33 representative drugs were classified into nine categories, which is an important categorization that is expected to provide extremely valuable information for future treatment selection.
Author Contributions
Specific contributions of the authors to this paper are as follows: Planning of the study: HT, MN, Conduct of the study: HT, MF, Reporting: HT, MN TO, Conception of the study: HT, MN, Design of the study: HT, MN, CF, Acquisition of data: MF, ST, SK, HA, MO, TS, Analysis and interpretation of the data: HT, MN, MA, TN, HN, HIH, SM.
Funding
This research received no external funding.
Institutional Review Board Statement
Approval number U17-0016-U01 for studies involving humans. The study was conducted in accordance with the Declaration of Helsinki, and approved by the Institutional Ethics Committee ofJuntendo University (protocol code number U17-0016-U01 and December 16 in 2022 of approval) for studies involving humans.
Informed Consent Statement
Any research article describing a study involving humans should contain this statement. Please add “Informed consent was obtained from all subjects involved in the study.
Data Availability Statement
Our articles published in MDPI journals to share their research data.
Acknowledgments
We greatly appreciate the assistance we received from Kotobiken Medical Laboratories Inc. (Tokyo, Japan) for the immunohistochemical analyses.
Conflicts of Interest
The authors declare no conflicts of interest. The results of the study will be made known to the study participants on the homepage of our website.
Patient and Public Involvement
None of the patients was involved in the design of this study. The results of the study will be made known to the study participants on the homepage of our website.
Abbreviations
The following abbreviations are used in this manuscript:
ALL Acute lymphoid leukemia
IHC Immunohistochemical staining
MRP1 Multidrug resistance-associated protein 1
AKR1B10 Aldo-keto reductase family 1 member B10
AKR1B1 Aldo-keto reductase family 1 member B1
AKR1C3 Aldo-keto reductase family 1 member C3
OS Overall survival
ELN European Leukemia Net
LBCL Large B-cell lymphoma
TCL Aggressive T-cell lymphoma
GRP94 Glucose-regulated protein 94
GRP78 Glucose-regulated protein 78
B-ALL B-cell acute lymphoblastic leukemia
TGFβ1 Transforming growth factor β1
TNFα1 Tumor necrosis factor α1
TNFR Tumor necrosis factor receptor
PD-1 Programmed cell death-1
PD-L1 Programmed cell death–ligand 1
ENT1 Equilibrative nucleoside transporter 1
MDR1 Multidrug resistance 1
MRP1 Multidrug resistance-associated protein 1
CYP3A4 Cytochrome P450 3A4
FLT3 fms related receptor tyrosine kinase 3
TKI Tyrosin kinase inhibitor
CYP2B6 Cytochrome P450 2B6
AKR1C3 Aldo-keto reductase family 1 member C3
AKR1B10 Aldo-keto reductase family 1 member B10
AKR1B1 Aldo-keto reductase family 1 member B1
TP Thymidine phosphorylase
GST Glutathione sulfate transferase
APL Acute promyeloid leukemia
CBF Core binding factor
CR Complete remission
PD Progressive disease
M Months
NS Not significant
NR Not reached
MCL1 Myeloid cell leukemia sequence 1
ATRA all-trans retinoic acid
NSAIDs; Non-Steroidal Anti-Inflammatory Drugs
NRF2; Nanomedicine
CyA; Cyclosporine A
TKIs; tyrosine kinase activity inhibitors.
HAHE; Selective inhibitor of AKR1B10 that is 790-fold more potent
than AKR1B1 (75)
EPA; Epalrestat
References
- Talha Bin Emran, Asif Shahriar, Ariful Islam, and Mohammad Mahmudul Hassan et al. Multidrug Resistance in Cancer: Understanding Molecular Mechanisms, Immunoprevention and Therapeutic Approaches. Front Oncol 2022 Jun 23:12:891652.
- Hideaki Nitta, Haruko Takizawa, Toru Mitsumori, Hiroko Iizuka-Honma, Miki Ando and Masaaki Noguchi et al. Possible New Histological Prognostic Index for Large B-Cell Lymphoma. J. Clin. Med. 2023, 12, 6324. [CrossRef]
- Hideaki Nitta, Haruko Takizawa , Toru Mitsumori, Miki Ando, and Masaaki Noguchi et al. A New Histology-Based Prognostic Index for Aggressive T-Cell lymphoma: Preliminary Results of the "TCL Urayasu Classification" J Clin Med. 2024 Jun 30;13(13):3870. [CrossRef]
- Toru Mitsumori, Hideaki Nitta, Haruko Takizawa , Miki Ando, and Masaaki Noguchi et al. A New Histology-Based Prognostic Index for Acute myeloid leukemia: Preliminary Results of the "AML Urayasu Classification".J Clin Med. 2025, 14, 1989. doi: 10.3390/jcm14061989.Jacob M Rowe, Georgina Buck, Martin S Tallman, and Anthony H Goldstone et al. Induction therapy for adults with acute lymphoblastic leukemia: results of more than 1500 patients from the international ALL trial: MRC UKALL XII/ECOG E2993 Blood. 2005 Dec 1;106(12):3760-7. https://doi.org/10.1182/blood-2005-04-1623. [CrossRef]
- Xiaofeng Duan, Stephen Iwanowycz, Soo Ngoi, Megan Hill 2 Qiang Zhaoand Bei Liu et al. Molecular Chaperone GRP94/GP96in Cancers: Oncogenesis and Therapeutic Target. Front Oncol. 2021. PMID: 33898309 Free PMC article. Review.
- Lee AS. Glucose-regulated proteins in cancer: molecular mechanisms and therapeutic potential. Nat Rev Cancer. 2014 Apr;14(4):263-76. [CrossRef]
- Amos Olalekan Akinyemi, Xiaoqi Liu, and Zhiguo Li et al. Unveiling the dark side of glucose-regulated protein 78 (GRP78) in cancers and other human pathology: a systematic review. Mol Med. 2023 Aug 21;29(1):112. [CrossRef]
- Tania Angeles-Floriano, Guadalupe Rivera-Torruco, Alhelí Bremer, Lourdes Alvarez-Arellano and Ricardo Valle-Rios et al. Cell surface expression of GRP78 and CXCR4 is associated with childhood high-risk acute lymphoblastic leukemia at diagnostics. Scientific Reports 2022 12:2322 | . [CrossRef]
- Nikhil Hebbar , Rebecca Epperly,Stephen Gottschalk, and M Paulina Velasquez et al. CAR T cells redirected to cell surface GRP78 display robust anti-acute myeloid leukemia activity and do not target hematopoietic progenitor cells Nat Commun 2022 Jan 31;13(1):587. [CrossRef]
- Sulsal Haque and John C Morris. Transforming growth factor-β: A therapeutic target for cancer. Hum Vaccin Immunother. 2017 Aug 3;13(8):1741-1750. [CrossRef]
- Matthew A. Timmins and Ingo Ringshausen. Transforming Growth Factor-Beta Orchestrates Tumour and Bystander Cells in B-Cell Non-Hodgkin Lymphoma. Cancers 2022, 14, 1772. [CrossRef]
- H T Idriss, and J H Naismith TNF alpha and the TNF receptor superfamily: structure-function relationship(s) Microsc Res Tech 2000 Aug 1;50(3):184-95. [CrossRef]
- H Takizawa, M Fujishiro, S Tomita, T Mitsumori, H Nitta, H Iizuka-Honma, M Ando, and M Noguchi. et al. Role of TGF-beta1 and TNF-alpha1 produced by neoplastic cells in the pathogenesis of fibrosis in patients with hematologic neoplasms. J Clin Exp Hematop. 2023 Jun 28;63(2):83-89. [CrossRef]
- Prada JP, Wangorsch G, Lang, Dandekar T, and Wajant H.et al. A systems-biology model of the tumor necrosis factor (TNF) interactions with TNF receptor 1 and 2. Bioinformatics. 2021 May 5;37(5):669-676. PMID: 32991680. [CrossRef]
- F Vinante, A Rigo, and M Chilosi, G Pizzolo et al. Serum levels of p55 and p75 soluble TNF receptors in adult acute leukaemia at diagnosis: correlation with clinical and biological features and outcome. Br J Haematol 1998 Sep;102(4):1025-34. [CrossRef]
- Adam Cisterne, Rana Baraz, Kenneth F Bradstock, and Linda J Bendall et al. Silencer of death domains controls cell death through tumour necrosis factor-receptor 1 and caspase-10 in acute lymphoblastic leukemia. PLoS One 2014 Jul 25;9(7):e103383. [CrossRef]
- Xi Xu, Wenwen Zhang, Linjia Jiang , Meng Zhao et all. PD-1 signalling defines and protects leukaemic stem cells from T cell receptor-induced cell death in T cell acute lymphoblastic leukaemia Nat Cell Biol. 2023 Jan;25(1):170-182. Epub 2023 Jan 9. [CrossRef]
- Huizhen Cao, Tianyu Wu, Yunxiao Sun, and Youjie Li.Progress of research on PD-1/PD-L1 in leukemia Front Immunol 2023 Sep 26:14:1265299. eCollection 2023. [CrossRef]
- Julie B Mortensen, Ida Monrad, Peter Kamper, and Francesco d'Amore et al. Soluble programmed cell death protein 1 (sPD-1) and the soluble programmed cell death ligands 1 and 2 (sPD-L1 and sPD-L2) in lymphoid malignancies Eur J Haematol. 2021 Jul;107(1):81-91. Epub 2021 Apr 12. [CrossRef]
- Kazuchika Takagaki, Susumu Katsuma, Yoshinori Kaminishi, Tatsuya Horio, Shinichiro Nakagawa, Teruo Tanaka, Tadaaki Ohgi, Junichi Yano Gene-expression profiling reveals down-regulation of equilibrative nucleoside transporter 1 (ENT1) in Ara-C-resistant CCRF-CEM-derived cells J Biochem 2004 Nov;136(5):733-40. [CrossRef]
- Elvis Terci Valera, Carlos Alberto Scrideli, Rosane Gomes de Paula Queiroz, Bianca Maria Ortelli Mori, Luiz Gonzaga Tone Multiple drug resistance protein (MDR-1), multidrug resistance-related protein (MRP) and lung resistance protein (LRP) gene expression in childhood acute lymphoblastic leukemia Sao Paulo Med J. 2004 Jul 1;122(4):166-71. [CrossRef]
- Adrian C Jaramillo, Jacqueline Cloos, Clara Lemos, Ronald W Stam, Gertjan J L Kaspers, Gerrit Jansen, Godefridus J Peters Ex vivo resistance in childhood acute lymphoblastic leukemia: Correlations between BCRP, MRP1, MRP4 and MRP5 ABC transporter expression and intracellular methotrexate polyglutamate accumulation Leuk Res. 2019 Apr:79:45-51. Epub 2019 Feb 2. [CrossRef]
- Monika Brüggemann, Heiko Trautmann, Dieter Hoelzer, Michael Kneba, Nicola Gökbuget, Thorsten Raff Multidrug resistance-associated protein 4 (MRP4) gene polymorphisms and treatment response in adult acute lymphoblastic leukemia Blood. 2009 Dec 17;114(26):5400-1; author reply 5401-2. [CrossRef]
- A Gézsi, O Lautner-Csorba,, G Kovács and C Szalai. In interaction with gender a common CYP3A4 polymorphism may influence the survival rate of chemotherapy for childhood acute lymphoblastic leukemia The Pharmacogenomics Journal 2015 volume 15, pages 241–247.
- Xuan Xiong, Dongke Yu, Hongtao Xiao, and Rongsheng Tong et al. Association between CYP2B6 c.516G >T variant and acute leukaemia. A protocol for systematic review and meta-analysis. Medicine (2021) 100:32.
- Kshitij Verma, Tianzhu Zang, Trevor M. Penning, and Paul C. Trippier, Potent and Highly Selective Aldo-Keto Reductase 1C3 (AKR1C3) Inhibitors Act as Chemotherapeutic Potentiators in Acute Myeloid Leukemia and T-Cell Acute Lymphoblastic Leukemia. J Med Chem. 2019 April 11; 62(7): 3590–3616. [CrossRef]
- Brian Laffin and J. Mark Petrash. Expression of the aldo-ketoreductases AKR1B1 and AKR1B10 in human cancers. Front Pharmacol. 2012; 3: 104. [CrossRef]
- Penning TM, Jonnalagadda S, Trippier PC, and Rižner TL et al. Aldo-Keto Reductases and Cancer Drug Resistance. Pharmacol Rev. 2021 Jul;73(3):1150-1171. [CrossRef]
- Neslihan Büküm, Eva Novotná, Petr Solich, and Vladimír Wsól et all. Inhibition of AKR1B10-mediated metabolism of daunorubicin as a novel off-target effect for the Bcr-Abl tyrosine kinase inhibitor dasatinib. Biochem Pharmacol 2021 Oct:192:114710. [CrossRef]
- Xingcao, Peter M Clifford, Rekha Bhat, Mini Abraham, and J Steve Hou et al. Thymidine phosphorylase expression in B-cell lymphomas and its significance: a new prognostic marker? Anal Quant Cytopathol Histpathol 2013 Dec;35(6):301-5.
- Frank N van Leeuwen. Therapeutic targeting of mutated p53 in acute lymphoblastic leukemia. Haematologica. 2020 Jan;105(1):10-11. [CrossRef]
- Kira Behrens, Natalie Brajanovski, Warren S Alexander, and Ashley P Ng et al.ERG and c-MYC regulate a critical gene network in BCR::ABL1-driven B cell acute lymphoblastic leukemia Sci Adv. 2024 Mar 8;10(10):eadj8803. Epub 2024 Mar 8. [CrossRef]
- Shahid M Baba , Arshad A Pandith,and Abid M Koul , and Sheikh Mansoor et ai. GSTT1 null and rs156697 Polymorphism in GSTO2 Influence the Risk and Therapeutic Outcome of B-Acute Lymphoblastic Leukemia Patients, Front Oncol Oct 14:11:714421. eCollection 2021. [CrossRef]
- S M Davies, L L Robison, J A Ross, and J P Perentesis et al. Glutathione S-transferase polymorphisms and outcome of chemotherapy in childhood acute myeloid leukemia. J Clin Oncol 2001 Mar 1;19(5):1279-87. [CrossRef]
- Y Kanda, Investigation of the freely available easy-to-use software ‘EZR’ for medical statistics. Bone Marrow Transplantation 23 (2013) 48, 452–458.
- Neslihan Büküm, Eva Novotná, Anselm Morell, Jana Želazková, Lenka Laštovičková, Lucie Čermáková, Ramon Portillo, Petr Solich,, Vladimír Wsól. Inhibition of AKR1B10-mediated metabolism of daunorubicin as a novel off-target effect for the Bcr-Abl tyrosine kinase inhibitor dasatinib Biochemical Pharmacology Volume 192, October 2021, 114710.
- Xiaohai,Li, Yuanjun,He, Claudia H, Ruiz, Marcel, Koenig, Michael, D Cameron, Tomas Vojkovsky. Characterization of dasatinib and its structural analogs as CYP3A4 mechanism-based inactivators and the proposed bioactivation pathways. Drug Metab Dispos 2009 Jun;37(6):1242-50. [CrossRef]
- C Hegedus, C Ozvegy-Laczka, A Apáti, M Magócsi, K Német, L Orfi, G Kéri, M Katona, Z Takáts, A Váradi, G Szakács, B Sarkadi Interaction of nilotinib, dasatinib and bosutinib with ABCB1 and ABCG2: implications for altered anti-cancer effects and pharmacological properties. Br J Pharmacol. 2009 Oct;158(4):1153-64. Epub 2009 Sep 28. [CrossRef]
- Toshiyuki Matsunaga , Yasuhiro Wada, Satoshi Endo, Midori Soda, Ossama El-Kabbani, Akira Hara. Aldo-Keto Reductase 1B10 and Its Role in Proliferation Capacity of Drug-Resistant Cancers. Front Pharmacol. 2012 Jan 31:3:5. eCollection 2012. [CrossRef]
- Roberta Bortolozzi, Silvia Bresolin, Giuseppe Basso, Luca Persano et al. AKR1C enzymes sustain therapy resistance in paediatric T-ALL Br J Cancer 2018 Apr;118(7):985-994. Epub 2018 Mar 8. [CrossRef]
- Ting Zhong, Feifei Xu, Jinhui Xu, Liang Liu, Yun Chen. Aldo-keto reductase 1C3 (AKR1C3) is associated with the doxorubicin resistance in human breast cancer via PTEN Loss. Biomedicine & Pharmacotherapy Volume 69, February 2015, Pages 317-325. Jakub Hofman, Beata Malcekova, Adam Skarka, Eva Novotna, Vladimir Wsol Anthracycline resistance mediated by reductive metabolism in cancer cells: The role of aldo-keto reductase 1C3 Author links open overlay panel Toxicology and Applied Pharmacology Volume 278, Issue 3, 1 August 2014, Pages 238-248.
- Ting Zhong, Feifei Xu, Jinhui Xu, Liang Liu, Yun Chen. Aldo-keto reductase 1C3 (AKR1C3) is associated with the doxorubicin resistance in human breast cancer via PTEN Loss. Biomedicine & Pharmacotherapy Volume 69, February 2015, Pages 317-325.
- Jing Zhao, Yang Xiang, Changji Xiao, Peng Guo, Dan Wang, Ying Liu, Yun Shen. AKR1C3 Overexpression Mediates Methotrexate Resistance in Choriocarcinoma Cells. Int. J. Med. Sci. 2014, Vol. 11 1089-1097.
- Rin Himura, Shinya Kawano, Yujiro Nagata, Mina Kawai, Atsumi Ota, Yudai, Kudo, Yuta Yoshino , Naohiro Fujimoto, Hiroshi Miyamoto, Satoshi Endo, Akira Ikari. Inhibition of aldo-keto reductase 1C3 overcomes gemcitabine/cisplatin resistance in bladder cancer. Chem Biol Interact. 2024 Jan 25:388:110840. Epub 2023 Dec 18. [CrossRef]
- Anselm Morell, Lucie Cˇ ermáková, Eva Novotná, Lenka Laštovicˇková, Melodie Haddad, Andrew Haddad, Ramon Portillo and Vladimír Wsól, Bruton’s Tyrosine Kinase Inhibitors Ibrutinib and Acalabrutinib Counteract Anthracycline Resistance in Cancer Cells Expressing AKR1C3 Cancers 2020, 12, 3731; [CrossRef]
- Celeste Lindley, Geraldine Hamilton, Jeannine S. McCune, Stephanie Faucette, Stacy S. Shord, Roy L. Hawke, Hongbing Wang, Darryl Gilbert, Summer Jolley, Bingfang Yan, Edward L. LeCluyse. The Effect of Cyclophosphamide with and without Dexamethasone on Cytochrome P450 3A4 and 2B6 in Human Hepatocytes. Drug Metabolism and Disposition Volume 30, Issue 7, July 2002, Pages 814-822.
- Jamie L Renbarger, Kevin C McCammack, Caroline E Rouse, Stephen D Hall. Effect of race on vincristine-associated neurotoxicity in pediatric acute lymphoblastic leukemia patients Pediatr Blood Cancer. 2008 Apr;50(4):769-71. [CrossRef]
- Susumu Ohya, Junko Kajikuri, Hiroaki Kito and Miki Matsui Down-Regulation of CYP3A4 by the KCa1.1 Inhibition Is Responsible for Overcoming Resistance to Doxorubicin in Cancer Spheroid Models. Int. J. Mol. Sci. 2023, 24, 15672. [CrossRef]
- Venceslas Bourdin, William Bigot, Anthony Vanjak, Ruxandra Burlacu, Amanda Lopes, Karine Champion, Audrey Depond, Blanca Amador-Borrero, Damien Sene, Chloe Comarmond and Stéphane Mouly.Drug–Drug Interactions Involving Dexamethasone in Clinical Practice: Myth or Reality? J. Clin. Med. 2023, 12, 7120. [CrossRef]
- Dawn E Colburn, Francis J Giles, Debra Oladovich, Judith A Smith. In vitro evaluation of cytochrome P450-mediated drug interactions between cytarabine, idarubicin, itraconazole and caspofungin. Hematology. 2004 Jun;9(3):217-21. [CrossRef]
- Vlastimil Masek, Eva Anzenbacherová, Markéta Machová, Viktor Brabec, Pavel Anzenbacher. Interaction of antitumor platinum complexes with human liver microsomal cytochromes P450. Anticancer Drugs. 2009 Jun;20(5):305-11. [CrossRef]
- Heidi D. Finnes, PharmD, Kari G. Chaffee, MS, Timothy G. Call, Wei Ding, MD, Saad S. Kenderian, Deborah A. Bowen, APRN, CNP, Michael Conte, PA-C, Kristen B. McCullough, PharmD, Julianna A. Merten, PharmD, Gabriel T. Bartoo, PharmD, Matthew D. Smith, PharmD, Jose Leis, AshChanan-Khan, Susan M. Schwager, Susan L. Slager, Neil E. Kay, Tait D. Shanafelt, and Sameer A. Parikh.Pharmacovigilance during Ibrutinib Therapy for Chronic Lymphocytic Leukemia (CLL) / Small Lymphocytic Lymphoma (SLL) in Routine Clinical Practice Leuk Lymphoma. 2017 June ; 58(6): 1376–1383. [CrossRef]
- Nicolas Hohmann, Martin Ronald Sprick, Moritz Pohl, Azaz Ahmed, Jürgen Burhenne, Marietta Kirchner, Lucian Le Cornet, Markus Kratzmann, Jacek Hajda, Albrecht Stenzinger, Karen Steindorf, Stefan Delorme, Heinz-Peter Schlemmer, Sabine Riethdorf, Ron van Schaik, Klaus Pantel, Jens Siveke,Thomas Seufferlein, Dirk Jäger, Walter E. Haefeli, Andreas Trumpp, Christoph Springfeld. Protocol of the IntenSify-Trial: An open-label phase I trial of the CYP3A inhibitor cobicistat and the cytostatics gemcitabine and nab-paclitaxel in patients with advanced stage or metastatic pancreatic ductal adenocarcinoma to evaluate the combination's pharmacokinetics, safety and efficacy. Clin Transl Sci. 2023;16:2483–2493. www.cts-journal.com.
- Eric D. Eisenmann, Dominique A. Garrison, Zahra Talebi, Yan Jin, Josie A. Silvaroli, Jin-Gyu Kim, Alex Sparreboom, Michael R. Savona 2, Alice S. Mims 3 and Sharyn D. Baker. Interaction of Antifungal Drugs with CYP3A- and OATP1B-Mediated Venetoclax Elimination. Pharmaceutics 2022, 14, 694. [CrossRef]
- Ibrahim El-Serafi, Parvaneh Afsharian, Ali Moshfegh, Moustapha Hassan, Ylva Terelius. Cytochrome P450 Oxidoreductase Influences CYP2B6 Activity in Cyclophosphamide Bioactivation. PLOS ONE. November 6, 2015. [CrossRef]
- J M Pascussi, S Gerbal-Chaloin, L Drocourt, P Maurel, M J Vilarem. The expression of CYP2B6, CYP2C9 and CYP3A4 genes: a tangle of networks of nuclear and steroid receptors Biochim Biophys Acta. 2003 Feb 17;1619(3):243-53. https://doi.org/10.1016/s0304-4165(02)00483-x. 58. Jelmer J. van Zanden,, Anika de Mul, Heleen M. Wortelboer, Mustafa Usta, Peter J. van Bladeren, Ivonne Rietjens, Nicole H.P. Cnubben, Reversal of in vitro cellular MRP1 and MRP2 mediated vincristine resistance by the flavonoid myricetin. Biochemical Pharmacology Volume 69, Issue 11, 1 June 2005, Pages 1657-1665. [CrossRef]
- Jelmer J. van Zanden,, Anika de Mul, Heleen M. Wortelboer, Mustafa Usta, Peter J. van Bladeren, Ivonne Rietjens, Nicole H.P. Cnubben, Reversal of in vitro cellular MRP1 and MRP2 mediated vincristine resistance by the flavonoid myricetin. Biochemical Pharmacology Volume 69, Issue 11, 1 June 2005, Pages 1657-1665.
- Chie Shinoda, Muneharu Maruyama, Takashi Fujishita, Junichi Dohkan, Hirofumi Oda, Kouichirou Shinoda, Toru Yamada, Koutarou Miyabayashi, Ryuji Hayashi, Yukio Kawagishi, Tadashi Fujita, Shoko Matsui, Eiji Sugiyama, Atsushi Muraguchi, Masashi Kobayashi. Doxorubicin induces expression of multidrug resistance-associated protein 1 in human small cell lung cancer cell lines by the c-jun N-terminal kinase pathway. Int J Cancer. 2005 Oct 20;117(1):21-31. [CrossRef]
- MEP Smeets, RAP Raymakers1, G Vierwinden1, AHM Pennings1, J Boezeman1, H Minderman2 and TM de Witte1 Idarubicin DNA intercalation is reduced by MRP1 and not Pgp Leukemia (1999) 13, 1390–1398.
- Xinxing Li, Haolu Wang, Juan Wang, Yuying Chen, Xiaobin Yin, Guiying Shi, Hui Li, Zhiqian Hu and Xiaowen Liang Emodin enhances cisplatin-induced cytotoxicity in human bladder cancer cells through ROS elevation and MRP1 downregulation. BMC Cancer (2016) 16:578.
- Atish Patel, Shao-Lin Ma, Xiao Jie Li, Yun-Kai Zhang,Pei-Qi Yang, Rishil J Kathawala, Yi-Jun Wang, Nagaraju Anreddy,Li-Wu Fu and Zhe-Sheng Chen. In vitro, in vivo and ex vivo characterization of ibrutinib: a potent inhibitor of the efflux function of the transporter MRP1. British Journal of Pharmacology (2014) 171 5845–5857. www.brjpharmacol.org. [CrossRef]
- Lei Kong, Jiali Du, Jichun Gu, Junyuan Deng, Yujie Guo, Baian Tao, Chen Jin, Deliang Fu and Ji Li. Gemcitabine-Loaded Albumin Nanoparticle Exerts An Antitumor Effect on Gemcitabine-Resistant Pancreatic Cancer Cells Induced by MDR1 and MRP1 Overexpression in Vitro Frontiers in Surgery, 2022, Volume 9 |Article 8904. www.frontiersin.org 1 12. [CrossRef]
- Jessica Ebner, Johannes Schmoellerl, Martin Piontek, Gabriele Manhart, Selina Troester, Bing Z. Carter, Heidi Neubauer, Richard Moriggl, Gergely Szakács, Johannes Zuber, Thomas Köcher, Michael Andreeff, Wolfgang R. Sperr, Peter Valent, Florian Grebien. ABCC1 and glutathionemetabolism limit the efficacy of BCL-2 inhibitors in acute myeloid leukemia. Nature Communications ( 2023) 14:5709. [CrossRef]
- Brenna Weadick, Debasis Nayak, Avinash K. Persaud, Sau Wai Hung, Radhika Raj, Moray J. Campbell, Wei Chen, Junan Li, Terence M. Williams4, Rajgopal Govindarajan. EMT-induced gemcitabine resistance in pancreatic cancer involves the functional loss of equilibrative nucleoside transporter 1. Mol Cancer Ther. 2021 February ; 20(2): 410–422. [CrossRef]
- Ashif Iqubala, Mohammad Kashif Iqubalb, Sumit Sharmaa, Mohd. Asif Ansaria,Abul Kalam Najmia, Syed Mansoor Alic, Javed Alib, Syed Ehtaishamul Haquea.Molecular mechanism involved in cyclophosphamide-induced cardiotoxicity: Old drug with a new vision. Life Sciences 218 (2019) 112–131.
- Marko Hojnik, Nataša Kenda Šuster, Špela Smrkolj, Damjan Sisinger, Snježana Frkovi´c Grazio, Ivan Verdenik and Tea Lanišnik Rižner.AKR1B1 as a Prognostic Biomarker of High-Grade Serous.Ovarian Cancer. Cancers 2022, 14, 809. [CrossRef]
- Li Huanga, Rongzhang Hea, Weihao Luoa, Yuan-Shan Zhuc, Jia Lia, Tan Tana, Xi Zhanga, Zheng Hua and Dixian Luoa. Aldo-Keto Reductase Family 1 Member B10 Inhibitors: Potential Drugs for Cancer Treatment. Recent Patents on Anti-Cancer Drug Discovery, 2016, 11, 184-196.
- Trevor M. Penning. Aldo-Keto Reductase (AKR) 1C3 inhibitors: a patent review. Expert Opin Ther Pat. 2017 December ; 27(12): 1329–1340. [CrossRef]
- Wolters Kluwer https://www.uptodate.com › imag Cytochrome P450 3A inhibitors and inducers – UpToDate Cytochrome P450 3A (including 3A4) inhibitors and inducers. 2025 UpToDate, Inc. and/or its affiliates. https://www.uptodate.com/contents/image?imageKey=CARD/76992.
- Cytochrome P-450 CYP2B6 Inhibitors (strong) – Drug Bank https://go.drugbank.com › categories.
- Kimberley M Hanssen, Michelle Haber, Jamie Fletcher Targeting multidrug resistance-associated protein 1 (MRP1)-expressing cancers: Beyond pharmacological inhibition Review Drug Resist Update. 2021 Dec:59:100795. Epub 2021 Dec 10. [CrossRef]
- Hisham Qosaa, David S. Millerb, Piera Pasinellia, and Davide Trottia. Regulation of ABC Efflux Transporters at Blood-Brain Barrier in Health and Neurological Disorders. Brain Res. 2015 December 2; 1628(0 0): 298–316. [CrossRef]
- Elodie Jouan· Amélie· Claire Denizot· Yannick Parmentier Arnaud Bruyere· Karima Alim. Olivier Fardel. ·Differential Inhibition of Equilibrative Nucleoside Transporter 1 (ENT1) Activity by Tyrosine Kinase Inhibitors. European Journal of Drug Metabolism and Pharmacokinetics (2021) 46:625–635. [CrossRef]
- Mingyue Liu, Xiaochun Qin, Jing Li,a Yuting Jiang, Junjie Jiang, Jiwei Guo, Hao Xu, Yousen Wang, Hengtai Bi and Zhiliang Wang. Decoding selectivity: computational insights into AKR1B1 and AKR1B10 inhibition. Phys. Chem. Chem. Phys., 2024, 26, 9295–9308. [CrossRef]
- Tanotnon Tanawattanasuntorn, Tienthong Thongpanchang, Thanyada Rungrotmongkol, Chonnikan Hanpaibool, Potchanapond Graidist, and Varomyalin Tipmanee. (−)-Kusunokinin as a Potential Aldose Reductase Inhibitor: Equivalency Observed via AKR1B1 Dynamics Simulation. ACS Omega 2021, 6, 606−614.
- Christian Bailly, Moving toward a new horizon for the aldose reductase inhibitor epalrestat to treat drug-resistant cancer. European Journal of Pharmacology Volume 931, 15 September 2022, 175191. Epub 2022 Aug 11. [CrossRef]
- Yang Liu, Siyu He, Ying Chen, Yijun Liu, Feng Feng, Wenyuan Liu, Qinglong Guo, Li Zhao, and Haopeng Sun. Overview of AKR1C3: Inhibitor Achievements and Disease InsightsJ. Med. Chem., 28 May 2020. [CrossRef]
- Raquel Alves, Ana Cristina Gonçalves, Sergio Rutella, António M. Almeida Javier De Las Rivas, Ioannis P. Trougakos and Ana Bela Sarmento Ribeiro. Review Resistance to Tyrosine Kinase Inhibitors in Chronic Myeloid Leukemia—From Molecular Mechanisms to Clinical Relevance. Cancers 2021, 13, 4820. [CrossRef]
- EUN JUNG LEE and SEUNG JIN LEE. Etoposide increases equilibrative nucleoside transporter 1 activity and fluorothymidine uptake: Screening of 60 cytotoxic agents. ONCOLOGY REPORTS 29: 763-770, 2013. [CrossRef]
- Xiangting Liu1, Zheng Hu1,2, Jiayao Qu1,2, Jia Li, Ke Gong, Li Wang1,2, Jing Jiang, Xiangning Li, Rongzhang He, Lili Duan, Weihao Luo, Chenglai Xia and Dixian Luo5,6. AKR1B10 confers resistance to radiotherapy via FFA/TLR4/NF-κB axis in nasopharyngeal carcinoma. Int. J. Biol. Sci. 2021, Vol. 17. 756-767.
- Shao-Qian Sun, Xiaobin Gu, Xian-Shu Gao, Yi Li, Hongliang Yu, Wei Xiong, Hao Yu, Wen Wang, Yingbo Li, Yingqi Teng, Demin Zhou. Overexpression of AKR1C3 significantly enhances human prostate cancer cells resistance to radiation. Oncotarget, Vol. 7, No. 30, 2020. 48050-48057.
- Yang Chen, Aijia Zhang, Yuan Wang, Daoda Qi, Chengyi Peng, Zihao Liang, Jingjing Guo Yan Gu. YY1-induced transcription of AKR1C3 activates the Hedgehog signalling pathway to enhance lenalidomide resistance and glycolytic activity in multiple myeloma cells. Clin Exp Med. 2025 Mar 29;25(1):99. [CrossRef]
- Judith Loeffler-Ragg, Doris Mueller, Gabriele Gamerith, Thomas Auer, Sergej Skvortsov, BettinaSarg, Ira Skvortsova, Klaus J Schmitz, Hans-Jörg Martin, Jens Krugmann, Hakan Alakus, Edmund Maser, Jürgen Menzel, Wolfgang Hilbe, Herbert Lindner, Kurt W Schmid, Heinz Zwierzina. Proteomic identification of aldo-keto reductase AKR1B10 induction after treatment of colorectal cancer cells with the proteasome inhibitor bortezomib Mol Cancer Ther. 2009 Jul;8(7):1995-2006. Epub 2009 Jun 30. [CrossRef]
- Zeen Tong, Usha Yerramilli, Sekhar Surapaneni, Gondi Kumar. The interactions of lenalidomide with human uptake and efflux transporters and UDP-glucuronosyltransferase 1A1: lack of potential for drug-drug interactions. Cancer Chemother Pharmacol. 2014 Apr;73(4):869-74. Epub 2014 Mar 14. [CrossRef]
- Gabriele Buda, Deborah Ricci, C Chris Huang, Reyna Favis, Nadine Cohen, Sen H Zhuang, Jean-Luc Harousseau, Pieter Sonneveld, Joan Bladé, Robert Z Orlowski. Polymorphisms in the multiple drug resistance protein 1 and in P-glycoprotein 1 are associated with time to event outcomes in patients with advanced multiple myeloma treated with bortezomib and pegylated liposomal doxorubicin. Ann Hematol. 2010 Nov;89(11):1133-40. Epub 2010 Jun 8. [CrossRef]
- Claudia Kasserra, Mahmoud Assaf, Matthew Hoffmann, Yan Li, Liangang Liu, Xiaomin Wang, Gondi Kumar, Maria Palmisano. Pomalidomide: evaluation of cytochrome P450 and transporter-mediated drug-drug interaction potential in vitro and in healthy subjects. J Clin Pharmacol. 2015 Feb;55(2):168-78. Epub 2014 Sep 7. [CrossRef]
- Rachel L Mynott, Craig T Wallington-Beddoe. Drug and Solute Transporters in Mediating Resistance to Novel Therapeutics in Multiple Myeloma. ACS Pharmacol Transl Sci. 2021 Apr 15;4(3):1050-1065. eCollection 2021 Jun 11. [CrossRef]
- Mary P Choules, Peiying Zuo, Yukio Otsuka, Amit Garg, Mei Tang, Peter Bonate. Physiologically based pharmacokinetic model to predict drug-drug interactions with the antibody-drug conjugate enfortumab vedotin. J Pharmacokinet Pharmacodyn 2024 Oct;51(5):417-428. Epub 2023 Aug 26. [CrossRef]
- Mitsuki Tabata, Masanobu Tsubaki, Tomoya Takeda, Keisuke Tateishi, Katsumasa Tsurushima, Motohiro Imano, Takao Satou Toshihiko Ishizaka , Shozo Nishida. Dasatinib reverses drug resistance by downregulating MDR1 and Survivin in Burkitt lymphoma cells. BMC Complement Med Ther. 2020 Mar 14;20(1):84. [CrossRef]
- Robert Chen, Jessie Hou, Edward Newman, Young Kim, Cecile Donohue, Xueli Liu , Sandra H Thomas, Stephen J Forman, Susan E Kane. CD30 Downregulation, MMAE Resistance, and MDR1 Upregulation are all associated with resistance to brentuximab vedotin. Mol Cancer Ther 2015 Jun;14(6):1376-84. Epub 2015 Apr 3. [CrossRef]
- Rong Huang, Daryl J. Murry, Dhanashri Kolwankar, Stephen D. Hall, David R. Foster. Vincristine transcriptional regulation of efflux drug transporters in carcinoma cell lines. Biochemical Pharmacology Volume 71, Issue 12, 14 June 2006, Pages 1695-1704.
- Maria M Ho, Donna E Hogge, Victor Ling. MDR1 and BCRP1 expression in leukemic progenitors correlates with chemotherapy response in acute myeloid leukemia. Exp Hematol 2008 Apr;36(4):433-42. Epub 2008 Jan 30. [CrossRef]
- S G Creemers, P M van Koetsveld , W W De Herder, F Dogan , G J H Franssen, R A Feelders, L J Hofland. MDR1 inhibition increases sensitivity to doxorubicin and etoposide in adrenocortical cancer. Endocr Relat Cancer. 2019 Mar;26(3):367-378. [CrossRef]
- Kohji Takara, Masayuki Tsujimoto, Misato Kokufu, Noriaki Ohnishi, Teruyoshi Yokoyama. Up-regulation of MDR1 function and expression by cisplatin in LLC-PK1 cells. Biol Pharm Bull. 2003 Feb;26(2):205-9. [CrossRef]
- P Rahman, D Hefferton, D Robb. Increased MDR1 P-glycoprotein expression in methotrexate resistance: comment on the article by Yudoh et al. Arthritis Rheum 2000 Jul;43(7):1661-2. [CrossRef]
- Muzaffar Iqbal, Mohammad Raish,, Ajaz Ahmad, Essam A. Ali, Yousef A. Bin Jardan, Mushtaq A. Ansari, Mudassar Shahid, Abdul Ahad, Khalid M. Alkharfy and Fahad. Al-Jenoobi. Cytochrome P450 3A2 and PGP-MDR1-Mediated Pharmacokinetic Interaction of Sinapic Acid with Ibrutinib in Rats: Potential Food/Herb–Drug Interaction. Processes 2022, 10, 1066.
- T. Gauler, A. C. Hoffman, P. Wild, C. Leicht, S. Bertz, K. D. Danenberg, R. Stöhr, M. Stöckle, W. E. Eberhardt, J. Lehmann, and A. HartmannAuthors Info & Affiliations. Use of multidrug-resistance gene (MDR1) expression levels to predict outcome to adjuvant cisplatin/gemcitabine based chemotherapy in patients with with locally advanced urothelial cancer. Journal of Clinical Oncology Volume 27, Number 15_suppl. https://doi.org/10.1200/jco.2009.27.15_suppl.e22081. Meeting Abstract: 2009 ASCO Annual Meeting Free access Tumor Biology and Human Genetics May 20, 2009. [CrossRef]
- Johanna Weiss, Thomas Gajek, Bruno Christian Köhler, Walter Emil Haefeli. Venetoclax (ABT-199) Might Act as a Perpetrator in Pharmacokinetic Drug-Drug Interactions. Pharmaceutics 2016 Feb 24;8(1):5. [CrossRef]
- Frank Loganzo, Matthew Sung, Hans-Peter Gerber. Mechanisms of Resistance to Antibody-Drug Conjugates. Mol Cancer Ther. 2016 Dec;15(12):2825-2834. Epub 2016 Oct 25. [CrossRef]
- Naoto Takahashi, Naoki Takezako,Masatomo Miura, Akihisa Nagata, Naohiro Sekiguchi, Takenori Niioka,, Seiji Shida, Takahiro Kobayashi,Maiko Abumiya, Akiyoshi Miwa. Clarithromycin Elevates the Plasma Concentration of Lenalidomide Via Inhibition of MDR1. Blood (2014) 124 (21): 3479. [CrossRef]
- A Besse, S C Stolze, L Rasche, N Weinhold, G J Morgan, M Kraus, J Bader, H S Overkleeft, L Besse, C Driessen. Carfilzomib resistance due to ABCB1/MDR1 overexpression is overcome by nelfinavir and lopinavir in multiple myeloma. Leukemia 2018 Feb;32(2):391-401. Epub 2017 Jul 5. [CrossRef]
- Motohiko Murase, Hiroyuki Iwamura, Kensuke Komatsu, Motoki Saito, Toshihiko Maekawa, Takaaki Nakamura, Takuya Yokokawa, Yasuhiro Shimada. Lack of cross-resistance to FF-10501, an inhibitor of inosine-5'-monophosphate dehydrogenase, in azacitidine-resistant cell lines selected from SKM-1 and MOLM-13 leukemia cell lines. Pharmacol Res Perspect 2016 Jan 28;4(1):e00206. eCollection 2016 Feb. [CrossRef]
- Angela Joubert James, Catherine C Smith, Mark Litzow, Alexander E Perl, Jessica K Altman, Dale Shepard, Takeshi Kadokura, Kinya Souda, Melanie Patton, Zheng Lu, Chaofeng Liu, Selina Moy, Mark J Levis, Erkut Bahceci. Pharmacokinetic Profile of Gilteritinib: A Novel FLT-3 Tyrosine Kinase Inhibitor Clin Pharmacokinet 2020 Oct;59(10):1273-1290. https://doi.org/10.1007/s40262-020-00888-w.106. https://www.pmda.go.jp/files/000228502.pdf. Report on the Deliberation Results September 4, 2018 Pharmaceutical Evaluation Division, Pharmaceutical Safety and Environmental Health Bureau Ministry of Health, Labour and Welfare Brand Name Xospata Tablets 40 mg Non-proprietary Name Gilteritinib Fumarate (JAN*) Applicant Astellas Pharma Inc. [CrossRef]
- Meng Zhang, Mei-Ling She, Jun Chen, Xiao-Qi Zeng, Qing-Quan Xiong, Ying-Huan Cen, Jia-An Ye, Guo-Bin Qiu, Shu-Yi Yang, Guang-Hui Ren. Gilteritinib reverses ABCB1-mediated multidrug resistance: Preclinical in vitro and animal investigations. Biomed Pharmacother, 2024 Nov:180:117603. Epub 2024 Oct 30. [CrossRef]
- Jianke Li, Martin Kankam, Denise Trone, Guy Gammon. Effects of CYP3A inhibitors on the pharmacokinetics of quizartinib, a potent and selective FLT3 inhibitor, and its active metabolite. Br J Clin Pharmacol. 2019 Sep;85(9):2108-2117. Epub 2019 Jul 23. [CrossRef]
- Jing Wang, Changpei Gan, Irene A Retmana, Rolf W Sparidans, Wenlong Li, Maria C Lebre, Jos H Beijnen, Alfred H Schinkel. P-glycoprotein (MDR1/ABCB1) and Breast Cancer Resistance Protein (BCRP/ABCG2) limit brain accumulation of the FLT3 inhibitor quizartinib in mice. Int J Pharm. 2019 Feb 10:556:172-180. Epub 2018 Dec 12. [CrossRef]
- C M Paumi, B G Ledford, P K Smitherman, A J Townsend, C S Morrow. Role of multidrug resistance protein 1 (MRP1) and glutathione S-transferase A1-1 in alkylating agent resistance. Kinetics of glutathione conjugate formation and efflux govern differential cellular sensitivity to chlorambucil versus melphalan toxicity. J Biol Chem. 2001 Mar 16;276(11):7952-6. Epub 2000 Dec 13. [CrossRef]
- Annett Kühne, Mladen Vassilev Tzvetkov, Yohannes Hagos, Hermann Lage, Gerhard Burckhardt, Jürgen Brockmöller. Influx and efflux transport as determinants of melphalan cytotoxicity: Resistance to melphalan in MDR1 overexpressing tumor cell lines. Biochem Pharmacol. 2009 Jul 1;78(1):45-53. Epub 2009 Apr 5. [CrossRef]
- Eva Novotná, Anselm Morell, Neslihan Büküm, Jakub Hofman, Petra Danielisová, Vladimír Wsól. Interactions of antileukemic drugs with daunorubicin reductases: could reductases affect the clinical efficacy of daunorubicin chemoregimens? Arch Toxicol. 2020 Sep;94(9):3059-3068. Epub 2020 Jun 25. [CrossRef]
- Emma Morrish, Anthony Copeland, Donia M Moujalled, Jason A Powell, Natasha Silke, Ann Lin, Kate E Jarman, Jarrod J Sandow, Gregor Ebert, Liana Mackiewicz, Jessica A Beach, Elizabeth L Christie, Alexander C Lewis, Giovanna Pomilio, Karla C Fischer, Laura MacPherson, David D L Bowtell, Andrew I Webb, Marc Pellegrini, Mark A Dawson, Stuart M Pitson, Andrew H Wei, John Silke, Gabriela Brumatti. Clinical MDR1 inhibitors enhance Smac-mimetic bioavailability to kill murine LSCs and improve survival in AML models.Blood Adv. 2020 Oct 27;4(20):5062-5077. [CrossRef]
- Tučková, Kateřina The use of selected inhibitors to overcome anthracycline resistance in cancer therapy (in vitro study). https://dspace.cuni.cz/handle/20.500.11956/181425 Charles University.
- Matthias Hoch, Felix Huth, Masahiko Sato, Tirtha Sengupta, Michelle, Quinlan, Stephanie Dodd, Shruti Kapoor, Florence Hourcade-Potelleret. Pharmacokinetic of asciminib in the presence of CYP3A or P-gp inhibitors, CYP3A inducers, and acid-reducing agents. Clin Transl Sci 2022 Jul;15(7):1698-1712. Epub 2022 May 26. [CrossRef]
- Laura N Eadie, Verity A Saunders, Susan Branford, Deborah L White, Timothy P Hughes. The new allosteric inhibitor asciminib is susceptible to resistance mediated by ABCB1 and ABCG2 overexpression in vitro. Oncotarget. 2018 Feb 3;9(17):13423-13437. eCollection 2018 Mar 2. [CrossRef]
- Tomoko O Morita, Kazuhiko Hanada. Physiologically based pharmacokinetic modeling of ponatinib to describe drug-drug interactions in patients with cancer Cancer Chemother Pharmacol. 2022 Oct;90(4):315-323. Epub 2022 Aug 23. [CrossRef]
- Yue-Li Sun, Priyank Kumar, Kamlesh Sodani, Atish Patel, Yihang Pan, Maria R Baer, Zhe-Sheng Chen, Wen-Qi Jiang. Ponatinib enhances anticancer drug sensitivity in MRP7-overexpressing cells. Oncol Rep. 2014 Apr;31(4):1605-12. Epub 2014 Jan 28. [CrossRef]
- Ogura M, Kim WS, Uchida T, Uike N, Suehiro Y, Ishizawa K, Nagai H, Nagahama F, Sonehara Y, Tobinai K. Phase I studies of darinaparsin in patients with relapsed or refractory peripheral T-cell lymphoma: a pooled analysis of two phase I studies conducted in Japan and Korea. Jpn J Clin Oncol. 2021 Feb 8;51(2):218-227. [CrossRef]
- Tomoko O Morita, Kazuhiko Hanada. Physiologically based pharmacokinetic modeling of ponatinib to describe drug-drug interactions in patients with cancer. Cancer Chemother Pharmacol. 2022 Oct;90(4):315-323. Epub 2022 Aug 23. [CrossRef]
- Yue-Li Sun, Priyank Kumar, Kamlesh Sodani, Atish Patel, Yihang Pan, Maria R Baer 4, Zhe-Sheng Chen 2, Wen-Qi Jiang. Ponatinib enhances anticancer drug sensitivity in MRP7-overexpressing cells. ncol Rep 2014 Apr;31(4):1605-12. Epub 2014 Jan 28. [CrossRef]
- Peter J. Hosein, Michael D. Craig, Martin S. Tallman, Ralph V. Boccia, Brian L. Hamilton, Jonathan J. Lewis, and Izidore S. Lossos. A multicenter phase II study of darinaparsin in relapsed or refractory Hodgkin’s and non-Hodgkin’s lymphoma. Am J Hematol. 2012. PMID: 22081459.
- Twila A Mason, Elena Kolobova, Jiang Liu, Joseph T Roland, Chin Chiang, James R Goldenring. Darinaparsin is a multivalent chemotherapeutic which induces incomplete stress response with disruption of microtubules and Shh signaling. PLoS One.2011;6(11):e27699. Epub 2011 Nov 15. [CrossRef]
- Irene Homminga,Michel C. Zwaan, Amel Seghouani, Chantal Y. Manz, Shanta Bantia, Wilco Smits, Rob Pieters,Jules P.P. Meijerink. In-Vitro Efficacy of the Deoxyguanoside Analogs Forodesine (BCX-1777) and ARA-G in Pediatric Acute Lymphoblastic Leukemia.Crossmark: Check for Updates Blood (2009) 114 (22): 2038. [CrossRef]
- Gonen N, Assaraf YG. Antifolates in cancer therapy: structure, activity and mechanisms of drug resistance.Drug Resist Updat. 2012 Aug;15(4):183-210. Epub 2012 Aug 23. PMID: 22921318. [CrossRef]
- M Serova, I Bieche, M-P Sablin, G J Pronk, M Vidaud, E Cvitkovic, S Faivre, E Raymond. Single agent and combination studies of pralatrexate and molecular correlates of sensitivity. Br J Cancer 2011 Jan 18;104(2):272-80. Epub 2010 Dec 21.124. [CrossRef]
- Eric Laille, Manish Patel, Suzanne F Jones, Howard A Burris, Jeffrey Infante, Charlotte Lemech, Liangang Liu, Hendrik-Tobias Arkenau. Evaluation of CYP3A-mediated drug-drug interactions with romidepsin in patients with advanced cancer. J Clin Pharmacol. 2015 Dec;55(12):1378-85. Epub 2015 Jul 29. [CrossRef]
- Istodax® (Romidepsin) 10mg Powder of Injection. Medsinfo https://rss.medsinfo.com.au.
- Benigno C Valdez, Jonathan E Brammer, Yang Li, David Murray,Esmeralda C Teo, Yan Liu, Chitra Hosing, Yago Nieto, Richard E Champlin, Borje S Andersson. Romidepsin enhances the cytotoxicity of fludarabine, clofarabine and busulfan combination in malignant T-cells. Leuk Res 2016 Aug:47:100-8. Epub 2016 May 27. [CrossRef]
- Istodax® (Romidepsin) Ritika Kurian, Hongbing Wang. Prodrugs in Oncology: Bioactivation and Impact on Therapeutic Efficacy and Toxicity. Int J Mol Sci. 2025 Jan 24;26(3):988. [CrossRef]
- Sukyung Woo, Erin R Gardner, Xiaohong Chen, Sandra B Ockers, Caitlin E Baum, Tristan M Sissung, Douglas K Price, Robin Frye, Richard L Piekarz, Susan E Bates, William D Figg. Population pharmacokinetics of romidepsin in patients with cutaneous T-cell lymphoma and relapsed peripheral T-cell lymphoma. Clin Cancer Res 2009 Feb 15;15(4):1496-503. [CrossRef]
- https://synapse.patsnap.com/article/what-is-chidamide-used-for? What is Chidamide used for?15 June 2024. Chidamide, also known by the trade names Epidaza and HBI-8000, is a novel histone deacetylase (HDAC) inhibitor that has garnered sign ificant attention in the field of oncology.
- Benigno C Valdez, Yang Li, David Murray, Yan Liu, Yago Nieto, Richard E Champlin, Borje S Andersson. Combination of a hypomethylating agent and inhibitors of PARP and HDAC traps PARP1 and DNMT1 to chromatin, acetylates DNA repair proteins, down-regulates NuRD and induces apoptosis in human leukemia and lymphoma cells. Oncotarget. 2017 Dec 17;9(3):3908-3921. eCollection 2018 Jan 9. [CrossRef]
- Pingjiang Ye, Haibo Xing, Fang Lou, Kaifeng Wang, Qin Pan, Xiaoyun Zhou, Liu Gong, Da Li. Histone deacetylase 2 regulates doxorubicin (Dox) sensitivity of colorectal cancer cells by targeting ABCB1 transcription. Cancer Chemother Pharmacol. 2016 Mar;77(3):613-21. Epub 2016 Feb 5. [CrossRef]
- Nobuya Hiraoka, Jiro Kikuchi, Takahiro Yamauchi, Daisuke Koyama, Taeko Wada, Mitsuyo Uesawa, Miyuki Akutsu, Shigehisa Mori, Yuichi Nakamura, Takanori Ueda, Yasuhiko Kano, Yusuke Furukawa. Purine analog-like properties of bendamustine underlie rapid activation of DNA damage response and synergistic effects with pyrimidine analogues in lymphoid malignancies. PLoS One 2014 Mar 13;9(3):e90675. eCollection 2014. [CrossRef]
- Toshikazu Itabashi, Takahiro Ueda, Ryohei Fukunaga, Takeshi Asano, Yasuhiko Itoh. Methylation of PLK-1 Potentially Drives Bendamustine Resistance in Leukemia Cells. J Nippon Med Sch 2024 May 21;91(2):162-171. Epub 2023 Dec 8. [CrossRef]
Figure 1.
Overall survival of ALL patients with and without various prognostic factors. Comparison of the Kaplan–Meier survival curves and disease/prognostic factors between 2 groups was performed by the log-rank test. Comparison of the overall survival (OS) after initial remission induction therapy with Hyper CVAD/MA. (A). The median OS duration in the patients (n = 19) was 57 months, and the 5-year OS was 48%. Hereafter, the red letters indicate the OS in the group showing positive immunostaining of the ALL blast cells for the prognostic factor, and the black letters indicate the OS in the group showing negative immunostaining for the prognostic factor. (B). There was no significant difference in the OS rate between the Philadelphia chromosome (Ph)- positive group (n = 9) and Ph-negative group (n=10) (not significant [NS]). The median OS in the Ph-positive group (n = 9) was 23 months, and the 5-year OS was 32%. (C). Among the patients in the Ph-negative group, there was no significant difference in the OS rate between the patients classified into the MRC high risk-positive group (n = 2) and MRC high risk-negative group (n=8) (NS). The median OS was not reached in the MRC high risk-positive group, and the 5-year OS in this group was 100%.(D) There was no significant difference in the OS rate between the patients classified as having B-ALL (n = 17) and those classified as having T-ALL (n=2) (NS). The median OS duration in the B-ALL group was 70 months, and the 5-year OS was 42%. (E) The group of patients who showed relapse within one year of treatment showed a significantly reduced OS duration and 5-year OS rate (n = 8; median OS, 23 months; 5-year OS rate 16%, p < 0.05). (F) There was no significant difference in the OS rate between patients who underwent (n=7)/ did not undergo (n=12) allogeneic stem cell transplantation (NS). The median OS duration in the patients who underwent allogeneic stem cell transplantation was 70 months, and the 5-year OS rate was 40%.
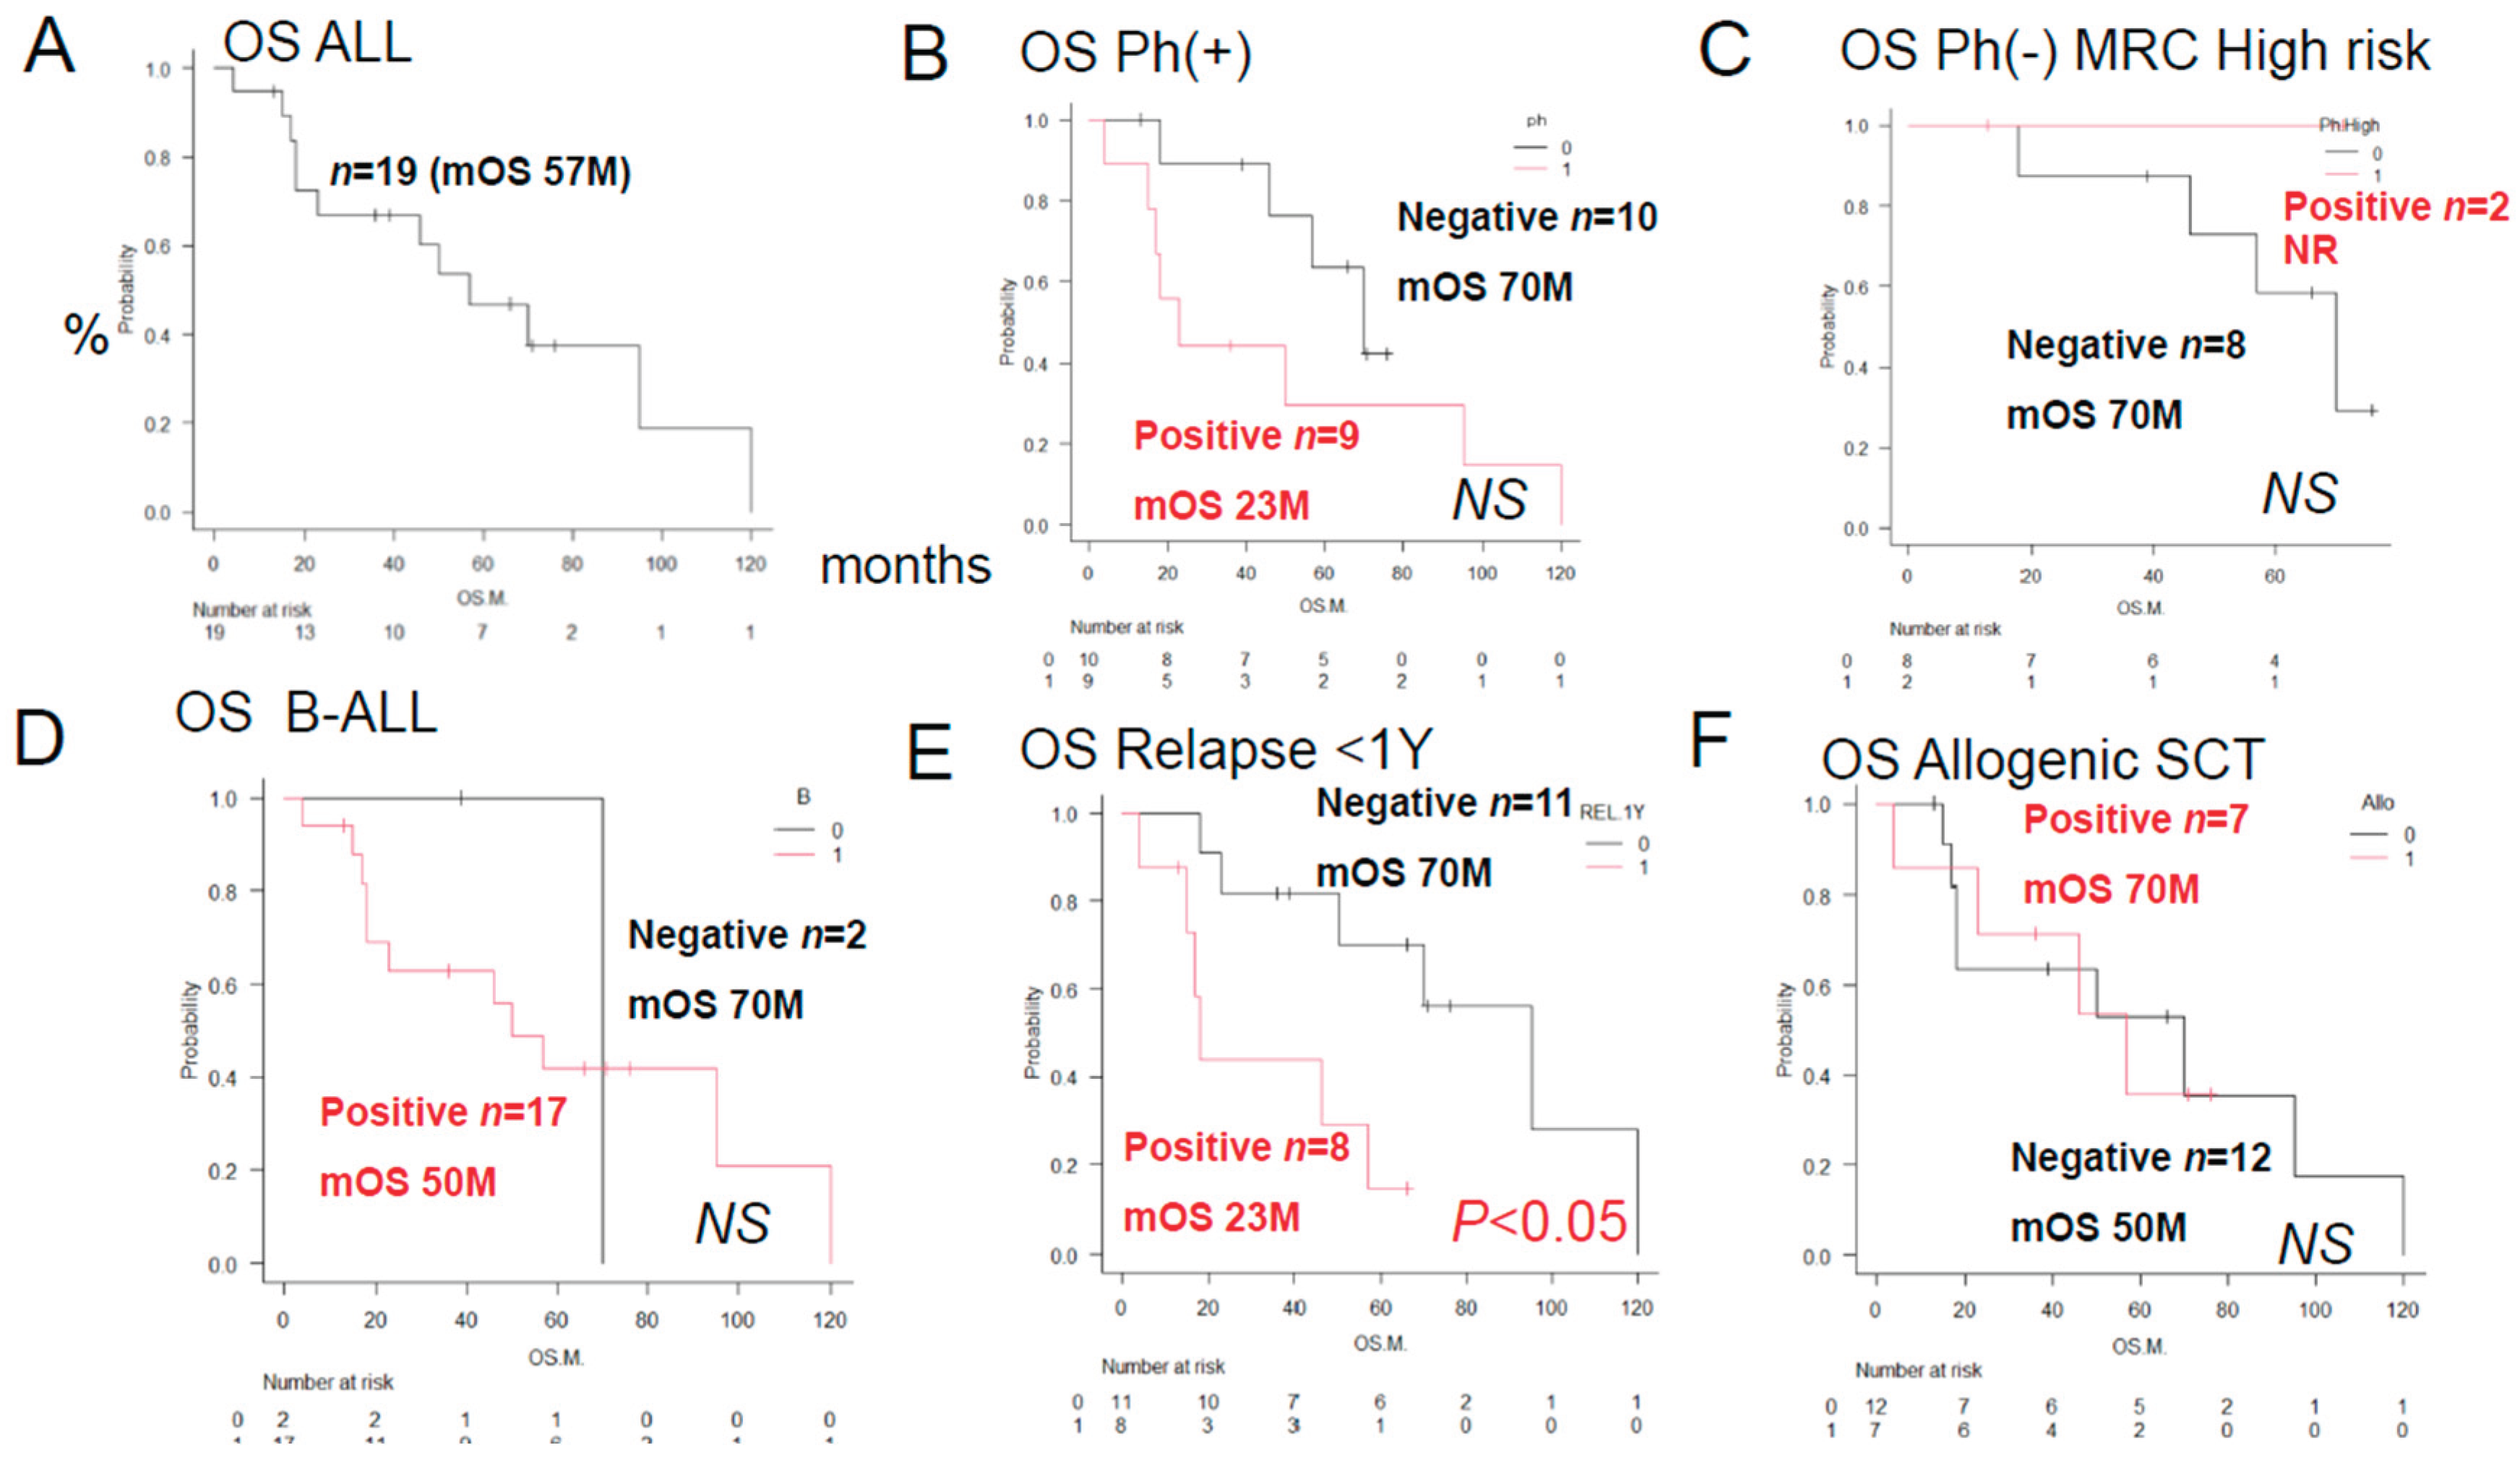
Figure 2.
Overall survival of ALL patients with and without the prognostic factors. We compared the Kaplan–Meier survival curves and disease/prognostic factors between 2 groups by the log-rank test. Comparison of the overall survival (OS) duration after initial remission induction therapy with Hyper CVAD/MA. Hereafter, the red letters indicate the OS durations in the group showing positive immunostaining of the ALL blast cells for the prognostic factor, and the black letters indicate the OS in the group showing negative immunostaining for the prognostic factor. (A) The AKR1B10-positive group showed a significantly reduced OS duration/2-year OS rate (n = 3; median OS, 18 months; 2-year OS rate, 0%; p < 0.05). (B). The AKR1C3-positive group showed a significantly reduced OS duration/2-year OS rate (n = 7; median OS, 35 months; 2-year OS, 18%; p < 0.05). (C). There was no significant difference in the OS rates between the AKR1B1-positive (n = 1) and AKR1B1-negative (n=18) groups (NS). The median OS was not reached in the AKR1B1-positive group, and the 5-year OS rate was 100%. (D) There was no significant difference in the OS rates between the MRP1-positive (n = 9) and MRP1-negative (n=10) groups (NS). The OS duration in the MRP1-positive group was 23 months, and the 5-year OS rate was 23%. (E) There was no significant difference in the OS rates between the PD-L2-positive (n=3) and PD-L2-negative (n=16) groups (NS). The OS duration in the PD-L2-positive group was 21 months, and the 2-year OS rate was 0%. (F) There was no significant difference in the OS rate between the CYP2B6-positive (n=1) and CYP2B6-negative (n=18) groups (NS). The median OS was not reached in the CYP2B6-positive group, and the 5-year OS rate was 100%. In summary, the results of univariate analyses showed that the decrease in OS rates differed significantly between patients showing positive/negative tumor cell expressions of (A) AKR1B10 (p<0.05), (B) AKR1C3 (p<0.05), (C) AKR1B1 (a competitive inhibitor of AKR1B10) (NS), (D) MPR1 (NS), (E) PD-L2 (NS), and (F) CYP2B6 (NS).
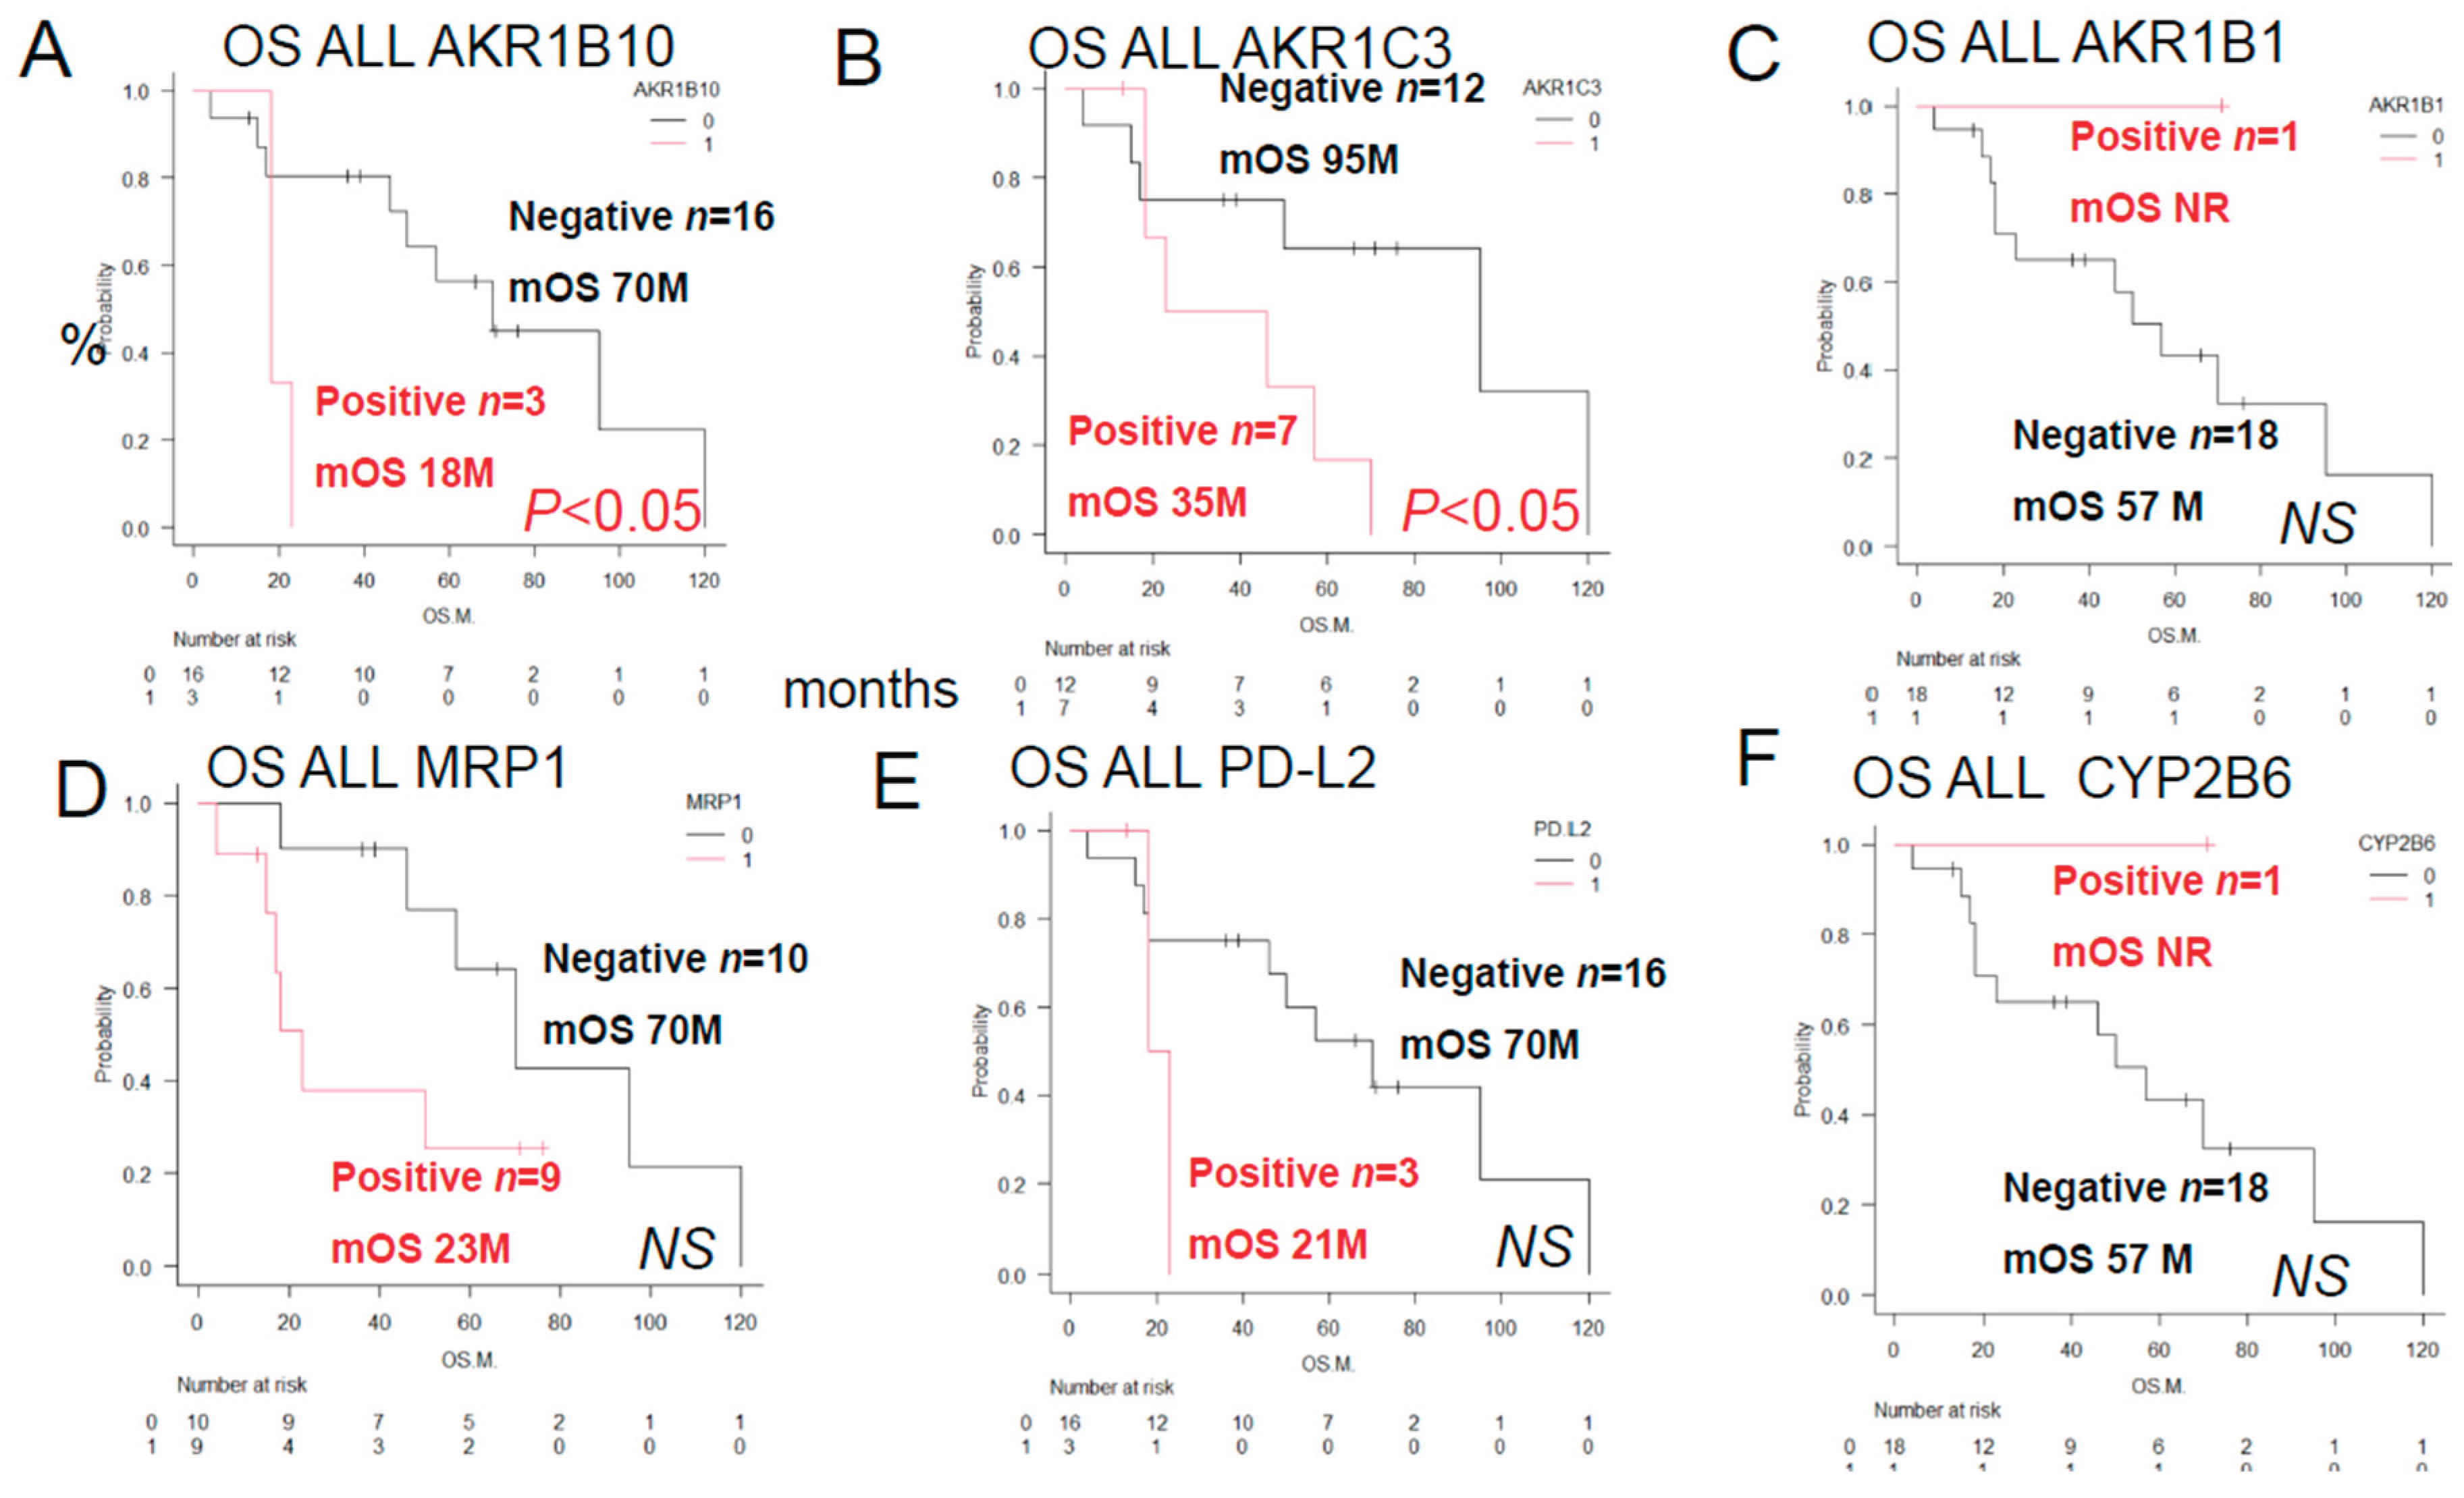
Figure 3.
Overall Survival of ALL Patients showing different combinations of AKR1C3 and AKR1B10 expressions, AKR1B1 and AKR1B10 expressions, AKR1B10 and CYP2B6 expressions, MRP1 and AKR1C3 expressions, Philadelphia chromosome status and AKR1C3 expression. We compared the Kaplan–Meier survival curves and prognostic factors as assessed by immunostaining between 2 groups by the log-rank test. Data/OS outcomes are shown in black for cases where the results were negative for both factors, in blue for cases where the results were positive for both factors, in green and blue for cases where the result was positive for one and negative for the other factor of the prognostic combination. See
Table 2 for the correlation between AKR1B10 and other factors. (
A) Significant differences in the OS duration/OS rate were observed for different combinations of AKR1C3 (C3) and AKR1B10 (B10) expressions (p < 0.05): AKR1C3 (-) AKR1B10 (-), n = 12; mean OS 95 months, 5-year OS 63%; AKR1C3 (-) AKR1B10 (+), n = 3, mean OS 57 months, 5-year OS 33%; AKR1C3 (+) AKR1B10 (+), n = 3, mean OS 12 months, 5-year OS 0%; (
B) Significant differences in the OS duration/OS rate were observed for different combinations of AKR1B1 (B1) and AKR1B10 expressions (p < 0.05): AKR1B1 (+) AKR1B10 (-), n = 1, OS not reached, 5-year OS 100%; AKR1B1 (-) AKR1B10 (-), n = 15, median OS 70 months, 5-year OS 52%; AKR1B1 (-) AKR1B10 (+), n=3, median OS 18 months, 2-year OS 0%. (
C) Significant differences in the OS duration/OS rate were observed for different combinations of MRP1 (P1) and AKR1C3 expressions (p < 0.05): MRP1(P1) (+) AKR1B10 (-), n = 1, OS not reached, 5-year OS 100%; CYP2B6 (-) AKR1B10 (-), n = 15, median OS 70 months, 5-year OS 52%; CYP2B6 (-) AKR1B10 (+), n=3, median OS 18 months, 2-year OS 0%. Thus, the OS duration and rates for AKR1B1 (+) AKR1B10 (-) was identical to that for CYP2B6(+) AKR1B10 (-). (
D) Significant differences in the OS duration/OS rates were observed for different combinations of MRP1 (P1) and AKR1C3 expressions (p < 0.05): MRP1 (-) AKR1C3 (-), n = 6, mean OS 108 months, 5-year OS rate100%; MRP1 (-) AKR1C3 (+), n = 4, mean OS 52 months, 5-year OS rate 34%; MRP1 (+) AKR1C3 (-), n = 6, mean OS 34 months, 5-year OS rate 26%; MRP1 (+) AKR1C3 (+), n = 3, mean OS 21 months, 2-year OS rate 0%; (E) Significant differences in the OS duration/OS rates were observed for different combinations of the tumor cell Philadelphia chromosome (Ph) status and AKR1C3 expression (p < 0.05): Ph(-) AKR1C3 (-), n = 5, median OS not reached, 5-year OS 100%; Ph (-) AKR1C3 (+), n = 5, median OS 52 months, 5-year OS rate 24%; Ph (+) AKR1C3(+), n=2, median OS 21 months, 2-year OS rate 0%. (F) No significant differences in the OS duration or rate were observed for different combinations of tumor Ph status and AKR1B10 expression; Ph(-) AKR1B10 (-), n = 9, median OS 70 months, 5-year OS rate 70%; Ph (+) AKR1B10 (-), n = 7, median OS 50 months, 5-year OS rate 38%; Ph (+) AKR1B10(+), n=2, median OS 21 months, 2-year OS rate 0%. Ph (-) AKR1B10(+), n=1, OS 18 months, 2-year OS rate 0%.
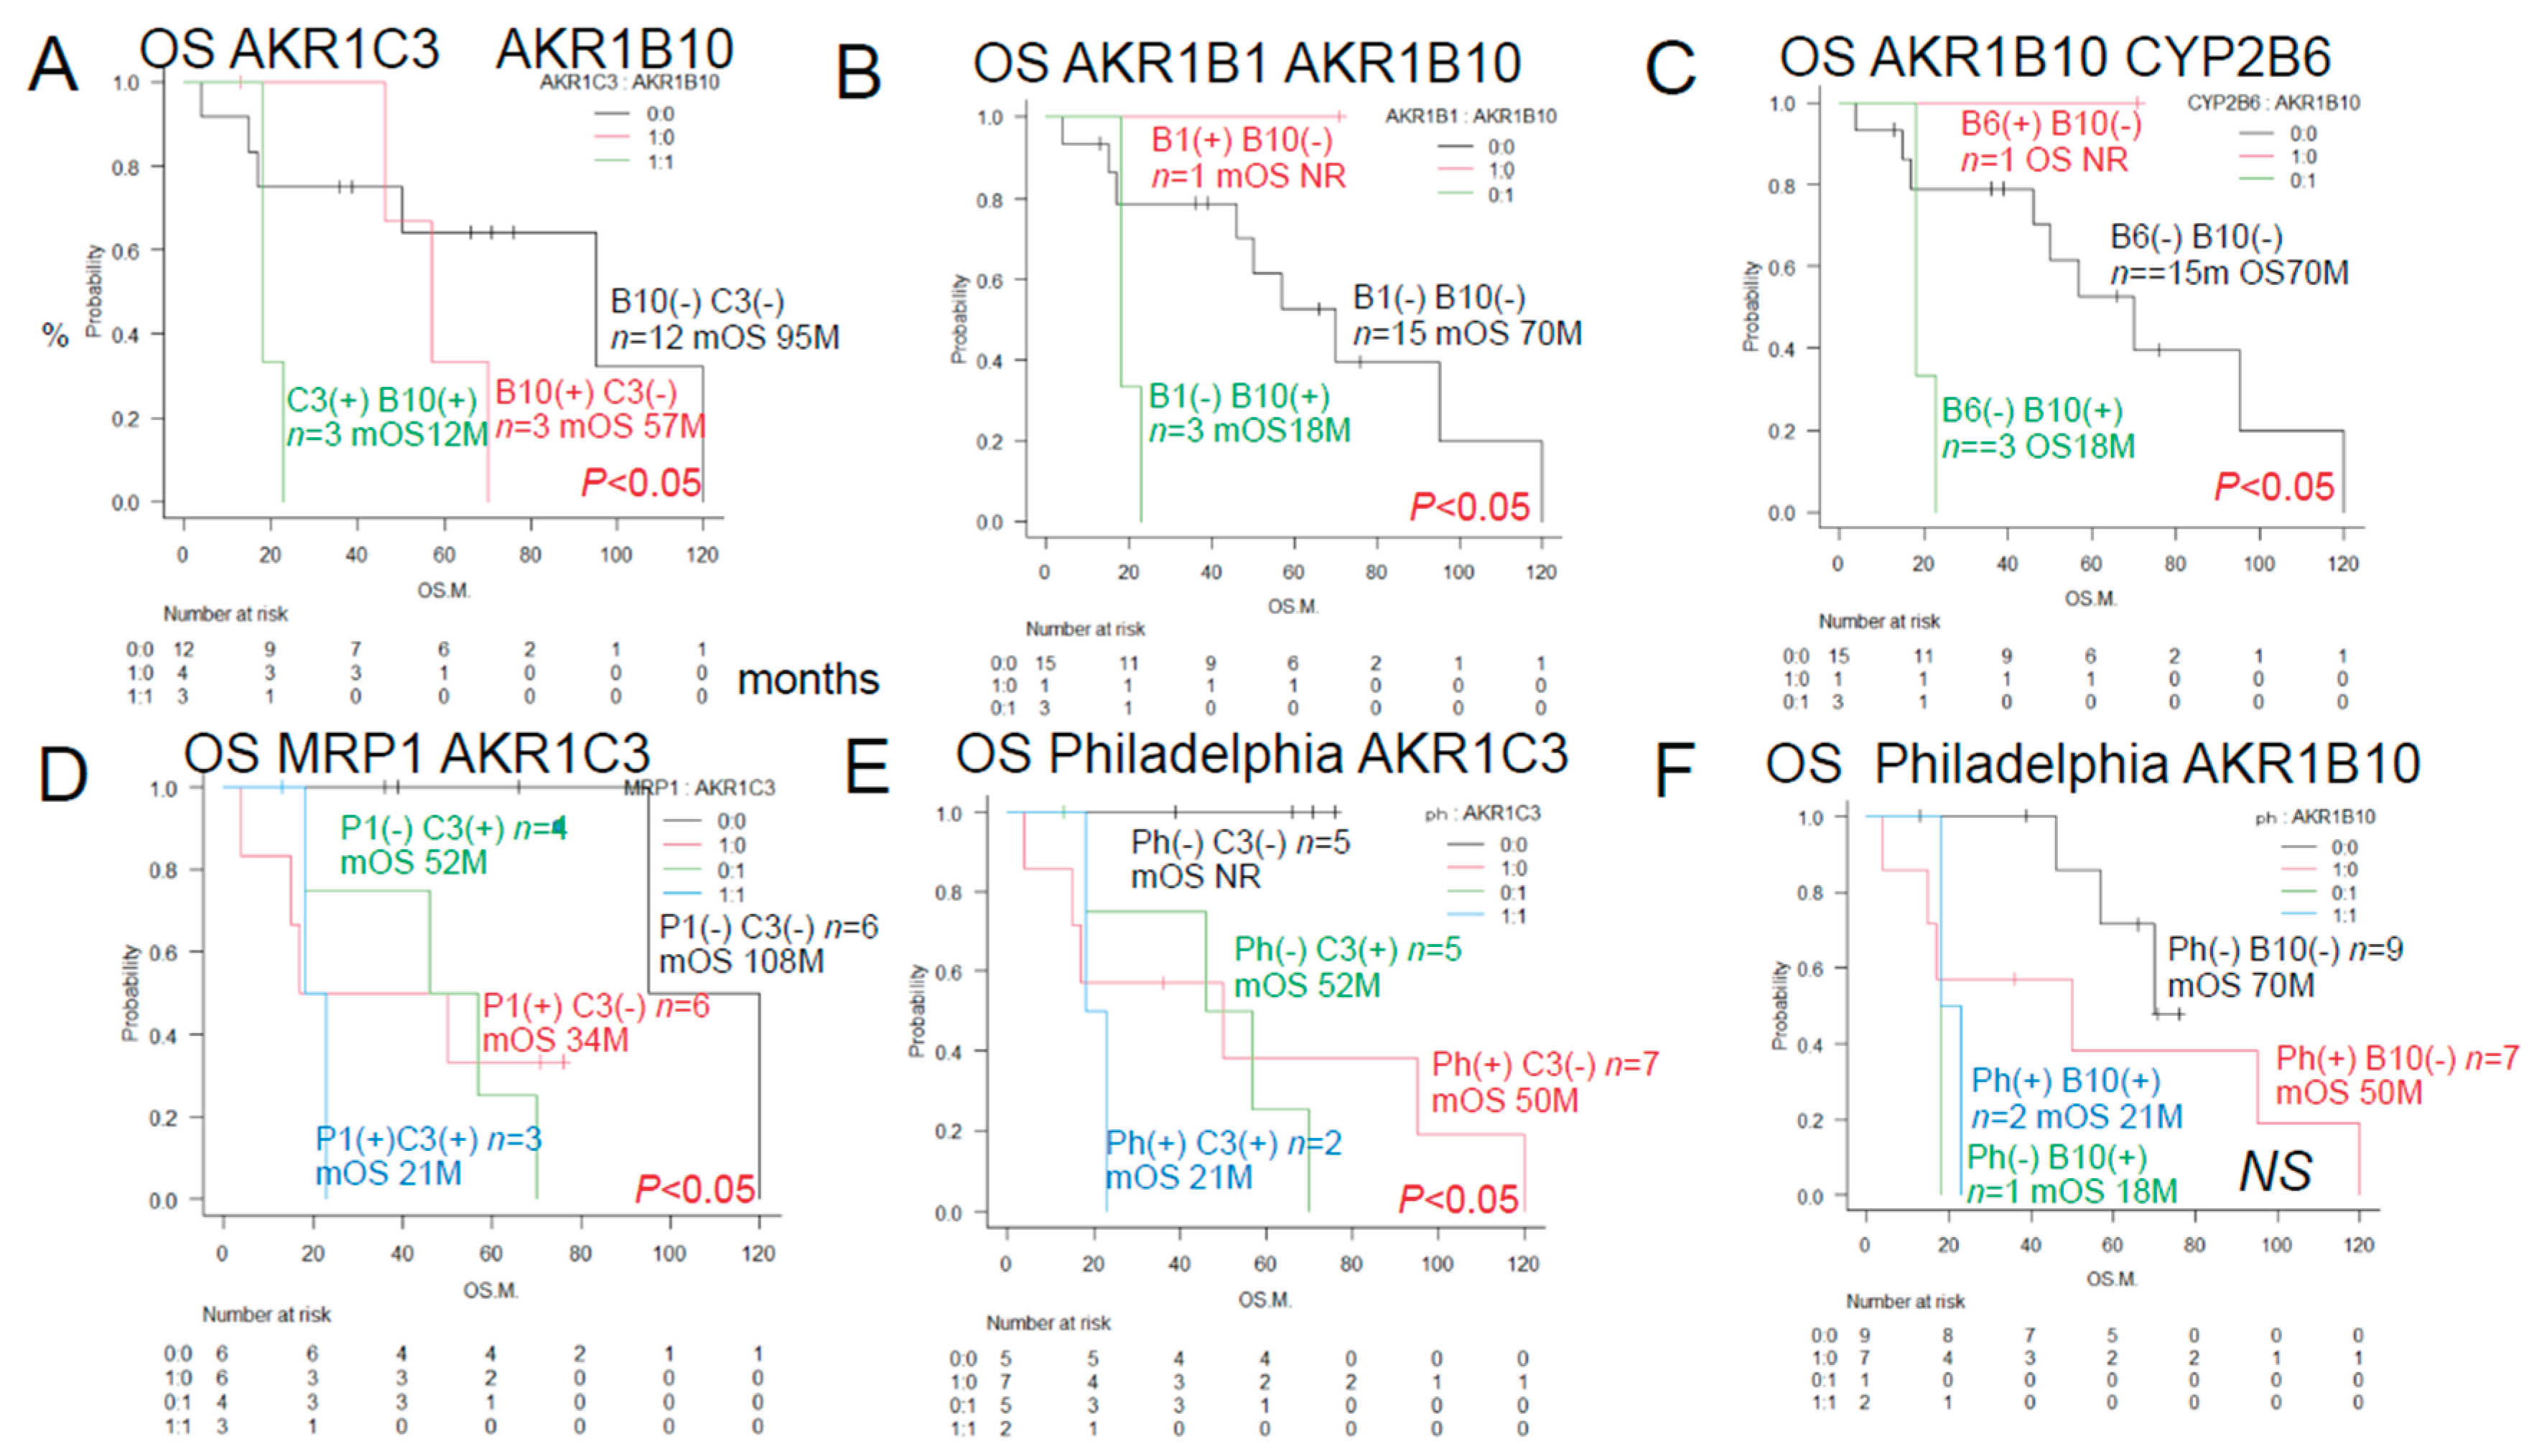
Figure 4.
Urayasu classification for ALL (groups 1-4). Group 1 ( Good prognosis group): AKR1B1 (+) AKR1B10(-), n=1, median OS not reached, 5-year OS rate 100%. Group 2+Group 3 (Intermediate prognosis): AKR1B1 (-) AKR1B10(-), n=15, median OS 70 months, 5-year OS rate 52%. Group 4 (Poor prognosis): AKR1B1 (-) AKR1B10(+), n=3, median OS, 18 months, 2-year OS rate 0%. Group 2 (Intermediate-1 prognosis): AKR1B1 (-) AKR1B10(-) MRP1(-), n=9, median OS 70 months, 5-year OS rate 72%. Group 3 (Intermediate-2 prognosis): AKR1B1 (-) AKR1B10(-) MRP1(+) n=6, median OS 17 months, 5-year OS rate 20%.
Figure 5A.
Case 1: A 52-year-old male patient. In April 2019, he visited a local doctor with testicular swelling, oral bleeding, and bloody stools. Blood tests showed an elevated WBC count of 100,000/μL, a serum LDH level of 2000 IU, and a reduced PLT count of 8000/μL. The patient was referred to our hospital and was diagnosed based on the results of a bone marrow biopsy as having Philadelphia chromosome-negative B-cell acute lymphoblastic leukemia. Complete remission was achieved with Hyper CVAD chemotherapy. He received consolidation therapy with MA and repeated Hyper CVAD/MA alternating therapy three times. Allogeneic hematopoietic stem cell transplantation was performed in October 2019 and the patient has survived for 71 months since, without recurrence. CVAD is a combination therapy regimen consisting of cyclophosphamide, vincristine, adriamycin (doxorubicin), and dexamethasone. MA is a combination therapy regimen consisting of methotrexate and arabinocytidine (cytarabine).
Figure 5B.
Case 2: A 46-year-old female patient with Philadelphia chromosome-negative B-ALL. The WBC count was 220,000 at diagnosis, and the patient was classified as high risk according to the MRC ECOG classification. Complete remission was achieved after Hyper CVAD/MA antibody therapy in February 2021. However, the patient developed relapse about 6 months later. Blinatumomab therapy and Hyper CVAD therapy were administered again, but complete remission failed to be achieved. In June 2022, after TBI+CY conditioning, she underwent allogeneic hematopoietic stem cell transplantation and achieved complete remission and has remained alive for 46 months since.
Figure 5C.
Case 3: A 51-year-old man presented with a history of redness, swelling, and tenderness in his right lower leg. A blood test showed an elevated white blood cell count of 24,700 (blasts 73.5%), and the patient was referred to our hospital, where we diagnosed him as having Philadelphia chromosome-positive acute lymphoblastic leukemia. Complete remission was achieved with Dasatinib + Hyper CVAD/MA therapy. However, relapse occurred. he patient did not wish to undergo allogeneic hematopoietic stem cell transplantation. Instead, he received palliative salvage therapy with ponatinib plus VP, to which he showed poor response. His disease continued to progress and he eventually died in March 2019.
Figure 5D.
Case 4 A 54-year-old man with Ph-positive ALL. As the initial induction therapy, we administered the tyrosine kinase inhibitor dasatinib + Hyper CVAD/MA therapy, which resulted in complete remission. After a total of four chemotherapy treatments (two each), the disease relapsed approximately six months later. He received ponatinib + Hyper CVAD/MA for treatment of the relapse, but the treatment proved ineffective. As the patient did not wish to undergo allogeneic transplantation, we administered blinatumomab four times and inotuzumab+ozogamicin twice, but these treatments were also ineffective, and the patient died approximately 16 months after the diagnosis. The family refused an autopsy.
Figure 6.
Chemoresitance mechanism in ALL cells. Future AKR1B10 inhibitor therapy may require individualized treatment. AKR1B10 shares 70.6% amino acid sequence identity with the aldose reductase enzyme AKR1B1, and their structures and substrate specificities are very similar. Many compounds that inhibit AKR1B10 also inhibit AKR1B1 to the same degree. AKR1B10 positivity also confers resistance to cisplatin. It is also known to confer a high degree of resistance to cyclophosphamide (CY), which may reduce the effectiveness of CY used in allogeneic transplant conditioning regimens such as CY+YBI and CY+busulfan, potentially increasing the relapse rate. AKR1B10 expression is regulated by a gene on chromosome 7q33. Chromosome 7 deletions may result in activation of AKR1B10. The Bcr-Abl tyrosine kinase inhibitor dasatinib inhibits AKR1B10 and inhibits the metabolism of daunomycin and idarubicin, making it promising for therapeutic application. NSAIDs such as N-phenyl-anthranilic acid, diclofenac, and glycyrrhetinic acid competitively inhibit AKR1B10. Based on the above, dasatinib and other NSAIDs are considered promising AKR1B10 inhibitors for stratified treatment of ALL.
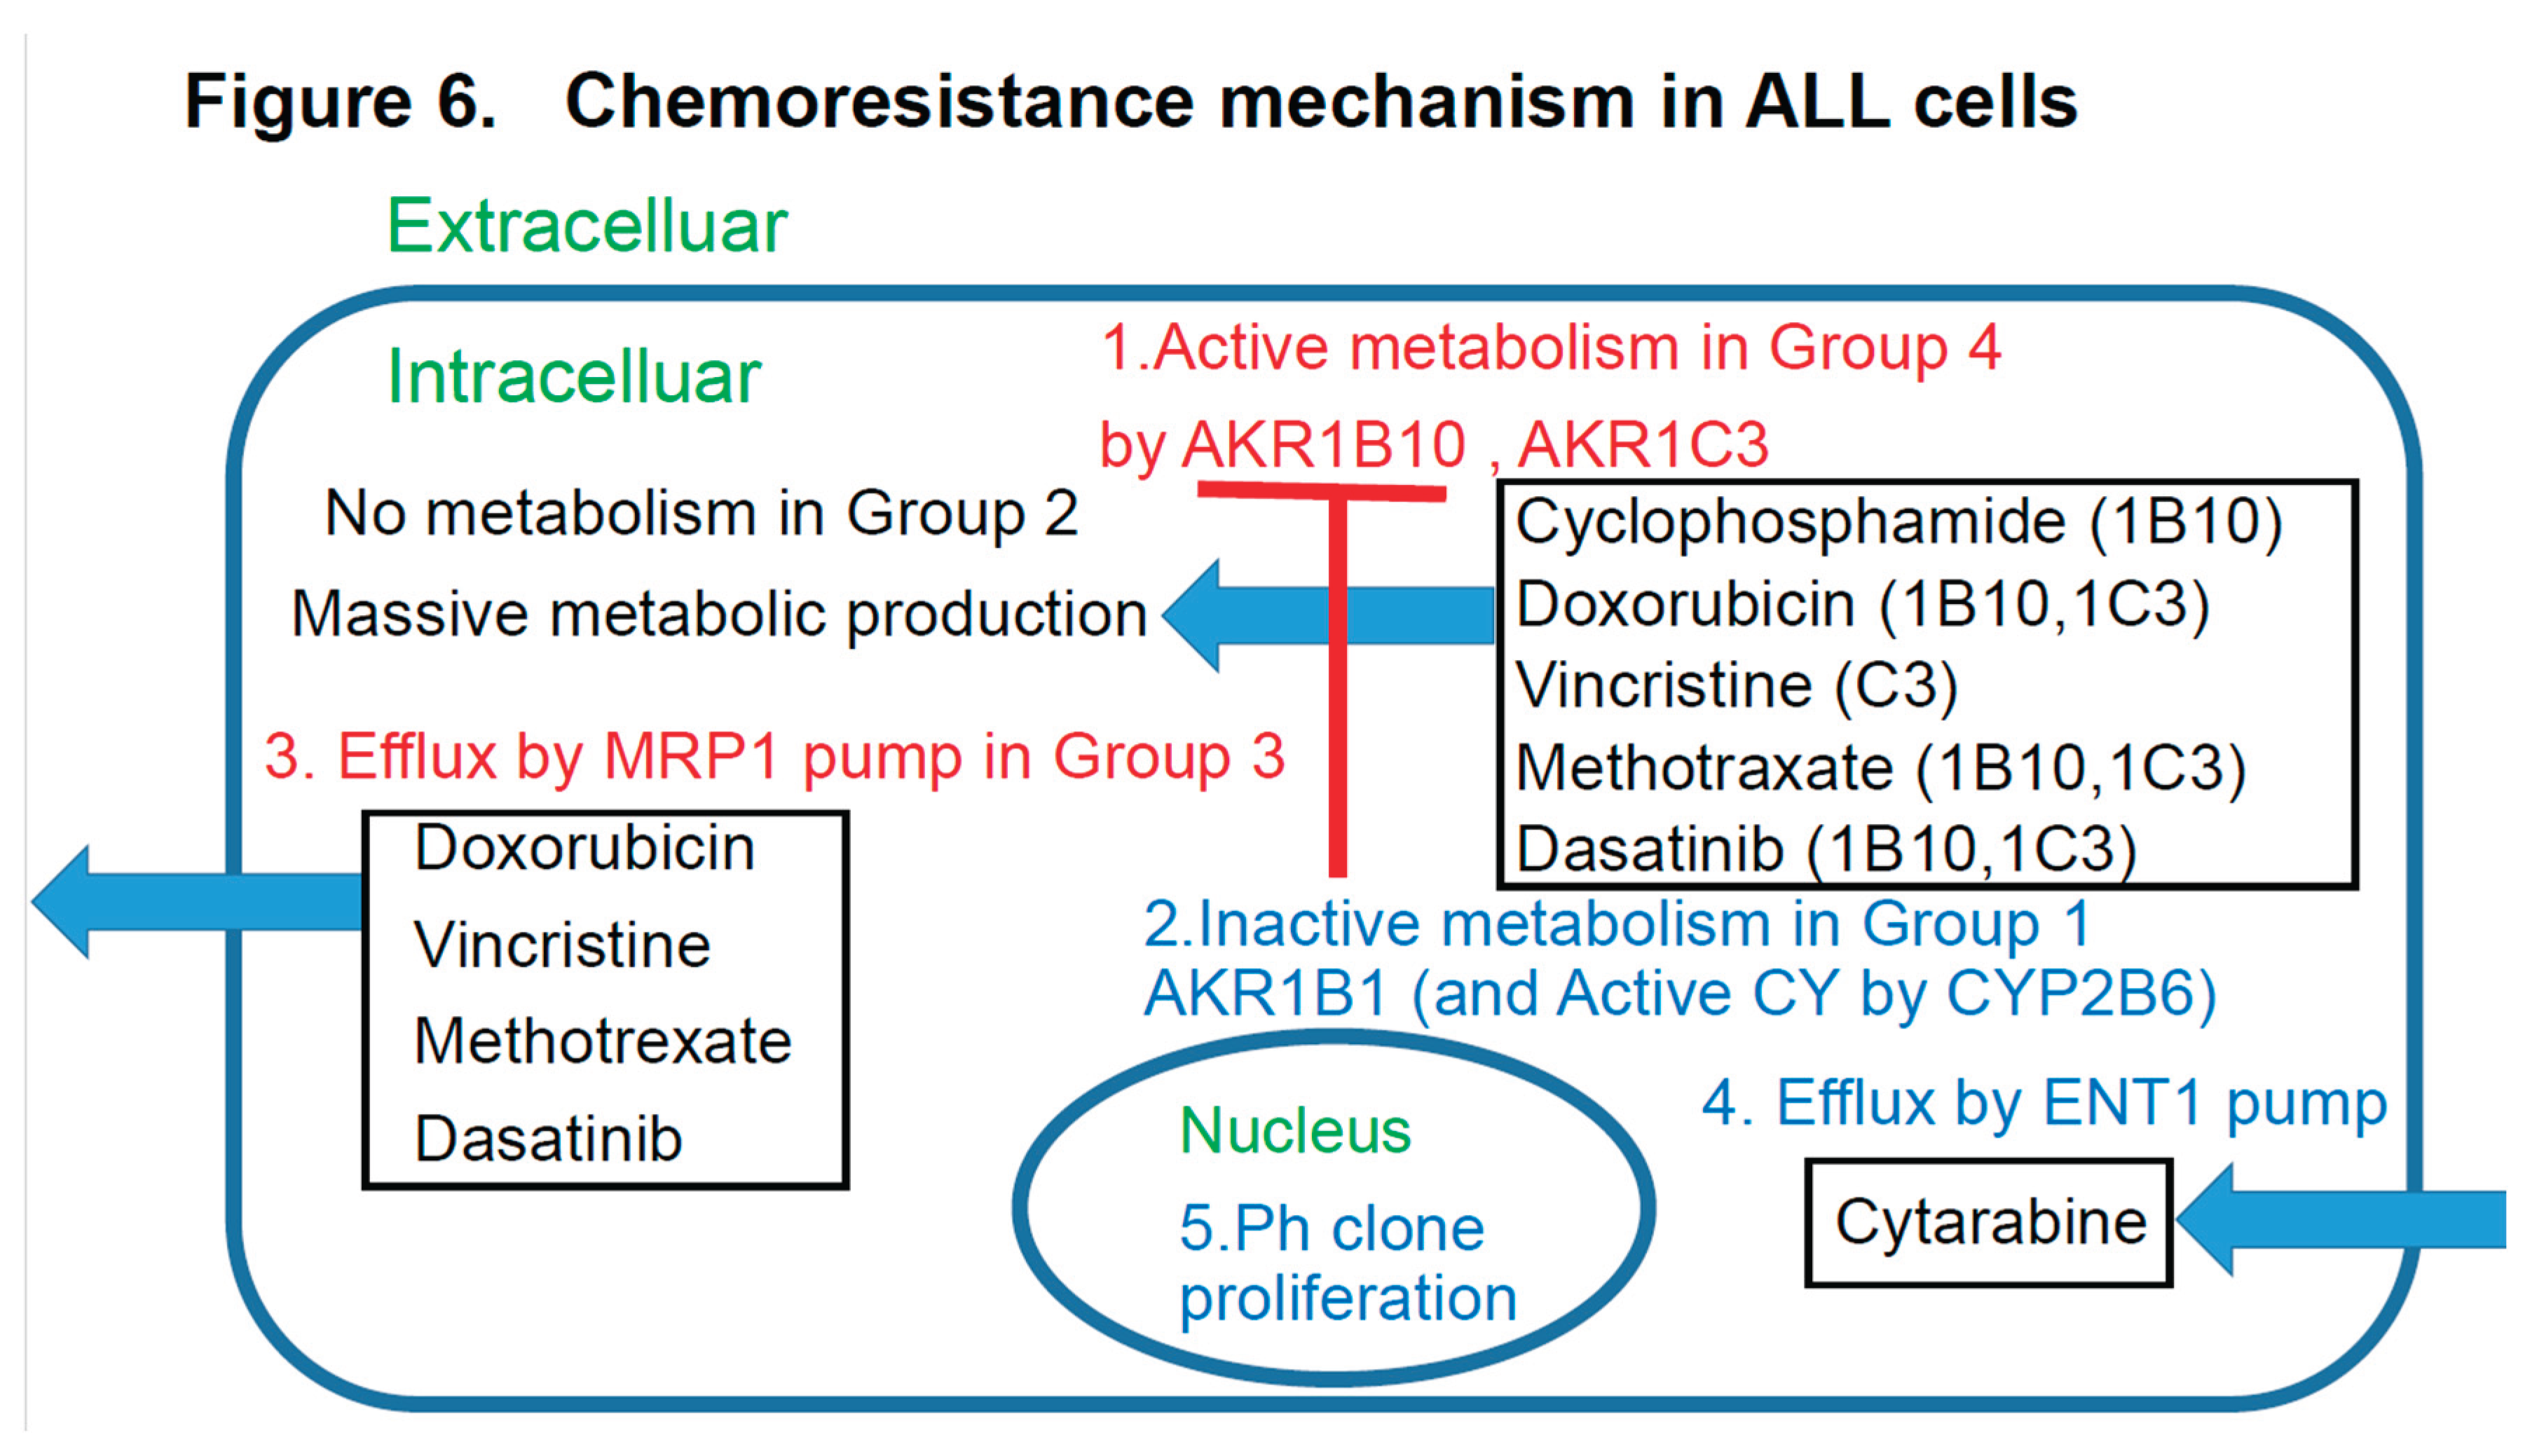
Figure 8.
A summary of the prognostic factors associated with treatment resistance in LBCL [
1], TCL [
2], AML [
3], and ALL (current study) in an easy-to-understand Venn diagram with four circles in the literature. The therapeutic agents used for hematological malignancies (AML, ALL, TCL, LB, etc.) shown in
Table 3 are converted into a Venn diagram in
Figure 8, which summarizes the mechanisms of therapeutic resistance. The therapeutic resistance mechanisms mainly involve at least three enzymes (AKR1B10, AKR1C3, and CYP3A4), one inflow pump (ENT1) which improves therapeutic efficacy, and two efflux pumps. LB stands for large B-cell lymphoma. Furthermore, the incidence of each tumor is shown as a percentage based on references 1-3 and this study. Stars (★) indicate tumors with significant differences in the survival time for each factor. Many anticancer drugs and molecular-targeted drugs are taken up into tumor cells via concentration gradient inflow pumps. 1 However, MTX, gemcitabine, cytarabine (Ara-C), romidepsin, etoposide, bendamustine, azacitidine (AZA), and forodesine are transported via the inflow pump ENT1. If ENT1 is not expressed, the efficacy of these pathway-dependent agents is diminished. However, ENT1 is expressed in 100% of TCLs. 2) Many anticancer drugs and molecular- targeted drugs are metabolized by three enzymes (AKR1B10, AKR1C3, and CYP3A4) and two efflux pumps in tumor cells, reducing their effectiveness. 3) CYP3A4 expression is 0% in TCL and ALL. CYP3A4 expression is also rare overall. 4) Furthermore, efflux pump expression is rare in TCL, so AKR1B10 and AKR1C3 are involved in treatment resistance in TCL. In addition to AKR1, the microenvironmental factors shown in
Figure 7 are important. 5) In LBCL (LB), ALL, and AML, the AKR1 enzyme and efflux pumps are often involved in treatment resistance.
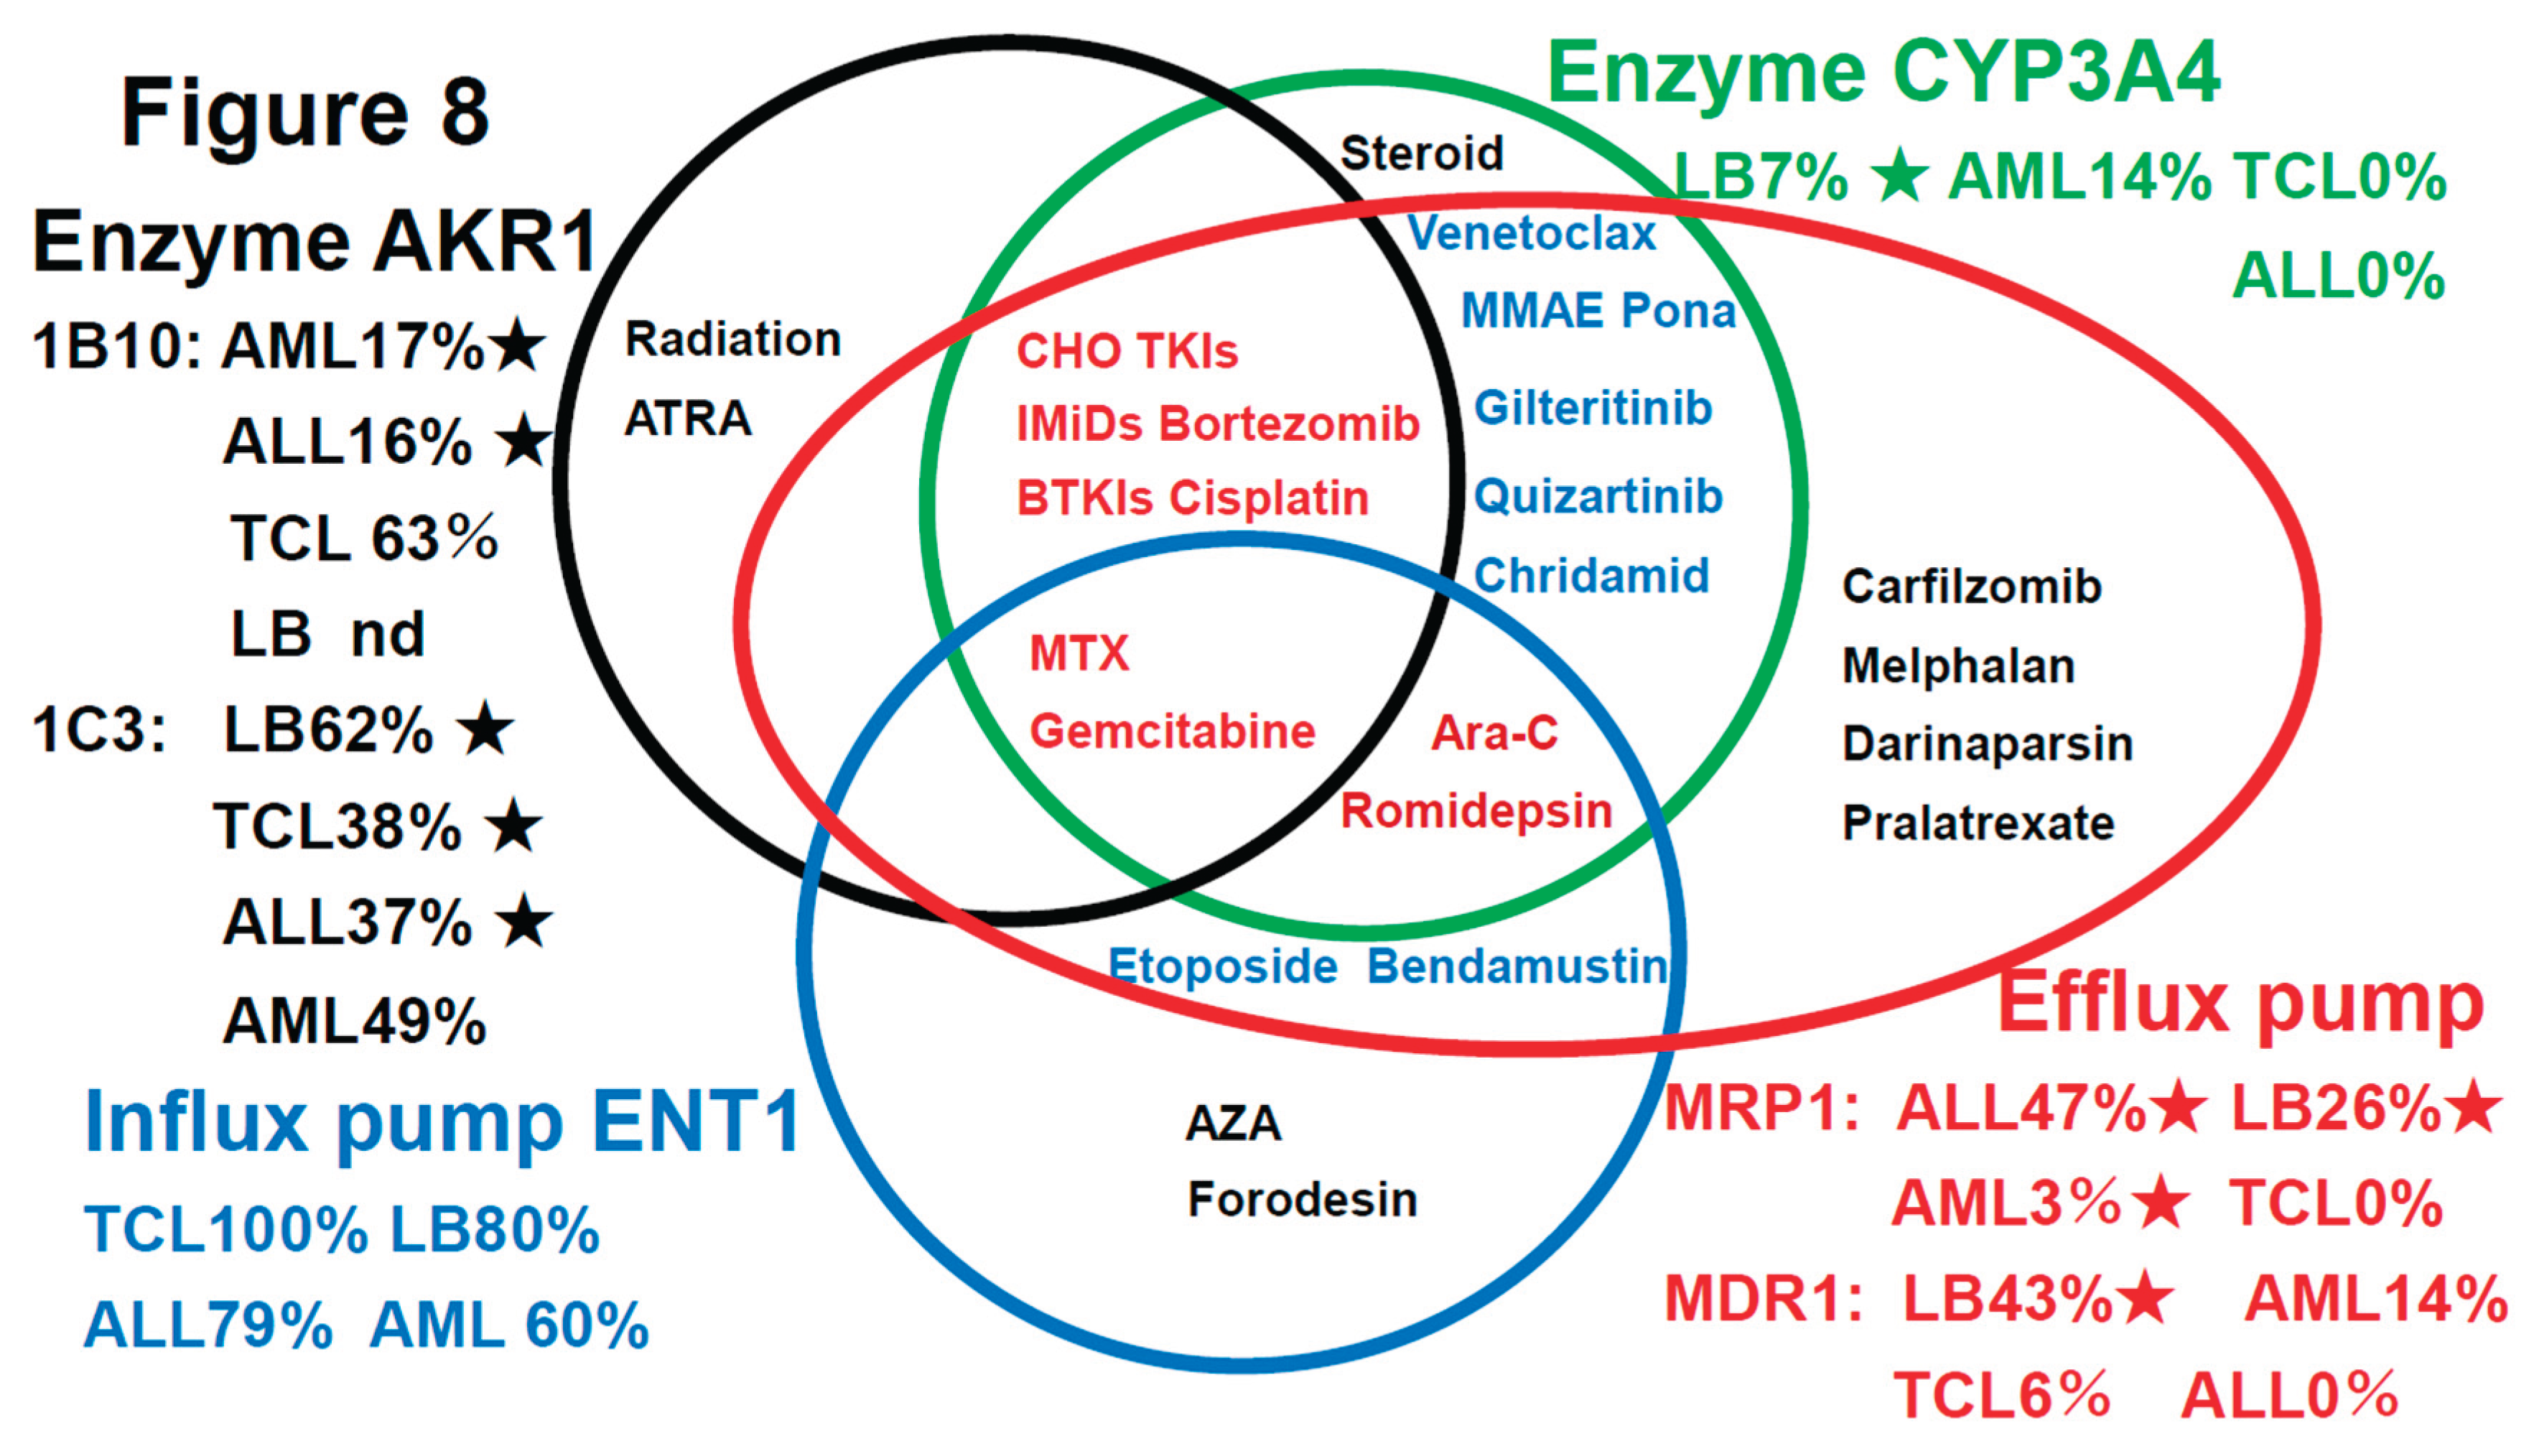
| Characteristics of the ALL patients included in this study |
n=19 |
| Age > 35 years (%) (16-76 yo) |
12 (63%) |
| Male (%) |
12 (63%) |
| B-cell lymphoma |
17 (89%) |
| T-cell lymphoma |
2 (11%) |
| Philadelphia chromosome (Ph)-positive |
10 (53%) |
| Philadelphia chromosome (Ph)-negative |
9 (47%) |
| WBC count at diagnosis > 30 x10*9/L Ph(-) |
3 (16%) |
| WBC count at diagnosis > 30 x10*9/L Ph(-) Age >35 yo High risk |
2 (11%) |
| Induction chemotherapy |
|
| Cyclophosphamide+Doxorubicin+Vincristine+Dexamethathone |
19 (100%) |
| to Methotrexate+Cytosine arabinoside |
|
| Outcome |
|
| Complete remission (CR) |
17 (89%) |
| Relapse within one year |
8 (42%) |
| Progressive disease (PD) |
2 (11%) |
| Allogeneic stem cell transplantation |
7 (37%) |
Table 2.
The results of univariate analyses showed that the OS rates differed significantly among patients showing different patterns of expressions of the prognostic factors.
Table 2.
The results of univariate analyses showed that the OS rates differed significantly among patients showing different patterns of expressions of the prognostic factors.
| Category |
Factors (♯Significant
difference:)
|
n |
Median OS
(months)
|
Years (Y) 5-year survival rate |
p value |
Figure |
| Total |
ALL |
19 |
57M |
44% |
|
1A |
| ALL MRC classification |
MRC ph (+) |
9 |
23M |
28% |
NS |
1B |
| |
MRC ph (-) High risk |
2 |
NR |
100% |
NS |
1C |
| |
MRC ph (-) Standard risk |
8 |
70M |
58% |
NS |
1D |
| Other prognostic factors |
Relapse <1Y |
8 |
23M |
14% |
*p<0.05 |
1E |
| Transplantation |
Allogeneic transplantation |
7 |
70M |
36% |
NS |
1F |
| CHO metabolic enzyme |
AKR1B10 (♯)
|
3 |
18M |
0% |
*p<0.05 |
2A |
| |
AKR1C3 |
7 |
35M |
18% |
*p<0.05 |
2B |
| |
AKR1B1 |
1 |
NR |
100% |
NS |
2C |
| Fibrosis |
Silver stain |
6 |
95M |
78% |
NS |
|
| HO efflux pump |
MDR1 |
0 |
|
|
|
|
| |
MRP1 |
9 |
23M |
22% |
NS |
2D |
| MTX efflux pump |
MRP4 |
0 |
|
|
|
|
| Immune check point |
PD-1 |
0 |
|
|
|
|
| |
PD-L1 |
0 |
|
|
|
|
| |
PD-L2 |
3 |
21M |
0% |
NS |
2E |
| C activating enzyme |
CYP2B6 |
1 |
NR |
100% |
NS |
2F |
| CHOP metabolic enzyme |
CYP3A4 |
0 |
|
|
|
|
| ER stress proteins |
GRP78 |
8 |
70M |
56% |
NS |
|
| |
GRP94 |
13 |
57M |
48% |
NS |
|
| |
TGF-beta1 |
7 |
50M |
42% |
NS |
|
| |
TNF-alpha1 |
|
|
|
|
|
| Others |
GST |
7 |
73M |
50% |
NS |
|
| |
Ki-67 |
12 |
46M |
22% |
NS |
|
| |
MYC |
5 |
40M |
0% |
NS |
|
| |
P53 |
1 |
NR |
100% |
NS |
|
| |
TP |
0 |
|
|
|
|
| Significant prognostic combinations |
AKR1C3(+), AKR1B10(+) (♯)
|
3 |
18M |
0% |
*p<0.05 |
3A |
| |
AKR1B1(-), AKR1B10(+) (♯)
|
3 |
18M |
0% |
*p<0.05 |
3B |
| |
CYP2B6(-), AKR1B10(+) (♯)
|
3 |
18M |
0% |
*p<0.05 |
3C |
| |
MRP1(+), AKR1C3(+) (♯)
|
3 |
21M |
0% |
*p<0.05 |
3D |
| |
Ph(+), AKR1C3(+) (♯)
|
2 |
21M |
0% |
*p<0.05 |
3E |
| |
Ph(+), AKR1B10(+) (♯)
|
2 |
21M |
0% |
NS |
3F |
| Urayasu classification |
ALL UG1 AKR1B1(+), AKR1B10(-) |
1 |
NR |
100% |
*p<0.05 |
4A, 3B |
| |
ALL UG2 AKR1B1(-),AKR1B10(-)MRP1(-) |
9 |
70M |
48% |
*p<0.05 |
4B |
| |
ALL UG3 AKR1B1(-),1AKRB10(-)MRP1(+) |
6 |
17M |
20% |
*p<0.05 |
4B |
| |
ALL UG4 AKR1B1(-), AKR1B10(+) |
3 |
18M |
0% |
*p<0.05 |
4A, 3B |
Table 3.
Influence of the activities of functional proteins on the intracellular anticancer drug concentrations in neoplastic cells (reference 29-133).
Table 3.
Influence of the activities of functional proteins on the intracellular anticancer drug concentrations in neoplastic cells (reference 29-133).
| Dasatinib+Hyper CVAD/MA |
|
|
|
Functional proteins |
|
|
|
Chemotherapy
in ALL cells, Others |
AKR1B10 |
AKR1C3 |
CYP3A4 |
CYP2B6 |
MRP1 |
ENT1 |
AKR1B1 |
MDR1 |
| Dasatinib |
Decrease(37) |
Decrease(29) |
Decrease(38) |
|
Decrease(39)
Decrease(79) |
|
|
Decrease(91) |
| Asciminib |
|
Decrease(114) |
Decrease(115) |
|
|
|
Decrease(116) |
| Ponatinib |
|
|
Decrease(117) |
|
|
|
Decrease(118) |
| Cyclophosphamide |
Decrease(40) |
|
Decrease(47) |
Increase(56) |
|
|
Increase(66)
by acrolein
(cardiotoxity
decrease)
(29)
AKR1B10
inhibition (4) |
|
| Vincristine |
|
Decrease(41) |
Decrease(48) |
|
Decrease(58)
Decrease(73) |
|
|
Decrease(93) |
| Doxorubicin |
Decrease(40) |
Decrease(42) |
Decrease(49) |
|
Decrease(59) |
|
Weak
decrease(29)
|
Decrease(95) |
| Idarubicin |
Decrease(40) |
Decrease(43) |
|
|
Decrease(60) |
|
Paclitaxel
Increase(67) |
Decrease(94) |
| Dexamethosone |
|
|
Decrease(50) |
Decrease(57) |
|
|
|
|
| Methotraxate |
Decrease(40) |
Decrease(44) |
|
|
Decrease(23)
Decrease(73) |
|
|
Decrease(97) |
| Cytarabine |
|
|
Decrease(51) |
|
|
Increase(21) |
|
|
| Cisplatin |
Decrease(40) |
Decrease(45) |
Decrease(52) |
|
Decrease(61) |
|
Weak
decrease(29) |
Decrease(96) |
| Iburutinib |
|
Decrease(46) |
Decrease(53) |
|
Decrease(62) |
|
|
Decrease(98) |
| Gemcitabine |
Decrease(40) |
Decrease(45) |
Decrease(54) |
|
Decrease(63) |
Increase(65) |
|
Decrease(99) |
| Venetclax |
|
|
Decrease(55)
|
|
Decrease(64) |
|
|
Decrease(100) |
| Azacitidine |
|
|
|
|
|
Increase(104) |
|
| Etoposide |
|
|
|
|
Decrease(73) |
Increase(80)
|
Decrease(94) |
| Radiation |
Decrease(81) |
Decrease(82) |
|
|
|
|
|
|
| Lenalidomide |
|
Decrease(83) |
|
|
Decrease(86) |
|
|
Decrease(102) |
| Pomalidomide |
|
Decrease(89) |
Decrease(88) |
|
Decrease(89) |
|
|
|
| Bortezomib |
Decrease(84) |
|
Decrease(85) |
|
Decrease(87) |
|
Weak
decrease(77) |
|
| Carfilzomib |
|
|
|
|
|
|
|
Decrease(103) |
| MMAE |
|
|
Decrease(90) |
|
Decrease(101) |
|
Decrease(92) |
| Gilteritinib |
|
|
Decrease(105) |
Decrease(106) |
|
|
Decrease(107) |
| Quizartinib |
|
|
Decrease(108) |
|
|
|
Decrease(109) |
| melphalan |
|
|
|
|
Decrease(110) |
|
Decrease(111) |
| ATRA |
Decrease(112) |
Decrease(112) |
|
|
|
|
|
|
| Darinaparsin |
|
|
Decrease(119) |
Decrease(120) |
|
Decrease(120) |
| Forodesine |
|
|
|
|
|
Increase(121) |
|
| Pralatrexate |
|
|
|
|
Decrease(122) |
|
Decrease(123) |
| Romidepsin |
|
|
Decrease(124) |
Decrease(125)
|
Decrease(126) |
Increase(127) |
Decrease(128) |
| Chidamide |
|
|
Decrease(129) |
Decrease(130) |
|
Decrease(131) |
| Bendamustine |
|
|
|
|
|
Increase(132) |
Decrease(133) |
| Inhibitors |
Epalrestat(78),NSAIDs,etc(68)Dasatinib(37) |
Epalrestat(78)
NSAIDs(69) |
Many
drugs(70) |
Many
Drugs(71) |
Anti-MRP1
Ab,GSH,
NRF2(72),
CyA (73) |
TKIs(74) |
lidorestat,
HAHE(75),
Kusunokinin(76)
EPA(77) |
Inhibitors(113) |
|
Disclaimer/Publisher’s Note: The statements, opinions and data contained in all publications are solely those of the individual author(s) and contributor(s) and not of MDPI and/or the editor(s). MDPI and/or the editor(s) disclaim responsibility for any injury to people or property resulting from any ideas, methods, instructions or products referred to in the content. |
© 2025 by the authors. Licensee MDPI, Basel, Switzerland. This article is an open access article distributed under the terms and conditions of the Creative Commons Attribution (CC BY) license (http://creativecommons.org/licenses/by/4.0/).